Embed Size (px)
Citation preview
NCCSIR All Sport Report 1982/83-2015/16, Table Appendix 1
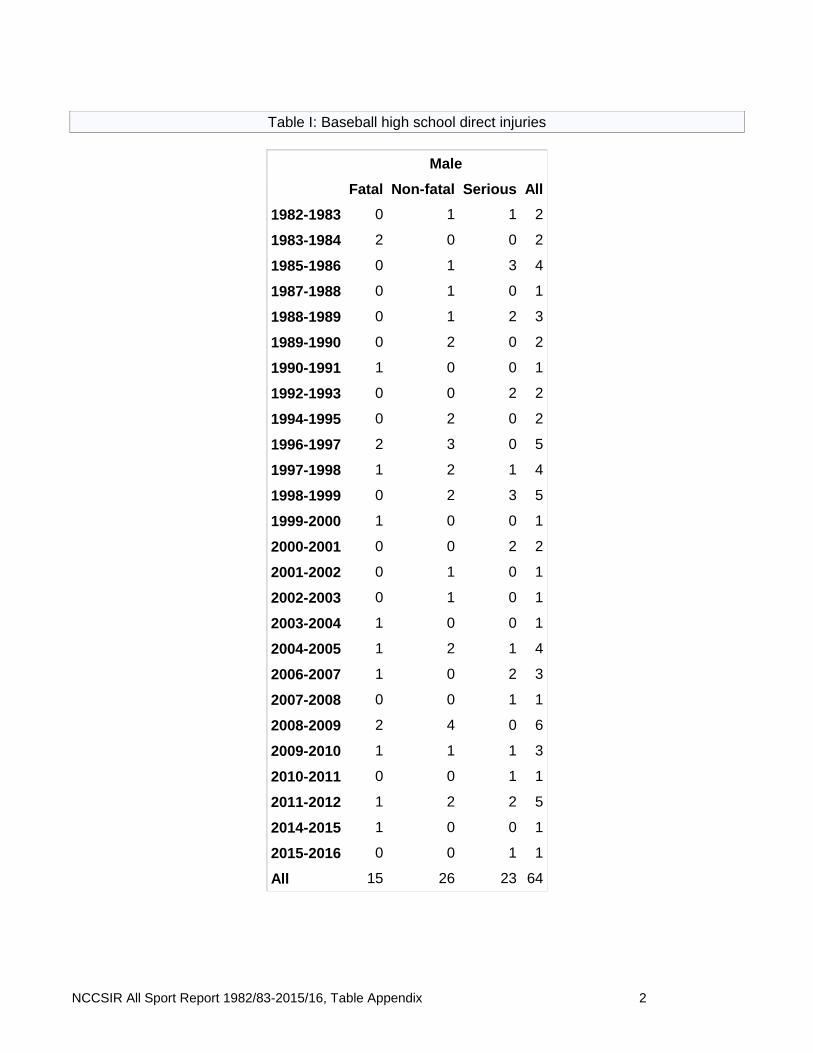
1982/83 – 2015/16 ALL SPORT REPORT – TABLE APPENDIX
TABLE OF CONTENTS
Pages
High School Direct – Tables I to II 2 to 16 High School Indirect – Tables III to IV 17 to 31 College Direct – Tables V to VI 32 to 43 College Indirect – TablesVI I to VIII 43 to 54 Participation Numbers: 1982/83 to 2015/16– Table IX 55
Notes: If there were no events in the sport for a particular year, the year is excluded from the frequency Table. Rates with number of incidents less than 5 should be interpreted with caution.
All rights reserved. This material may not be published, broadcast, rewritten or
redistributed in whole or part without express written permission. Contact the National
Center for Catastrophic Sport Injury Research for all questions regarding this report at
NCCSIR All Sport Report 1982/83-2015/16, Table Appendix 2
Table I: Baseball high school direct injuries
Male
Fatal Non-fatal Serious All
1982-1983 0 1 1 2
1983-1984 2 0 0 2
1985-1986 0 1 3 4
1987-1988 0 1 0 1
1988-1989 0 1 2 3
1989-1990 0 2 0 2
1990-1991 1 0 0 1
1992-1993 0 0 2 2
1994-1995 0 2 0 2
1996-1997 2 3 0 5
1997-1998 1 2 1 4
1998-1999 0 2 3 5
1999-2000 1 0 0 1
2000-2001 0 0 2 2
2001-2002 0 1 0 1
2002-2003 0 1 0 1
2003-2004 1 0 0 1
2004-2005 1 2 1 4
2006-2007 1 0 2 3
2007-2008 0 0 1 1
2008-2009 2 4 0 6
2009-2010 1 1 1 3
2010-2011 0 0 1 1
2011-2012 1 2 2 5
2014-2015 1 0 0 1
2015-2016 0 0 1 1
All 15 26 23 64
NCCSIR All Sport Report 1982/83-2015/16, Table Appendix 3
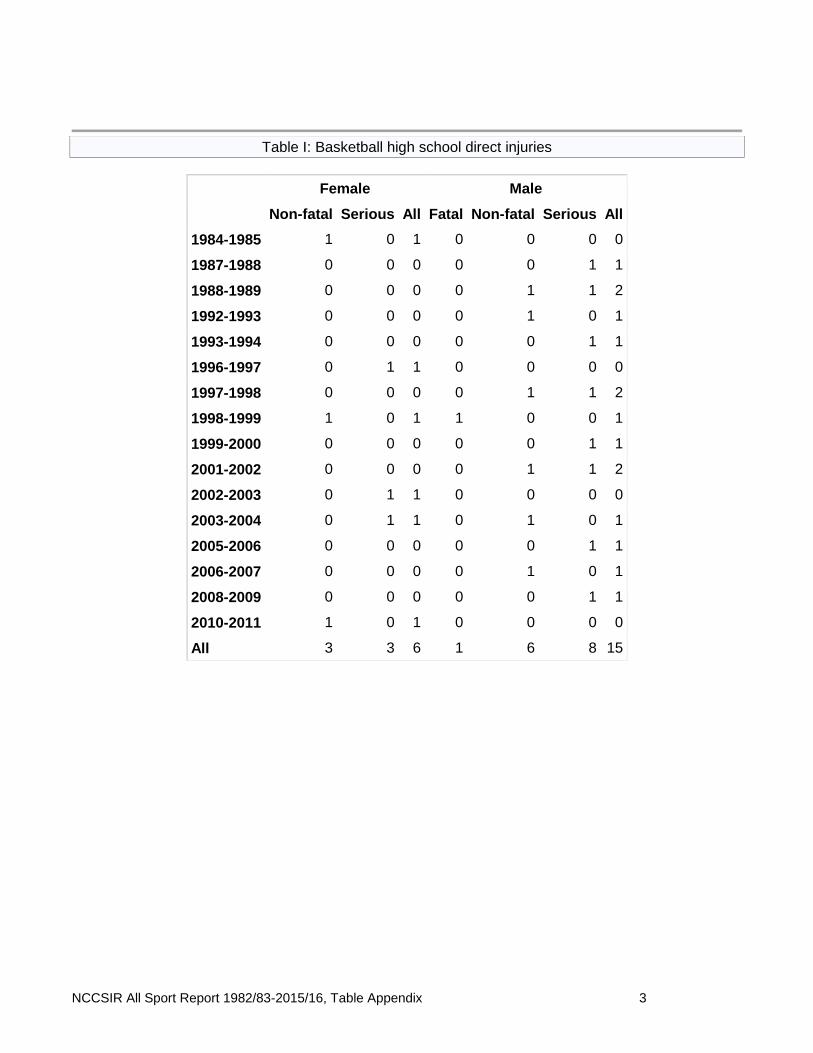
Table I: Basketball high school direct injuries
Female Male
Non-fatal Serious All Fatal Non-fatal Serious All
1984-1985 1 0 1 0 0 0 0
1987-1988 0 0 0 0 0 1 1
1988-1989 0 0 0 0 1 1 2
1992-1993 0 0 0 0 1 0 1
1993-1994 0 0 0 0 0 1 1
1996-1997 0 1 1 0 0 0 0
1997-1998 0 0 0 0 1 1 2
1998-1999 1 0 1 1 0 0 1
1999-2000 0 0 0 0 0 1 1
2001-2002 0 0 0 0 1 1 2
2002-2003 0 1 1 0 0 0 0
2003-2004 0 1 1 0 1 0 1
2005-2006 0 0 0 0 0 1 1
2006-2007 0 0 0 0 1 0 1
2008-2009 0 0 0 0 0 1 1
2010-2011 1 0 1 0 0 0 0
All 3 3 6 1 6 8 15
NCCSIR All Sport Report 1982/83-2015/16, Table Appendix 4
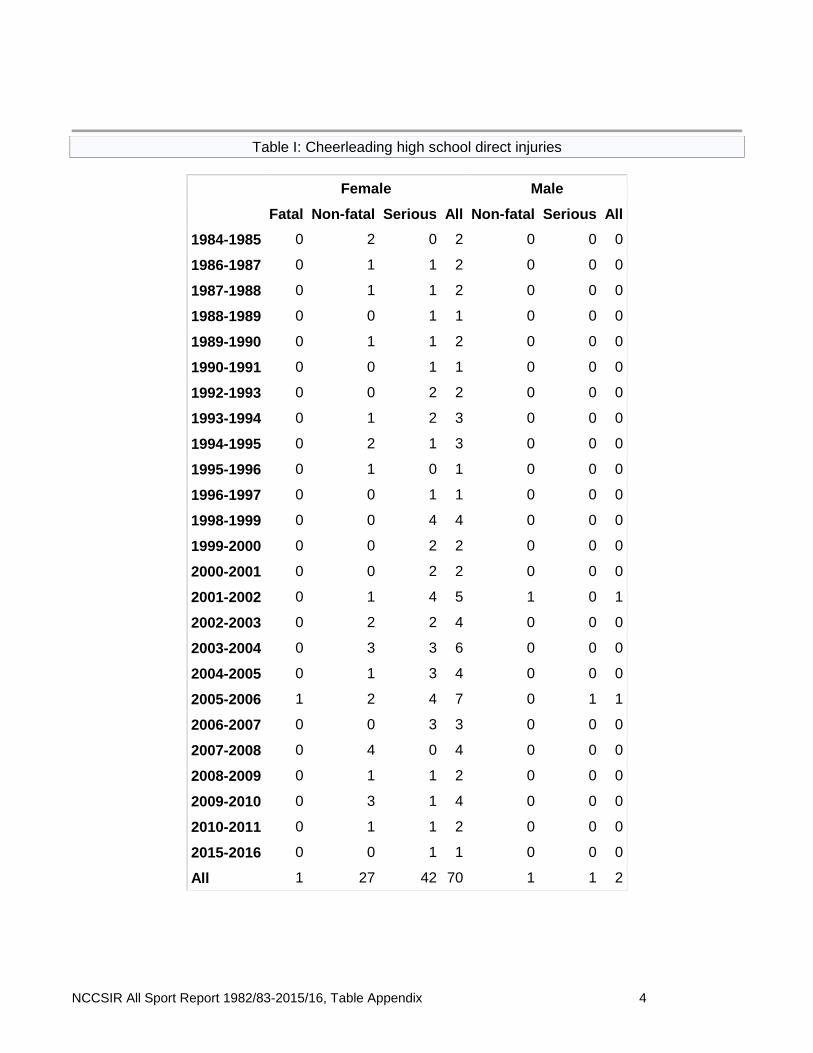
Table I: Cheerleading high school direct injuries
Female Male
Fatal Non-fatal Serious All Non-fatal Serious All
1984-1985 0 2 0 2 0 0 0
1986-1987 0 1 1 2 0 0 0
1987-1988 0 1 1 2 0 0 0
1988-1989 0 0 1 1 0 0 0
1989-1990 0 1 1 2 0 0 0
1990-1991 0 0 1 1 0 0 0
1992-1993 0 0 2 2 0 0 0
1993-1994 0 1 2 3 0 0 0
1994-1995 0 2 1 3 0 0 0
1995-1996 0 1 0 1 0 0 0
1996-1997 0 0 1 1 0 0 0
1998-1999 0 0 4 4 0 0 0
1999-2000 0 0 2 2 0 0 0
2000-2001 0 0 2 2 0 0 0
2001-2002 0 1 4 5 1 0 1
2002-2003 0 2 2 4 0 0 0
2003-2004 0 3 3 6 0 0 0
2004-2005 0 1 3 4 0 0 0
2005-2006 1 2 4 7 0 1 1
2006-2007 0 0 3 3 0 0 0
2007-2008 0 4 0 4 0 0 0
2008-2009 0 1 1 2 0 0 0
2009-2010 0 3 1 4 0 0 0
2010-2011 0 1 1 2 0 0 0
2015-2016 0 0 1 1 0 0 0
All 1 27 42 70 1 1 2
NCCSIR All Sport Report 1982/83-2015/16, Table Appendix 5
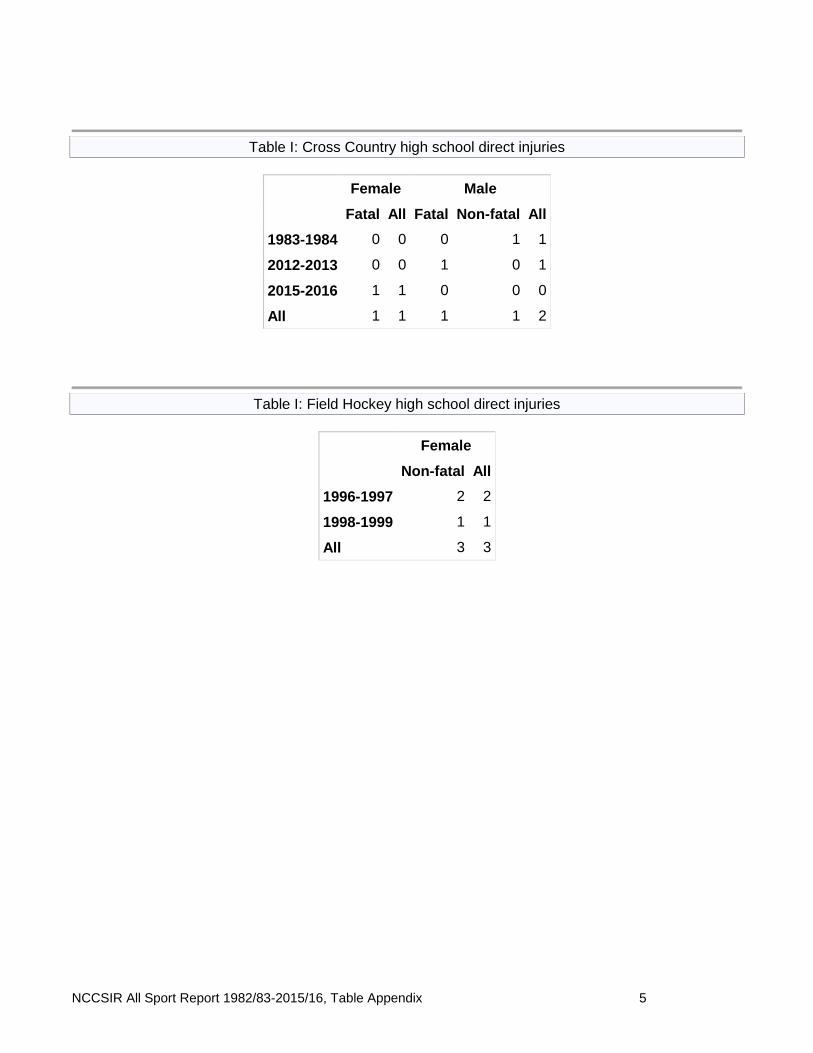
Table I: Cross Country high school direct injuries
Female Male
Fatal All Fatal Non-fatal All
1983-1984 0 0 0 1 1
2012-2013 0 0 1 0 1
2015-2016 1 1 0 0 0
All 1 1 1 1 2
Table I: Field Hockey high school direct injuries
Female
Non-fatal All
1996-1997 2 2
1998-1999 1 1
All 3 3
NCCSIR All Sport Report 1982/83-2015/16, Table Appendix 6
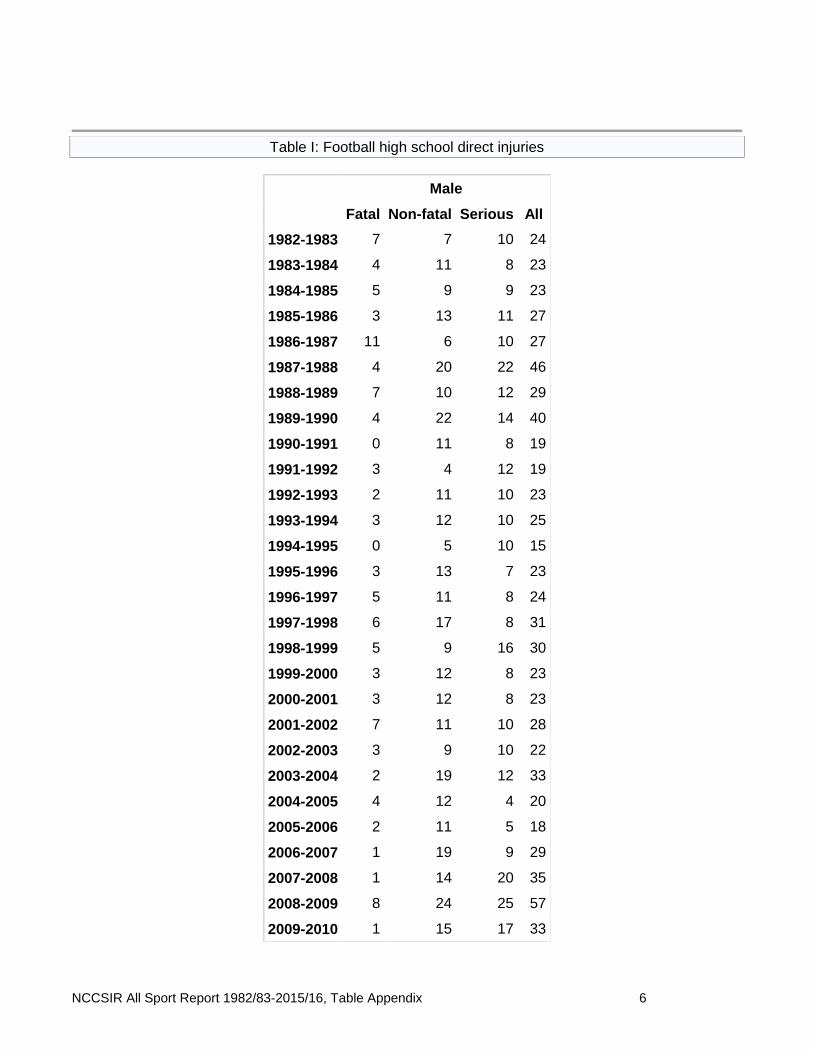
Table I: Football high school direct injuries
Male
Fatal Non-fatal Serious All
1982-1983 7 7 10 24
1983-1984 4 11 8 23
1984-1985 5 9 9 23
1985-1986 3 13 11 27
1986-1987 11 6 10 27
1987-1988 4 20 22 46
1988-1989 7 10 12 29
1989-1990 4 22 14 40
1990-1991 0 11 8 19
1991-1992 3 4 12 19
1992-1993 2 11 10 23
1993-1994 3 12 10 25
1994-1995 0 5 10 15
1995-1996 3 13 7 23
1996-1997 5 11 8 24
1997-1998 6 17 8 31
1998-1999 5 9 16 30
1999-2000 3 12 8 23
2000-2001 3 12 8 23
2001-2002 7 11 10 28
2002-2003 3 9 10 22
2003-2004 2 19 12 33
2004-2005 4 12 4 20
2005-2006 2 11 5 18
2006-2007 1 19 9 29
2007-2008 1 14 20 35
2008-2009 8 24 25 57
2009-2010 1 15 17 33
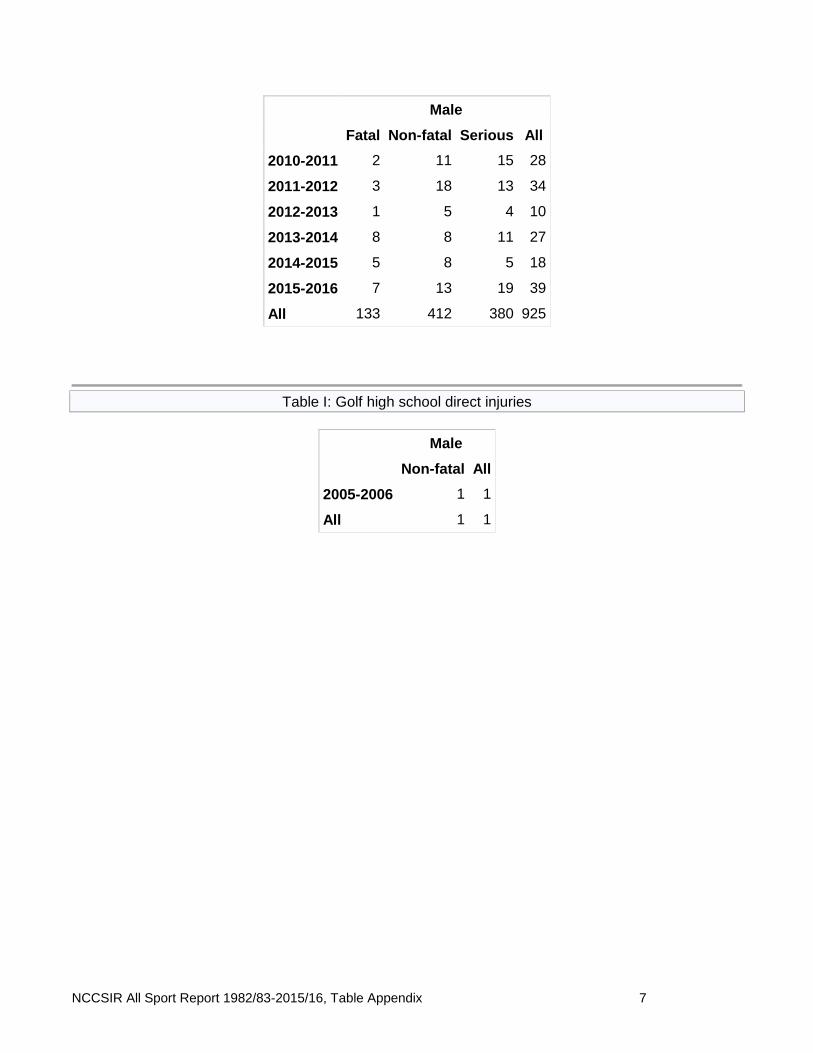
NCCSIR All Sport Report 1982/83-2015/16, Table Appendix 7
Male
Fatal Non-fatal Serious All
2010-2011 2 11 15 28
2011-2012 3 18 13 34
2012-2013 1 5 4 10
2013-2014 8 8 11 27
2014-2015 5 8 5 18
2015-2016 7 13 19 39
All 133 412 380 925
Table I: Golf high school direct injuries
Male
Non-fatal All
2005-2006 1 1
All 1 1
NCCSIR All Sport Report 1982/83-2015/16, Table Appendix 8
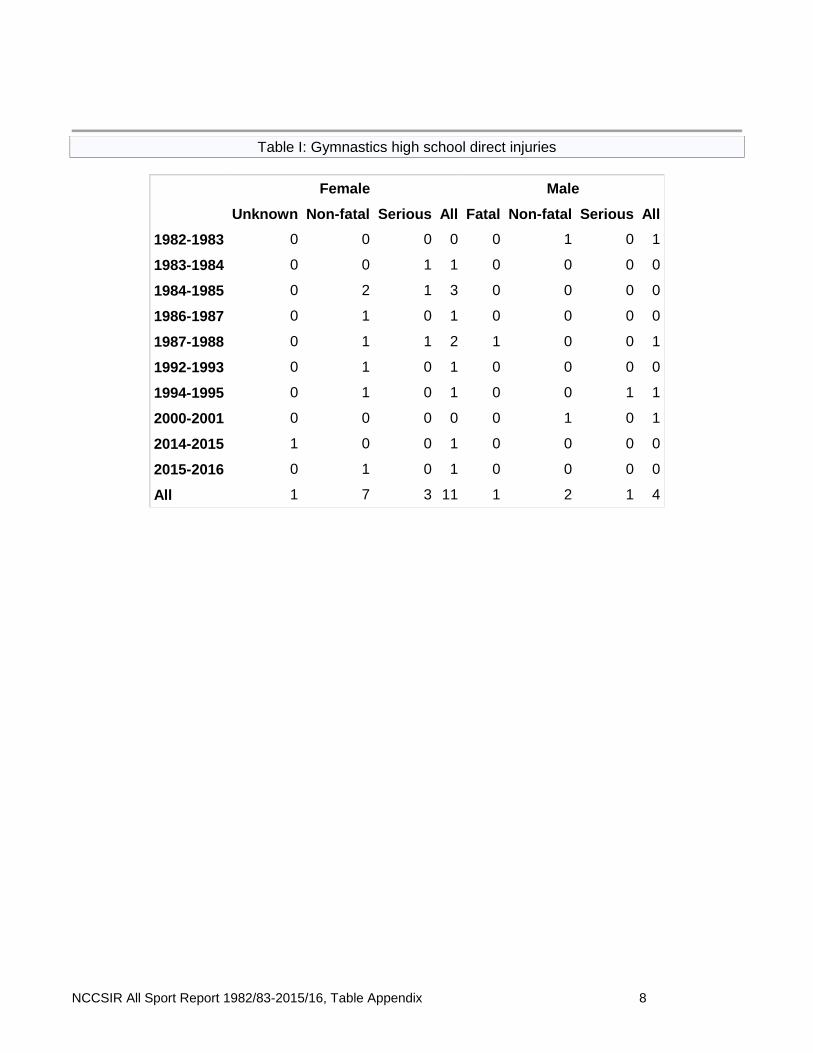
Table I: Gymnastics high school direct injuries
Female Male
Unknown Non-fatal Serious All Fatal Non-fatal Serious All
1982-1983 0 0 0 0 0 1 0 1
1983-1984 0 0 1 1 0 0 0 0
1984-1985 0 2 1 3 0 0 0 0
1986-1987 0 1 0 1 0 0 0 0
1987-1988 0 1 1 2 1 0 0 1
1992-1993 0 1 0 1 0 0 0 0
1994-1995 0 1 0 1 0 0 1 1
2000-2001 0 0 0 0 0 1 0 1
2014-2015 1 0 0 1 0 0 0 0
2015-2016 0 1 0 1 0 0 0 0
All 1 7 3 11 1 2 1 4
NCCSIR All Sport Report 1982/83-2015/16, Table Appendix 9
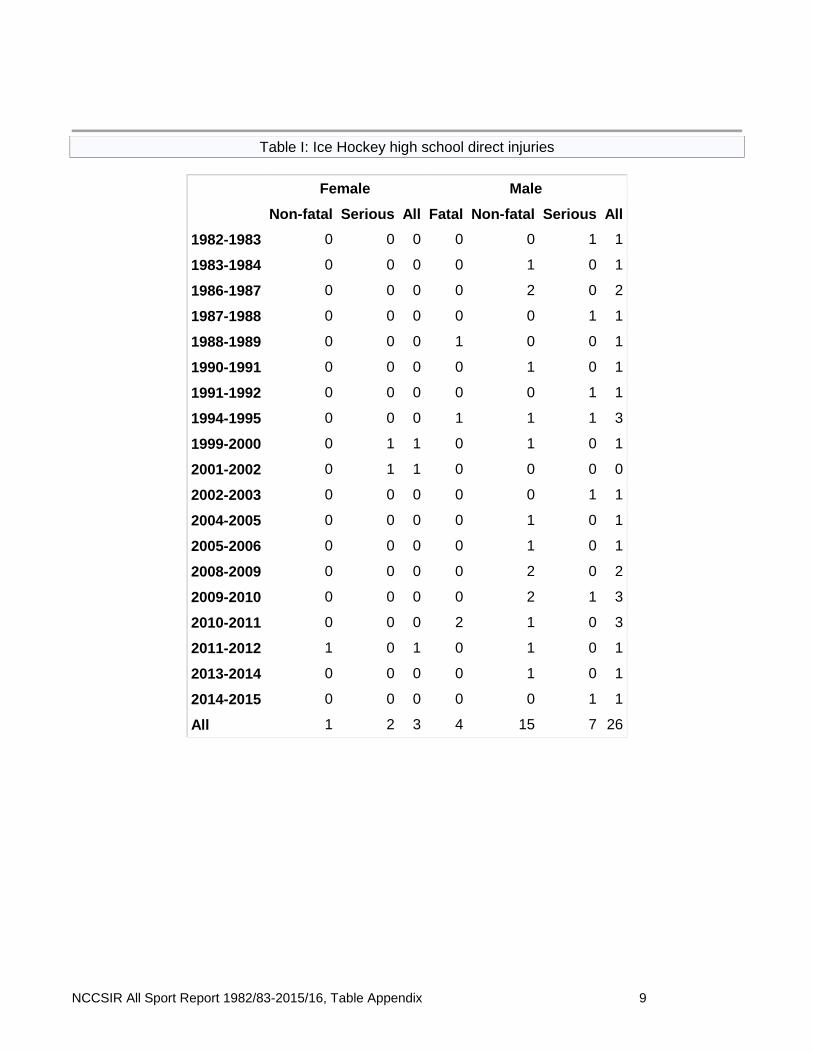
Table I: Ice Hockey high school direct injuries
Female Male
Non-fatal Serious All Fatal Non-fatal Serious All
1982-1983 0 0 0 0 0 1 1
1983-1984 0 0 0 0 1 0 1
1986-1987 0 0 0 0 2 0 2
1987-1988 0 0 0 0 0 1 1
1988-1989 0 0 0 1 0 0 1
1990-1991 0 0 0 0 1 0 1
1991-1992 0 0 0 0 0 1 1
1994-1995 0 0 0 1 1 1 3
1999-2000 0 1 1 0 1 0 1
2001-2002 0 1 1 0 0 0 0
2002-2003 0 0 0 0 0 1 1
2004-2005 0 0 0 0 1 0 1
2005-2006 0 0 0 0 1 0 1
2008-2009 0 0 0 0 2 0 2
2009-2010 0 0 0 0 2 1 3
2010-2011 0 0 0 2 1 0 3
2011-2012 1 0 1 0 1 0 1
2013-2014 0 0 0 0 1 0 1
2014-2015 0 0 0 0 0 1 1
All 1 2 3 4 15 7 26
NCCSIR All Sport Report 1982/83-2015/16, Table Appendix 10
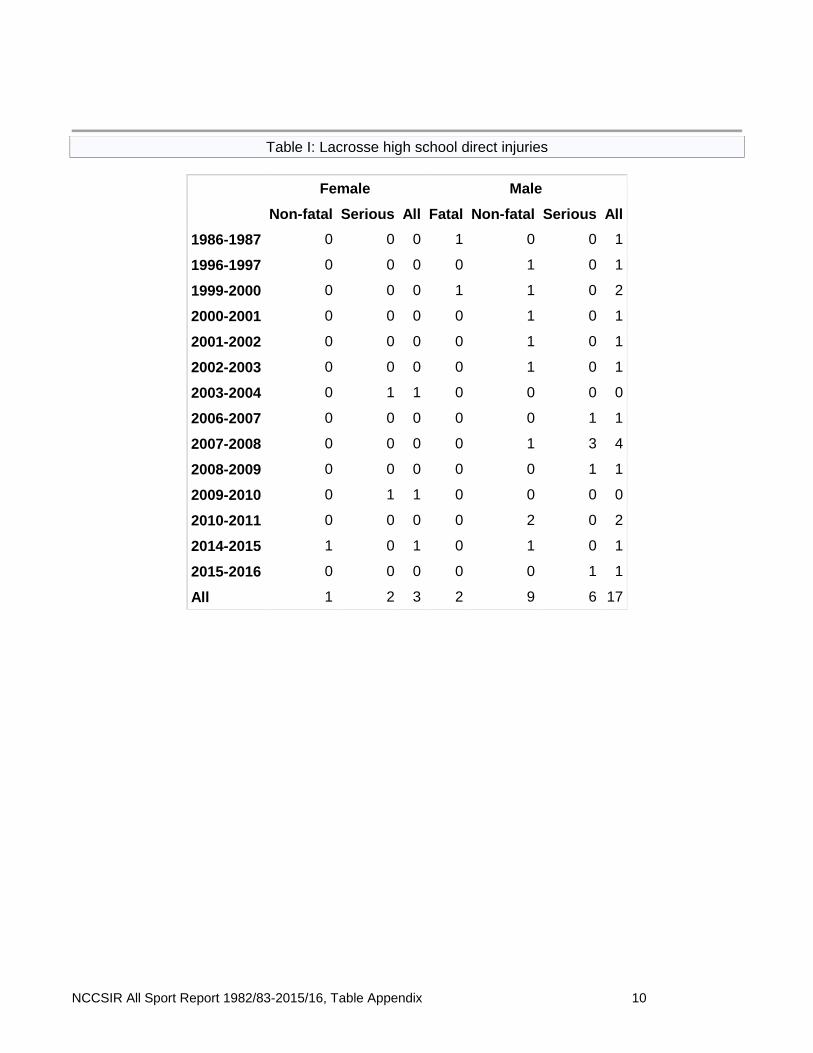
Table I: Lacrosse high school direct injuries
Female Male
Non-fatal Serious All Fatal Non-fatal Serious All
1986-1987 0 0 0 1 0 0 1
1996-1997 0 0 0 0 1 0 1
1999-2000 0 0 0 1 1 0 2
2000-2001 0 0 0 0 1 0 1
2001-2002 0 0 0 0 1 0 1
2002-2003 0 0 0 0 1 0 1
2003-2004 0 1 1 0 0 0 0
2006-2007 0 0 0 0 0 1 1
2007-2008 0 0 0 0 1 3 4
2008-2009 0 0 0 0 0 1 1
2009-2010 0 1 1 0 0 0 0
2010-2011 0 0 0 0 2 0 2
2014-2015 1 0 1 0 1 0 1
2015-2016 0 0 0 0 0 1 1
All 1 2 3 2 9 6 17
NCCSIR All Sport Report 1982/83-2015/16, Table Appendix 11
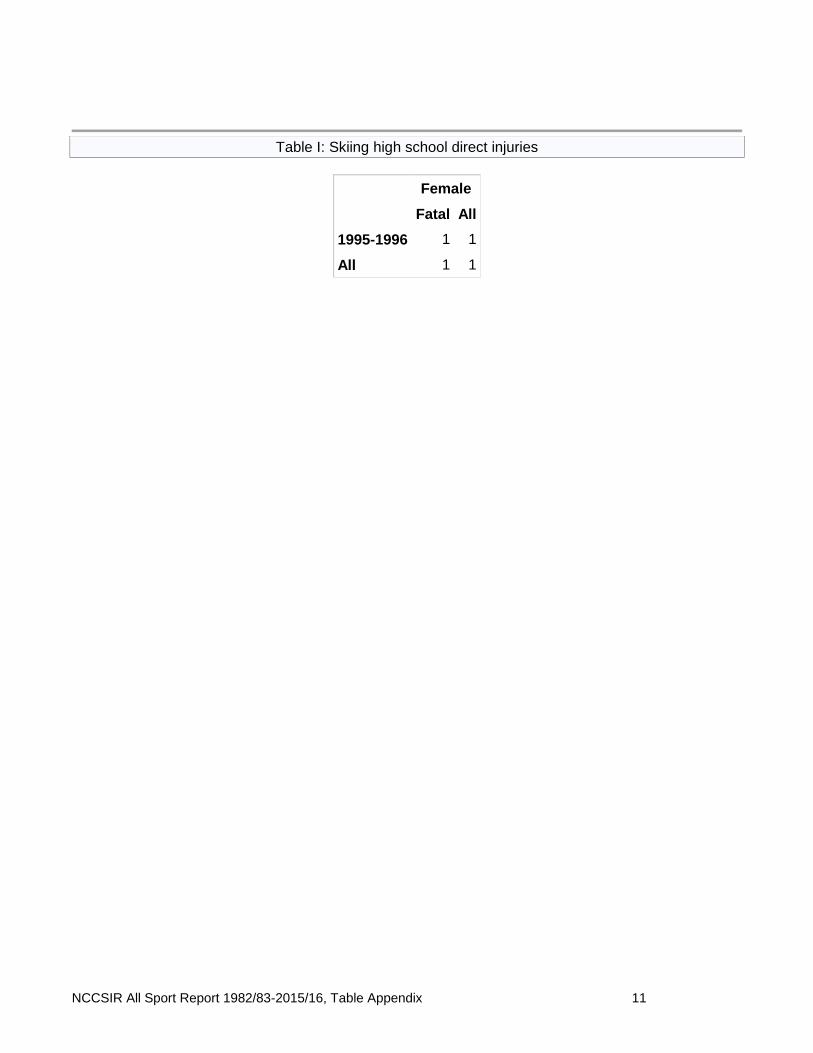
Table I: Skiing high school direct injuries
Female
Fatal All
1995-1996 1 1
All 1 1
NCCSIR All Sport Report 1982/83-2015/16, Table Appendix 12
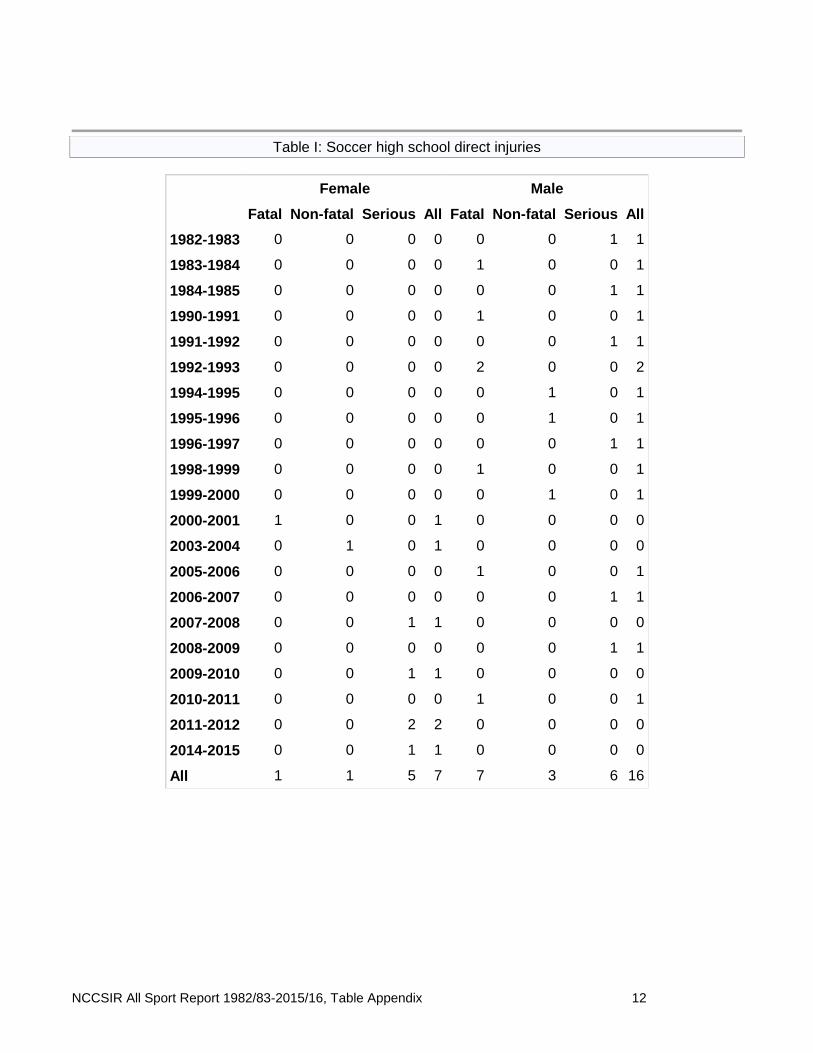
Table I: Soccer high school direct injuries
Female Male
Fatal Non-fatal Serious All Fatal Non-fatal Serious All
1982-1983 0 0 0 0 0 0 1 1
1983-1984 0 0 0 0 1 0 0 1
1984-1985 0 0 0 0 0 0 1 1
1990-1991 0 0 0 0 1 0 0 1
1991-1992 0 0 0 0 0 0 1 1
1992-1993 0 0 0 0 2 0 0 2
1994-1995 0 0 0 0 0 1 0 1
1995-1996 0 0 0 0 0 1 0 1
1996-1997 0 0 0 0 0 0 1 1
1998-1999 0 0 0 0 1 0 0 1
1999-2000 0 0 0 0 0 1 0 1
2000-2001 1 0 0 1 0 0 0 0
2003-2004 0 1 0 1 0 0 0 0
2005-2006 0 0 0 0 1 0 0 1
2006-2007 0 0 0 0 0 0 1 1
2007-2008 0 0 1 1 0 0 0 0
2008-2009 0 0 0 0 0 0 1 1
2009-2010 0 0 1 1 0 0 0 0
2010-2011 0 0 0 0 1 0 0 1
2011-2012 0 0 2 2 0 0 0 0
2014-2015 0 0 1 1 0 0 0 0
All 1 1 5 7 7 3 6 16
NCCSIR All Sport Report 1982/83-2015/16, Table Appendix 13
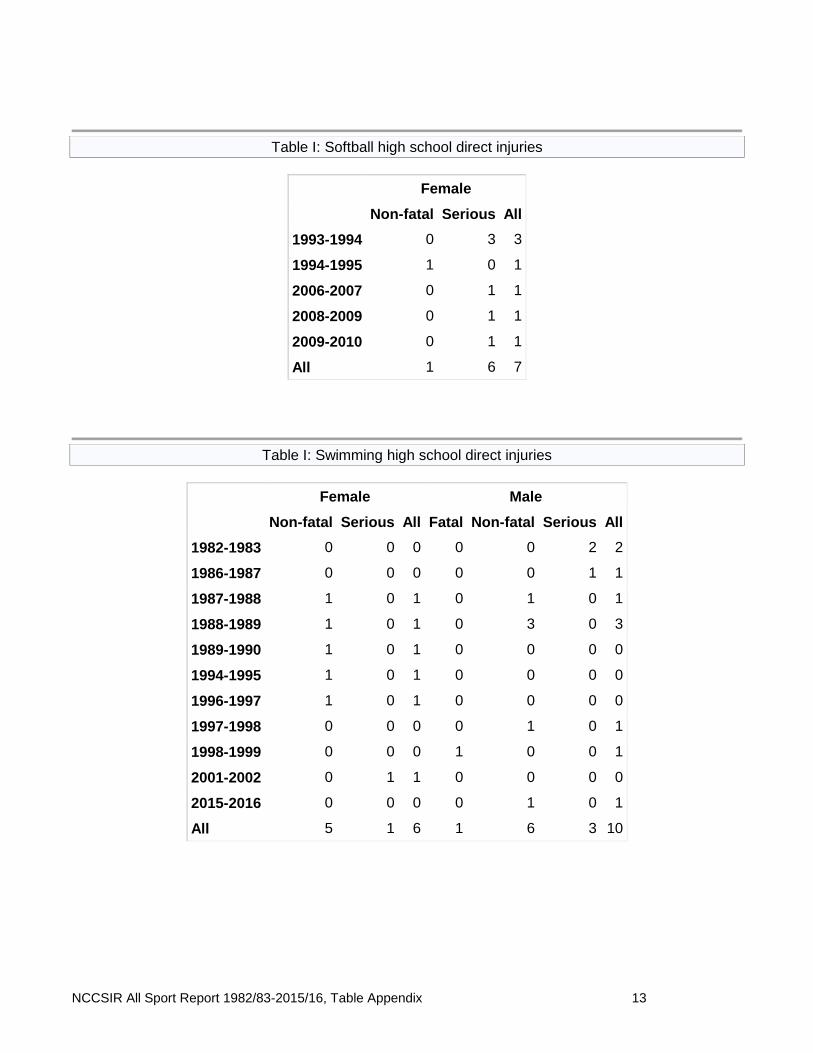
Table I: Softball high school direct injuries
Female
Non-fatal Serious All
1993-1994 0 3 3
1994-1995 1 0 1
2006-2007 0 1 1
2008-2009 0 1 1
2009-2010 0 1 1
All 1 6 7
Table I: Swimming high school direct injuries
Female Male
Non-fatal Serious All Fatal Non-fatal Serious All
1982-1983 0 0 0 0 0 2 2
1986-1987 0 0 0 0 0 1 1
1987-1988 1 0 1 0 1 0 1
1988-1989 1 0 1 0 3 0 3
1989-1990 1 0 1 0 0 0 0
1994-1995 1 0 1 0 0 0 0
1996-1997 1 0 1 0 0 0 0
1997-1998 0 0 0 0 1 0 1
1998-1999 0 0 0 1 0 0 1
2001-2002 0 1 1 0 0 0 0
2015-2016 0 0 0 0 1 0 1
All 5 1 6 1 6 3 10
NCCSIR All Sport Report 1982/83-2015/16, Table Appendix 14
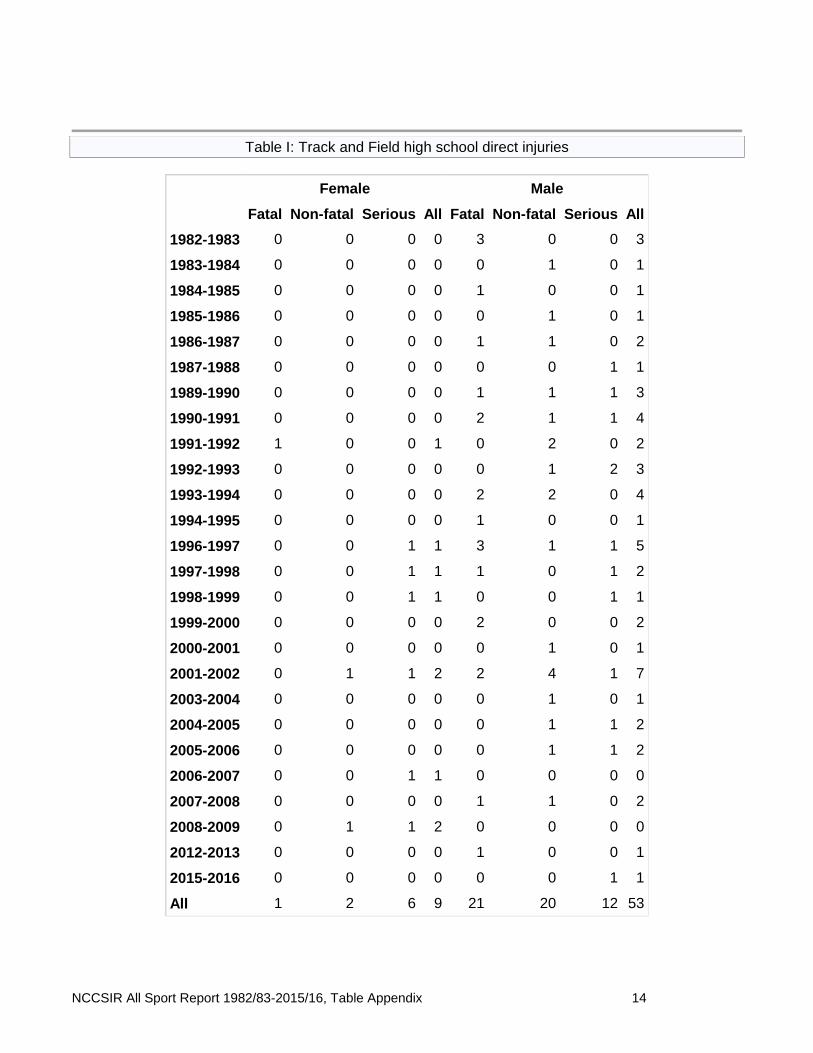
Table I: Track and Field high school direct injuries
Female Male
Fatal Non-fatal Serious All Fatal Non-fatal Serious All
1982-1983 0 0 0 0 3 0 0 3
1983-1984 0 0 0 0 0 1 0 1
1984-1985 0 0 0 0 1 0 0 1
1985-1986 0 0 0 0 0 1 0 1
1986-1987 0 0 0 0 1 1 0 2
1987-1988 0 0 0 0 0 0 1 1
1989-1990 0 0 0 0 1 1 1 3
1990-1991 0 0 0 0 2 1 1 4
1991-1992 1 0 0 1 0 2 0 2
1992-1993 0 0 0 0 0 1 2 3
1993-1994 0 0 0 0 2 2 0 4
1994-1995 0 0 0 0 1 0 0 1
1996-1997 0 0 1 1 3 1 1 5
1997-1998 0 0 1 1 1 0 1 2
1998-1999 0 0 1 1 0 0 1 1
1999-2000 0 0 0 0 2 0 0 2
2000-2001 0 0 0 0 0 1 0 1
2001-2002 0 1 1 2 2 4 1 7
2003-2004 0 0 0 0 0 1 0 1
2004-2005 0 0 0 0 0 1 1 2
2005-2006 0 0 0 0 0 1 1 2
2006-2007 0 0 1 1 0 0 0 0
2007-2008 0 0 0 0 1 1 0 2
2008-2009 0 1 1 2 0 0 0 0
2012-2013 0 0 0 0 1 0 0 1
2015-2016 0 0 0 0 0 0 1 1
All 1 2 6 9 21 20 12 53
NCCSIR All Sport Report 1982/83-2015/16, Table Appendix 15
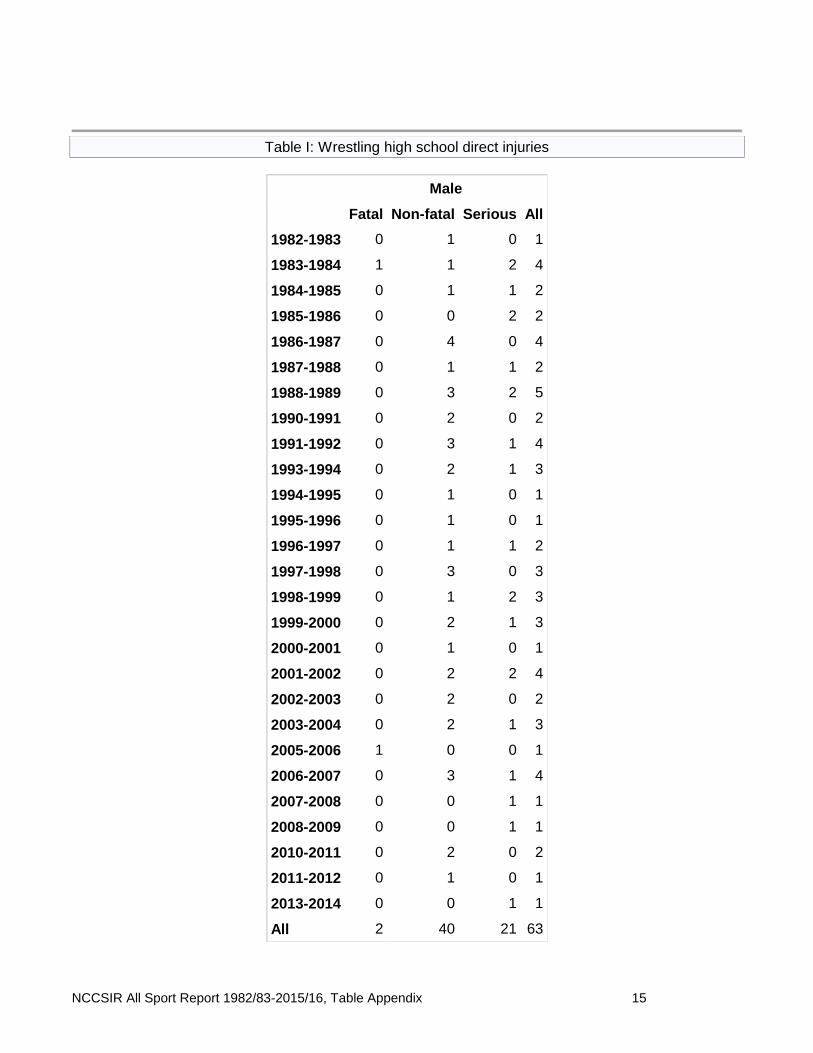
Table I: Wrestling high school direct injuries
Male
Fatal Non-fatal Serious All
1982-1983 0 1 0 1
1983-1984 1 1 2 4
1984-1985 0 1 1 2
1985-1986 0 0 2 2
1986-1987 0 4 0 4
1987-1988 0 1 1 2
1988-1989 0 3 2 5
1990-1991 0 2 0 2
1991-1992 0 3 1 4
1993-1994 0 2 1 3
1994-1995 0 1 0 1
1995-1996 0 1 0 1
1996-1997 0 1 1 2
1997-1998 0 3 0 3
1998-1999 0 1 2 3
1999-2000 0 2 1 3
2000-2001 0 1 0 1
2001-2002 0 2 2 4
2002-2003 0 2 0 2
2003-2004 0 2 1 3
2005-2006 1 0 0 1
2006-2007 0 3 1 4
2007-2008 0 0 1 1
2008-2009 0 0 1 1
2010-2011 0 2 0 2
2011-2012 0 1 0 1
2013-2014 0 0 1 1
All 2 40 21 63
NCCSIR All Sport Report 1982/83-2015/16, Table Appendix 16
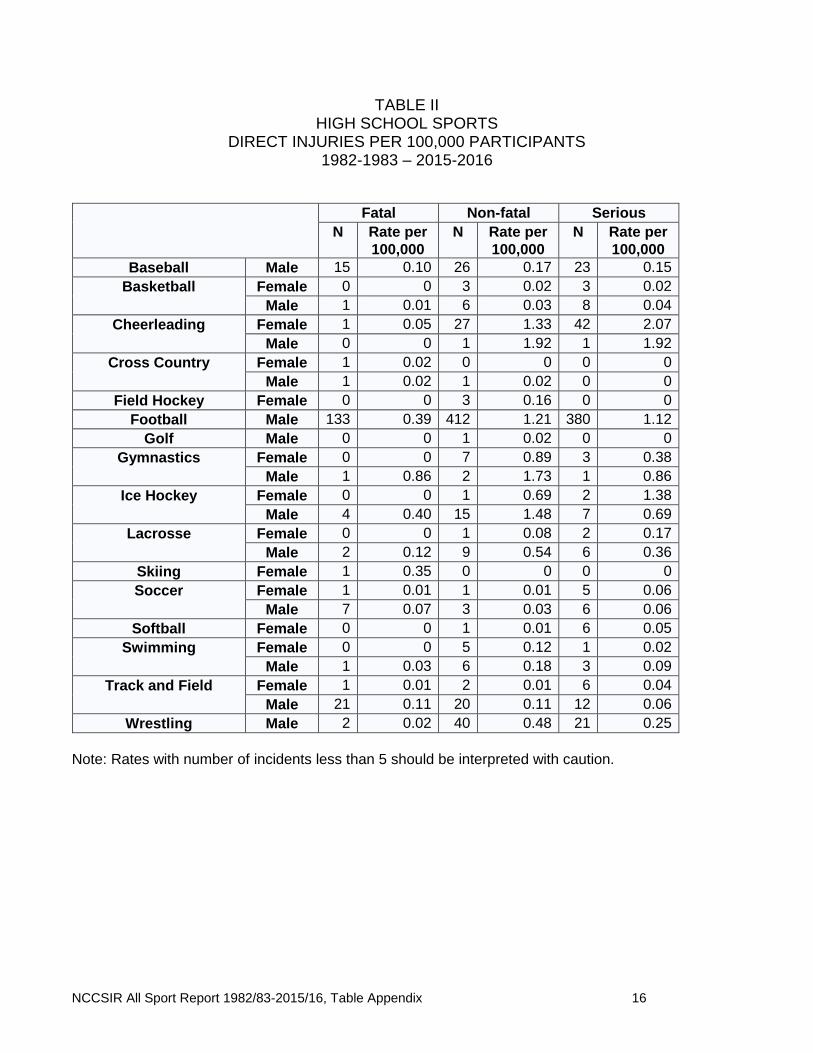
TABLE II HIGH SCHOOL SPORTS
DIRECT INJURIES PER 100,000 PARTICIPANTS 1982-1983 – 2015-2016
Fatal Non-fatal Serious
N Rate per
100,000
N Rate per
100,000
N Rate per
100,000
Baseball Male 15 0.10 26 0.17 23 0.15
Basketball Female 0 0 3 0.02 3 0.02
Male 1 0.01 6 0.03 8 0.04
Cheerleading Female 1 0.05 27 1.33 42 2.07
Male 0 0 1 1.92 1 1.92
Cross Country Female 1 0.02 0 0 0 0
Male 1 0.02 1 0.02 0 0
Field Hockey Female 0 0 3 0.16 0 0
Football Male 133 0.39 412 1.21 380 1.12
Golf Male 0 0 1 0.02 0 0
Gymnastics Female 0 0 7 0.89 3 0.38
Male 1 0.86 2 1.73 1 0.86
Ice Hockey Female 0 0 1 0.69 2 1.38
Male 4 0.40 15 1.48 7 0.69
Lacrosse Female 0 0 1 0.08 2 0.17
Male 2 0.12 9 0.54 6 0.36
Skiing Female 1 0.35 0 0 0 0
Soccer Female 1 0.01 1 0.01 5 0.06
Male 7 0.07 3 0.03 6 0.06
Softball Female 0 0 1 0.01 6 0.05
Swimming Female 0 0 5 0.12 1 0.02
Male 1 0.03 6 0.18 3 0.09
Track and Field Female 1 0.01 2 0.01 6 0.04
Male 21 0.11 20 0.11 12 0.06
Wrestling Male 2 0.02 40 0.48 21 0.25
Note: Rates with number of incidents less than 5 should be interpreted with caution.
NCCSIR All Sport Report 1982/83-2015/16, Table Appendix 17
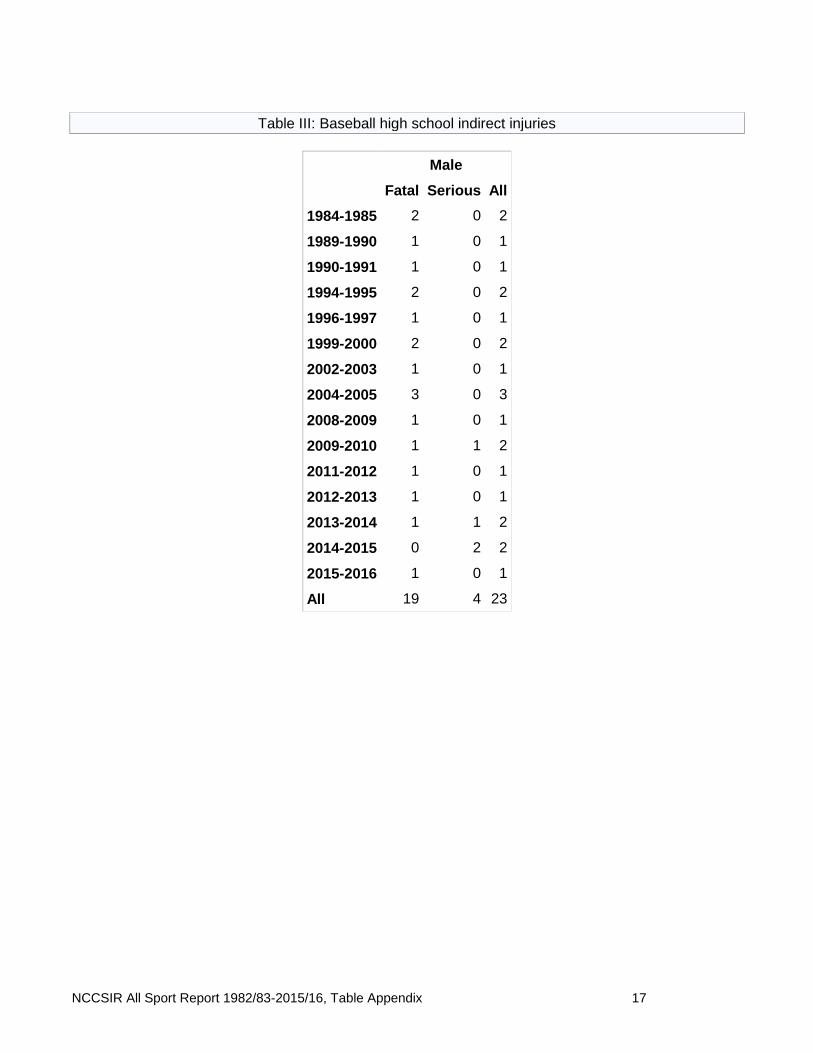
Table III: Baseball high school indirect injuries
Male
Fatal Serious All
1984-1985 2 0 2
1989-1990 1 0 1
1990-1991 1 0 1
1994-1995 2 0 2
1996-1997 1 0 1
1999-2000 2 0 2
2002-2003 1 0 1
2004-2005 3 0 3
2008-2009 1 0 1
2009-2010 1 1 2
2011-2012 1 0 1
2012-2013 1 0 1
2013-2014 1 1 2
2014-2015 0 2 2
2015-2016 1 0 1
All 19 4 23
NCCSIR All Sport Report 1982/83-2015/16, Table Appendix 18
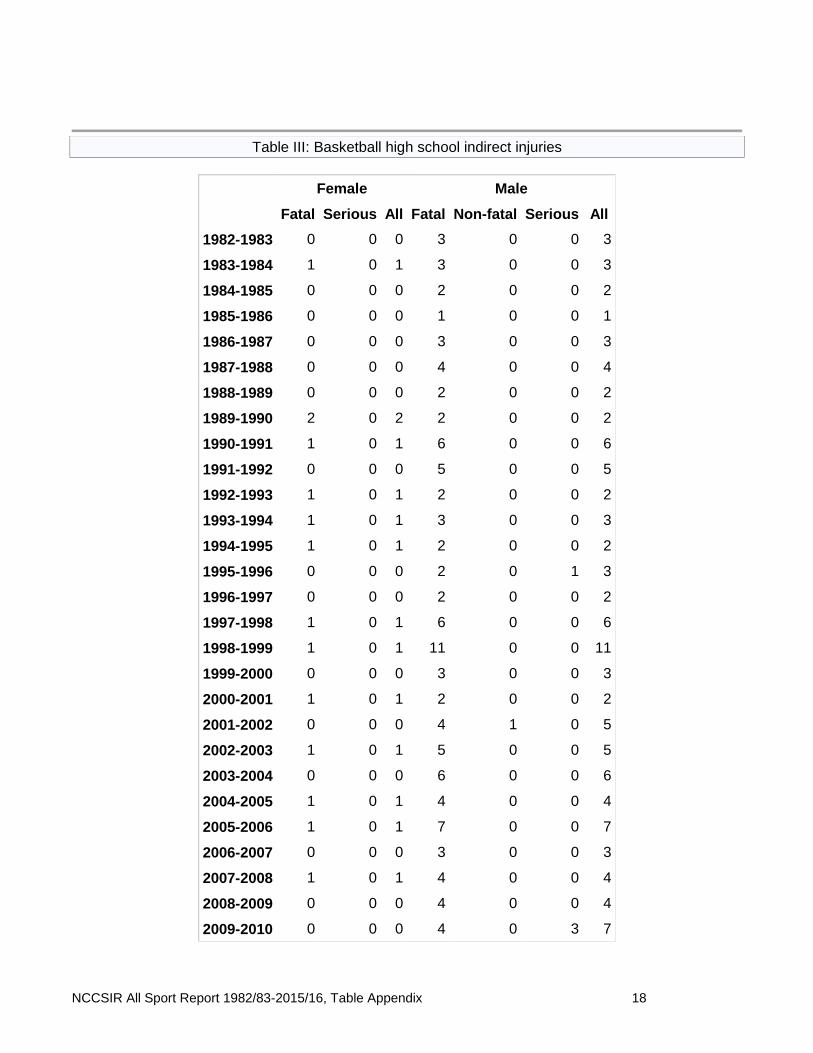
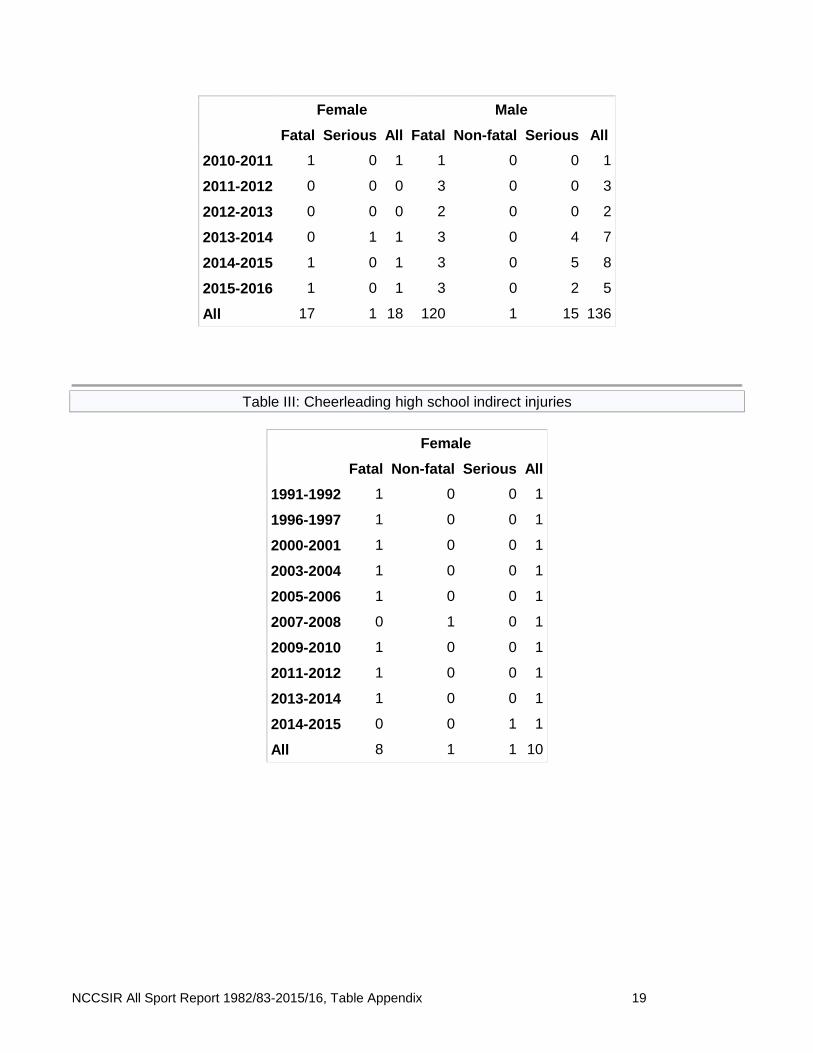
Table III: Basketball high school indirect injuries
Female Male
Fatal Serious All Fatal Non-fatal Serious All
1982-1983 0 0 0 3 0 0 3
1983-1984 1 0 1 3 0 0 3
1984-1985 0 0 0 2 0 0 2
1985-1986 0 0 0 1 0 0 1
1986-1987 0 0 0 3 0 0 3
1987-1988 0 0 0 4 0 0 4
1988-1989 0 0 0 2 0 0 2
1989-1990 2 0 2 2 0 0 2
1990-1991 1 0 1 6 0 0 6
1991-1992 0 0 0 5 0 0 5
1992-1993 1 0 1 2 0 0 2
1993-1994 1 0 1 3 0 0 3
1994-1995 1 0 1 2 0 0 2
1995-1996 0 0 0 2 0 1 3
1996-1997 0 0 0 2 0 0 2
1997-1998 1 0 1 6 0 0 6
1998-1999 1 0 1 11 0 0 11
1999-2000 0 0 0 3 0 0 3
2000-2001 1 0 1 2 0 0 2
2001-2002 0 0 0 4 1 0 5
2002-2003 1 0 1 5 0 0 5
2003-2004 0 0 0 6 0 0 6
2004-2005 1 0 1 4 0 0 4
2005-2006 1 0 1 7 0 0 7
2006-2007 0 0 0 3 0 0 3
2007-2008 1 0 1 4 0 0 4
2008-2009 0 0 0 4 0 0 4
2009-2010 0 0 0 4 0 3 7
NCCSIR All Sport Report 1982/83-2015/16, Table Appendix 19
Female Male
Fatal Serious All Fatal Non-fatal Serious All
2010-2011 1 0 1 1 0 0 1
2011-2012 0 0 0 3 0 0 3
2012-2013 0 0 0 2 0 0 2
2013-2014 0 1 1 3 0 4 7
2014-2015 1 0 1 3 0 5 8
2015-2016 1 0 1 3 0 2 5
All 17 1 18 120 1 15 136
Table III: Cheerleading high school indirect injuries
Female
Fatal Non-fatal Serious All
1991-1992 1 0 0 1
1996-1997 1 0 0 1
2000-2001 1 0 0 1
2003-2004 1 0 0 1
2005-2006 1 0 0 1
2007-2008 0 1 0 1
2009-2010 1 0 0 1
2011-2012 1 0 0 1
2013-2014 1 0 0 1
2014-2015 0 0 1 1
All 8 1 1 10
NCCSIR All Sport Report 1982/83-2015/16, Table Appendix 20
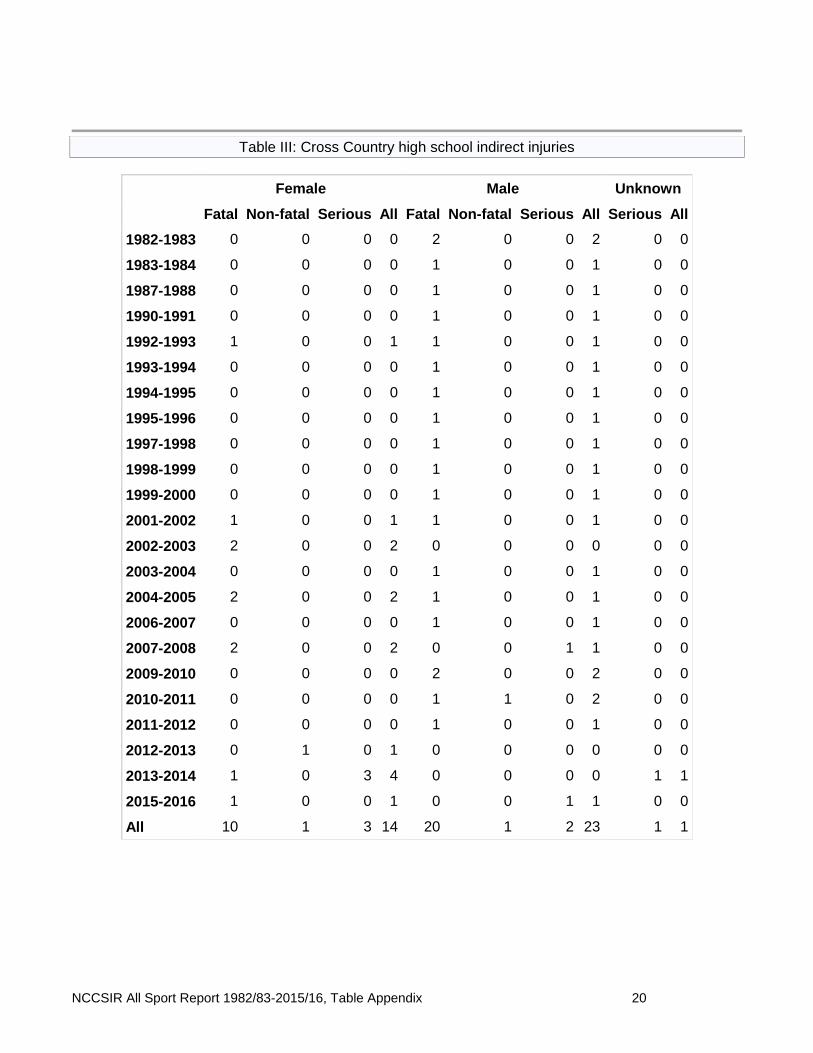
Table III: Cross Country high school indirect injuries
Female Male Unknown
Fatal Non-fatal Serious All Fatal Non-fatal Serious All Serious All
1982-1983 0 0 0 0 2 0 0 2 0 0
1983-1984 0 0 0 0 1 0 0 1 0 0
1987-1988 0 0 0 0 1 0 0 1 0 0
1990-1991 0 0 0 0 1 0 0 1 0 0
1992-1993 1 0 0 1 1 0 0 1 0 0
1993-1994 0 0 0 0 1 0 0 1 0 0
1994-1995 0 0 0 0 1 0 0 1 0 0
1995-1996 0 0 0 0 1 0 0 1 0 0
1997-1998 0 0 0 0 1 0 0 1 0 0
1998-1999 0 0 0 0 1 0 0 1 0 0
1999-2000 0 0 0 0 1 0 0 1 0 0
2001-2002 1 0 0 1 1 0 0 1 0 0
2002-2003 2 0 0 2 0 0 0 0 0 0
2003-2004 0 0 0 0 1 0 0 1 0 0
2004-2005 2 0 0 2 1 0 0 1 0 0
2006-2007 0 0 0 0 1 0 0 1 0 0
2007-2008 2 0 0 2 0 0 1 1 0 0
2009-2010 0 0 0 0 2 0 0 2 0 0
2010-2011 0 0 0 0 1 1 0 2 0 0
2011-2012 0 0 0 0 1 0 0 1 0 0
2012-2013 0 1 0 1 0 0 0 0 0 0
2013-2014 1 0 3 4 0 0 0 0 1 1
2015-2016 1 0 0 1 0 0 1 1 0 0
All 10 1 3 14 20 1 2 23 1 1
NCCSIR All Sport Report 1982/83-2015/16, Table Appendix 21
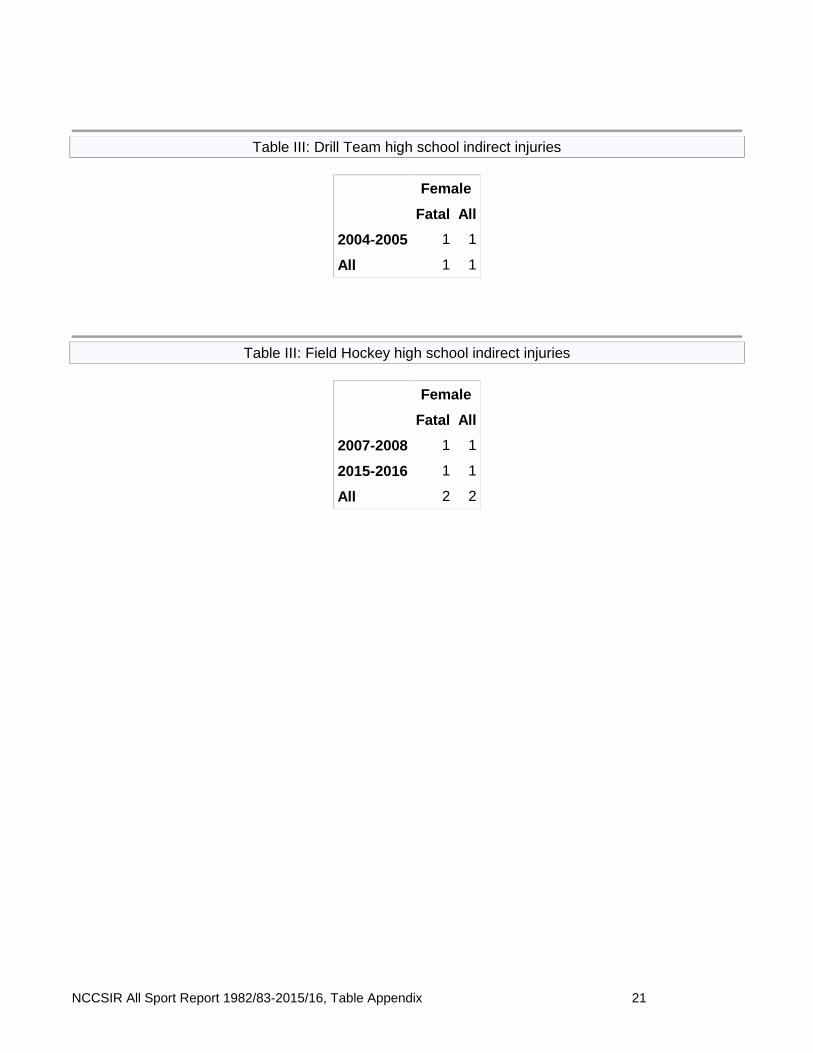
Table III: Drill Team high school indirect injuries
Female
Fatal All
2004-2005 1 1
All 1 1
Table III: Field Hockey high school indirect injuries
Female
Fatal All
2007-2008 1 1
2015-2016 1 1
All 2 2

NCCSIR All Sport Report 1982/83-2015/16, Table Appendix 22
Table III: Football high school indirect injuries
Male
Fatal Non-fatal Serious All
1982-1983 6 0 0 6
1983-1984 6 0 0 6
1984-1985 3 0 0 3
1985-1986 1 0 0 1
1986-1987 6 0 1 7
1987-1988 4 0 0 4
1988-1989 10 0 0 10
1989-1990 9 0 0 9
1990-1991 4 0 0 4
1991-1992 2 0 0 2
1992-1993 9 0 0 9
1993-1994 6 0 0 6
1994-1995 2 0 0 2
1995-1996 8 0 0 8
1996-1997 8 0 0 8
1997-1998 7 0 0 7
1998-1999 6 0 0 6
1999-2000 13 0 0 13
2000-2001 12 0 0 12
2001-2002 8 0 0 8
2002-2003 6 0 0 6
2003-2004 4 0 0 4
2004-2005 9 0 0 9
2005-2006 4 0 0 4
2006-2007 9 0 0 9
2007-2008 8 0 0 8
2008-2009 6 0 0 6
2009-2010 12 0 0 12
NCCSIR All Sport Report 1982/83-2015/16, Table Appendix 23
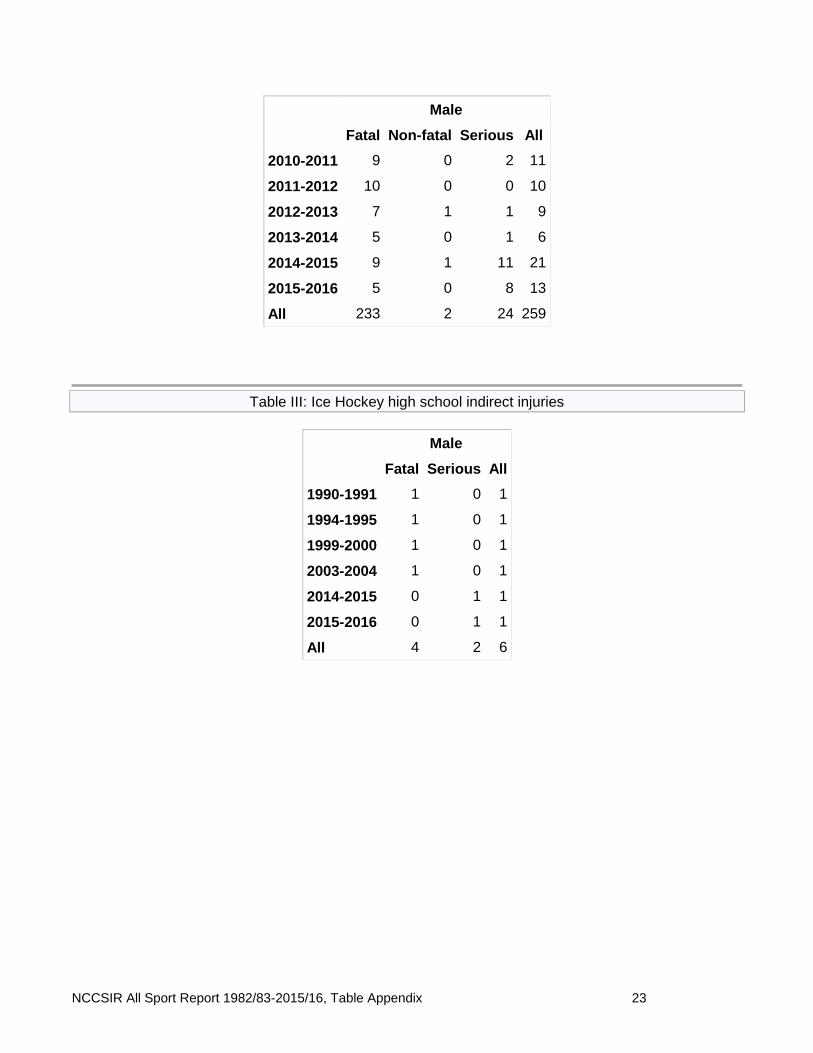
Male
Fatal Non-fatal Serious All
2010-2011 9 0 2 11
2011-2012 10 0 0 10
2012-2013 7 1 1 9
2013-2014 5 0 1 6
2014-2015 9 1 11 21
2015-2016 5 0 8 13
All 233 2 24 259
Table III: Ice Hockey high school indirect injuries
Male
Fatal Serious All
1990-1991 1 0 1
1994-1995 1 0 1
1999-2000 1 0 1
2003-2004 1 0 1
2014-2015 0 1 1
2015-2016 0 1 1
All 4 2 6
NCCSIR All Sport Report 1982/83-2015/16, Table Appendix 24
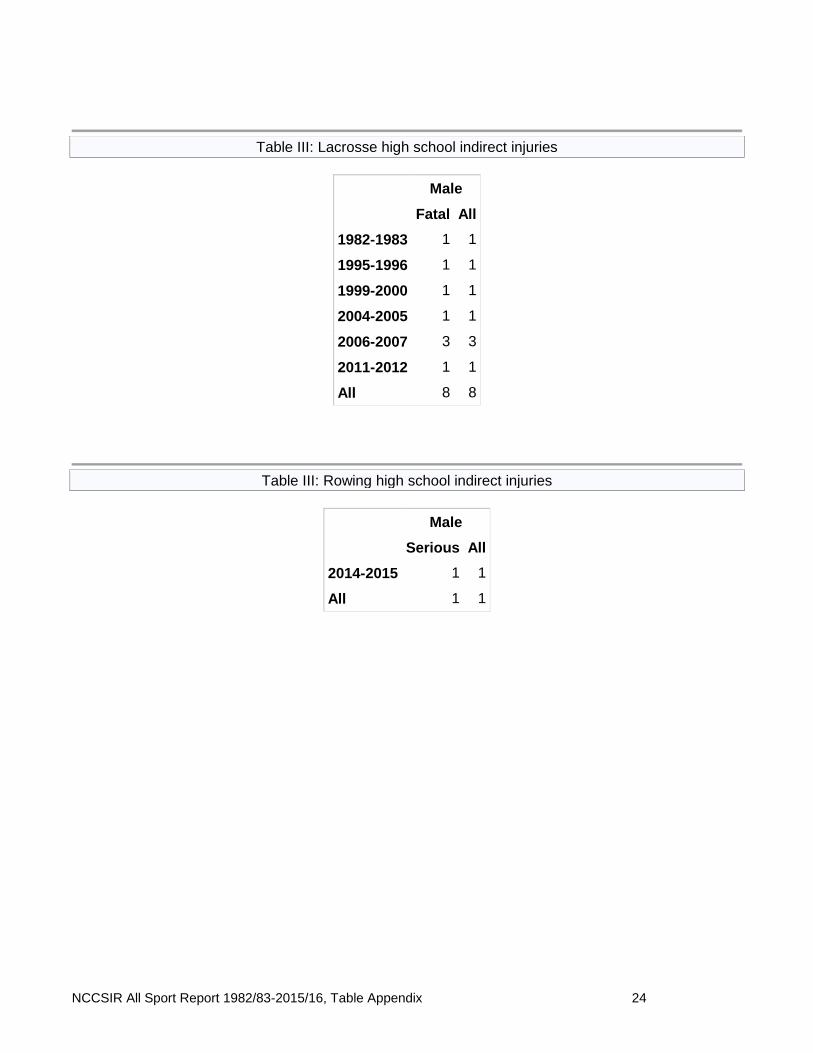
Table III: Lacrosse high school indirect injuries
Male
Fatal All
1982-1983 1 1
1995-1996 1 1
1999-2000 1 1
2004-2005 1 1
2006-2007 3 3
2011-2012 1 1
All 8 8
Table III: Rowing high school indirect injuries
Male
Serious All
2014-2015 1 1
All 1 1
NCCSIR All Sport Report 1982/83-2015/16, Table Appendix 25
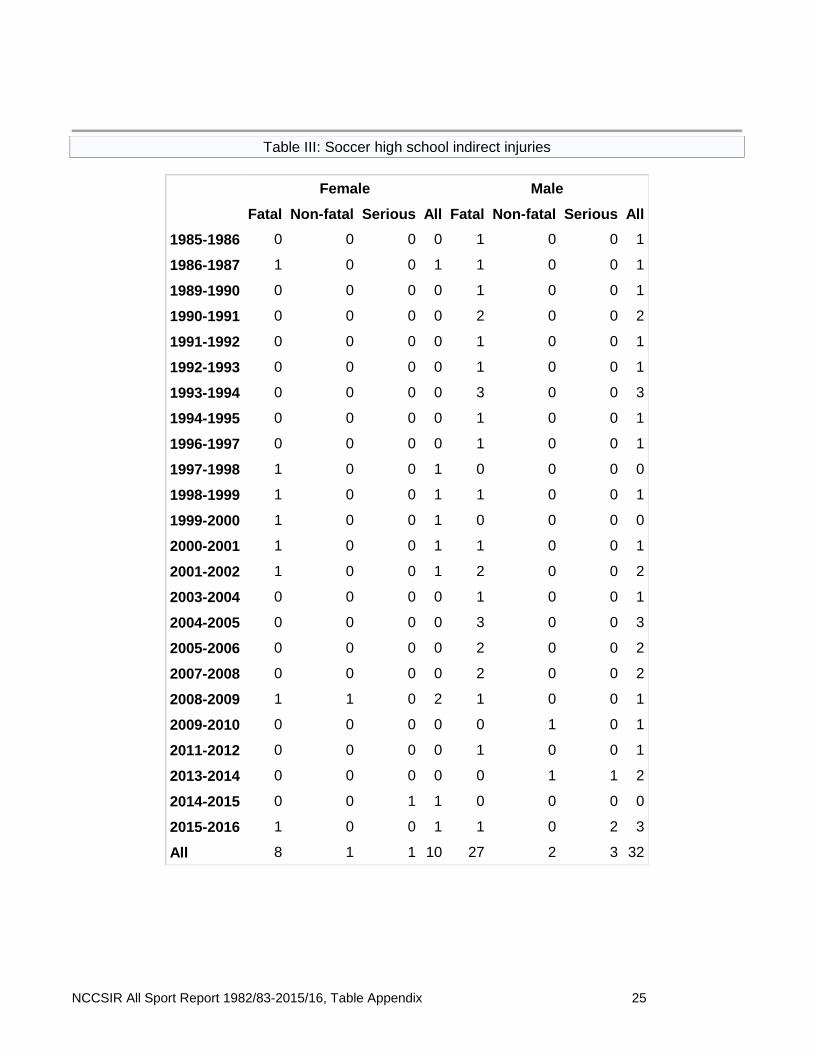
Table III: Soccer high school indirect injuries
Female Male
Fatal Non-fatal Serious All Fatal Non-fatal Serious All
1985-1986 0 0 0 0 1 0 0 1
1986-1987 1 0 0 1 1 0 0 1
1989-1990 0 0 0 0 1 0 0 1
1990-1991 0 0 0 0 2 0 0 2
1991-1992 0 0 0 0 1 0 0 1
1992-1993 0 0 0 0 1 0 0 1
1993-1994 0 0 0 0 3 0 0 3
1994-1995 0 0 0 0 1 0 0 1
1996-1997 0 0 0 0 1 0 0 1
1997-1998 1 0 0 1 0 0 0 0
1998-1999 1 0 0 1 1 0 0 1
1999-2000 1 0 0 1 0 0 0 0
2000-2001 1 0 0 1 1 0 0 1
2001-2002 1 0 0 1 2 0 0 2
2003-2004 0 0 0 0 1 0 0 1
2004-2005 0 0 0 0 3 0 0 3
2005-2006 0 0 0 0 2 0 0 2
2007-2008 0 0 0 0 2 0 0 2
2008-2009 1 1 0 2 1 0 0 1
2009-2010 0 0 0 0 0 1 0 1
2011-2012 0 0 0 0 1 0 0 1
2013-2014 0 0 0 0 0 1 1 2
2014-2015 0 0 1 1 0 0 0 0
2015-2016 1 0 0 1 1 0 2 3
All 8 1 1 10 27 2 3 32
NCCSIR All Sport Report 1982/83-2015/16, Table Appendix 26
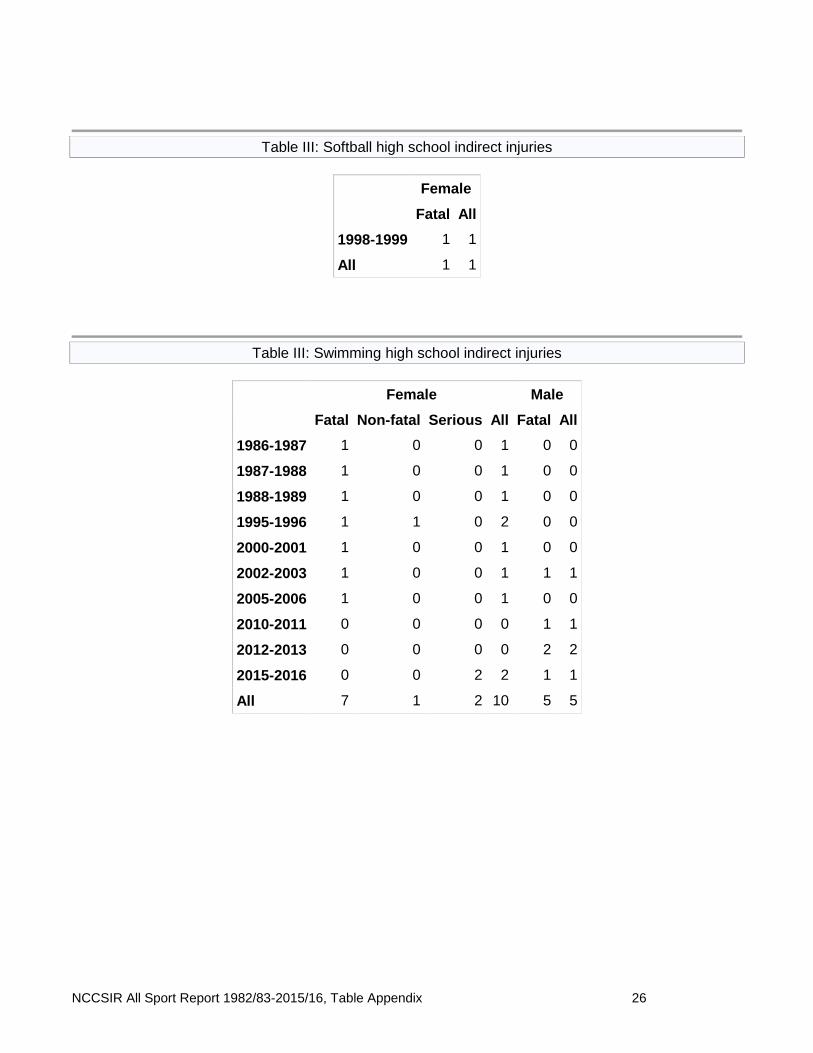
Table III: Softball high school indirect injuries
Female
Fatal All
1998-1999 1 1
All 1 1
Table III: Swimming high school indirect injuries
Female Male
Fatal Non-fatal Serious All Fatal All
1986-1987 1 0 0 1 0 0
1987-1988 1 0 0 1 0 0
1988-1989 1 0 0 1 0 0
1995-1996 1 1 0 2 0 0
2000-2001 1 0 0 1 0 0
2002-2003 1 0 0 1 1 1
2005-2006 1 0 0 1 0 0
2010-2011 0 0 0 0 1 1
2012-2013 0 0 0 0 2 2
2015-2016 0 0 2 2 1 1
All 7 1 2 10 5 5
NCCSIR All Sport Report 1982/83-2015/16, Table Appendix 27
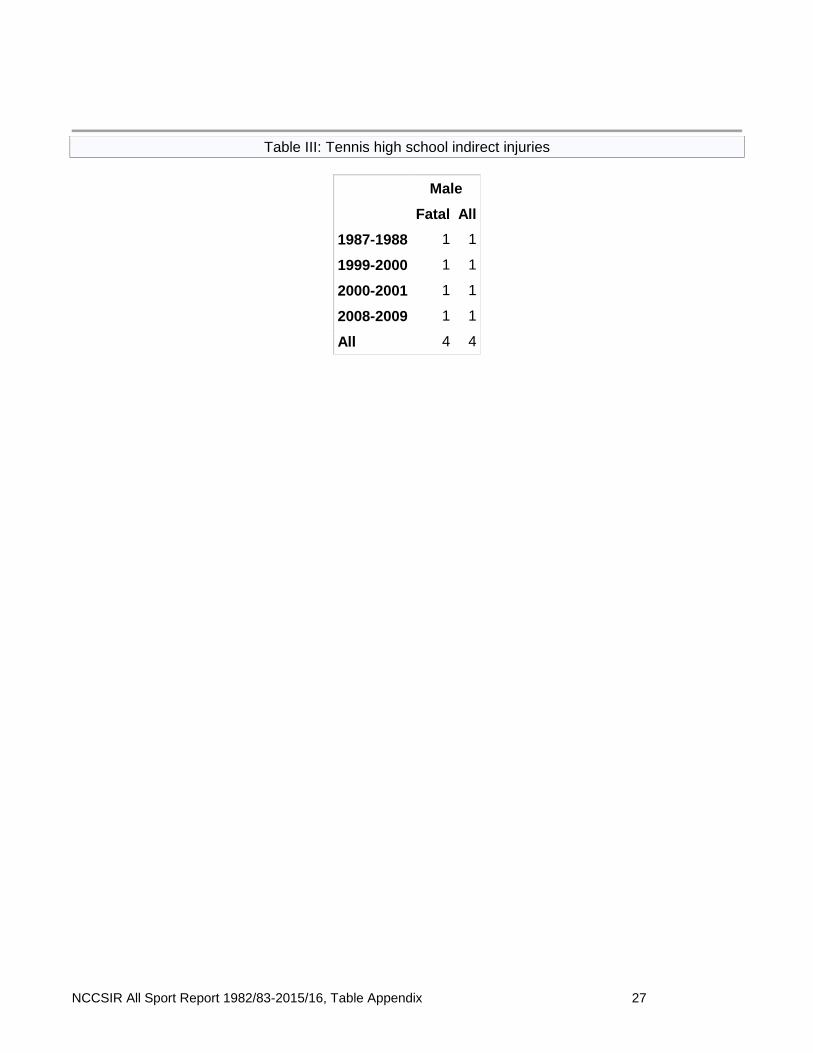
Table III: Tennis high school indirect injuries
Male
Fatal All
1987-1988 1 1
1999-2000 1 1
2000-2001 1 1
2008-2009 1 1
All 4 4
NCCSIR All Sport Report 1982/83-2015/16, Table Appendix 28
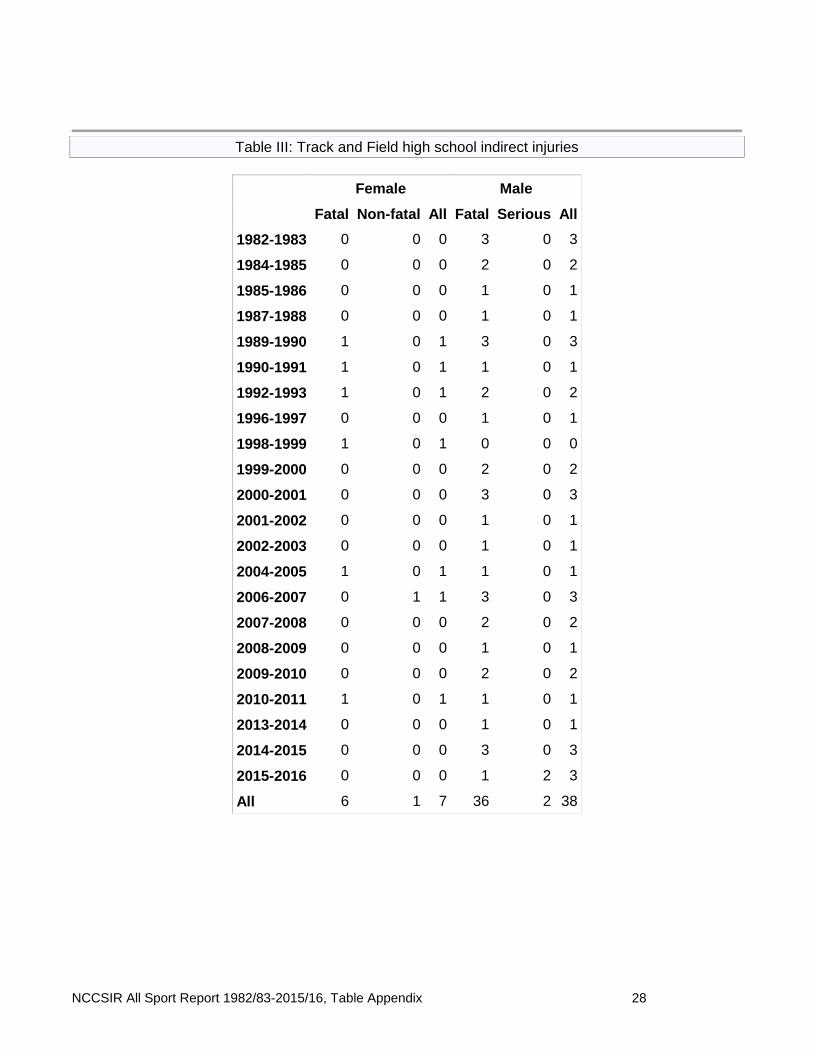
Table III: Track and Field high school indirect injuries
Female Male
Fatal Non-fatal All Fatal Serious All
1982-1983 0 0 0 3 0 3
1984-1985 0 0 0 2 0 2
1985-1986 0 0 0 1 0 1
1987-1988 0 0 0 1 0 1
1989-1990 1 0 1 3 0 3
1990-1991 1 0 1 1 0 1
1992-1993 1 0 1 2 0 2
1996-1997 0 0 0 1 0 1
1998-1999 1 0 1 0 0 0
1999-2000 0 0 0 2 0 2
2000-2001 0 0 0 3 0 3
2001-2002 0 0 0 1 0 1
2002-2003 0 0 0 1 0 1
2004-2005 1 0 1 1 0 1
2006-2007 0 1 1 3 0 3
2007-2008 0 0 0 2 0 2
2008-2009 0 0 0 1 0 1
2009-2010 0 0 0 2 0 2
2010-2011 1 0 1 1 0 1
2013-2014 0 0 0 1 0 1
2014-2015 0 0 0 3 0 3
2015-2016 0 0 0 1 2 3
All 6 1 7 36 2 38
NCCSIR All Sport Report 1982/83-2015/16, Table Appendix 29
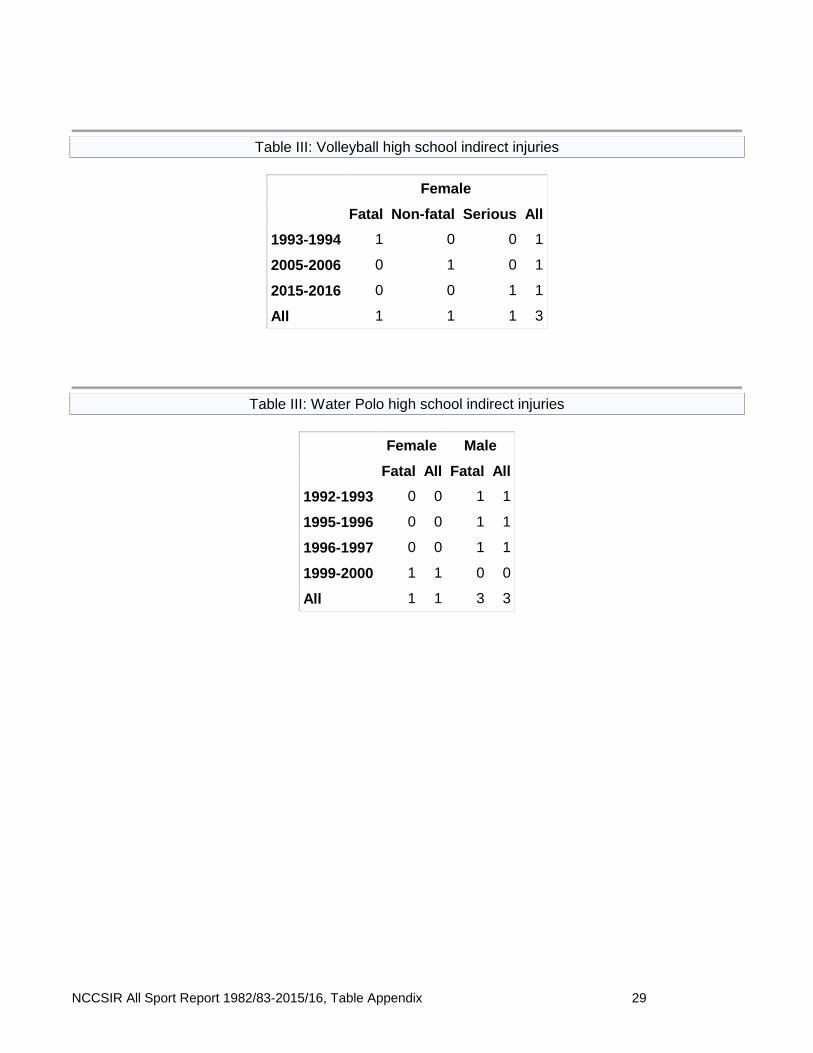
Table III: Volleyball high school indirect injuries
Female
Fatal Non-fatal Serious All
1993-1994 1 0 0 1
2005-2006 0 1 0 1
2015-2016 0 0 1 1
All 1 1 1 3
Table III: Water Polo high school indirect injuries
Female Male
Fatal All Fatal All
1992-1993 0 0 1 1
1995-1996 0 0 1 1
1996-1997 0 0 1 1
1999-2000 1 1 0 0
All 1 1 3 3
NCCSIR All Sport Report 1982/83-2015/16, Table Appendix 30
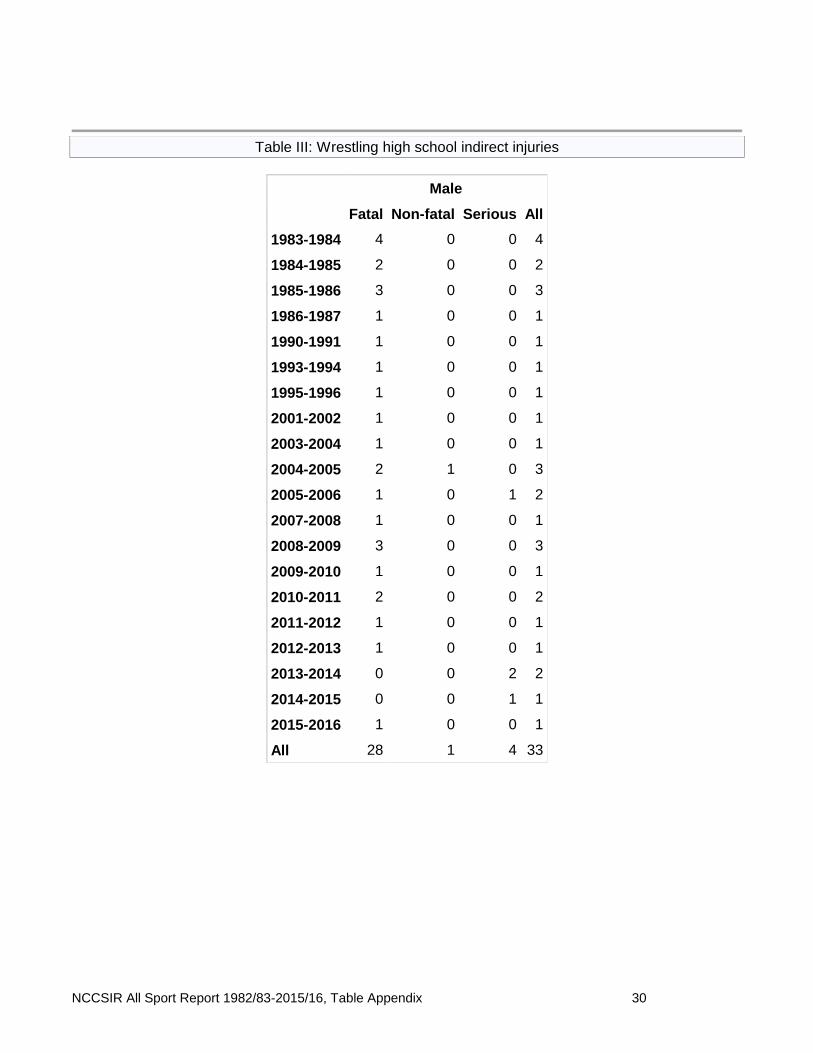
Table III: Wrestling high school indirect injuries
Male
Fatal Non-fatal Serious All
1983-1984 4 0 0 4
1984-1985 2 0 0 2
1985-1986 3 0 0 3
1986-1987 1 0 0 1
1990-1991 1 0 0 1
1993-1994 1 0 0 1
1995-1996 1 0 0 1
2001-2002 1 0 0 1
2003-2004 1 0 0 1
2004-2005 2 1 0 3
2005-2006 1 0 1 2
2007-2008 1 0 0 1
2008-2009 3 0 0 3
2009-2010 1 0 0 1
2010-2011 2 0 0 2
2011-2012 1 0 0 1
2012-2013 1 0 0 1
2013-2014 0 0 2 2
2014-2015 0 0 1 1
2015-2016 1 0 0 1
All 28 1 4 33
NCCSIR All Sport Report 1982/83-2015/16, Table Appendix 31
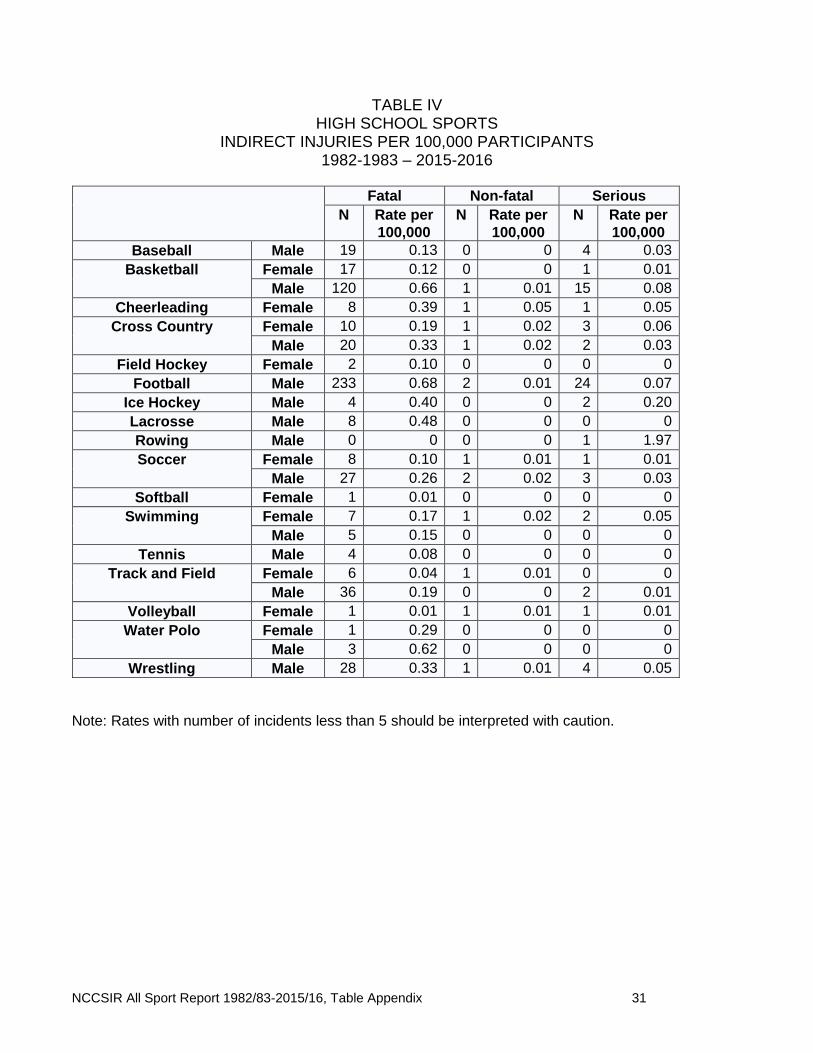
TABLE IV HIGH SCHOOL SPORTS
INDIRECT INJURIES PER 100,000 PARTICIPANTS 1982-1983 – 2015-2016
Fatal Non-fatal Serious
N Rate per
100,000
N Rate per
100,000
N Rate per
100,000
Baseball Male 19 0.13 0 0 4 0.03
Basketball Female 17 0.12 0 0 1 0.01
Male 120 0.66 1 0.01 15 0.08
Cheerleading Female 8 0.39 1 0.05 1 0.05
Cross Country Female 10 0.19 1 0.02 3 0.06
Male 20 0.33 1 0.02 2 0.03
Field Hockey Female 2 0.10 0 0 0 0
Football Male 233 0.68 2 0.01 24 0.07
Ice Hockey Male 4 0.40 0 0 2 0.20
Lacrosse Male 8 0.48 0 0 0 0
Rowing Male 0 0 0 0 1 1.97
Soccer Female 8 0.10 1 0.01 1 0.01
Male 27 0.26 2 0.02 3 0.03
Softball Female 1 0.01 0 0 0 0
Swimming Female 7 0.17 1 0.02 2 0.05
Male 5 0.15 0 0 0 0
Tennis Male 4 0.08 0 0 0 0
Track and Field Female 6 0.04 1 0.01 0 0
Male 36 0.19 0 0 2 0.01
Volleyball Female 1 0.01 1 0.01 1 0.01
Water Polo Female 1 0.29 0 0 0 0
Male 3 0.62 0 0 0 0
Wrestling Male 28 0.33 1 0.01 4 0.05
Note: Rates with number of incidents less than 5 should be interpreted with caution.
NCCSIR All Sport Report 1982/83-2015/16, Table Appendix 32
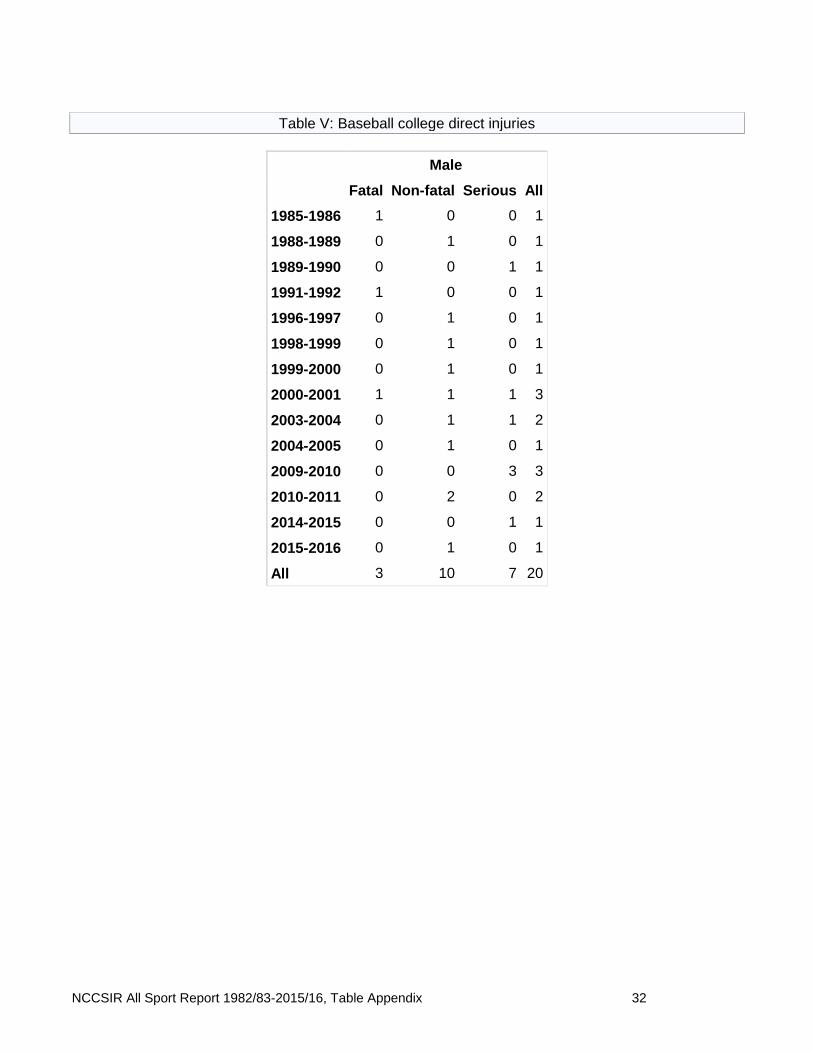
Table V: Baseball college direct injuries
Male
Fatal Non-fatal Serious All
1985-1986 1 0 0 1
1988-1989 0 1 0 1
1989-1990 0 0 1 1
1991-1992 1 0 0 1
1996-1997 0 1 0 1
1998-1999 0 1 0 1
1999-2000 0 1 0 1
2000-2001 1 1 1 3
2003-2004 0 1 1 2
2004-2005 0 1 0 1
2009-2010 0 0 3 3
2010-2011 0 2 0 2
2014-2015 0 0 1 1
2015-2016 0 1 0 1
All 3 10 7 20
NCCSIR All Sport Report 1982/83-2015/16, Table Appendix 33
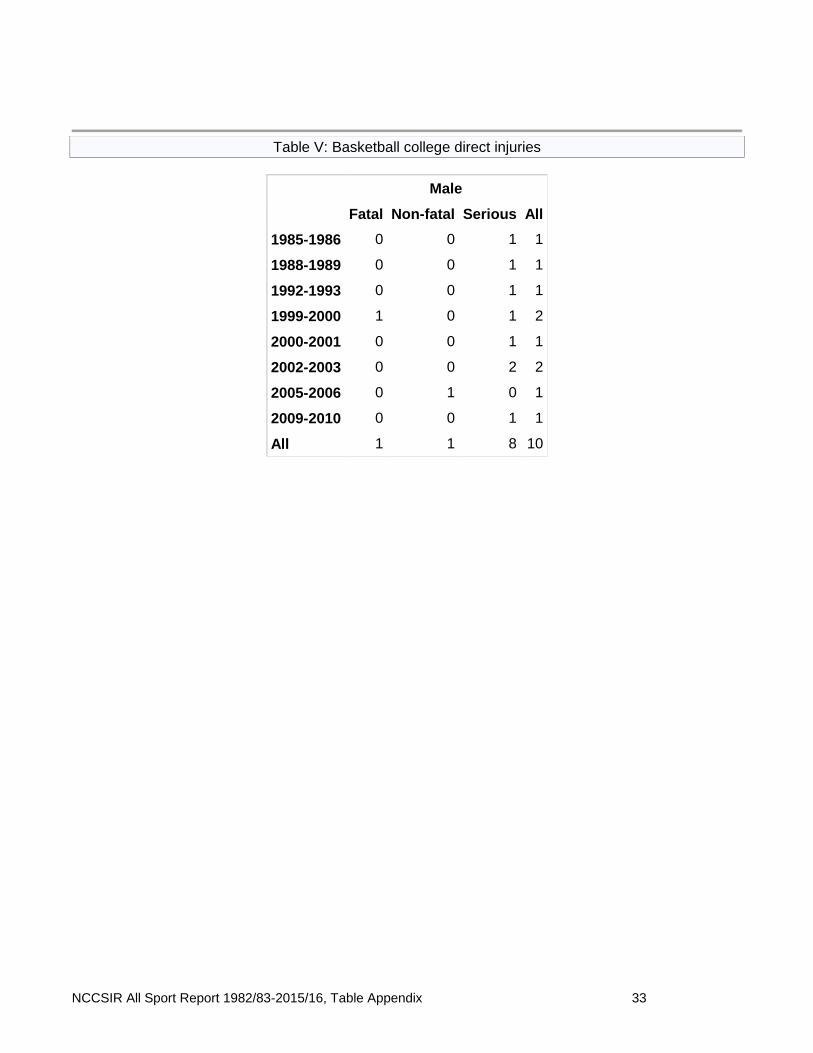
Table V: Basketball college direct injuries
Male
Fatal Non-fatal Serious All
1985-1986 0 0 1 1
1988-1989 0 0 1 1
1992-1993 0 0 1 1
1999-2000 1 0 1 2
2000-2001 0 0 1 1
2002-2003 0 0 2 2
2005-2006 0 1 0 1
2009-2010 0 0 1 1
All 1 1 8 10
NCCSIR All Sport Report 1982/83-2015/16, Table Appendix 34
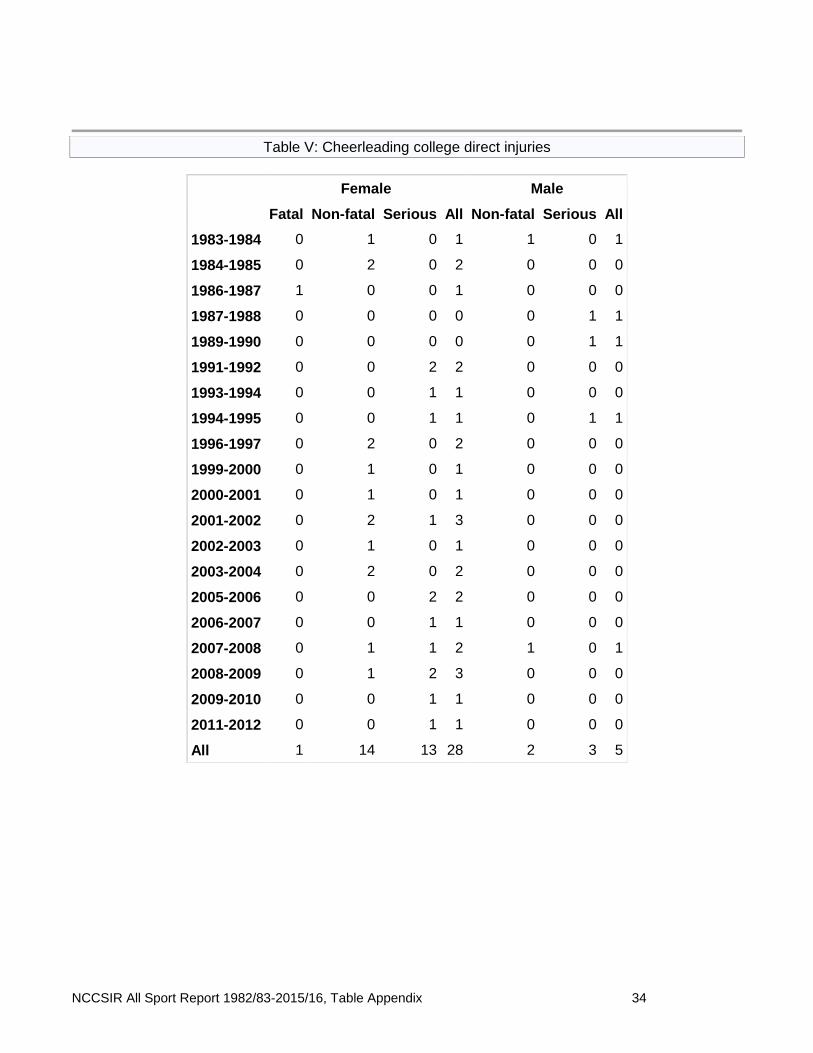
Table V: Cheerleading college direct injuries
Female Male
Fatal Non-fatal Serious All Non-fatal Serious All
1983-1984 0 1 0 1 1 0 1
1984-1985 0 2 0 2 0 0 0
1986-1987 1 0 0 1 0 0 0
1987-1988 0 0 0 0 0 1 1
1989-1990 0 0 0 0 0 1 1
1991-1992 0 0 2 2 0 0 0
1993-1994 0 0 1 1 0 0 0
1994-1995 0 0 1 1 0 1 1
1996-1997 0 2 0 2 0 0 0
1999-2000 0 1 0 1 0 0 0
2000-2001 0 1 0 1 0 0 0
2001-2002 0 2 1 3 0 0 0
2002-2003 0 1 0 1 0 0 0
2003-2004 0 2 0 2 0 0 0
2005-2006 0 0 2 2 0 0 0
2006-2007 0 0 1 1 0 0 0
2007-2008 0 1 1 2 1 0 1
2008-2009 0 1 2 3 0 0 0
2009-2010 0 0 1 1 0 0 0
2011-2012 0 0 1 1 0 0 0
All 1 14 13 28 2 3 5
NCCSIR All Sport Report 1982/83-2015/16, Table Appendix 35
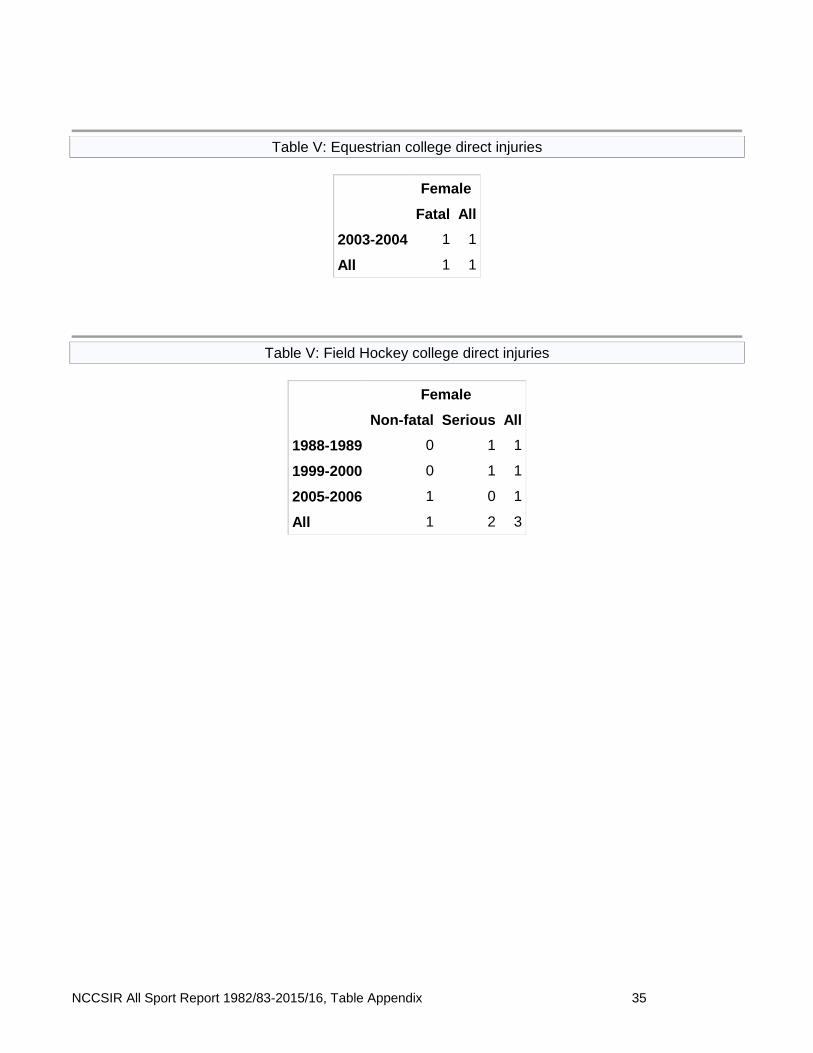
Table V: Equestrian college direct injuries
Female
Fatal All
2003-2004 1 1
All 1 1
Table V: Field Hockey college direct injuries
Female
Non-fatal Serious All
1988-1989 0 1 1
1999-2000 0 1 1
2005-2006 1 0 1
All 1 2 3
NCCSIR All Sport Report 1982/83-2015/16, Table Appendix 36
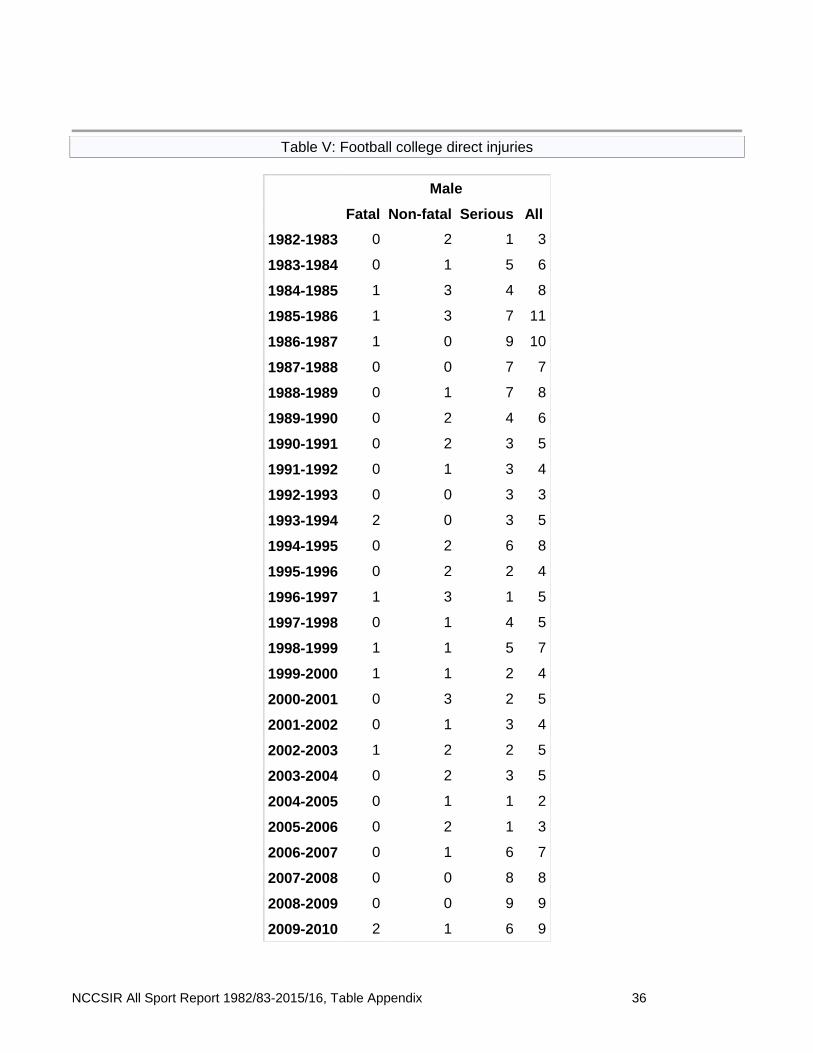
Table V: Football college direct injuries
Male
Fatal Non-fatal Serious All
1982-1983 0 2 1 3
1983-1984 0 1 5 6
1984-1985 1 3 4 8
1985-1986 1 3 7 11
1986-1987 1 0 9 10
1987-1988 0 0 7 7
1988-1989 0 1 7 8
1989-1990 0 2 4 6
1990-1991 0 2 3 5
1991-1992 0 1 3 4
1992-1993 0 0 3 3
1993-1994 2 0 3 5
1994-1995 0 2 6 8
1995-1996 0 2 2 4
1996-1997 1 3 1 5
1997-1998 0 1 4 5
1998-1999 1 1 5 7
1999-2000 1 1 2 4
2000-2001 0 3 2 5
2001-2002 0 1 3 4
2002-2003 1 2 2 5
2003-2004 0 2 3 5
2004-2005 0 1 1 2
2005-2006 0 2 1 3
2006-2007 0 1 6 7
2007-2008 0 0 8 8
2008-2009 0 0 9 9
2009-2010 2 1 6 9
NCCSIR All Sport Report 1982/83-2015/16, Table Appendix 37
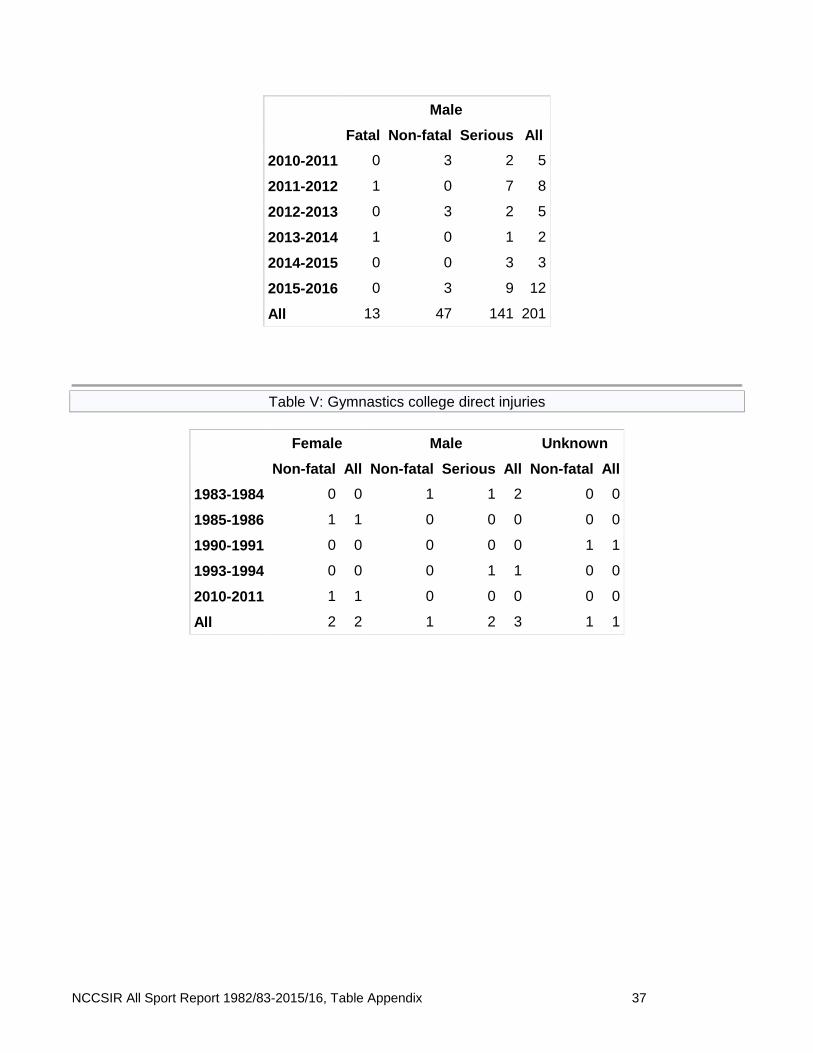
Male
Fatal Non-fatal Serious All
2010-2011 0 3 2 5
2011-2012 1 0 7 8
2012-2013 0 3 2 5
2013-2014 1 0 1 2
2014-2015 0 0 3 3
2015-2016 0 3 9 12
All 13 47 141 201
Table V: Gymnastics college direct injuries
Female Male Unknown
Non-fatal All Non-fatal Serious All Non-fatal All
1983-1984 0 0 1 1 2 0 0
1985-1986 1 1 0 0 0 0 0
1990-1991 0 0 0 0 0 1 1
1993-1994 0 0 0 1 1 0 0
2010-2011 1 1 0 0 0 0 0
All 2 2 1 2 3 1 1
NCCSIR All Sport Report 1982/83-2015/16, Table Appendix 38
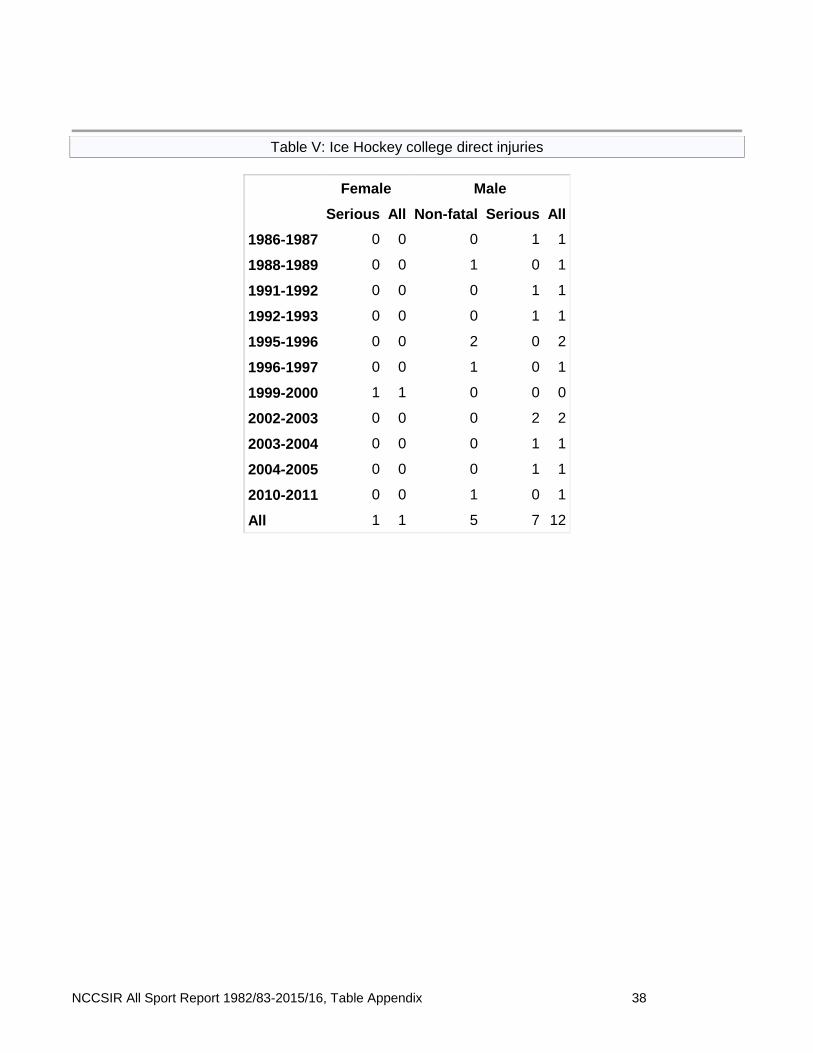
Table V: Ice Hockey college direct injuries
Female Male
Serious All Non-fatal Serious All
1986-1987 0 0 0 1 1
1988-1989 0 0 1 0 1
1991-1992 0 0 0 1 1
1992-1993 0 0 0 1 1
1995-1996 0 0 2 0 2
1996-1997 0 0 1 0 1
1999-2000 1 1 0 0 0
2002-2003 0 0 0 2 2
2003-2004 0 0 0 1 1
2004-2005 0 0 0 1 1
2010-2011 0 0 1 0 1
All 1 1 5 7 12
NCCSIR All Sport Report 1982/83-2015/16, Table Appendix 39
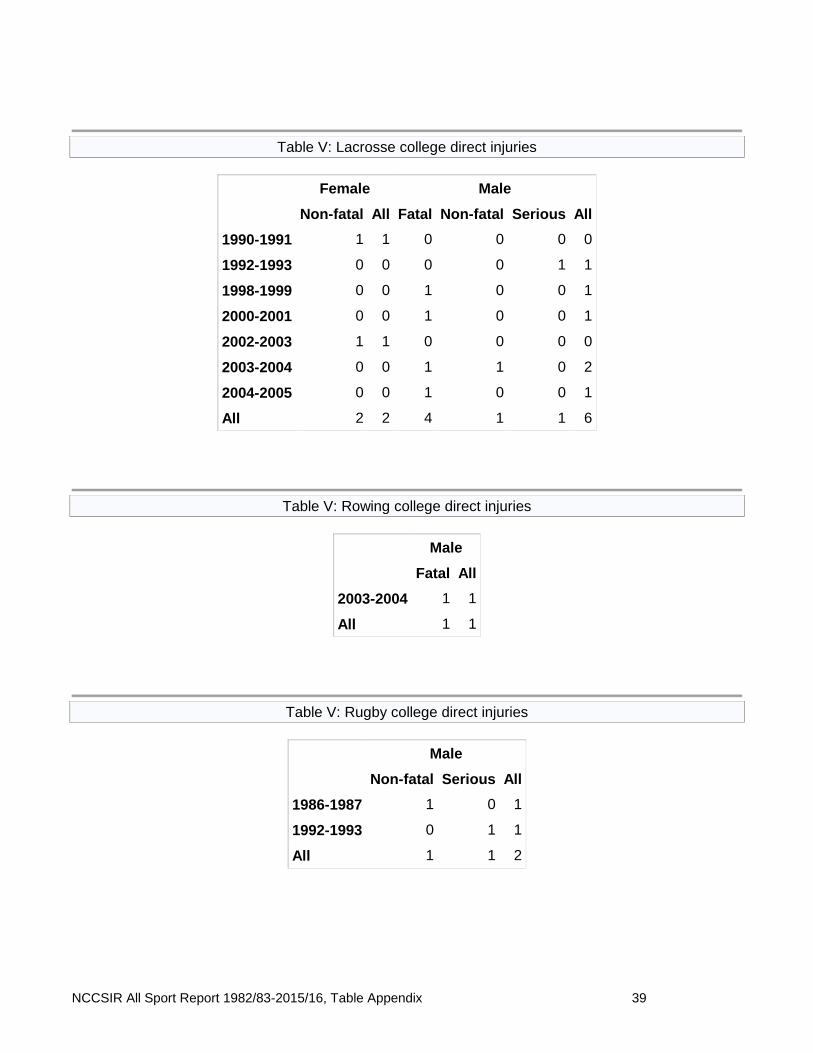
Table V: Lacrosse college direct injuries
Female Male
Non-fatal All Fatal Non-fatal Serious All
1990-1991 1 1 0 0 0 0
1992-1993 0 0 0 0 1 1
1998-1999 0 0 1 0 0 1
2000-2001 0 0 1 0 0 1
2002-2003 1 1 0 0 0 0
2003-2004 0 0 1 1 0 2
2004-2005 0 0 1 0 0 1
All 2 2 4 1 1 6
Table V: Rowing college direct injuries
Male
Fatal All
2003-2004 1 1
All 1 1
Table V: Rugby college direct injuries
Male
Non-fatal Serious All
1986-1987 1 0 1
1992-1993 0 1 1
All 1 1 2
NCCSIR All Sport Report 1982/83-2015/16, Table Appendix 40
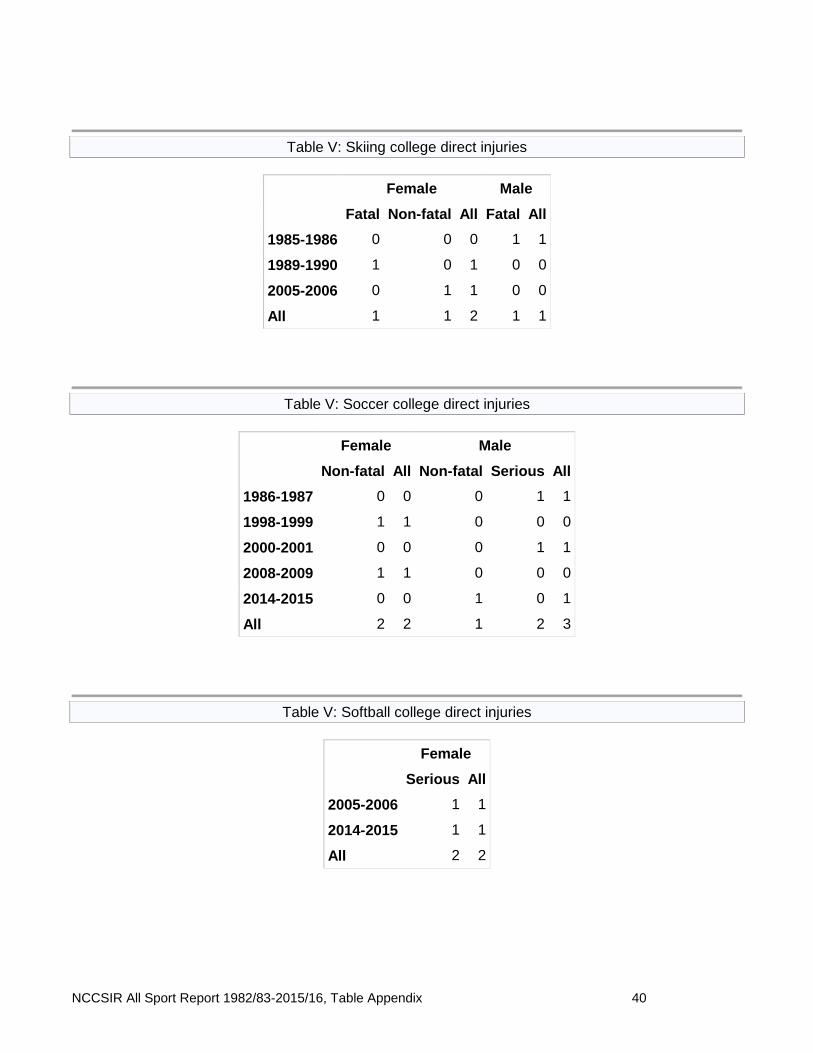
Table V: Skiing college direct injuries
Female Male
Fatal Non-fatal All Fatal All
1985-1986 0 0 0 1 1
1989-1990 1 0 1 0 0
2005-2006 0 1 1 0 0
All 1 1 2 1 1
Table V: Soccer college direct injuries
Female Male
Non-fatal All Non-fatal Serious All
1986-1987 0 0 0 1 1
1998-1999 1 1 0 0 0
2000-2001 0 0 0 1 1
2008-2009 1 1 0 0 0
2014-2015 0 0 1 0 1
All 2 2 1 2 3
Table V: Softball college direct injuries
Female
Serious All
2005-2006 1 1
2014-2015 1 1
All 2 2
NCCSIR All Sport Report 1982/83-2015/16, Table Appendix 41
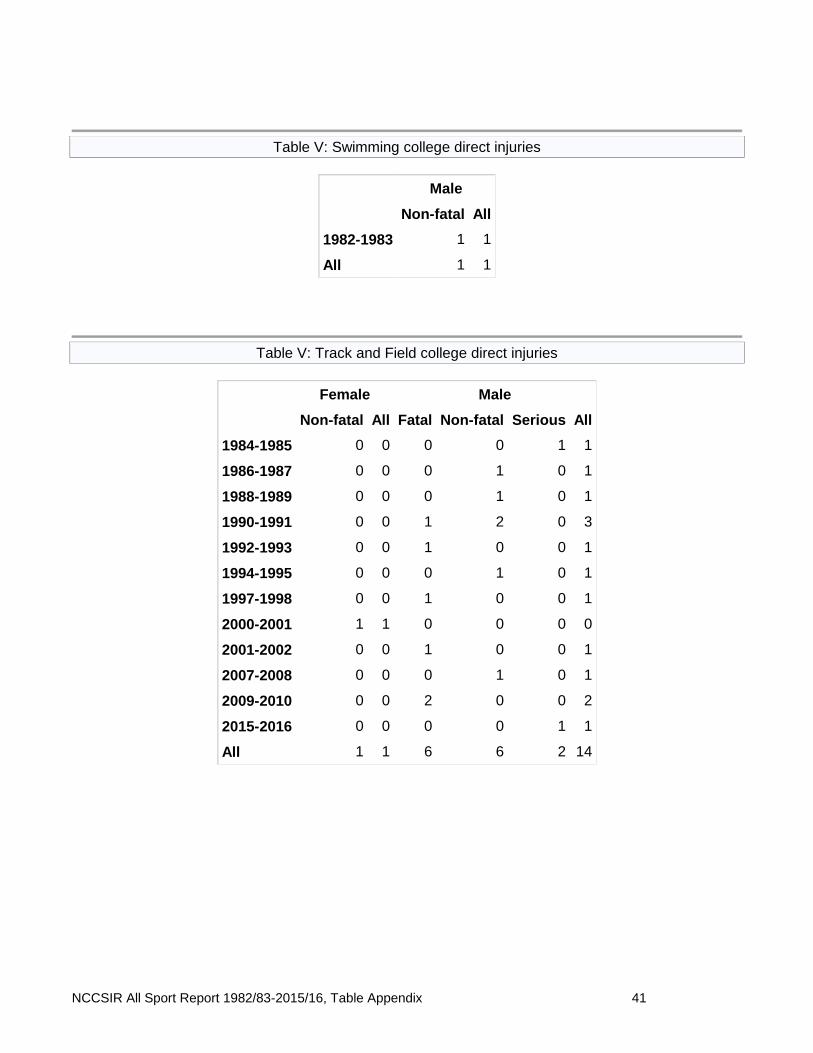
Table V: Swimming college direct injuries
Male
Non-fatal All
1982-1983 1 1
All 1 1
Table V: Track and Field college direct injuries
Female Male
Non-fatal All Fatal Non-fatal Serious All
1984-1985 0 0 0 0 1 1
1986-1987 0 0 0 1 0 1
1988-1989 0 0 0 1 0 1
1990-1991 0 0 1 2 0 3
1992-1993 0 0 1 0 0 1
1994-1995 0 0 0 1 0 1
1997-1998 0 0 1 0 0 1
2000-2001 1 1 0 0 0 0
2001-2002 0 0 1 0 0 1
2007-2008 0 0 0 1 0 1
2009-2010 0 0 2 0 0 2
2015-2016 0 0 0 0 1 1
All 1 1 6 6 2 14
NCCSIR All Sport Report 1982/83-2015/16, Table Appendix 42
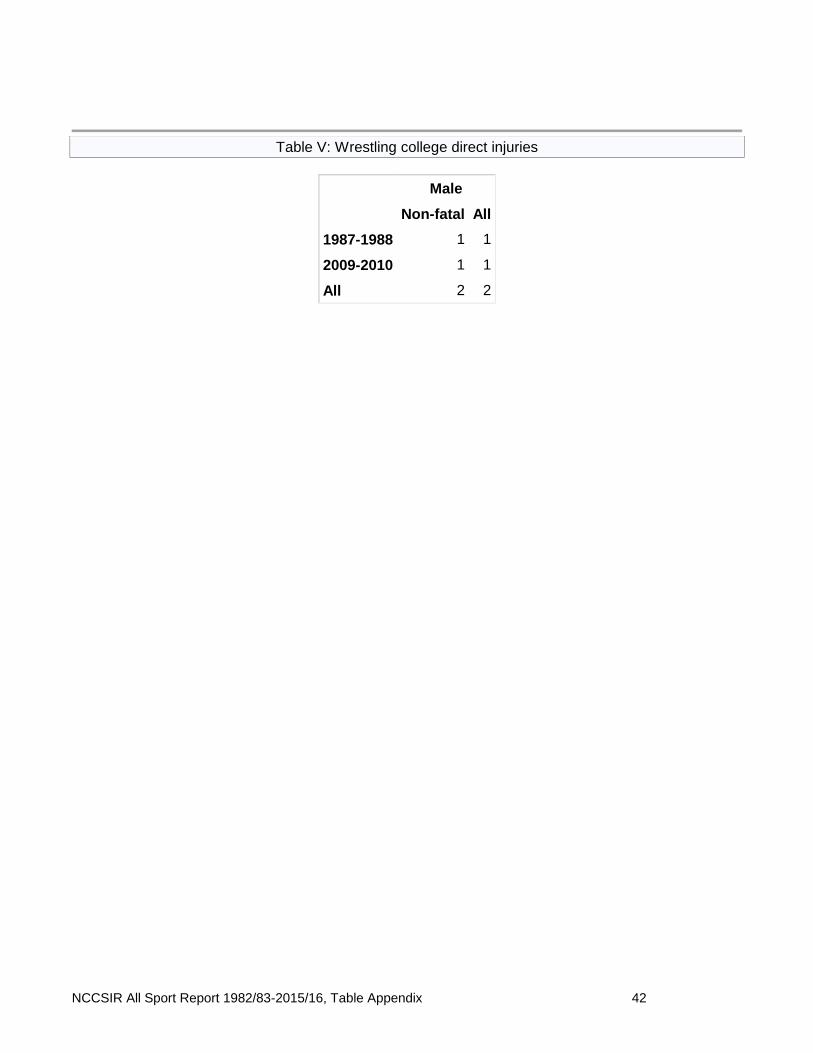
Table V: Wrestling college direct injuries
Male
Non-fatal All
1987-1988 1 1
2009-2010 1 1
All 2 2
NCCSIR All Sport Report 1982/83-2015/16, Table Appendix 43
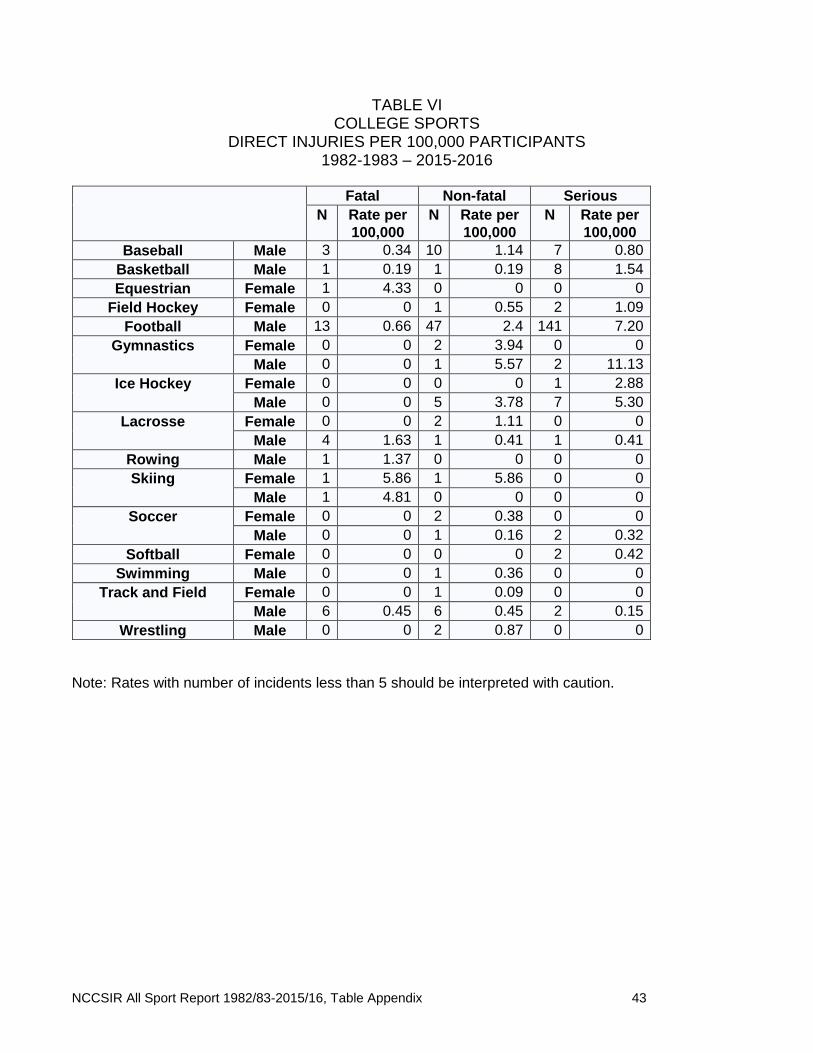
TABLE VI COLLEGE SPORTS
DIRECT INJURIES PER 100,000 PARTICIPANTS 1982-1983 – 2015-2016
Fatal Non-fatal Serious
N Rate per
100,000
N Rate per
100,000
N Rate per
100,000
Baseball Male 3 0.34 10 1.14 7 0.80
Basketball Male 1 0.19 1 0.19 8 1.54
Equestrian Female 1 4.33 0 0 0 0
Field Hockey Female 0 0 1 0.55 2 1.09
Football Male 13 0.66 47 2.4 141 7.20
Gymnastics Female 0 0 2 3.94 0 0
Male 0 0 1 5.57 2 11.13
Ice Hockey Female 0 0 0 0 1 2.88
Male 0 0 5 3.78 7 5.30
Lacrosse Female 0 0 2 1.11 0 0
Male 4 1.63 1 0.41 1 0.41
Rowing Male 1 1.37 0 0 0 0
Skiing Female 1 5.86 1 5.86 0 0
Male 1 4.81 0 0 0 0
Soccer Female 0 0 2 0.38 0 0
Male 0 0 1 0.16 2 0.32
Softball Female 0 0 0 0 2 0.42
Swimming Male 0 0 1 0.36 0 0
Track and Field Female 0 0 1 0.09 0 0
Male 6 0.45 6 0.45 2 0.15
Wrestling Male 0 0 2 0.87 0 0
Note: Rates with number of incidents less than 5 should be interpreted with caution.
NCCSIR All Sport Report 1982/83-2015/16, Table Appendix 44
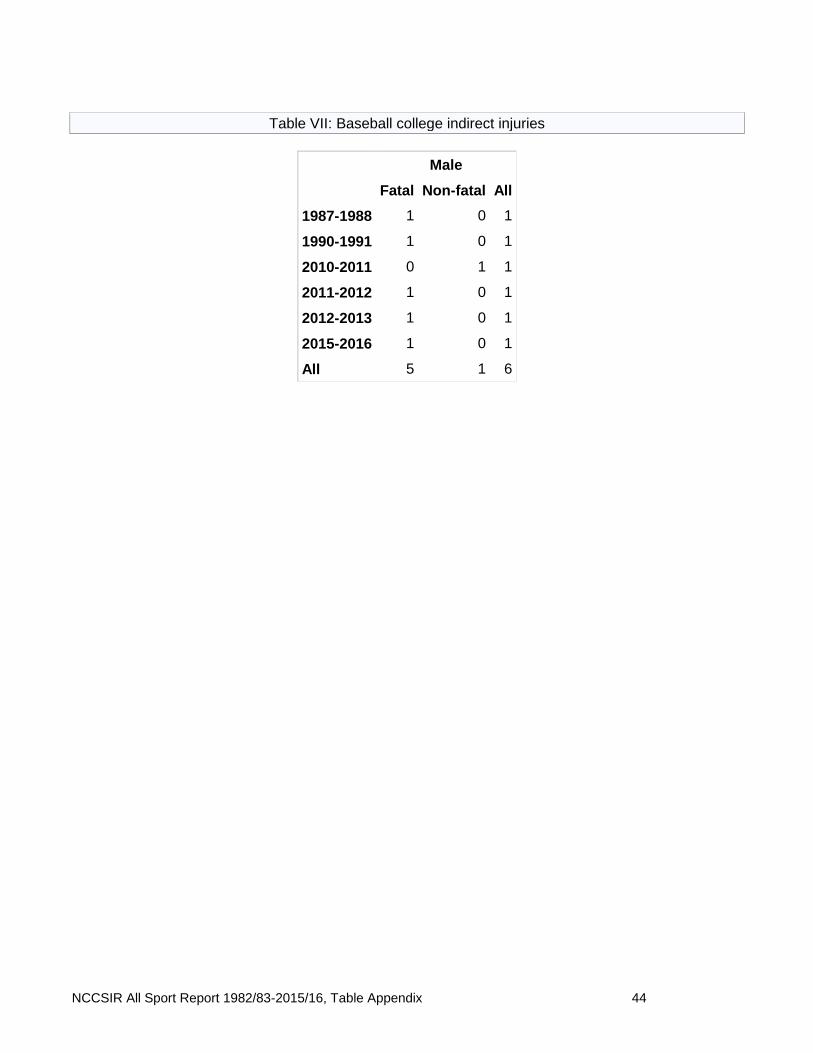
Table VII: Baseball college indirect injuries
Male
Fatal Non-fatal All
1987-1988 1 0 1
1990-1991 1 0 1
2010-2011 0 1 1
2011-2012 1 0 1
2012-2013 1 0 1
2015-2016 1 0 1
All 5 1 6
NCCSIR All Sport Report 1982/83-2015/16, Table Appendix 45
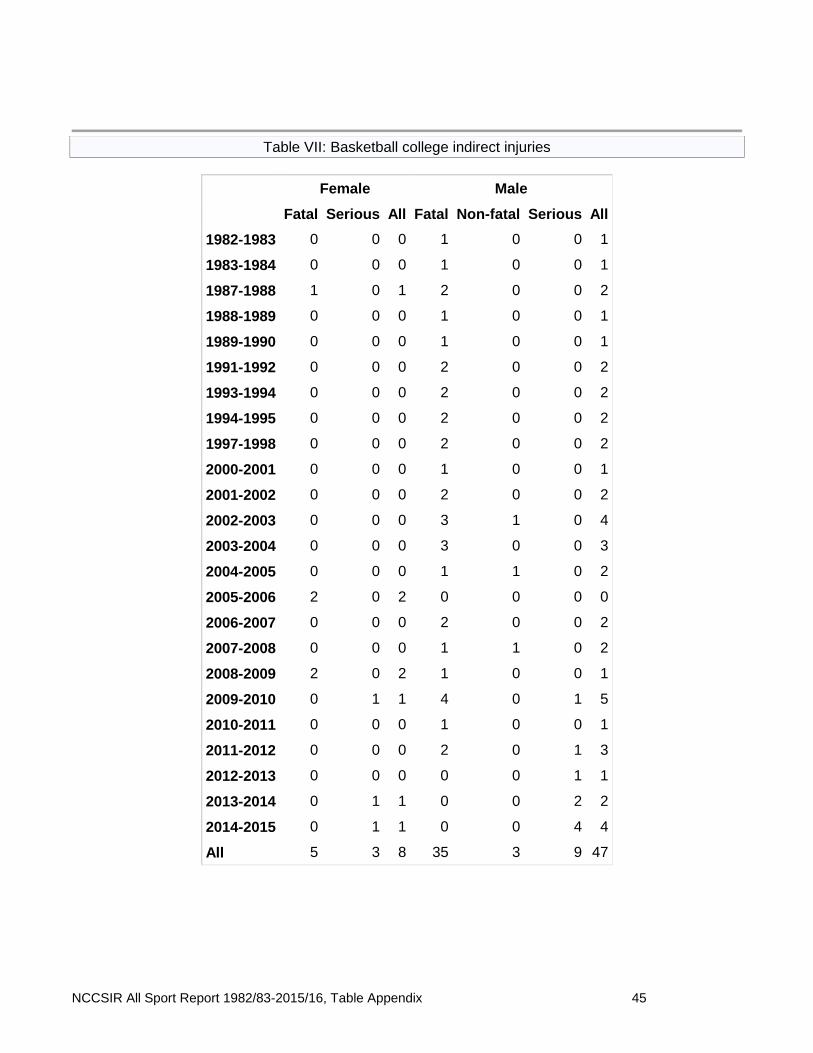
Table VII: Basketball college indirect injuries
Female Male
Fatal Serious All Fatal Non-fatal Serious All
1982-1983 0 0 0 1 0 0 1
1983-1984 0 0 0 1 0 0 1
1987-1988 1 0 1 2 0 0 2
1988-1989 0 0 0 1 0 0 1
1989-1990 0 0 0 1 0 0 1
1991-1992 0 0 0 2 0 0 2
1993-1994 0 0 0 2 0 0 2
1994-1995 0 0 0 2 0 0 2
1997-1998 0 0 0 2 0 0 2
2000-2001 0 0 0 1 0 0 1
2001-2002 0 0 0 2 0 0 2
2002-2003 0 0 0 3 1 0 4
2003-2004 0 0 0 3 0 0 3
2004-2005 0 0 0 1 1 0 2
2005-2006 2 0 2 0 0 0 0
2006-2007 0 0 0 2 0 0 2
2007-2008 0 0 0 1 1 0 2
2008-2009 2 0 2 1 0 0 1
2009-2010 0 1 1 4 0 1 5
2010-2011 0 0 0 1 0 0 1
2011-2012 0 0 0 2 0 1 3
2012-2013 0 0 0 0 0 1 1
2013-2014 0 1 1 0 0 2 2
2014-2015 0 1 1 0 0 4 4
All 5 3 8 35 3 9 47
NCCSIR All Sport Report 1982/83-2015/16, Table Appendix 46
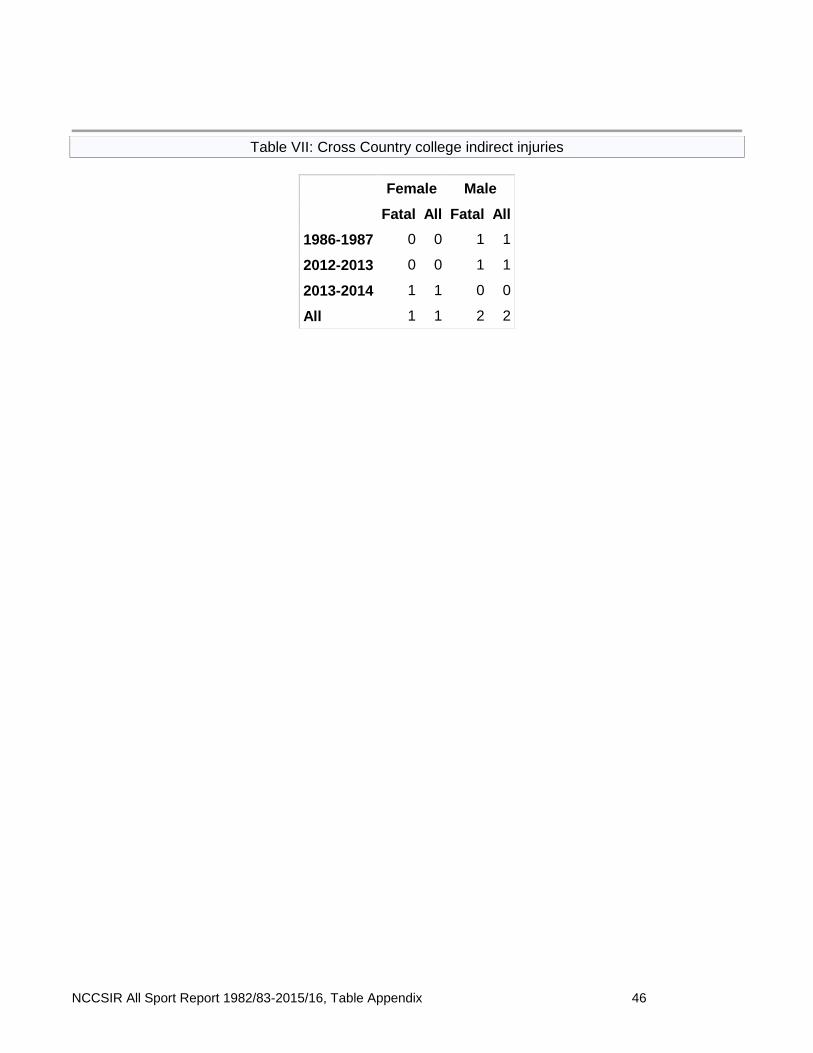
Table VII: Cross Country college indirect injuries
Female Male
Fatal All Fatal All
1986-1987 0 0 1 1
2012-2013 0 0 1 1
2013-2014 1 1 0 0
All 1 1 2 2
NCCSIR All Sport Report 1982/83-2015/16, Table Appendix 47
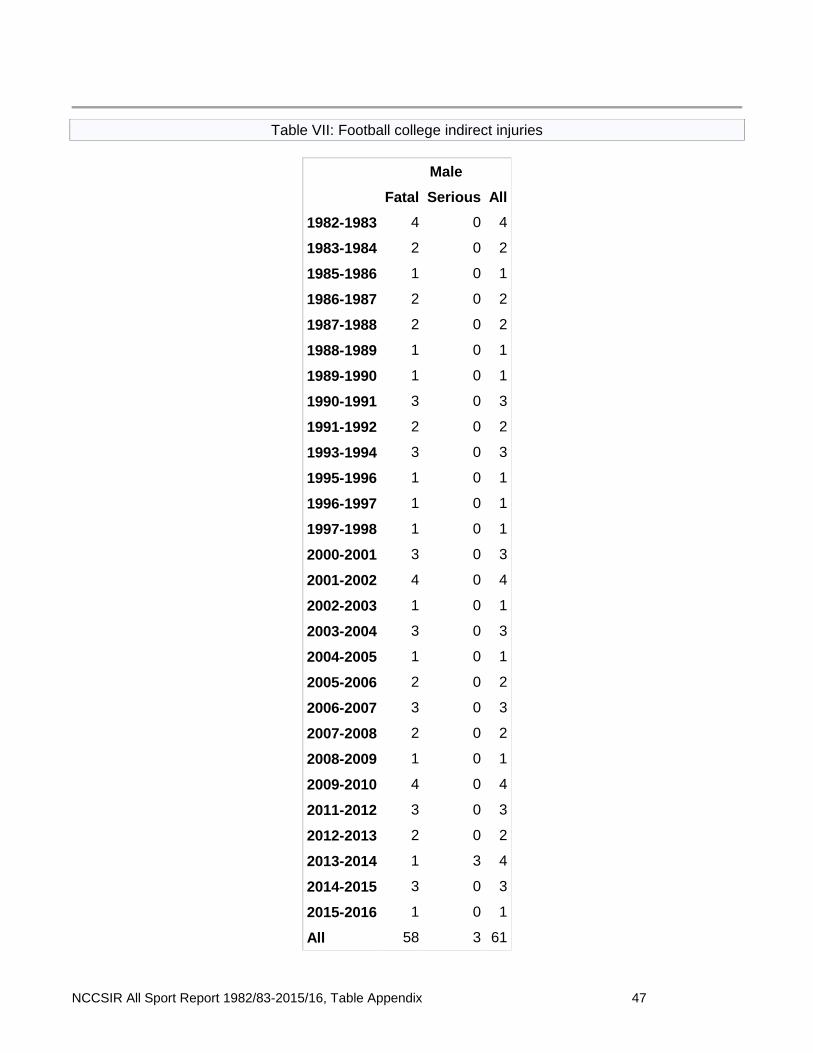
Table VII: Football college indirect injuries
Male
Fatal Serious All
1982-1983 4 0 4
1983-1984 2 0 2
1985-1986 1 0 1
1986-1987 2 0 2
1987-1988 2 0 2
1988-1989 1 0 1
1989-1990 1 0 1
1990-1991 3 0 3
1991-1992 2 0 2
1993-1994 3 0 3
1995-1996 1 0 1
1996-1997 1 0 1
1997-1998 1 0 1
2000-2001 3 0 3
2001-2002 4 0 4
2002-2003 1 0 1
2003-2004 3 0 3
2004-2005 1 0 1
2005-2006 2 0 2
2006-2007 3 0 3
2007-2008 2 0 2
2008-2009 1 0 1
2009-2010 4 0 4
2011-2012 3 0 3
2012-2013 2 0 2
2013-2014 1 3 4
2014-2015 3 0 3
2015-2016 1 0 1
All 58 3 61
NCCSIR All Sport Report 1982/83-2015/16, Table Appendix 48
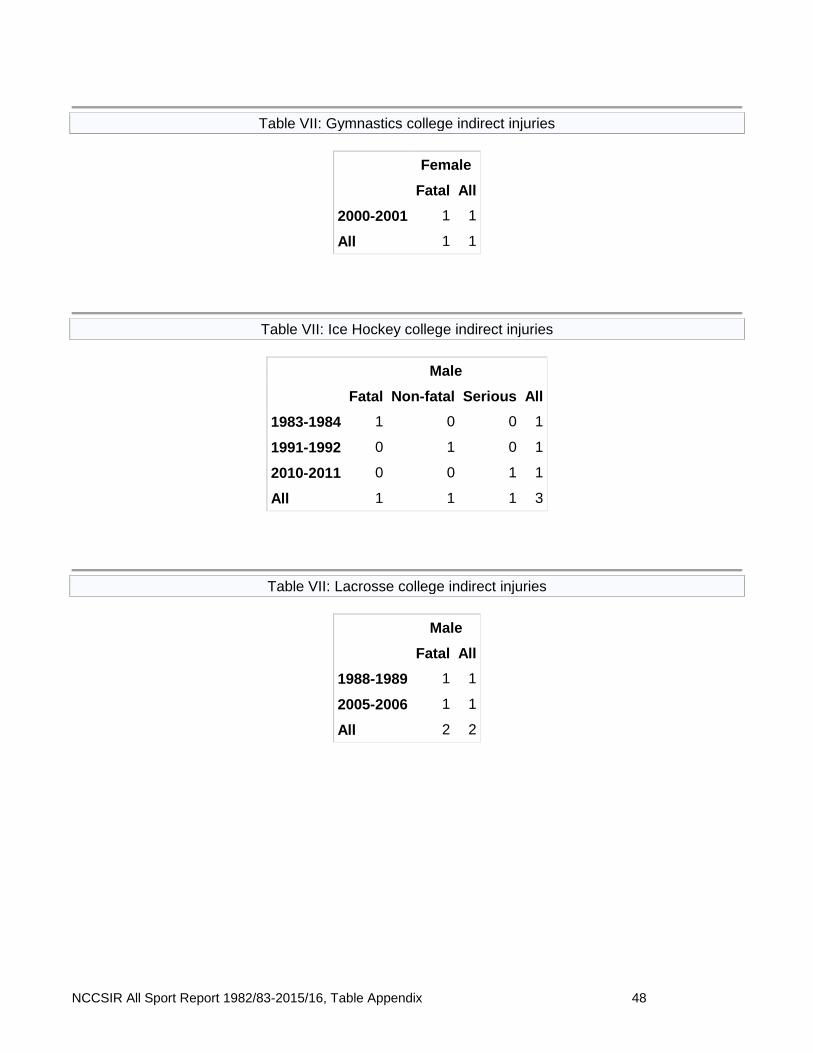
Table VII: Gymnastics college indirect injuries
Female
Fatal All
2000-2001 1 1
All 1 1
Table VII: Ice Hockey college indirect injuries
Male
Fatal Non-fatal Serious All
1983-1984 1 0 0 1
1991-1992 0 1 0 1
2010-2011 0 0 1 1
All 1 1 1 3
Table VII: Lacrosse college indirect injuries
Male
Fatal All
1988-1989 1 1
2005-2006 1 1
All 2 2
NCCSIR All Sport Report 1982/83-2015/16, Table Appendix 49
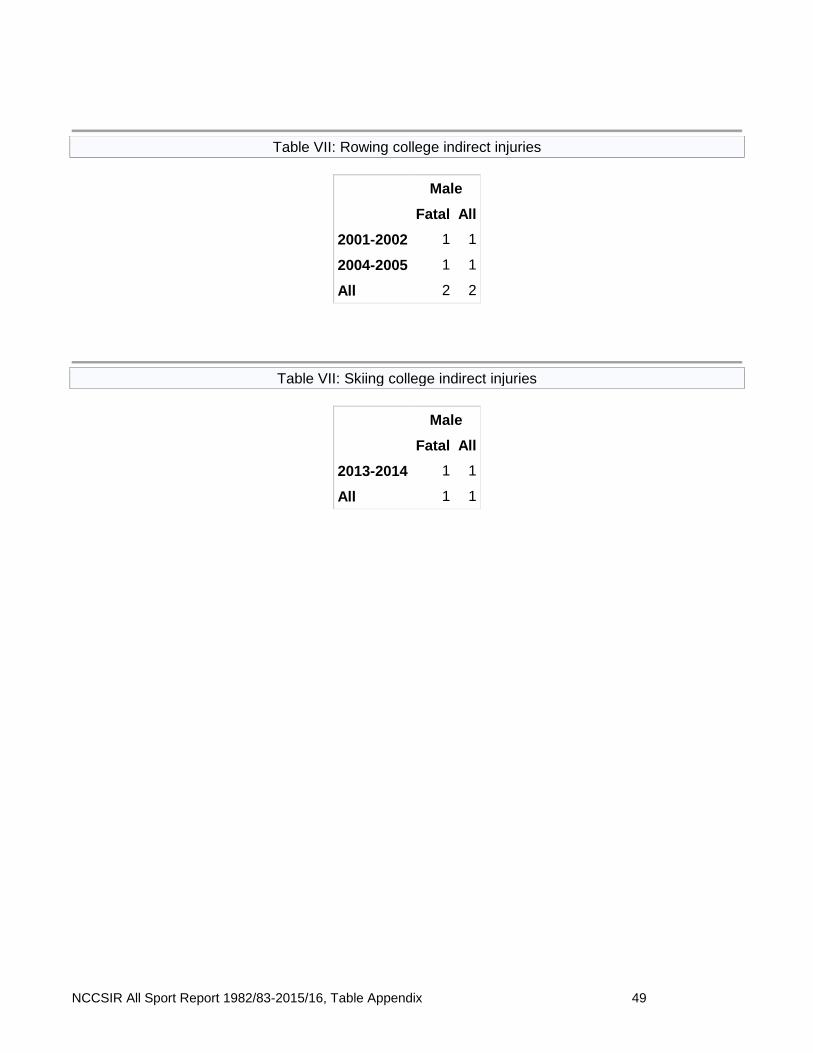
Table VII: Rowing college indirect injuries
Male
Fatal All
2001-2002 1 1
2004-2005 1 1
All 2 2
Table VII: Skiing college indirect injuries
Male
Fatal All
2013-2014 1 1
All 1 1
NCCSIR All Sport Report 1982/83-2015/16, Table Appendix 50
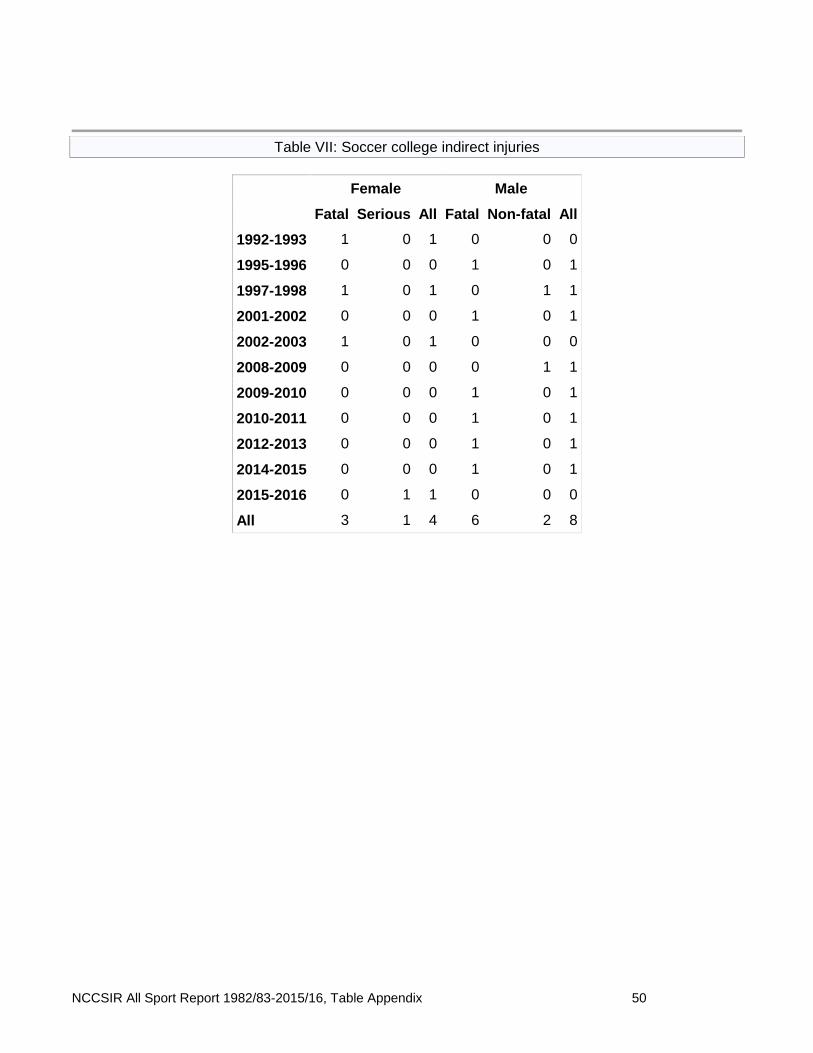
Table VII: Soccer college indirect injuries
Female Male
Fatal Serious All Fatal Non-fatal All
1992-1993 1 0 1 0 0 0
1995-1996 0 0 0 1 0 1
1997-1998 1 0 1 0 1 1
2001-2002 0 0 0 1 0 1
2002-2003 1 0 1 0 0 0
2008-2009 0 0 0 0 1 1
2009-2010 0 0 0 1 0 1
2010-2011 0 0 0 1 0 1
2012-2013 0 0 0 1 0 1
2014-2015 0 0 0 1 0 1
2015-2016 0 1 1 0 0 0
All 3 1 4 6 2 8
NCCSIR All Sport Report 1982/83-2015/16, Table Appendix 51
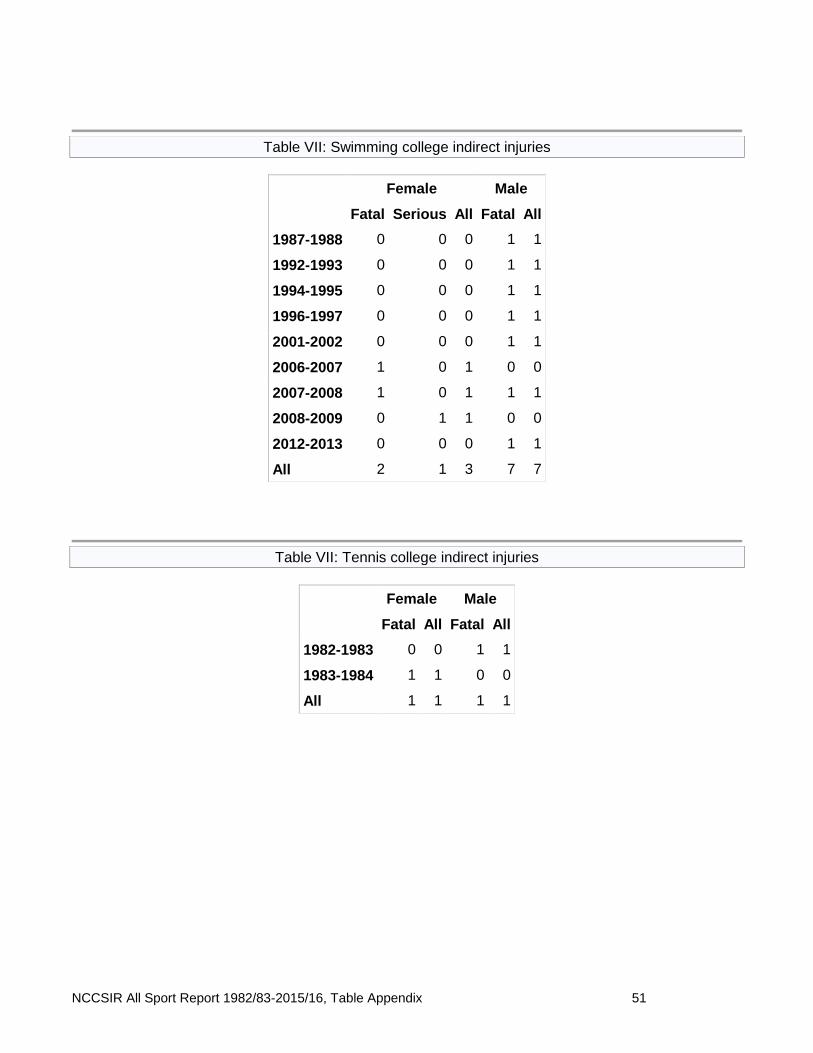
Table VII: Swimming college indirect injuries
Female Male
Fatal Serious All Fatal All
1987-1988 0 0 0 1 1
1992-1993 0 0 0 1 1
1994-1995 0 0 0 1 1
1996-1997 0 0 0 1 1
2001-2002 0 0 0 1 1
2006-2007 1 0 1 0 0
2007-2008 1 0 1 1 1
2008-2009 0 1 1 0 0
2012-2013 0 0 0 1 1
All 2 1 3 7 7
Table VII: Tennis college indirect injuries
Female Male
Fatal All Fatal All
1982-1983 0 0 1 1
1983-1984 1 1 0 0
All 1 1 1 1
NCCSIR All Sport Report 1982/83-2015/16, Table Appendix 52
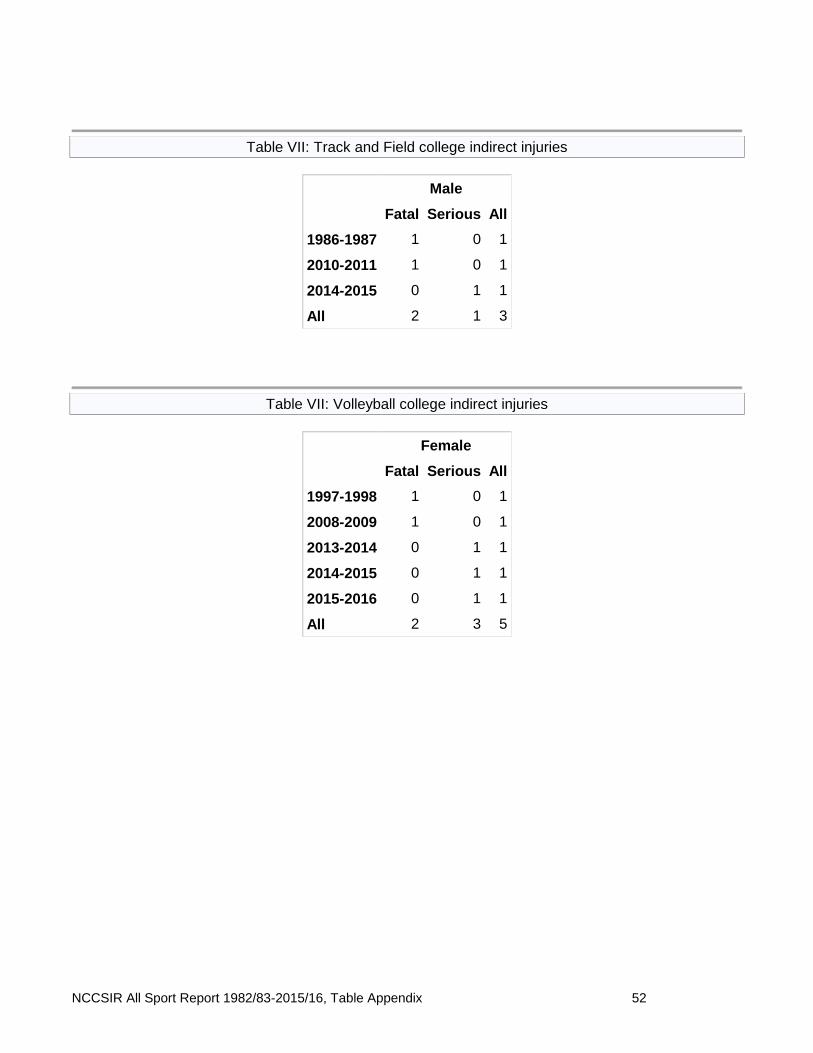
Table VII: Track and Field college indirect injuries
Male
Fatal Serious All
1986-1987 1 0 1
2010-2011 1 0 1
2014-2015 0 1 1
All 2 1 3
Table VII: Volleyball college indirect injuries
Female
Fatal Serious All
1997-1998 1 0 1
2008-2009 1 0 1
2013-2014 0 1 1
2014-2015 0 1 1
2015-2016 0 1 1
All 2 3 5
NCCSIR All Sport Report 1982/83-2015/16, Table Appendix 53
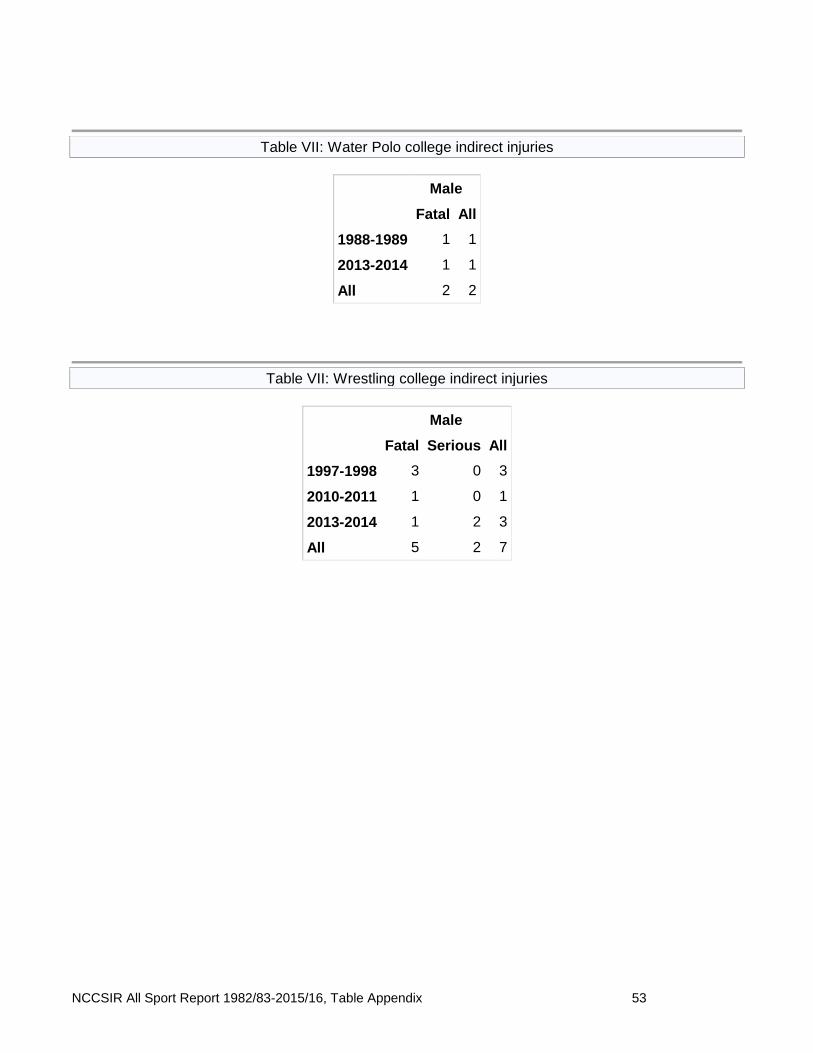
Table VII: Water Polo college indirect injuries
Male
Fatal All
1988-1989 1 1
2013-2014 1 1
All 2 2
Table VII: Wrestling college indirect injuries
Male
Fatal Serious All
1997-1998 3 0 3
2010-2011 1 0 1
2013-2014 1 2 3
All 5 2 7
NCCSIR All Sport Report 1982/83-2015/16, Table Appendix 54
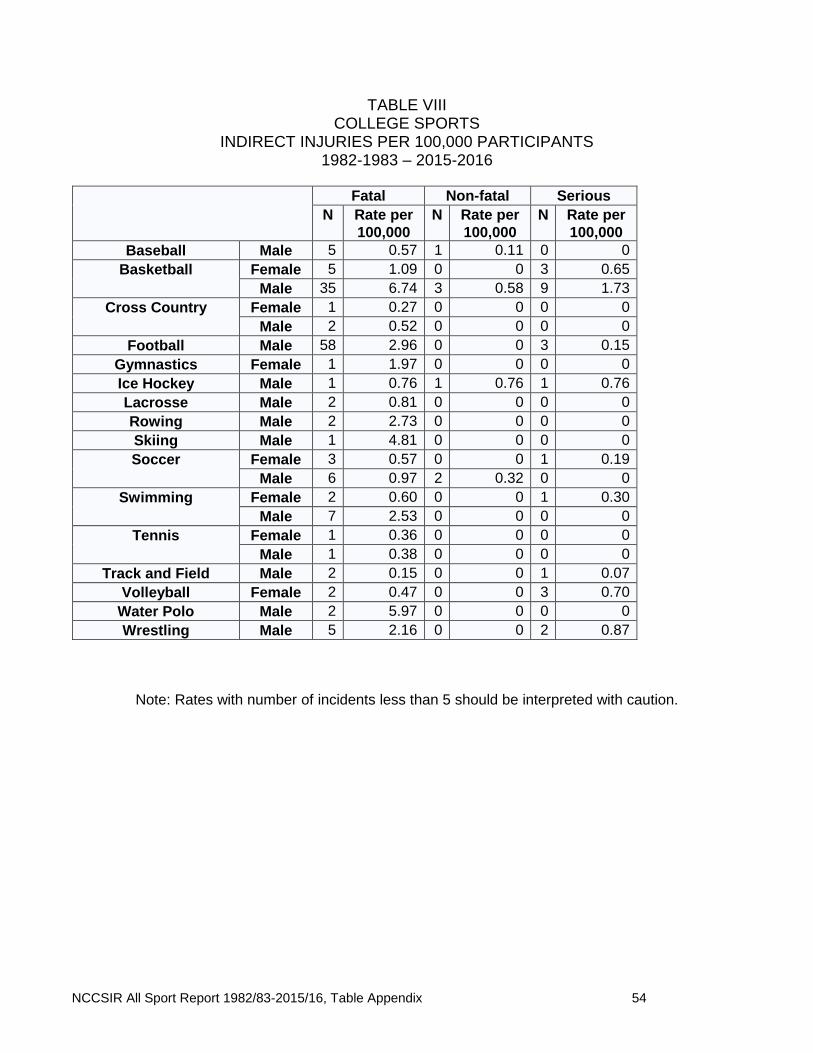
TABLE VIII COLLEGE SPORTS
INDIRECT INJURIES PER 100,000 PARTICIPANTS 1982-1983 – 2015-2016
Fatal Non-fatal Serious
N Rate per
100,000
N Rate per
100,000
N Rate per
100,000
Baseball Male 5 0.57 1 0.11 0 0
Basketball Female 5 1.09 0 0 3 0.65
Male 35 6.74 3 0.58 9 1.73
Cross Country Female 1 0.27 0 0 0 0
Male 2 0.52 0 0 0 0
Football Male 58 2.96 0 0 3 0.15
Gymnastics Female 1 1.97 0 0 0 0
Ice Hockey Male 1 0.76 1 0.76 1 0.76
Lacrosse Male 2 0.81 0 0 0 0
Rowing Male 2 2.73 0 0 0 0
Skiing Male 1 4.81 0 0 0 0
Soccer Female 3 0.57 0 0 1 0.19
Male 6 0.97 2 0.32 0 0
Swimming Female 2 0.60 0 0 1 0.30
Male 7 2.53 0 0 0 0
Tennis Female 1 0.36 0 0 0 0
Male 1 0.38 0 0 0 0
Track and Field Male 2 0.15 0 0 1 0.07
Volleyball Female 2 0.47 0 0 3 0.70
Water Polo Male 2 5.97 0 0 0 0
Wrestling Male 5 2.16 0 0 2 0.87
Note: Rates with number of incidents less than 5 should be interpreted with caution.
NCCSIR All Sport Report 1982/83-2015/16, Table Appendix 55
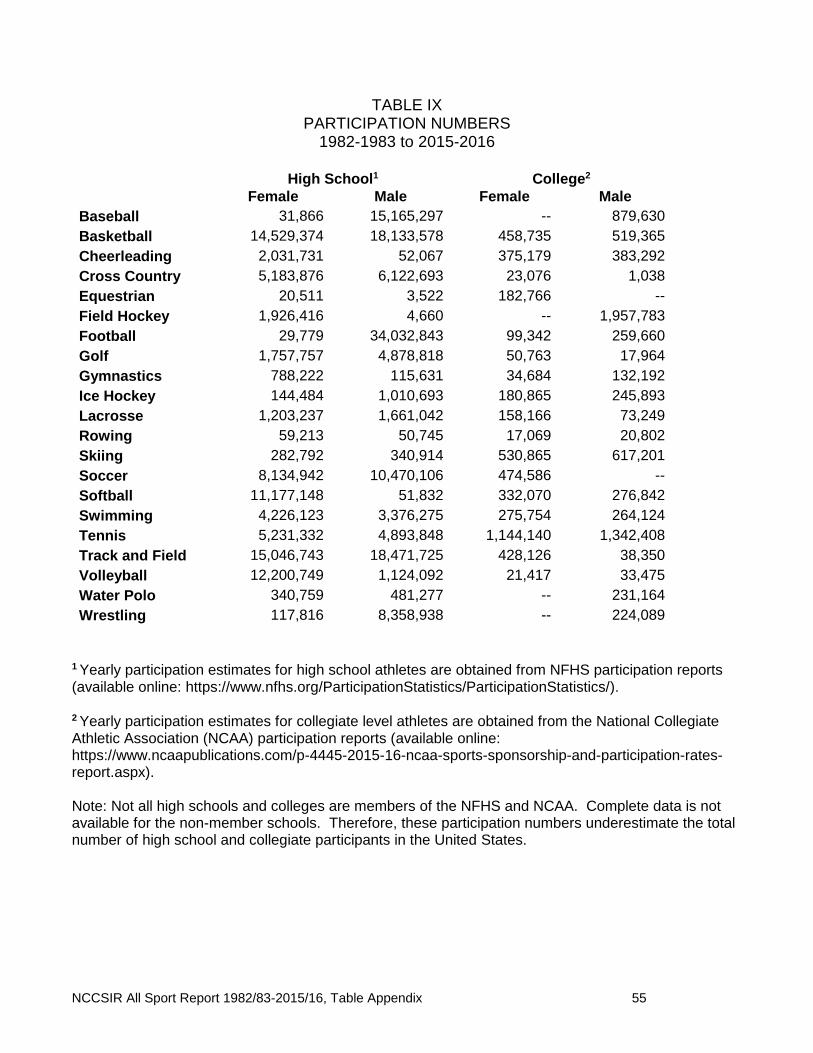
TABLE IX PARTICIPATION NUMBERS
1982-1983 to 2015-2016
High School1 College2
Female Male Female Male
Baseball 31,866 15,165,297 -- 879,630
Basketball 14,529,374 18,133,578 458,735 519,365
Cheerleading 2,031,731 52,067 375,179 383,292
Cross Country 5,183,876 6,122,693 23,076 1,038
Equestrian 20,511 3,522 182,766 --
Field Hockey 1,926,416 4,660 -- 1,957,783
Football 29,779 34,032,843 99,342 259,660
Golf 1,757,757 4,878,818 50,763 17,964
Gymnastics 788,222 115,631 34,684 132,192
Ice Hockey 144,484 1,010,693 180,865 245,893
Lacrosse 1,203,237 1,661,042 158,166 73,249
Rowing 59,213 50,745 17,069 20,802
Skiing 282,792 340,914 530,865 617,201
Soccer 8,134,942 10,470,106 474,586 --
Softball 11,177,148 51,832 332,070 276,842
Swimming 4,226,123 3,376,275 275,754 264,124
Tennis 5,231,332 4,893,848 1,144,140 1,342,408
Track and Field 15,046,743 18,471,725 428,126 38,350
Volleyball 12,200,749 1,124,092 21,417 33,475
Water Polo 340,759 481,277 -- 231,164
Wrestling 117,816 8,358,938 -- 224,089
1 Yearly participation estimates for high school athletes are obtained from NFHS participation reports (available online: https://www.nfhs.org/ParticipationStatistics/ParticipationStatistics/). 2 Yearly participation estimates for collegiate level athletes are obtained from the National Collegiate Athletic Association (NCAA) participation reports (available online: https://www.ncaapublications.com/p-4445-2015-16-ncaa-sports-sponsorship-and-participation-rates-report.aspx). Note: Not all high schools and colleges are members of the NFHS and NCAA. Complete data is not available for the non-member schools. Therefore, these participation numbers underestimate the total number of high school and collegiate participants in the United States.