Embed Size (px)
Citation preview
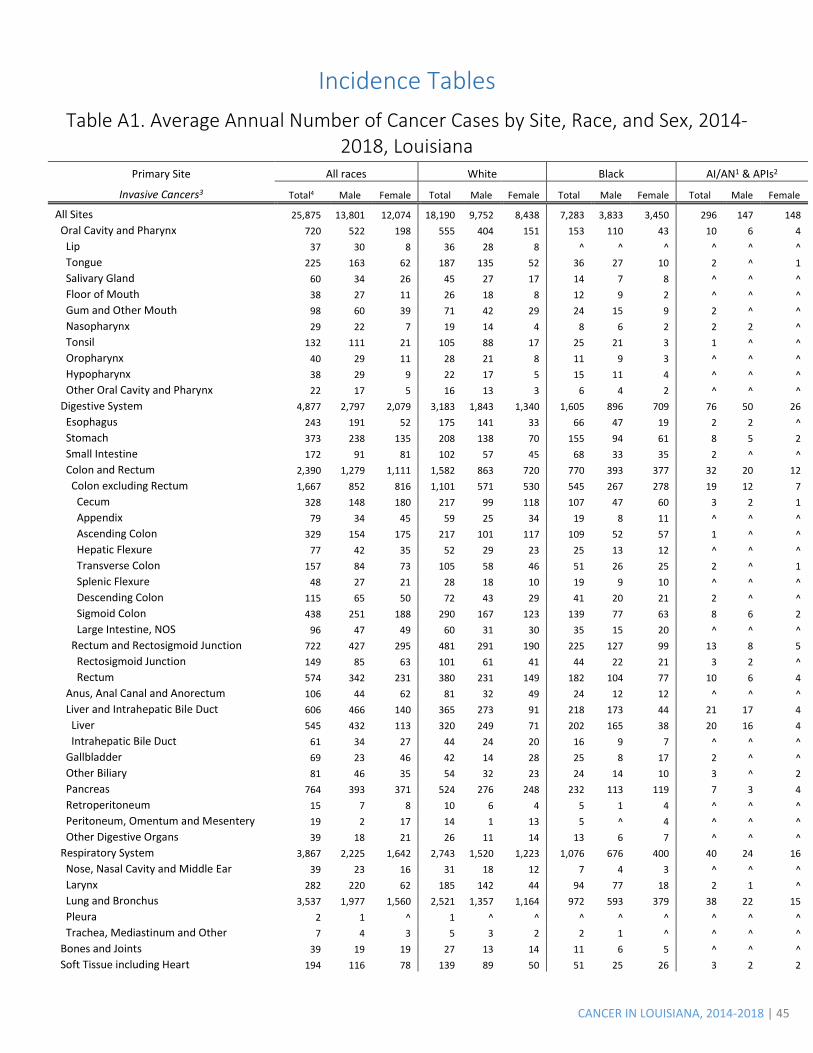
CANCER IN LOUISIANA, 2014-2018 | 45
Incidence Tables
Table A1. Average Annual Number of Cancer Cases by Site, Race, and Sex, 2014-2018, Louisiana
Primary Site All races White Black AI/AN1 & APIs2
Invasive Cancers3 Total4 Male Female Total Male Female Total Male Female Total Male Female
All Sites 25,875 13,801 12,074 18,190 9,752 8,438 7,283 3,833 3,450 296 147 148 Oral Cavity and Pharynx 720 522 198 555 404 151 153 110 43 10 6 4 Lip 37 30 8 36 28 8 ^ ^ ^ ^ ^ ^ Tongue 225 163 62 187 135 52 36 27 10 2 ^ 1 Salivary Gland 60 34 26 45 27 17 14 7 8 ^ ^ ^ Floor of Mouth 38 27 11 26 18 8 12 9 2 ^ ^ ^ Gum and Other Mouth 98 60 39 71 42 29 24 15 9 2 ^ ^ Nasopharynx 29 22 7 19 14 4 8 6 2 2 2 ^ Tonsil 132 111 21 105 88 17 25 21 3 1 ^ ^ Oropharynx 40 29 11 28 21 8 11 9 3 ^ ^ ^ Hypopharynx 38 29 9 22 17 5 15 11 4 ^ ^ ^ Other Oral Cavity and Pharynx 22 17 5 16 13 3 6 4 2 ^ ^ ^ Digestive System 4,877 2,797 2,079 3,183 1,843 1,340 1,605 896 709 76 50 26 Esophagus 243 191 52 175 141 33 66 47 19 2 2 ^ Stomach 373 238 135 208 138 70 155 94 61 8 5 2 Small Intestine 172 91 81 102 57 45 68 33 35 2 ^ ^ Colon and Rectum 2,390 1,279 1,111 1,582 863 720 770 393 377 32 20 12 Colon excluding Rectum 1,667 852 816 1,101 571 530 545 267 278 19 12 7 Cecum 328 148 180 217 99 118 107 47 60 3 2 1 Appendix 79 34 45 59 25 34 19 8 11 ^ ^ ^ Ascending Colon 329 154 175 217 101 117 109 52 57 1 ^ ^ Hepatic Flexure 77 42 35 52 29 23 25 13 12 ^ ^ ^ Transverse Colon 157 84 73 105 58 46 51 26 25 2 ^ 1 Splenic Flexure 48 27 21 28 18 10 19 9 10 ^ ^ ^ Descending Colon 115 65 50 72 43 29 41 20 21 2 ^ ^ Sigmoid Colon 438 251 188 290 167 123 139 77 63 8 6 2 Large Intestine, NOS 96 47 49 60 31 30 35 15 20 ^ ^ ^ Rectum and Rectosigmoid Junction 722 427 295 481 291 190 225 127 99 13 8 5 Rectosigmoid Junction 149 85 63 101 61 41 44 22 21 3 2 ^ Rectum 574 342 231 380 231 149 182 104 77 10 6 4 Anus, Anal Canal and Anorectum 106 44 62 81 32 49 24 12 12 ^ ^ ^ Liver and Intrahepatic Bile Duct 606 466 140 365 273 91 218 173 44 21 17 4 Liver 545 432 113 320 249 71 202 165 38 20 16 4 Intrahepatic Bile Duct 61 34 27 44 24 20 16 9 7 ^ ^ ^ Gallbladder 69 23 46 42 14 28 25 8 17 2 ^ ^ Other Biliary 81 46 35 54 32 23 24 14 10 3 ^ 2 Pancreas 764 393 371 524 276 248 232 113 119 7 3 4 Retroperitoneum 15 7 8 10 6 4 5 1 4 ^ ^ ^ Peritoneum, Omentum and Mesentery 19 2 17 14 1 13 5 ^ 4 ^ ^ ^ Other Digestive Organs 39 18 21 26 11 14 13 6 7 ^ ^ ^ Respiratory System 3,867 2,225 1,642 2,743 1,520 1,223 1,076 676 400 40 24 16 Nose, Nasal Cavity and Middle Ear 39 23 16 31 18 12 7 4 3 ^ ^ ^ Larynx 282 220 62 185 142 44 94 77 18 2 1 ^ Lung and Bronchus 3,537 1,977 1,560 2,521 1,357 1,164 972 593 379 38 22 15 Pleura 2 1 ^ 1 ^ ^ ^ ^ ^ ^ ^ ^ Trachea, Mediastinum and Other 7 4 3 5 3 2 2 1 ^ ^ ^ ^ Bones and Joints 39 19 19 27 13 14 11 6 5 ^ ^ ^ Soft Tissue including Heart 194 116 78 139 89 50 51 25 26 3 2 2
CANCER IN LOUISIANA, 2014-2018 | 46
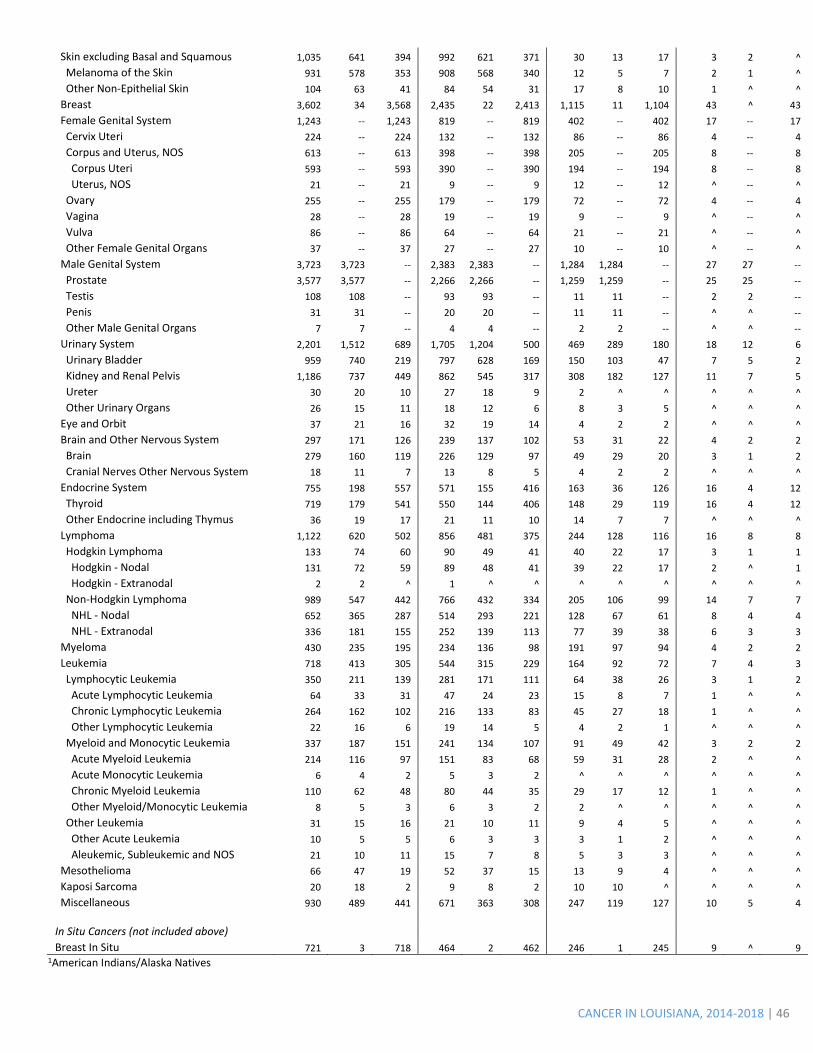
Skin excluding Basal and Squamous 1,035 641 394 992 621 371 30 13 17 3 2 ^ Melanoma of the Skin 931 578 353 908 568 340 12 5 7 2 1 ^ Other Non-Epithelial Skin 104 63 41 84 54 31 17 8 10 1 ^ ^ Breast 3,602 34 3,568 2,435 22 2,413 1,115 11 1,104 43 ^ 43 Female Genital System 1,243 -- 1,243 819 -- 819 402 -- 402 17 -- 17 Cervix Uteri 224 -- 224 132 -- 132 86 -- 86 4 -- 4 Corpus and Uterus, NOS 613 -- 613 398 -- 398 205 -- 205 8 -- 8 Corpus Uteri 593 -- 593 390 -- 390 194 -- 194 8 -- 8 Uterus, NOS 21 -- 21 9 -- 9 12 -- 12 ^ -- ^ Ovary 255 -- 255 179 -- 179 72 -- 72 4 -- 4 Vagina 28 -- 28 19 -- 19 9 -- 9 ^ -- ^ Vulva 86 -- 86 64 -- 64 21 -- 21 ^ -- ^ Other Female Genital Organs 37 -- 37 27 -- 27 10 -- 10 ^ -- ^ Male Genital System 3,723 3,723 -- 2,383 2,383 -- 1,284 1,284 -- 27 27 -- Prostate 3,577 3,577 -- 2,266 2,266 -- 1,259 1,259 -- 25 25 -- Testis 108 108 -- 93 93 -- 11 11 -- 2 2 -- Penis 31 31 -- 20 20 -- 11 11 -- ^ ^ -- Other Male Genital Organs 7 7 -- 4 4 -- 2 2 -- ^ ^ -- Urinary System 2,201 1,512 689 1,705 1,204 500 469 289 180 18 12 6 Urinary Bladder 959 740 219 797 628 169 150 103 47 7 5 2 Kidney and Renal Pelvis 1,186 737 449 862 545 317 308 182 127 11 7 5 Ureter 30 20 10 27 18 9 2 ^ ^ ^ ^ ^ Other Urinary Organs 26 15 11 18 12 6 8 3 5 ^ ^ ^ Eye and Orbit 37 21 16 32 19 14 4 2 2 ^ ^ ^ Brain and Other Nervous System 297 171 126 239 137 102 53 31 22 4 2 2 Brain 279 160 119 226 129 97 49 29 20 3 1 2 Cranial Nerves Other Nervous System 18 11 7 13 8 5 4 2 2 ^ ^ ^ Endocrine System 755 198 557 571 155 416 163 36 126 16 4 12 Thyroid 719 179 541 550 144 406 148 29 119 16 4 12 Other Endocrine including Thymus 36 19 17 21 11 10 14 7 7 ^ ^ ^ Lymphoma 1,122 620 502 856 481 375 244 128 116 16 8 8 Hodgkin Lymphoma 133 74 60 90 49 41 40 22 17 3 1 1 Hodgkin - Nodal 131 72 59 89 48 41 39 22 17 2 ^ 1 Hodgkin - Extranodal 2 2 ^ 1 ^ ^ ^ ^ ^ ^ ^ ^ Non-Hodgkin Lymphoma 989 547 442 766 432 334 205 106 99 14 7 7 NHL - Nodal 652 365 287 514 293 221 128 67 61 8 4 4 NHL - Extranodal 336 181 155 252 139 113 77 39 38 6 3 3 Myeloma 430 235 195 234 136 98 191 97 94 4 2 2 Leukemia 718 413 305 544 315 229 164 92 72 7 4 3 Lymphocytic Leukemia 350 211 139 281 171 111 64 38 26 3 1 2 Acute Lymphocytic Leukemia 64 33 31 47 24 23 15 8 7 1 ^ ^ Chronic Lymphocytic Leukemia 264 162 102 216 133 83 45 27 18 1 ^ ^ Other Lymphocytic Leukemia 22 16 6 19 14 5 4 2 1 ^ ^ ^ Myeloid and Monocytic Leukemia 337 187 151 241 134 107 91 49 42 3 2 2 Acute Myeloid Leukemia 214 116 97 151 83 68 59 31 28 2 ^ ^ Acute Monocytic Leukemia 6 4 2 5 3 2 ^ ^ ^ ^ ^ ^ Chronic Myeloid Leukemia 110 62 48 80 44 35 29 17 12 1 ^ ^ Other Myeloid/Monocytic Leukemia 8 5 3 6 3 2 2 ^ ^ ^ ^ ^ Other Leukemia 31 15 16 21 10 11 9 4 5 ^ ^ ^ Other Acute Leukemia 10 5 5 6 3 3 3 1 2 ^ ^ ^ Aleukemic, Subleukemic and NOS 21 10 11 15 7 8 5 3 3 ^ ^ ^ Mesothelioma 66 47 19 52 37 15 13 9 4 ^ ^ ^ Kaposi Sarcoma 20 18 2 9 8 2 10 10 ^ ^ ^ ^ Miscellaneous 930 489 441 671 363 308 247 119 127 10 5 4
In Situ Cancers (not included above) Breast In Situ 721 3 718 464 2 462 246 1 245 9 ^ 9
1American Indians/Alaska Natives
CANCER IN LOUISIANA, 2014-2018 | 47
2Asians and Pacific Islanders 3Except for urinary bladder (in situ and invasive), only invasive cases are included. 4The total case count for each cancer site may not have the same number as the sum of male and female due to rounding. ^ Count is not displayed due to fewer than 6 cases during the five-year period. --Not applicable
CANCER IN LOUISIANA, 2014-2018 | 48
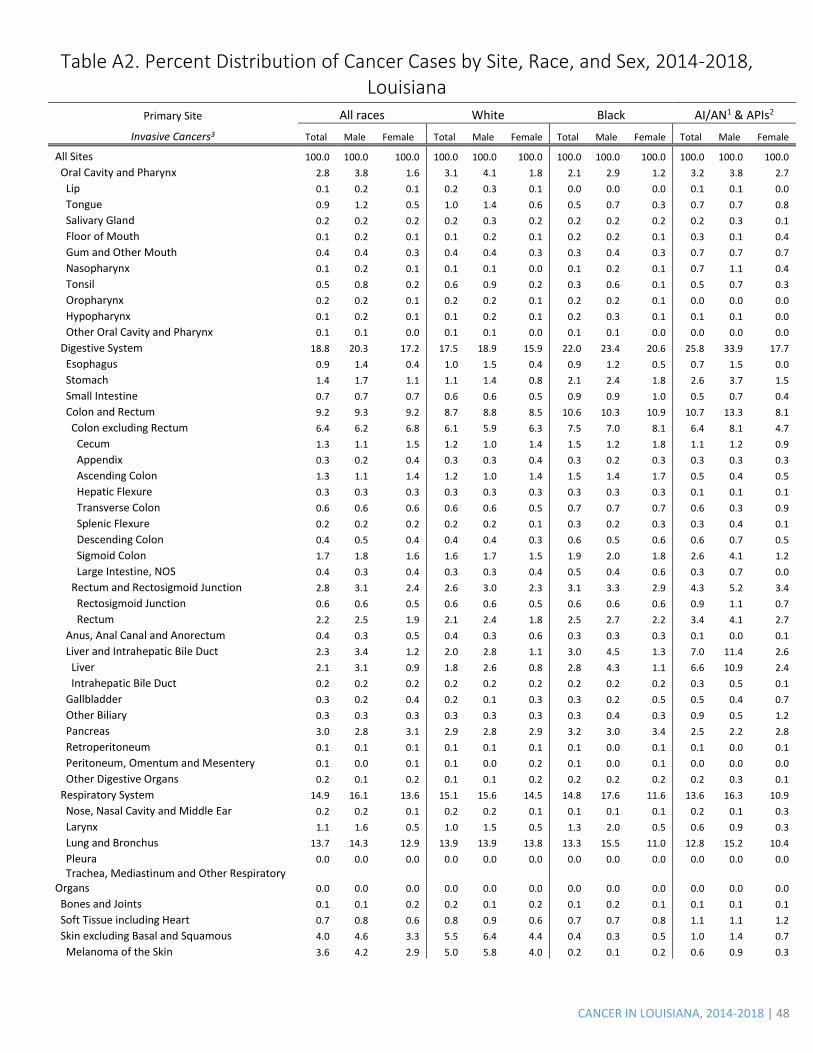
Table A2. Percent Distribution of Cancer Cases by Site, Race, and Sex, 2014-2018, Louisiana
Primary Site All races White Black AI/AN1 & APIs2
Invasive Cancers3 Total Male Female Total Male Female Total Male Female Total Male Female
All Sites 100.0 100.0 100.0 100.0 100.0 100.0 100.0 100.0 100.0 100.0 100.0 100.0 Oral Cavity and Pharynx 2.8 3.8 1.6 3.1 4.1 1.8 2.1 2.9 1.2 3.2 3.8 2.7 Lip 0.1 0.2 0.1 0.2 0.3 0.1 0.0 0.0 0.0 0.1 0.1 0.0 Tongue 0.9 1.2 0.5 1.0 1.4 0.6 0.5 0.7 0.3 0.7 0.7 0.8 Salivary Gland 0.2 0.2 0.2 0.2 0.3 0.2 0.2 0.2 0.2 0.2 0.3 0.1 Floor of Mouth 0.1 0.2 0.1 0.1 0.2 0.1 0.2 0.2 0.1 0.3 0.1 0.4 Gum and Other Mouth 0.4 0.4 0.3 0.4 0.4 0.3 0.3 0.4 0.3 0.7 0.7 0.7 Nasopharynx 0.1 0.2 0.1 0.1 0.1 0.0 0.1 0.2 0.1 0.7 1.1 0.4 Tonsil 0.5 0.8 0.2 0.6 0.9 0.2 0.3 0.6 0.1 0.5 0.7 0.3 Oropharynx 0.2 0.2 0.1 0.2 0.2 0.1 0.2 0.2 0.1 0.0 0.0 0.0 Hypopharynx 0.1 0.2 0.1 0.1 0.2 0.1 0.2 0.3 0.1 0.1 0.1 0.0 Other Oral Cavity and Pharynx 0.1 0.1 0.0 0.1 0.1 0.0 0.1 0.1 0.0 0.0 0.0 0.0 Digestive System 18.8 20.3 17.2 17.5 18.9 15.9 22.0 23.4 20.6 25.8 33.9 17.7 Esophagus 0.9 1.4 0.4 1.0 1.5 0.4 0.9 1.2 0.5 0.7 1.5 0.0 Stomach 1.4 1.7 1.1 1.1 1.4 0.8 2.1 2.4 1.8 2.6 3.7 1.5 Small Intestine 0.7 0.7 0.7 0.6 0.6 0.5 0.9 0.9 1.0 0.5 0.7 0.4 Colon and Rectum 9.2 9.3 9.2 8.7 8.8 8.5 10.6 10.3 10.9 10.7 13.3 8.1 Colon excluding Rectum 6.4 6.2 6.8 6.1 5.9 6.3 7.5 7.0 8.1 6.4 8.1 4.7 Cecum 1.3 1.1 1.5 1.2 1.0 1.4 1.5 1.2 1.8 1.1 1.2 0.9 Appendix 0.3 0.2 0.4 0.3 0.3 0.4 0.3 0.2 0.3 0.3 0.3 0.3 Ascending Colon 1.3 1.1 1.4 1.2 1.0 1.4 1.5 1.4 1.7 0.5 0.4 0.5 Hepatic Flexure 0.3 0.3 0.3 0.3 0.3 0.3 0.3 0.3 0.3 0.1 0.1 0.1 Transverse Colon 0.6 0.6 0.6 0.6 0.6 0.5 0.7 0.7 0.7 0.6 0.3 0.9 Splenic Flexure 0.2 0.2 0.2 0.2 0.2 0.1 0.3 0.2 0.3 0.3 0.4 0.1 Descending Colon 0.4 0.5 0.4 0.4 0.4 0.3 0.6 0.5 0.6 0.6 0.7 0.5 Sigmoid Colon 1.7 1.8 1.6 1.6 1.7 1.5 1.9 2.0 1.8 2.6 4.1 1.2 Large Intestine, NOS 0.4 0.3 0.4 0.3 0.3 0.4 0.5 0.4 0.6 0.3 0.7 0.0 Rectum and Rectosigmoid Junction 2.8 3.1 2.4 2.6 3.0 2.3 3.1 3.3 2.9 4.3 5.2 3.4 Rectosigmoid Junction 0.6 0.6 0.5 0.6 0.6 0.5 0.6 0.6 0.6 0.9 1.1 0.7 Rectum 2.2 2.5 1.9 2.1 2.4 1.8 2.5 2.7 2.2 3.4 4.1 2.7 Anus, Anal Canal and Anorectum 0.4 0.3 0.5 0.4 0.3 0.6 0.3 0.3 0.3 0.1 0.0 0.1 Liver and Intrahepatic Bile Duct 2.3 3.4 1.2 2.0 2.8 1.1 3.0 4.5 1.3 7.0 11.4 2.6 Liver 2.1 3.1 0.9 1.8 2.6 0.8 2.8 4.3 1.1 6.6 10.9 2.4 Intrahepatic Bile Duct 0.2 0.2 0.2 0.2 0.2 0.2 0.2 0.2 0.2 0.3 0.5 0.1 Gallbladder 0.3 0.2 0.4 0.2 0.1 0.3 0.3 0.2 0.5 0.5 0.4 0.7 Other Biliary 0.3 0.3 0.3 0.3 0.3 0.3 0.3 0.4 0.3 0.9 0.5 1.2 Pancreas 3.0 2.8 3.1 2.9 2.8 2.9 3.2 3.0 3.4 2.5 2.2 2.8 Retroperitoneum 0.1 0.1 0.1 0.1 0.1 0.1 0.1 0.0 0.1 0.1 0.0 0.1 Peritoneum, Omentum and Mesentery 0.1 0.0 0.1 0.1 0.0 0.2 0.1 0.0 0.1 0.0 0.0 0.0 Other Digestive Organs 0.2 0.1 0.2 0.1 0.1 0.2 0.2 0.2 0.2 0.2 0.3 0.1 Respiratory System 14.9 16.1 13.6 15.1 15.6 14.5 14.8 17.6 11.6 13.6 16.3 10.9 Nose, Nasal Cavity and Middle Ear 0.2 0.2 0.1 0.2 0.2 0.1 0.1 0.1 0.1 0.2 0.1 0.3 Larynx 1.1 1.6 0.5 1.0 1.5 0.5 1.3 2.0 0.5 0.6 0.9 0.3 Lung and Bronchus 13.7 14.3 12.9 13.9 13.9 13.8 13.3 15.5 11.0 12.8 15.2 10.4 Pleura 0.0 0.0 0.0 0.0 0.0 0.0 0.0 0.0 0.0 0.0 0.0 0.0 Trachea, Mediastinum and Other Respiratory Organs 0.0 0.0 0.0 0.0 0.0 0.0 0.0 0.0 0.0 0.0 0.0 0.0 Bones and Joints 0.1 0.1 0.2 0.2 0.1 0.2 0.1 0.2 0.1 0.1 0.1 0.1 Soft Tissue including Heart 0.7 0.8 0.6 0.8 0.9 0.6 0.7 0.7 0.8 1.1 1.1 1.2 Skin excluding Basal and Squamous 4.0 4.6 3.3 5.5 6.4 4.4 0.4 0.3 0.5 1.0 1.4 0.7 Melanoma of the Skin 3.6 4.2 2.9 5.0 5.8 4.0 0.2 0.1 0.2 0.6 0.9 0.3
CANCER IN LOUISIANA, 2014-2018 | 49
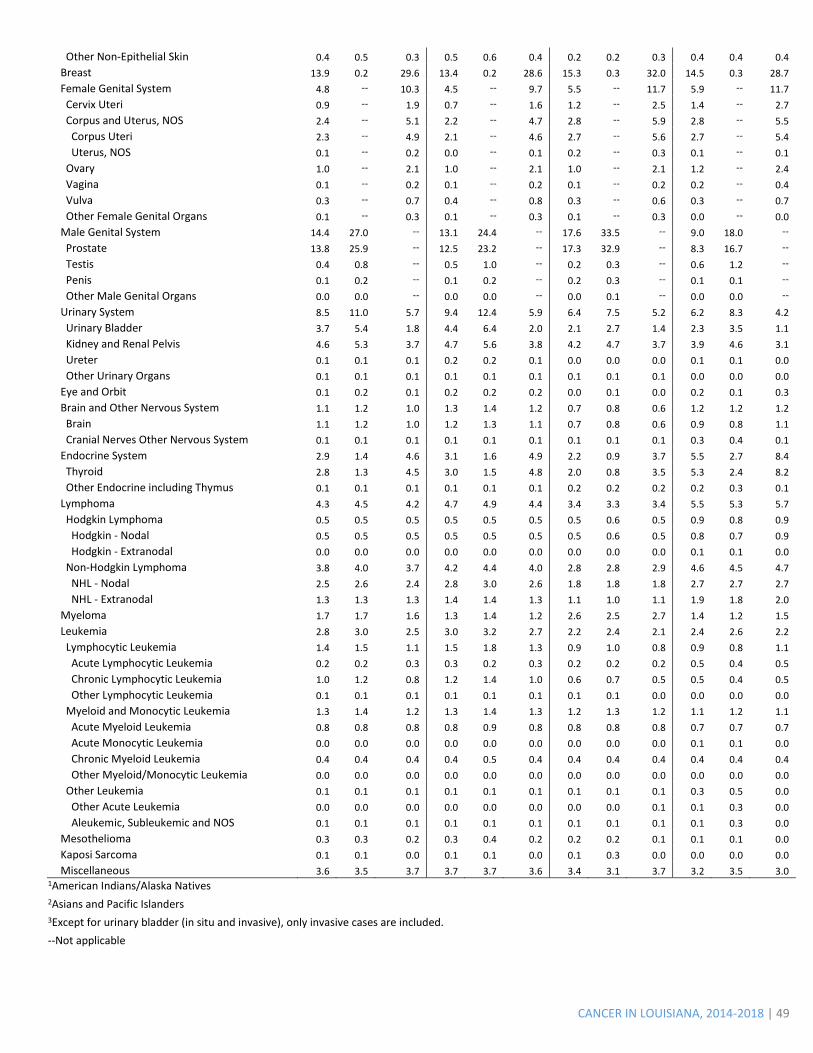
Other Non-Epithelial Skin 0.4 0.5 0.3 0.5 0.6 0.4 0.2 0.2 0.3 0.4 0.4 0.4 Breast 13.9 0.2 29.6 13.4 0.2 28.6 15.3 0.3 32.0 14.5 0.3 28.7 Female Genital System 4.8 -- 10.3 4.5 -- 9.7 5.5 -- 11.7 5.9 -- 11.7 Cervix Uteri 0.9 -- 1.9 0.7 -- 1.6 1.2 -- 2.5 1.4 -- 2.7 Corpus and Uterus, NOS 2.4 -- 5.1 2.2 -- 4.7 2.8 -- 5.9 2.8 -- 5.5 Corpus Uteri 2.3 -- 4.9 2.1 -- 4.6 2.7 -- 5.6 2.7 -- 5.4 Uterus, NOS 0.1 -- 0.2 0.0 -- 0.1 0.2 -- 0.3 0.1 -- 0.1 Ovary 1.0 -- 2.1 1.0 -- 2.1 1.0 -- 2.1 1.2 -- 2.4 Vagina 0.1 -- 0.2 0.1 -- 0.2 0.1 -- 0.2 0.2 -- 0.4 Vulva 0.3 -- 0.7 0.4 -- 0.8 0.3 -- 0.6 0.3 -- 0.7 Other Female Genital Organs 0.1 -- 0.3 0.1 -- 0.3 0.1 -- 0.3 0.0 -- 0.0 Male Genital System 14.4 27.0 -- 13.1 24.4 -- 17.6 33.5 -- 9.0 18.0 --
Prostate 13.8 25.9 -- 12.5 23.2 -- 17.3 32.9 -- 8.3 16.7 --
Testis 0.4 0.8 -- 0.5 1.0 -- 0.2 0.3 -- 0.6 1.2 --
Penis 0.1 0.2 -- 0.1 0.2 -- 0.2 0.3 -- 0.1 0.1 --
Other Male Genital Organs 0.0 0.0 -- 0.0 0.0 -- 0.0 0.1 -- 0.0 0.0 --
Urinary System 8.5 11.0 5.7 9.4 12.4 5.9 6.4 7.5 5.2 6.2 8.3 4.2 Urinary Bladder 3.7 5.4 1.8 4.4 6.4 2.0 2.1 2.7 1.4 2.3 3.5 1.1 Kidney and Renal Pelvis 4.6 5.3 3.7 4.7 5.6 3.8 4.2 4.7 3.7 3.9 4.6 3.1 Ureter 0.1 0.1 0.1 0.2 0.2 0.1 0.0 0.0 0.0 0.1 0.1 0.0 Other Urinary Organs 0.1 0.1 0.1 0.1 0.1 0.1 0.1 0.1 0.1 0.0 0.0 0.0 Eye and Orbit 0.1 0.2 0.1 0.2 0.2 0.2 0.0 0.1 0.0 0.2 0.1 0.3 Brain and Other Nervous System 1.1 1.2 1.0 1.3 1.4 1.2 0.7 0.8 0.6 1.2 1.2 1.2 Brain 1.1 1.2 1.0 1.2 1.3 1.1 0.7 0.8 0.6 0.9 0.8 1.1 Cranial Nerves Other Nervous System 0.1 0.1 0.1 0.1 0.1 0.1 0.1 0.1 0.1 0.3 0.4 0.1 Endocrine System 2.9 1.4 4.6 3.1 1.6 4.9 2.2 0.9 3.7 5.5 2.7 8.4 Thyroid 2.8 1.3 4.5 3.0 1.5 4.8 2.0 0.8 3.5 5.3 2.4 8.2 Other Endocrine including Thymus 0.1 0.1 0.1 0.1 0.1 0.1 0.2 0.2 0.2 0.2 0.3 0.1 Lymphoma 4.3 4.5 4.2 4.7 4.9 4.4 3.4 3.3 3.4 5.5 5.3 5.7 Hodgkin Lymphoma 0.5 0.5 0.5 0.5 0.5 0.5 0.5 0.6 0.5 0.9 0.8 0.9 Hodgkin - Nodal 0.5 0.5 0.5 0.5 0.5 0.5 0.5 0.6 0.5 0.8 0.7 0.9 Hodgkin - Extranodal 0.0 0.0 0.0 0.0 0.0 0.0 0.0 0.0 0.0 0.1 0.1 0.0 Non-Hodgkin Lymphoma 3.8 4.0 3.7 4.2 4.4 4.0 2.8 2.8 2.9 4.6 4.5 4.7 NHL - Nodal 2.5 2.6 2.4 2.8 3.0 2.6 1.8 1.8 1.8 2.7 2.7 2.7 NHL - Extranodal 1.3 1.3 1.3 1.4 1.4 1.3 1.1 1.0 1.1 1.9 1.8 2.0 Myeloma 1.7 1.7 1.6 1.3 1.4 1.2 2.6 2.5 2.7 1.4 1.2 1.5 Leukemia 2.8 3.0 2.5 3.0 3.2 2.7 2.2 2.4 2.1 2.4 2.6 2.2 Lymphocytic Leukemia 1.4 1.5 1.1 1.5 1.8 1.3 0.9 1.0 0.8 0.9 0.8 1.1 Acute Lymphocytic Leukemia 0.2 0.2 0.3 0.3 0.2 0.3 0.2 0.2 0.2 0.5 0.4 0.5 Chronic Lymphocytic Leukemia 1.0 1.2 0.8 1.2 1.4 1.0 0.6 0.7 0.5 0.5 0.4 0.5 Other Lymphocytic Leukemia 0.1 0.1 0.1 0.1 0.1 0.1 0.1 0.1 0.0 0.0 0.0 0.0 Myeloid and Monocytic Leukemia 1.3 1.4 1.2 1.3 1.4 1.3 1.2 1.3 1.2 1.1 1.2 1.1 Acute Myeloid Leukemia 0.8 0.8 0.8 0.8 0.9 0.8 0.8 0.8 0.8 0.7 0.7 0.7 Acute Monocytic Leukemia 0.0 0.0 0.0 0.0 0.0 0.0 0.0 0.0 0.0 0.1 0.1 0.0 Chronic Myeloid Leukemia 0.4 0.4 0.4 0.4 0.5 0.4 0.4 0.4 0.4 0.4 0.4 0.4 Other Myeloid/Monocytic Leukemia 0.0 0.0 0.0 0.0 0.0 0.0 0.0 0.0 0.0 0.0 0.0 0.0 Other Leukemia 0.1 0.1 0.1 0.1 0.1 0.1 0.1 0.1 0.1 0.3 0.5 0.0 Other Acute Leukemia 0.0 0.0 0.0 0.0 0.0 0.0 0.0 0.0 0.1 0.1 0.3 0.0 Aleukemic, Subleukemic and NOS 0.1 0.1 0.1 0.1 0.1 0.1 0.1 0.1 0.1 0.1 0.3 0.0 Mesothelioma 0.3 0.3 0.2 0.3 0.4 0.2 0.2 0.2 0.1 0.1 0.1 0.0 Kaposi Sarcoma 0.1 0.1 0.0 0.1 0.1 0.0 0.1 0.3 0.0 0.0 0.0 0.0 Miscellaneous 3.6 3.5 3.7 3.7 3.7 3.6 3.4 3.1 3.7 3.2 3.5 3.0
1American Indians/Alaska Natives 2Asians and Pacific Islanders 3Except for urinary bladder (in situ and invasive), only invasive cases are included. --Not applicable
CANCER IN LOUISIANA, 2014-2018 | 50
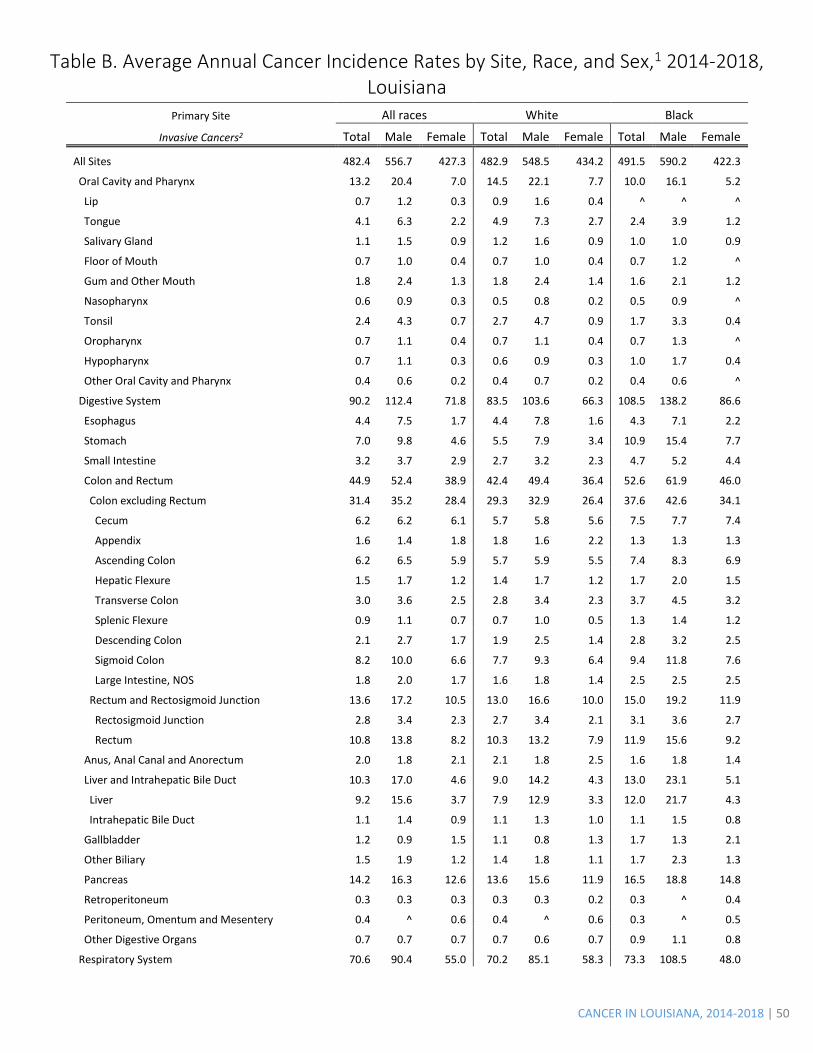
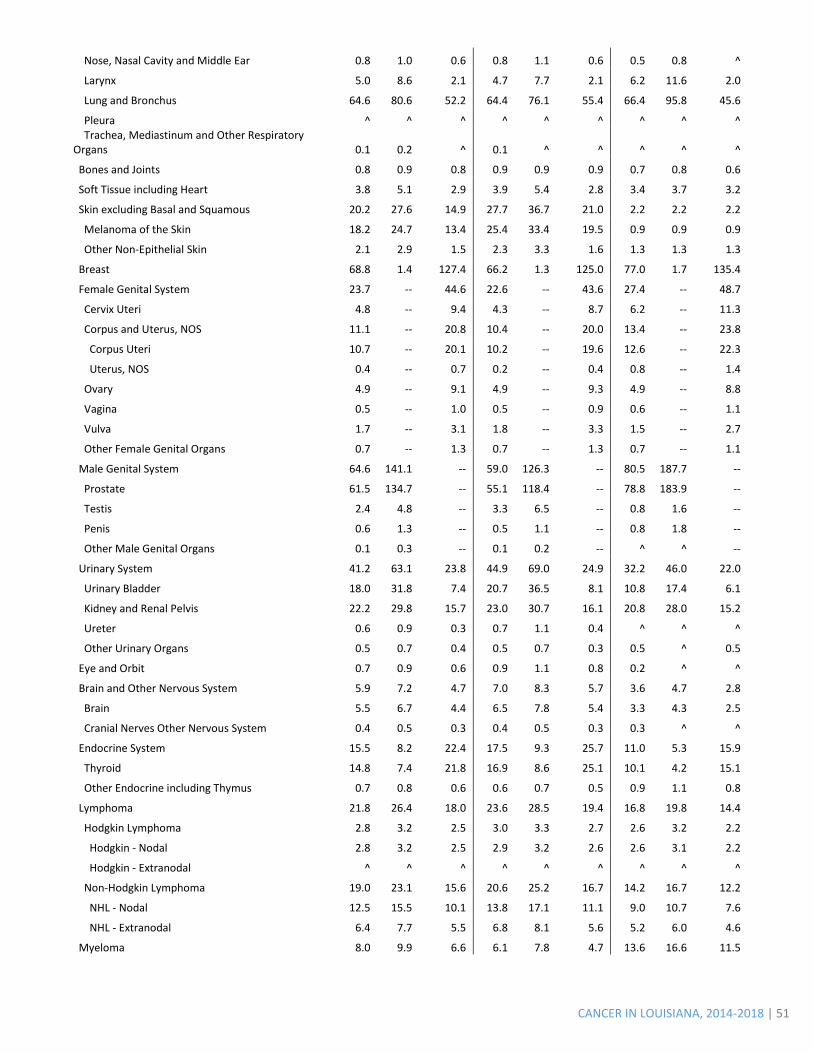
Table B. Average Annual Cancer Incidence Rates by Site, Race, and Sex,1 2014-2018, Louisiana
Primary Site All races White Black
Invasive Cancers2 Total Male Female Total Male Female Total Male Female
All Sites 482.4 556.7 427.3 482.9 548.5 434.2 491.5 590.2 422.3
Oral Cavity and Pharynx 13.2 20.4 7.0 14.5 22.1 7.7 10.0 16.1 5.2
Lip 0.7 1.2 0.3 0.9 1.6 0.4 ^ ^ ^
Tongue 4.1 6.3 2.2 4.9 7.3 2.7 2.4 3.9 1.2
Salivary Gland 1.1 1.5 0.9 1.2 1.6 0.9 1.0 1.0 0.9
Floor of Mouth 0.7 1.0 0.4 0.7 1.0 0.4 0.7 1.2 ^
Gum and Other Mouth 1.8 2.4 1.3 1.8 2.4 1.4 1.6 2.1 1.2
Nasopharynx 0.6 0.9 0.3 0.5 0.8 0.2 0.5 0.9 ^
Tonsil 2.4 4.3 0.7 2.7 4.7 0.9 1.7 3.3 0.4
Oropharynx 0.7 1.1 0.4 0.7 1.1 0.4 0.7 1.3 ^
Hypopharynx 0.7 1.1 0.3 0.6 0.9 0.3 1.0 1.7 0.4
Other Oral Cavity and Pharynx 0.4 0.6 0.2 0.4 0.7 0.2 0.4 0.6 ^
Digestive System 90.2 112.4 71.8 83.5 103.6 66.3 108.5 138.2 86.6
Esophagus 4.4 7.5 1.7 4.4 7.8 1.6 4.3 7.1 2.2
Stomach 7.0 9.8 4.6 5.5 7.9 3.4 10.9 15.4 7.7
Small Intestine 3.2 3.7 2.9 2.7 3.2 2.3 4.7 5.2 4.4
Colon and Rectum 44.9 52.4 38.9 42.4 49.4 36.4 52.6 61.9 46.0
Colon excluding Rectum 31.4 35.2 28.4 29.3 32.9 26.4 37.6 42.6 34.1
Cecum 6.2 6.2 6.1 5.7 5.8 5.6 7.5 7.7 7.4
Appendix 1.6 1.4 1.8 1.8 1.6 2.2 1.3 1.3 1.3
Ascending Colon 6.2 6.5 5.9 5.7 5.9 5.5 7.4 8.3 6.9
Hepatic Flexure 1.5 1.7 1.2 1.4 1.7 1.2 1.7 2.0 1.5
Transverse Colon 3.0 3.6 2.5 2.8 3.4 2.3 3.7 4.5 3.2
Splenic Flexure 0.9 1.1 0.7 0.7 1.0 0.5 1.3 1.4 1.2
Descending Colon 2.1 2.7 1.7 1.9 2.5 1.4 2.8 3.2 2.5
Sigmoid Colon 8.2 10.0 6.6 7.7 9.3 6.4 9.4 11.8 7.6
Large Intestine, NOS 1.8 2.0 1.7 1.6 1.8 1.4 2.5 2.5 2.5
Rectum and Rectosigmoid Junction 13.6 17.2 10.5 13.0 16.6 10.0 15.0 19.2 11.9
Rectosigmoid Junction 2.8 3.4 2.3 2.7 3.4 2.1 3.1 3.6 2.7
Rectum 10.8 13.8 8.2 10.3 13.2 7.9 11.9 15.6 9.2
Anus, Anal Canal and Anorectum 2.0 1.8 2.1 2.1 1.8 2.5 1.6 1.8 1.4
Liver and Intrahepatic Bile Duct 10.3 17.0 4.6 9.0 14.2 4.3 13.0 23.1 5.1
Liver 9.2 15.6 3.7 7.9 12.9 3.3 12.0 21.7 4.3
Intrahepatic Bile Duct 1.1 1.4 0.9 1.1 1.3 1.0 1.1 1.5 0.8
Gallbladder 1.2 0.9 1.5 1.1 0.8 1.3 1.7 1.3 2.1
Other Biliary 1.5 1.9 1.2 1.4 1.8 1.1 1.7 2.3 1.3
Pancreas 14.2 16.3 12.6 13.6 15.6 11.9 16.5 18.8 14.8
Retroperitoneum 0.3 0.3 0.3 0.3 0.3 0.2 0.3 ^ 0.4
Peritoneum, Omentum and Mesentery 0.4 ^ 0.6 0.4 ^ 0.6 0.3 ^ 0.5
Other Digestive Organs 0.7 0.7 0.7 0.7 0.6 0.7 0.9 1.1 0.8
Respiratory System 70.6 90.4 55.0 70.2 85.1 58.3 73.3 108.5 48.0
CANCER IN LOUISIANA, 2014-2018 | 51
Nose, Nasal Cavity and Middle Ear 0.8 1.0 0.6 0.8 1.1 0.6 0.5 0.8 ^
Larynx 5.0 8.6 2.1 4.7 7.7 2.1 6.2 11.6 2.0
Lung and Bronchus 64.6 80.6 52.2 64.4 76.1 55.4 66.4 95.8 45.6
Pleura ^ ^ ^ ^ ^ ^ ^ ^ ^ Trachea, Mediastinum and Other Respiratory Organs 0.1 0.2 ^ 0.1 ^ ^ ^ ^ ^
Bones and Joints 0.8 0.9 0.8 0.9 0.9 0.9 0.7 0.8 0.6
Soft Tissue including Heart 3.8 5.1 2.9 3.9 5.4 2.8 3.4 3.7 3.2
Skin excluding Basal and Squamous 20.2 27.6 14.9 27.7 36.7 21.0 2.2 2.2 2.2
Melanoma of the Skin 18.2 24.7 13.4 25.4 33.4 19.5 0.9 0.9 0.9
Other Non-Epithelial Skin 2.1 2.9 1.5 2.3 3.3 1.6 1.3 1.3 1.3
Breast 68.8 1.4 127.4 66.2 1.3 125.0 77.0 1.7 135.4
Female Genital System 23.7 -- 44.6 22.6 -- 43.6 27.4 -- 48.7
Cervix Uteri 4.8 -- 9.4 4.3 -- 8.7 6.2 -- 11.3
Corpus and Uterus, NOS 11.1 -- 20.8 10.4 -- 20.0 13.4 -- 23.8
Corpus Uteri 10.7 -- 20.1 10.2 -- 19.6 12.6 -- 22.3
Uterus, NOS 0.4 -- 0.7 0.2 -- 0.4 0.8 -- 1.4
Ovary 4.9 -- 9.1 4.9 -- 9.3 4.9 -- 8.8
Vagina 0.5 -- 1.0 0.5 -- 0.9 0.6 -- 1.1
Vulva 1.7 -- 3.1 1.8 -- 3.3 1.5 -- 2.7
Other Female Genital Organs 0.7 -- 1.3 0.7 -- 1.3 0.7 -- 1.1
Male Genital System 64.6 141.1 -- 59.0 126.3 -- 80.5 187.7 --
Prostate 61.5 134.7 -- 55.1 118.4 -- 78.8 183.9 --
Testis 2.4 4.8 -- 3.3 6.5 -- 0.8 1.6 --
Penis 0.6 1.3 -- 0.5 1.1 -- 0.8 1.8 --
Other Male Genital Organs 0.1 0.3 -- 0.1 0.2 -- ^ ^ --
Urinary System 41.2 63.1 23.8 44.9 69.0 24.9 32.2 46.0 22.0
Urinary Bladder 18.0 31.8 7.4 20.7 36.5 8.1 10.8 17.4 6.1
Kidney and Renal Pelvis 22.2 29.8 15.7 23.0 30.7 16.1 20.8 28.0 15.2
Ureter 0.6 0.9 0.3 0.7 1.1 0.4 ^ ^ ^
Other Urinary Organs 0.5 0.7 0.4 0.5 0.7 0.3 0.5 ^ 0.5
Eye and Orbit 0.7 0.9 0.6 0.9 1.1 0.8 0.2 ^ ^
Brain and Other Nervous System 5.9 7.2 4.7 7.0 8.3 5.7 3.6 4.7 2.8
Brain 5.5 6.7 4.4 6.5 7.8 5.4 3.3 4.3 2.5
Cranial Nerves Other Nervous System 0.4 0.5 0.3 0.4 0.5 0.3 0.3 ^ ^
Endocrine System 15.5 8.2 22.4 17.5 9.3 25.7 11.0 5.3 15.9
Thyroid 14.8 7.4 21.8 16.9 8.6 25.1 10.1 4.2 15.1
Other Endocrine including Thymus 0.7 0.8 0.6 0.6 0.7 0.5 0.9 1.1 0.8
Lymphoma 21.8 26.4 18.0 23.6 28.5 19.4 16.8 19.8 14.4
Hodgkin Lymphoma 2.8 3.2 2.5 3.0 3.3 2.7 2.6 3.2 2.2
Hodgkin - Nodal 2.8 3.2 2.5 2.9 3.2 2.6 2.6 3.1 2.2
Hodgkin - Extranodal ^ ^ ^ ^ ^ ^ ^ ^ ^
Non-Hodgkin Lymphoma 19.0 23.1 15.6 20.6 25.2 16.7 14.2 16.7 12.2
NHL - Nodal 12.5 15.5 10.1 13.8 17.1 11.1 9.0 10.7 7.6
NHL - Extranodal 6.4 7.7 5.5 6.8 8.1 5.6 5.2 6.0 4.6
Myeloma 8.0 9.9 6.6 6.1 7.8 4.7 13.6 16.6 11.5
CANCER IN LOUISIANA, 2014-2018 | 52
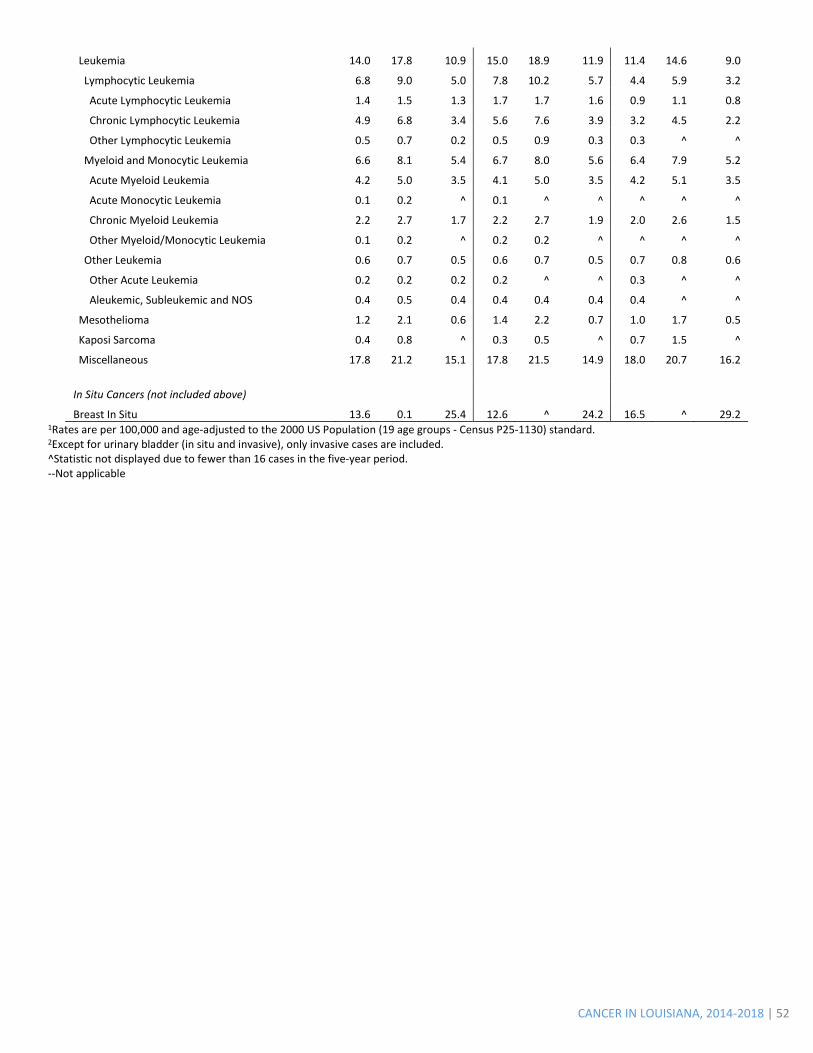
Leukemia 14.0 17.8 10.9 15.0 18.9 11.9 11.4 14.6 9.0
Lymphocytic Leukemia 6.8 9.0 5.0 7.8 10.2 5.7 4.4 5.9 3.2
Acute Lymphocytic Leukemia 1.4 1.5 1.3 1.7 1.7 1.6 0.9 1.1 0.8
Chronic Lymphocytic Leukemia 4.9 6.8 3.4 5.6 7.6 3.9 3.2 4.5 2.2
Other Lymphocytic Leukemia 0.5 0.7 0.2 0.5 0.9 0.3 0.3 ^ ^
Myeloid and Monocytic Leukemia 6.6 8.1 5.4 6.7 8.0 5.6 6.4 7.9 5.2
Acute Myeloid Leukemia 4.2 5.0 3.5 4.1 5.0 3.5 4.2 5.1 3.5
Acute Monocytic Leukemia 0.1 0.2 ^ 0.1 ^ ^ ^ ^ ^
Chronic Myeloid Leukemia 2.2 2.7 1.7 2.2 2.7 1.9 2.0 2.6 1.5
Other Myeloid/Monocytic Leukemia 0.1 0.2 ^ 0.2 0.2 ^ ^ ^ ^
Other Leukemia 0.6 0.7 0.5 0.6 0.7 0.5 0.7 0.8 0.6
Other Acute Leukemia 0.2 0.2 0.2 0.2 ^ ^ 0.3 ^ ^
Aleukemic, Subleukemic and NOS 0.4 0.5 0.4 0.4 0.4 0.4 0.4 ^ ^
Mesothelioma 1.2 2.1 0.6 1.4 2.2 0.7 1.0 1.7 0.5
Kaposi Sarcoma 0.4 0.8 ^ 0.3 0.5 ^ 0.7 1.5 ^
Miscellaneous 17.8 21.2 15.1 17.8 21.5 14.9 18.0 20.7 16.2
In Situ Cancers (not included above) Breast In Situ 13.6 0.1 25.4 12.6 ^ 24.2 16.5 ^ 29.2
1Rates are per 100,000 and age-adjusted to the 2000 US Population (19 age groups - Census P25-1130) standard. 2Except for urinary bladder (in situ and invasive), only invasive cases are included. ^Statistic not displayed due to fewer than 16 cases in the five-year period. --Not applicable
CANCER IN LOUISIANA, 2014-2018 | 53
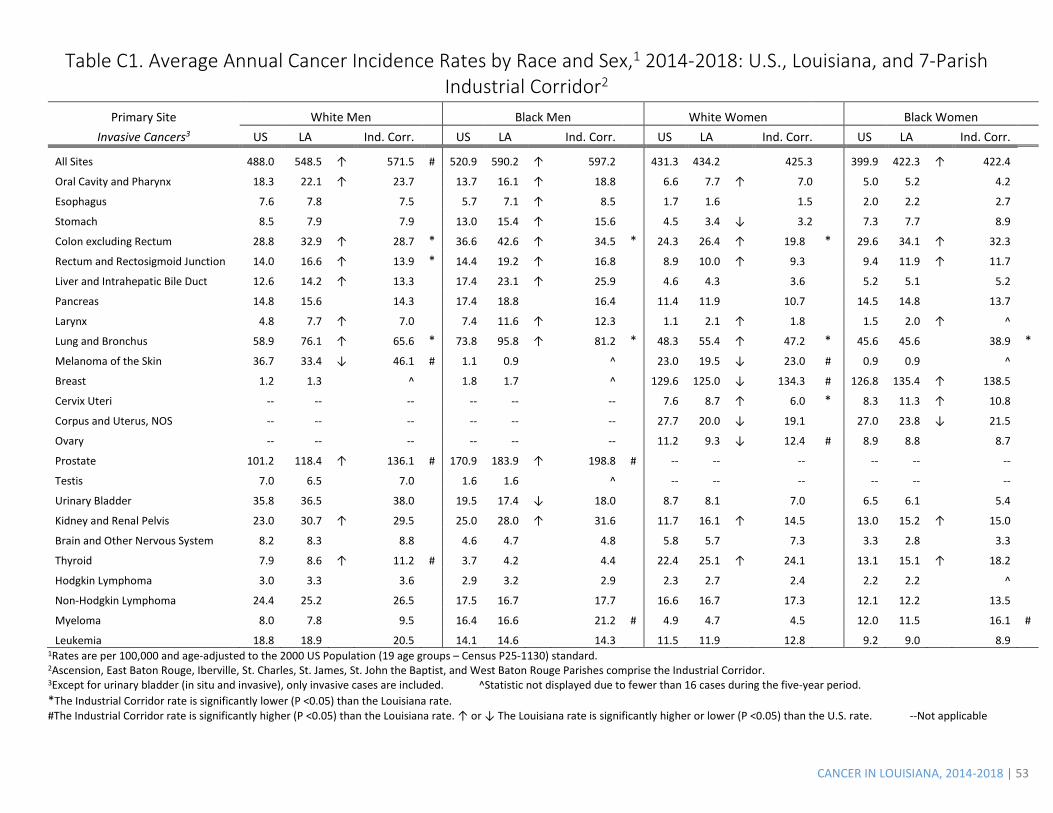
Table C1. Average Annual Cancer Incidence Rates by Race and Sex,1 2014-2018: U.S., Louisiana, and 7-Parish Industrial Corridor2
Primary Site White Men Black Men White Women Black Women Invasive Cancers3 US LA Ind. Corr. US LA Ind. Corr. US LA Ind. Corr. US LA Ind. Corr.
All Sites 488.0 548.5 ↑ 571.5 # 520.9 590.2 ↑ 597.2 431.3 434.2 425.3 399.9 422.3 ↑ 422.4
Oral Cavity and Pharynx 18.3 22.1 ↑ 23.7 13.7 16.1 ↑ 18.8 6.6 7.7 ↑ 7.0 5.0 5.2 4.2
Esophagus 7.6 7.8 7.5 5.7 7.1 ↑ 8.5 1.7 1.6 1.5 2.0 2.2 2.7
Stomach 8.5 7.9 7.9 13.0 15.4 ↑ 15.6 4.5 3.4 ↓ 3.2 7.3 7.7 8.9
Colon excluding Rectum 28.8 32.9 ↑ 28.7 * 36.6 42.6 ↑ 34.5 * 24.3 26.4 ↑ 19.8 * 29.6 34.1 ↑ 32.3
Rectum and Rectosigmoid Junction 14.0 16.6 ↑ 13.9 * 14.4 19.2 ↑ 16.8 8.9 10.0 ↑ 9.3 9.4 11.9 ↑ 11.7
Liver and Intrahepatic Bile Duct 12.6 14.2 ↑ 13.3 17.4 23.1 ↑ 25.9 4.6 4.3 3.6 5.2 5.1 5.2
Pancreas 14.8 15.6 14.3 17.4 18.8 16.4 11.4 11.9 10.7 14.5 14.8 13.7
Larynx 4.8 7.7 ↑ 7.0 7.4 11.6 ↑ 12.3 1.1 2.1 ↑ 1.8 1.5 2.0 ↑ ^
Lung and Bronchus 58.9 76.1 ↑ 65.6 * 73.8 95.8 ↑ 81.2 * 48.3 55.4 ↑ 47.2 * 45.6 45.6 38.9 *
Melanoma of the Skin 36.7 33.4 ↓ 46.1 # 1.1 0.9 ^ 23.0 19.5 ↓ 23.0 # 0.9 0.9 ^
Breast 1.2 1.3 ^ 1.8 1.7 ^ 129.6 125.0 ↓ 134.3 # 126.8 135.4 ↑ 138.5
Cervix Uteri -- -- -- -- -- -- 7.6 8.7 ↑ 6.0 * 8.3 11.3 ↑ 10.8
Corpus and Uterus, NOS -- -- -- -- -- -- 27.7 20.0 ↓ 19.1 27.0 23.8 ↓ 21.5
Ovary -- -- -- -- -- -- 11.2 9.3 ↓ 12.4 # 8.9 8.8 8.7
Prostate 101.2 118.4 ↑ 136.1 # 170.9 183.9 ↑ 198.8 # -- -- -- -- -- --
Testis 7.0 6.5 7.0 1.6 1.6 ^ -- -- -- -- -- --
Urinary Bladder 35.8 36.5 38.0 19.5 17.4 ↓ 18.0 8.7 8.1 7.0 6.5 6.1 5.4
Kidney and Renal Pelvis 23.0 30.7 ↑ 29.5 25.0 28.0 ↑ 31.6 11.7 16.1 ↑ 14.5 13.0 15.2 ↑ 15.0
Brain and Other Nervous System 8.2 8.3 8.8 4.6 4.7 4.8 5.8 5.7 7.3 3.3 2.8 3.3
Thyroid 7.9 8.6 ↑ 11.2 # 3.7 4.2 4.4 22.4 25.1 ↑ 24.1 13.1 15.1 ↑ 18.2
Hodgkin Lymphoma 3.0 3.3 3.6 2.9 3.2 2.9 2.3 2.7 2.4 2.2 2.2 ^
Non-Hodgkin Lymphoma 24.4 25.2 26.5 17.5 16.7 17.7 16.6 16.7 17.3 12.1 12.2 13.5
Myeloma 8.0 7.8 9.5 16.4 16.6 21.2 # 4.9 4.7 4.5 12.0 11.5 16.1 #
Leukemia 18.8 18.9 20.5 14.1 14.6 14.3 11.5 11.9 12.8 9.2 9.0 8.9 1Rates are per 100,000 and age-adjusted to the 2000 US Population (19 age groups – Census P25-1130) standard. 2Ascension, East Baton Rouge, Iberville, St. Charles, St. James, St. John the Baptist, and West Baton Rouge Parishes comprise the Industrial Corridor. 3Except for urinary bladder (in situ and invasive), only invasive cases are included. ^Statistic not displayed due to fewer than 16 cases during the five-year period. *The Industrial Corridor rate is significantly lower (P <0.05) than the Louisiana rate. #The Industrial Corridor rate is significantly higher (P <0.05) than the Louisiana rate. ↑ or ↓ The Louisiana rate is significantly higher or lower (P <0.05) than the U.S. rate. --Not applicable
CANCER IN LOUISIANA, 2014-2018 | 54
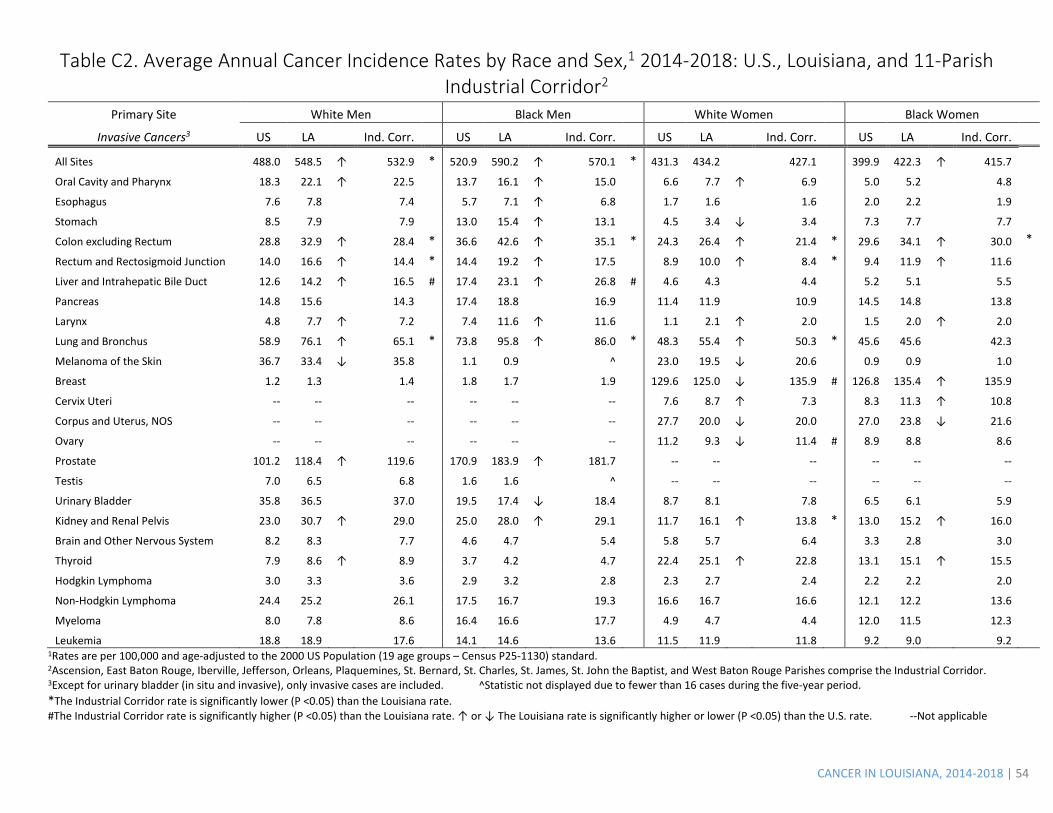
Table C2. Average Annual Cancer Incidence Rates by Race and Sex,1 2014-2018: U.S., Louisiana, and 11-Parish Industrial Corridor2
Primary Site White Men Black Men White Women Black Women
Invasive Cancers3 US LA Ind. Corr. US LA Ind. Corr. US LA Ind. Corr. US LA Ind. Corr.
All Sites 488.0 548.5 ↑ 532.9 * 520.9 590.2 ↑ 570.1 * 431.3 434.2 427.1 399.9 422.3 ↑ 415.7
Oral Cavity and Pharynx 18.3 22.1 ↑ 22.5 13.7 16.1 ↑ 15.0 6.6 7.7 ↑ 6.9 5.0 5.2 4.8
Esophagus 7.6 7.8 7.4 5.7 7.1 ↑ 6.8 1.7 1.6 1.6 2.0 2.2 1.9
Stomach 8.5 7.9 7.9 13.0 15.4 ↑ 13.1 4.5 3.4 ↓ 3.4 7.3 7.7 7.7
Colon excluding Rectum 28.8 32.9 ↑ 28.4 * 36.6 42.6 ↑ 35.1 * 24.3 26.4 ↑ 21.4 * 29.6 34.1 ↑ 30.0 *
Rectum and Rectosigmoid Junction 14.0 16.6 ↑ 14.4 * 14.4 19.2 ↑ 17.5 8.9 10.0 ↑ 8.4 * 9.4 11.9 ↑ 11.6
Liver and Intrahepatic Bile Duct 12.6 14.2 ↑ 16.5 # 17.4 23.1 ↑ 26.8 # 4.6 4.3 4.4 5.2 5.1 5.5
Pancreas 14.8 15.6 14.3 17.4 18.8 16.9 11.4 11.9 10.9 14.5 14.8 13.8
Larynx 4.8 7.7 ↑ 7.2 7.4 11.6 ↑ 11.6 1.1 2.1 ↑ 2.0 1.5 2.0 ↑ 2.0
Lung and Bronchus 58.9 76.1 ↑ 65.1 * 73.8 95.8 ↑ 86.0 * 48.3 55.4 ↑ 50.3 * 45.6 45.6 42.3
Melanoma of the Skin 36.7 33.4 ↓ 35.8 1.1 0.9 ^ 23.0 19.5 ↓ 20.6 0.9 0.9 1.0
Breast 1.2 1.3 1.4 1.8 1.7 1.9 129.6 125.0 ↓ 135.9 # 126.8 135.4 ↑ 135.9
Cervix Uteri -- -- -- -- -- -- 7.6 8.7 ↑ 7.3 8.3 11.3 ↑ 10.8
Corpus and Uterus, NOS -- -- -- -- -- -- 27.7 20.0 ↓ 20.0 27.0 23.8 ↓ 21.6
Ovary -- -- -- -- -- -- 11.2 9.3 ↓ 11.4 # 8.9 8.8 8.6
Prostate 101.2 118.4 ↑ 119.6 170.9 183.9 ↑ 181.7 -- -- -- -- -- --
Testis 7.0 6.5 6.8 1.6 1.6 ^ -- -- -- -- -- --
Urinary Bladder 35.8 36.5 37.0 19.5 17.4 ↓ 18.4 8.7 8.1 7.8 6.5 6.1 5.9
Kidney and Renal Pelvis 23.0 30.7 ↑ 29.0 25.0 28.0 ↑ 29.1 11.7 16.1 ↑ 13.8 * 13.0 15.2 ↑ 16.0
Brain and Other Nervous System 8.2 8.3 7.7 4.6 4.7 5.4 5.8 5.7 6.4 3.3 2.8 3.0
Thyroid 7.9 8.6 ↑ 8.9 3.7 4.2 4.7 22.4 25.1 ↑ 22.8 13.1 15.1 ↑ 15.5
Hodgkin Lymphoma 3.0 3.3 3.6 2.9 3.2 2.8 2.3 2.7 2.4 2.2 2.2 2.0
Non-Hodgkin Lymphoma 24.4 25.2 26.1 17.5 16.7 19.3 16.6 16.7 16.6 12.1 12.2 13.6
Myeloma 8.0 7.8 8.6 16.4 16.6 17.7 4.9 4.7 4.4 12.0 11.5 12.3
Leukemia 18.8 18.9 17.6 14.1 14.6 13.6 11.5 11.9 11.8 9.2 9.0 9.2 1Rates are per 100,000 and age-adjusted to the 2000 US Population (19 age groups – Census P25-1130) standard. 2Ascension, East Baton Rouge, Iberville, Jefferson, Orleans, Plaquemines, St. Bernard, St. Charles, St. James, St. John the Baptist, and West Baton Rouge Parishes comprise the Industrial Corridor. 3Except for urinary bladder (in situ and invasive), only invasive cases are included. ^Statistic not displayed due to fewer than 16 cases during the five-year period. *The Industrial Corridor rate is significantly lower (P <0.05) than the Louisiana rate. #The Industrial Corridor rate is significantly higher (P <0.05) than the Louisiana rate. ↑ or ↓ The Louisiana rate is significantly higher or lower (P <0.05) than the U.S. rate. --Not applicable
CANCER IN LOUISIANA, 2014-2018 |55
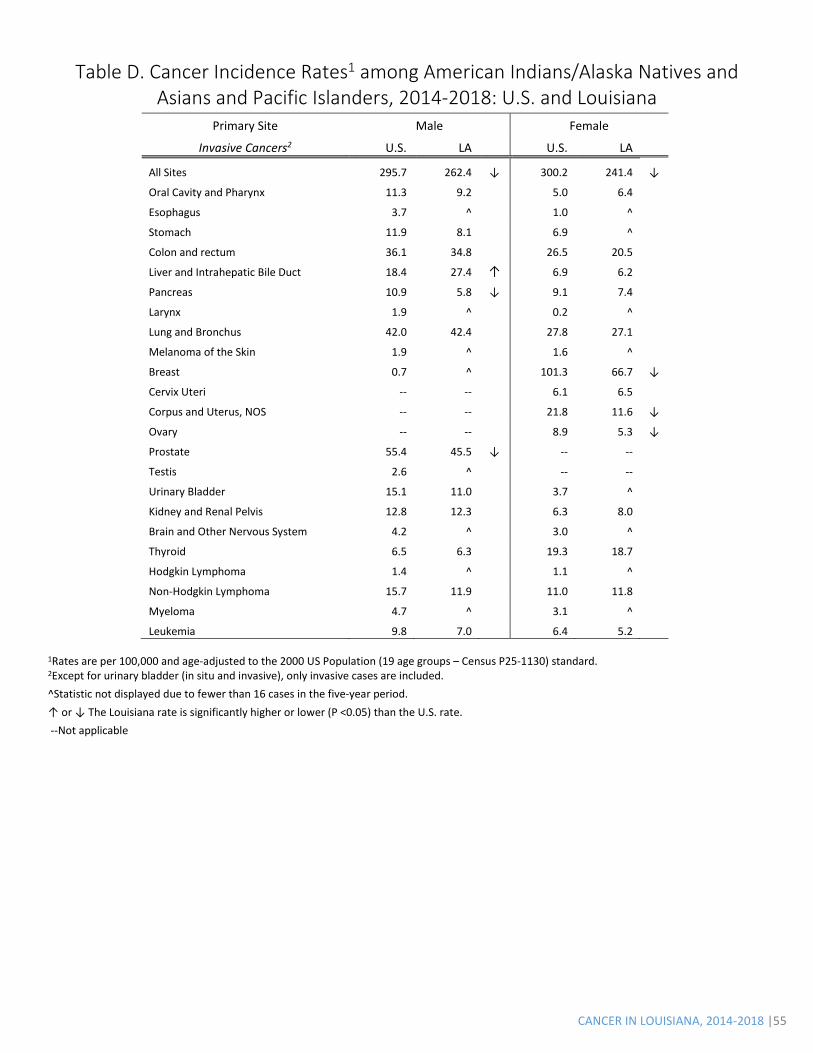
Table D. Cancer Incidence Rates1 among American Indians/Alaska Natives and Asians and Pacific Islanders, 2014-2018: U.S. and Louisiana
Primary Site Male Female
Invasive Cancers2 U.S. LA U.S. LA
All Sites 295.7 262.4 ↓ 300.2 241.4 ↓
Oral Cavity and Pharynx 11.3 9.2 5.0 6.4
Esophagus 3.7 ^ 1.0 ^
Stomach 11.9 8.1 6.9 ^
Colon and rectum 36.1 34.8 26.5 20.5
Liver and Intrahepatic Bile Duct 18.4 27.4 ↑ 6.9 6.2
Pancreas 10.9 5.8 ↓ 9.1 7.4
Larynx 1.9 ^ 0.2 ^
Lung and Bronchus 42.0 42.4 27.8 27.1
Melanoma of the Skin 1.9 ^ 1.6 ^
Breast 0.7 ^ 101.3 66.7 ↓
Cervix Uteri -- -- 6.1 6.5
Corpus and Uterus, NOS -- -- 21.8 11.6 ↓
Ovary -- -- 8.9 5.3 ↓
Prostate 55.4 45.5 ↓ -- --
Testis 2.6 ^ -- --
Urinary Bladder 15.1 11.0 3.7 ^
Kidney and Renal Pelvis 12.8 12.3 6.3 8.0
Brain and Other Nervous System 4.2 ^ 3.0 ^
Thyroid 6.5 6.3 19.3 18.7
Hodgkin Lymphoma 1.4 ^ 1.1 ^
Non-Hodgkin Lymphoma 15.7 11.9 11.0 11.8
Myeloma 4.7 ^ 3.1 ^
Leukemia 9.8 7.0 6.4 5.2
1Rates are per 100,000 and age-adjusted to the 2000 US Population (19 age groups – Census P25-1130) standard. 2Except for urinary bladder (in situ and invasive), only invasive cases are included. ^Statistic not displayed due to fewer than 16 cases in the five-year period. ↑ or ↓ The Louisiana rate is significantly higher or lower (P <0.05) than the U.S. rate. --Not applicable
CANCER IN LOUISIANA, 2014-2018 |56
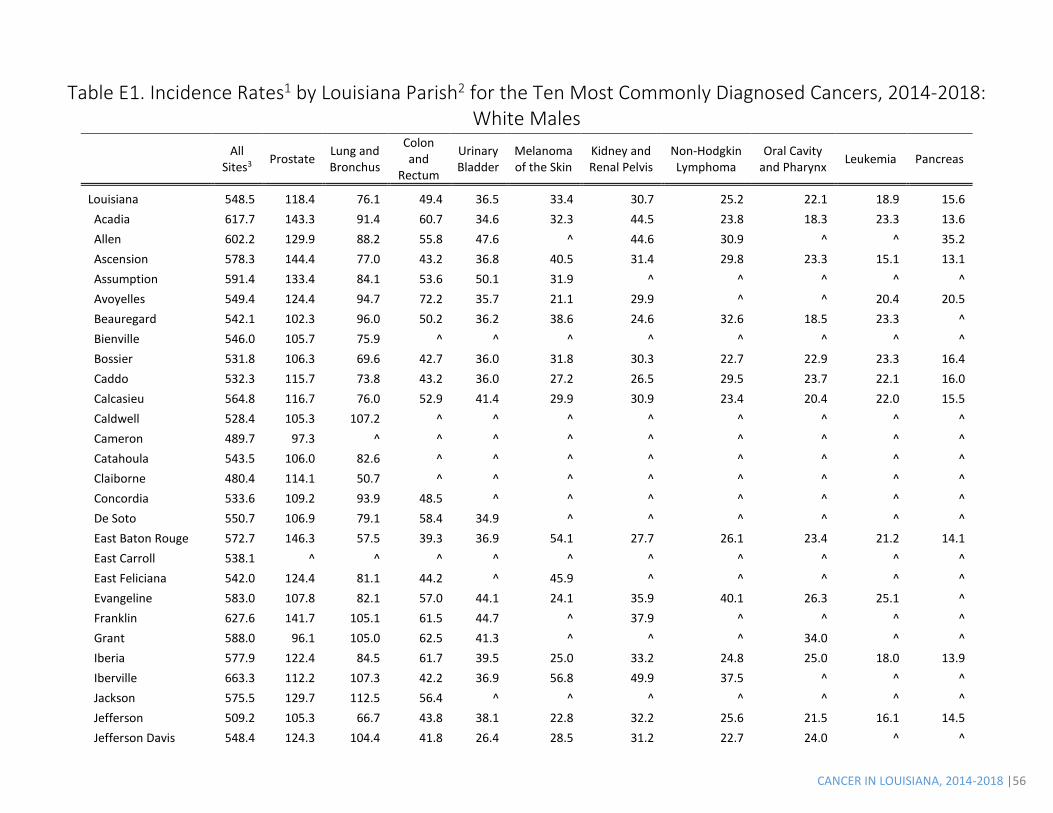
Table E1. Incidence Rates1 by Louisiana Parish2 for the Ten Most Commonly Diagnosed Cancers, 2014-2018: White Males
All Sites3 Prostate Lung and
Bronchus
Colon and
Rectum
Urinary Bladder
Melanoma of the Skin
Kidney and Renal Pelvis
Non-Hodgkin Lymphoma
Oral Cavity and Pharynx Leukemia Pancreas
Louisiana 548.5 118.4 76.1 49.4 36.5 33.4 30.7 25.2 22.1 18.9 15.6 Acadia 617.7 143.3 91.4 60.7 34.6 32.3 44.5 23.8 18.3 23.3 13.6 Allen 602.2 129.9 88.2 55.8 47.6 ^ 44.6 30.9 ^ ^ 35.2 Ascension 578.3 144.4 77.0 43.2 36.8 40.5 31.4 29.8 23.3 15.1 13.1 Assumption 591.4 133.4 84.1 53.6 50.1 31.9 ^ ^ ^ ^ ^ Avoyelles 549.4 124.4 94.7 72.2 35.7 21.1 29.9 ^ ^ 20.4 20.5 Beauregard 542.1 102.3 96.0 50.2 36.2 38.6 24.6 32.6 18.5 23.3 ^ Bienville 546.0 105.7 75.9 ^ ^ ^ ^ ^ ^ ^ ^ Bossier 531.8 106.3 69.6 42.7 36.0 31.8 30.3 22.7 22.9 23.3 16.4 Caddo 532.3 115.7 73.8 43.2 36.0 27.2 26.5 29.5 23.7 22.1 16.0 Calcasieu 564.8 116.7 76.0 52.9 41.4 29.9 30.9 23.4 20.4 22.0 15.5 Caldwell 528.4 105.3 107.2 ^ ^ ^ ^ ^ ^ ^ ^ Cameron 489.7 97.3 ^ ^ ^ ^ ^ ^ ^ ^ ^ Catahoula 543.5 106.0 82.6 ^ ^ ^ ^ ^ ^ ^ ^ Claiborne 480.4 114.1 50.7 ^ ^ ^ ^ ^ ^ ^ ^ Concordia 533.6 109.2 93.9 48.5 ^ ^ ^ ^ ^ ^ ^ De Soto 550.7 106.9 79.1 58.4 34.9 ^ ^ ^ ^ ^ ^ East Baton Rouge 572.7 146.3 57.5 39.3 36.9 54.1 27.7 26.1 23.4 21.2 14.1 East Carroll 538.1 ^ ^ ^ ^ ^ ^ ^ ^ ^ ^ East Feliciana 542.0 124.4 81.1 44.2 ^ 45.9 ^ ^ ^ ^ ^ Evangeline 583.0 107.8 82.1 57.0 44.1 24.1 35.9 40.1 26.3 25.1 ^ Franklin 627.6 141.7 105.1 61.5 44.7 ^ 37.9 ^ ^ ^ ^ Grant 588.0 96.1 105.0 62.5 41.3 ^ ^ ^ 34.0 ^ ^ Iberia 577.9 122.4 84.5 61.7 39.5 25.0 33.2 24.8 25.0 18.0 13.9 Iberville 663.3 112.2 107.3 42.2 36.9 56.8 49.9 37.5 ^ ^ ^ Jackson 575.5 129.7 112.5 56.4 ^ ^ ^ ^ ^ ^ ^ Jefferson 509.2 105.3 66.7 43.8 38.1 22.8 32.2 25.6 21.5 16.1 14.5 Jefferson Davis 548.4 124.3 104.4 41.8 26.4 28.5 31.2 22.7 24.0 ^ ^
CANCER IN LOUISIANA, 2014-2018 | 57
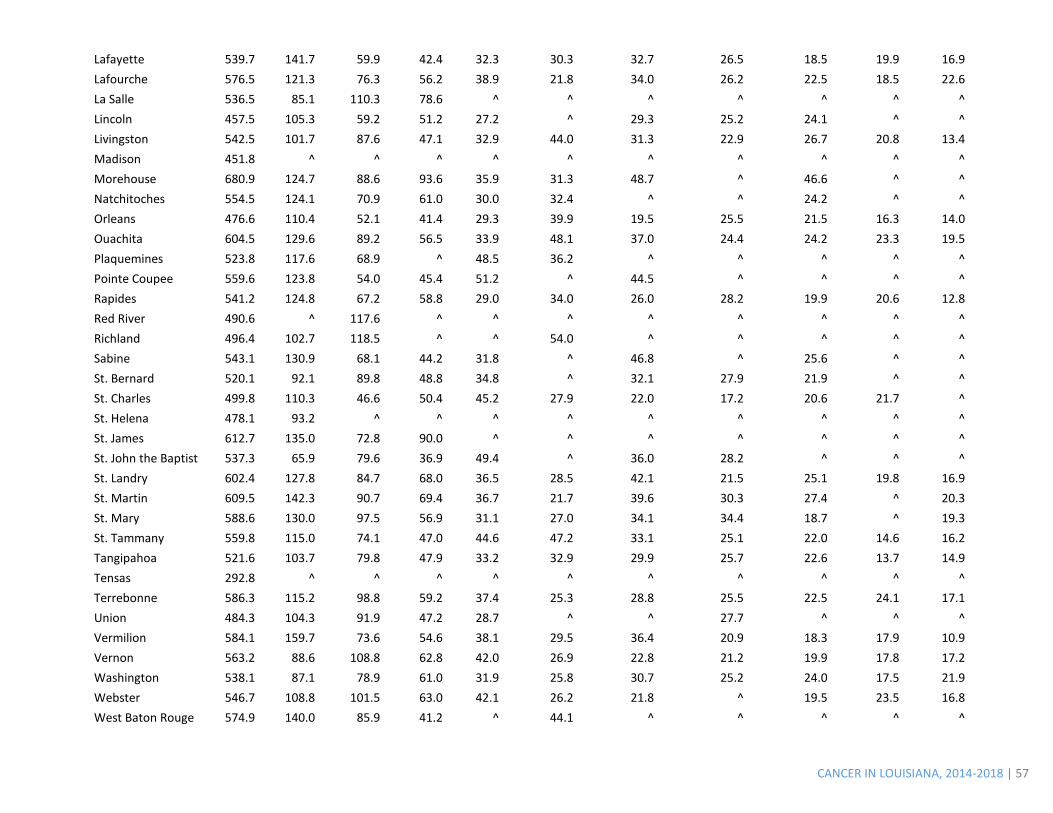
Lafayette 539.7 141.7 59.9 42.4 32.3 30.3 32.7 26.5 18.5 19.9 16.9 Lafourche 576.5 121.3 76.3 56.2 38.9 21.8 34.0 26.2 22.5 18.5 22.6 La Salle 536.5 85.1 110.3 78.6 ^ ^ ^ ^ ^ ^ ^ Lincoln 457.5 105.3 59.2 51.2 27.2 ^ 29.3 25.2 24.1 ^ ^ Livingston 542.5 101.7 87.6 47.1 32.9 44.0 31.3 22.9 26.7 20.8 13.4 Madison 451.8 ^ ^ ^ ^ ^ ^ ^ ^ ^ ^ Morehouse 680.9 124.7 88.6 93.6 35.9 31.3 48.7 ^ 46.6 ^ ^ Natchitoches 554.5 124.1 70.9 61.0 30.0 32.4 ^ ^ 24.2 ^ ^ Orleans 476.6 110.4 52.1 41.4 29.3 39.9 19.5 25.5 21.5 16.3 14.0 Ouachita 604.5 129.6 89.2 56.5 33.9 48.1 37.0 24.4 24.2 23.3 19.5 Plaquemines 523.8 117.6 68.9 ^ 48.5 36.2 ^ ^ ^ ^ ^ Pointe Coupee 559.6 123.8 54.0 45.4 51.2 ^ 44.5 ^ ^ ^ ^ Rapides 541.2 124.8 67.2 58.8 29.0 34.0 26.0 28.2 19.9 20.6 12.8 Red River 490.6 ^ 117.6 ^ ^ ^ ^ ^ ^ ^ ^ Richland 496.4 102.7 118.5 ^ ^ 54.0 ^ ^ ^ ^ ^ Sabine 543.1 130.9 68.1 44.2 31.8 ^ 46.8 ^ 25.6 ^ ^ St. Bernard 520.1 92.1 89.8 48.8 34.8 ^ 32.1 27.9 21.9 ^ ^ St. Charles 499.8 110.3 46.6 50.4 45.2 27.9 22.0 17.2 20.6 21.7 ^ St. Helena 478.1 93.2 ^ ^ ^ ^ ^ ^ ^ ^ ^ St. James 612.7 135.0 72.8 90.0 ^ ^ ^ ^ ^ ^ ^ St. John the Baptist 537.3 65.9 79.6 36.9 49.4 ^ 36.0 28.2 ^ ^ ^ St. Landry 602.4 127.8 84.7 68.0 36.5 28.5 42.1 21.5 25.1 19.8 16.9 St. Martin 609.5 142.3 90.7 69.4 36.7 21.7 39.6 30.3 27.4 ^ 20.3 St. Mary 588.6 130.0 97.5 56.9 31.1 27.0 34.1 34.4 18.7 ^ 19.3 St. Tammany 559.8 115.0 74.1 47.0 44.6 47.2 33.1 25.1 22.0 14.6 16.2 Tangipahoa 521.6 103.7 79.8 47.9 33.2 32.9 29.9 25.7 22.6 13.7 14.9 Tensas 292.8 ^ ^ ^ ^ ^ ^ ^ ^ ^ ^ Terrebonne 586.3 115.2 98.8 59.2 37.4 25.3 28.8 25.5 22.5 24.1 17.1 Union 484.3 104.3 91.9 47.2 28.7 ^ ^ 27.7 ^ ^ ^ Vermilion 584.1 159.7 73.6 54.6 38.1 29.5 36.4 20.9 18.3 17.9 10.9 Vernon 563.2 88.6 108.8 62.8 42.0 26.9 22.8 21.2 19.9 17.8 17.2 Washington 538.1 87.1 78.9 61.0 31.9 25.8 30.7 25.2 24.0 17.5 21.9 Webster 546.7 108.8 101.5 63.0 42.1 26.2 21.8 ^ 19.5 23.5 16.8 West Baton Rouge 574.9 140.0 85.9 41.2 ^ 44.1 ^ ^ ^ ^ ^
CANCER IN LOUISIANA, 2014-2018 | 58
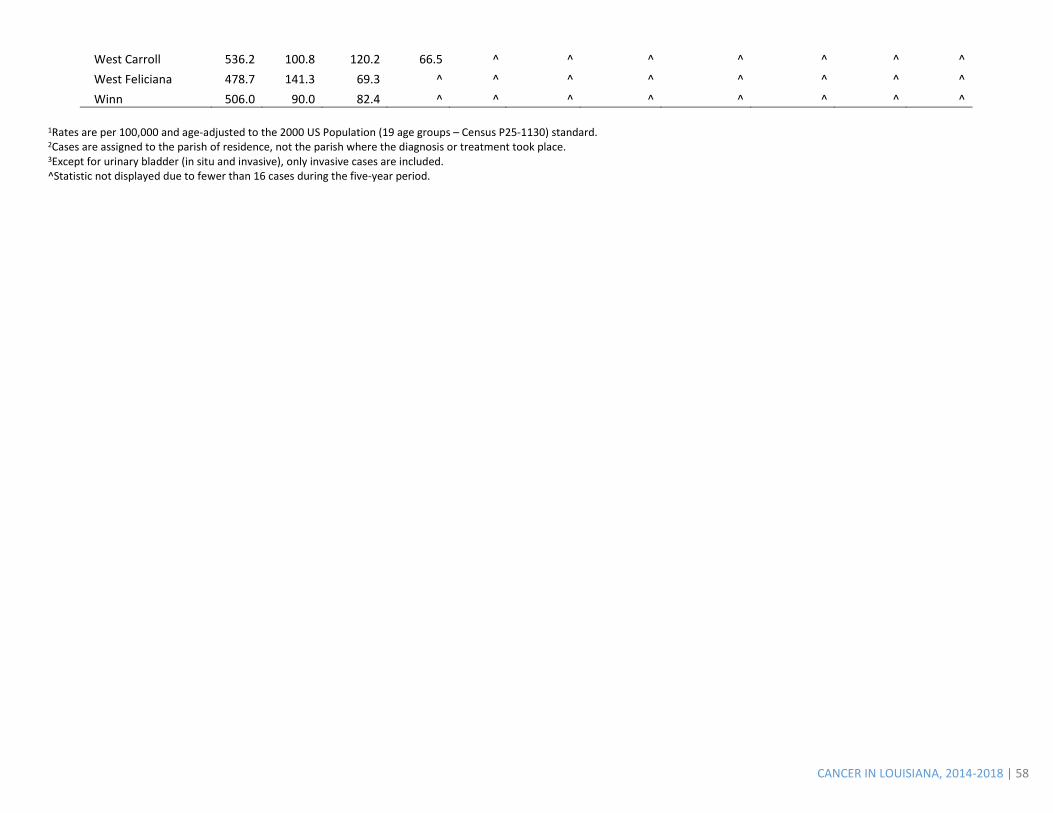
West Carroll 536.2 100.8 120.2 66.5 ^ ^ ^ ^ ^ ^ ^ West Feliciana 478.7 141.3 69.3 ^ ^ ^ ^ ^ ^ ^ ^ Winn 506.0 90.0 82.4 ^ ^ ^ ^ ^ ^ ^ ^
1Rates are per 100,000 and age-adjusted to the 2000 US Population (19 age groups – Census P25-1130) standard. 2Cases are assigned to the parish of residence, not the parish where the diagnosis or treatment took place. 3Except for urinary bladder (in situ and invasive), only invasive cases are included. ^Statistic not displayed due to fewer than 16 cases during the five-year period.
CANCER IN LOUISIANA, 2014-2018 | 59
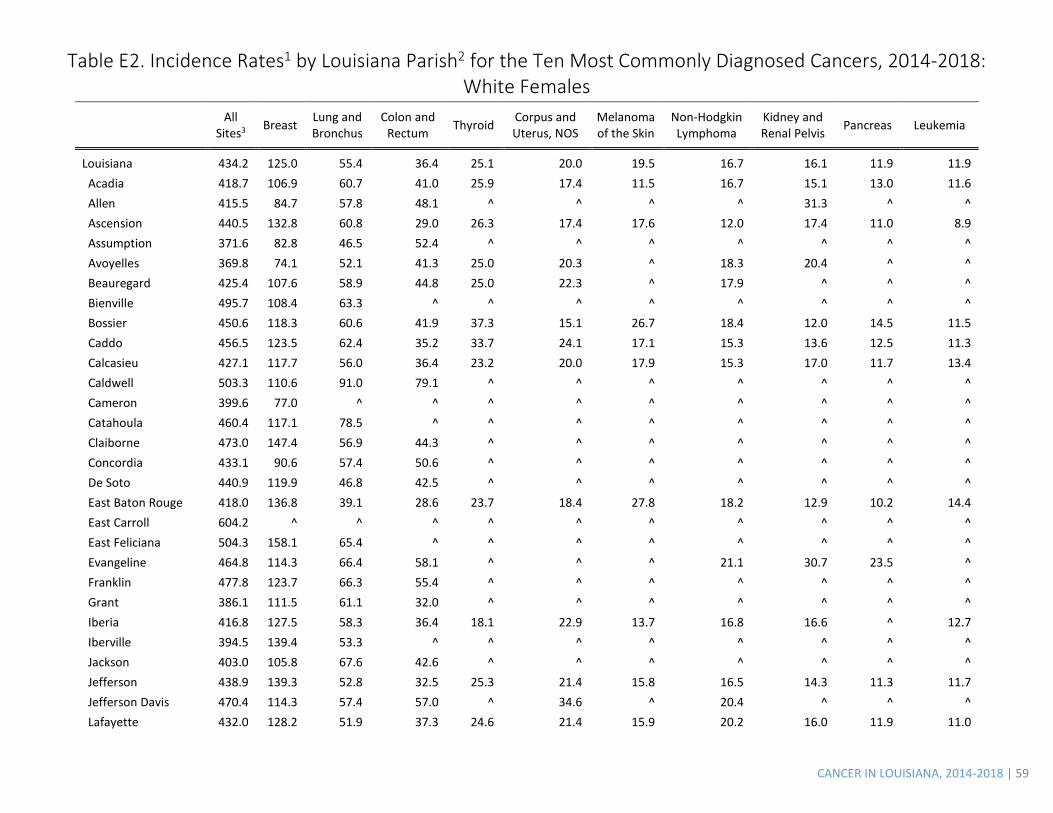
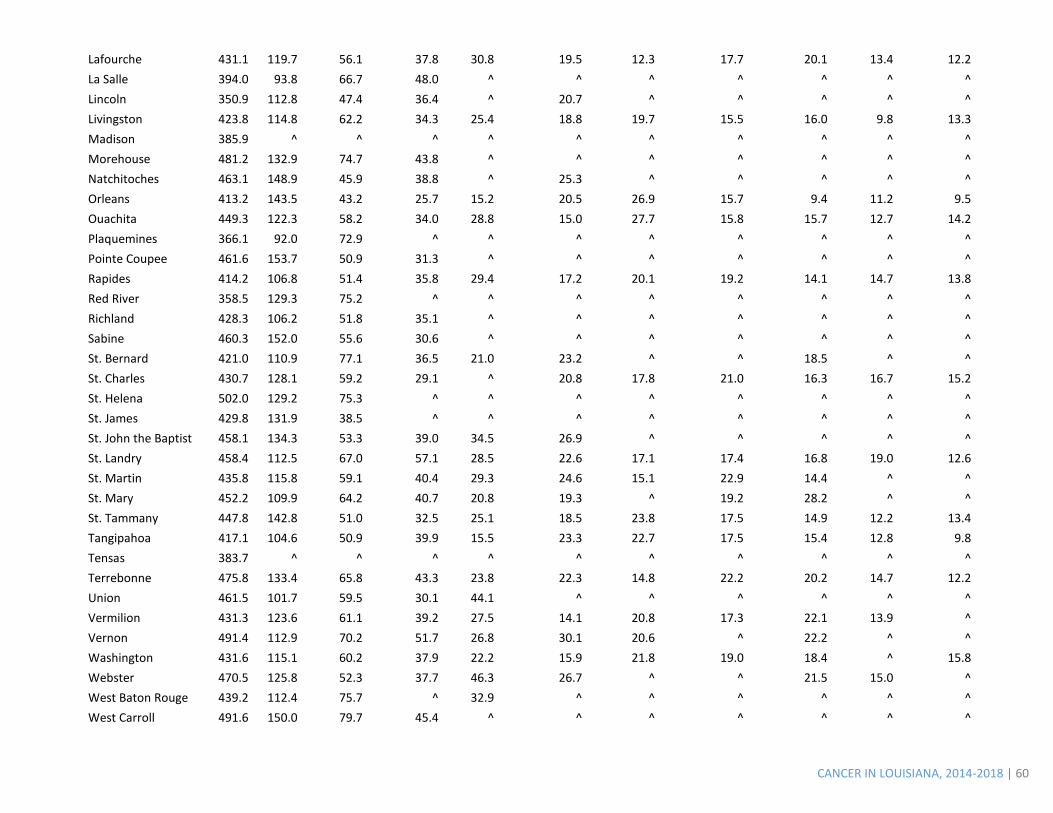
Table E2. Incidence Rates1 by Louisiana Parish2 for the Ten Most Commonly Diagnosed Cancers, 2014-2018: White Females
All Sites3 Breast Lung and
Bronchus Colon and
Rectum Thyroid Corpus and Uterus, NOS
Melanoma of the Skin
Non-Hodgkin Lymphoma
Kidney and Renal Pelvis Pancreas Leukemia
Louisiana 434.2 125.0 55.4 36.4 25.1 20.0 19.5 16.7 16.1 11.9 11.9 Acadia 418.7 106.9 60.7 41.0 25.9 17.4 11.5 16.7 15.1 13.0 11.6 Allen 415.5 84.7 57.8 48.1 ^ ^ ^ ^ 31.3 ^ ^ Ascension 440.5 132.8 60.8 29.0 26.3 17.4 17.6 12.0 17.4 11.0 8.9 Assumption 371.6 82.8 46.5 52.4 ^ ^ ^ ^ ^ ^ ^ Avoyelles 369.8 74.1 52.1 41.3 25.0 20.3 ^ 18.3 20.4 ^ ^ Beauregard 425.4 107.6 58.9 44.8 25.0 22.3 ^ 17.9 ^ ^ ^ Bienville 495.7 108.4 63.3 ^ ^ ^ ^ ^ ^ ^ ^ Bossier 450.6 118.3 60.6 41.9 37.3 15.1 26.7 18.4 12.0 14.5 11.5 Caddo 456.5 123.5 62.4 35.2 33.7 24.1 17.1 15.3 13.6 12.5 11.3 Calcasieu 427.1 117.7 56.0 36.4 23.2 20.0 17.9 15.3 17.0 11.7 13.4 Caldwell 503.3 110.6 91.0 79.1 ^ ^ ^ ^ ^ ^ ^ Cameron 399.6 77.0 ^ ^ ^ ^ ^ ^ ^ ^ ^ Catahoula 460.4 117.1 78.5 ^ ^ ^ ^ ^ ^ ^ ^ Claiborne 473.0 147.4 56.9 44.3 ^ ^ ^ ^ ^ ^ ^ Concordia 433.1 90.6 57.4 50.6 ^ ^ ^ ^ ^ ^ ^ De Soto 440.9 119.9 46.8 42.5 ^ ^ ^ ^ ^ ^ ^ East Baton Rouge 418.0 136.8 39.1 28.6 23.7 18.4 27.8 18.2 12.9 10.2 14.4 East Carroll 604.2 ^ ^ ^ ^ ^ ^ ^ ^ ^ ^ East Feliciana 504.3 158.1 65.4 ^ ^ ^ ^ ^ ^ ^ ^ Evangeline 464.8 114.3 66.4 58.1 ^ ^ ^ 21.1 30.7 23.5 ^ Franklin 477.8 123.7 66.3 55.4 ^ ^ ^ ^ ^ ^ ^ Grant 386.1 111.5 61.1 32.0 ^ ^ ^ ^ ^ ^ ^ Iberia 416.8 127.5 58.3 36.4 18.1 22.9 13.7 16.8 16.6 ^ 12.7 Iberville 394.5 139.4 53.3 ^ ^ ^ ^ ^ ^ ^ ^ Jackson 403.0 105.8 67.6 42.6 ^ ^ ^ ^ ^ ^ ^ Jefferson 438.9 139.3 52.8 32.5 25.3 21.4 15.8 16.5 14.3 11.3 11.7 Jefferson Davis 470.4 114.3 57.4 57.0 ^ 34.6 ^ 20.4 ^ ^ ^ Lafayette 432.0 128.2 51.9 37.3 24.6 21.4 15.9 20.2 16.0 11.9 11.0
CANCER IN LOUISIANA, 2014-2018 | 60
Lafourche 431.1 119.7 56.1 37.8 30.8 19.5 12.3 17.7 20.1 13.4 12.2 La Salle 394.0 93.8 66.7 48.0 ^ ^ ^ ^ ^ ^ ^ Lincoln 350.9 112.8 47.4 36.4 ^ 20.7 ^ ^ ^ ^ ^ Livingston 423.8 114.8 62.2 34.3 25.4 18.8 19.7 15.5 16.0 9.8 13.3 Madison 385.9 ^ ^ ^ ^ ^ ^ ^ ^ ^ ^ Morehouse 481.2 132.9 74.7 43.8 ^ ^ ^ ^ ^ ^ ^ Natchitoches 463.1 148.9 45.9 38.8 ^ 25.3 ^ ^ ^ ^ ^ Orleans 413.2 143.5 43.2 25.7 15.2 20.5 26.9 15.7 9.4 11.2 9.5 Ouachita 449.3 122.3 58.2 34.0 28.8 15.0 27.7 15.8 15.7 12.7 14.2 Plaquemines 366.1 92.0 72.9 ^ ^ ^ ^ ^ ^ ^ ^ Pointe Coupee 461.6 153.7 50.9 31.3 ^ ^ ^ ^ ^ ^ ^ Rapides 414.2 106.8 51.4 35.8 29.4 17.2 20.1 19.2 14.1 14.7 13.8 Red River 358.5 129.3 75.2 ^ ^ ^ ^ ^ ^ ^ ^ Richland 428.3 106.2 51.8 35.1 ^ ^ ^ ^ ^ ^ ^ Sabine 460.3 152.0 55.6 30.6 ^ ^ ^ ^ ^ ^ ^ St. Bernard 421.0 110.9 77.1 36.5 21.0 23.2 ^ ^ 18.5 ^ ^ St. Charles 430.7 128.1 59.2 29.1 ^ 20.8 17.8 21.0 16.3 16.7 15.2 St. Helena 502.0 129.2 75.3 ^ ^ ^ ^ ^ ^ ^ ^ St. James 429.8 131.9 38.5 ^ ^ ^ ^ ^ ^ ^ ^ St. John the Baptist 458.1 134.3 53.3 39.0 34.5 26.9 ^ ^ ^ ^ ^ St. Landry 458.4 112.5 67.0 57.1 28.5 22.6 17.1 17.4 16.8 19.0 12.6 St. Martin 435.8 115.8 59.1 40.4 29.3 24.6 15.1 22.9 14.4 ^ ^ St. Mary 452.2 109.9 64.2 40.7 20.8 19.3 ^ 19.2 28.2 ^ ^ St. Tammany 447.8 142.8 51.0 32.5 25.1 18.5 23.8 17.5 14.9 12.2 13.4 Tangipahoa 417.1 104.6 50.9 39.9 15.5 23.3 22.7 17.5 15.4 12.8 9.8 Tensas 383.7 ^ ^ ^ ^ ^ ^ ^ ^ ^ ^ Terrebonne 475.8 133.4 65.8 43.3 23.8 22.3 14.8 22.2 20.2 14.7 12.2 Union 461.5 101.7 59.5 30.1 44.1 ^ ^ ^ ^ ^ ^ Vermilion 431.3 123.6 61.1 39.2 27.5 14.1 20.8 17.3 22.1 13.9 ^ Vernon 491.4 112.9 70.2 51.7 26.8 30.1 20.6 ^ 22.2 ^ ^ Washington 431.6 115.1 60.2 37.9 22.2 15.9 21.8 19.0 18.4 ^ 15.8 Webster 470.5 125.8 52.3 37.7 46.3 26.7 ^ ^ 21.5 15.0 ^ West Baton Rouge 439.2 112.4 75.7 ^ 32.9 ^ ^ ^ ^ ^ ^ West Carroll 491.6 150.0 79.7 45.4 ^ ^ ^ ^ ^ ^ ^
CANCER IN LOUISIANA, 2014-2018 | 61
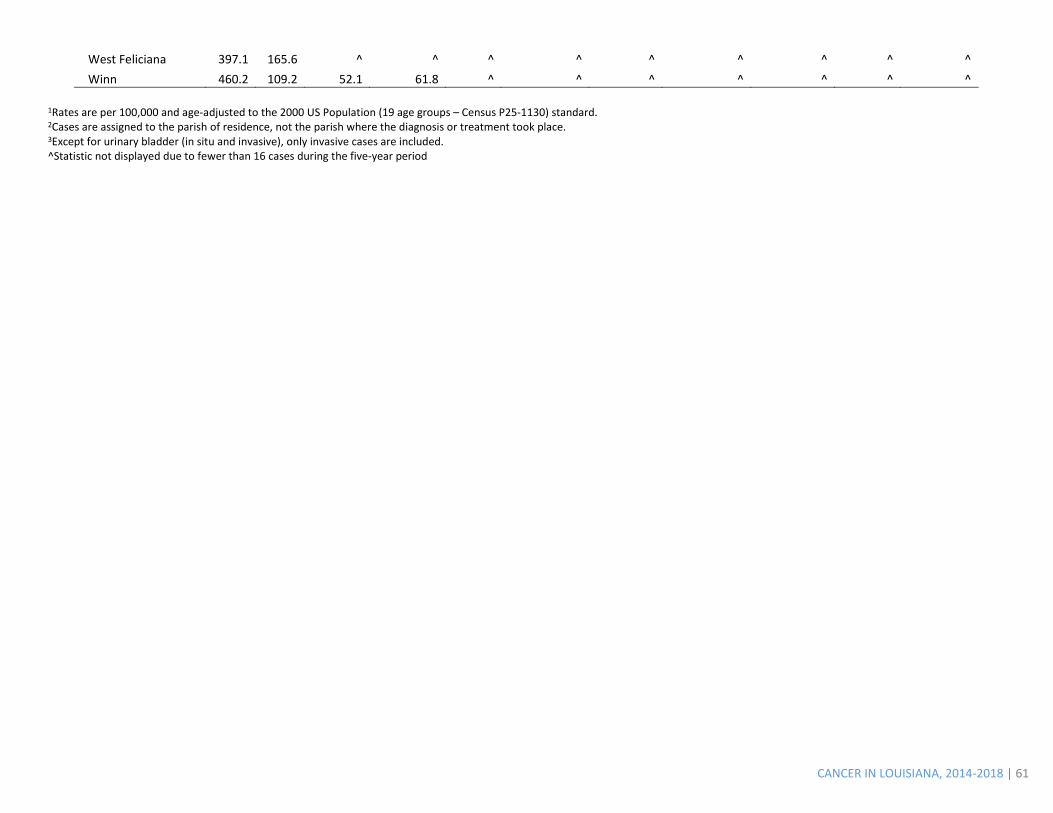
West Feliciana 397.1 165.6 ^ ^ ^ ^ ^ ^ ^ ^ ^ Winn 460.2 109.2 52.1 61.8 ^ ^ ^ ^ ^ ^ ^
1Rates are per 100,000 and age-adjusted to the 2000 US Population (19 age groups – Census P25-1130) standard. 2Cases are assigned to the parish of residence, not the parish where the diagnosis or treatment took place. 3Except for urinary bladder (in situ and invasive), only invasive cases are included. ^Statistic not displayed due to fewer than 16 cases during the five-year period
CANCER IN LOUISIANA, 2014-2018 | 62
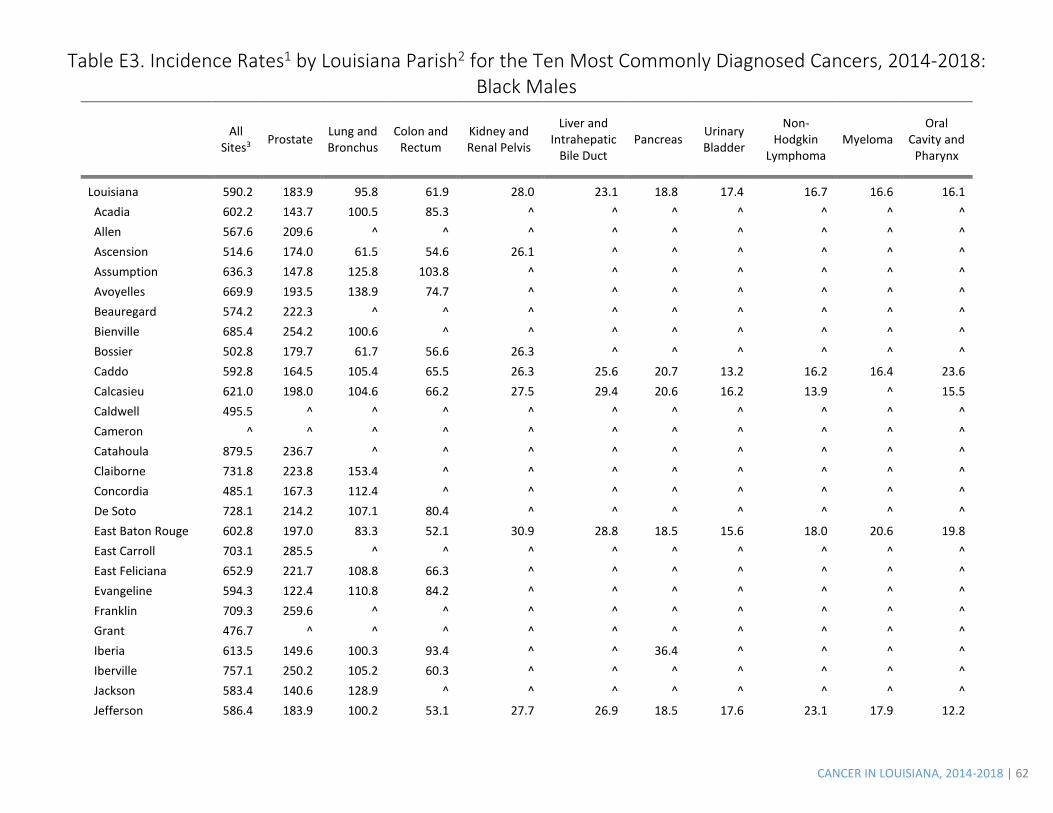
Table E3. Incidence Rates1 by Louisiana Parish2 for the Ten Most Commonly Diagnosed Cancers, 2014-2018: Black Males
All Sites3 Prostate Lung and
Bronchus Colon and
Rectum Kidney and Renal Pelvis
Liver and Intrahepatic
Bile Duct Pancreas Urinary
Bladder
Non-Hodgkin
Lymphoma Myeloma
Oral Cavity and
Pharynx
Louisiana 590.2 183.9 95.8 61.9 28.0 23.1 18.8 17.4 16.7 16.6 16.1 Acadia 602.2 143.7 100.5 85.3 ^ ^ ^ ^ ^ ^ ^ Allen 567.6 209.6 ^ ^ ^ ^ ^ ^ ^ ^ ^ Ascension 514.6 174.0 61.5 54.6 26.1 ^ ^ ^ ^ ^ ^ Assumption 636.3 147.8 125.8 103.8 ^ ^ ^ ^ ^ ^ ^ Avoyelles 669.9 193.5 138.9 74.7 ^ ^ ^ ^ ^ ^ ^ Beauregard 574.2 222.3 ^ ^ ^ ^ ^ ^ ^ ^ ^ Bienville 685.4 254.2 100.6 ^ ^ ^ ^ ^ ^ ^ ^ Bossier 502.8 179.7 61.7 56.6 26.3 ^ ^ ^ ^ ^ ^ Caddo 592.8 164.5 105.4 65.5 26.3 25.6 20.7 13.2 16.2 16.4 23.6 Calcasieu 621.0 198.0 104.6 66.2 27.5 29.4 20.6 16.2 13.9 ^ 15.5 Caldwell 495.5 ^ ^ ^ ^ ^ ^ ^ ^ ^ ^ Cameron ^ ^ ^ ^ ^ ^ ^ ^ ^ ^ ^ Catahoula 879.5 236.7 ^ ^ ^ ^ ^ ^ ^ ^ ^ Claiborne 731.8 223.8 153.4 ^ ^ ^ ^ ^ ^ ^ ^ Concordia 485.1 167.3 112.4 ^ ^ ^ ^ ^ ^ ^ ^ De Soto 728.1 214.2 107.1 80.4 ^ ^ ^ ^ ^ ^ ^ East Baton Rouge 602.8 197.0 83.3 52.1 30.9 28.8 18.5 15.6 18.0 20.6 19.8 East Carroll 703.1 285.5 ^ ^ ^ ^ ^ ^ ^ ^ ^ East Feliciana 652.9 221.7 108.8 66.3 ^ ^ ^ ^ ^ ^ ^ Evangeline 594.3 122.4 110.8 84.2 ^ ^ ^ ^ ^ ^ ^ Franklin 709.3 259.6 ^ ^ ^ ^ ^ ^ ^ ^ ^ Grant 476.7 ^ ^ ^ ^ ^ ^ ^ ^ ^ ^ Iberia 613.5 149.6 100.3 93.4 ^ ^ 36.4 ^ ^ ^ ^ Iberville 757.1 250.2 105.2 60.3 ^ ^ ^ ^ ^ ^ ^ Jackson 583.4 140.6 128.9 ^ ^ ^ ^ ^ ^ ^ ^ Jefferson 586.4 183.9 100.2 53.1 27.7 26.9 18.5 17.6 23.1 17.9 12.2
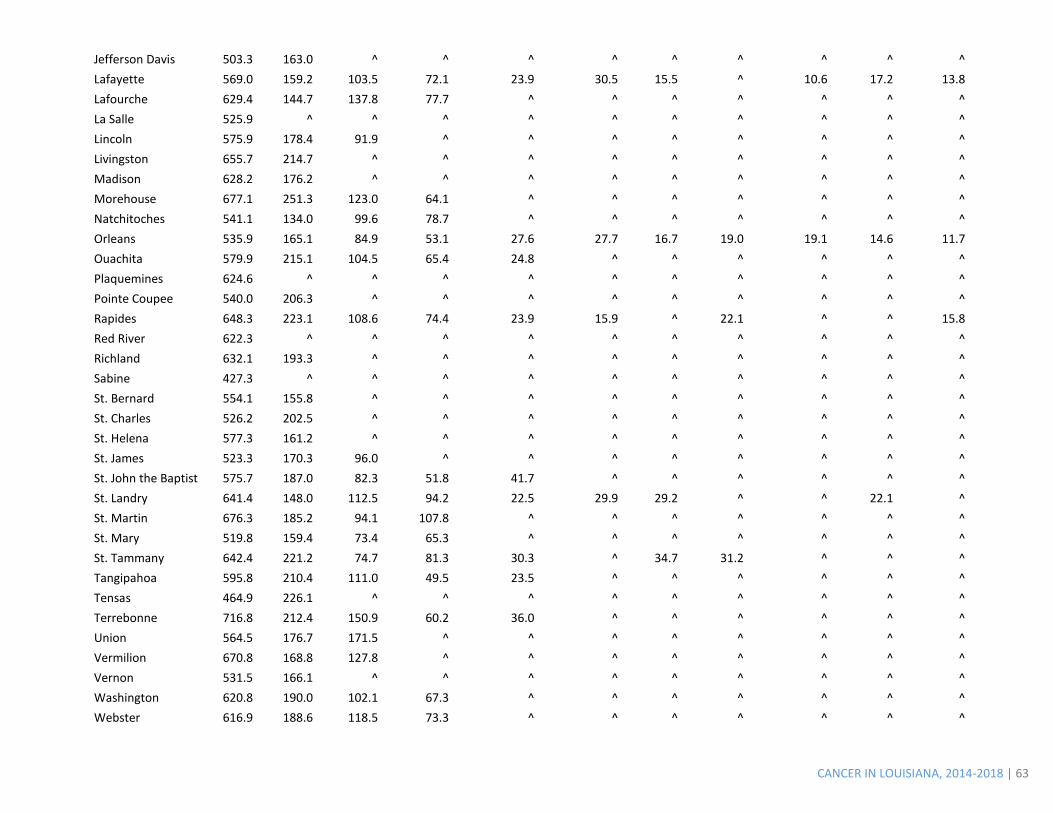
CANCER IN LOUISIANA, 2014-2018 | 63
Jefferson Davis 503.3 163.0 ^ ^ ^ ^ ^ ^ ^ ^ ^ Lafayette 569.0 159.2 103.5 72.1 23.9 30.5 15.5 ^ 10.6 17.2 13.8 Lafourche 629.4 144.7 137.8 77.7 ^ ^ ^ ^ ^ ^ ^ La Salle 525.9 ^ ^ ^ ^ ^ ^ ^ ^ ^ ^ Lincoln 575.9 178.4 91.9 ^ ^ ^ ^ ^ ^ ^ ^ Livingston 655.7 214.7 ^ ^ ^ ^ ^ ^ ^ ^ ^ Madison 628.2 176.2 ^ ^ ^ ^ ^ ^ ^ ^ ^ Morehouse 677.1 251.3 123.0 64.1 ^ ^ ^ ^ ^ ^ ^ Natchitoches 541.1 134.0 99.6 78.7 ^ ^ ^ ^ ^ ^ ^ Orleans 535.9 165.1 84.9 53.1 27.6 27.7 16.7 19.0 19.1 14.6 11.7 Ouachita 579.9 215.1 104.5 65.4 24.8 ^ ^ ^ ^ ^ ^ Plaquemines 624.6 ^ ^ ^ ^ ^ ^ ^ ^ ^ ^ Pointe Coupee 540.0 206.3 ^ ^ ^ ^ ^ ^ ^ ^ ^ Rapides 648.3 223.1 108.6 74.4 23.9 15.9 ^ 22.1 ^ ^ 15.8 Red River 622.3 ^ ^ ^ ^ ^ ^ ^ ^ ^ ^ Richland 632.1 193.3 ^ ^ ^ ^ ^ ^ ^ ^ ^ Sabine 427.3 ^ ^ ^ ^ ^ ^ ^ ^ ^ ^ St. Bernard 554.1 155.8 ^ ^ ^ ^ ^ ^ ^ ^ ^ St. Charles 526.2 202.5 ^ ^ ^ ^ ^ ^ ^ ^ ^ St. Helena 577.3 161.2 ^ ^ ^ ^ ^ ^ ^ ^ ^ St. James 523.3 170.3 96.0 ^ ^ ^ ^ ^ ^ ^ ^ St. John the Baptist 575.7 187.0 82.3 51.8 41.7 ^ ^ ^ ^ ^ ^ St. Landry 641.4 148.0 112.5 94.2 22.5 29.9 29.2 ^ ^ 22.1 ^ St. Martin 676.3 185.2 94.1 107.8 ^ ^ ^ ^ ^ ^ ^ St. Mary 519.8 159.4 73.4 65.3 ^ ^ ^ ^ ^ ^ ^ St. Tammany 642.4 221.2 74.7 81.3 30.3 ^ 34.7 31.2 ^ ^ ^ Tangipahoa 595.8 210.4 111.0 49.5 23.5 ^ ^ ^ ^ ^ ^ Tensas 464.9 226.1 ^ ^ ^ ^ ^ ^ ^ ^ ^ Terrebonne 716.8 212.4 150.9 60.2 36.0 ^ ^ ^ ^ ^ ^ Union 564.5 176.7 171.5 ^ ^ ^ ^ ^ ^ ^ ^ Vermilion 670.8 168.8 127.8 ^ ^ ^ ^ ^ ^ ^ ^ Vernon 531.5 166.1 ^ ^ ^ ^ ^ ^ ^ ^ ^ Washington 620.8 190.0 102.1 67.3 ^ ^ ^ ^ ^ ^ ^ Webster 616.9 188.6 118.5 73.3 ^ ^ ^ ^ ^ ^ ^
CANCER IN LOUISIANA, 2014-2018 | 64
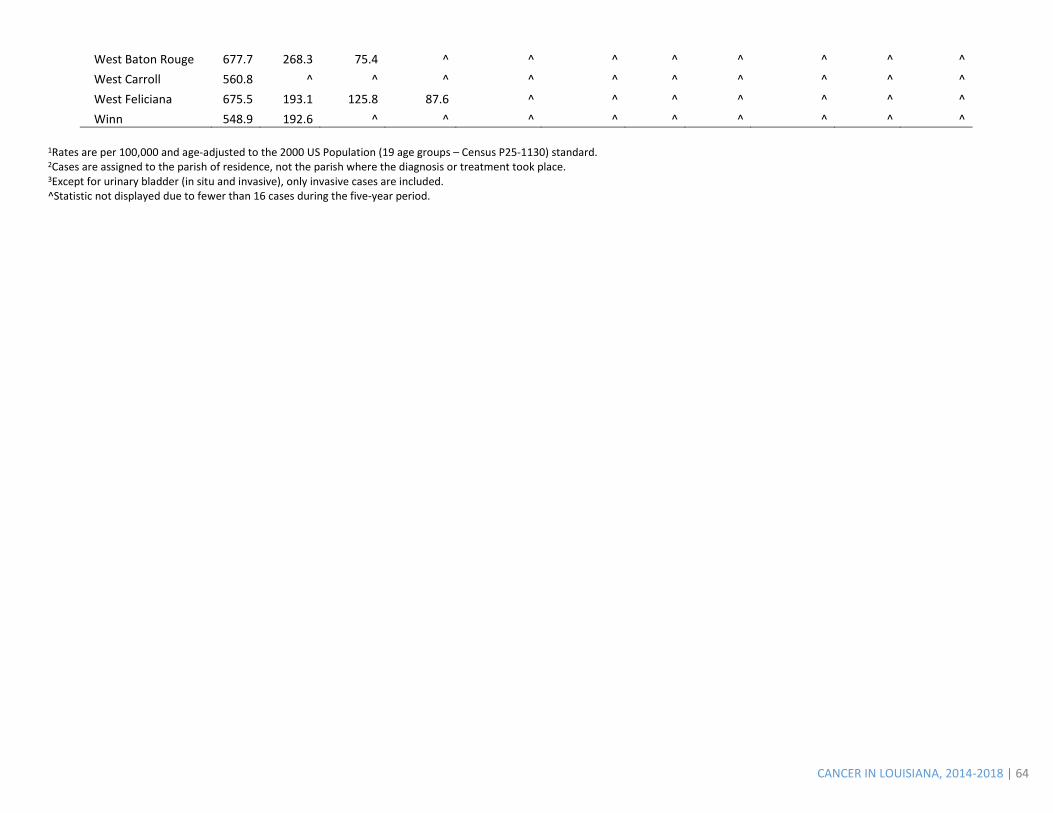
West Baton Rouge 677.7 268.3 75.4 ^ ^ ^ ^ ^ ^ ^ ^ West Carroll 560.8 ^ ^ ^ ^ ^ ^ ^ ^ ^ ^ West Feliciana 675.5 193.1 125.8 87.6 ^ ^ ^ ^ ^ ^ ^ Winn 548.9 192.6 ^ ^ ^ ^ ^ ^ ^ ^ ^
1Rates are per 100,000 and age-adjusted to the 2000 US Population (19 age groups – Census P25-1130) standard. 2Cases are assigned to the parish of residence, not the parish where the diagnosis or treatment took place. 3Except for urinary bladder (in situ and invasive), only invasive cases are included. ^Statistic not displayed due to fewer than 16 cases during the five-year period.
CANCER IN LOUISIANA, 2014-2018 | 65
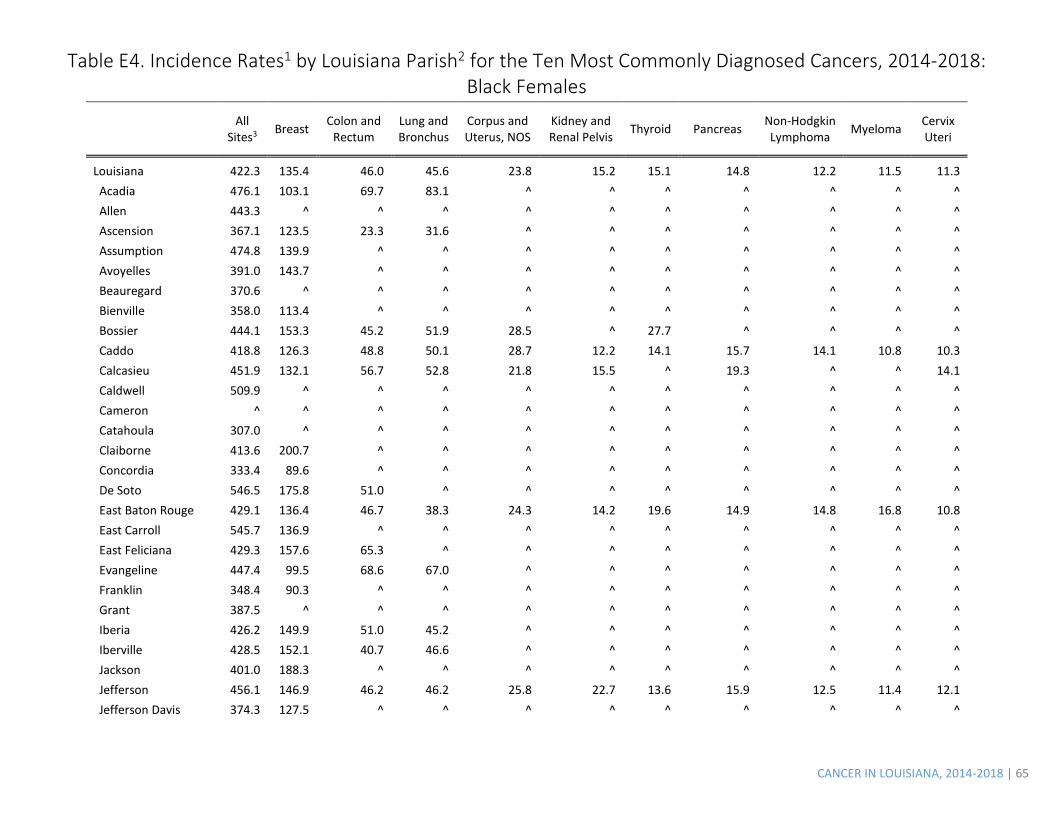
Table E4. Incidence Rates1 by Louisiana Parish2 for the Ten Most Commonly Diagnosed Cancers, 2014-2018: Black Females
All Sites3 Breast Colon and
Rectum Lung and Bronchus
Corpus and Uterus, NOS
Kidney and Renal Pelvis Thyroid Pancreas Non-Hodgkin
Lymphoma Myeloma Cervix Uteri
Louisiana 422.3 135.4 46.0 45.6 23.8 15.2 15.1 14.8 12.2 11.5 11.3 Acadia 476.1 103.1 69.7 83.1 ^ ^ ^ ^ ^ ^ ^ Allen 443.3 ^ ^ ^ ^ ^ ^ ^ ^ ^ ^ Ascension 367.1 123.5 23.3 31.6 ^ ^ ^ ^ ^ ^ ^ Assumption 474.8 139.9 ^ ^ ^ ^ ^ ^ ^ ^ ^ Avoyelles 391.0 143.7 ^ ^ ^ ^ ^ ^ ^ ^ ^ Beauregard 370.6 ^ ^ ^ ^ ^ ^ ^ ^ ^ ^ Bienville 358.0 113.4 ^ ^ ^ ^ ^ ^ ^ ^ ^ Bossier 444.1 153.3 45.2 51.9 28.5 ^ 27.7 ^ ^ ^ ^ Caddo 418.8 126.3 48.8 50.1 28.7 12.2 14.1 15.7 14.1 10.8 10.3 Calcasieu 451.9 132.1 56.7 52.8 21.8 15.5 ^ 19.3 ^ ^ 14.1 Caldwell 509.9 ^ ^ ^ ^ ^ ^ ^ ^ ^ ^ Cameron ^ ^ ^ ^ ^ ^ ^ ^ ^ ^ ^ Catahoula 307.0 ^ ^ ^ ^ ^ ^ ^ ^ ^ ^ Claiborne 413.6 200.7 ^ ^ ^ ^ ^ ^ ^ ^ ^ Concordia 333.4 89.6 ^ ^ ^ ^ ^ ^ ^ ^ ^ De Soto 546.5 175.8 51.0 ^ ^ ^ ^ ^ ^ ^ ^ East Baton Rouge 429.1 136.4 46.7 38.3 24.3 14.2 19.6 14.9 14.8 16.8 10.8 East Carroll 545.7 136.9 ^ ^ ^ ^ ^ ^ ^ ^ ^ East Feliciana 429.3 157.6 65.3 ^ ^ ^ ^ ^ ^ ^ ^ Evangeline 447.4 99.5 68.6 67.0 ^ ^ ^ ^ ^ ^ ^ Franklin 348.4 90.3 ^ ^ ^ ^ ^ ^ ^ ^ ^ Grant 387.5 ^ ^ ^ ^ ^ ^ ^ ^ ^ ^ Iberia 426.2 149.9 51.0 45.2 ^ ^ ^ ^ ^ ^ ^ Iberville 428.5 152.1 40.7 46.6 ^ ^ ^ ^ ^ ^ ^ Jackson 401.0 188.3 ^ ^ ^ ^ ^ ^ ^ ^ ^ Jefferson 456.1 146.9 46.2 46.2 25.8 22.7 13.6 15.9 12.5 11.4 12.1 Jefferson Davis 374.3 127.5 ^ ^ ^ ^ ^ ^ ^ ^ ^
CANCER IN LOUISIANA, 2014-2018 | 66
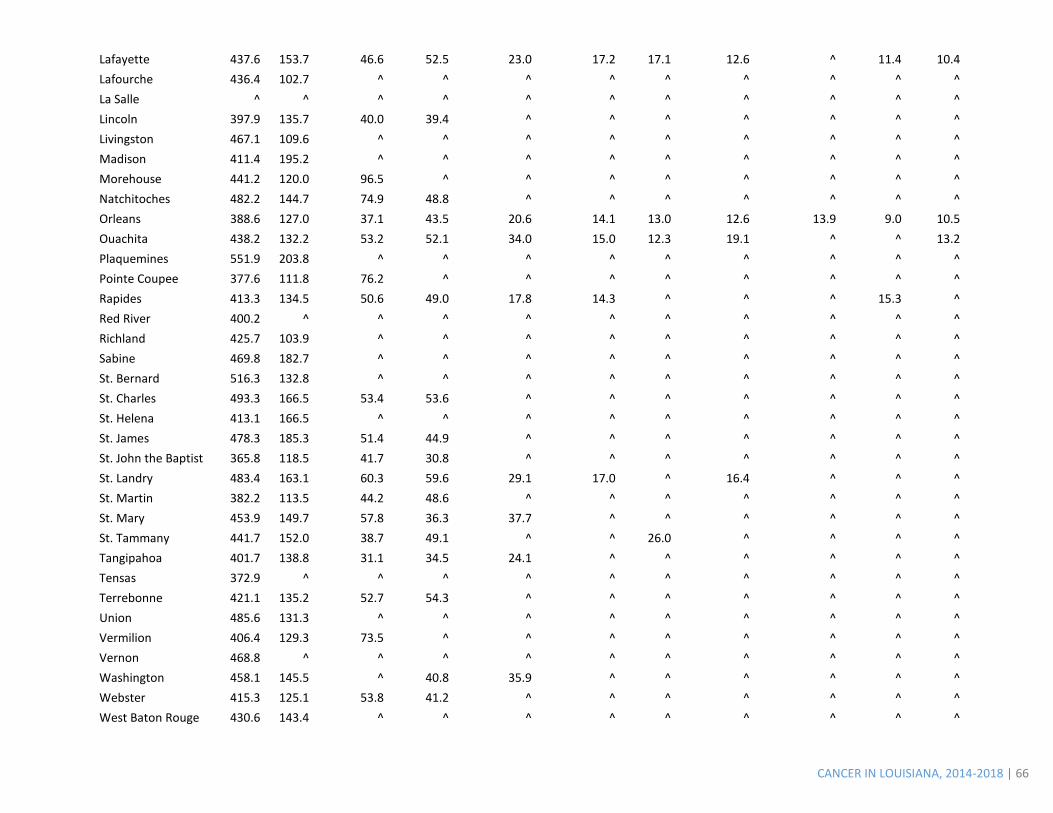
Lafayette 437.6 153.7 46.6 52.5 23.0 17.2 17.1 12.6 ^ 11.4 10.4 Lafourche 436.4 102.7 ^ ^ ^ ^ ^ ^ ^ ^ ^ La Salle ^ ^ ^ ^ ^ ^ ^ ^ ^ ^ ^ Lincoln 397.9 135.7 40.0 39.4 ^ ^ ^ ^ ^ ^ ^ Livingston 467.1 109.6 ^ ^ ^ ^ ^ ^ ^ ^ ^ Madison 411.4 195.2 ^ ^ ^ ^ ^ ^ ^ ^ ^ Morehouse 441.2 120.0 96.5 ^ ^ ^ ^ ^ ^ ^ ^ Natchitoches 482.2 144.7 74.9 48.8 ^ ^ ^ ^ ^ ^ ^ Orleans 388.6 127.0 37.1 43.5 20.6 14.1 13.0 12.6 13.9 9.0 10.5 Ouachita 438.2 132.2 53.2 52.1 34.0 15.0 12.3 19.1 ^ ^ 13.2 Plaquemines 551.9 203.8 ^ ^ ^ ^ ^ ^ ^ ^ ^ Pointe Coupee 377.6 111.8 76.2 ^ ^ ^ ^ ^ ^ ^ ^ Rapides 413.3 134.5 50.6 49.0 17.8 14.3 ^ ^ ^ 15.3 ^ Red River 400.2 ^ ^ ^ ^ ^ ^ ^ ^ ^ ^ Richland 425.7 103.9 ^ ^ ^ ^ ^ ^ ^ ^ ^ Sabine 469.8 182.7 ^ ^ ^ ^ ^ ^ ^ ^ ^ St. Bernard 516.3 132.8 ^ ^ ^ ^ ^ ^ ^ ^ ^ St. Charles 493.3 166.5 53.4 53.6 ^ ^ ^ ^ ^ ^ ^ St. Helena 413.1 166.5 ^ ^ ^ ^ ^ ^ ^ ^ ^ St. James 478.3 185.3 51.4 44.9 ^ ^ ^ ^ ^ ^ ^ St. John the Baptist 365.8 118.5 41.7 30.8 ^ ^ ^ ^ ^ ^ ^ St. Landry 483.4 163.1 60.3 59.6 29.1 17.0 ^ 16.4 ^ ^ ^ St. Martin 382.2 113.5 44.2 48.6 ^ ^ ^ ^ ^ ^ ^ St. Mary 453.9 149.7 57.8 36.3 37.7 ^ ^ ^ ^ ^ ^ St. Tammany 441.7 152.0 38.7 49.1 ^ ^ 26.0 ^ ^ ^ ^ Tangipahoa 401.7 138.8 31.1 34.5 24.1 ^ ^ ^ ^ ^ ^ Tensas 372.9 ^ ^ ^ ^ ^ ^ ^ ^ ^ ^ Terrebonne 421.1 135.2 52.7 54.3 ^ ^ ^ ^ ^ ^ ^ Union 485.6 131.3 ^ ^ ^ ^ ^ ^ ^ ^ ^ Vermilion 406.4 129.3 73.5 ^ ^ ^ ^ ^ ^ ^ ^ Vernon 468.8 ^ ^ ^ ^ ^ ^ ^ ^ ^ ^ Washington 458.1 145.5 ^ 40.8 35.9 ^ ^ ^ ^ ^ ^ Webster 415.3 125.1 53.8 41.2 ^ ^ ^ ^ ^ ^ ^ West Baton Rouge 430.6 143.4 ^ ^ ^ ^ ^ ^ ^ ^ ^
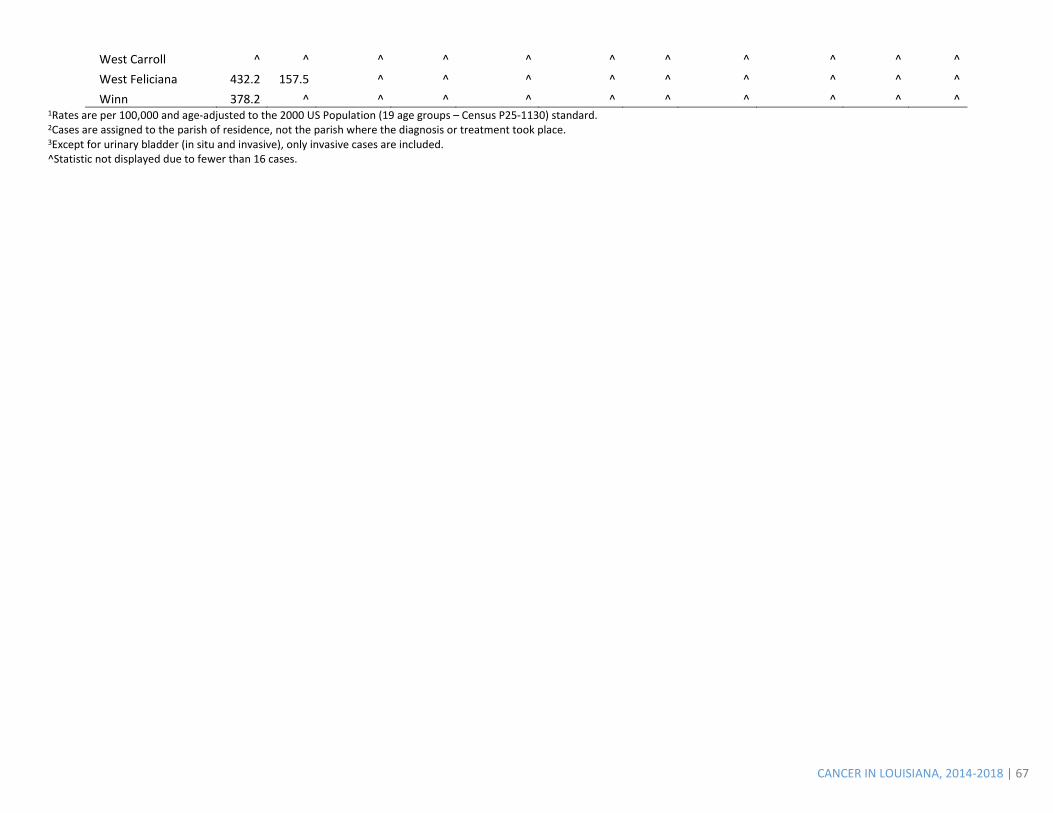
CANCER IN LOUISIANA, 2014-2018 | 67
West Carroll ^ ^ ^ ^ ^ ^ ^ ^ ^ ^ ^ West Feliciana 432.2 157.5 ^ ^ ^ ^ ^ ^ ^ ^ ^ Winn 378.2 ^ ^ ^ ^ ^ ^ ^ ^ ^ ^
1Rates are per 100,000 and age-adjusted to the 2000 US Population (19 age groups – Census P25-1130) standard. 2Cases are assigned to the parish of residence, not the parish where the diagnosis or treatment took place. 3Except for urinary bladder (in situ and invasive), only invasive cases are included. ^Statistic not displayed due to fewer than 16 cases.
CANCER IN LOUISIANA, 2014-2018 | 68
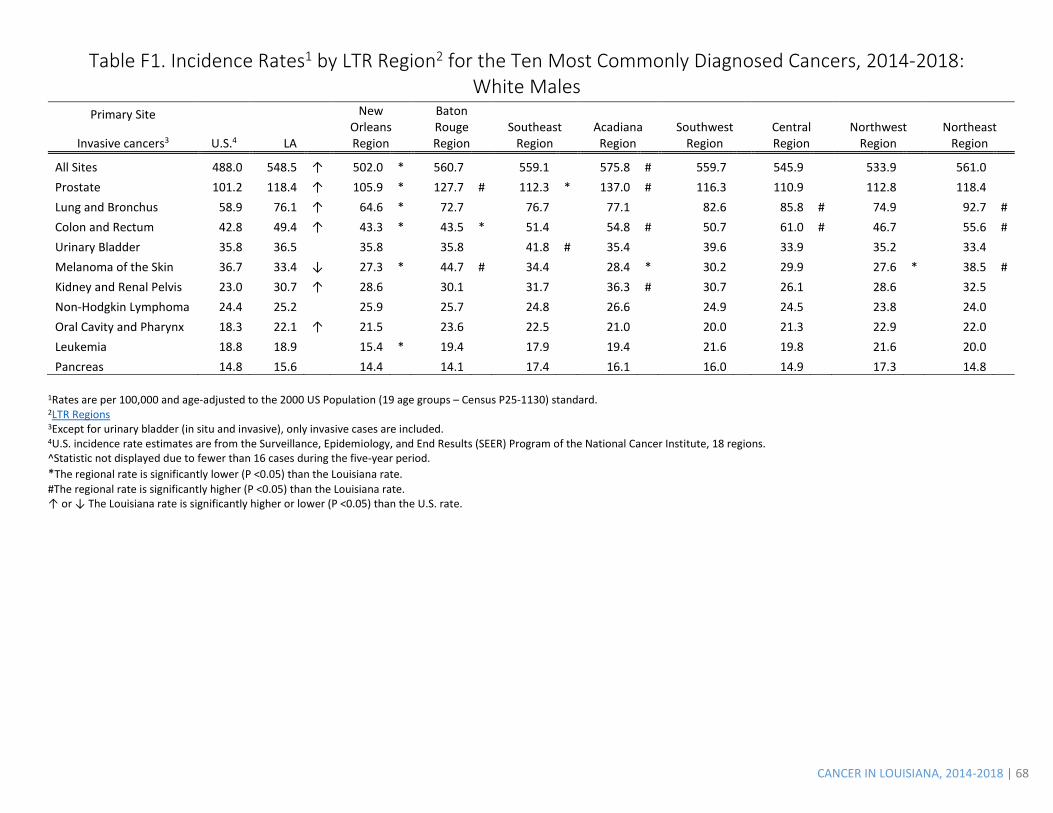
Table F1. Incidence Rates1 by LTR Region2 for the Ten Most Commonly Diagnosed Cancers, 2014-2018: White Males
Primary Site
U.S.4 LA
New Orleans Region
Baton Rouge Region
Southeast Region
Acadiana Region
Southwest Region
Central Region
Northwest Region
Northeast Region Invasive cancers3
All Sites 488.0 548.5 ↑ 502.0 * 560.7 559.1 575.8 # 559.7 545.9 533.9 561.0 Prostate 101.2 118.4 ↑ 105.9 * 127.7 # 112.3 * 137.0 # 116.3 110.9 112.8 118.4 Lung and Bronchus 58.9 76.1 ↑ 64.6 * 72.7 76.7 77.1 82.6 85.8 # 74.9 92.7 # Colon and Rectum 42.8 49.4 ↑ 43.3 * 43.5 * 51.4 54.8 # 50.7 61.0 # 46.7 55.6 # Urinary Bladder 35.8 36.5 35.8 35.8 41.8 # 35.4 39.6 33.9 35.2 33.4 Melanoma of the Skin 36.7 33.4 ↓ 27.3 * 44.7 # 34.4 28.4 * 30.2 29.9 27.6 * 38.5 # Kidney and Renal Pelvis 23.0 30.7 ↑ 28.6 30.1 31.7 36.3 # 30.7 26.1 28.6 32.5 Non-Hodgkin Lymphoma 24.4 25.2 25.9 25.7 24.8 26.6 24.9 24.5 23.8 24.0 Oral Cavity and Pharynx 18.3 22.1 ↑ 21.5 23.6 22.5 21.0 20.0 21.3 22.9 22.0 Leukemia 18.8 18.9 15.4 * 19.4 17.9 19.4 21.6 19.8 21.6 20.0 Pancreas 14.8 15.6 14.4 14.1 17.4 16.1 16.0 14.9 17.3 14.8
1Rates are per 100,000 and age-adjusted to the 2000 US Population (19 age groups – Census P25-1130) standard. 2LTR Regions 3Except for urinary bladder (in situ and invasive), only invasive cases are included. 4U.S. incidence rate estimates are from the Surveillance, Epidemiology, and End Results (SEER) Program of the National Cancer Institute, 18 regions. ^Statistic not displayed due to fewer than 16 cases during the five-year period. *The regional rate is significantly lower (P <0.05) than the Louisiana rate. #The regional rate is significantly higher (P <0.05) than the Louisiana rate. ↑ or ↓ The Louisiana rate is significantly higher or lower (P <0.05) than the U.S. rate.
CANCER IN LOUISIANA, 2014-2018 | 69
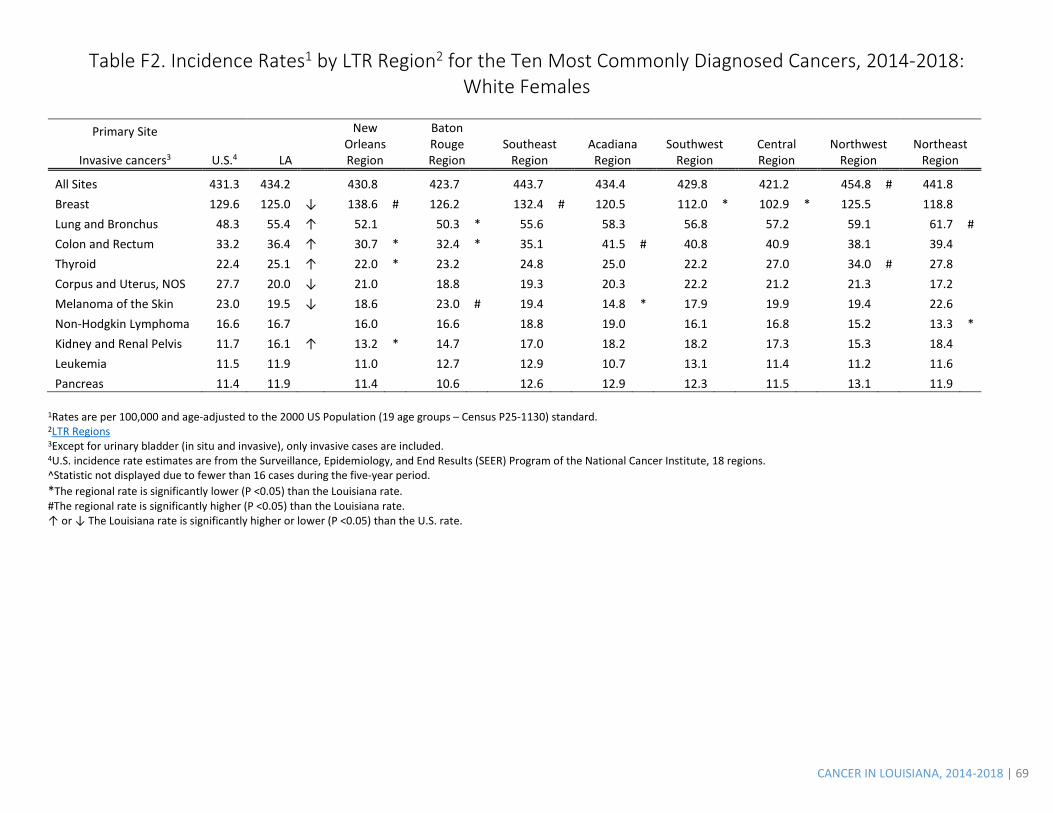
Table F2. Incidence Rates1 by LTR Region2 for the Ten Most Commonly Diagnosed Cancers, 2014-2018: White Females
Primary Site
U.S.4 LA
New Orleans Region
Baton Rouge Region
Southeast Region
Acadiana Region
Southwest Region
Central Region
Northwest Region
Northeast Region Invasive cancers3
All Sites 431.3 434.2 430.8 423.7 443.7 434.4 429.8 421.2 454.8 # 441.8 Breast 129.6 125.0 ↓ 138.6 # 126.2 132.4 # 120.5 112.0 * 102.9 * 125.5 118.8 Lung and Bronchus 48.3 55.4 ↑ 52.1 50.3 * 55.6 58.3 56.8 57.2 59.1 61.7 # Colon and Rectum 33.2 36.4 ↑ 30.7 * 32.4 * 35.1 41.5 # 40.8 40.9 38.1 39.4 Thyroid 22.4 25.1 ↑ 22.0 * 23.2 24.8 25.0 22.2 27.0 34.0 # 27.8 Corpus and Uterus, NOS 27.7 20.0 ↓ 21.0 18.8 19.3 20.3 22.2 21.2 21.3 17.2 Melanoma of the Skin 23.0 19.5 ↓ 18.6 23.0 # 19.4 14.8 * 17.9 19.9 19.4 22.6 Non-Hodgkin Lymphoma 16.6 16.7 16.0 16.6 18.8 19.0 16.1 16.8 15.2 13.3 * Kidney and Renal Pelvis 11.7 16.1 ↑ 13.2 * 14.7 17.0 18.2 18.2 17.3 15.3 18.4 Leukemia 11.5 11.9 11.0 12.7 12.9 10.7 13.1 11.4 11.2 11.6 Pancreas 11.4 11.9 11.4 10.6 12.6 12.9 12.3 11.5 13.1 11.9
1Rates are per 100,000 and age-adjusted to the 2000 US Population (19 age groups – Census P25-1130) standard. 2LTR Regions 3Except for urinary bladder (in situ and invasive), only invasive cases are included. 4U.S. incidence rate estimates are from the Surveillance, Epidemiology, and End Results (SEER) Program of the National Cancer Institute, 18 regions. ^Statistic not displayed due to fewer than 16 cases during the five-year period. *The regional rate is significantly lower (P <0.05) than the Louisiana rate. #The regional rate is significantly higher (P <0.05) than the Louisiana rate. ↑ or ↓ The Louisiana rate is significantly higher or lower (P <0.05) than the U.S. rate.
CANCER IN LOUISIANA, 2014-2018 | 70
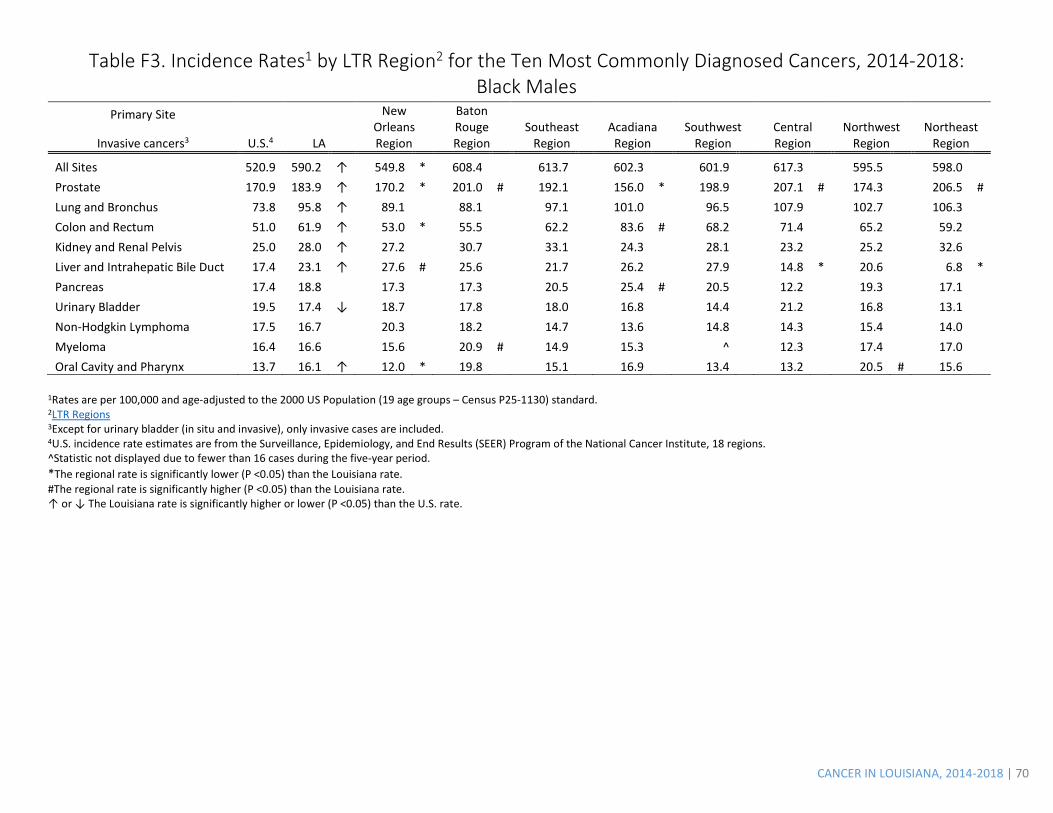
Table F3. Incidence Rates1 by LTR Region2 for the Ten Most Commonly Diagnosed Cancers, 2014-2018: Black Males
Primary Site
U.S.4 LA
New Orleans Region
Baton Rouge Region
Southeast Region
Acadiana Region
Southwest Region
Central Region
Northwest Region
Northeast Region Invasive cancers3
All Sites 520.9 590.2 ↑ 549.8 * 608.4 613.7 602.3 601.9 617.3 595.5 598.0 Prostate 170.9 183.9 ↑ 170.2 * 201.0 # 192.1 156.0 * 198.9 207.1 # 174.3 206.5 # Lung and Bronchus 73.8 95.8 ↑ 89.1 88.1 97.1 101.0 96.5 107.9 102.7 106.3 Colon and Rectum 51.0 61.9 ↑ 53.0 * 55.5 62.2 83.6 # 68.2 71.4 65.2 59.2 Kidney and Renal Pelvis 25.0 28.0 ↑ 27.2 30.7 33.1 24.3 28.1 23.2 25.2 32.6 Liver and Intrahepatic Bile Duct 17.4 23.1 ↑ 27.6 # 25.6 21.7 26.2 27.9 14.8 * 20.6 6.8 * Pancreas 17.4 18.8 17.3 17.3 20.5 25.4 # 20.5 12.2 19.3 17.1 Urinary Bladder 19.5 17.4 ↓ 18.7 17.8 18.0 16.8 14.4 21.2 16.8 13.1 Non-Hodgkin Lymphoma 17.5 16.7 20.3 18.2 14.7 13.6 14.8 14.3 15.4 14.0 Myeloma 16.4 16.6 15.6 20.9 # 14.9 15.3 ^ 12.3 17.4 17.0 Oral Cavity and Pharynx 13.7 16.1 ↑ 12.0 * 19.8 15.1 16.9 13.4 13.2 20.5 # 15.6
1Rates are per 100,000 and age-adjusted to the 2000 US Population (19 age groups – Census P25-1130) standard. 2LTR Regions 3Except for urinary bladder (in situ and invasive), only invasive cases are included. 4U.S. incidence rate estimates are from the Surveillance, Epidemiology, and End Results (SEER) Program of the National Cancer Institute, 18 regions. ^Statistic not displayed due to fewer than 16 cases during the five-year period. *The regional rate is significantly lower (P <0.05) than the Louisiana rate. #The regional rate is significantly higher (P <0.05) than the Louisiana rate. ↑ or ↓ The Louisiana rate is significantly higher or lower (P <0.05) than the U.S. rate.
CANCER IN LOUISIANA, 2014-2018 | 71
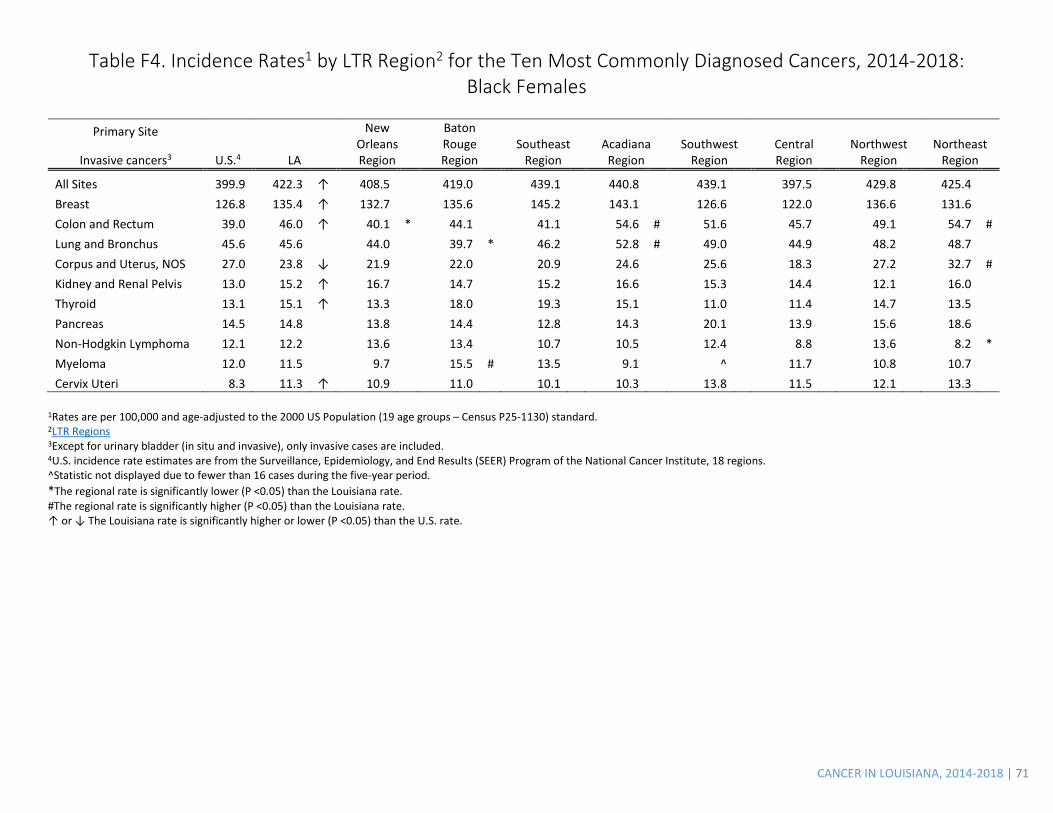
Table F4. Incidence Rates1 by LTR Region2 for the Ten Most Commonly Diagnosed Cancers, 2014-2018: Black Females
Primary Site
U.S.4 LA
New Orleans Region
Baton Rouge Region
Southeast Region
Acadiana Region
Southwest Region
Central Region
Northwest Region
Northeast Region Invasive cancers3
All Sites 399.9 422.3 ↑ 408.5 419.0 439.1 440.8 439.1 397.5 429.8 425.4 Breast 126.8 135.4 ↑ 132.7 135.6 145.2 143.1 126.6 122.0 136.6 131.6 Colon and Rectum 39.0 46.0 ↑ 40.1 * 44.1 41.1 54.6 # 51.6 45.7 49.1 54.7 # Lung and Bronchus 45.6 45.6 44.0 39.7 * 46.2 52.8 # 49.0 44.9 48.2 48.7 Corpus and Uterus, NOS 27.0 23.8 ↓ 21.9 22.0 20.9 24.6 25.6 18.3 27.2 32.7 # Kidney and Renal Pelvis 13.0 15.2 ↑ 16.7 14.7 15.2 16.6 15.3 14.4 12.1 16.0 Thyroid 13.1 15.1 ↑ 13.3 18.0 19.3 15.1 11.0 11.4 14.7 13.5 Pancreas 14.5 14.8 13.8 14.4 12.8 14.3 20.1 13.9 15.6 18.6 Non-Hodgkin Lymphoma 12.1 12.2 13.6 13.4 10.7 10.5 12.4 8.8 13.6 8.2 * Myeloma 12.0 11.5 9.7 15.5 # 13.5 9.1 ^ 11.7 10.8 10.7 Cervix Uteri 8.3 11.3 ↑ 10.9 11.0 10.1 10.3 13.8 11.5 12.1 13.3
1Rates are per 100,000 and age-adjusted to the 2000 US Population (19 age groups – Census P25-1130) standard. 2LTR Regions 3Except for urinary bladder (in situ and invasive), only invasive cases are included. 4U.S. incidence rate estimates are from the Surveillance, Epidemiology, and End Results (SEER) Program of the National Cancer Institute, 18 regions. ^Statistic not displayed due to fewer than 16 cases during the five-year period. *The regional rate is significantly lower (P <0.05) than the Louisiana rate. #The regional rate is significantly higher (P <0.05) than the Louisiana rate. ↑ or ↓ The Louisiana rate is significantly higher or lower (P <0.05) than the U.S. rate.
CANCER IN LOUISIANA, 2014-2018 | 72
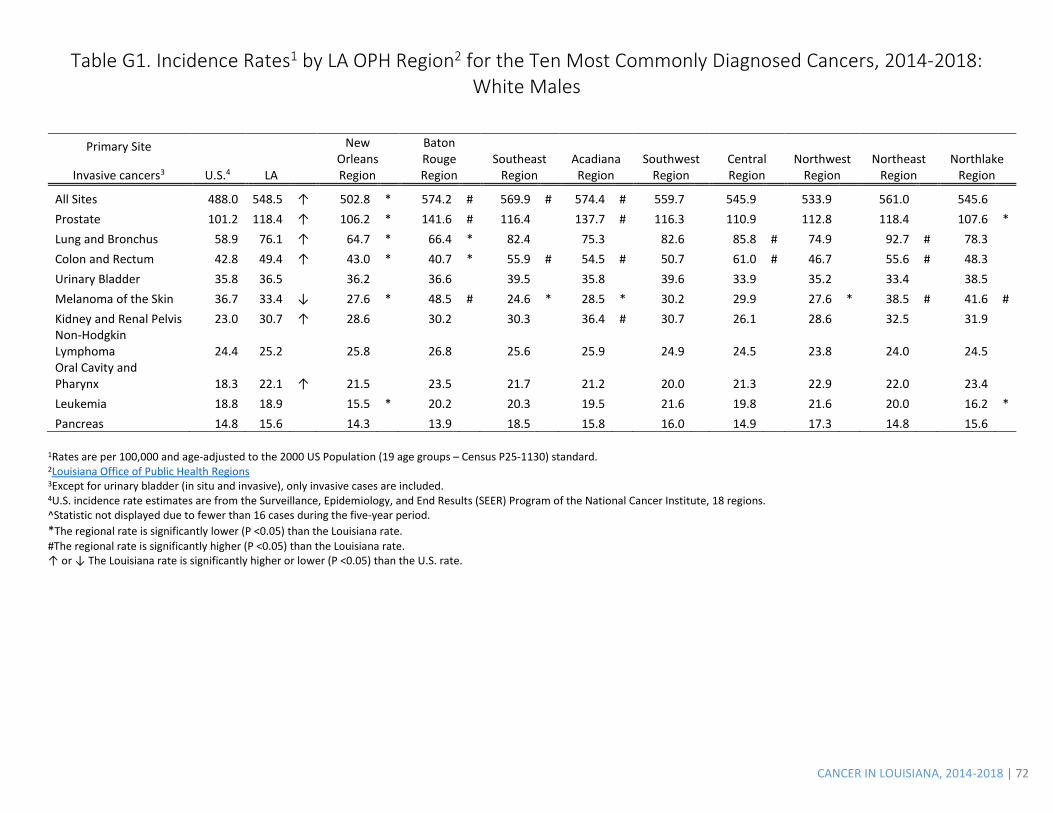
Table G1. Incidence Rates1 by LA OPH Region2 for the Ten Most Commonly Diagnosed Cancers, 2014-2018: White Males
Primary Site
U.S.4 LA
New Orleans Region
Baton Rouge Region
Southeast Region
Acadiana Region
Southwest Region
Central Region
Northwest Region
Northeast Region
Northlake Region Invasive cancers3
All Sites 488.0 548.5 ↑ 502.8 * 574.2 # 569.9 # 574.4 # 559.7 545.9 533.9 561.0 545.6 Prostate 101.2 118.4 ↑ 106.2 * 141.6 # 116.4 137.7 # 116.3 110.9 112.8 118.4 107.6 * Lung and Bronchus 58.9 76.1 ↑ 64.7 * 66.4 * 82.4 75.3 82.6 85.8 # 74.9 92.7 # 78.3 Colon and Rectum 42.8 49.4 ↑ 43.0 * 40.7 * 55.9 # 54.5 # 50.7 61.0 # 46.7 55.6 # 48.3 Urinary Bladder 35.8 36.5 36.2 36.6 39.5 35.8 39.6 33.9 35.2 33.4 38.5 Melanoma of the Skin 36.7 33.4 ↓ 27.6 * 48.5 # 24.6 * 28.5 * 30.2 29.9 27.6 * 38.5 # 41.6 # Kidney and Renal Pelvis 23.0 30.7 ↑ 28.6 30.2 30.3 36.4 # 30.7 26.1 28.6 32.5 31.9 Non-Hodgkin Lymphoma 24.4 25.2 25.8 26.8 25.6 25.9 24.9 24.5 23.8 24.0 24.5 Oral Cavity and Pharynx 18.3 22.1 ↑ 21.5 23.5 21.7 21.2 20.0 21.3 22.9 22.0 23.4 Leukemia 18.8 18.9 15.5 * 20.2 20.3 19.5 21.6 19.8 21.6 20.0 16.2 * Pancreas 14.8 15.6 14.3 13.9 18.5 15.8 16.0 14.9 17.3 14.8 15.6
1Rates are per 100,000 and age-adjusted to the 2000 US Population (19 age groups – Census P25-1130) standard. 2Louisiana Office of Public Health Regions 3Except for urinary bladder (in situ and invasive), only invasive cases are included. 4U.S. incidence rate estimates are from the Surveillance, Epidemiology, and End Results (SEER) Program of the National Cancer Institute, 18 regions. ^Statistic not displayed due to fewer than 16 cases during the five-year period. *The regional rate is significantly lower (P <0.05) than the Louisiana rate. #The regional rate is significantly higher (P <0.05) than the Louisiana rate. ↑ or ↓ The Louisiana rate is significantly higher or lower (P <0.05) than the U.S. rate.
CANCER IN LOUISIANA, 2014-2018 | 73
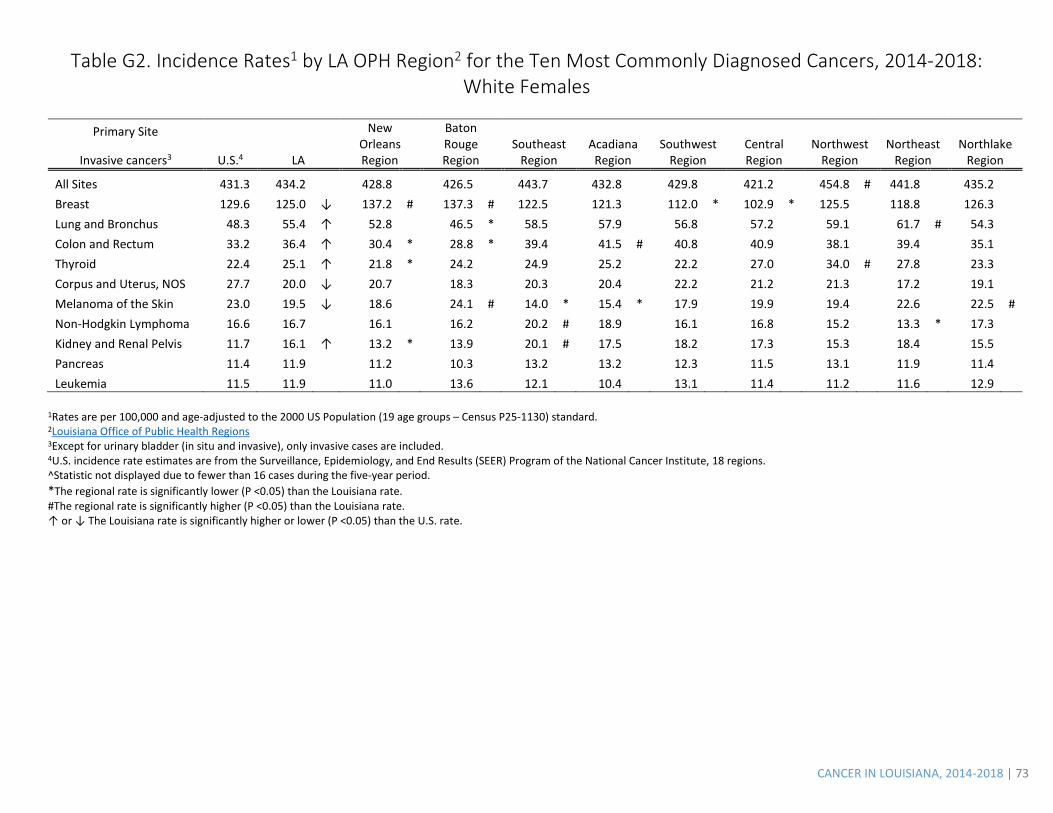
Table G2. Incidence Rates1 by LA OPH Region2 for the Ten Most Commonly Diagnosed Cancers, 2014-2018: White Females
Primary Site
U.S.4 LA
New Orleans Region
Baton Rouge Region
Southeast Region
Acadiana Region
Southwest Region
Central Region
Northwest Region
Northeast Region
Northlake Region Invasive cancers3
All Sites 431.3 434.2 428.8 426.5 443.7 432.8 429.8 421.2 454.8 # 441.8 435.2 Breast 129.6 125.0 ↓ 137.2 # 137.3 # 122.5 121.3 112.0 * 102.9 * 125.5 118.8 126.3 Lung and Bronchus 48.3 55.4 ↑ 52.8 46.5 * 58.5 57.9 56.8 57.2 59.1 61.7 # 54.3 Colon and Rectum 33.2 36.4 ↑ 30.4 * 28.8 * 39.4 41.5 # 40.8 40.9 38.1 39.4 35.1 Thyroid 22.4 25.1 ↑ 21.8 * 24.2 24.9 25.2 22.2 27.0 34.0 # 27.8 23.3 Corpus and Uterus, NOS 27.7 20.0 ↓ 20.7 18.3 20.3 20.4 22.2 21.2 21.3 17.2 19.1 Melanoma of the Skin 23.0 19.5 ↓ 18.6 24.1 # 14.0 * 15.4 * 17.9 19.9 19.4 22.6 22.5 # Non-Hodgkin Lymphoma 16.6 16.7 16.1 16.2 20.2 # 18.9 16.1 16.8 15.2 13.3 * 17.3 Kidney and Renal Pelvis 11.7 16.1 ↑ 13.2 * 13.9 20.1 # 17.5 18.2 17.3 15.3 18.4 15.5 Pancreas 11.4 11.9 11.2 10.3 13.2 13.2 12.3 11.5 13.1 11.9 11.4 Leukemia 11.5 11.9 11.0 13.6 12.1 10.4 13.1 11.4 11.2 11.6 12.9
1Rates are per 100,000 and age-adjusted to the 2000 US Population (19 age groups – Census P25-1130) standard. 2Louisiana Office of Public Health Regions 3Except for urinary bladder (in situ and invasive), only invasive cases are included. 4U.S. incidence rate estimates are from the Surveillance, Epidemiology, and End Results (SEER) Program of the National Cancer Institute, 18 regions. ^Statistic not displayed due to fewer than 16 cases during the five-year period. *The regional rate is significantly lower (P <0.05) than the Louisiana rate. #The regional rate is significantly higher (P <0.05) than the Louisiana rate. ↑ or ↓ The Louisiana rate is significantly higher or lower (P <0.05) than the U.S. rate.

CANCER IN LOUISIANA, 2014-2018 | 74
Table G3. Incidence Rates1 by LA OPH Region2 for the Ten Most Commonly Diagnosed Cancers, 2014-2018: Black Males
Primary Site
U.S.4 LA
New Orleans Region
Baton Rouge Region
Southeast Region
Acadiana Region
Southwest Region
Central Region
Northwest Region
Northeast Region
Northlake Region Invasive cancers3
All Sites 520.9 590.2 ↑ 551.0 * 609.8 586.7 613.0 601.9 617.3 595.5 598.0 615.8 Prostate 170.9 183.9 ↑ 169.7 * 202.8 # 178.6 155.4 * 198.9 207.1 # 174.3 206.5 # 205.3 # Lung and Bronchus 73.8 95.8 ↑ 89.3 84.2 * 99.1 104.7 96.5 107.9 102.7 106.3 93.4 Colon and Rectum 51.0 61.9 ↑ 53.3 * 54.7 59.0 86.0 # 68.2 71.4 65.2 59.2 64.5 Kidney and Renal Pelvis 25.0 28.0 ↑ 27.5 31.4 32.2 23.7 28.1 23.2 25.2 32.6 28.4 Liver and Intrahepatic Bile Duct 17.4 23.1 ↑ 27.4 # 26.8 21.1 27.9 27.9 14.8 * 20.6 6.8 * 19.5 Pancreas 17.4 18.8 17.3 17.8 15.3 26.4 # 20.5 12.2 19.3 17.1 23.5 Urinary Bladder 19.5 17.4 ↓ 18.6 17.2 15.8 17.5 14.4 21.2 16.8 13.1 20.7 Non-Hodgkin Lymphoma 17.5 16.7 20.5 # 18.1 13.6 13.9 14.8 14.3 15.4 14.0 16.3 Myeloma 16.4 16.6 15.4 21.3 # 14.4 16.5 ^ 12.3 17.4 17.0 17.1 Oral Cavity and Pharynx 13.7 16.1 ↑ 12.2 * 19.8 15.5 16.1 13.4 13.2 20.5 # 15.6 17.9
1Rates are per 100,000 and age-adjusted to the 2000 US Population (19 age groups – Census P25-1130) standard. 2Louisiana Office of Public Health Regions 3Except for urinary bladder (in situ and invasive), only invasive cases are included. 4U.S. incidence rate estimates are from the Surveillance, Epidemiology, and End Results (SEER) Program of the National Cancer Institute, 18 regions. ^Statistic not displayed due to fewer than 16 cases during the five-year period. *The regional rate is significantly lower (P <0.05) than the Louisiana rate. #The regional rate is significantly higher (P <0.05) than the Louisiana rate. ↑ or ↓ The Louisiana rate is significantly higher or lower (P <0.05) than the U.S. rate.
CANCER IN LOUISIANA, 2014-2018 | 75
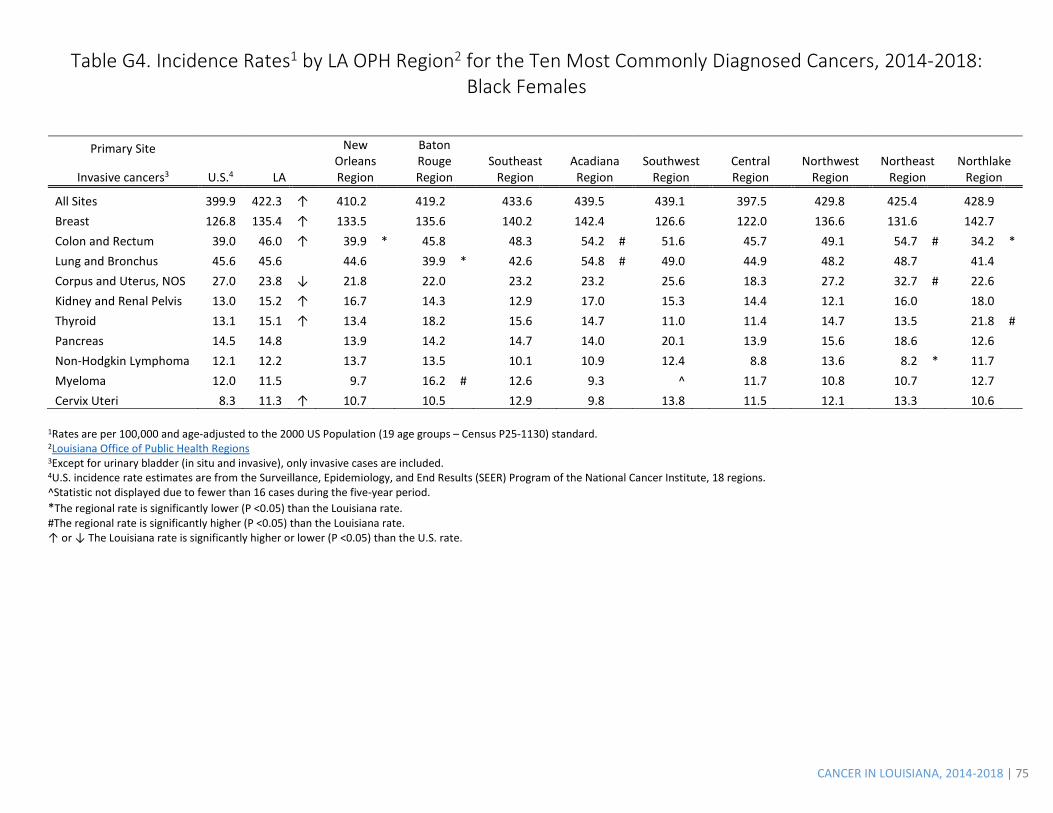
Table G4. Incidence Rates1 by LA OPH Region2 for the Ten Most Commonly Diagnosed Cancers, 2014-2018: Black Females
Primary Site
U.S.4 LA
New Orleans Region
Baton Rouge Region
Southeast Region
Acadiana Region
Southwest Region
Central Region
Northwest Region
Northeast Region
Northlake Region Invasive cancers3
All Sites 399.9 422.3 ↑ 410.2 419.2 433.6 439.5 439.1 397.5 429.8 425.4 428.9 Breast 126.8 135.4 ↑ 133.5 135.6 140.2 142.4 126.6 122.0 136.6 131.6 142.7 Colon and Rectum 39.0 46.0 ↑ 39.9 * 45.8 48.3 54.2 # 51.6 45.7 49.1 54.7 # 34.2 * Lung and Bronchus 45.6 45.6 44.6 39.9 * 42.6 54.8 # 49.0 44.9 48.2 48.7 41.4 Corpus and Uterus, NOS 27.0 23.8 ↓ 21.8 22.0 23.2 23.2 25.6 18.3 27.2 32.7 # 22.6 Kidney and Renal Pelvis 13.0 15.2 ↑ 16.7 14.3 12.9 17.0 15.3 14.4 12.1 16.0 18.0 Thyroid 13.1 15.1 ↑ 13.4 18.2 15.6 14.7 11.0 11.4 14.7 13.5 21.8 # Pancreas 14.5 14.8 13.9 14.2 14.7 14.0 20.1 13.9 15.6 18.6 12.6 Non-Hodgkin Lymphoma 12.1 12.2 13.7 13.5 10.1 10.9 12.4 8.8 13.6 8.2 * 11.7 Myeloma 12.0 11.5 9.7 16.2 # 12.6 9.3 ^ 11.7 10.8 10.7 12.7 Cervix Uteri 8.3 11.3 ↑ 10.7 10.5 12.9 9.8 13.8 11.5 12.1 13.3 10.6
1Rates are per 100,000 and age-adjusted to the 2000 US Population (19 age groups – Census P25-1130) standard. 2Louisiana Office of Public Health Regions 3Except for urinary bladder (in situ and invasive), only invasive cases are included. 4U.S. incidence rate estimates are from the Surveillance, Epidemiology, and End Results (SEER) Program of the National Cancer Institute, 18 regions. ^Statistic not displayed due to fewer than 16 cases during the five-year period. *The regional rate is significantly lower (P <0.05) than the Louisiana rate. #The regional rate is significantly higher (P <0.05) than the Louisiana rate. ↑ or ↓ The Louisiana rate is significantly higher or lower (P <0.05) than the U.S. rate.
CANCER IN LOUISIANA, 2014-2018 | 76
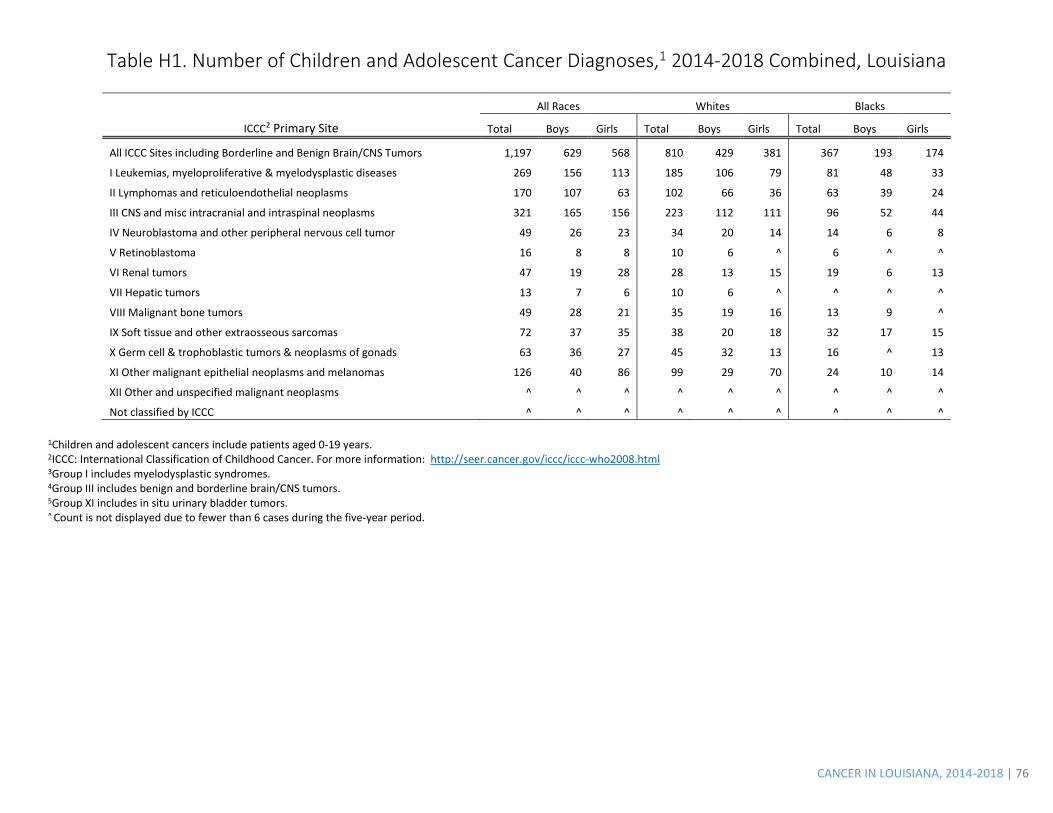
Table H1. Number of Children and Adolescent Cancer Diagnoses,1 2014-2018 Combined, Louisiana
All Races Whites Blacks
ICCC2 Primary Site Total Boys Girls Total Boys Girls Total Boys Girls
All ICCC Sites including Borderline and Benign Brain/CNS Tumors 1,197 629 568 810 429 381 367 193 174
I Leukemias, myeloproliferative & myelodysplastic diseases 269 156 113 185 106 79 81 48 33
II Lymphomas and reticuloendothelial neoplasms 170 107 63 102 66 36 63 39 24
III CNS and misc intracranial and intraspinal neoplasms 321 165 156 223 112 111 96 52 44
IV Neuroblastoma and other peripheral nervous cell tumor 49 26 23 34 20 14 14 6 8
V Retinoblastoma 16 8 8 10 6 ^ 6 ^ ^
VI Renal tumors 47 19 28 28 13 15 19 6 13
VII Hepatic tumors 13 7 6 10 6 ^ ^ ^ ^
VIII Malignant bone tumors 49 28 21 35 19 16 13 9 ^
IX Soft tissue and other extraosseous sarcomas 72 37 35 38 20 18 32 17 15
X Germ cell & trophoblastic tumors & neoplasms of gonads 63 36 27 45 32 13 16 ^ 13
XI Other malignant epithelial neoplasms and melanomas 126 40 86 99 29 70 24 10 14
XII Other and unspecified malignant neoplasms ^ ^ ^ ^ ^ ^ ^ ^ ^
Not classified by ICCC ^ ^ ^ ^ ^ ^ ^ ^ ^ 1Children and adolescent cancers include patients aged 0-19 years. 2ICCC: International Classification of Childhood Cancer. For more information: http://seer.cancer.gov/iccc/iccc-who2008.html 3Group I includes myelodysplastic syndromes. 4Group III includes benign and borderline brain/CNS tumors. 5Group XI includes in situ urinary bladder tumors. ^ Count is not displayed due to fewer than 6 cases during the five-year period.
CANCER IN LOUISIANA, 2014-2018 | 77
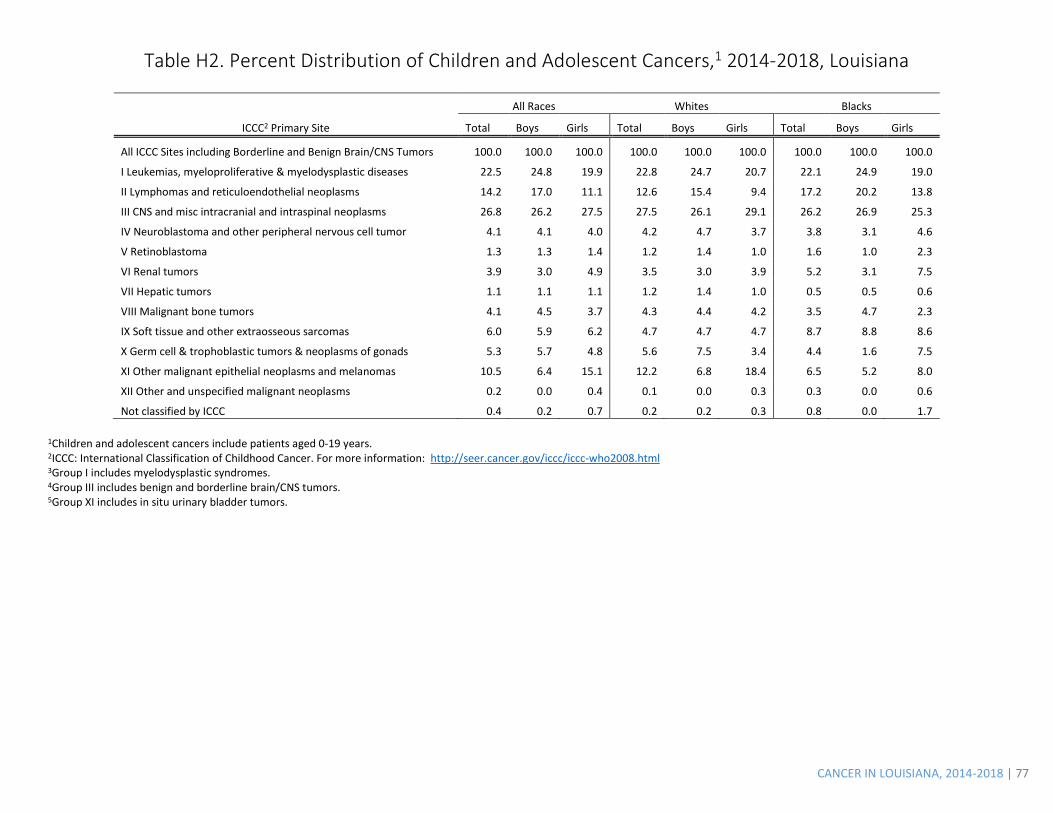
Table H2. Percent Distribution of Children and Adolescent Cancers,1 2014-2018, Louisiana
All Races Whites Blacks
ICCC2 Primary Site Total Boys Girls Total Boys Girls Total Boys Girls
All ICCC Sites including Borderline and Benign Brain/CNS Tumors 100.0 100.0 100.0 100.0 100.0 100.0 100.0 100.0 100.0
I Leukemias, myeloproliferative & myelodysplastic diseases 22.5 24.8 19.9 22.8 24.7 20.7 22.1 24.9 19.0
II Lymphomas and reticuloendothelial neoplasms 14.2 17.0 11.1 12.6 15.4 9.4 17.2 20.2 13.8
III CNS and misc intracranial and intraspinal neoplasms 26.8 26.2 27.5 27.5 26.1 29.1 26.2 26.9 25.3
IV Neuroblastoma and other peripheral nervous cell tumor 4.1 4.1 4.0 4.2 4.7 3.7 3.8 3.1 4.6
V Retinoblastoma 1.3 1.3 1.4 1.2 1.4 1.0 1.6 1.0 2.3
VI Renal tumors 3.9 3.0 4.9 3.5 3.0 3.9 5.2 3.1 7.5
VII Hepatic tumors 1.1 1.1 1.1 1.2 1.4 1.0 0.5 0.5 0.6
VIII Malignant bone tumors 4.1 4.5 3.7 4.3 4.4 4.2 3.5 4.7 2.3
IX Soft tissue and other extraosseous sarcomas 6.0 5.9 6.2 4.7 4.7 4.7 8.7 8.8 8.6
X Germ cell & trophoblastic tumors & neoplasms of gonads 5.3 5.7 4.8 5.6 7.5 3.4 4.4 1.6 7.5
XI Other malignant epithelial neoplasms and melanomas 10.5 6.4 15.1 12.2 6.8 18.4 6.5 5.2 8.0
XII Other and unspecified malignant neoplasms 0.2 0.0 0.4 0.1 0.0 0.3 0.3 0.0 0.6
Not classified by ICCC 0.4 0.2 0.7 0.2 0.2 0.3 0.8 0.0 1.7 1Children and adolescent cancers include patients aged 0-19 years. 2ICCC: International Classification of Childhood Cancer. For more information: http://seer.cancer.gov/iccc/iccc-who2008.html 3Group I includes myelodysplastic syndromes. 4Group III includes benign and borderline brain/CNS tumors. 5Group XI includes in situ urinary bladder tumors.
CANCER IN LOUISIANA, 2014-2018 | 78
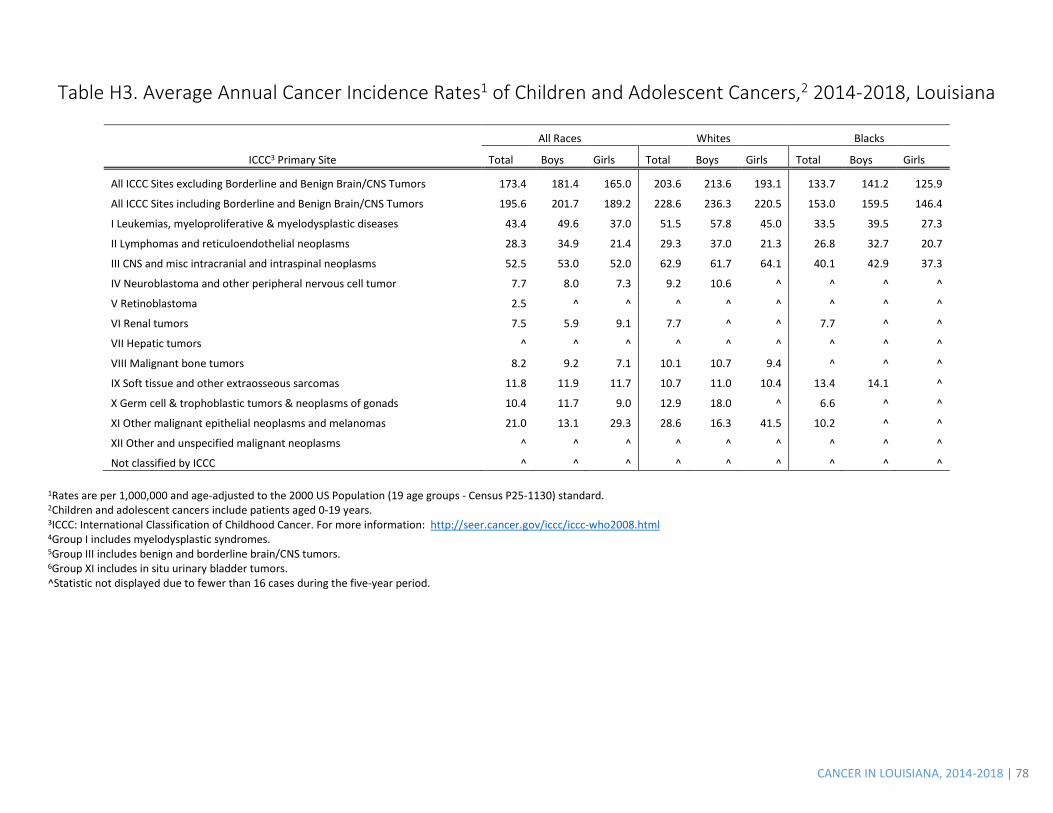
Table H3. Average Annual Cancer Incidence Rates1 of Children and Adolescent Cancers,2 2014-2018, Louisiana
All Races Whites Blacks
ICCC3 Primary Site Total Boys Girls Total Boys Girls Total Boys Girls
All ICCC Sites excluding Borderline and Benign Brain/CNS Tumors 173.4 181.4 165.0 203.6 213.6 193.1 133.7 141.2 125.9
All ICCC Sites including Borderline and Benign Brain/CNS Tumors 195.6 201.7 189.2 228.6 236.3 220.5 153.0 159.5 146.4
I Leukemias, myeloproliferative & myelodysplastic diseases 43.4 49.6 37.0 51.5 57.8 45.0 33.5 39.5 27.3
II Lymphomas and reticuloendothelial neoplasms 28.3 34.9 21.4 29.3 37.0 21.3 26.8 32.7 20.7
III CNS and misc intracranial and intraspinal neoplasms 52.5 53.0 52.0 62.9 61.7 64.1 40.1 42.9 37.3
IV Neuroblastoma and other peripheral nervous cell tumor 7.7 8.0 7.3 9.2 10.6 ^ ^ ^ ^
V Retinoblastoma 2.5 ^ ^ ^ ^ ^ ^ ^ ^
VI Renal tumors 7.5 5.9 9.1 7.7 ^ ^ 7.7 ^ ^
VII Hepatic tumors ^ ^ ^ ^ ^ ^ ^ ^ ^
VIII Malignant bone tumors 8.2 9.2 7.1 10.1 10.7 9.4 ^ ^ ^
IX Soft tissue and other extraosseous sarcomas 11.8 11.9 11.7 10.7 11.0 10.4 13.4 14.1 ^
X Germ cell & trophoblastic tumors & neoplasms of gonads 10.4 11.7 9.0 12.9 18.0 ^ 6.6 ^ ^
XI Other malignant epithelial neoplasms and melanomas 21.0 13.1 29.3 28.6 16.3 41.5 10.2 ^ ^
XII Other and unspecified malignant neoplasms ^ ^ ^ ^ ^ ^ ^ ^ ^
Not classified by ICCC ^ ^ ^ ^ ^ ^ ^ ^ ^ 1Rates are per 1,000,000 and age-adjusted to the 2000 US Population (19 age groups - Census P25-1130) standard. 2Children and adolescent cancers include patients aged 0-19 years. 3ICCC: International Classification of Childhood Cancer. For more information: http://seer.cancer.gov/iccc/iccc-who2008.html 4Group I includes myelodysplastic syndromes. 5Group III includes benign and borderline brain/CNS tumors. 6Group XI includes in situ urinary bladder tumors. ^Statistic not displayed due to fewer than 16 cases during the five-year period.
CANCER IN LOUISIANA, 2014-2018 | 79
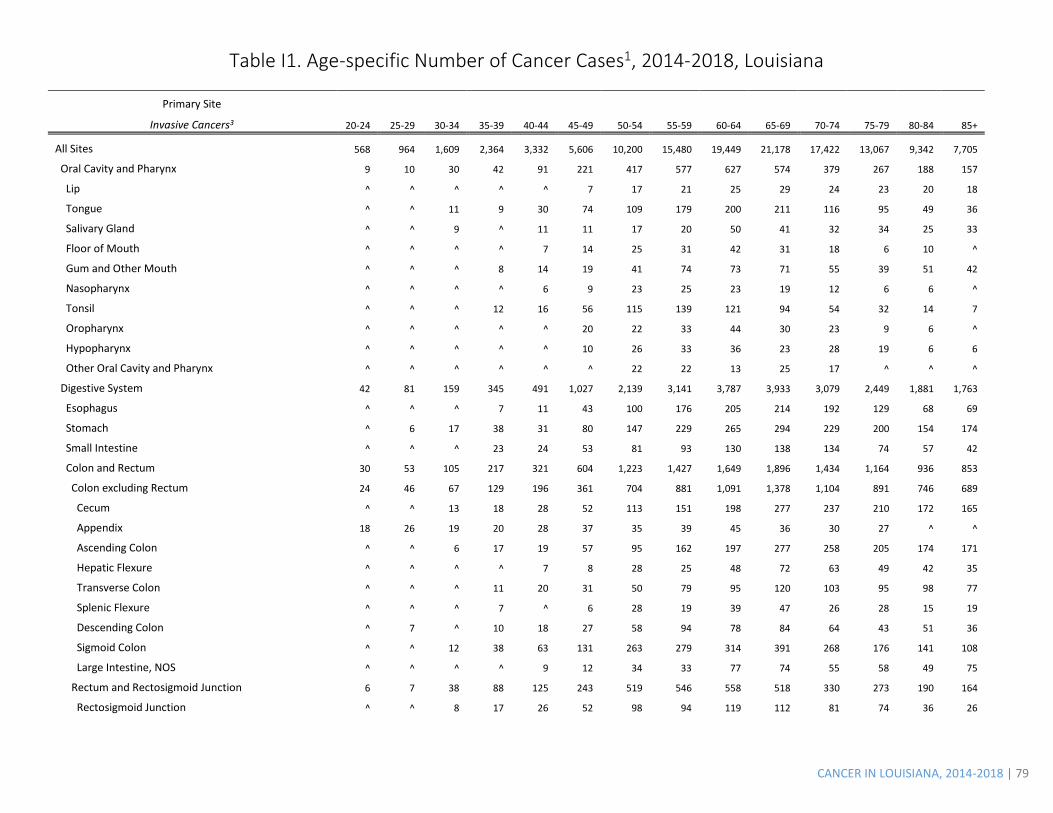
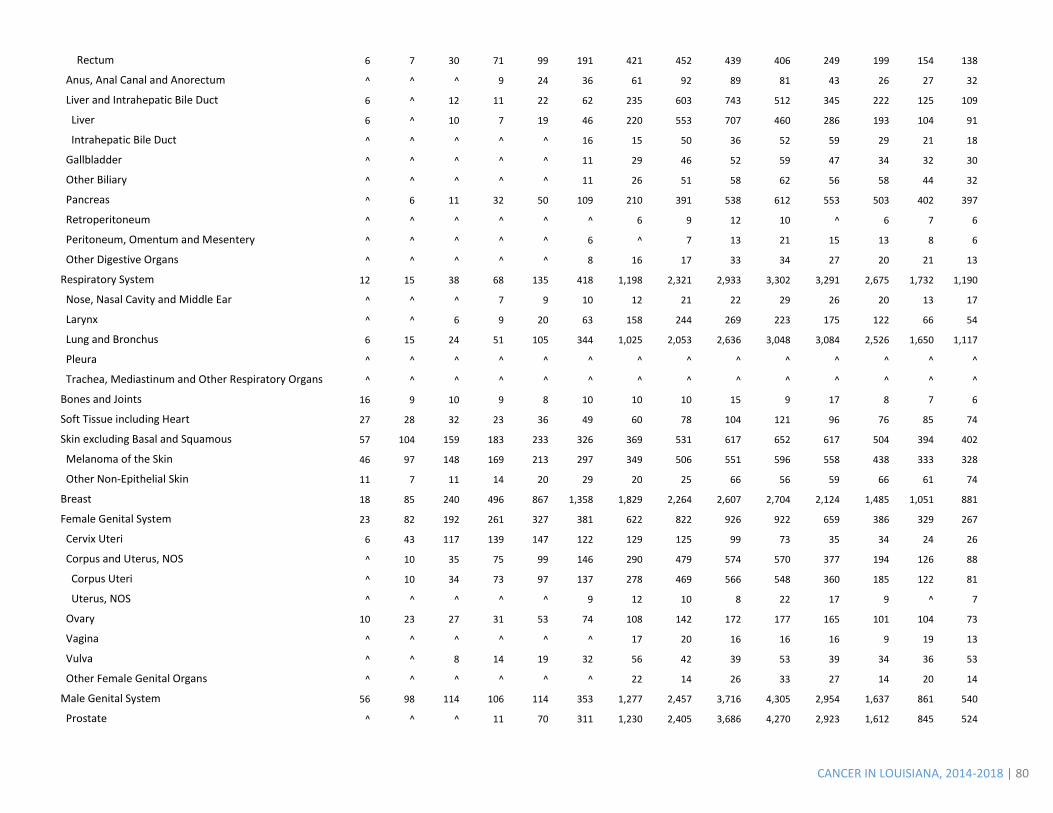
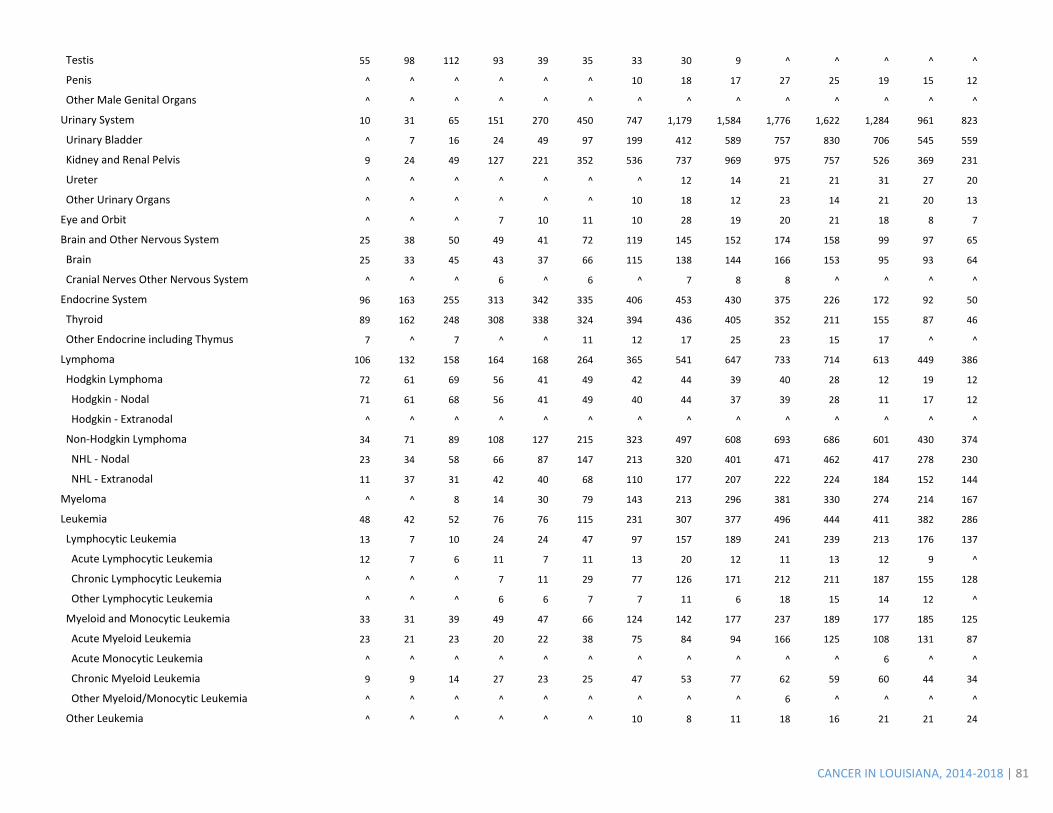
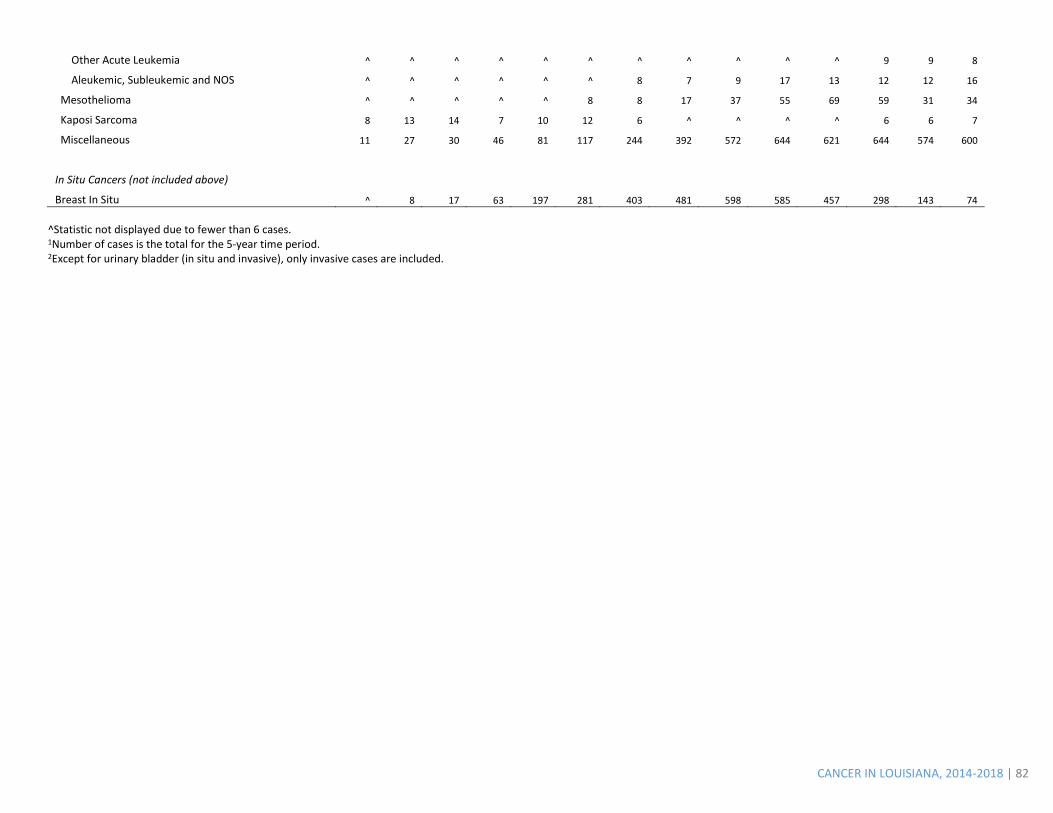
Table I1. Age-specific Number of Cancer Cases1, 2014-2018, Louisiana
Primary Site Invasive Cancers3 20-24 25-29 30-34 35-39 40-44 45-49 50-54 55-59 60-64 65-69 70-74 75-79 80-84 85+
All Sites 568 964 1,609 2,364 3,332 5,606 10,200 15,480 19,449 21,178 17,422 13,067 9,342 7,705
Oral Cavity and Pharynx 9 10 30 42 91 221 417 577 627 574 379 267 188 157
Lip ^ ^ ^ ^ ^ 7 17 21 25 29 24 23 20 18
Tongue ^ ^ 11 9 30 74 109 179 200 211 116 95 49 36
Salivary Gland ^ ^ 9 ^ 11 11 17 20 50 41 32 34 25 33
Floor of Mouth ^ ^ ^ ^ 7 14 25 31 42 31 18 6 10 ^
Gum and Other Mouth ^ ^ ^ 8 14 19 41 74 73 71 55 39 51 42
Nasopharynx ^ ^ ^ ^ 6 9 23 25 23 19 12 6 6 ^
Tonsil ^ ^ ^ 12 16 56 115 139 121 94 54 32 14 7
Oropharynx ^ ^ ^ ^ ^ 20 22 33 44 30 23 9 6 ^
Hypopharynx ^ ^ ^ ^ ^ 10 26 33 36 23 28 19 6 6
Other Oral Cavity and Pharynx ^ ^ ^ ^ ^ ^ 22 22 13 25 17 ^ ^ ^
Digestive System 42 81 159 345 491 1,027 2,139 3,141 3,787 3,933 3,079 2,449 1,881 1,763
Esophagus ^ ^ ^ 7 11 43 100 176 205 214 192 129 68 69
Stomach ^ 6 17 38 31 80 147 229 265 294 229 200 154 174
Small Intestine ^ ^ ^ 23 24 53 81 93 130 138 134 74 57 42
Colon and Rectum 30 53 105 217 321 604 1,223 1,427 1,649 1,896 1,434 1,164 936 853
Colon excluding Rectum 24 46 67 129 196 361 704 881 1,091 1,378 1,104 891 746 689
Cecum ^ ^ 13 18 28 52 113 151 198 277 237 210 172 165
Appendix 18 26 19 20 28 37 35 39 45 36 30 27 ^ ^
Ascending Colon ^ ^ 6 17 19 57 95 162 197 277 258 205 174 171
Hepatic Flexure ^ ^ ^ ^ 7 8 28 25 48 72 63 49 42 35
Transverse Colon ^ ^ ^ 11 20 31 50 79 95 120 103 95 98 77
Splenic Flexure ^ ^ ^ 7 ^ 6 28 19 39 47 26 28 15 19
Descending Colon ^ 7 ^ 10 18 27 58 94 78 84 64 43 51 36
Sigmoid Colon ^ ^ 12 38 63 131 263 279 314 391 268 176 141 108
Large Intestine, NOS ^ ^ ^ ^ 9 12 34 33 77 74 55 58 49 75
Rectum and Rectosigmoid Junction 6 7 38 88 125 243 519 546 558 518 330 273 190 164
Rectosigmoid Junction ^ ^ 8 17 26 52 98 94 119 112 81 74 36 26
CANCER IN LOUISIANA, 2014-2018 | 80
Rectum 6 7 30 71 99 191 421 452 439 406 249 199 154 138
Anus, Anal Canal and Anorectum ^ ^ ^ 9 24 36 61 92 89 81 43 26 27 32
Liver and Intrahepatic Bile Duct 6 ^ 12 11 22 62 235 603 743 512 345 222 125 109
Liver 6 ^ 10 7 19 46 220 553 707 460 286 193 104 91
Intrahepatic Bile Duct ^ ^ ^ ^ ^ 16 15 50 36 52 59 29 21 18
Gallbladder ^ ^ ^ ^ ^ 11 29 46 52 59 47 34 32 30
Other Biliary ^ ^ ^ ^ ^ 11 26 51 58 62 56 58 44 32
Pancreas ^ 6 11 32 50 109 210 391 538 612 553 503 402 397
Retroperitoneum ^ ^ ^ ^ ^ ^ 6 9 12 10 ^ 6 7 6
Peritoneum, Omentum and Mesentery ^ ^ ^ ^ ^ 6 ^ 7 13 21 15 13 8 6
Other Digestive Organs ^ ^ ^ ^ ^ 8 16 17 33 34 27 20 21 13
Respiratory System 12 15 38 68 135 418 1,198 2,321 2,933 3,302 3,291 2,675 1,732 1,190
Nose, Nasal Cavity and Middle Ear ^ ^ ^ 7 9 10 12 21 22 29 26 20 13 17
Larynx ^ ^ 6 9 20 63 158 244 269 223 175 122 66 54
Lung and Bronchus 6 15 24 51 105 344 1,025 2,053 2,636 3,048 3,084 2,526 1,650 1,117
Pleura ^ ^ ^ ^ ^ ^ ^ ^ ^ ^ ^ ^ ^ ^
Trachea, Mediastinum and Other Respiratory Organs ^ ^ ^ ^ ^ ^ ^ ^ ^ ^ ^ ^ ^ ^
Bones and Joints 16 9 10 9 8 10 10 10 15 9 17 8 7 6
Soft Tissue including Heart 27 28 32 23 36 49 60 78 104 121 96 76 85 74
Skin excluding Basal and Squamous 57 104 159 183 233 326 369 531 617 652 617 504 394 402
Melanoma of the Skin 46 97 148 169 213 297 349 506 551 596 558 438 333 328
Other Non-Epithelial Skin 11 7 11 14 20 29 20 25 66 56 59 66 61 74
Breast 18 85 240 496 867 1,358 1,829 2,264 2,607 2,704 2,124 1,485 1,051 881
Female Genital System 23 82 192 261 327 381 622 822 926 922 659 386 329 267
Cervix Uteri 6 43 117 139 147 122 129 125 99 73 35 34 24 26
Corpus and Uterus, NOS ^ 10 35 75 99 146 290 479 574 570 377 194 126 88
Corpus Uteri ^ 10 34 73 97 137 278 469 566 548 360 185 122 81
Uterus, NOS ^ ^ ^ ^ ^ 9 12 10 8 22 17 9 ^ 7
Ovary 10 23 27 31 53 74 108 142 172 177 165 101 104 73
Vagina ^ ^ ^ ^ ^ ^ 17 20 16 16 16 9 19 13
Vulva ^ ^ 8 14 19 32 56 42 39 53 39 34 36 53
Other Female Genital Organs ^ ^ ^ ^ ^ ^ 22 14 26 33 27 14 20 14
Male Genital System 56 98 114 106 114 353 1,277 2,457 3,716 4,305 2,954 1,637 861 540
Prostate ^ ^ ^ 11 70 311 1,230 2,405 3,686 4,270 2,923 1,612 845 524
CANCER IN LOUISIANA, 2014-2018 | 81
Testis 55 98 112 93 39 35 33 30 9 ^ ^ ^ ^ ^
Penis ^ ^ ^ ^ ^ ^ 10 18 17 27 25 19 15 12
Other Male Genital Organs ^ ^ ^ ^ ^ ^ ^ ^ ^ ^ ^ ^ ^ ^
Urinary System 10 31 65 151 270 450 747 1,179 1,584 1,776 1,622 1,284 961 823
Urinary Bladder ^ 7 16 24 49 97 199 412 589 757 830 706 545 559
Kidney and Renal Pelvis 9 24 49 127 221 352 536 737 969 975 757 526 369 231
Ureter ^ ^ ^ ^ ^ ^ ^ 12 14 21 21 31 27 20
Other Urinary Organs ^ ^ ^ ^ ^ ^ 10 18 12 23 14 21 20 13
Eye and Orbit ^ ^ ^ 7 10 11 10 28 19 20 21 18 8 7
Brain and Other Nervous System 25 38 50 49 41 72 119 145 152 174 158 99 97 65
Brain 25 33 45 43 37 66 115 138 144 166 153 95 93 64
Cranial Nerves Other Nervous System ^ ^ ^ 6 ^ 6 ^ 7 8 8 ^ ^ ^ ^
Endocrine System 96 163 255 313 342 335 406 453 430 375 226 172 92 50
Thyroid 89 162 248 308 338 324 394 436 405 352 211 155 87 46
Other Endocrine including Thymus 7 ^ 7 ^ ^ 11 12 17 25 23 15 17 ^ ^
Lymphoma 106 132 158 164 168 264 365 541 647 733 714 613 449 386
Hodgkin Lymphoma 72 61 69 56 41 49 42 44 39 40 28 12 19 12
Hodgkin - Nodal 71 61 68 56 41 49 40 44 37 39 28 11 17 12
Hodgkin - Extranodal ^ ^ ^ ^ ^ ^ ^ ^ ^ ^ ^ ^ ^ ^
Non-Hodgkin Lymphoma 34 71 89 108 127 215 323 497 608 693 686 601 430 374
NHL - Nodal 23 34 58 66 87 147 213 320 401 471 462 417 278 230
NHL - Extranodal 11 37 31 42 40 68 110 177 207 222 224 184 152 144
Myeloma ^ ^ 8 14 30 79 143 213 296 381 330 274 214 167
Leukemia 48 42 52 76 76 115 231 307 377 496 444 411 382 286
Lymphocytic Leukemia 13 7 10 24 24 47 97 157 189 241 239 213 176 137
Acute Lymphocytic Leukemia 12 7 6 11 7 11 13 20 12 11 13 12 9 ^
Chronic Lymphocytic Leukemia ^ ^ ^ 7 11 29 77 126 171 212 211 187 155 128
Other Lymphocytic Leukemia ^ ^ ^ 6 6 7 7 11 6 18 15 14 12 ^
Myeloid and Monocytic Leukemia 33 31 39 49 47 66 124 142 177 237 189 177 185 125
Acute Myeloid Leukemia 23 21 23 20 22 38 75 84 94 166 125 108 131 87
Acute Monocytic Leukemia ^ ^ ^ ^ ^ ^ ^ ^ ^ ^ ^ 6 ^ ^
Chronic Myeloid Leukemia 9 9 14 27 23 25 47 53 77 62 59 60 44 34
Other Myeloid/Monocytic Leukemia ^ ^ ^ ^ ^ ^ ^ ^ ^ 6 ^ ^ ^ ^
Other Leukemia ^ ^ ^ ^ ^ ^ 10 8 11 18 16 21 21 24
CANCER IN LOUISIANA, 2014-2018 | 82
Other Acute Leukemia ^ ^ ^ ^ ^ ^ ^ ^ ^ ^ ^ 9 9 8
Aleukemic, Subleukemic and NOS ^ ^ ^ ^ ^ ^ 8 7 9 17 13 12 12 16
Mesothelioma ^ ^ ^ ^ ^ 8 8 17 37 55 69 59 31 34
Kaposi Sarcoma 8 13 14 7 10 12 6 ^ ^ ^ ^ 6 6 7
Miscellaneous 11 27 30 46 81 117 244 392 572 644 621 644 574 600
In Situ Cancers (not included above) Breast In Situ ^ 8 17 63 197 281 403 481 598 585 457 298 143 74
^Statistic not displayed due to fewer than 6 cases. 1Number of cases is the total for the 5-year time period. 2Except for urinary bladder (in situ and invasive), only invasive cases are included.
CANCER IN LOUISIANA, 2014-2018 | 83
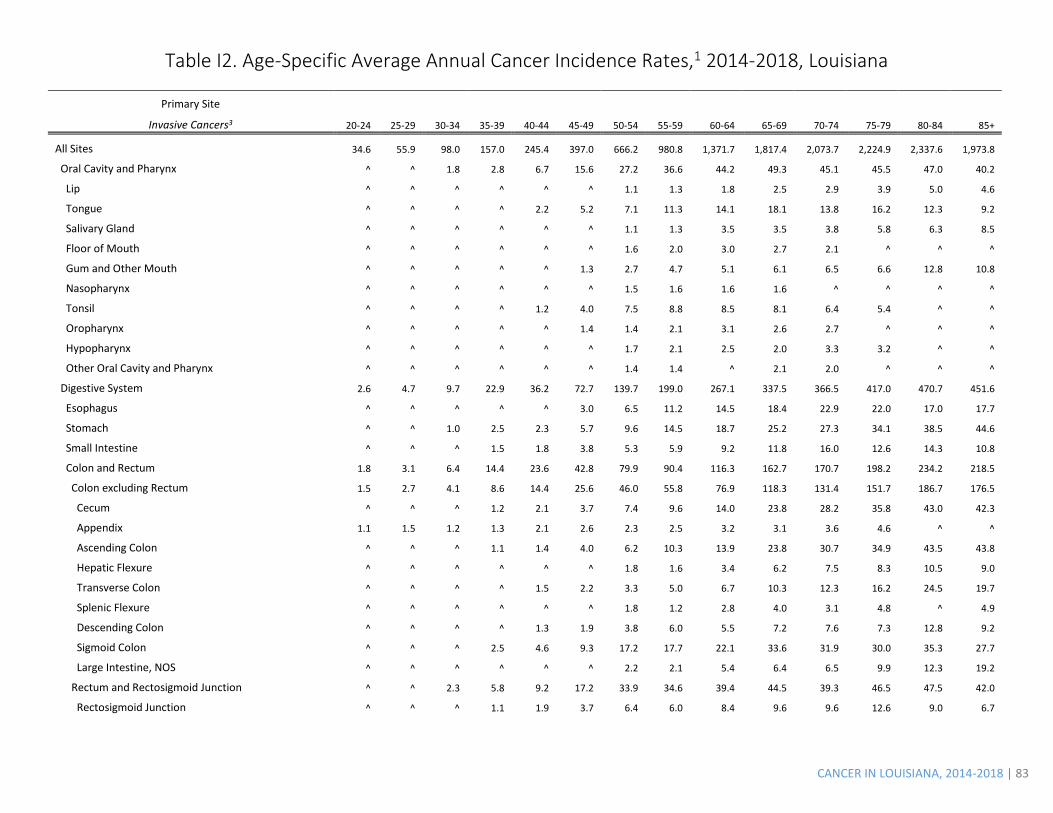
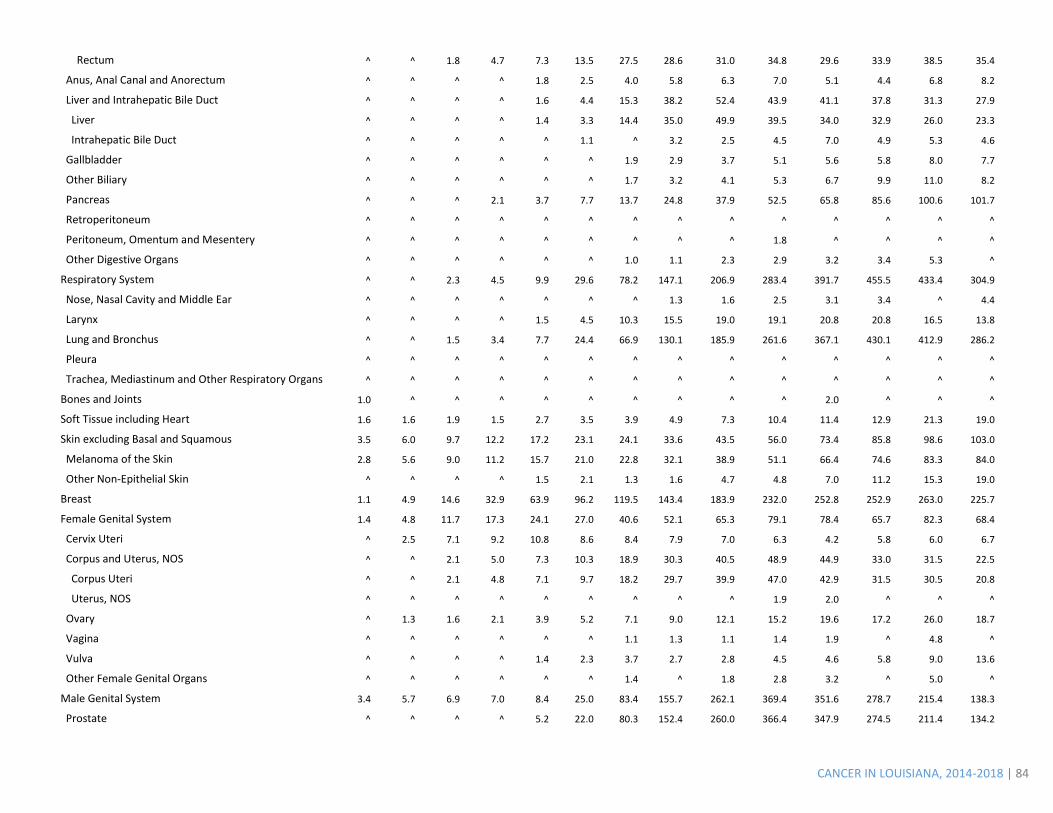
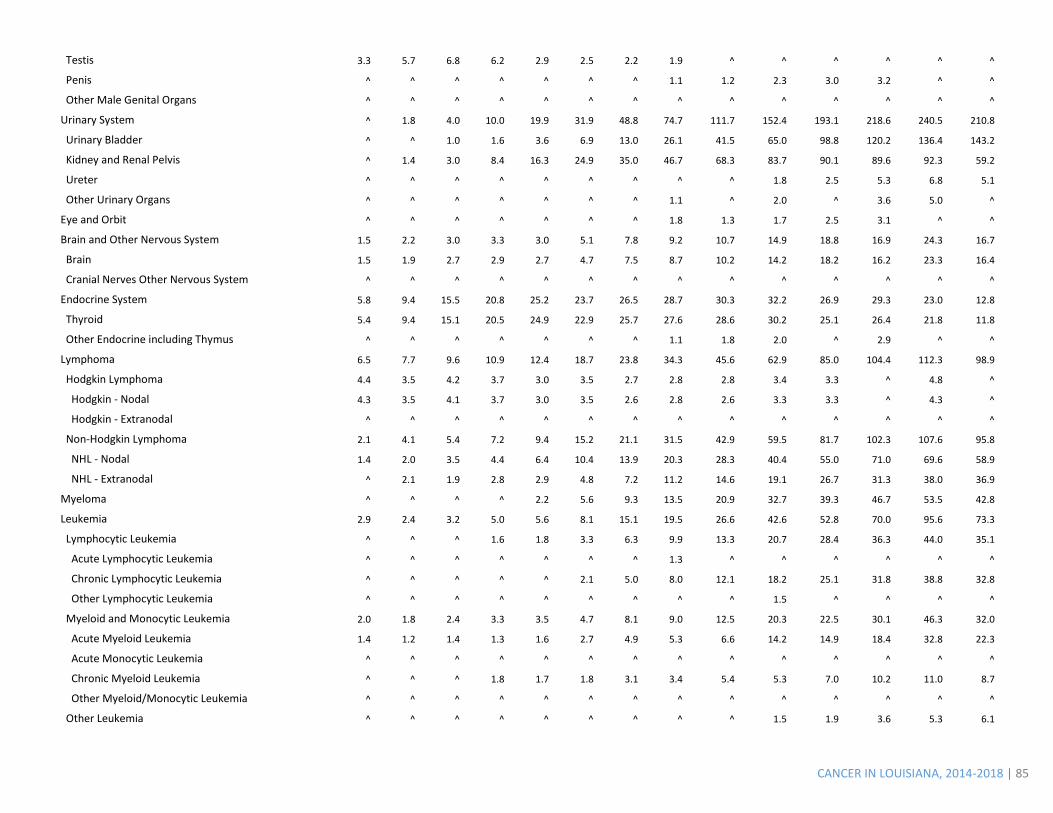
Table I2. Age-Specific Average Annual Cancer Incidence Rates,1 2014-2018, Louisiana
Primary Site Invasive Cancers3 20-24 25-29 30-34 35-39 40-44 45-49 50-54 55-59 60-64 65-69 70-74 75-79 80-84 85+
All Sites 34.6 55.9 98.0 157.0 245.4 397.0 666.2 980.8 1,371.7 1,817.4 2,073.7 2,224.9 2,337.6 1,973.8
Oral Cavity and Pharynx ^ ^ 1.8 2.8 6.7 15.6 27.2 36.6 44.2 49.3 45.1 45.5 47.0 40.2
Lip ^ ^ ^ ^ ^ ^ 1.1 1.3 1.8 2.5 2.9 3.9 5.0 4.6
Tongue ^ ^ ^ ^ 2.2 5.2 7.1 11.3 14.1 18.1 13.8 16.2 12.3 9.2
Salivary Gland ^ ^ ^ ^ ^ ^ 1.1 1.3 3.5 3.5 3.8 5.8 6.3 8.5
Floor of Mouth ^ ^ ^ ^ ^ ^ 1.6 2.0 3.0 2.7 2.1 ^ ^ ^
Gum and Other Mouth ^ ^ ^ ^ ^ 1.3 2.7 4.7 5.1 6.1 6.5 6.6 12.8 10.8
Nasopharynx ^ ^ ^ ^ ^ ^ 1.5 1.6 1.6 1.6 ^ ^ ^ ^
Tonsil ^ ^ ^ ^ 1.2 4.0 7.5 8.8 8.5 8.1 6.4 5.4 ^ ^
Oropharynx ^ ^ ^ ^ ^ 1.4 1.4 2.1 3.1 2.6 2.7 ^ ^ ^
Hypopharynx ^ ^ ^ ^ ^ ^ 1.7 2.1 2.5 2.0 3.3 3.2 ^ ^
Other Oral Cavity and Pharynx ^ ^ ^ ^ ^ ^ 1.4 1.4 ^ 2.1 2.0 ^ ^ ^
Digestive System 2.6 4.7 9.7 22.9 36.2 72.7 139.7 199.0 267.1 337.5 366.5 417.0 470.7 451.6
Esophagus ^ ^ ^ ^ ^ 3.0 6.5 11.2 14.5 18.4 22.9 22.0 17.0 17.7
Stomach ^ ^ 1.0 2.5 2.3 5.7 9.6 14.5 18.7 25.2 27.3 34.1 38.5 44.6
Small Intestine ^ ^ ^ 1.5 1.8 3.8 5.3 5.9 9.2 11.8 16.0 12.6 14.3 10.8
Colon and Rectum 1.8 3.1 6.4 14.4 23.6 42.8 79.9 90.4 116.3 162.7 170.7 198.2 234.2 218.5
Colon excluding Rectum 1.5 2.7 4.1 8.6 14.4 25.6 46.0 55.8 76.9 118.3 131.4 151.7 186.7 176.5
Cecum ^ ^ ^ 1.2 2.1 3.7 7.4 9.6 14.0 23.8 28.2 35.8 43.0 42.3
Appendix 1.1 1.5 1.2 1.3 2.1 2.6 2.3 2.5 3.2 3.1 3.6 4.6 ^ ^
Ascending Colon ^ ^ ^ 1.1 1.4 4.0 6.2 10.3 13.9 23.8 30.7 34.9 43.5 43.8
Hepatic Flexure ^ ^ ^ ^ ^ ^ 1.8 1.6 3.4 6.2 7.5 8.3 10.5 9.0
Transverse Colon ^ ^ ^ ^ 1.5 2.2 3.3 5.0 6.7 10.3 12.3 16.2 24.5 19.7
Splenic Flexure ^ ^ ^ ^ ^ ^ 1.8 1.2 2.8 4.0 3.1 4.8 ^ 4.9
Descending Colon ^ ^ ^ ^ 1.3 1.9 3.8 6.0 5.5 7.2 7.6 7.3 12.8 9.2
Sigmoid Colon ^ ^ ^ 2.5 4.6 9.3 17.2 17.7 22.1 33.6 31.9 30.0 35.3 27.7
Large Intestine, NOS ^ ^ ^ ^ ^ ^ 2.2 2.1 5.4 6.4 6.5 9.9 12.3 19.2
Rectum and Rectosigmoid Junction ^ ^ 2.3 5.8 9.2 17.2 33.9 34.6 39.4 44.5 39.3 46.5 47.5 42.0
Rectosigmoid Junction ^ ^ ^ 1.1 1.9 3.7 6.4 6.0 8.4 9.6 9.6 12.6 9.0 6.7
CANCER IN LOUISIANA, 2014-2018 | 84
Rectum ^ ^ 1.8 4.7 7.3 13.5 27.5 28.6 31.0 34.8 29.6 33.9 38.5 35.4
Anus, Anal Canal and Anorectum ^ ^ ^ ^ 1.8 2.5 4.0 5.8 6.3 7.0 5.1 4.4 6.8 8.2
Liver and Intrahepatic Bile Duct ^ ^ ^ ^ 1.6 4.4 15.3 38.2 52.4 43.9 41.1 37.8 31.3 27.9
Liver ^ ^ ^ ^ 1.4 3.3 14.4 35.0 49.9 39.5 34.0 32.9 26.0 23.3
Intrahepatic Bile Duct ^ ^ ^ ^ ^ 1.1 ^ 3.2 2.5 4.5 7.0 4.9 5.3 4.6
Gallbladder ^ ^ ^ ^ ^ ^ 1.9 2.9 3.7 5.1 5.6 5.8 8.0 7.7
Other Biliary ^ ^ ^ ^ ^ ^ 1.7 3.2 4.1 5.3 6.7 9.9 11.0 8.2
Pancreas ^ ^ ^ 2.1 3.7 7.7 13.7 24.8 37.9 52.5 65.8 85.6 100.6 101.7
Retroperitoneum ^ ^ ^ ^ ^ ^ ^ ^ ^ ^ ^ ^ ^ ^
Peritoneum, Omentum and Mesentery ^ ^ ^ ^ ^ ^ ^ ^ ^ 1.8 ^ ^ ^ ^
Other Digestive Organs ^ ^ ^ ^ ^ ^ 1.0 1.1 2.3 2.9 3.2 3.4 5.3 ^
Respiratory System ^ ^ 2.3 4.5 9.9 29.6 78.2 147.1 206.9 283.4 391.7 455.5 433.4 304.9
Nose, Nasal Cavity and Middle Ear ^ ^ ^ ^ ^ ^ ^ 1.3 1.6 2.5 3.1 3.4 ^ 4.4
Larynx ^ ^ ^ ^ 1.5 4.5 10.3 15.5 19.0 19.1 20.8 20.8 16.5 13.8
Lung and Bronchus ^ ^ 1.5 3.4 7.7 24.4 66.9 130.1 185.9 261.6 367.1 430.1 412.9 286.2
Pleura ^ ^ ^ ^ ^ ^ ^ ^ ^ ^ ^ ^ ^ ^
Trachea, Mediastinum and Other Respiratory Organs ^ ^ ^ ^ ^ ^ ^ ^ ^ ^ ^ ^ ^ ^
Bones and Joints 1.0 ^ ^ ^ ^ ^ ^ ^ ^ ^ 2.0 ^ ^ ^
Soft Tissue including Heart 1.6 1.6 1.9 1.5 2.7 3.5 3.9 4.9 7.3 10.4 11.4 12.9 21.3 19.0
Skin excluding Basal and Squamous 3.5 6.0 9.7 12.2 17.2 23.1 24.1 33.6 43.5 56.0 73.4 85.8 98.6 103.0
Melanoma of the Skin 2.8 5.6 9.0 11.2 15.7 21.0 22.8 32.1 38.9 51.1 66.4 74.6 83.3 84.0
Other Non-Epithelial Skin ^ ^ ^ ^ 1.5 2.1 1.3 1.6 4.7 4.8 7.0 11.2 15.3 19.0
Breast 1.1 4.9 14.6 32.9 63.9 96.2 119.5 143.4 183.9 232.0 252.8 252.9 263.0 225.7
Female Genital System 1.4 4.8 11.7 17.3 24.1 27.0 40.6 52.1 65.3 79.1 78.4 65.7 82.3 68.4
Cervix Uteri ^ 2.5 7.1 9.2 10.8 8.6 8.4 7.9 7.0 6.3 4.2 5.8 6.0 6.7
Corpus and Uterus, NOS ^ ^ 2.1 5.0 7.3 10.3 18.9 30.3 40.5 48.9 44.9 33.0 31.5 22.5
Corpus Uteri ^ ^ 2.1 4.8 7.1 9.7 18.2 29.7 39.9 47.0 42.9 31.5 30.5 20.8
Uterus, NOS ^ ^ ^ ^ ^ ^ ^ ^ ^ 1.9 2.0 ^ ^ ^
Ovary ^ 1.3 1.6 2.1 3.9 5.2 7.1 9.0 12.1 15.2 19.6 17.2 26.0 18.7
Vagina ^ ^ ^ ^ ^ ^ 1.1 1.3 1.1 1.4 1.9 ^ 4.8 ^
Vulva ^ ^ ^ ^ 1.4 2.3 3.7 2.7 2.8 4.5 4.6 5.8 9.0 13.6
Other Female Genital Organs ^ ^ ^ ^ ^ ^ 1.4 ^ 1.8 2.8 3.2 ^ 5.0 ^
Male Genital System 3.4 5.7 6.9 7.0 8.4 25.0 83.4 155.7 262.1 369.4 351.6 278.7 215.4 138.3
Prostate ^ ^ ^ ^ 5.2 22.0 80.3 152.4 260.0 366.4 347.9 274.5 211.4 134.2
CANCER IN LOUISIANA, 2014-2018 | 85
Testis 3.3 5.7 6.8 6.2 2.9 2.5 2.2 1.9 ^ ^ ^ ^ ^ ^
Penis ^ ^ ^ ^ ^ ^ ^ 1.1 1.2 2.3 3.0 3.2 ^ ^
Other Male Genital Organs ^ ^ ^ ^ ^ ^ ^ ^ ^ ^ ^ ^ ^ ^
Urinary System ^ 1.8 4.0 10.0 19.9 31.9 48.8 74.7 111.7 152.4 193.1 218.6 240.5 210.8
Urinary Bladder ^ ^ 1.0 1.6 3.6 6.9 13.0 26.1 41.5 65.0 98.8 120.2 136.4 143.2
Kidney and Renal Pelvis ^ 1.4 3.0 8.4 16.3 24.9 35.0 46.7 68.3 83.7 90.1 89.6 92.3 59.2
Ureter ^ ^ ^ ^ ^ ^ ^ ^ ^ 1.8 2.5 5.3 6.8 5.1
Other Urinary Organs ^ ^ ^ ^ ^ ^ ^ 1.1 ^ 2.0 ^ 3.6 5.0 ^
Eye and Orbit ^ ^ ^ ^ ^ ^ ^ 1.8 1.3 1.7 2.5 3.1 ^ ^
Brain and Other Nervous System 1.5 2.2 3.0 3.3 3.0 5.1 7.8 9.2 10.7 14.9 18.8 16.9 24.3 16.7
Brain 1.5 1.9 2.7 2.9 2.7 4.7 7.5 8.7 10.2 14.2 18.2 16.2 23.3 16.4
Cranial Nerves Other Nervous System ^ ^ ^ ^ ^ ^ ^ ^ ^ ^ ^ ^ ^ ^
Endocrine System 5.8 9.4 15.5 20.8 25.2 23.7 26.5 28.7 30.3 32.2 26.9 29.3 23.0 12.8
Thyroid 5.4 9.4 15.1 20.5 24.9 22.9 25.7 27.6 28.6 30.2 25.1 26.4 21.8 11.8
Other Endocrine including Thymus ^ ^ ^ ^ ^ ^ ^ 1.1 1.8 2.0 ^ 2.9 ^ ^
Lymphoma 6.5 7.7 9.6 10.9 12.4 18.7 23.8 34.3 45.6 62.9 85.0 104.4 112.3 98.9
Hodgkin Lymphoma 4.4 3.5 4.2 3.7 3.0 3.5 2.7 2.8 2.8 3.4 3.3 ^ 4.8 ^
Hodgkin - Nodal 4.3 3.5 4.1 3.7 3.0 3.5 2.6 2.8 2.6 3.3 3.3 ^ 4.3 ^
Hodgkin - Extranodal ^ ^ ^ ^ ^ ^ ^ ^ ^ ^ ^ ^ ^ ^
Non-Hodgkin Lymphoma 2.1 4.1 5.4 7.2 9.4 15.2 21.1 31.5 42.9 59.5 81.7 102.3 107.6 95.8
NHL - Nodal 1.4 2.0 3.5 4.4 6.4 10.4 13.9 20.3 28.3 40.4 55.0 71.0 69.6 58.9
NHL - Extranodal ^ 2.1 1.9 2.8 2.9 4.8 7.2 11.2 14.6 19.1 26.7 31.3 38.0 36.9
Myeloma ^ ^ ^ ^ 2.2 5.6 9.3 13.5 20.9 32.7 39.3 46.7 53.5 42.8
Leukemia 2.9 2.4 3.2 5.0 5.6 8.1 15.1 19.5 26.6 42.6 52.8 70.0 95.6 73.3
Lymphocytic Leukemia ^ ^ ^ 1.6 1.8 3.3 6.3 9.9 13.3 20.7 28.4 36.3 44.0 35.1
Acute Lymphocytic Leukemia ^ ^ ^ ^ ^ ^ ^ 1.3 ^ ^ ^ ^ ^ ^
Chronic Lymphocytic Leukemia ^ ^ ^ ^ ^ 2.1 5.0 8.0 12.1 18.2 25.1 31.8 38.8 32.8
Other Lymphocytic Leukemia ^ ^ ^ ^ ^ ^ ^ ^ ^ 1.5 ^ ^ ^ ^
Myeloid and Monocytic Leukemia 2.0 1.8 2.4 3.3 3.5 4.7 8.1 9.0 12.5 20.3 22.5 30.1 46.3 32.0
Acute Myeloid Leukemia 1.4 1.2 1.4 1.3 1.6 2.7 4.9 5.3 6.6 14.2 14.9 18.4 32.8 22.3
Acute Monocytic Leukemia ^ ^ ^ ^ ^ ^ ^ ^ ^ ^ ^ ^ ^ ^
Chronic Myeloid Leukemia ^ ^ ^ 1.8 1.7 1.8 3.1 3.4 5.4 5.3 7.0 10.2 11.0 8.7
Other Myeloid/Monocytic Leukemia ^ ^ ^ ^ ^ ^ ^ ^ ^ ^ ^ ^ ^ ^
Other Leukemia ^ ^ ^ ^ ^ ^ ^ ^ ^ 1.5 1.9 3.6 5.3 6.1
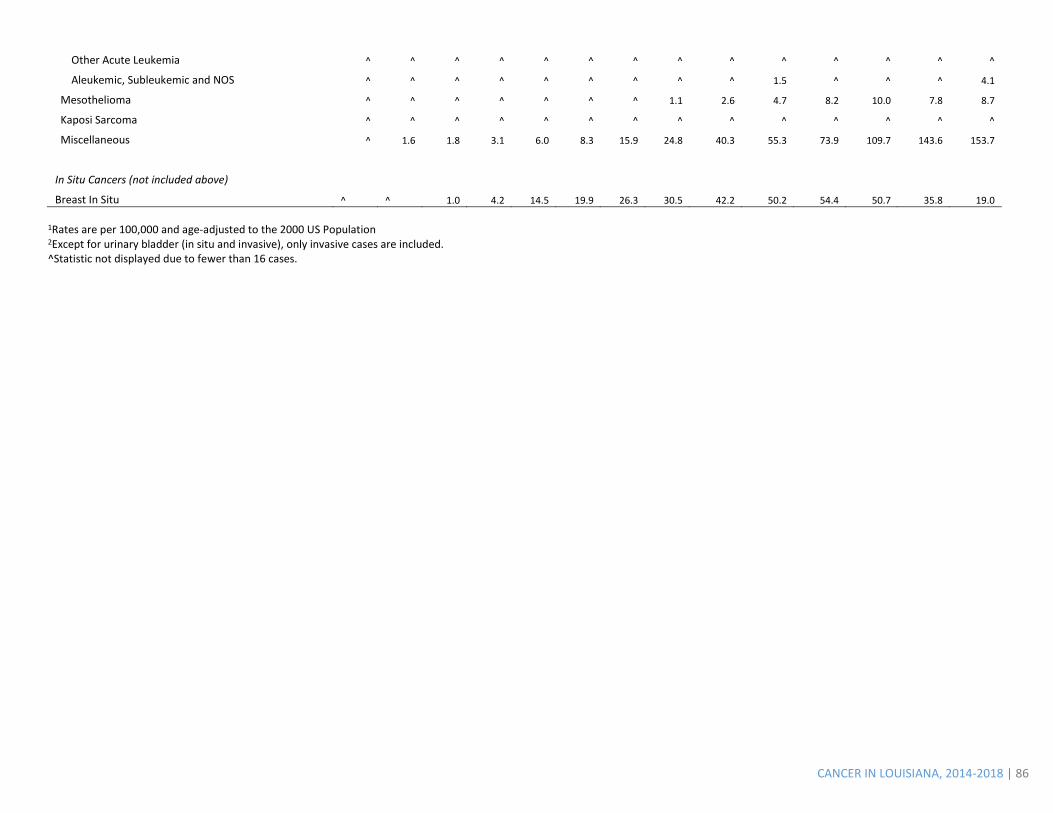
CANCER IN LOUISIANA, 2014-2018 | 86
Other Acute Leukemia ^ ^ ^ ^ ^ ^ ^ ^ ^ ^ ^ ^ ^ ^
Aleukemic, Subleukemic and NOS ^ ^ ^ ^ ^ ^ ^ ^ ^ 1.5 ^ ^ ^ 4.1
Mesothelioma ^ ^ ^ ^ ^ ^ ^ 1.1 2.6 4.7 8.2 10.0 7.8 8.7
Kaposi Sarcoma ^ ^ ^ ^ ^ ^ ^ ^ ^ ^ ^ ^ ^ ^
Miscellaneous ^ 1.6 1.8 3.1 6.0 8.3 15.9 24.8 40.3 55.3 73.9 109.7 143.6 153.7
In Situ Cancers (not included above) Breast In Situ ^ ^ 1.0 4.2 14.5 19.9 26.3 30.5 42.2 50.2 54.4 50.7 35.8 19.0
1Rates are per 100,000 and age-adjusted to the 2000 US Population 2Except for urinary bladder (in situ and invasive), only invasive cases are included. ^Statistic not displayed due to fewer than 16 cases.