Embed Size (px)
Citation preview
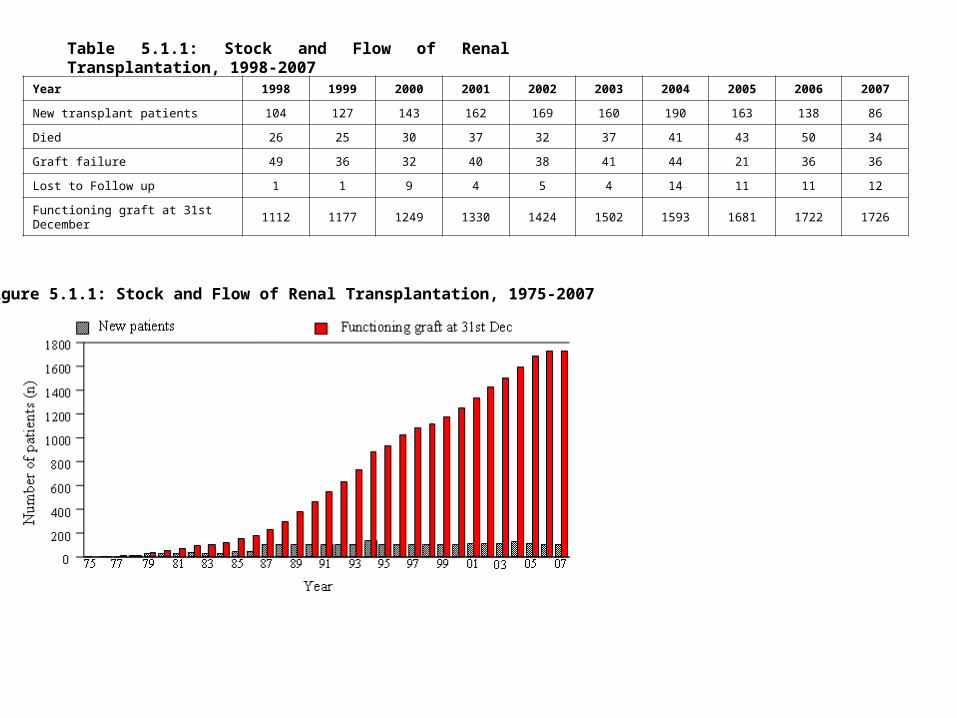
Table 5.1.1: Stock and Flow of Renal Transplantation, 1998-2007
Year 1998 1999 2000 2001 2002 2003 2004 2005 2006 2007
New transplant patients 104 127 143 162 169 160 190 163 138 86
Died 26 25 30 37 32 37 41 43 50 34
Graft failure 49 36 32 40 38 41 44 21 36 36
Lost to Follow up 1 1 9 4 5 4 14 11 11 12
Functioning graft at 31st December 1112 1177 1249 1330 1424 1502 1593 1681 1722 1726
Figure 5.1.1: Stock and Flow of Renal Transplantation, 1975-2007
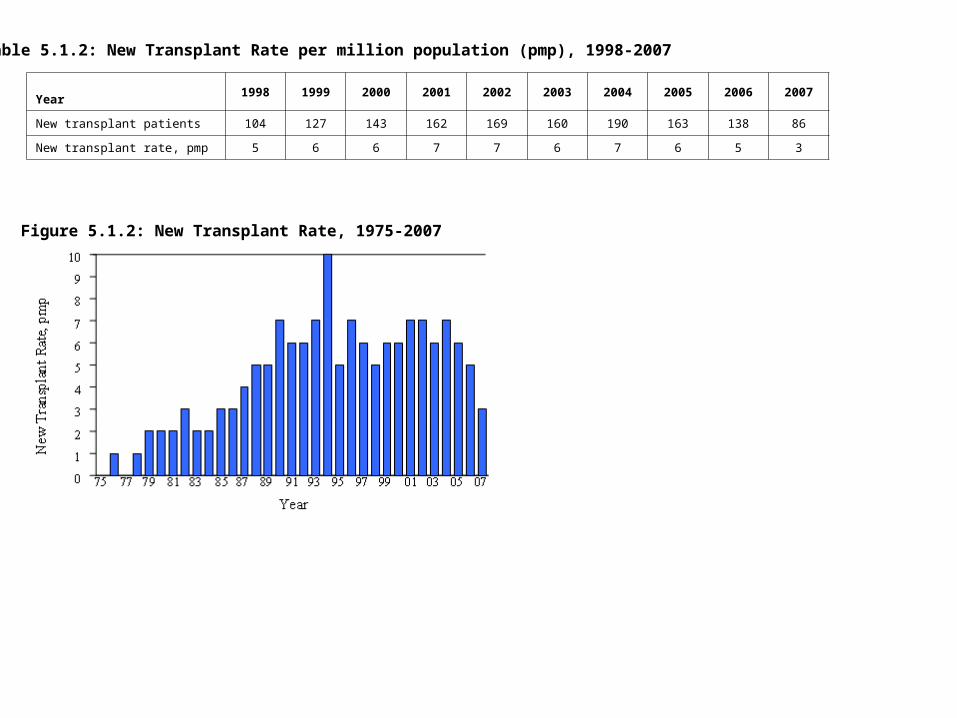
Table 5.1.2: New Transplant Rate per million population (pmp), 1998-2007
Year1998 1999 2000 2001 2002 2003 2004 2005 2006 2007
New transplant patients 104 127 143 162 169 160 190 163 138 86
New transplant rate, pmp 5 6 6 7 7 6 7 6 5 3
Figure 5.1.2: New Transplant Rate, 1975-2007
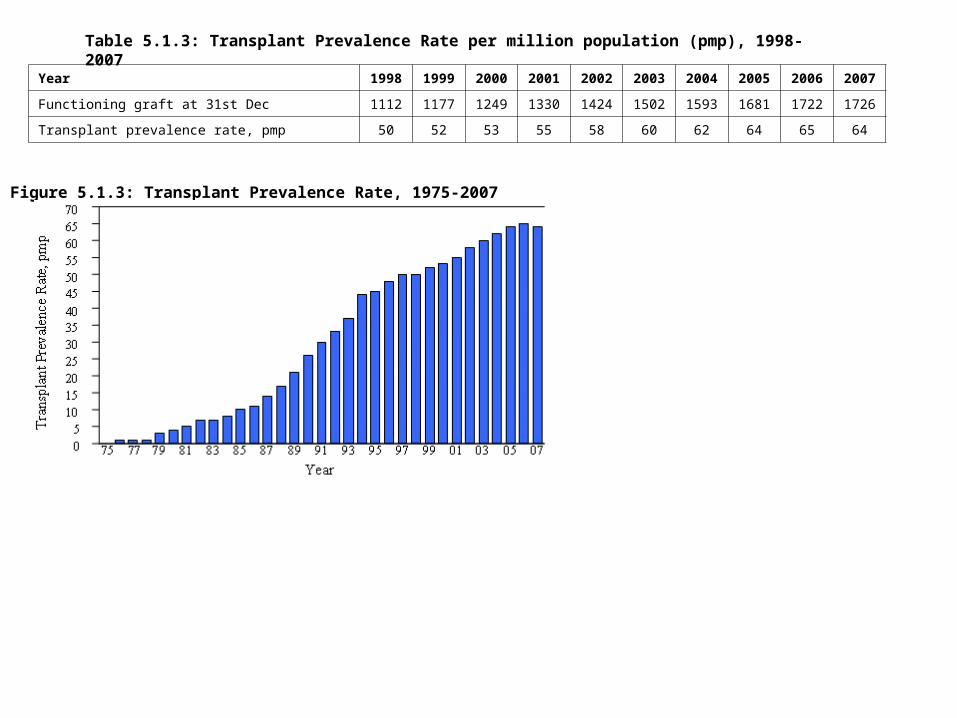
Table 5.1.3: Transplant Prevalence Rate per million population (pmp), 1998-2007
Year 1998 1999 2000 2001 2002 2003 2004 2005 2006 2007
Functioning graft at 31st Dec 1112 1177 1249 1330 1424 1502 1593 1681 1722 1726
Transplant prevalence rate, pmp 50 52 53 55 58 60 62 64 65 64
Figure 5.1.3: Transplant Prevalence Rate, 1975-2007
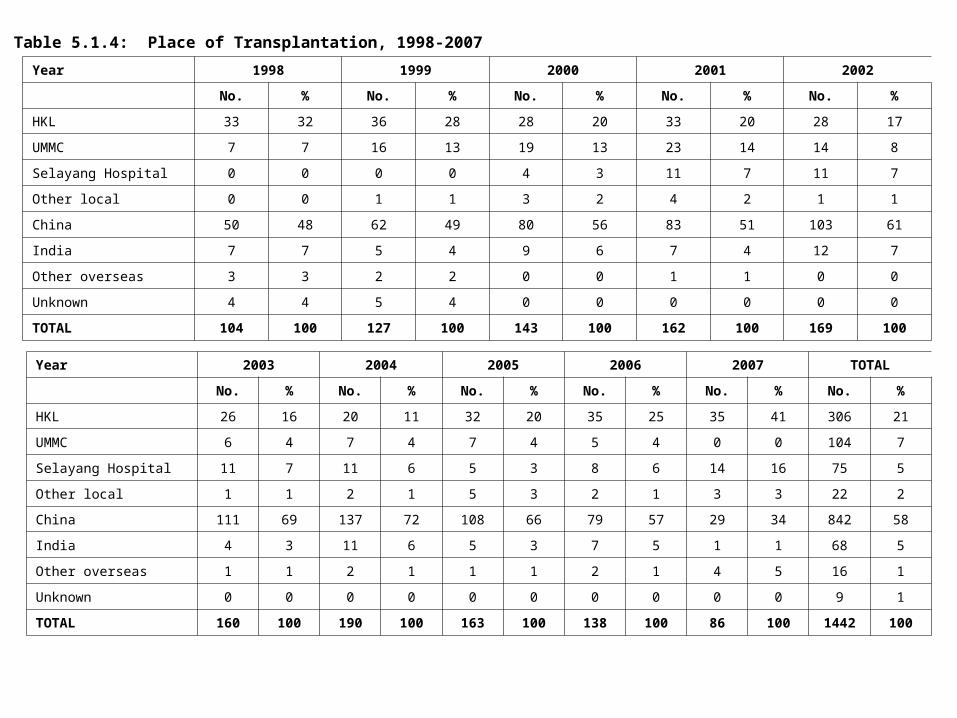
Table 5.1.4: Place of Transplantation, 1998-2007
Year 1998 1999 2000 2001 2002
No. % No. % No. % No. % No. %
HKL 33 32 36 28 28 20 33 20 28 17
UMMC 7 7 16 13 19 13 23 14 14 8
Selayang Hospital 0 0 0 0 4 3 11 7 11 7
Other local 0 0 1 1 3 2 4 2 1 1
China 50 48 62 49 80 56 83 51 103 61
India 7 7 5 4 9 6 7 4 12 7
Other overseas 3 3 2 2 0 0 1 1 0 0
Unknown 4 4 5 4 0 0 0 0 0 0
TOTAL 104 100 127 100 143 100 162 100 169 100
Year 2003 2004 2005 2006 2007 TOTAL
No. % No. % No. % No. % No. % No. %
HKL 26 16 20 11 32 20 35 25 35 41 306 21
UMMC 6 4 7 4 7 4 5 4 0 0 104 7
Selayang Hospital 11 7 11 6 5 3 8 6 14 16 75 5
Other local 1 1 2 1 5 3 2 1 3 3 22 2
China 111 69 137 72 108 66 79 57 29 34 842 58
India 4 3 11 6 5 3 7 5 1 1 68 5
Other overseas 1 1 2 1 1 1 2 1 4 5 16 1
Unknown 0 0 0 0 0 0 0 0 0 0 9 1
TOTAL 160 100 190 100 163 100 138 100 86 100 1442 100
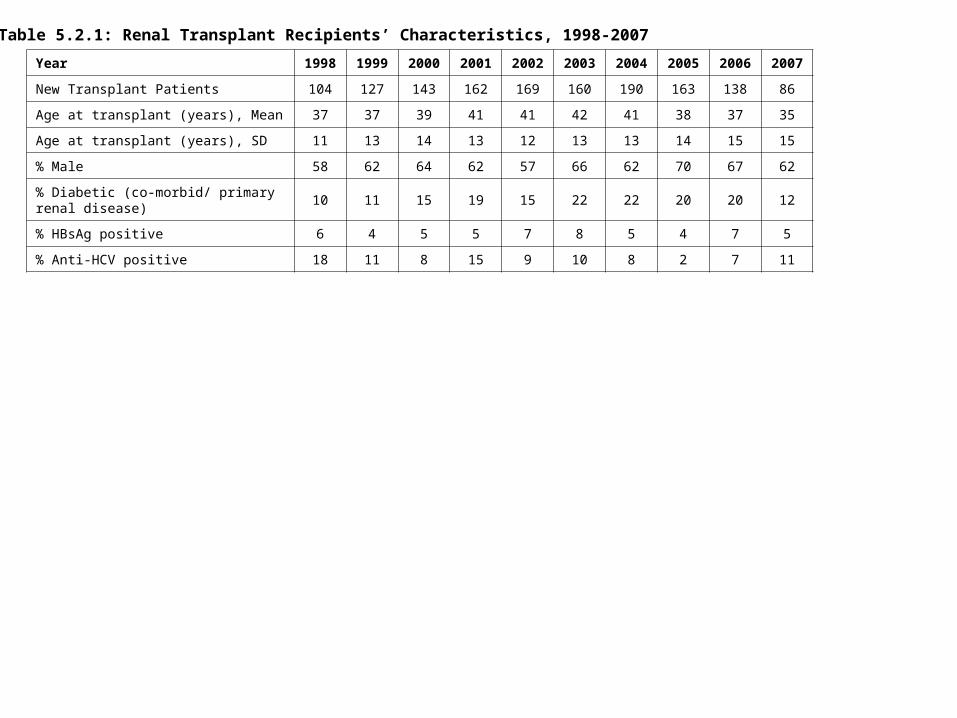
Table 5.2.1: Renal Transplant Recipients’ Characteristics, 1998-2007
Year 1998 1999 2000 2001 2002 2003 2004 2005 2006 2007
New Transplant Patients 104 127 143 162 169 160 190 163 138 86
Age at transplant (years), Mean 37 37 39 41 41 42 41 38 37 35
Age at transplant (years), SD 11 13 14 13 12 13 13 14 15 15
% Male 58 62 64 62 57 66 62 70 67 62
% Diabetic (co-morbid/ primary renal disease) 10 11 15 19 15 22 22 20 20 12
% HBsAg positive 6 4 5 5 7 8 5 4 7 5
% Anti-HCV positive 18 11 8 15 9 10 8 2 7 11
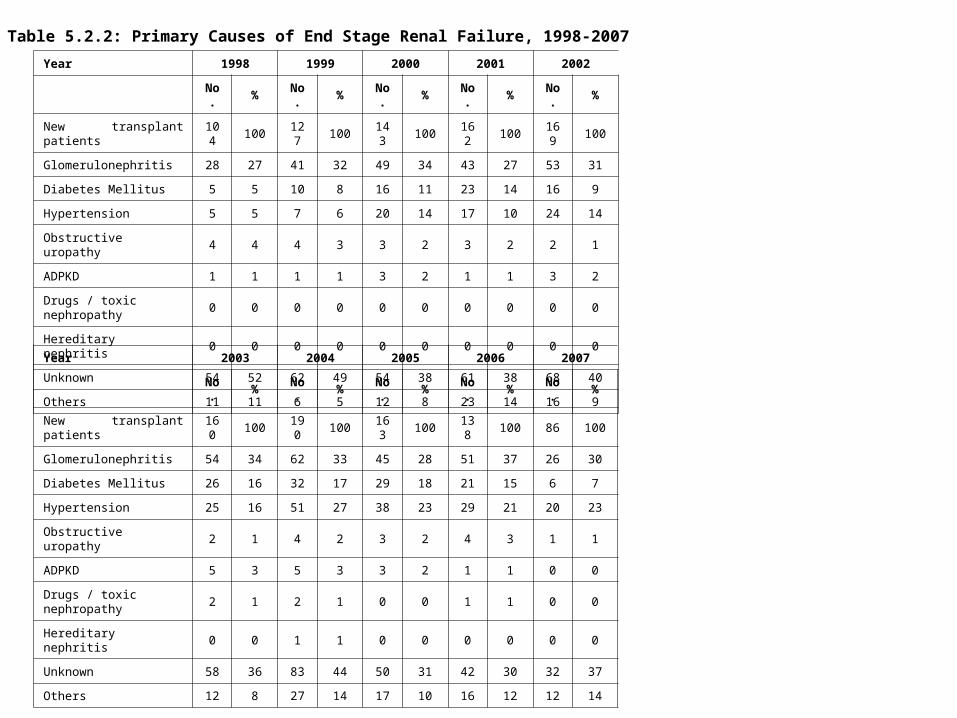
Year 2003 2004 2005 2006 2007
No. % No. % No. % No. % No. %
New transplant patients 160 100 190 100 163 100 138 100 86 100
Glomerulonephritis 54 34 62 33 45 28 51 37 26 30
Diabetes Mellitus 26 16 32 17 29 18 21 15 6 7
Hypertension 25 16 51 27 38 23 29 21 20 23
Obstructive uropathy 2 1 4 2 3 2 4 3 1 1
ADPKD 5 3 5 3 3 2 1 1 0 0
Drugs / toxic nephropathy 2 1 2 1 0 0 1 1 0 0
Hereditary nephritis 0 0 1 1 0 0 0 0 0 0
Unknown 58 36 83 44 50 31 42 30 32 37
Others 12 8 27 14 17 10 16 12 12 14
Table 5.2.2: Primary Causes of End Stage Renal Failure, 1998-2007
Year 1998 1999 2000 2001 2002
No. % No. % No. % No. % No. %
New transplant patients 104 100 127 100 143 100 162 100 169 100
Glomerulonephritis 28 27 41 32 49 34 43 27 53 31
Diabetes Mellitus 5 5 10 8 16 11 23 14 16 9
Hypertension 5 5 7 6 20 14 17 10 24 14
Obstructive uropathy 4 4 4 3 3 2 3 2 2 1
ADPKD 1 1 1 1 3 2 1 1 3 2
Drugs / toxic nephropathy 0 0 0 0 0 0 0 0 0 0
Hereditary nephritis 0 0 0 0 0 0 0 0 0 0
Unknown 54 52 62 49 54 38 61 38 68 40
Others 11 11 6 5 12 8 23 14 16 9
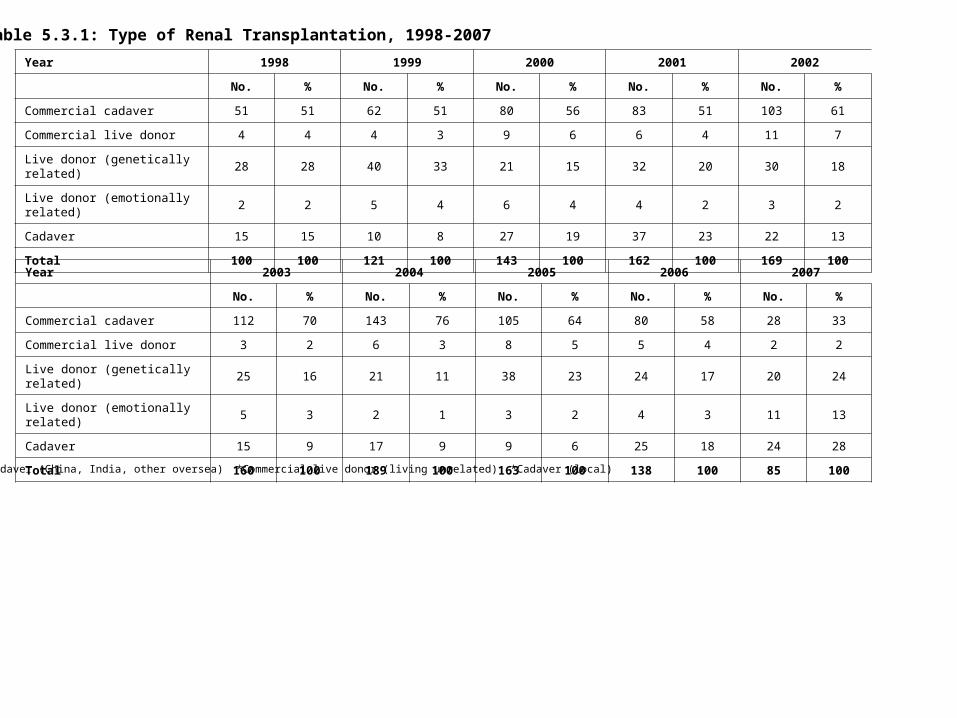
Table 5.3.1: Type of Renal Transplantation, 1998-2007
*Commercial Cadaver (China, India, other oversea) *Commercial live donor (living unrelated) *Cadaver (local)
Year 1998 1999 2000 2001 2002
No. % No. % No. % No. % No. %
Commercial cadaver 51 51 62 51 80 56 83 51 103 61
Commercial live donor 4 4 4 3 9 6 6 4 11 7
Live donor (genetically related) 28 28 40 33 21 15 32 20 30 18
Live donor (emotionally related) 2 2 5 4 6 4 4 2 3 2
Cadaver 15 15 10 8 27 19 37 23 22 13
Total 100 100 121 100 143 100 162 100 169 100
Year 2003 2004 2005 2006 2007
No. % No. % No. % No. % No. %
Commercial cadaver 112 70 143 76 105 64 80 58 28 33
Commercial live donor 3 2 6 3 8 5 5 4 2 2
Live donor (genetically related) 25 16 21 11 38 23 24 17 20 24
Live donor (emotionally related) 5 3 2 1 3 2 4 3 11 13
Cadaver 15 9 17 9 9 6 25 18 24 28
Total 160 100 189 100 163 100 138 100 85 100
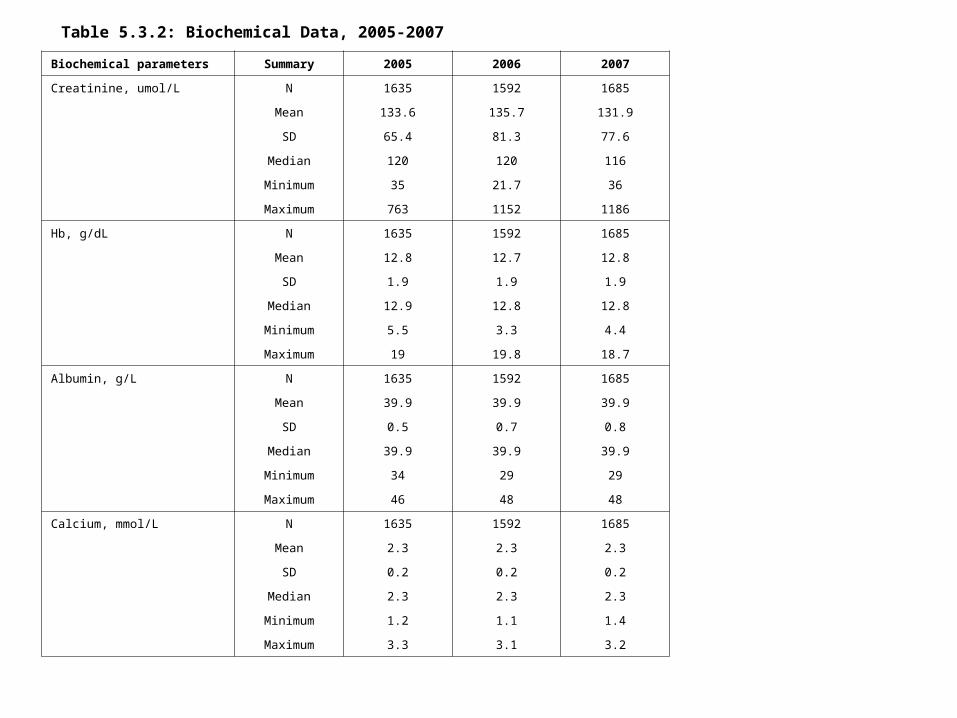
Table 5.3.2: Biochemical Data, 2005-2007
Biochemical parameters Summary 2005 2006 2007
Creatinine, umol/L N 1635 1592 1685
Mean 133.6 135.7 131.9
SD 65.4 81.3 77.6
Median 120 120 116
Minimum 35 21.7 36
Maximum 763 1152 1186
Hb, g/dL N 1635 1592 1685
Mean 12.8 12.7 12.8
SD 1.9 1.9 1.9
Median 12.9 12.8 12.8
Minimum 5.5 3.3 4.4
Maximum 19 19.8 18.7
Albumin, g/L N 1635 1592 1685
Mean 39.9 39.9 39.9
SD 0.5 0.7 0.8
Median 39.9 39.9 39.9
Minimum 34 29 29
Maximum 46 48 48
Calcium, mmol/L N 1635 1592 1685
Mean 2.3 2.3 2.3
SD 0.2 0.2 0.2
Median 2.3 2.3 2.3
Minimum 1.2 1.1 1.4
Maximum 3.3 3.1 3.2
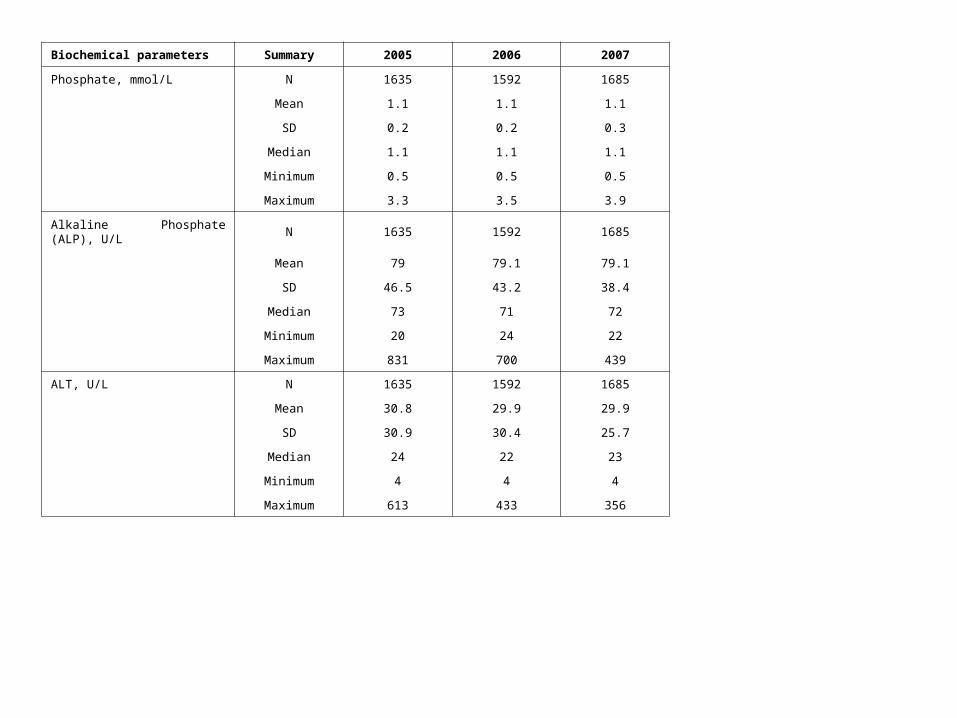
Phosphate, mmol/L N 1635 1592 1685
Mean 1.1 1.1 1.1
SD 0.2 0.2 0.3
Median 1.1 1.1 1.1
Minimum 0.5 0.5 0.5
Maximum 3.3 3.5 3.9
Alkaline Phosphate (ALP), U/L N 1635 1592 1685
Mean 79 79.1 79.1
SD 46.5 43.2 38.4
Median 73 71 72
Minimum 20 24 22
Maximum 831 700 439
ALT, U/L N 1635 1592 1685
Mean 30.8 29.9 29.9
SD 30.9 30.4 25.7
Median 24 22 23
Minimum 4 4 4
Maximum 613 433 356
Biochemical parameters Summary 2005 2006 2007
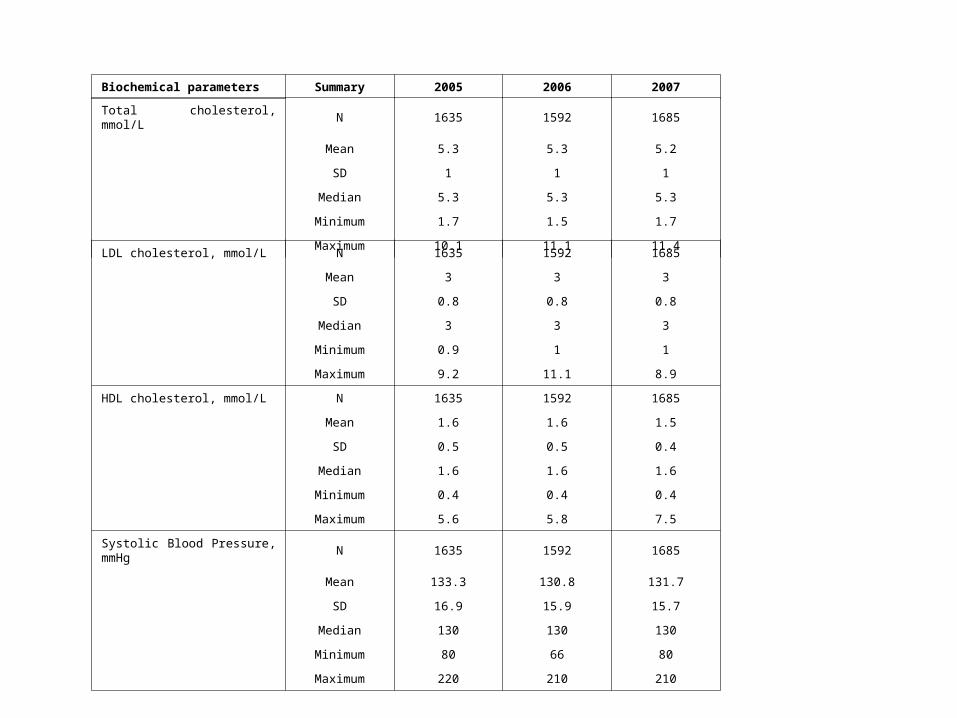
Total cholesterol, mmol/L N 1635 1592 1685
Mean 5.3 5.3 5.2
SD 1 1 1
Median 5.3 5.3 5.3
Minimum 1.7 1.5 1.7
Maximum 10.1 11.1 11.4
LDL cholesterol, mmol/L N 1635 1592 1685
Mean 3 3 3
SD 0.8 0.8 0.8
Median 3 3 3
Minimum 0.9 1 1
Maximum 9.2 11.1 8.9
HDL cholesterol, mmol/L N 1635 1592 1685
Mean 1.6 1.6 1.5
SD 0.5 0.5 0.4
Median 1.6 1.6 1.6
Minimum 0.4 0.4 0.4
Maximum 5.6 5.8 7.5
Systolic Blood Pressure, mmHg N 1635 1592 1685
Mean 133.3 130.8 131.7
SD 16.9 15.9 15.7
Median 130 130 130
Minimum 80 66 80
Maximum 220 210 210
Biochemical parameters Summary 2005 2006 2007
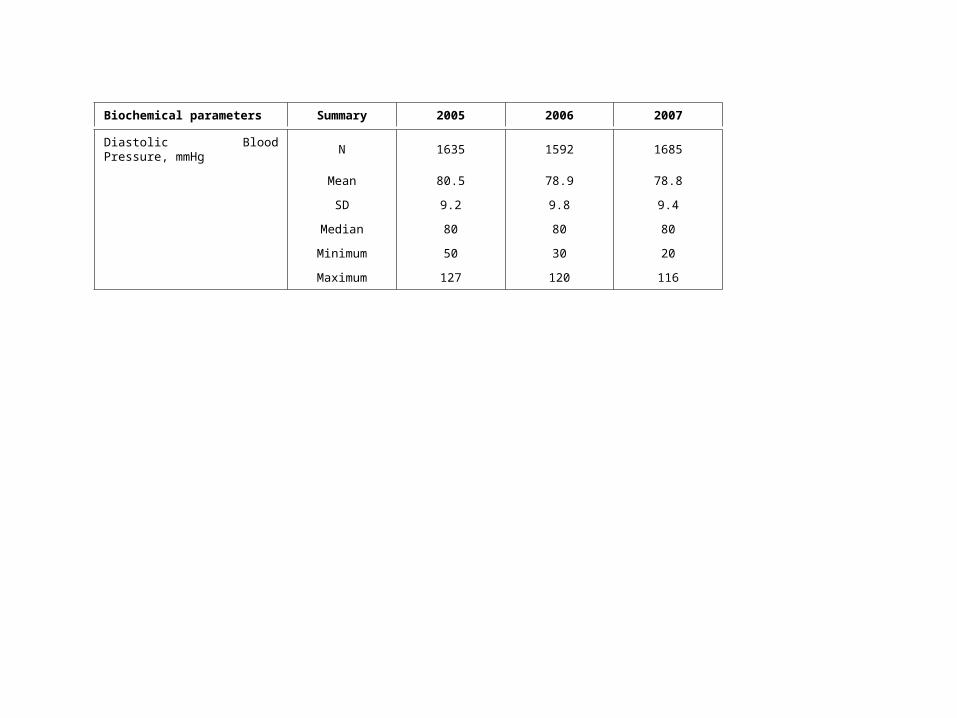
Biochemical parameters Summary 2005 2006 2007
Diastolic Blood Pressure, mmHg N 1635 1592 1685
Mean 80.5 78.9 78.8
SD 9.2 9.8 9.4
Median 80 80 80
Minimum 50 30 20
Maximum 127 120 116
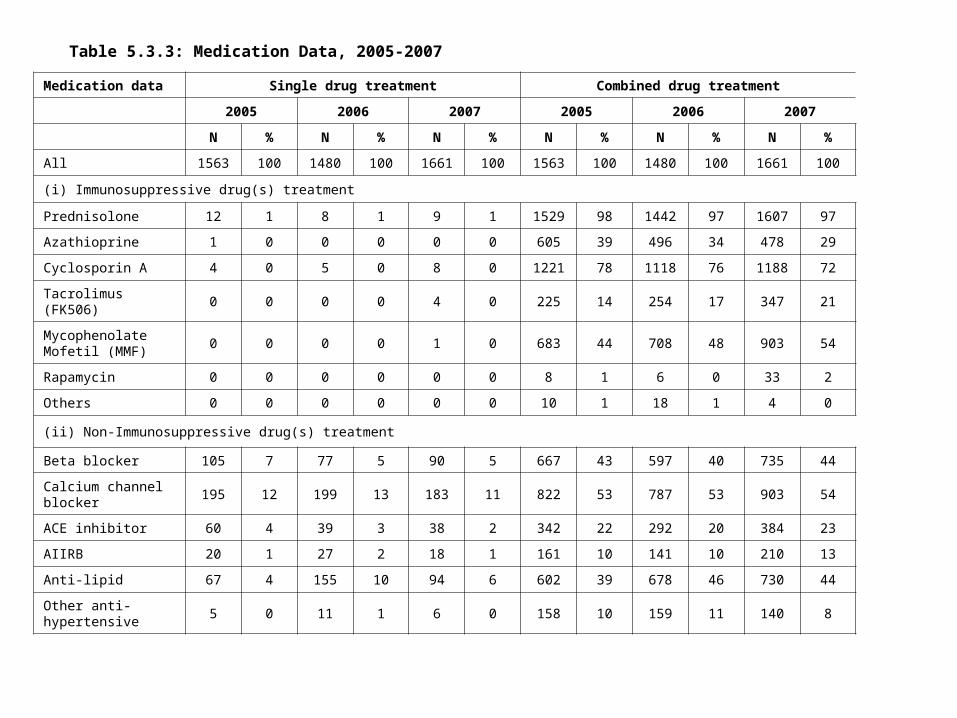
Table 5.3.3: Medication Data, 2005-2007
Medication data Single drug treatment Combined drug treatment
2005 2006 2007 2005 2006 2007
N % N % N % N % N % N %
All 1563 100 1480 100 1661 100 1563 100 1480 100 1661 100
(i) Immunosuppressive drug(s) treatment
Prednisolone 12 1 8 1 9 1 1529 98 1442 97 1607 97
Azathioprine 1 0 0 0 0 0 605 39 496 34 478 29
Cyclosporin A 4 0 5 0 8 0 1221 78 1118 76 1188 72
Tacrolimus (FK506) 0 0 0 0 4 0 225 14 254 17 347 21
Mycophenolate Mofetil (MMF)
0 0 0 0 1 0 683 44 708 48 903 54
Rapamycin 0 0 0 0 0 0 8 1 6 0 33 2
Others 0 0 0 0 0 0 10 1 18 1 4 0
(ii) Non-Immunosuppressive drug(s) treatment
Beta blocker 105 7 77 5 90 5 667 43 597 40 735 44
Calcium channel blocker
195 12 199 13 183 11 822 53 787 53 903 54
ACE inhibitor 60 4 39 3 38 2 342 22 292 20 384 23
AIIRB 20 1 27 2 18 1 161 10 141 10 210 13
Anti-lipid 67 4 155 10 94 6 602 39 678 46 730 44
Other anti-hypertensive 5 0 11 1 6 0 158 10 159 11 140 8
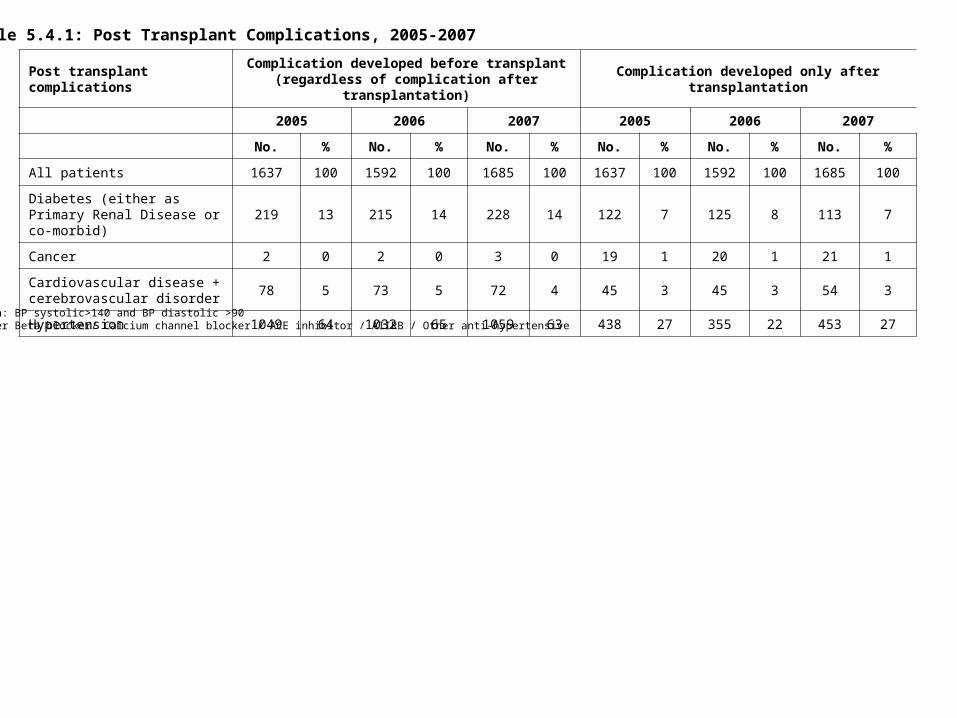
Table 5.4.1: Post Transplant Complications, 2005-2007
Post transplant complicationsComplication developed before transplant (regardless of
complication after transplantation)Complication developed only after transplantation
2005 2006 2007 2005 2006 2007
No. % No. % No. % No. % No. % No. %
All patients 1637 100 1592 100 1685 100 1637 100 1592 100 1685 100
Diabetes (either as Primary Renal Disease or co-morbid)
219 13 215 14 228 14 122 7 125 8 113 7
Cancer 2 0 2 0 3 0 19 1 20 1 21 1
Cardiovascular disease + cerebrovascular disorder
78 5 73 5 72 4 45 3 45 3 54 3
Hypertension 1049 64 1032 65 1059 63 438 27 355 22 453 27
*Hypertension: BP systolic>140 and BP diastolic >90OR have either Beta blocker/ Calcium channel blocker / ACE inhibitor / AIIRB / Other anti-hypertensive
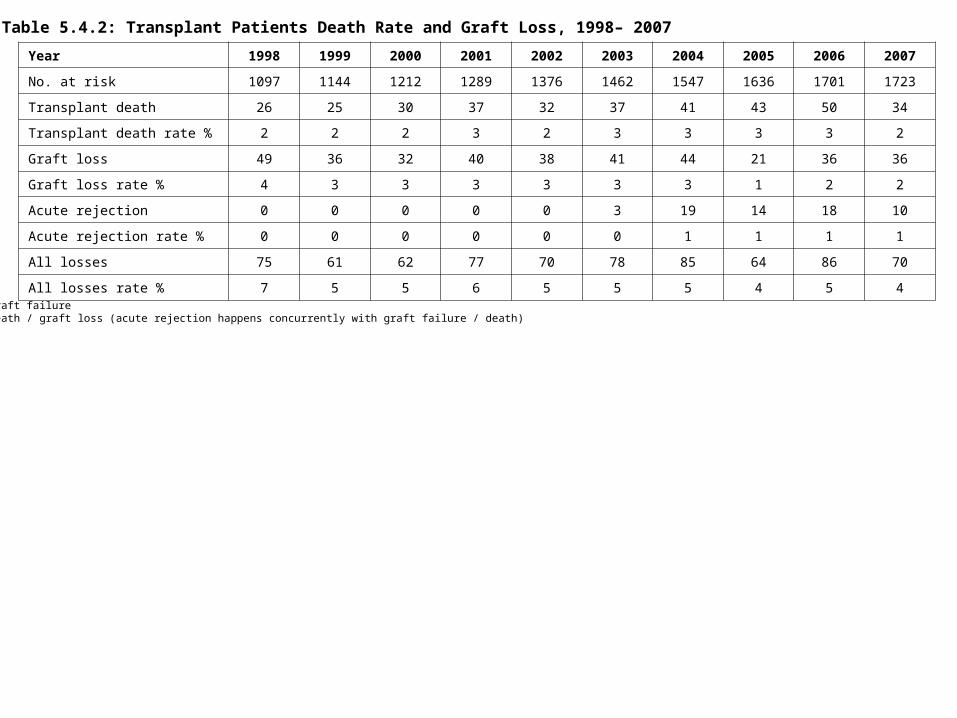
Table 5.4.2: Transplant Patients Death Rate and Graft Loss, 1998– 2007
Year 1998 1999 2000 2001 2002 2003 2004 2005 2006 2007
No. at risk 1097 1144 1212 1289 1376 1462 1547 1636 1701 1723
Transplant death 26 25 30 37 32 37 41 43 50 34
Transplant death rate % 2 2 2 3 2 3 3 3 3 2
Graft loss 49 36 32 40 38 41 44 21 36 36
Graft loss rate % 4 3 3 3 3 3 3 1 2 2
Acute rejection 0 0 0 0 0 3 19 14 18 10
Acute rejection rate % 0 0 0 0 0 0 1 1 1 1
All losses 75 61 62 77 70 78 85 64 86 70
All losses rate % 7 5 5 6 5 5 5 4 5 4*Graft loss=graft failure*All losses=death / graft loss (acute rejection happens concurrently with graft failure / death)
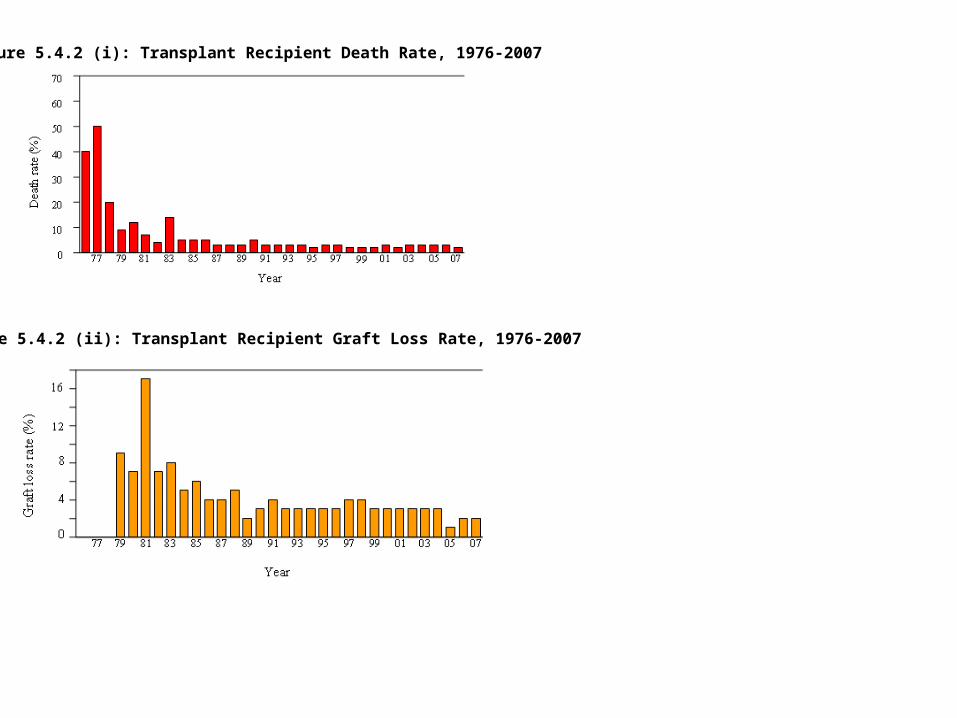
Figure 5.4.2 (i): Transplant Recipient Death Rate, 1976-2007
Figure 5.4.2 (ii): Transplant Recipient Graft Loss Rate, 1976-2007
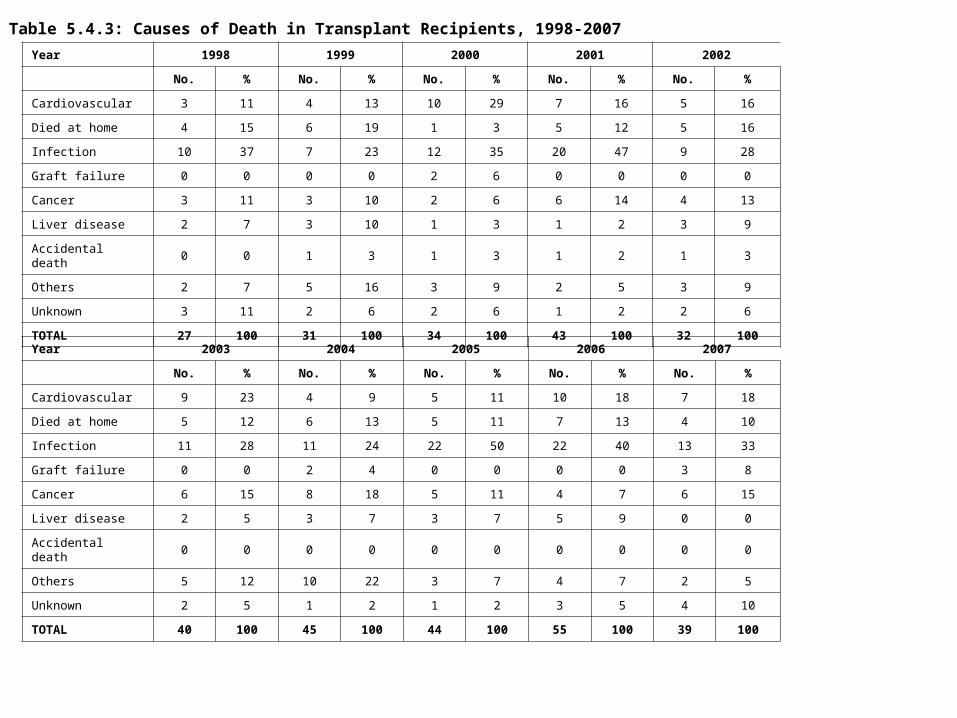
Table 5.4.3: Causes of Death in Transplant Recipients, 1998-2007
Year 1998 1999 2000 2001 2002
No. % No. % No. % No. % No. %
Cardiovascular 3 11 4 13 10 29 7 16 5 16
Died at home 4 15 6 19 1 3 5 12 5 16
Infection 10 37 7 23 12 35 20 47 9 28
Graft failure 0 0 0 0 2 6 0 0 0 0
Cancer 3 11 3 10 2 6 6 14 4 13
Liver disease 2 7 3 10 1 3 1 2 3 9
Accidental death 0 0 1 3 1 3 1 2 1 3
Others 2 7 5 16 3 9 2 5 3 9
Unknown 3 11 2 6 2 6 1 2 2 6
TOTAL 27 100 31 100 34 100 43 100 32 100
Year 2003 2004 2005 2006 2007
No. % No. % No. % No. % No. %
Cardiovascular 9 23 4 9 5 11 10 18 7 18
Died at home 5 12 6 13 5 11 7 13 4 10
Infection 11 28 11 24 22 50 22 40 13 33
Graft failure 0 0 2 4 0 0 0 0 3 8
Cancer 6 15 8 18 5 11 4 7 6 15
Liver disease 2 5 3 7 3 7 5 9 0 0
Accidental death 0 0 0 0 0 0 0 0 0 0
Others 5 12 10 22 3 7 4 7 2 5
Unknown 2 5 1 2 1 2 3 5 4 10
TOTAL 40 100 45 100 44 100 55 100 39 100
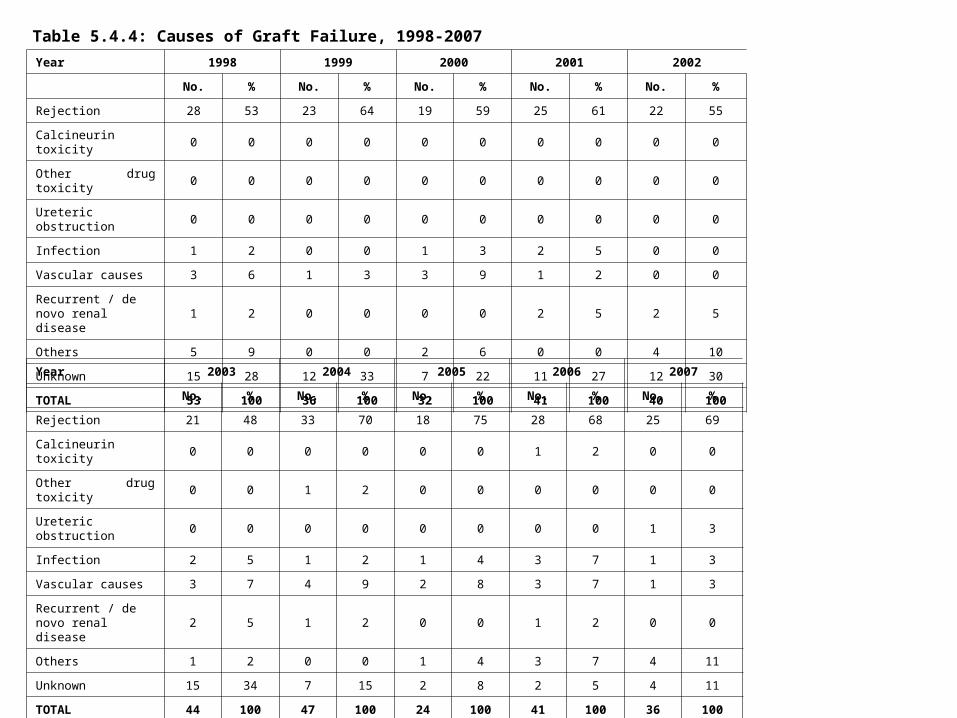
Table 5.4.4: Causes of Graft Failure, 1998-2007
Year 1998 1999 2000 2001 2002
No. % No. % No. % No. % No. %
Rejection 28 53 23 64 19 59 25 61 22 55
Calcineurin toxicity 0 0 0 0 0 0 0 0 0 0
Other drug toxicity 0 0 0 0 0 0 0 0 0 0
Ureteric obstruction 0 0 0 0 0 0 0 0 0 0
Infection 1 2 0 0 1 3 2 5 0 0
Vascular causes 3 6 1 3 3 9 1 2 0 0
Recurrent / de novo renal disease
1 2 0 0 0 0 2 5 2 5
Others 5 9 0 0 2 6 0 0 4 10
Unknown 15 28 12 33 7 22 11 27 12 30
TOTAL 53 100 36 100 32 100 41 100 40 100
Year 2003 2004 2005 2006 2007
No. % No. % No. % No. % No. %
Rejection 21 48 33 70 18 75 28 68 25 69
Calcineurin toxicity 0 0 0 0 0 0 1 2 0 0
Other drug toxicity 0 0 1 2 0 0 0 0 0 0
Ureteric obstruction 0 0 0 0 0 0 0 0 1 3
Infection 2 5 1 2 1 4 3 7 1 3
Vascular causes 3 7 4 9 2 8 3 7 1 3
Recurrent / de novo renal disease
2 5 1 2 0 0 1 2 0 0
Others 1 2 0 0 1 4 3 7 4 11
Unknown 15 34 7 15 2 8 2 5 4 11
TOTAL 44 100 47 100 24 100 41 100 36 100
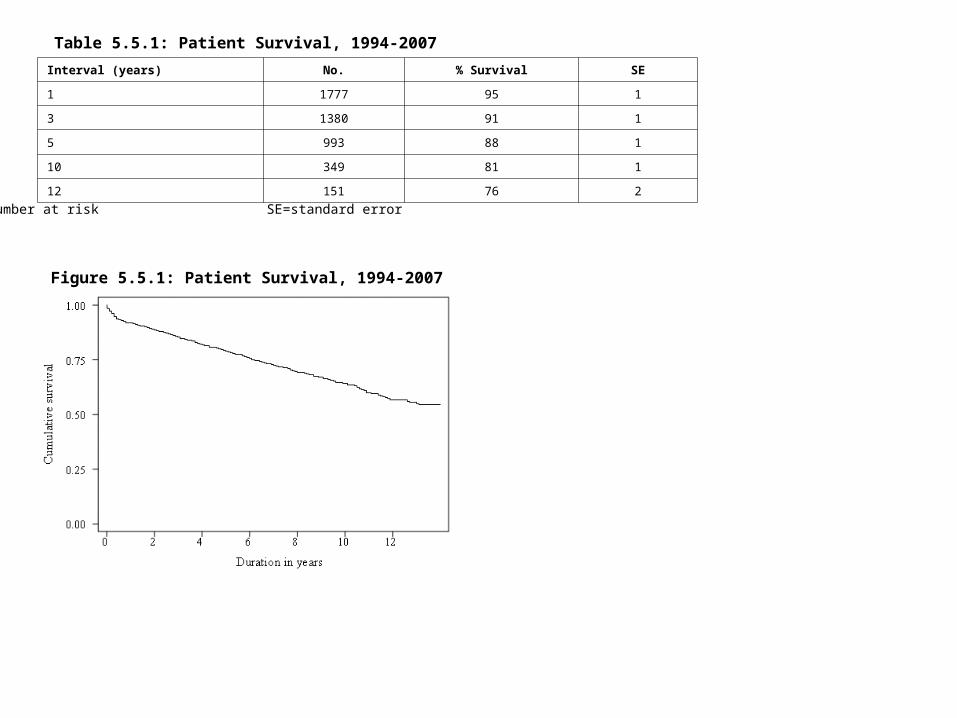
Table 5.5.1: Patient Survival, 1994-2007
Interval (years) No. % Survival SE
1 1777 95 1
3 1380 91 1
5 993 88 1
10 349 81 1
12 151 76 2
No.=Number at risk SE=standard error
Figure 5.5.1: Patient Survival, 1994-2007
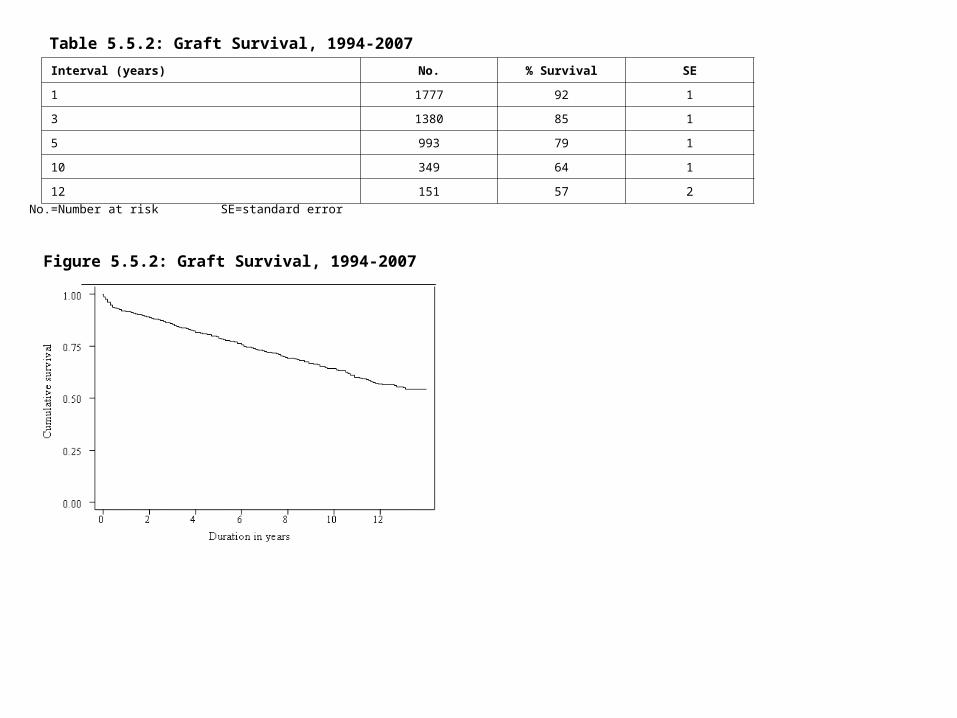
Table 5.5.2: Graft Survival, 1994-2007
Interval (years) No. % Survival SE
1 1777 92 1
3 1380 85 1
5 993 79 1
10 349 64 1
12 151 57 2
No.=Number at risk SE=standard error
Figure 5.5.2: Graft Survival, 1994-2007
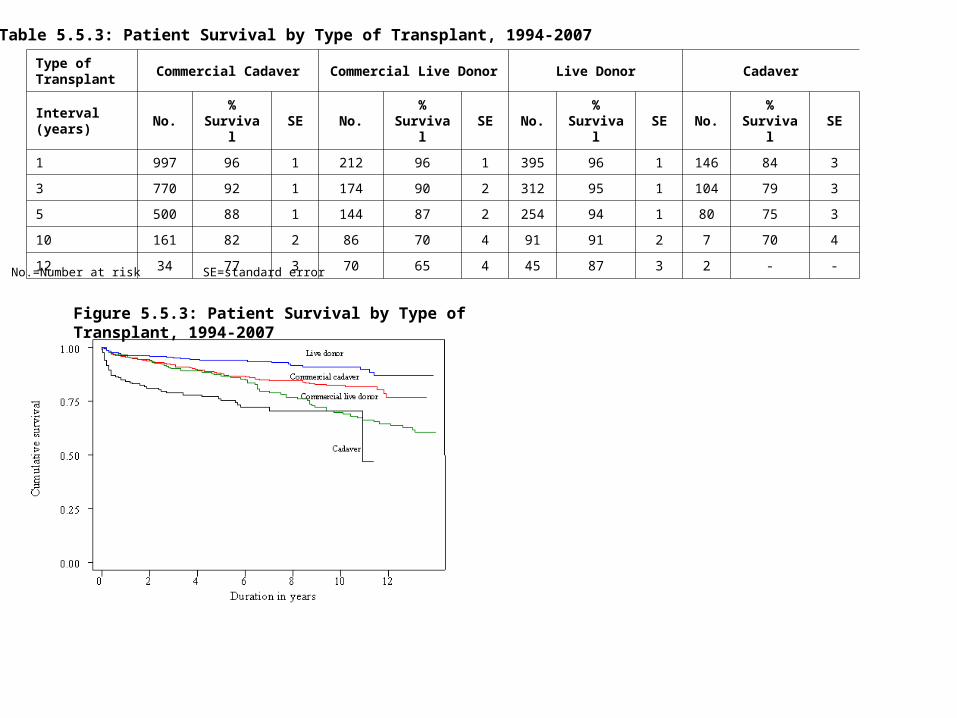
Table 5.5.3: Patient Survival by Type of Transplant, 1994-2007
Type of Transplant
Commercial Cadaver Commercial Live Donor Live Donor Cadaver
Interval (years) No.%
SurvivalSE No.
% Survival
SE No.%
SurvivalSE No.
% Survival
SE
1 997 96 1 212 96 1 395 96 1 146 84 3
3 770 92 1 174 90 2 312 95 1 104 79 3
5 500 88 1 144 87 2 254 94 1 80 75 3
10 161 82 2 86 70 4 91 91 2 7 70 4
12 34 77 3 70 65 4 45 87 3 2 - -
No.=Number at risk SE=standard error
Figure 5.5.3: Patient Survival by Type of Transplant, 1994-2007
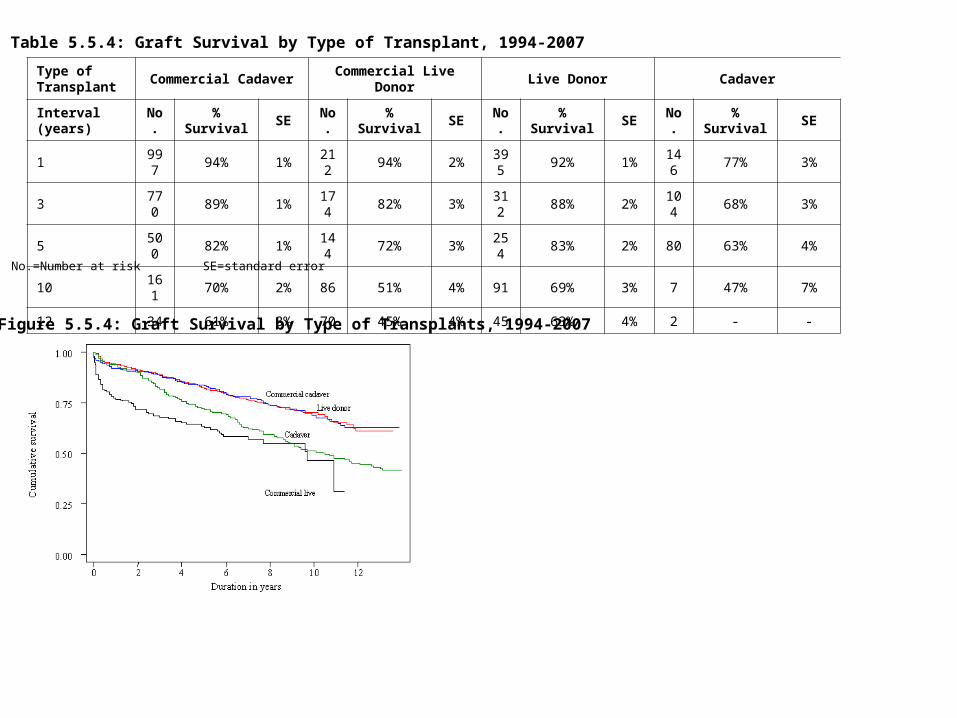
Table 5.5.4: Graft Survival by Type of Transplant, 1994-2007
Type of Transplant
Commercial Cadaver Commercial Live Donor Live Donor Cadaver
Interval (years) No. % Survival SE No. % Survival SE No. % Survival SE No. % Survival SE
1 997 94% 1% 212 94% 2% 395 92% 1% 146 77% 3%
3 770 89% 1% 174 82% 3% 312 88% 2% 104 68% 3%
5 500 82% 1% 144 72% 3% 254 83% 2% 80 63% 4%
10 161 70% 2% 86 51% 4% 91 69% 3% 7 47% 7%
12 34 61% 3% 70 45% 4% 45 63% 4% 2 - -
No.=Number at risk SE=standard error
Figure 5.5.4: Graft Survival by Type of Transplants, 1994-2007
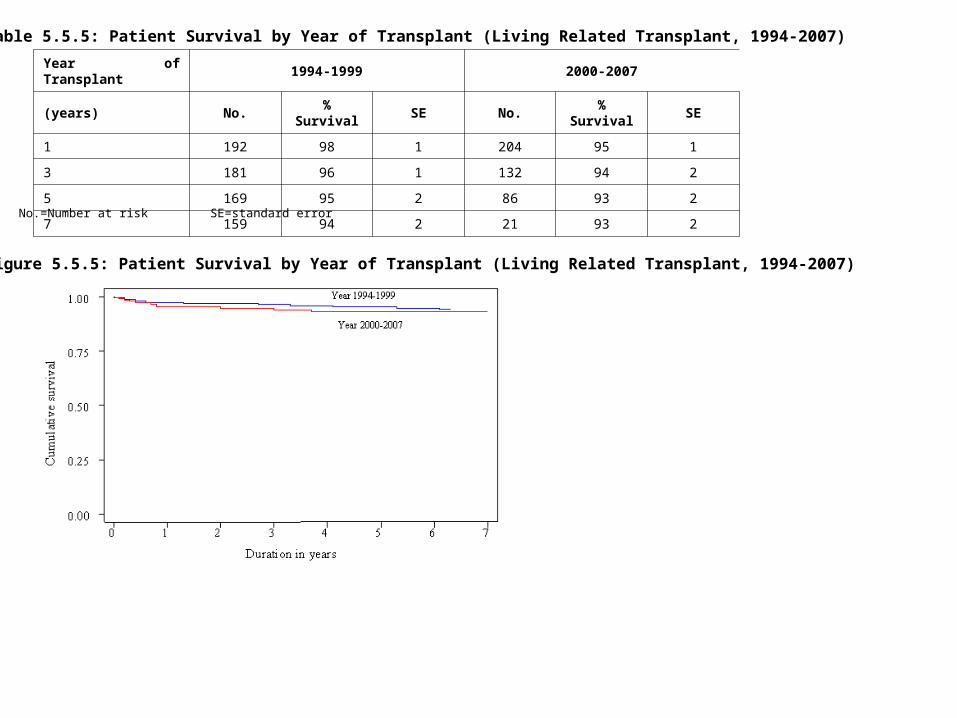
Table 5.5.5: Patient Survival by Year of Transplant (Living Related Transplant, 1994-2007)
Year of Transplant 1994-1999 2000-2007
(years) No. % Survival SE No. % Survival SE
1 192 98 1 204 95 1
3 181 96 1 132 94 2
5 169 95 2 86 93 2
7 159 94 2 21 93 2
No.=Number at risk SE=standard error
Figure 5.5.5: Patient Survival by Year of Transplant (Living Related Transplant, 1994-2007)
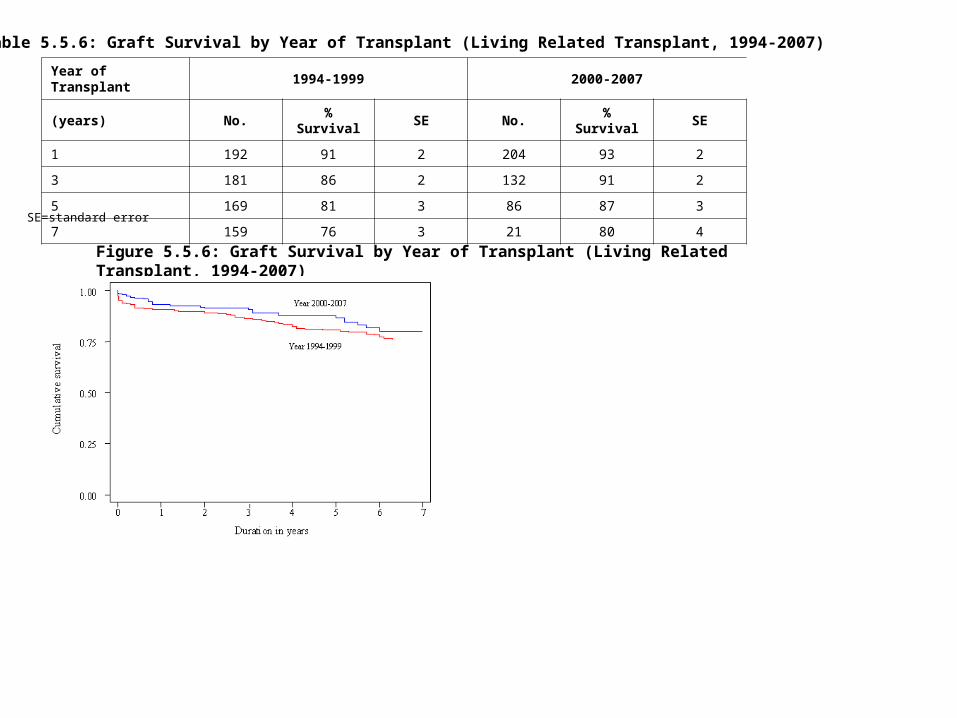
Table 5.5.6: Graft Survival by Year of Transplant (Living Related Transplant, 1994-2007)
Year of Transplant 1994-1999 2000-2007
(years) No. % Survival SE No. % Survival SE
1 192 91 2 204 93 2
3 181 86 2 132 91 2
5 169 81 3 86 87 3
7 159 76 3 21 80 4SE=standard error
Figure 5.5.6: Graft Survival by Year of Transplant (Living Related Transplant, 1994-2007)
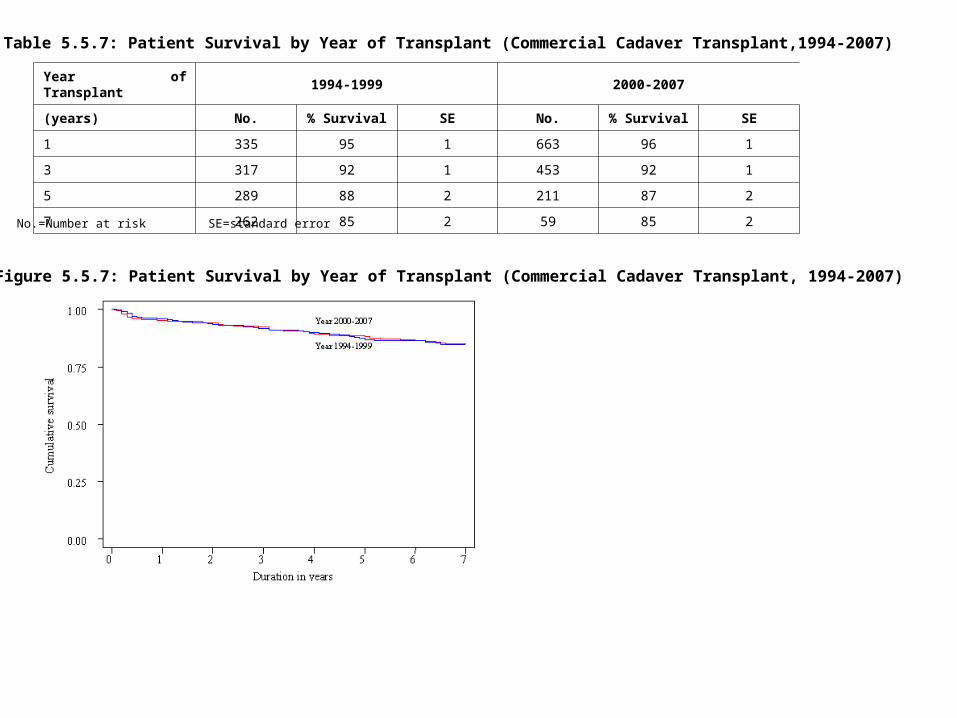
Table 5.5.7: Patient Survival by Year of Transplant (Commercial Cadaver Transplant,1994-2007)
Year of Transplant 1994-1999 2000-2007
(years) No. % Survival SE No. % Survival SE
1 335 95 1 663 96 1
3 317 92 1 453 92 1
5 289 88 2 211 87 2
7 262 85 2 59 85 2No.=Number at risk SE=standard error
Figure 5.5.7: Patient Survival by Year of Transplant (Commercial Cadaver Transplant, 1994-2007)
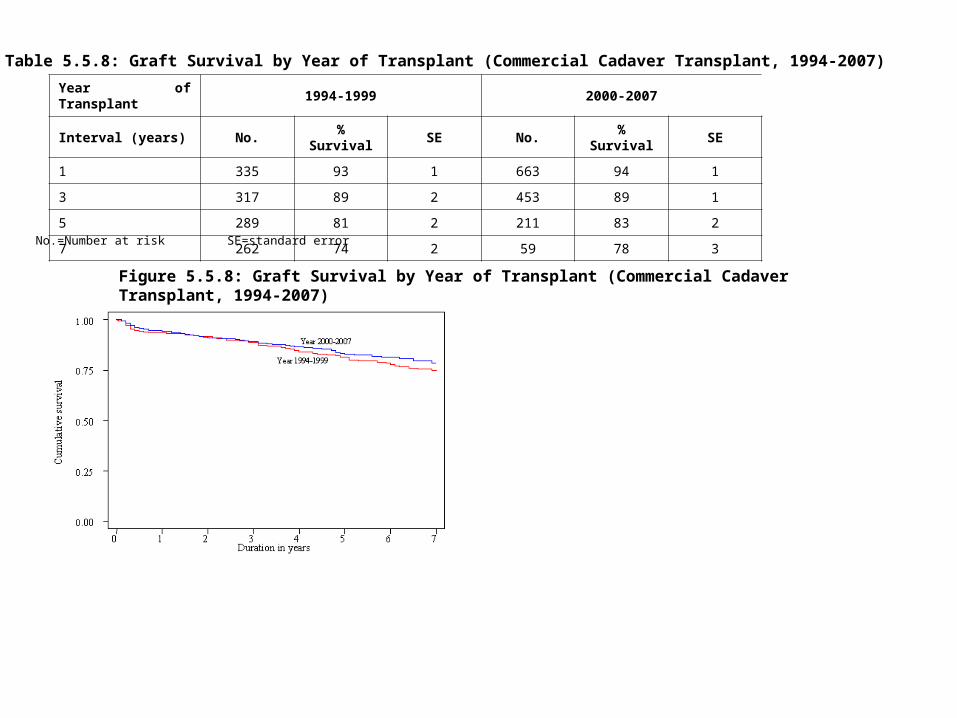
Table 5.5.8: Graft Survival by Year of Transplant (Commercial Cadaver Transplant, 1994-2007)
Year of Transplant 1994-1999 2000-2007
Interval (years) No. % Survival SE No. % Survival SE
1 335 93 1 663 94 1
3 317 89 2 453 89 1
5 289 81 2 211 83 2
7 262 74 2 59 78 3
No.=Number at risk SE=standard error
Figure 5.5.8: Graft Survival by Year of Transplant (Commercial Cadaver Transplant, 1994-2007)
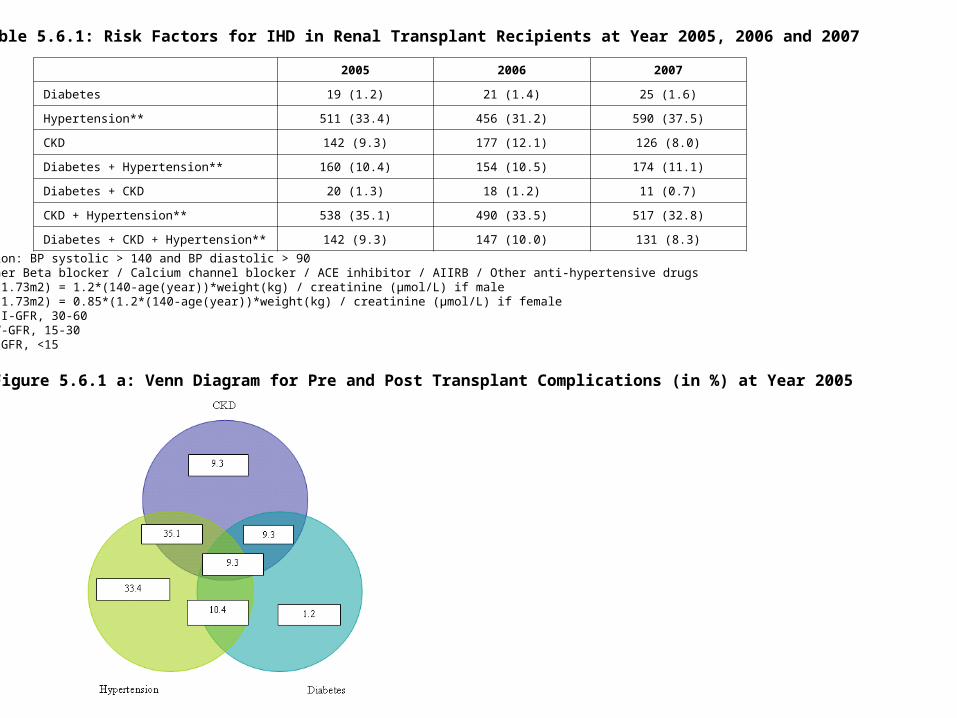
Table 5.6.1: Risk Factors for IHD in Renal Transplant Recipients at Year 2005, 2006 and 2007
2005 2006 2007
Diabetes 19 (1.2) 21 (1.4) 25 (1.6)
Hypertension** 511 (33.4) 456 (31.2) 590 (37.5)
CKD 142 (9.3) 177 (12.1) 126 (8.0)
Diabetes + Hypertension** 160 (10.4) 154 (10.5) 174 (11.1)
Diabetes + CKD 20 (1.3) 18 (1.2) 11 (0.7)
CKD + Hypertension** 538 (35.1) 490 (33.5) 517 (32.8)
Diabetes + CKD + Hypertension** 142 (9.3) 147 (10.0) 131 (8.3)
**Hypertension: BP systolic > 140 and BP diastolic > 90OR have either Beta blocker / Calcium channel blocker / ACE inhibitor / AIIRB / Other anti-hypertensive drugsGFR (mL/min/1.73m2) = 1.2*(140-age(year))*weight(kg) / creatinine (µmol/L) if maleGFR (mL/min/1.73m2) = 0.85*(1.2*(140-age(year))*weight(kg) / creatinine (µmol/L) if femaleCKD stage III-GFR, 30-60CKD stage IV-GFR, 15-30CKD stage V-GFR, <15
Figure 5.6.1 a: Venn Diagram for Pre and Post Transplant Complications (in %) at Year 2005
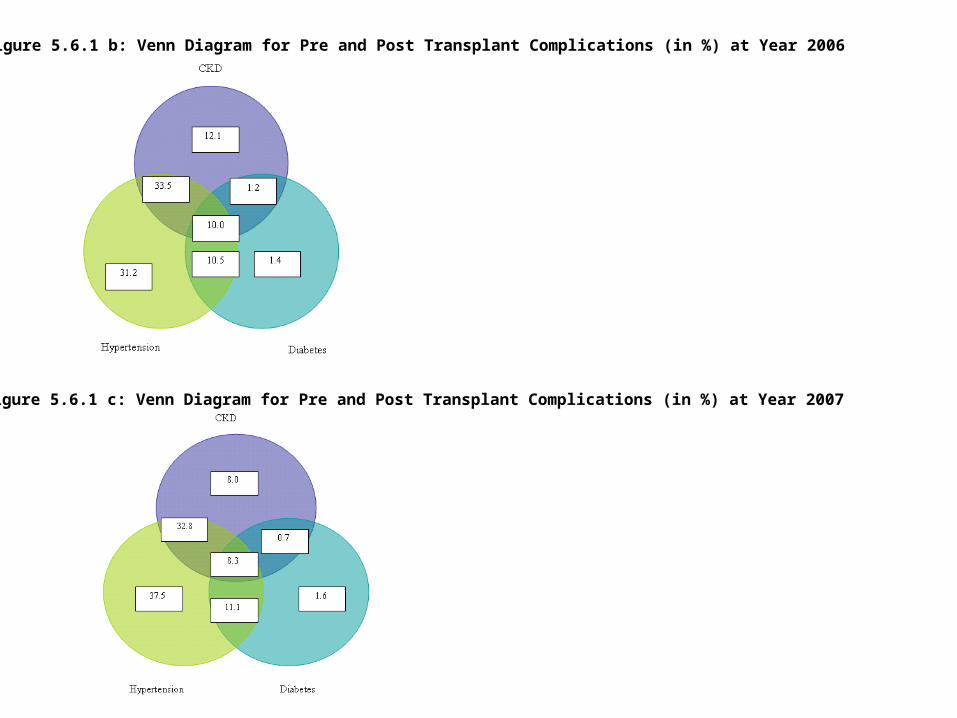
Figure 5.6.1 b: Venn Diagram for Pre and Post Transplant Complications (in %) at Year 2006
Figure 5.6.1 c: Venn Diagram for Pre and Post Transplant Complications (in %) at Year 2007
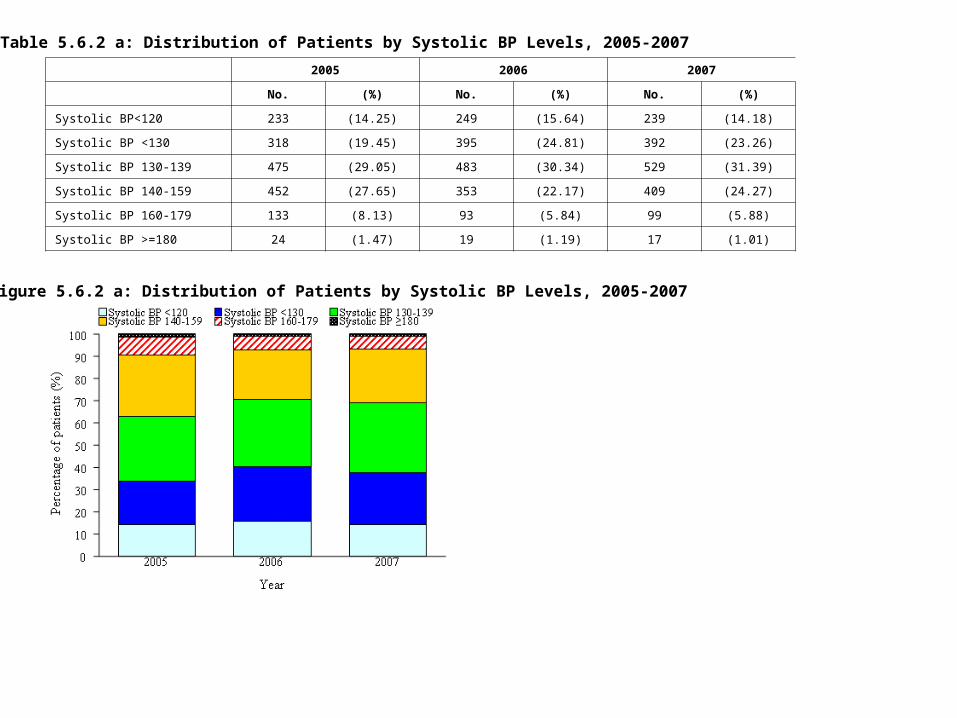
Table 5.6.2 a: Distribution of Patients by Systolic BP Levels, 2005-2007
2005 2006 2007
No. (%) No. (%) No. (%)
Systolic BP<120 233 (14.25) 249 (15.64) 239 (14.18)
Systolic BP <130 318 (19.45) 395 (24.81) 392 (23.26)
Systolic BP 130-139 475 (29.05) 483 (30.34) 529 (31.39)
Systolic BP 140-159 452 (27.65) 353 (22.17) 409 (24.27)
Systolic BP 160-179 133 (8.13) 93 (5.84) 99 (5.88)
Systolic BP >=180 24 (1.47) 19 (1.19) 17 (1.01)
Figure 5.6.2 a: Distribution of Patients by Systolic BP Levels, 2005-2007
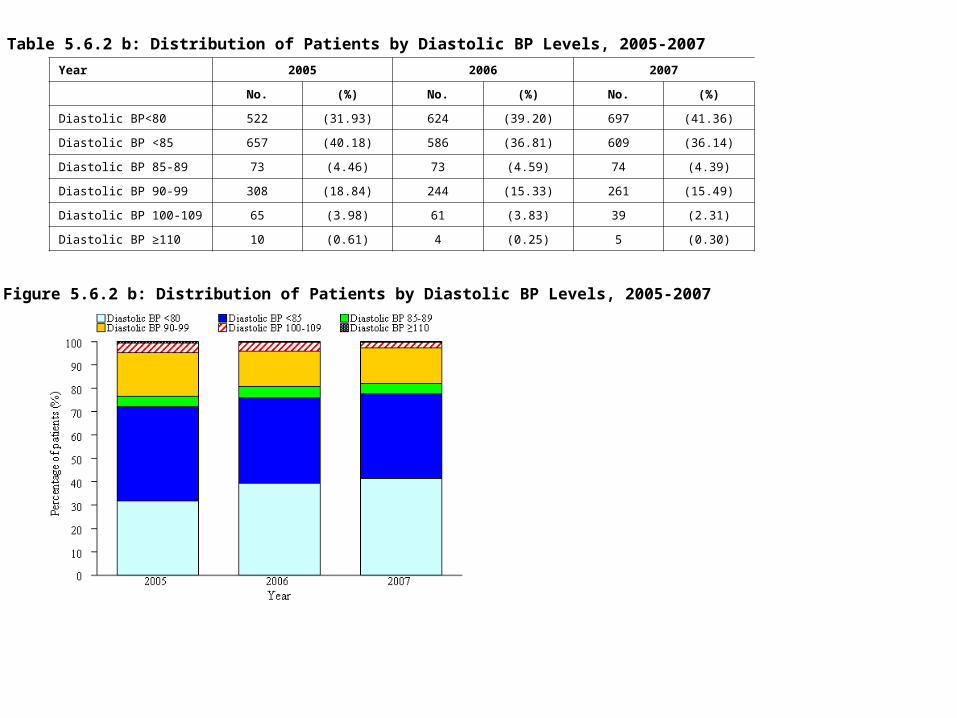
Table 5.6.2 b: Distribution of Patients by Diastolic BP Levels, 2005-2007
Year 2005 2006 2007
No. (%) No. (%) No. (%)
Diastolic BP<80 522 (31.93) 624 (39.20) 697 (41.36)
Diastolic BP <85 657 (40.18) 586 (36.81) 609 (36.14)
Diastolic BP 85-89 73 (4.46) 73 (4.59) 74 (4.39)
Diastolic BP 90-99 308 (18.84) 244 (15.33) 261 (15.49)
Diastolic BP 100-109 65 (3.98) 61 (3.83) 39 (2.31)
Diastolic BP ≥110 10 (0.61) 4 (0.25) 5 (0.30)
Figure 5.6.2 b: Distribution of Patients by Diastolic BP Levels, 2005-2007
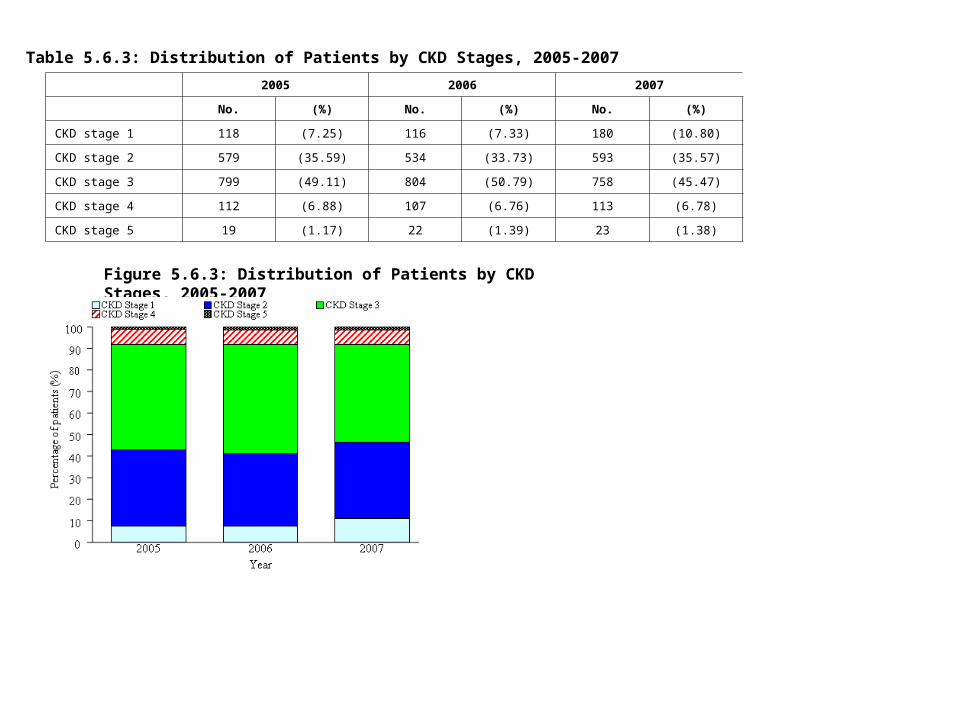
Table 5.6.3: Distribution of Patients by CKD Stages, 2005-2007
2005 2006 2007
No. (%) No. (%) No. (%)
CKD stage 1 118 (7.25) 116 (7.33) 180 (10.80)
CKD stage 2 579 (35.59) 534 (33.73) 593 (35.57)
CKD stage 3 799 (49.11) 804 (50.79) 758 (45.47)
CKD stage 4 112 (6.88) 107 (6.76) 113 (6.78)
CKD stage 5 19 (1.17) 22 (1.39) 23 (1.38)
Figure 5.6.3: Distribution of Patients by CKD Stages, 2005-2007
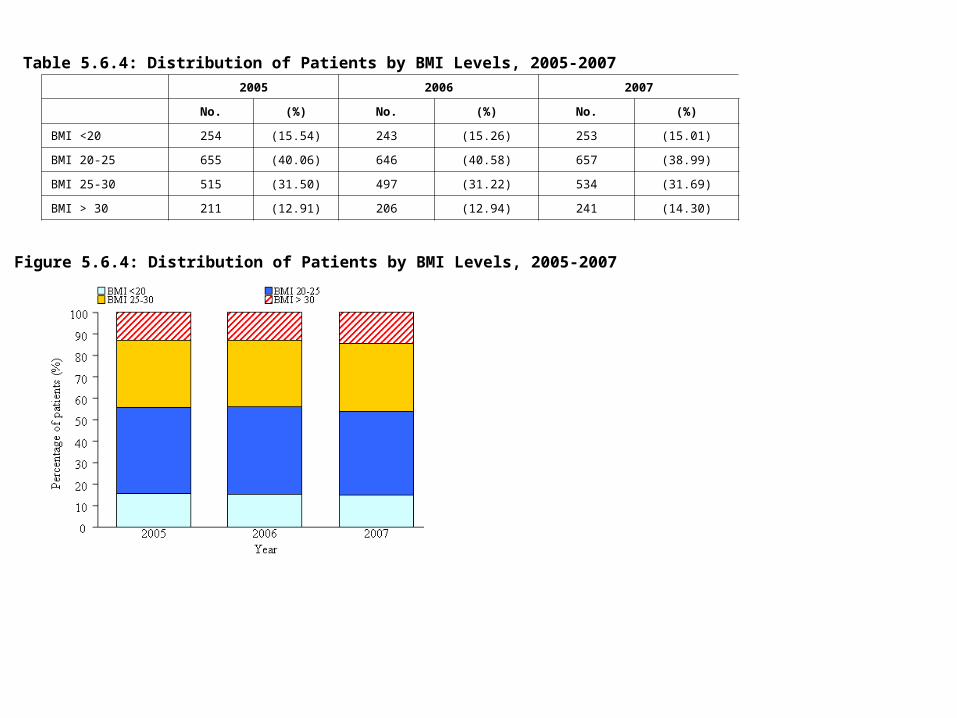
Table 5.6.4: Distribution of Patients by BMI Levels, 2005-2007
2005 2006 2007
No. (%) No. (%) No. (%)
BMI <20 254 (15.54) 243 (15.26) 253 (15.01)
BMI 20-25 655 (40.06) 646 (40.58) 657 (38.99)
BMI 25-30 515 (31.50) 497 (31.22) 534 (31.69)
BMI > 30 211 (12.91) 206 (12.94) 241 (14.30)
Figure 5.6.4: Distribution of Patients by BMI Levels, 2005-2007
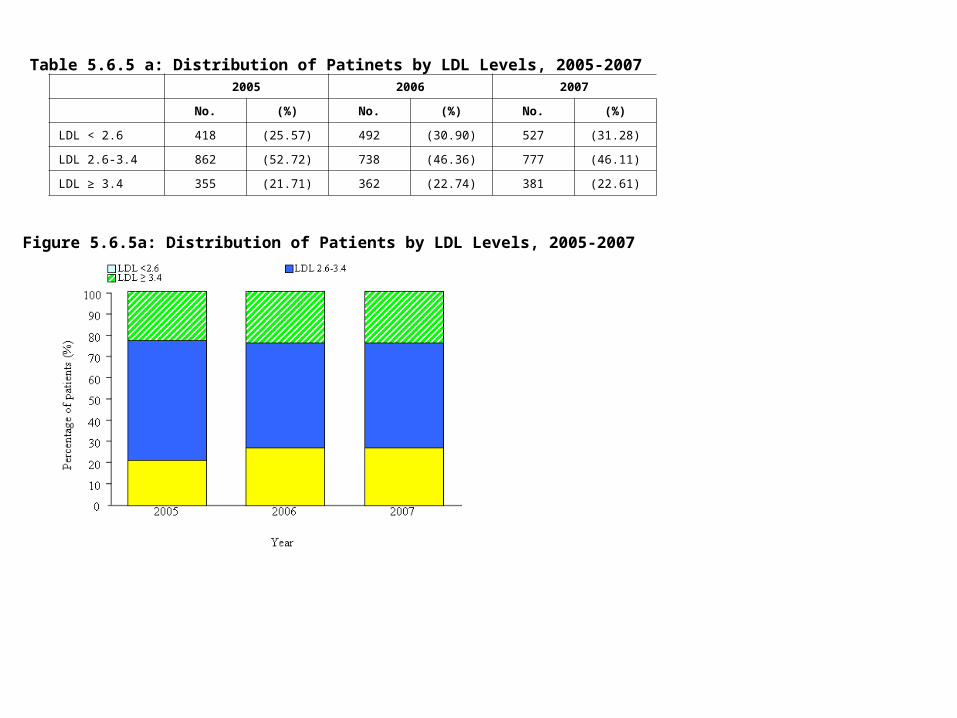
Table 5.6.5 a: Distribution of Patinets by LDL Levels, 2005-20072005 2006 2007
No. (%) No. (%) No. (%)
LDL < 2.6 418 (25.57) 492 (30.90) 527 (31.28)
LDL 2.6-3.4 862 (52.72) 738 (46.36) 777 (46.11)
LDL ≥ 3.4 355 (21.71) 362 (22.74) 381 (22.61)
Figure 5.6.5a: Distribution of Patients by LDL Levels, 2005-2007
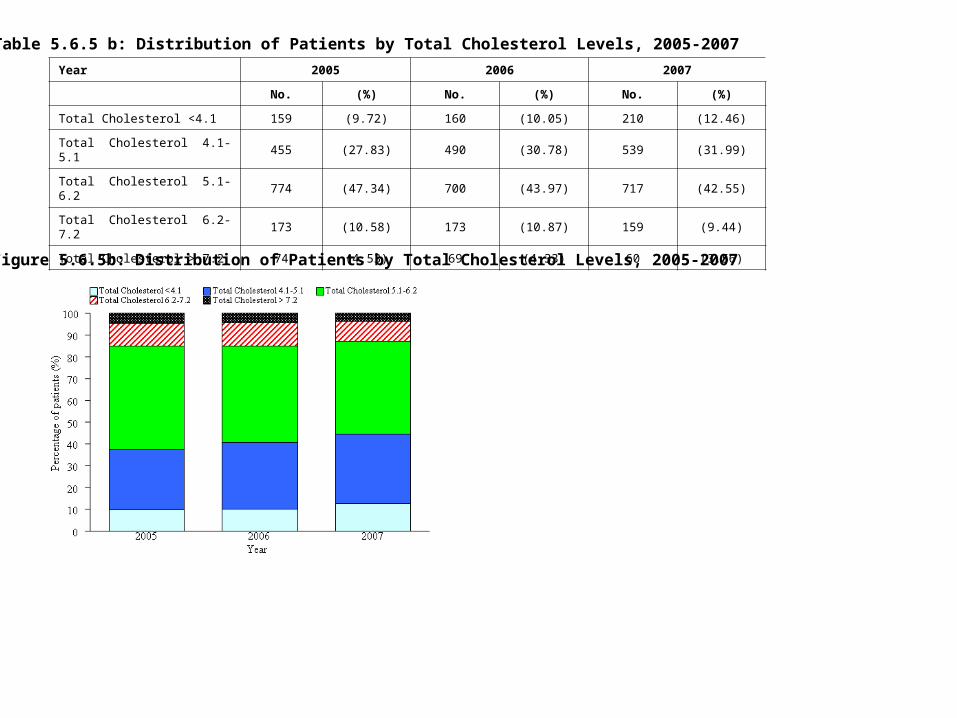
Table 5.6.5 b: Distribution of Patients by Total Cholesterol Levels, 2005-2007
Year 2005 2006 2007
No. (%) No. (%) No. (%)
Total Cholesterol <4.1 159 (9.72) 160 (10.05) 210 (12.46)
Total Cholesterol 4.1-5.1 455 (27.83) 490 (30.78) 539 (31.99)
Total Cholesterol 5.1-6.2 774 (47.34) 700 (43.97) 717 (42.55)
Total Cholesterol 6.2- 7.2 173 (10.58) 173 (10.87) 159 (9.44)
Total Cholesterol > 7.2 74 (4.53) 69 (4.33) 60 (3.56)
Figure 5.6.5b: Distribution of Patients by Total Cholesterol Levels, 2005-2007
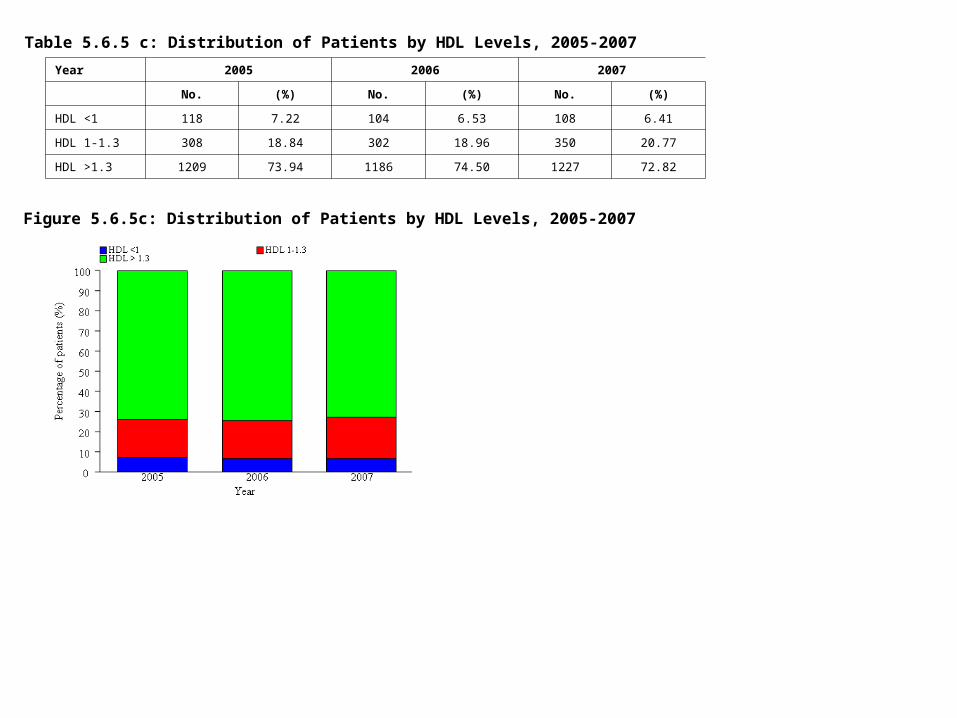
Table 5.6.5 c: Distribution of Patients by HDL Levels, 2005-2007
Year 2005 2006 2007
No. (%) No. (%) No. (%)
HDL <1 118 7.22 104 6.53 108 6.41
HDL 1-1.3 308 18.84 302 18.96 350 20.77
HDL >1.3 1209 73.94 1186 74.50 1227 72.82
Figure 5.6.5c: Distribution of Patients by HDL Levels, 2005-2007
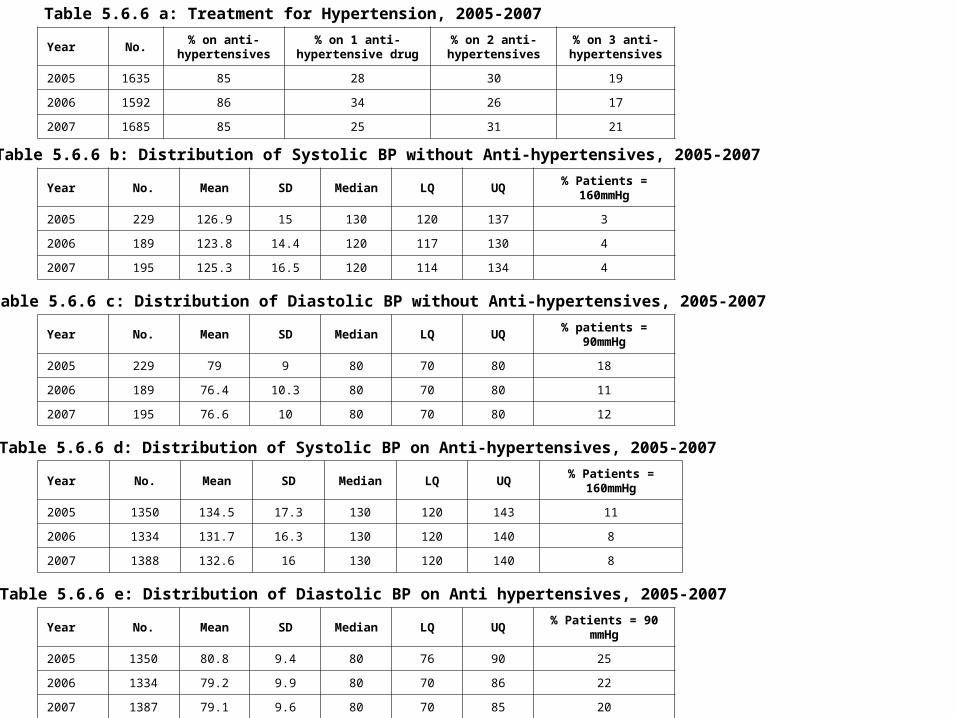
Table 5.6.6 a: Treatment for Hypertension, 2005-2007
Year No.% on anti-
hypertensives% on 1 anti-
hypertensive drug% on 2 anti-hypertensives
% on 3 anti-hypertensives
2005 1635 85 28 30 19
2006 1592 86 34 26 17
2007 1685 85 25 31 21
Table 5.6.6 b: Distribution of Systolic BP without Anti-hypertensives, 2005-2007
Year No. Mean SD Median LQ UQ% Patients =
160mmHg
2005 229 126.9 15 130 120 137 3
2006 189 123.8 14.4 120 117 130 4
2007 195 125.3 16.5 120 114 134 4
Table 5.6.6 c: Distribution of Diastolic BP without Anti-hypertensives, 2005-2007
Year No. Mean SD Median LQ UQ % patients = 90mmHg
2005 229 79 9 80 70 80 18
2006 189 76.4 10.3 80 70 80 11
2007 195 76.6 10 80 70 80 12
Table 5.6.6 d: Distribution of Systolic BP on Anti-hypertensives, 2005-2007
Year No. Mean SD Median LQ UQ % Patients = 160mmHg
2005 1350 134.5 17.3 130 120 143 11
2006 1334 131.7 16.3 130 120 140 8
2007 1388 132.6 16 130 120 140 8
Table 5.6.6 e: Distribution of Diastolic BP on Anti hypertensives, 2005-2007
Year No. Mean SD Median LQ UQ % Patients = 90 mmHg
2005 1350 80.8 9.4 80 76 90 25
2006 1334 79.2 9.9 80 70 86 22
2007 1387 79.1 9.6 80 70 85 20
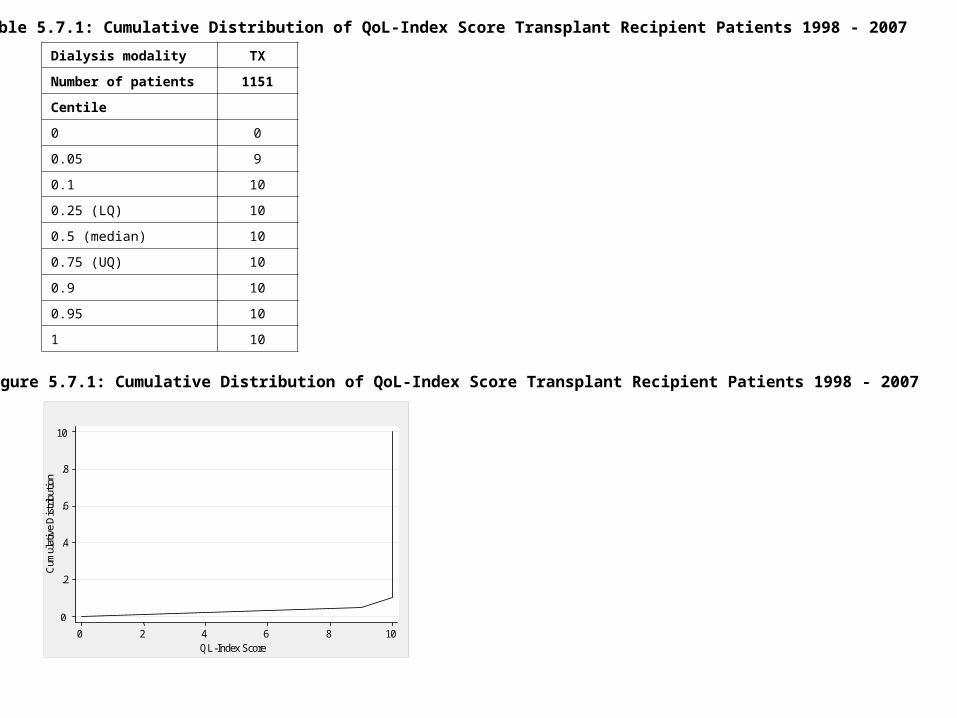
Table 5.7.1: Cumulative Distribution of QoL-Index Score Transplant Recipient Patients 1998 - 2007
Dialysis modality TX
Number of patients 1151
Centile
0 0
0.05 9
0.1 10
0.25 (LQ) 10
0.5 (median) 10
0.75 (UQ) 10
0.9 10
0.95 10
1 10
Figure 5.7.1: Cumulative Distribution of QoL-Index Score Transplant Recipient Patients 1998 - 2007
0
.2
.4
.6
.8
10
Cum
ulat
ive
Dis
trib
utio
n
0 2 4 6 8 10 QL-Index Score
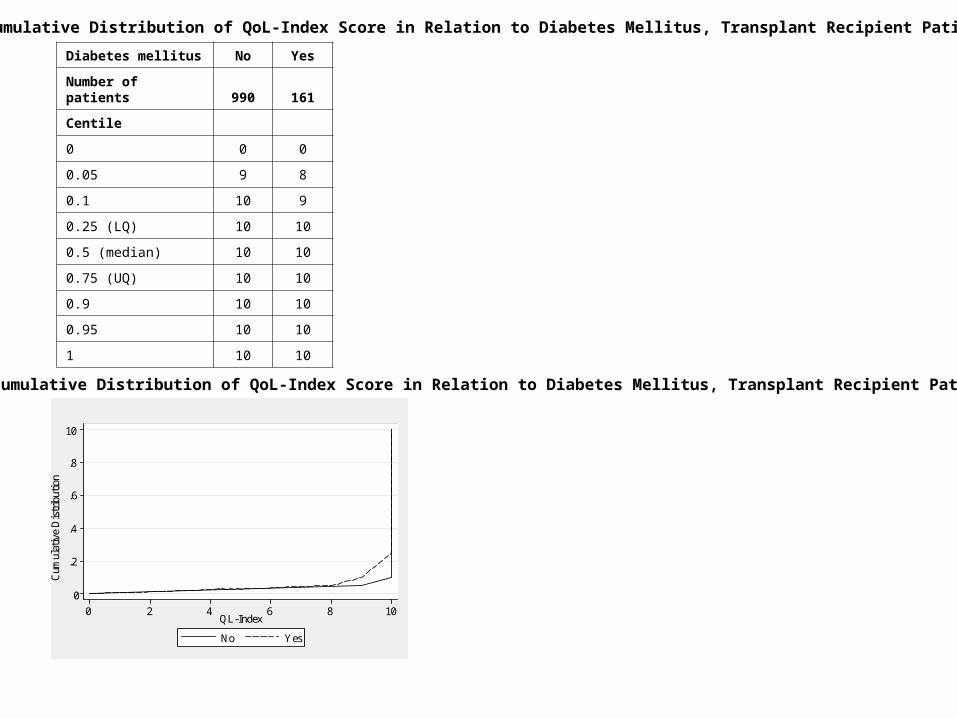
Table 5.7.2: Cumulative Distribution of QoL-Index Score in Relation to Diabetes Mellitus, Transplant Recipient Patients 1998 - 2007
Diabetes mellitus No Yes
Number of patients 990 161
Centile
0 0 0
0.05 9 8
0.1 10 9
0.25 (LQ) 10 10
0.5 (median) 10 10
0.75 (UQ) 10 10
0.9 10 10
0.95 10 10
1 10 10
Figure 5.7.2: Cumulative Distribution of QoL-Index Score in Relation to Diabetes Mellitus, Transplant Recipient Patients 1998 – 2007
0
.2
.4
.6
.8
10
Cum
ulat
ive
Dis
trib
utio
n
0 2 4 6 8 10 QL-Index Score No Yes
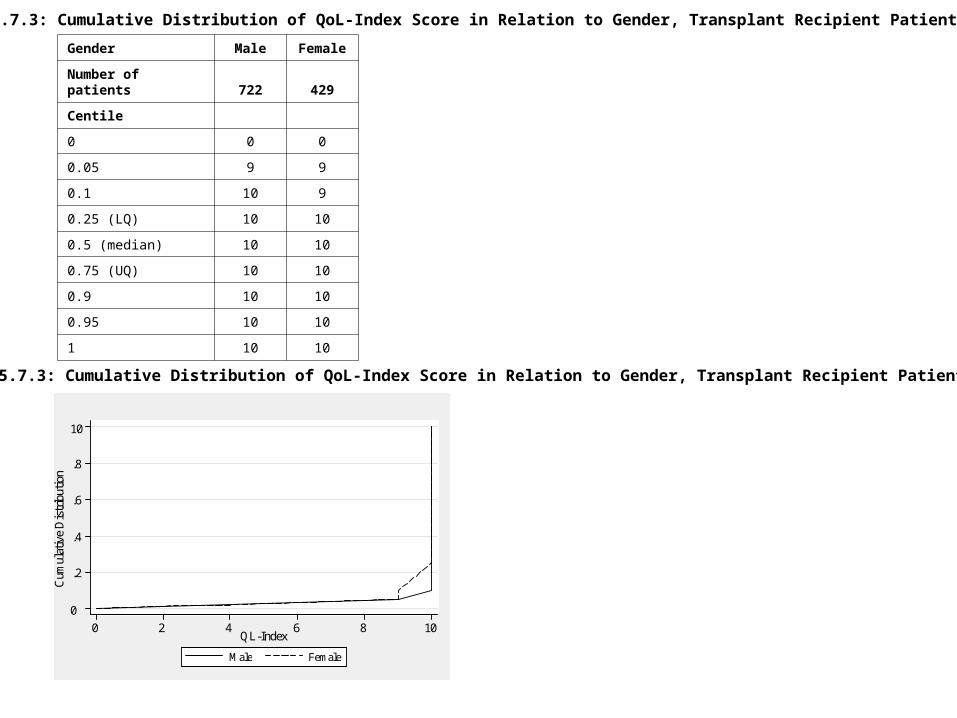
Table 5.7.3: Cumulative Distribution of QoL-Index Score in Relation to Gender, Transplant Recipient Patients 1998 – 2007
Gender Male Female
Number of patients 722 429
Centile
0 0 0
0.05 9 9
0.1 10 9
0.25 (LQ) 10 10
0.5 (median) 10 10
0.75 (UQ) 10 10
0.9 10 10
0.95 10 10
1 10 10
Figure 5.7.3: Cumulative Distribution of QoL-Index Score in Relation to Gender, Transplant Recipient Patients 1998 – 2007
0
.2
.4
.6
.8
10
Cum
ulat
ive
Dis
trib
utio
n
0 2 4 6 8 10 QL-Index Score
Male Female
Age ≥60
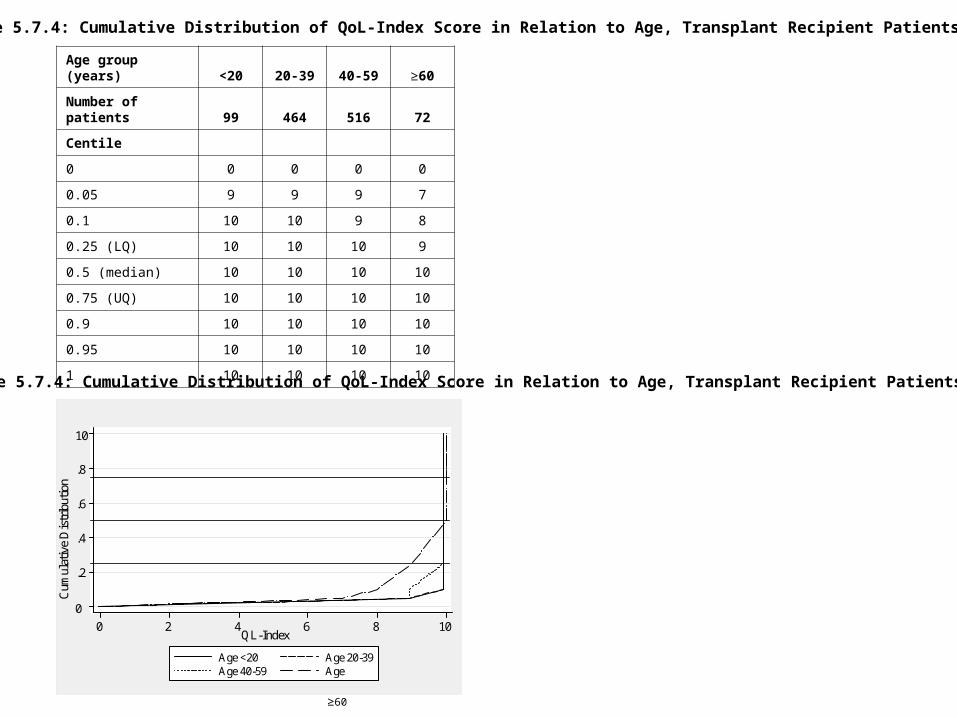
Table 5.7.4: Cumulative Distribution of QoL-Index Score in Relation to Age, Transplant Recipient Patients 1998 – 2007
Age group (years) <20 20-39 40-59 ≥60
Number of patients 99 464 516 72
Centile
0 0 0 0 0
0.05 9 9 9 7
0.1 10 10 9 8
0.25 (LQ) 10 10 10 9
0.5 (median) 10 10 10 10
0.75 (UQ) 10 10 10 10
0.9 10 10 10 10
0.95 10 10 10 10
1 10 10 10 10
Figure 5.7.4: Cumulative Distribution of QoL-Index Score in Relation to Age, Transplant Recipient Patients 1998 – 2007
0
.2
.4
.6
.8
10
Cum
ulat
ive
Dis
trib
utio
n
0 2 4 6 8 10 QL-Index Score
Age <20 Age 20-39 Age 40-59 Age
≥60
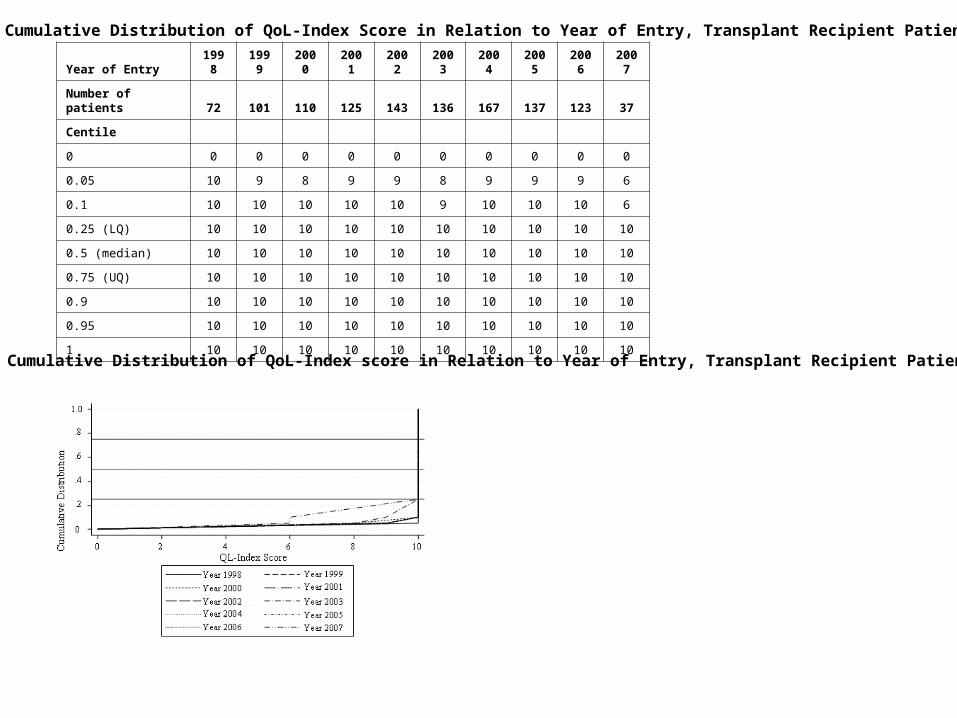
Table 5.7.5: Cumulative Distribution of QoL-Index Score in Relation to Year of Entry, Transplant Recipient Patients 1998 – 2007
Year of Entry 1998 1999 2000 2001 2002 2003 2004 2005 2006 2007
Number of patients 72 101 110 125 143 136 167 137 123 37
Centile
0 0 0 0 0 0 0 0 0 0 0
0.05 10 9 8 9 9 8 9 9 9 6
0.1 10 10 10 10 10 9 10 10 10 6
0.25 (LQ) 10 10 10 10 10 10 10 10 10 10
0.5 (median) 10 10 10 10 10 10 10 10 10 10
0.75 (UQ) 10 10 10 10 10 10 10 10 10 10
0.9 10 10 10 10 10 10 10 10 10 10
0.95 10 10 10 10 10 10 10 10 10 10
1 10 10 10 10 10 10 10 10 10 10
Figure 5.7.5: Cumulative Distribution of QoL-Index score in Relation to Year of Entry, Transplant Recipient Patients 1998 – 2007