Embed Size (px)
DESCRIPTION
Table 3.1.1: Stock and Flow of Heart Transplantation, 1997-2005. N.B. There was no heart transplants carried out in 2004. New transplant patients. Alive at 31st December. 8. 7. 6. 5. Number of patients. 4. 3. 2. 1. 0. 1997. 1999. 2001. 2003. 2005. 1998. 2000. 2002. 2004. - PowerPoint PPT Presentation
Citation preview
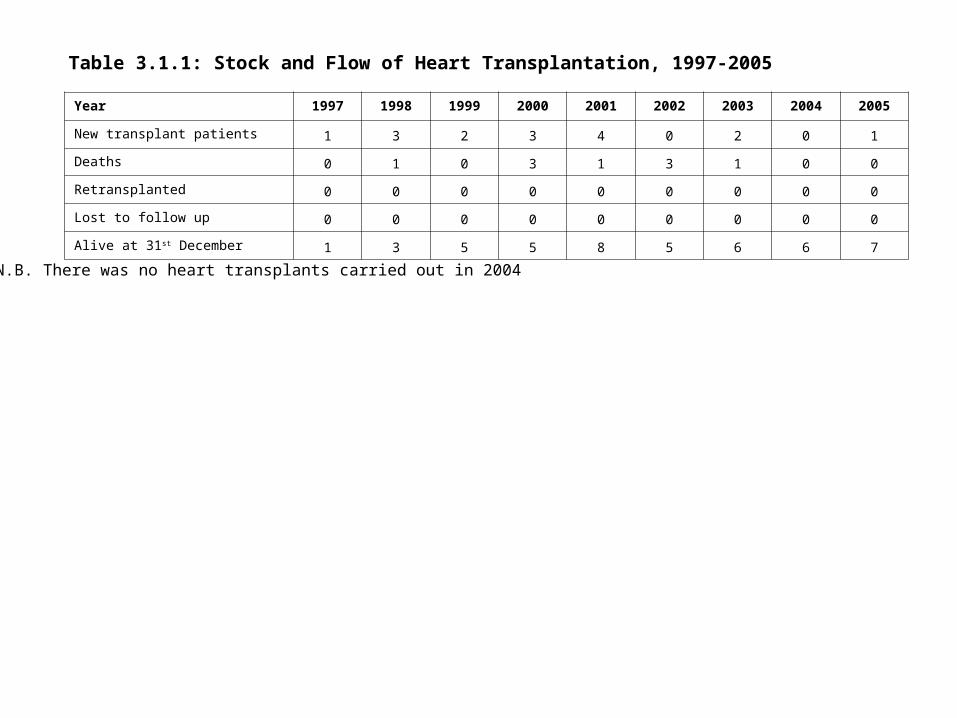
Table 3.1.1: Stock and Flow of Heart Transplantation, 1997-2005
Year 1997 1998 1999 2000 2001 2002 2003 2004 2005
New transplant patients 1 3 2 3 4 0 2 0 1
Deaths 0 1 0 3 1 3 1 0 0
Retransplanted 0 0 0 0 0 0 0 0 0
Lost to follow up 0 0 0 0 0 0 0 0 0
Alive at 31st December 1 3 5 5 8 5 6 6 7
N.B. There was no heart transplants carried out in 2004
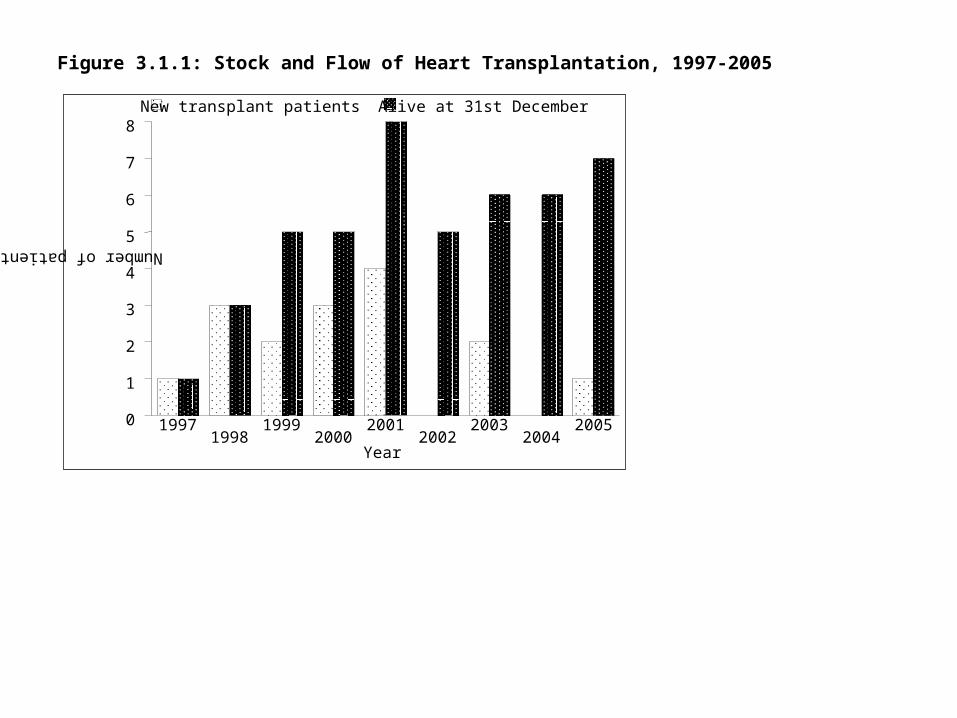
Figure 3.1.1: Stock and Flow of Heart Transplantation, 1997-2005
Number of patientsYear
0
1
2
3
4
5
6
7
8 New transplant patients Alive at 31st December
19971998
19992000
20012002
20032004
2005
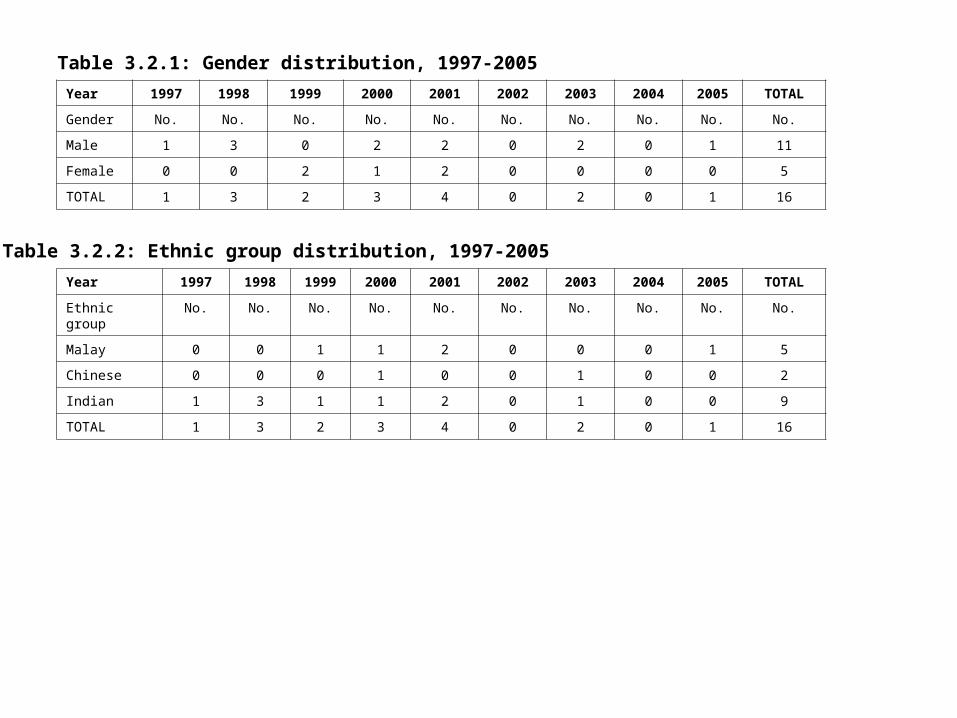
Table 3.2.1: Gender distribution, 1997-2005
Year 1997 1998 1999 2000 2001 2002 2003 2004 2005 TOTAL
Gender No. No. No. No. No. No. No. No. No. No.
Male 1 3 0 2 2 0 2 0 1 11
Female 0 0 2 1 2 0 0 0 0 5
TOTAL 1 3 2 3 4 0 2 0 1 16
Table 3.2.2: Ethnic group distribution, 1997-2005
Year 1997 1998 1999 2000 2001 2002 2003 2004 2005 TOTAL
Ethnic group No. No. No. No. No. No. No. No. No. No.
Malay 0 0 1 1 2 0 0 0 1 5
Chinese 0 0 0 1 0 0 1 0 0 2
Indian 1 3 1 1 2 0 1 0 0 9
TOTAL 1 3 2 3 4 0 2 0 1 16
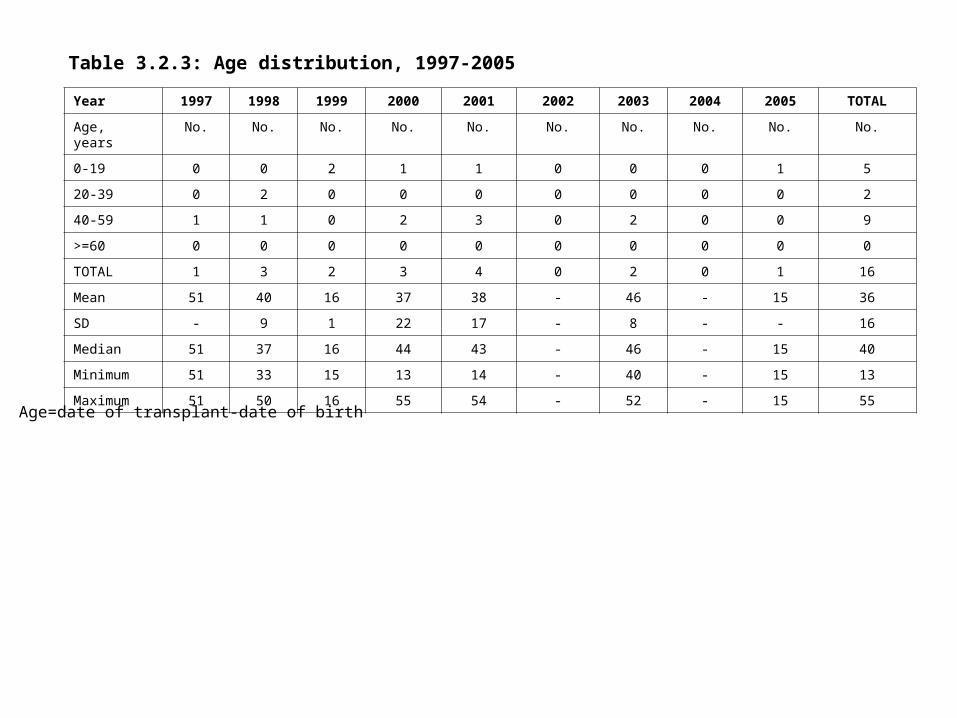
Table 3.2.3: Age distribution, 1997-2005
Year 1997 1998 1999 2000 2001 2002 2003 2004 2005 TOTAL
Age, years No. No. No. No. No. No. No. No. No. No.
0-19 0 0 2 1 1 0 0 0 1 5
20-39 0 2 0 0 0 0 0 0 0 2
40-59 1 1 0 2 3 0 2 0 0 9
>=60 0 0 0 0 0 0 0 0 0 0
TOTAL 1 3 2 3 4 0 2 0 1 16
Mean 51 40 16 37 38 - 46 - 15 36
SD - 9 1 22 17 - 8 - - 16
Median 51 37 16 44 43 - 46 - 15 40
Minimum 51 33 15 13 14 - 40 - 15 13
Maximum 51 50 16 55 54 - 52 - 15 55
Age=date of transplant-date of birth
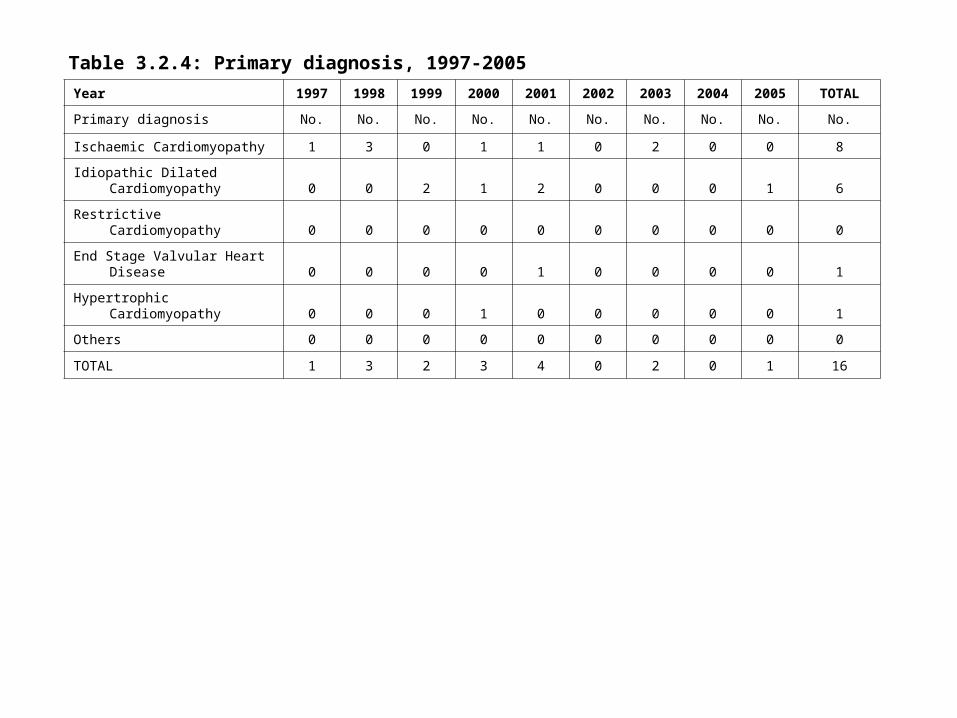
Table 3.2.4: Primary diagnosis, 1997-2005
Year 1997 1998 1999 2000 2001 2002 2003 2004 2005 TOTAL
Primary diagnosis No. No. No. No. No. No. No. No. No. No.
Ischaemic Cardiomyopathy 1 3 0 1 1 0 2 0 0 8
Idiopathic Dilated Cardiomyopathy 0 0 2 1 2 0 0 0 1 6
Restrictive Cardiomyopathy 0 0 0 0 0 0 0 0 0 0
End Stage Valvular Heart Disease 0 0 0 0 1 0 0 0 0 1
Hypertrophic Cardiomyopathy 0 0 0 1 0 0 0 0 0 1
Others 0 0 0 0 0 0 0 0 0 0
TOTAL 1 3 2 3 4 0 2 0 1 16
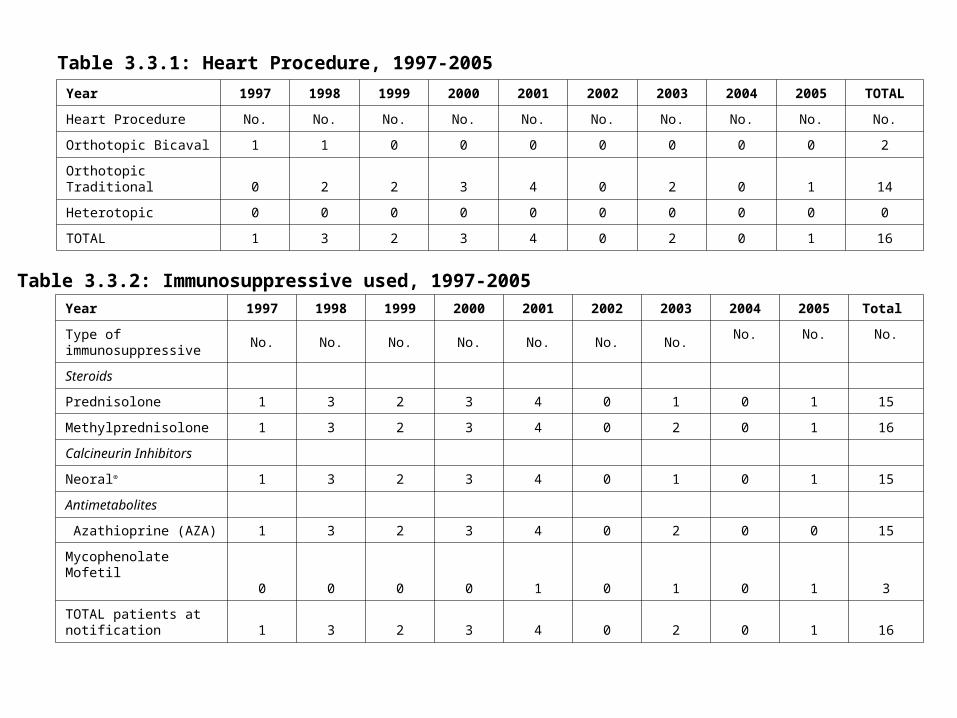
Table 3.3.1: Heart Procedure, 1997-2005
Year 1997 1998 1999 2000 2001 2002 2003 2004 2005 TOTAL
Heart Procedure No. No. No. No. No. No. No. No. No. No.
Orthotopic Bicaval 1 1 0 0 0 0 0 0 0 2
Orthotopic Traditional 0 2 2 3 4 0 2 0 1 14
Heterotopic 0 0 0 0 0 0 0 0 0 0
TOTAL 1 3 2 3 4 0 2 0 1 16
Table 3.3.2: Immunosuppressive used, 1997-2005
Year 1997 1998 1999 2000 2001 2002 2003 2004 2005 Total
Type of immunosuppressive No. No. No. No. No. No. No. No. No. No.
Steroids
Prednisolone 1 3 2 3 4 0 1 0 1 15
Methylprednisolone 1 3 2 3 4 0 2 0 1 16
Calcineurin Inhibitors
Neoral® 1 3 2 3 4 0 1 0 1 15
Antimetabolites
Azathioprine (AZA) 1 3 2 3 4 0 2 0 0 15
Mycophenolate Mofetil 0 0 0 0 1 0 1 0 1 3
TOTAL patients at notification 1 3 2 3 4 0 2 0 1 16
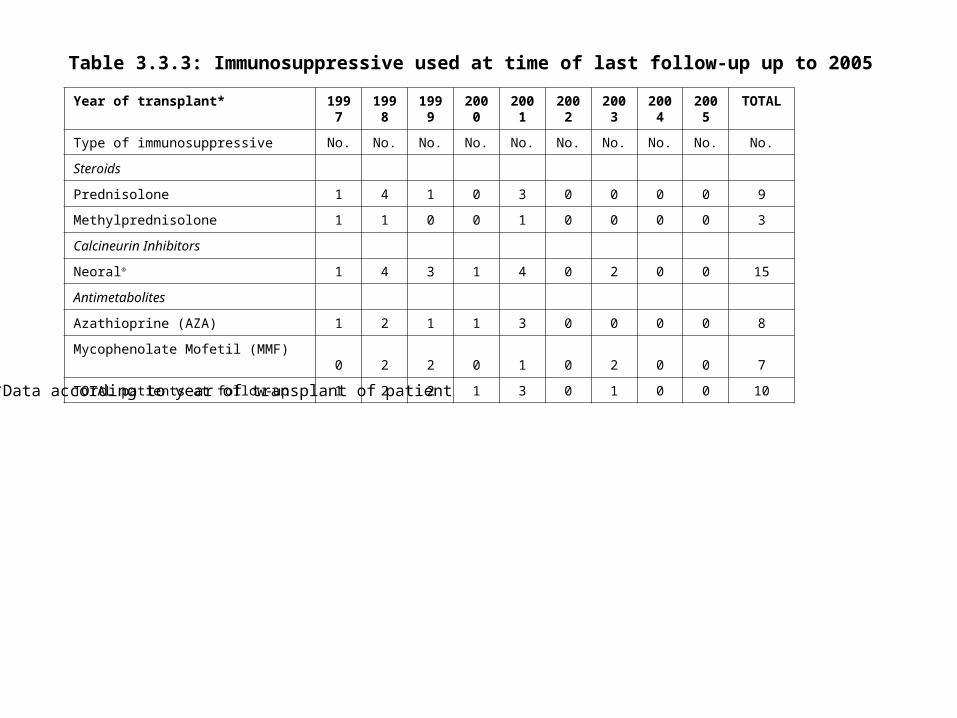
Table 3.3.3: Immunosuppressive used at time of last follow-up up to 2005
Year of transplant* 1997 1998 1999 2000 2001 2002 2003 2004 2005 TOTAL
Type of immunosuppressive No. No. No. No. No. No. No. No. No. No.
Steroids
Prednisolone 1 4 1 0 3 0 0 0 0 9
Methylprednisolone 1 1 0 0 1 0 0 0 0 3
Calcineurin Inhibitors
Neoral® 1 4 3 1 4 0 2 0 0 15
Antimetabolites
Azathioprine (AZA) 1 2 1 1 3 0 0 0 0 8
Mycophenolate Mofetil (MMF) 0 2 2 0 1 0 2 0 0 7
TOTAL patients at follow-up 1 2 2 1 3 0 1 0 0 10
*Data according to year of transplant of patient
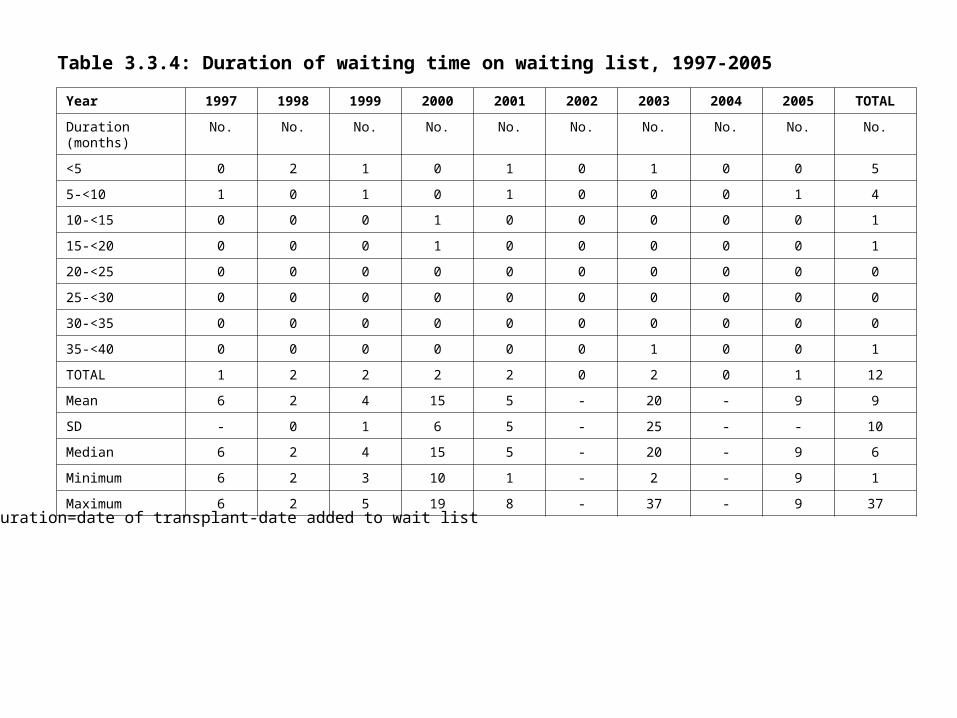
Table 3.3.4: Duration of waiting time on waiting list, 1997-2005
Year 1997 1998 1999 2000 2001 2002 2003 2004 2005 TOTAL
Duration (months) No. No. No. No. No. No. No. No. No. No.
<5 0 2 1 0 1 0 1 0 0 5
5-<10 1 0 1 0 1 0 0 0 1 4
10-<15 0 0 0 1 0 0 0 0 0 1
15-<20 0 0 0 1 0 0 0 0 0 1
20-<25 0 0 0 0 0 0 0 0 0 0
25-<30 0 0 0 0 0 0 0 0 0 0
30-<35 0 0 0 0 0 0 0 0 0 0
35-<40 0 0 0 0 0 0 1 0 0 1
TOTAL 1 2 2 2 2 0 2 0 1 12
Mean 6 2 4 15 5 - 20 - 9 9
SD - 0 1 6 5 - 25 - - 10
Median 6 2 4 15 5 - 20 - 9 6
Minimum 6 2 3 10 1 - 2 - 9 1
Maximum 6 2 5 19 8 - 37 - 9 37
*Duration=date of transplant-date added to wait list
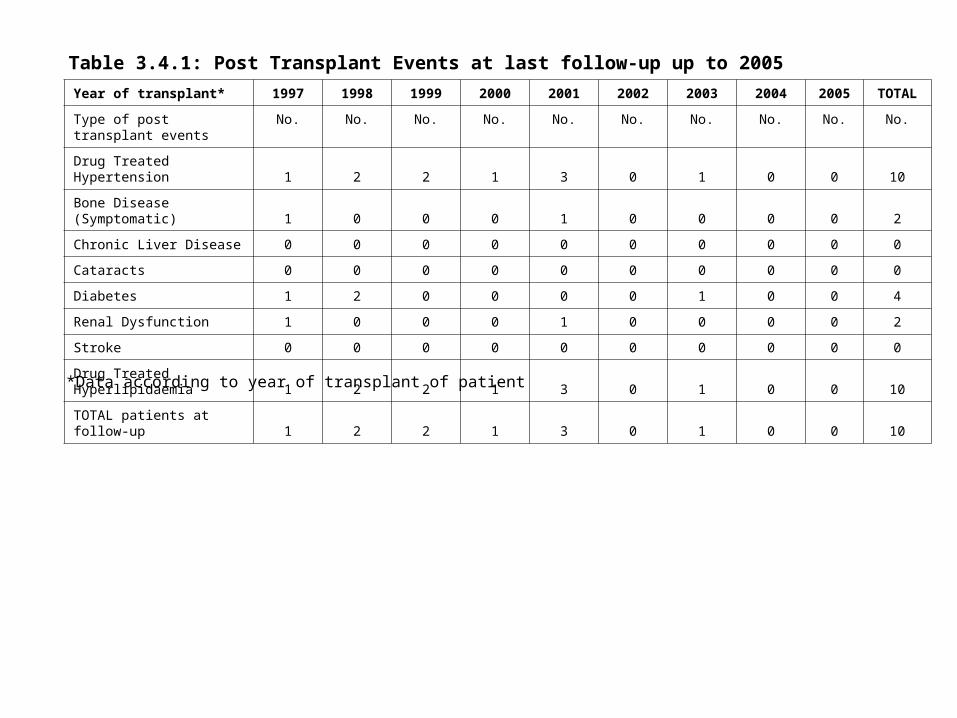
Table 3.4.1: Post Transplant Events at last follow-up up to 2005
Year of transplant* 1997 1998 1999 2000 2001 2002 2003 2004 2005 TOTAL
Type of post transplant events No. No. No. No. No. No. No. No. No. No.
Drug Treated Hypertension 1 2 2 1 3 0 1 0 0 10
Bone Disease (Symptomatic) 1 0 0 0 1 0 0 0 0 2
Chronic Liver Disease 0 0 0 0 0 0 0 0 0 0
Cataracts 0 0 0 0 0 0 0 0 0 0
Diabetes 1 2 0 0 0 0 1 0 0 4
Renal Dysfunction 1 0 0 0 1 0 0 0 0 2
Stroke 0 0 0 0 0 0 0 0 0 0
Drug Treated Hyperlipidaemia 1 2 2 1 3 0 1 0 0 10
TOTAL patients at follow-up 1 2 2 1 3 0 1 0 0 10
*Data according to year of transplant of patient
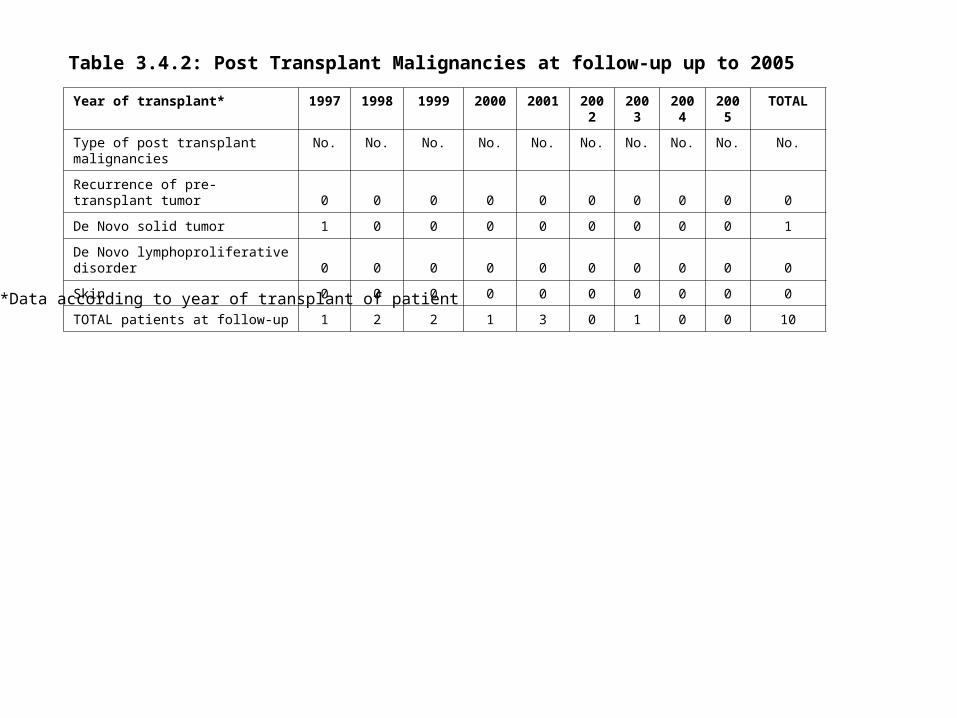
Table 3.4.2: Post Transplant Malignancies at follow-up up to 2005
Year of transplant* 1997 1998 1999 2000 2001 2002
2003
2004
2005
TOTAL
Type of post transplant malignancies No. No. No. No. No. No. No. No. No. No.
Recurrence of pre-transplant tumor 0 0 0 0 0 0 0 0 0 0
De Novo solid tumor 1 0 0 0 0 0 0 0 0 1
De Novo lymphoproliferative disorder 0 0 0 0 0 0 0 0 0 0
Skin 0 0 0 0 0 0 0 0 0 0
TOTAL patients at follow-up 1 2 2 1 3 0 1 0 0 10
*Data according to year of transplant of patient
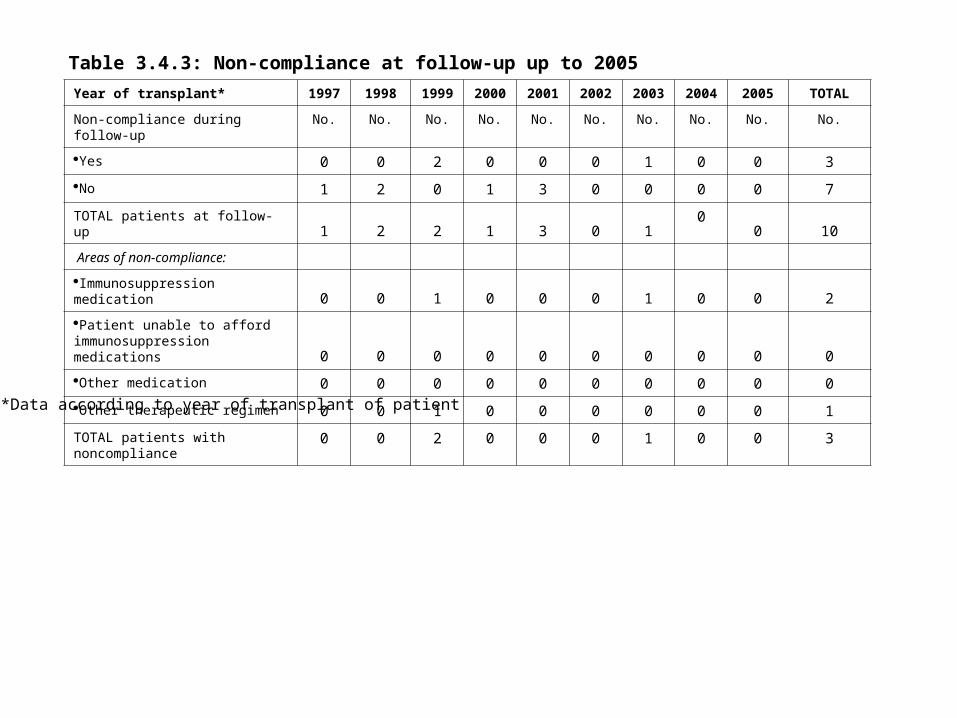
Table 3.4.3: Non-compliance at follow-up up to 2005
Year of transplant* 1997 1998 1999 2000 2001 2002 2003 2004 2005 TOTAL
Non-compliance during follow-up No. No. No. No. No. No. No. No. No. No.
Yes 0 0 2 0 0 0 1 0 0 3
No 1 2 0 1 3 0 0 0 0 7
TOTAL patients at follow-up 1 2 2 1 3 0 1 0 0 10
Areas of non-compliance:
Immunosuppression medication 0 0 1 0 0 0 1 0 0 2
Patient unable to afford immunosuppression medications 0 0 0 0 0 0 0 0 0 0
Other medication 0 0 0 0 0 0 0 0 0 0
Other therapeutic regimen 0 0 1 0 0 0 0 0 0 1
TOTAL patients with noncompliance 0 0 2 0 0 0 1 0 0 3
*Data according to year of transplant of patient
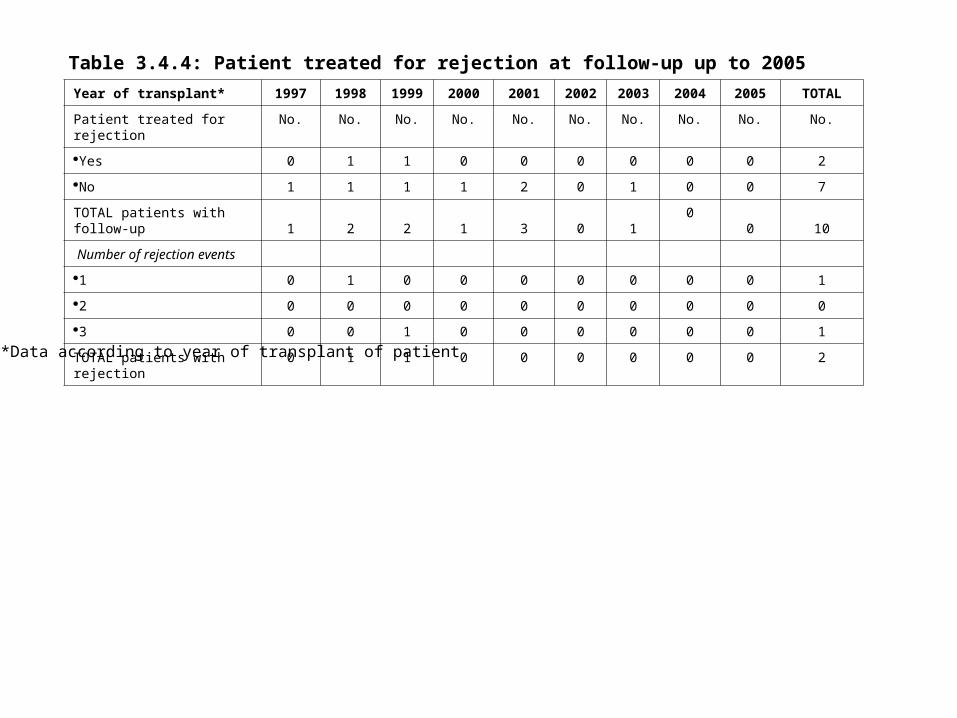
Table 3.4.4: Patient treated for rejection at follow-up up to 2005
Year of transplant* 1997 1998 1999 2000 2001 2002 2003 2004 2005 TOTAL
Patient treated for rejection No. No. No. No. No. No. No. No. No. No.
Yes 0 1 1 0 0 0 0 0 0 2
No 1 1 1 1 2 0 1 0 0 7
TOTAL patients with follow-up 1 2 2 1 3 0 1 0 0 10
Number of rejection events
1 0 1 0 0 0 0 0 0 0 1
2 0 0 0 0 0 0 0 0 0 0
3 0 0 1 0 0 0 0 0 0 1
TOTAL patients with rejection 0 1 1 0 0 0 0 0 0 2
*Data according to year of transplant of patient
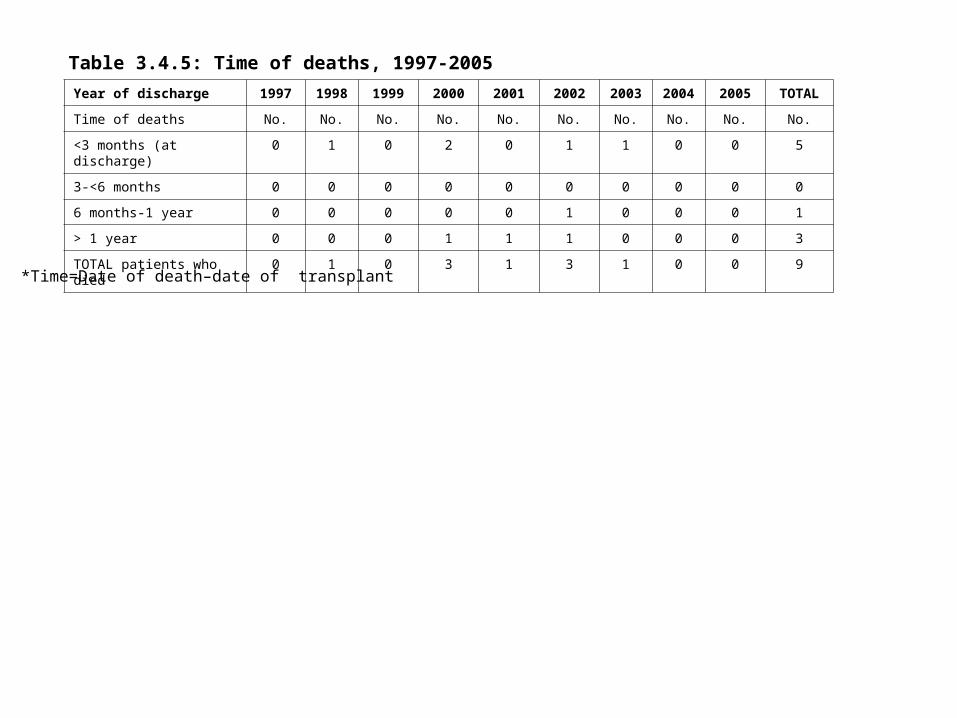
Table 3.4.5: Time of deaths, 1997-2005
Year of discharge 1997 1998 1999 2000 2001 2002 2003 2004 2005 TOTAL
Time of deaths No. No. No. No. No. No. No. No. No. No.
<3 months (at discharge) 0 1 0 2 0 1 1 0 0 5
3-<6 months 0 0 0 0 0 0 0 0 0 0
6 months-1 year 0 0 0 0 0 1 0 0 0 1
> 1 year 0 0 0 1 1 1 0 0 0 3
TOTAL patients who died 0 1 0 3 1 3 1 0 0 9
*Time=Date of death–date of transplant
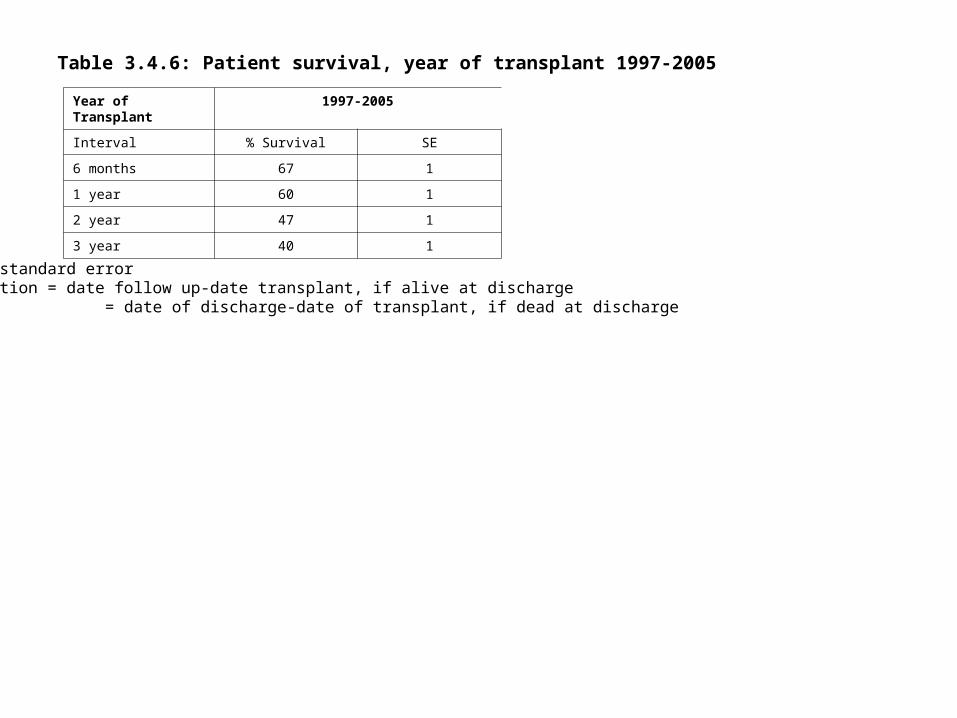
Table 3.4.6: Patient survival, year of transplant 1997-2005
Year of Transplant 1997-2005
Interval % Survival SE
6 months 67 1
1 year 60 1
2 year 47 1
3 year 40 1
SE = standard error*Duration = date follow up-date transplant, if alive at discharge = date of discharge-date of transplant, if dead at discharge
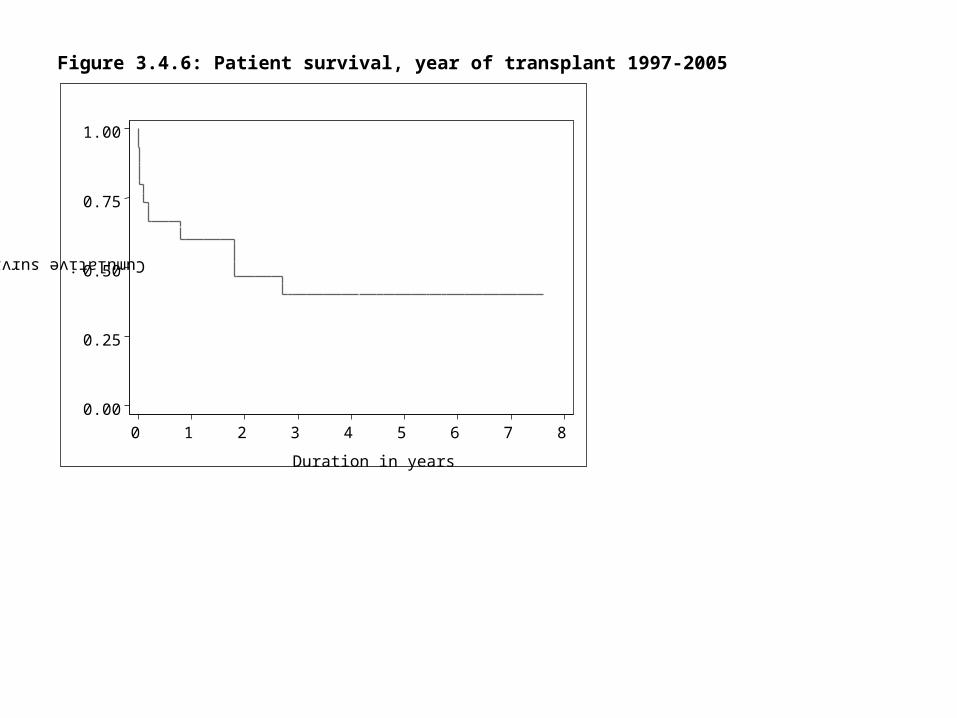
Figure 3.4.6: Patient survival, year of transplant 1997-2005
0.00
0.25
0.50
0.75
1.00
Cumulative survival0 1 2 3 4 5 6 7 8
Duration in years
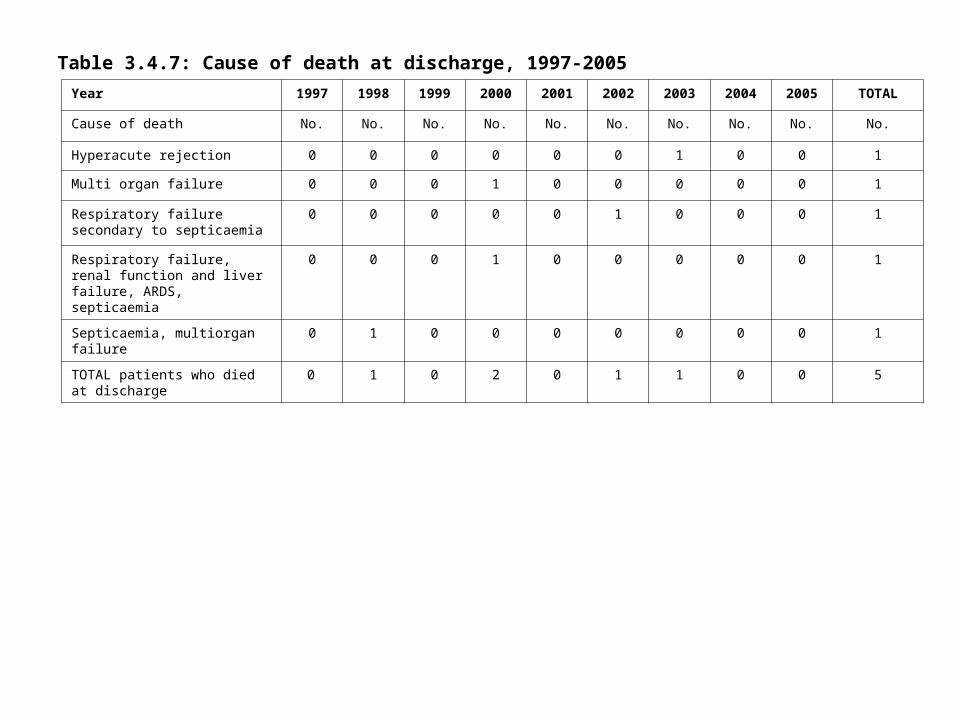
Table 3.4.7: Cause of death at discharge, 1997-2005
Year 1997 1998 1999 2000 2001 2002 2003 2004 2005 TOTAL
Cause of death No. No. No. No. No. No. No. No. No. No.
Hyperacute rejection 0 0 0 0 0 0 1 0 0 1
Multi organ failure 0 0 0 1 0 0 0 0 0 1
Respiratory failure secondary to septicaemia
0 0 0 0 0 1 0 0 0 1
Respiratory failure, renal function and liver failure, ARDS, septicaemia
0 0 0 1 0 0 0 0 0 1
Septicaemia, multiorgan failure 0 1 0 0 0 0 0 0 0 1
TOTAL patients who died at discharge
0 1 0 2 0 1 1 0 0 5
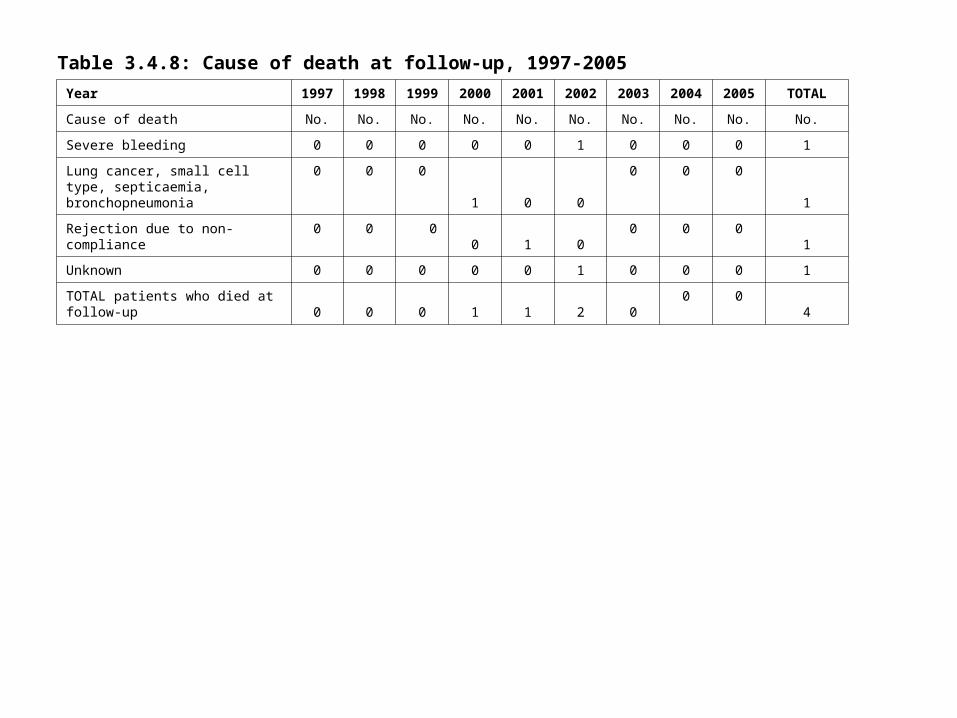
Table 3.4.8: Cause of death at follow-up, 1997-2005
Year 1997 1998 1999 2000 2001 2002 2003 2004 2005 TOTAL
Cause of death No. No. No. No. No. No. No. No. No. No.
Severe bleeding 0 0 0 0 0 1 0 0 0 1
Lung cancer, small cell type, septicaemia, bronchopneumonia
0 0 01 0 0
0 0 01
Rejection due to non-compliance 0 0 0 0 1 0 0 0 0 1
Unknown 0 0 0 0 0 1 0 0 0 1
TOTAL patients who died at follow-up 0 0 0 1 1 2 0 0 0 4


![Kidney Transplantation (Renal Transplantation) Auto Saved]](https://img.pdfslide.us/doc/110x75/577d22b31a28ab4e1e9807d7/kidney-transplantation-renal-transplantation-auto-saved.jpg)


