Embed Size (px)
Citation preview


Table 3.1: Trends in Inpatient Utilization in Community Hospitals, 1989 – 2009
Source: Avalere Health analysis of American Hospital Association Annual Survey data, 2009, for community hospitals. US Census Bureau: National and State Population Estimates, July 1, 2009. Link: http://www.census.gov/popest/states/tables/NST-EST2009-01.xls.
Data for Charts 3.1, 3.2, 3.3, 3.4, 3.5, and 3.14
Year
Inpatient Admissions in
Community Hospitals
Inpatient Admissions
per 1,000
Total Inpatient Days in
Community Hospitals
Inpatient Days per 1,000
Inpatient Surgeries
Average Length of
Stay
1989 31,116,048 126.1 225,436,505 913.4 10,989,409 7.2
1990 31,181,046 125.3 225,971,653 908.4 10,844,916 7.2
1991 31,064,283 123.2 222,858,470 883.9 10,693,243 7.2
1992 31,033,557 121.7 221,047,104 866.8 10,552,378 7.1
1993 30,748,051 119.3 215,888,741 837.6 10,181,703 7.0
1994 30,718,136 118.0 207,180,278 796.0 9,833,938 6.7
1995 30,945,357 117.8 199,876,367 760.7 9,700,613 6.5
1996 31,098,959 117.2 193,747,004 730.4 9,545,612 6.2
1997 31,576,960 118.0 192,504,015 719.3 9,509,081 6.1
1998 31,811,673 117.8 191,430,450 709.0 9,735,705 6.0
1999 32,359,042 118.7 191,884,270 703.7 9,539,593 5.9
2000 33,089,467 117.6 192,420,368 683.7 9,729,336 5.8
2001 33,813,589 118.7 194,106,316 681.6 9,779,583 5.7
2002 34,478,280 119.7 196,690,099 682.7 10,105,010 5.7
2003 34,782,742 119.6 196,649,769 676.2 9,940,922 5.7
2004 35,086,061 119.5 197,564,172 672.8 10,050,346 5.6
2005 35,238,673 119.2 197,073,770 666.4 10,097,271 5.6
2006 35,377,659 118.2 196,366,512 655.9 10,095,683 5.6
2007 35,345,986 117.3 194,549,348 645.7 10,189,630 5.5
2008 35,760,750 117.6 196,078,468 644.9 10,105,156 5.5
2009 35,527,377 115.7 192,656,804 627.5 10,100,980 5.4
A-2

Table 3.2: Average Length of Stay in Community Hospitals by State, 2008 and 2009
Source: Avalere Health analysis of American Hospital Association Annual Survey data, 2009, for community hospitals.
Data for Chart 3.6
State
Average Length of Stay
State
Average Length of Stay
08 09 08 09
Alabama 5.1 5.2 Montana 8.7 8.6Alaska 6.0 5.9 Nebraska 7.3 7.4Arizona 4.5 4.5 Nevada 5.3 5.3Arkansas 5.3 5.1 New Hampshire 5.4 5.3California 5.2 5.1 New Jersey 5.2 5.1Colorado 5.0 5.0 New Mexico 4.7 4.6Connecticut 5.7 5.8 New York 7.1 6.9Delaware 5.9 5.9 North Carolina 5.8 5.6District of Columbia 7.0 6.7 North Dakota 8.3 8.1Florida 5.1 5.0 Ohio 5.0 5.1Georgia 6.4 6.3 Oklahoma 5.3 5.4Hawaii 7.6 6.9 Oregon 4.5 4.4Idaho 4.7 4.8 Pennsylvania 5.4 5.4Illinois 5.0 5.0 Rhode Island 5.2 5.2Indiana 5.2 5.2 South Carolina 5.6 5.6Iowa 6.0 6.2 South Dakota 9.8 9.8Kansas 6.3 6.4 Tennessee 5.7 5.6 Kentucky 5.3 5.2 Texas 5.2 5.2Louisiana 5.3 5.5 Utah 4.5 4.4Maine 5.7 5.5 Vermont 6.4 6.3Maryland 4.6 4.5 Virginia 5.6 5.5Massachusetts 5.2 5.1 Washington 4.6 4.5Michigan 5.2 5.2 West Virginia 5.9 5.9Minnesota 6.0 6.0 Wisconsin 5.1 5.1Mississippi 6.5 6.3 Wyoming 7.9 7.9Missouri 5.2 5.2
A-3

Table 3.3: Emergency Department Visits, Emergency Department Visits per 1,000, and Number of Emergency Departments, 1991 – 2009
Source: Avalere Health analysis of American Hospital Association Annual Survey data, 2009, for community hospitals. US CensusBureau: National and State Population Estimates, July 1, 2009. Link: http://www.census.gov/popest/states/tables/NST-EST2009-01.xls.
(1) Defined as hospitals reporting ED visits in the AHA Annual Survey.
Data for Charts 3.7 and 3.8
Year ED Visits (millions) ED Visits per 1,000Emergency
Departments(1)
1991 88.5 351 5,108
1992 90.8 356 5,035
1993 92.6 359 4,998
1994 90.5 348 4,960
1995 94.7 360 4,923
1996 93.1 351 4,884
1997 92.8 347 4,813
1998 94.8 351 4,771
1999 99.5 365 4,679
2000 103.1 366 4,650
2001 106.0 372 4,621
2002 110.0 382 4,620
2003 111.0 382 4,570
2004 112.6 383 4,595
2005 114.8 388 4,611
2006 118.4 395 4,587
2007 120.8 401 4,565
2008 123.0 405 4,613
2009 127.3 415 4,594
A-4
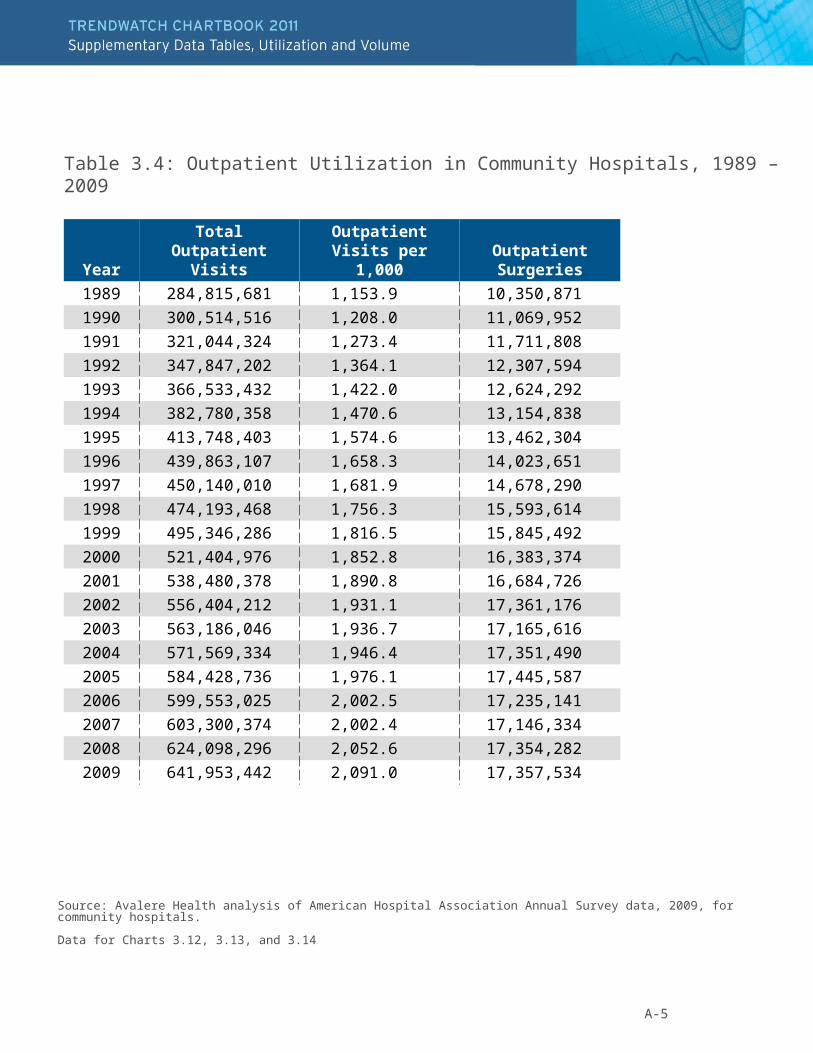
Table 3.4: Outpatient Utilization in Community Hospitals, 1989 – 2009
Source: Avalere Health analysis of American Hospital Association Annual Survey data, 2009, for community hospitals.
Data for Charts 3.12, 3.13, and 3.14
YearTotal Outpatient
VisitsOutpatient Visits
per 1,000Outpatient Surgeries
1989 284,815,681 1,153.9 10,350,871
1990 300,514,516 1,208.0 11,069,952
1991 321,044,324 1,273.4 11,711,808
1992 347,847,202 1,364.1 12,307,594
1993 366,533,432 1,422.0 12,624,292
1994 382,780,358 1,470.6 13,154,838
1995 413,748,403 1,574.6 13,462,304
1996 439,863,107 1,658.3 14,023,651
1997 450,140,010 1,681.9 14,678,290
1998 474,193,468 1,756.3 15,593,614
1999 495,346,286 1,816.5 15,845,492
2000 521,404,976 1,852.8 16,383,374
2001 538,480,378 1,890.8 16,684,726
2002 556,404,212 1,931.1 17,361,176
2003 563,186,046 1,936.7 17,165,616
2004 571,569,334 1,946.4 17,351,490
2005 584,428,736 1,976.1 17,445,587
2006 599,553,025 2,002.5 17,235,141
2007 603,300,374 2,002.4 17,146,334
2008 624,098,296 2,052.6 17,354,282
2009 641,953,442 2,091.0 17,357,534
A-5