Embed Size (px)
Citation preview

MARKET WATCHMARKET WATCH FEED
Normand St-PierreProfessorOhio State [email protected]
Sometimes I wonder if I live on the same planet as dairy economists. I just read an article where an eminent economist is confi dent of a dairy rebound ahead. Let’s see: $18.66 Class III prices last December, January futures trading at $18.12 today and February futures at $17.02. On the feed side, corn prices have indeed rebounded from lows under $7 per bushel with March futures at $7.20 per bushel today. I suppose that some prices are indeed rebounding, but in the wrong direction …
Regardless of your current fi nancial position, feeding balanced diets based on economically priced feed ingredients can help in maintaining positive margins or reducing fi nancial losses.
� e feed table reports bracket prices for each feed. � e Low and High values delineate the 75 percent confi dence range for a feed. � e ‘Status’ column provides you with a quick indicator of a feed status: a ★indicates a bargain feed; a ■ denotes an overpriced feed; a blank entry indicates that the feed is priced about right.
Lastly, a few feeds carry a special status symbol: a is shown if a feed is grossly overpriced (in which case only the High column has a price, and the reported price is the calculated
breakeven price), if a feed is grossly underpriced (in which case only the Low column has a price, and the reported price is the calculated breakeven price) or if we are in no position to judge a feed status. � e third option occurs, for example, with
the diff erent grades of alfalfa hay. We can calculate what each grade is worth, but we do not have suffi cient market information to identify an accurate market price for each grade with which we can compare to the values calculated by Sesame. So we report the same price for the Low and High. � is price is, in fact, the breakeven price for the feed in question.
Sesame determines the nutritional worth of feeds through the determination of the economic values of the nutrients. Because nutrients required for milk production are well known, we can calculate the cost of providing these nutrients to dairy cows. Beware that the resulting feed costs do not include the costs of feeding the dry cows and the replacement herd. PD
www.trioliet.com Trioliet. Invents for you.
Capacity 1,650 cu.ft.
Solid Rocking Beam Tandem
Two discharge doors on RHS
Also available from 1,285 to 1,860 cu.ft.
Alan BrandmeyerRegional Sales Manager - Western USA661.303.3626 [email protected]
RDO EquipmentHermiston, OR 800.357.7925Sunnyside, WA 800.745.4027
Lawrence Tractor Co.Mike LorenzoHanford, Visalia, Tipton, CA559.901.9267 559.752.4251
Mixer CenterStephenville, TX 254.965.3663Friona, TX 254.965.3663Roswell, NM 254.965.3663
Kern MachineryBakersfield, CA 661.833.9900Buttonwillow, CA 661.746.6363Delano, CA 661.725.3841
Linn Benton TractorTangent, OR 541.926.1811
Whatcom ManufacturingLynden, WA 360.354.3094
Trioliet YouTube channel: www.youtube.com/Trioliet2011
SOLOMIX 3 4600 ZKX-T
New@ the World AG Expo
Booth DS143
Supreme hay ($/ton)
Jan. 25 Price 3-week change
Central CA $310 $35
UT $185-$200 NC
WY $175-$250 NC
WA/OR $210 $30
CO $250-$275 NC
NM $275-$285 NC
TX $240-$250 NC
Source: USDA National Hay, Feed & Seed Summary
Soybean meal* ($/ton)
Jan. 25 Price 3-week change
CA $483 $23
ID $480 $9
NM $468 $52
*Price quotes contributed by Western Milling, J.D. Heiskell and independent sources.
Corn* (in tons) (in bushels)
Jan. 25 Price 3-week change
CA $313 $3
ID $319 $12
NM $295 $10
Price 3-week change
$8.76 .08¢ $8.93 .33¢ $8.26 .28¢
Jan. 25 Price 3-week change
CA $395 NC
ID $369 NC
NM $340 $10
Cottonseed* ($/ton)
COMMODITIES
CORN SILAGE A BARGAIN
Item1 Southwest West NorthwestNEL (¢/Mcal) 15.4 16.1 17.5
MP (¢/lb) 42.8 33.9 26.5
e-NDF (¢/lb) 6.1 6.4 5.5
ne-NDF (¢/lb) -5.7 -0.5 -3.6
Nutrient costs ($/cow per day)2 7.63 7.63 7.50
Nutrient costs (¢/lb of feed DM) 15.5 15.5 15.3
Nutrient cost ($/cwt of milk) 10.90 10.90 10.721 NEL = Net energy for lactation; MP = metabolizable protein; e-NDF = effective neutral detergent fi ber; ne-NDF = non-effective NDF.2 1,400-lb cow producing 70 lbs/day at 3.7% fat, 3.1% protein and 5.7% other solids.
Table 1
8 Progressive Dairyman Issue 3 • February 11, 2013

Mar2013
Mar2014
JulyMay Sept Dec
Low
High
Settle$5.50$5.75$6.00$6.25$6.50$6.75$7.00$7.25$7.50
Jan2013
May July Aug Sept Oct DecMar Jan2014
High
Settle Low
$325
$350
$375
$400
$425
$450
$475
FUTURES
High: $7.36 Low: $5.70
High: $425.30 Low: $354.90
Corn (dollars per bushel)
CornMar. ’13 contracts $7.14 +0.15¢ $7.31/$6.85May ’13 contracts $7.15 +0.13¢ $7.31/$6.85
JANUARY 30 Avg. 3-week settle High/Low
Soybean mealJan. ’13 contracts $413.00 -$17.16 $421.60/$404.30Mar. ’13 contracts $407.28 -$12.06 $415.80/$399.20
Source: Chicago Mercantile Exchange data
Soybeans (dollars per ton)
Get replacement heifers to optimum frame and scale for breeding fast with GAINPRO® GAINPRO® consistently improves performance, giving you big framed, large capacity heifers that make great Milkers.
Huvepharma, Inc. 525 Westpark Dr., Suite 230 Peachtree City, GA 30269 Call us toll free at 1-877-994-4883 or email: [email protected]
World Ag Expo Booth DS97Visit us at
TIDENBERG’SWELDING REPAIR&
INC
Jim Tidenberg 575 US HWY 70 Clovis, NM Phone: 575-763-1979 • Fax: 575-763-9766
HEAVY DUTY DAIRY EQUIPMENTHeavy Duty Laydown Chute
Heavy Duty Box ScraperRubber Tire Scraper
Calf Bottle Trailer
Roll-out Bucket Hay Forks
Push Wheel• All types of custom
fabrication• Stainless steel &
aluminum welding• Feed box & hay
equipment repair• Dairy specialties• Dealer for Kirby
and Kuhn Knight feed equipment
Are youAre yo
Losing You need aTruck Scale
Weight?
Sanstrom Scale Construction Inc.
Your authorized Unibridge and Cardinal Dealer 888.375.1206
Cell: 208.250.8478 www.scaleconstruction.net
Nationwide Construction / Installation
“Th ey treat us well and want to do whatever it takes
to make things work profi ciently. Th ey are very professional, reliable and I would recommend them to anyone.”
Sanstrom Scale Construction can help with all your SCALE needs...including employee time card and commodity inventory tracking.
Richard AvilaDairy Co-owner, Avi-Lanche Dairy
work proficiently They are veryto make things w
“Th ey treat us well and want to do whatever it takes awork proficiently They are veryto make things w
51 Years in the
scale business
Come See Us at
World Ag Expo Booths: 6616, 6617
BLOOD MEAL OVERPRICEDSouthwest West Northwest
Feedname Low High Status Low High Status Low High Status
Alfalfa hay, supreme (190 RFV) $312 $368 $325 $351 $323 $349
Alfalfa hay, premium (170 RFV) $244 $300 $303 $329 $301 $327
Alfalfa hay, good (150 RFV) $289 $345 ★ $258 $284 ★ $301 $327 ★
Alfalfa hay, fair (130 RFV) $210 $266 $225 $251 $219 $245
Alfalfa hay, low (110 RFV) $173 $229 $189 $215 $182 $208
Almond hulls – – $204 $224 ★ – –
Bakery byproduct $304 $336 ■ – – – –
Barley feed $287 $313 ■ $303 $316 $302 $317 ★
Beet pulp – $253 ■ – – $241 $268 ■
Blood meal – $797 ■ – $705 ■ – $644 ■
Canola meal – – $336 $350 ■ $320 $337 ■
Citrus pulp – – – – – –
Corn grain, ground $306 $334 ★ – – $318 $333 ★
Corn grain, steam fl aked – – $332 $346 ★ – –
Corn silage (32% DM) $92 $112 ★ $102 $110 ★ $98 $109 ★
Cottonseed hulls $56 $136 ■ $116 $152 – –
Cottonseed meal $384 $418 ★ $378 $402 – –
Cottonseed, whole $334 $423 ★ $357 $395 ■ $355 $396
Distillers dried grains $330 $376 $360 $380 ★ $331 $361 ★
Feather meal $604 $672 ■ $576 $576 – –
Fishmeal, Menhaden – $661 ■ – – $562 $562
Gluten feed $283 $312 ★ $304 $317 $290 $309
Gluten meal – – – $482 ■ – –
Hominy $275 $303 ★ $296 $309 $290 $308 ■
Linseed meal $312 $347 ★ – – – –
Meat meal $494 $535 ★ $482 – ★ $451 $486 ★
Molasses $212 $223 $217 $228 $223 $237 ■
Rice bran $309 $235 ★ $338 – ★ – –
Saffl ower meal – – $227 $253 – –
Sorghum grain, rolled $290 $313 ★ $296 $308 ■ – –
Soybean hulls $175 $244 ■ $240 $269 $226 $226
Soybean meal, expeller $537 $583 ★ $516 $553 ★ $425 $453 ■
Soybean meal, 44% $409 $437 $403 $423 ■ $399 $399
Soybean meal, 48% $463 $497 ★ $443 $470 ■ $425 $453 ■
Tallow $682 $777 ■ $715 $762 $854 $922
Wheat bran – – $245 $268 – –
Wheat feed $299 $327 ★ $314 $328 ■ – –
Wheat middlings $224 $270 $265 $285 ★ $244 $276 ★
Issue 3 • February 11, 2013 Progressive Dairyman 9

MARKET WATCHMARKET WATCH Margin
Patrick FrenchRP Feed [email protected]
SepMay NovJul Nov SepMayMar Jul Nov MayMar Jul SepMar2010
Jan2011
Jan2012
Income Over Feed Cost
Operating Income
Ration Cost
Mailbox milk price
$-2.00
$1.50
$5.00
$8.50
$12.00
$15.50
$19.00
$22.50
$26.00 CaliforniaMilk Price, Feed Costs,and Returns from 2010-2012 ($/cwt)
High: $5.14 Low: -$0.77
Income OverFeed Cost
Operating Income
Ration Cost
Mailbox milk price
SepMay Jul Nov SepMar May Jul Nov Sep NovMar May JulMar2010
Jan2011
Jan2012
$0
$4
$8
$12
$16
$20
$24
$28NorthwestMilk Price, Feed Costs,
and Returns from 2010-2012 ($/cwt)High: $6.04 Low: $0.39
Income OverFeed Cost
Operating Income
Ration Cost
Income Over
Mailbox milk price
SepMay Jul Nov SepMar May Jul Mar May Jul Sep NovNovMar2010
Jan2011
Jan2012
$0
$4
$8
$12
$16
$20
$24
$28 MidwestMilk Price, Feed Costs,and Returns from 2010-2012 ($/cwt)
High: $6.16 Low: $0.75
Income OverFeed Cost
Operating Income
Ration Cost
Mailbox milk price
SepMay Jul Nov SepMayMar Jul MayMar Jul Sep NovNovMar2010
Jan2011
Jan2012
$-2
$2
$6
$10
$14
$18
$22
$26
$30 NortheastMilk Price, Feed Costs,and Returns from 2010-2012 ($/cwt)
High: $6.59 Low: -$0.31
Milk price and feed costs drive margins at the farm level. Certainly, sources of revenue other than milk and expenses other than feed impact profi tability, but not of the same magnitude. To gauge the economic health of the dairy industry, we have calculated margin based on mailbox milk price of several states and estimated of the market cost of a ration. Because feed prices change constantly and no one feed is a good indicator of total feed cost on a dairy, a ration was standardized to 10 percent rumen-degradable protein, 6 percent rumen-undegradable protein, 32 percent neutral-detergent fi ber, 40 percent non-fi ber carbohydrates and 5 percent fat. Nutrient costs are derived using the nutrient composition and monthly average market prices for a basket of feeds available in the region. Income over feed cost (IOFC) is calculated as the mailbox milk price less the feed cost of producing a hundredweight (cwt) of milk assuming a feed effi ciency of 1.45. Operating income is IOFC less non-feed operating costs that are published biannually by USDA’s Economic Research Service.
� e accompanying graphs show the mailbox milk price, ration cost, IOFC and operating income for the diff erent regions over the last three years. Milk price and income hit their lows this summer but just a few months later hit their 36-month highs. All of the improvement in margin is from an increase in milk price..
Margins improved considerably as 2012 came to a close. December data is preliminary, but it appears that IOFC is in the $7- to $11-per-cwt range. PD
10 Progressive Dairyman Issue 3 • February 11, 2013
MARGINS IMPROVE AS 2012 CLOSES
MARKET WATCHMARKET WATCHMARKET WATCHMARGIN
Dec2009
OctSepMarFeb Apr May Jun Jul Aug Sep Oct NovJan2010
Dec DecJan2011
MarFeb Apr May Jun Jul Aug Sep Oct Nov NovDec Jan2012
MarFeb Apr May Jun Jul Aug$2$3$4$5$6$7$8$9
$10$11
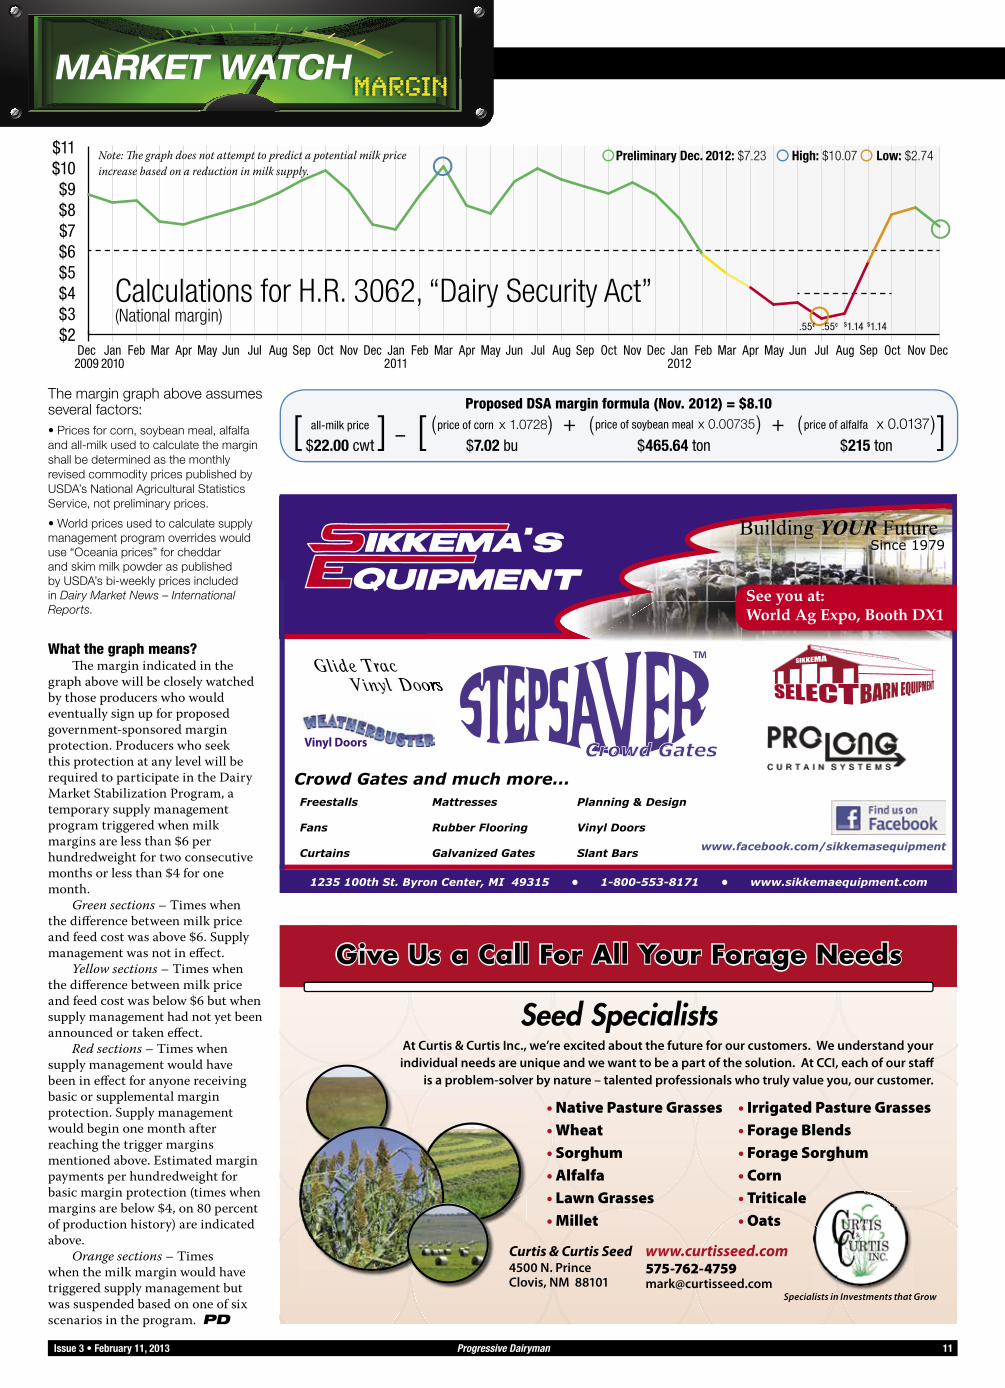
Calculations for H.R. 3062, “Dairy Security Act”(National margin)
Preliminary Dec. 2012: $7.23 High: $10.07 Low: $2.74
Proposed DSA margin formula (Nov. 2012) = $8.10
–all-milk price
$22.00 cwt $7.02 bu $465.64 ton $215 ton[ ] [ ]+ +price of corn x 1.0728( ) x 0.0137price of alfalfa( )price of soybean meal x 0.00735( )
The margin graph above assumes several factors: • Prices for corn, soybean meal, alfalfa and all-milk used to calculate the margin shall be determined as the monthly revised commodity prices published by USDA’s National Agricultural Statistics Service, not preliminary prices.
• World prices used to calculate supply management program overrides would use “Oceania prices” for cheddar and skim milk powder as published by USDA’s bi-weekly prices included in Dairy Market News – International Reports.
Note: � e graph does not attempt to predict a potential milk price increase based on a reduction in milk supply.
What the graph means? � e margin indicated in the
graph above will be closely watched by those producers who would eventually sign up for proposed government-sponsored margin protection. Producers who seek this protection at any level will be required to participate in the Dairy Market Stabilization Program, a temporary supply management program triggered when milk margins are less than $6 per hundredweight for two consecutive months or less than $4 for one month.
Green sections – Times when the diff erence between milk price and feed cost was above $6. Supply management was not in eff ect.
Yellow sections – Times when the diff erence between milk price and feed cost was below $6 but when supply management had not yet been announced or taken eff ect.
Red sections – Times when supply management would have been in eff ect for anyone receiving basic or supplemental margin protection. Supply management would begin one month after reaching the trigger margins mentioned above. Estimated margin payments per hundredweight for basic margin protection (times when margins are below $4, on 80 percent of production history) are indicated above.
Orange sections – Times when the milk margin would have triggered supply management but was suspended based on one of six scenarios in the program. PD
.55¢ .55¢ $1.14 $1.14
™
Since 1979
Vinyl Doors
Building YOUR Future
See you at:World Ag Expo, Booth DX1
Curtis & Curtis Seed4500 N. PrinceClovis, NM 88101
Give Us a Call For All Your Forage Needs
At Curtis & Curtis Inc., we’re excited about the future for our customers. We understand your individual needs are unique and we want to be a part of the solution. At CCI, each of our staff
is a problem-solver by nature – talented professionals who truly value you, our customer.
• Native Pasture Grasses • Irrigated Pasture Grasses• Wheat • Forage Blends• Sorghum • Forage Sorghum• Alfalfa • Corn• Lawn Grasses • Triticale• Millet • Oats
Seed Specialists
Specialists in Investments that Grow
Issue 3 • February 11, 2013 Progressive Dairyman 11

MARKET WATCHMARKET WATCHMARKET WATCHMARKET WATCHMARKET WATCHMARKET WATCHMARKET WATCHCATTLE
MARK ETWATCHJanuary 25, 2013
Top Springer
Top Average
Medium Holstein Springer
ShortbredsOpen
Heifers Light
Open Heifers Heavy
HeiferCalves
BullCalves
Breeding Bulls
Empire Livestock - Burton MarketVernon, NY (800) 257-1819 (sale 1/24/13)
$1,450NC
$1,250$50
$1,100 $100
$1,000$300
$100 $700
$200 $70
$65 $90
$20 $800$75
Mammoth Cave Dairy Auction, Inc.Smiths Grove, KY (800) 563-2131(sale 1/22/13)
$1,580$80
$1,480$20
$1,300 $20
$775$305
$360$15
$560$180
$150NC
$140$10
N/T
New Holland Sales StablesNew Holland, PA (717) 354-4341 (sale 1/23/13)
$1,575$25
$1,350$100
$1,225$150
$1,000NC
$400$90
$1,200$200
N/T N/T$1,350$200
Mid-Georgia Livestock AuctionJackson, GA (770) 775-7314 (sale 1/15/13)
$1,625$150
$1,400$100
$1,050$175
N/T$310
$160 $390
$390 N/T
$75$15
N/T
Central Livestock AssociationAlbany, MN (800) 733-6828 (sale 1/22/13)
$1,400$25
$1,350$50
$1,225$50
$1,110$140
N/T N/T N/T N/T N/T
Equity Co-op LivestockStratford, WI (715) 687-4101Rocky Olsen (608) 434-4037 (sale 1/22/13)
$1,500$25
$1,450$100
$1,200$25
$1,200$325
$525$75
$875$25
$105$45
$168$38
N/T
Lake Odessa LivestockLake Odessa, MI (616) 374-8213(sale 1/22/13)
$1,500$100
$1,200NC
$850$100
N/T$600
$100 $800$50
$250$50
N/T $1,300NC
Norwood Dairy Cattle AuctionNorwood, MO (417) 746-4242 (sale 1/11/13)
$1,375$65
$1,230$30
$940$10
$1,050$60
$350$10
$700$50
$230$70
$170$5
N/T
Pipestone Livestock Auction MarketPipestone, MN (507) 825-3306 (sale 1/17/13)
$1,575$100
$1,443$59
$1,398$64
N/T$105/cwt$5/cwt
$92/cwt$8/cwt
N/T N/T$1,100
NC
Spring� eld Livestock Marketing Center Springfi eld, MO (417) 869-9500 Doug Thomas (417) 840-9316 (sale 1/23/13)
$1,460$15
$1,200$50
$850$200
$1,075$335
$400$60
$855 $35
$220$100
$180 $30
N/T
Topeka Livestock AuctionTopeka, IN (206) 593-2522 (sale 1/22/13)
$1,525$15
$700$200
N/T N/T$800
$100 $1,300$125
$150$55
N/T$1,075$125
Tri-State LivestockSioux Center, IA (712) 722-0681Mike Koedam (712) 470-0198 (sale 1/16/13)
$1,635 $160
$1,545$125
$1,491$168
N/T$109/cwt$2/cwt
$94/cwt$7/cwt
N/T N/T $1,225
United Producers, Inc.Marion, MI (517) 294-3484 (sale 1/18/13)
$1,700$250
$1,500 $100
$1,200$150
$1,050$125
$400$800$50
$150$150
N/T $1,000
Brush Livestock of ColoradoBrush, CO (970) 842-2801 (sale 1/10/13)
$1,925$125
$1,810$50
$1,615$100
$1,310$185
$385 $520 N/T N/T N/T
Chehalis Livestock MarketChehalis, WA (360) 748-3191 (sale 1/11/13)
$1,425$50
$1,400$75
$1,110$40
N/T N/T N/T N/T$65
$25 N/T
Producers LivestockJerome, ID (208) 324-4345 (sale 1/16/13)
$1,450 $20
$1,380$30
$1,300$40
N/T N/T N/T N/T N/T N/T
Smith� eld Livestock AuctionSmithfi eld, UT (435) 563-3259 (sale 1/24/13)
$1,310$65
$1,175$75
$1,100 $800 $90/cwt $92/cwt N/T N/T N/T
Toppenish Dairy Replacement SalesToppenish, WA (509) 865-2820 (sale 1/14/13)
$1,275$25
$1,200 NC
$900$250
$1,210$60
$108/cwt$2/cwt
$100/cwt$5/cwt
N/T N/T N/T
A & M Livestock Auction, Inc.Hanford, CA (559) 582-0358 (sale 1/9/13)
$1,480$250
$1,250$180
$1,220$210
$1,020$170
$370$10
$900$30
N/T N/T N/T
Sulphur Springs Livestock & Dairy AuctionSulphur Springs, TX (903) 885-7739(sale 1/3/13)
$1,400$100
$1,050NC
$1,025$25
N/T$610$15
$850$40
$235$25
$250$50
$875$15
Escalon Livestock Market, Inc.Escalon, CA (209) 838-7011(sale 1/16/13)
$1,500 NC
$1,100 NC
$1,075NCzs
N/T$90/cwt
NC$175/cwt
NCN/T N/T
$900NC
Contact Judy about being included in Progressive Dairyman’s Market Watch! [email protected] • (208) 324-7513 NC = No change N/T = No test Decrease in price Increase in price
Log on to www.progressivedairy.com/marketwatch to get auction reports from more locations!
MARKET WATCHMARKET WATCHMARKET WATCHCULLING
Warren WagnerMarket360 Dairy AdviserStewart-Peterson [email protected]
Jan
Dec
Jul
Mar
Apr
May
Jun
Feb
Sep
Aug
Nov
Oct
Jan
2011
2010
2011
20122013
2012
35,000
45,000
55,000
65,000
75,000
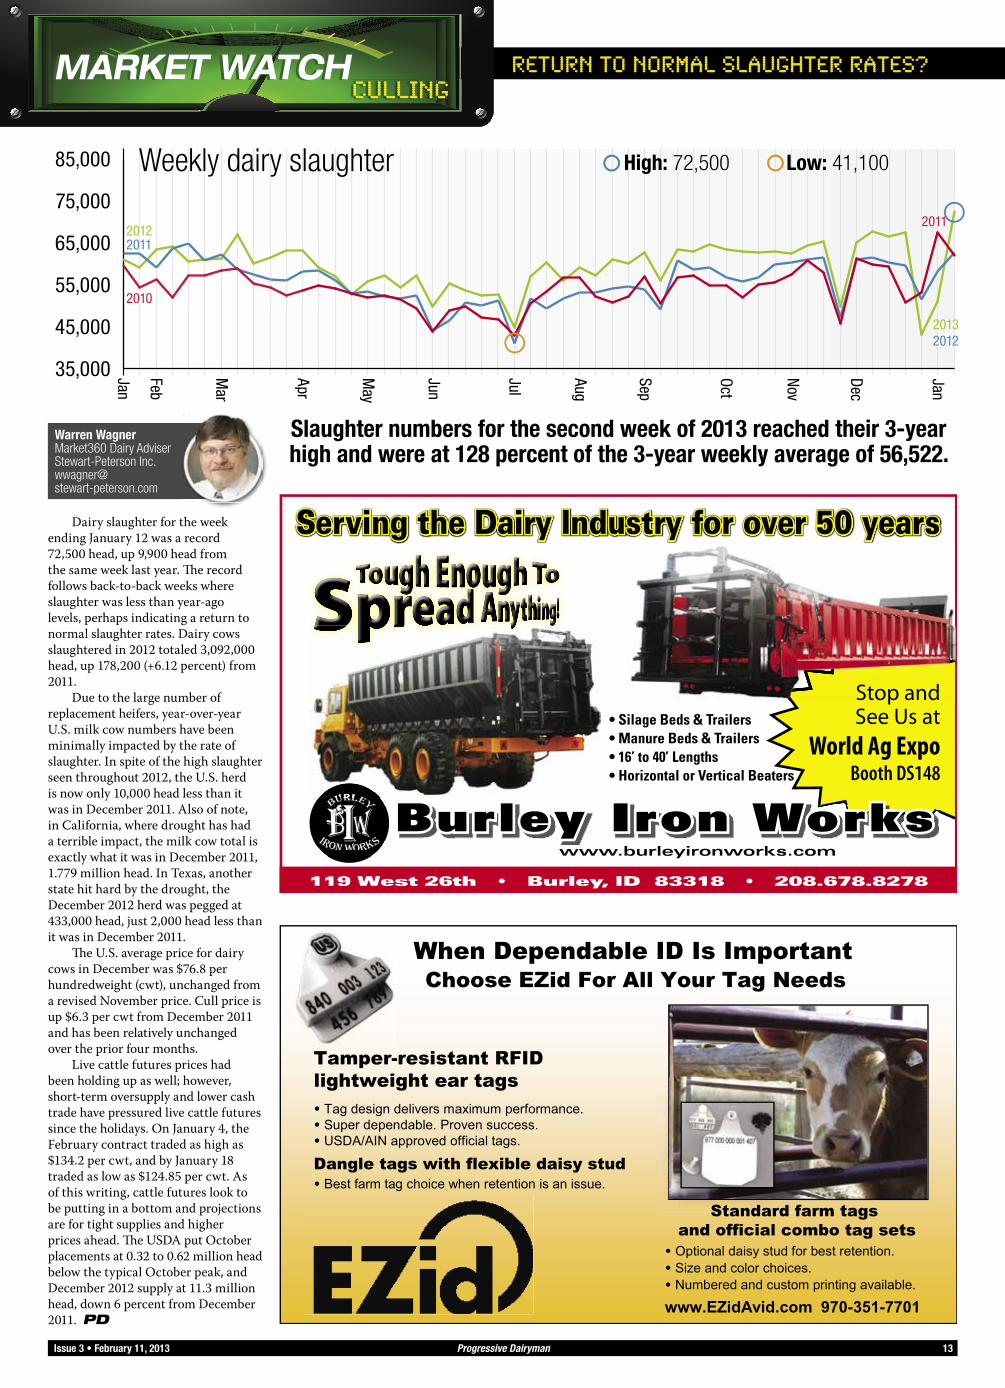
85,000 High: 72,500 Low: 41,100Weekly dairy slaughter
Slaughter numbers for the second week of 2013 reached their 3-year high and were at 128 percent of the 3-year weekly average of 56,522.
Dairy slaughter for the week ending January 12 was a record 72,500 head, up 9,900 head from the same week last year. � e record follows back-to-back weeks where slaughter was less than year-ago levels, perhaps indicating a return to normal slaughter rates. Dairy cows slaughtered in 2012 totaled 3,092,000 head, up 178,200 (+6.12 percent) from 2011.
Due to the large number of replacement heifers, year-over-year U.S. milk cow numbers have been minimally impacted by the rate of slaughter. In spite of the high slaughter seen throughout 2012, the U.S. herd is now only 10,000 head less than it was in December 2011. Also of note, in California, where drought has had a terrible impact, the milk cow total is exactly what it was in December 2011, 1.779 million head. In Texas, another state hit hard by the drought, the December 2012 herd was pegged at 433,000 head, just 2,000 head less than it was in December 2011.
� e U.S. average price for dairy cows in December was $76.8 per hundredweight (cwt), unchanged from a revised November price. Cull price is up $6.3 per cwt from December 2011 and has been relatively unchanged over the prior four months.
Live cattle futures prices had been holding up as well; however, short-term oversupply and lower cash trade have pressured live cattle futures since the holidays. On January 4, the February contract traded as high as $134.2 per cwt, and by January 18 traded as low as $124.85 per cwt. As of this writing, cattle futures look to be putting in a bottom and projections are for tight supplies and higher prices ahead. � e USDA put October placements at 0.32 to 0.62 million head below the typical October peak, and December 2012 supply at 11.3 million head, down 6 percent from December 2011. PD
RETURN TO NORMAL SLAUGHTER RATES?
Tag design delivers maximum performance. Super dependable. Proven success. USDA/AIN approved official tags.
Dangle tags with flexible daisy stud Best farm tag choice when retention is an issue.
When Dependable ID Is ImportantChoose EZid For All Your Tag Needs
Tamper-resistant RFID lightweight ear tags
Standard farm tags and official combo tag sets
Optional daisy stud for best retention. Size and color choices. Numbered and custom printing available.
www.EZidAvid.com 970-351-7701
Standard f
Burley Iron Works119 West 26th • Burley, ID 83318 • 208.678.8278
Serving the Dairy Industry for over 50 years
www.burleyironworks.com
• Silage Beds & Trailers• Manure Beds & Trailers• 16’ to 40’ Lengths• Horizontal or Vertical Beaters
Stop and See Us at
World Ag Expo Booth DS148
Issue 3 • February 11, 2013 Progressive Dairyman 13
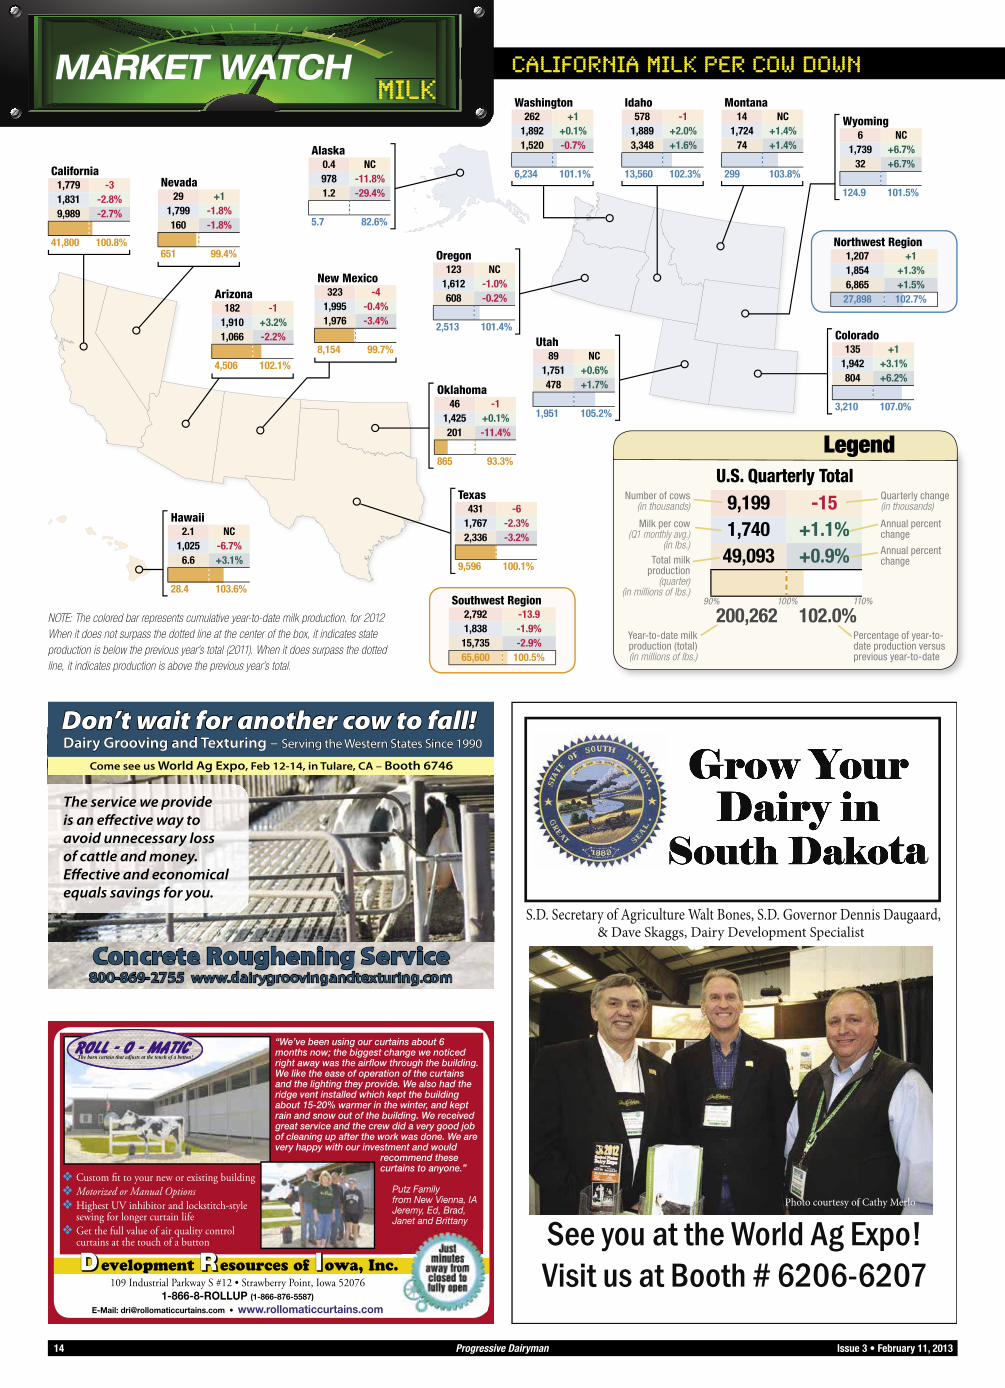
NOTE: The colored bar represents cumulative year-to-date milk production. for 2012 When it does not surpass the dotted line at the center of the box, it indicates state production is below the previous year’s total (2011). When it does surpass the dotted line, it indicates production is above the previous year’s total.
Southwest Region2,792 -13.91,838 -1.9%15,735 -2.9%65,600 100.5%
Northwest Region1,207 +11,854 +1.3%6,865 +1.5%27,898 102.7%
MARKET WATCHMARKET WATCHMILK
Texas431 -6
1,767 -2.3%2,336 -3.2%
9,596 100.1%
Utah89 NC
1,751 +0.6%478 +1.7%
1,951 105.2%
Washington262 +1
1,892 +0.1%1,520 -0.7%
6,234 101.1%
Arizona182 -1
1,910 +3.2%1,066 -2.2%
4,506 102.1%
California1,779 -31,831 -2.8%9,989 -2.7%
41,800 100.8%
Nevada29 +1
1,799 -1.8%160 -1.8%
651 99.4%
Oklahoma46 -1
1,425 +0.1%201 -11.4%
865 93.3%
Hawaii2.1 NC
1,025 -6.7%6.6 +3.1%
28.4 103.6%
Colorado135 +1
1,942 +3.1%804 +6.2%
3,210 107.0%
Montana14 NC
1,724 +1.4%74 +1.4%
299 103.8%
Wyoming6 NC
1,739 +6.7%32 +6.7%
124.9 101.5%
Alaska0.4 NC978 -11.8%1.2 -29.4%
5.7 82.6%
Idaho578 -1
1,889 +2.0%3,348 +1.6%
13,560 102.3%
New Mexico323 -4
1,995 -0.4%1,976 -3.4%
8,154 99.7%
Oregon123 NC
1,612 -1.0%608 -0.2%
2,513 101.4%
U.S. Quarterly Total 9,199 -151,740 +1.1%49,093 +0.9%
200,262 102.0%
Legend
Number of cows(in thousands)
Milk per cow(Q1 monthly avg.)
(in lbs.)Total milk
production (quarter)
(in millions of lbs.)
Year-to-date milkproduction (total)(in millions of lbs.)
Percentage of year-to-date production versus previous year-to-date
Quarterly change(in thousands)
Annual percentchange
Annual percentchange
90% 100% 110%
DD evelopment RR esources of IIowa, Inc.109 Industrial Parkway S #12 • Strawberry Point, Iowa 52076
1-866-8-ROLLUP (1-866-876-5587)
E-Mail: [email protected] • www.rollomaticcurtains.com
v Custom fi t to your new or existing buildingv Motorized or Manual Optionsv Highest UV inhibitor and lockstitch-style sewing for longer curtain lifev Get the full value of air quality control curtains at the touch of a button
“We’ve been using our curtains about 6 months now; the biggest change we noticed right away was the airfl ow through the building. We like the ease of operation of the curtains and the lighting they provide. We also had the ridge vent installed which kept the building about 15-20% warmer in the winter, and kept rain and snow out of the building. We received great service and the crew did a very good job of cleaning up after the work was done. We are very happy with our investment and would recommend these curtains to anyone.”
Putz Family from New Vienna, IA Jeremy, Ed, Brad, Janet and Brittany
The barn curtain that adjusts at the touch of a button!The barn curtain that adjusts at the touch of a button!
Don’t wait for another cow to fall!Dairy Grooving and Texturing – Serving the Western States Since 1990
Concrete Roughening Service800-869-2755 www.dairygroovingandtexturing.com
Come see us World Ag Expo, Feb 12-14, in Tulare, CA – Booth 6746
The service we provide is an eff ective way to avoid unnecessary loss of cattle and money. Eff ective and economical equals savings for you.
See you at the World Ag Expo! Visit us at Booth # 6206-6207
S.D. Secretary of Agriculture Walt Bones, S.D. Governor Dennis & Dave Skaggs, Dairy Development Specialist
Photo courtesy of Cathy Merlo
Daugaard,
CALIFORNIA MILK PER COW DOWN
14 Progressive Dairyman Issue 3 • February 11, 2013
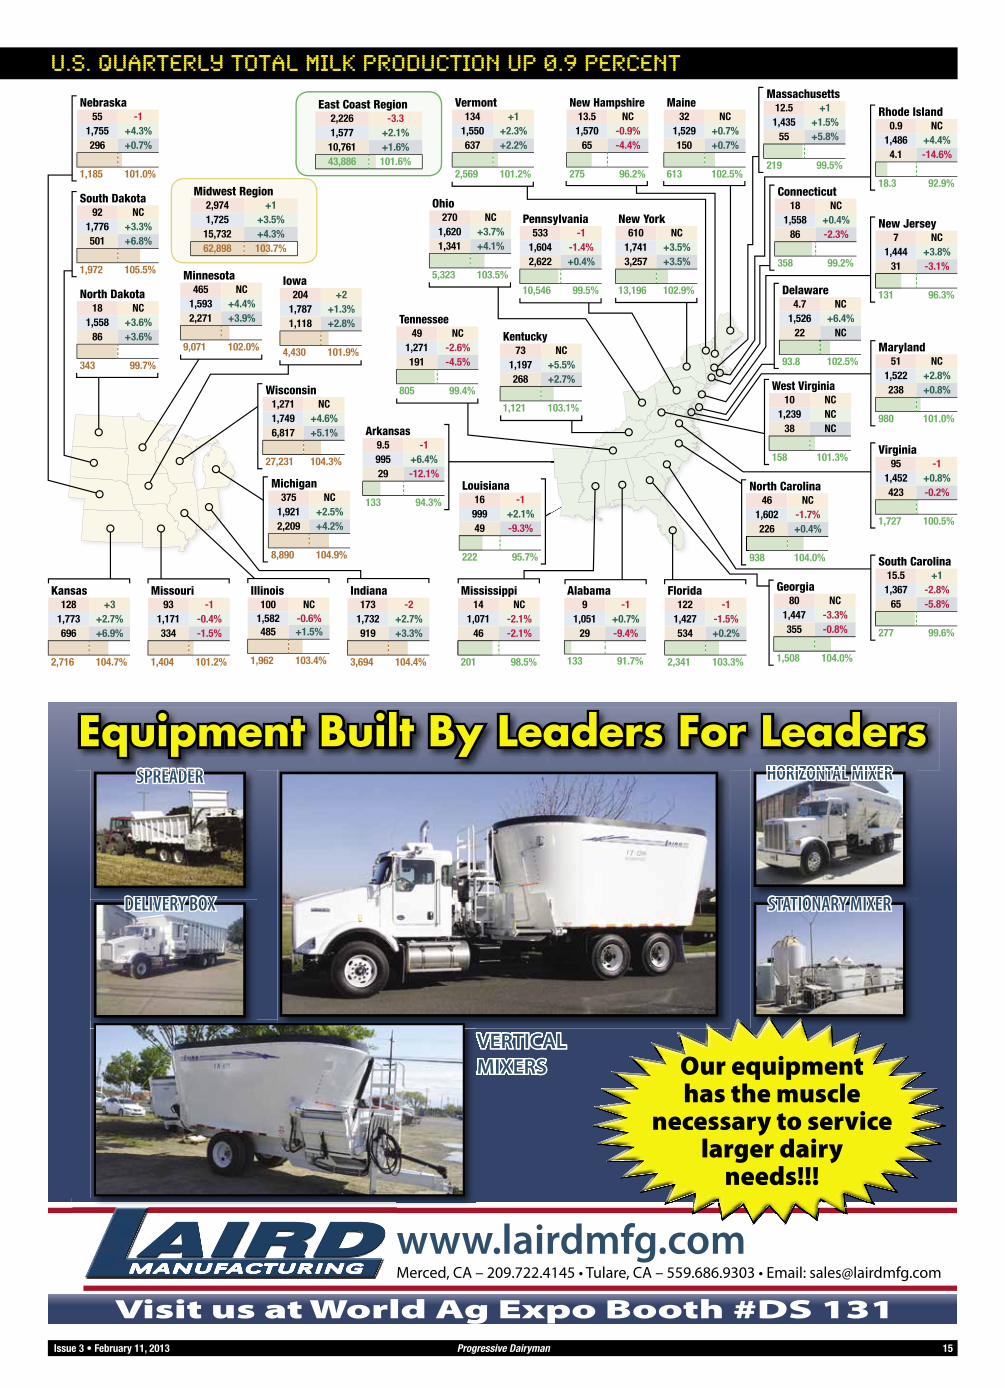
East Coast Region2,226 -3.31,577 +2.1%10,761 +1.6%43,886 101.6%
Midwest Region2,974 +11,725 +3.5%15,732 +4.3%62,898 103.7%
U.S. QUARTERLY TOTAL MILK PRODUCTION UP 0.9 PERCENTVermont
134 +11,550 +2.3%637 +2.2%
2,569 101.2%
Virginia95 -1
1,452 +0.8%423 -0.2%
1,727 100.5%
Wisconsin1,271 NC1,749 +4.6%6,817 +5.1%
27,231 104.3%
Florida122 -1
1,427 -1.5%534 +0.2%
2,341 103.3%
Georgia80 NC
1,447 -3.3%355 -0.8%
1,508 104.0%
North Carolina46 NC
1,602 -1.7%226 +0.4%
938 104.0%
Maryland51 NC
1,522 +2.8%238 +0.8%
980 101.0%
New Jersey7 NC
1,444 +3.8%31 -3.1%
131 96.3%Delaware4.7 NC
1,526 +6.4%22 NC
93.8 102.5%
Connecticut18 NC
1,558 +0.4%86 -2.3%
358 99.2%
Massachusetts12.5 +1
1,435 +1.5%55 +5.8%
219 99.5%
Rhode Island0.9 NC
1,486 +4.4%4.1 -14.6%
18.3 92.9%
Alabama9 -1
1,051 +0.7%29 -9.4%
133 91.7%
Mississippi14 NC
1,071 -2.1%46 -2.1%
201 98.5%
Louisiana16 -1
999 +2.1%49 -9.3%
222 95.7%
Illinois100 NC
1,582 -0.6%485 +1.5%
1,962 103.4%
Indiana173 -2
1,732 +2.7%919 +3.3%
3,694 104.4%
Iowa204 +2
1,787 +1.3%1,118 +2.8%
4,430 101.9%
Kansas128 +3
1,773 +2.7%696 +6.9%
2,716 104.7%
Nebraska55 -1
1,755 +4.3%296 +0.7%
1,185 101.0%
South Dakota92 NC
1,776 +3.3%501 +6.8%
1,972 105.5%
North Dakota18 NC
1,558 +3.6%86 +3.6%
343 99.7%
Michigan375 NC
1,921 +2.5%2,209 +4.2%
8,890 104.9%
Minnesota465 NC
1,593 +4.4%2,271 +3.9%
9,071 102.0%
Missouri93 -1
1,171 -0.4%334 -1.5%
1,404 101.2%
New York610 NC
1,741 +3.5%3,257 +3.5%
13,196 102.9%
Ohio270 NC
1,620 +3.7%1,341 +4.1%
5,323 103.5%
Pennsylvania533 -1
1,604 -1.4%2,622 +0.4%
10,546 99.5%
New Hampshire13.5 NC
1,570 -0.9%65 -4.4%
275 96.2%
Maine32 NC
1,529 +0.7%150 +0.7%
613 102.5%
West Virginia10 NC
1,239 NC38 NC
158 101.3%
Kentucky73 NC
1,197 +5.5%268 +2.7%
1,121 103.1%
Tennessee49 NC
1,271 -2.6%191 -4.5%
805 99.4%
Arkansas9.5 -1995 +6.4%29 -12.1%
133 94.3%
South Carolina15.5 +1
1,367 -2.8%65 -5.8%
277 99.6%
VERTICAL MIXERS
SPREADER
DELIVERY BOX
HORIZONTAL MIXER
STATIONARY MIXER
SPREADERSPREADER HORIZONTAL MIXERHORIZONTAL MIXEHORIZONTAL MIXER
Equipment Built By Leaders For Leaders
www.lairdmfg.comAIRDAIRDMerced, CA – 209.722.4145 • Tulare, CA – 559.686.9303 • Email: [email protected]
Our equipment has the muscle
necessary to servicelarger dairy
needs!!!
Visit us at World Ag Expo Booth #DS 131Issue 3 • February 11, 2013 Progressive Dairyman 15

Feb Mar Apr May July AugJune Sept Oct Dec Jan2012
Dec Jan2012
Nov Feb Mar Apr May June July Aug Sept Oct NovFeb2010
Mar Apr May June July Aug Sept Oct Nov Dec Jan2011
CA Class 1 price
Federal Class I price$13
$15
$17
$19
$21
$23
$25
MARKET WATCHMARKET WATCH CASH BLOCK CHEESE PRICE DIPS DAIRY PRICES
Jan. 2013: $18.97 High: $21.78 Low: $13.22Jan. 2013: $20.51 High: $23.84 Low: $14.64
Fluid milk prices (in dollars)
Lee MielkeSyndicated [email protected]
Two USDA reports fed the dairy market bears this week. Preliminary data in the December milk production report put output in the top 23 states at 15.7 billion pounds, up 800 million pounds from November and a hefty 1.7 percent above December 2011. � e 50-state output, at 16.8 billion pounds, was up 1.6 percent. Revisions added 31 million pounds to the November data, pushing output to 14.9 billion, up 1.3 percent from a year ago.
� e preliminary 2012 50-state milk production total came to 200.3 billion pounds, up 4 billion pounds or 2.1 percent from 2011. Cow numbers averaged 9.23 million head, up 37,000. Output per cow averaged 21,697 pounds, up 352 pounds. December cow numbers in the 23 states stood at 8.49 million head, up 16,000 from November and 5,000 above a year ago.
� e bears fed off USDA’s latest cold storage data, which pegged December 31 butter holdings at 152.9 million pounds, up 25.6 million pounds or 20 percent from November and a whopping 46 million or 43 percent above December 2012.
� e cash block cheese price lost 4 1/4 cents in the shortened Martin Luther King Day holiday week, dipping to $1.6450 per pound, the lowest level since mid-July 2012, but still 13 1/2 cents above a year ago. � e barrels closed the week at $1.5725, down 6 1/2 cents on the week, 7 1/4 below the blocks, but 7 3/4 cents above a year ago. Four cars of block traded hands on the week and 10 of barrel. � e AMS-surveyed U.S. average block price hit $1.7443, down a penny. � e barrels averaged $1.7277, down 1.1 cent.
FAS-reported exports of butter and milkfat, January to November 2012, totaled 99.5 million pounds, down 25 percent from a year ago. � ose exports accounted for 5.9 percent of U.S. butter production for the year.
Cooperatives Working Together (CWT) accepted 19 requests for export assistance this week to sell 3.814 million pounds of cheese and 2.423 million pounds of butter to customers in Asia, the Middle East and North Africa.
Checking demand – USDA reports that 4.5 billion pounds of packaged fl uid milk products is estimated to have been sold in the U.S. in November, down half a percentage point from November 2011. After adjusting for calendar composition, November sales were off 1.7 percent. Total conventional fl uid product sales were off 0.9 percent, while total organic fl uid milk products increased 9 percent.
Following a 12-day delay, the California Department of Food and Agriculture (CDFA) announced its February Class I milk prices January
Come see us at
World Ag ExpoBooth DS111-114
16 Progressive Dairyman Issue 3 • February 11, 2013

American cheese, at 604.9 million pounds, was up 4 percent from November but 1 percent below a year ago. The total cheese inventory, at 987.9 million pounds, was up 5 percent from November and unchanged from a year ago.
Cash butter saw its week close at $1.5050, unchanged on the week, but 4 1/2 cents below a year ago.
MarFeb Sept OctJan2012
Apr May AugJune July Nov Dec
2011
$1.20
$1.30
$1.40
$1.50
$1.60
$1.70
$1.80 Dec. 2012: $1.58 High: $1.75 Low: $1.21Non-fat dry milk
2012
3/3/12
5/5/12
10/6/12
11/3/12
12/1/12
1/5/13
1/19/13
7/7/12
8/4/12
9/1/12
4/7/12
1/28/122/4/12
6/2/12
2011
$1.45
$1.65
$1.85
$2.05
$2.25
1/3/13
1/4/13
1/7/13
1/8/13
1/9/13
1/10/13
1/11/13
1/14/13
1/15/13
1/16/13
1/17/13
1/18/13
1/22/13
1/23/13
1/24/13
$1.64
$1.66
$1.68
$1.70
$1.72
$1.74
$1.76
$1.78
Jan. 19, 2013: $1.70High: $2.16Low: $1.48
Cheese (weekly average in dollars)
Mar Apr May June July Aug Sept Oct Nov NovDec FebFeb Mar Apr May June July Aug Sept Oct
Futures
Jan2012
Jan2011
Dec
2013 2014
$13
$15
$17
$19
$21
$23 Class III (in dollars) Dec. 2012: $18.66 High: $21.67 Low: $13.48
FLUID PRODUCT SALES OFF 0.9 PERCENT
1/28/12
3/3/12
4/7/12
5/5/12
7/7/12
8/4/12
9/1/12
10/6/12
1/5/13
1/19/13
12/1/12
11/3/12
2/4/12
6/2/12
2011
2012
$1.25
$1.50
$1.75
$2.00
$2.25
$2.50Jan. 19, 2012: $1.49 High: $2.16 Low: $1.31Butter (weekly average in dollars)
1/4/13
1/7/13
1/8/13
1/9/13
1/10/13
1/11/13
1/14/13
1/15/13
1/16/13
1/17/13
1/18/13
1/22/13
1/23/13
1/24/13
1/3/13
$1.44
$1.45
$1.46
$1.47
$1.48
$1.49
$1.50
$1.51
22 at $19.83 per hundredweight (cwt) for the north and $20.10 for the south. Both are down 41 cents from January, but $1.31 above February 2012. � at put the two-month average at $20.04 for the north and $20.31 for the south, both up 84 cents from a year ago.
CDFA stated on its website that class prices for the months February to May 2013 include temporary price increases resulting from the December 21, 2012, public hearing. “In order to calculate class prices for these months, the additional temporary increases are added to the corresponding per-pound price of fat, solids-not-fat and fl uid carrier after all other calculations
of the current formulas have been performed.”
Many of the details in the notice were already anticipated. Under the American Taxpayer Relief Act of 2012, signed into law by President Obama on January 2, virtually all dates regarding MILC payment calculations, price triggers and adjusters and payment caps were changed from “2012” to “2013.”
As a result of legislative changes, retroactive MILC payments were triggered for September and October 2012. � e September 2012 payment is 59.44 cents per cwt. � e October payment is 2.37 cents. PD
References in Expert (Peer) Reviewed Journals1. Effects of changing the fat and fatty acid composition of milk replacers fed to neonatal calves. Prof.
Anim. Sci. 23:135-143 (2007).2. Amino acid fatty acid and fat sources for calf milk replacers. Prof. Anim. Sci. 23:401-408 (2007).3. Effects of changing the fatty acid composition of calf starters. Prof. Anim. Sci. 23:665-671 (2007).4. Effects of changing the essential and functional fatty acid intake of dairy calves. J. Dairy Sci.
92:670-676 (2009).5. Selenium yeast for dairy calf feeds. Animal Feed Science and Technology 153:228-235 (2009).6. Effect of yeast culture, fatty acids, whey, and a peptide source on dairy calf performance. Prof. Anim.
Sci. 25:794-800 (2009).7. Impact of various fatty acids on dairy calf performance. Prof. Anim. Sci. 27:167-175 (2011).8. Fatty acid intake alters growth and immunity of milk-fed calves. J. Dairy Sci. 94:3936-3948 (2011).
Butyric acid, medium chain fatty acids, and linolenic acid are all low in concentration in the typical milk replacer, starter feed, and grower feed. These fatty acids have increased average daily gain in each published calf trial. The change in hip width was increased and feed efficiency was improved in most every trial. So the calf was not just heavier but its frame was larger. In most all milk replacer trials, where the full dose of fatty acids was delivered in the neonatal period, scouring was reduced and titers to vaccines were increased.
The value of specific fatty acids (butyrate, medium chain fatty acids, and linolenic acid) to calves has been quantified and the results were consistent across feed types, feed companies, animal types, and research labs (references cited below). These are consistent responses that bring value to a calf-rearing program in the form of bigger and healthier calves.
your calves
The right fatty acids for your calf program!
NeoTec4.com / 800-553-1712 or 1-800-392-8324
®
Grasp Firmly.Then Apply Science.
Issue 3 • February 11, 2013 Progressive Dairyman 17