Embed Size (px)
Citation preview
TA INSTRUMENTS
RHEOMETERS
THE TA INSTRUMENTS RHEOMETER
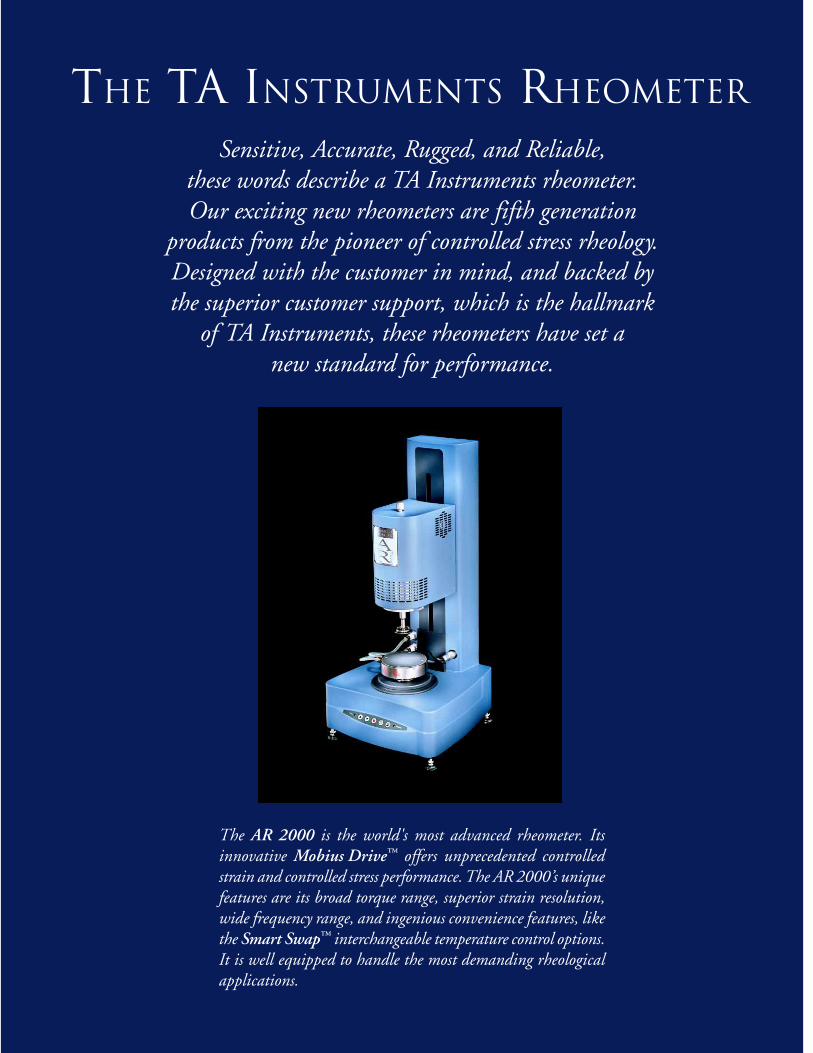
Sensitive, Accurate, Rugged, and Reliable,these words describe a TA Instruments rheometer.Our exciting new rheometers are fifth generation
products from the pioneer of controlled stress rheology.Designed with the customer in mind, and backed bythe superior customer support, which is the hallmark
of TA Instruments, these rheometers have set anew standard for performance.
The AR 2000 is the world's most advanced rheometer. Itsinnovative Mobius Drive™ offers unprecedented controlledstrain and controlled stress performance. The AR 2000’s uniquefeatures are its broad torque range, superior strain resolution,wide frequency range, and ingenious convenience features, likethe Smart Swap™ interchangeable temperature control options.It is well equipped to handle the most demanding rheologicalapplications.
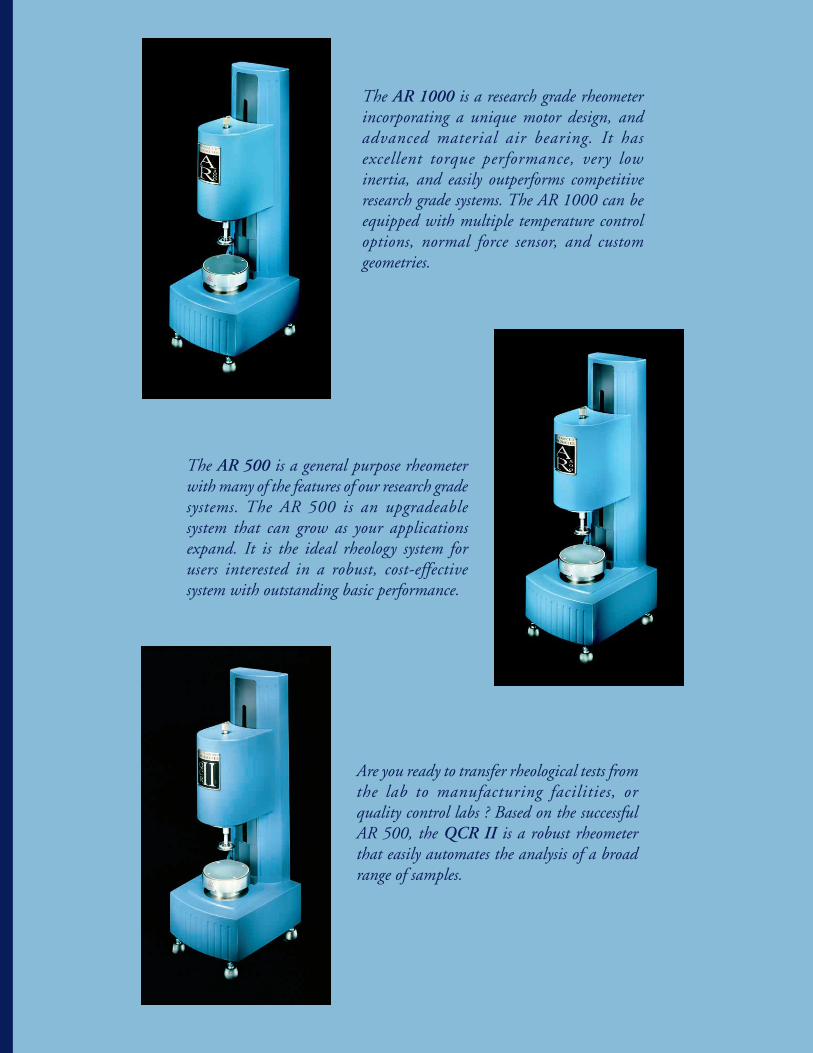
The AR 1000 is a research grade rheometerincorporating a unique motor design, andadvanced material air bearing. It hasexcellent torque performance, very lowinertia, and easily outperforms competitiveresearch grade systems. The AR 1000 can beequipped with multiple temperature controloptions, normal force sensor, and customgeometries.
The AR 500 is a general purpose rheometerwith many of the features of our research gradesystems. The AR 500 is an upgradeablesystem that can grow as your applicationsexpand. It is the ideal rheology system forusers interested in a robust, cost-effectivesystem with outstanding basic performance.
Are you ready to transfer rheological tests fromthe lab to manufacturing facilities, orquality control labs ? Based on the successfulAR 500, the QCR II is a robust rheometerthat easily automates the analysis of a broadrange of samples.
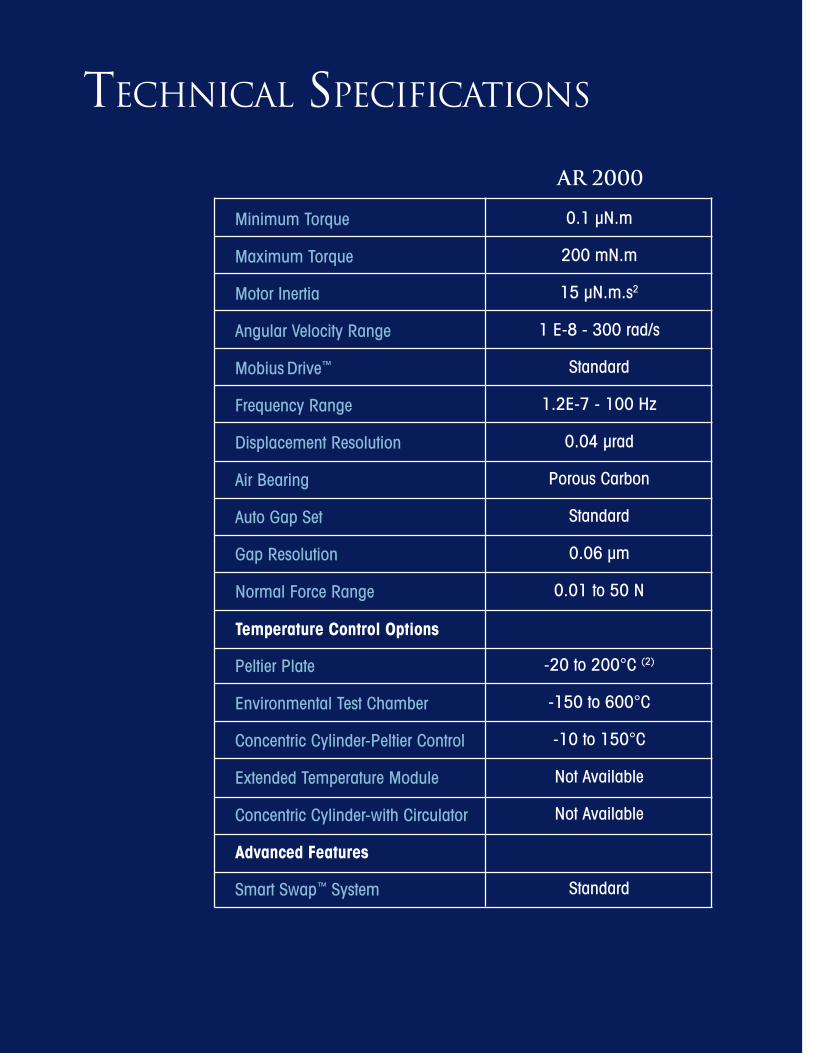
TECHNICAL SPECIFICATIONS
Minimum Torque
Maximum Torque
Motor Inertia
Angular Velocity Range
Mobius Drive™
Frequency Range
Displacement Resolution
Air Bearing
Auto Gap Set
Gap Resolution
Normal Force Range
Peltier Plate
Environmental Test Chamber
Concentric Cylinder-Peltier Control
Extended Temperature Module
Concentric Cylinder-with Circulator
Advanced Features
Smart Swap™ System
Temperature Control Options
AR 2000
0.1 µN.m
200 mN.m
15 µN.m.s2
1 E-8 - 300 rad/s
Standard
1.2E-7 - 100 Hz
0.04 µrad
Porous Carbon
Standard
0.06 µm
0.01 to 50 N
-20 to 200°C (2)
-150 to 600°C
-10 to 150°C
Not Available
Not Available
Standard
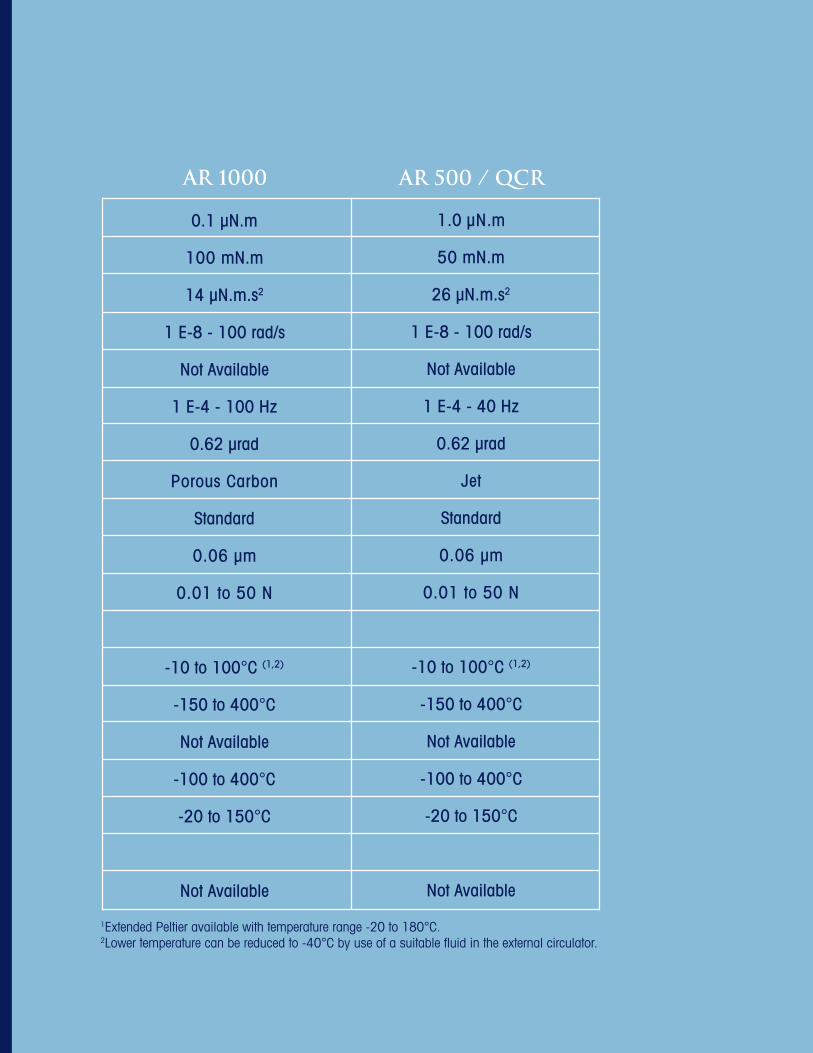
AR 1000
0.1 µN.m
100 mN.m
14 µN.m.s2
1 E-8 - 100 rad/s
Not Available
1 E-4 - 100 Hz
0.62 µrad
Porous Carbon
Standard
0.06 µm
0.01 to 50 N
-10 to 100°C (1,2)
-150 to 400°C
Not Available
-100 to 400°C
-20 to 150°C
Not Available
AR 500 / QCR
1.0 µN.m
50 mN.m
26 µN.m.s2
1 E-8 - 100 rad/s
Not Available
1 E-4 - 40 Hz
0.62 µrad
Jet
Standard
0.06 µm
0.01 to 50 N
-10 to 100°C (1,2)
-150 to 400°C
Not Available
-100 to 400°C
-20 to 150°C
Not Available
1Extended Peltier available with temperature range -20 to 180°C.2Lower temperature can be reduced to -40°C by use of a suitable fluid in the external circulator.
INSTRUMENT DESIGN FEATURES AND BENEFITS
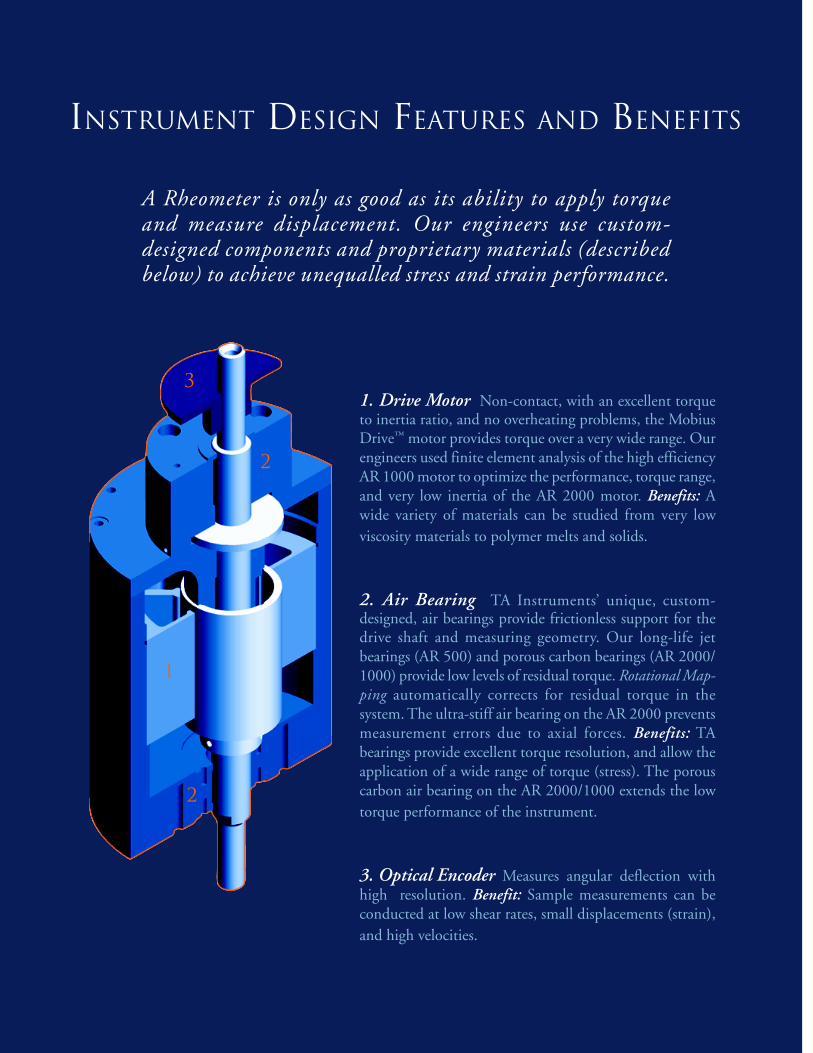
A Rheometer is only as good as its ability to apply torqueand measure displacement. Our engineers use custom-designed components and proprietary materials (describedbelow) to achieve unequalled stress and strain performance.
1. Drive Motor Non-contact, with an excellent torqueto inertia ratio, and no overheating problems, the MobiusDrive™ motor provides torque over a very wide range. Ourengineers used finite element analysis of the high efficiencyAR 1000 motor to optimize the performance, torque range,and very low inertia of the AR 2000 motor. Benefits: Awide variety of materials can be studied from very lowviscosity materials to polymer melts and solids.
2. Air Bearing TA Instruments’ unique, custom-designed, air bearings provide frictionless support for thedrive shaft and measuring geometry. Our long-life jetbearings (AR 500) and porous carbon bearings (AR 2000/1000) provide low levels of residual torque. Rotational Map-ping automatically corrects for residual torque in thesystem. The ultra-stiff air bearing on the AR 2000 preventsmeasurement errors due to axial forces. Benefits: TAbearings provide excellent torque resolution, and allow theapplication of a wide range of torque (stress). The porouscarbon air bearing on the AR 2000/1000 extends the lowtorque performance of the instrument.
3. Optical Encoder Measures angular deflection withhigh resolution. Benefit: Sample measurements can beconducted at low shear rates, small displacements (strain),and high velocities.
1
2
2
3

•Linear Ball Slide Mounts the motor and air bearing to the casting. The high precision slide is drivenvertically by a motor in the base. A second optical encoder is located in the base to measure the movementof the slide. Benefits: Precise geometry location relative to the sample is assured. The long travel permittedby the ball slide allows for a large working space to simplify sample loading and cleaning.
•Auto Gap Set The software provides automatic setting of gap, and programmed gap closure via severalmethods (linear, exponential). Thermal Gap Compensation automatically corrects for any change in samplegap due to thermal expansion. Benefits: Automatic and reproducible setting of the sample gap ensuresaccuracy and reproducibility. By monitoring the normal force exerted by the sample during closure,delicate material structures are protected rather than destroyed prior to the experiment.
•Rigid One-Piece Aluminum Casting The key components of the rheometer are mounted in thisstiff high mass casting. Benefit: Low system compliance with high mechanical integrity.
5
4. Smart Swap™ This unique magnetic device isthe location point for all AR 2000 temperaturecontrol options. Benefit: The Smart Swap base allowsrapid exchange of temperature options whilemaintaining precise location.
5. Normal Force Transducer This highly sensi-tive, ultra-stiff transducer located below the sampleplate provides a direct measure of a wide rangeof normal forces exerted by samples, without a changein gap. The performance, fast response, and tempera-ture isolation found in the AR 1000/500 normal forcesensors are improved in the AR 2000. Benefits: Quantitativenormal forces exhibited by materials with different viscoelas-tic properties are measured. Normal forces generated duringsample loading can be monitored.
4
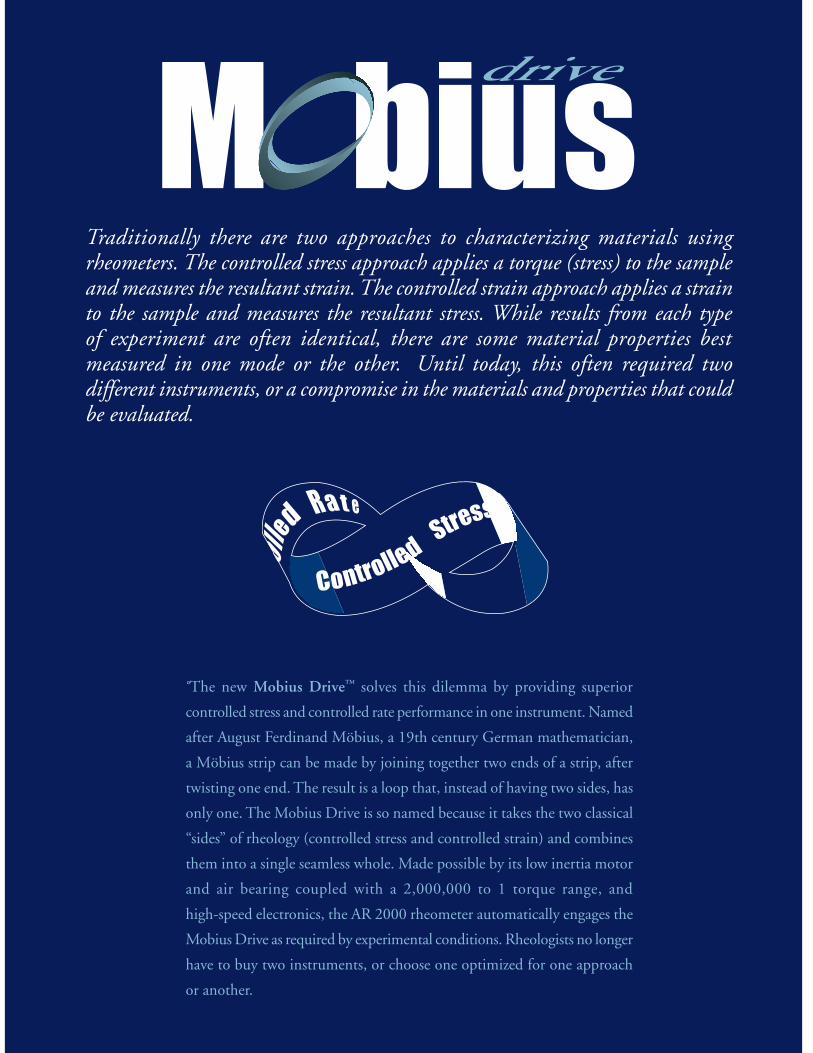
Traditionally there are two approaches to characterizing materials usingrheometers. The controlled stress approach applies a torque (stress) to the sampleand measures the resultant strain. The controlled strain approach applies a strainto the sample and measures the resultant stress. While results from each typeof experiment are often identical, there are some material properties bestmeasured in one mode or the other.␣ Until today, this often required twodifferent instruments, or a compromise in the materials and properties that couldbe evaluated.
␣ The new Mobius Drive™ solves this dilemma by providing superior
controlled stress and controlled rate performance in one instrument. Named
after August Ferdinand Möbius, a 19th century German mathematician,
a Möbius strip can be made by joining together two ends of a strip, after
twisting one end. The result is a loop that, instead of having two sides, has
only one. The Mobius Drive is so named because it takes the two classical
“sides” of rheology (controlled stress and controlled strain) and combines
them into a single seamless whole. Made possible by its low inertia motor
and air bearing coupled with a 2,000,000 to 1 torque range, and
high-speed electronics, the AR 2000 rheometer automatically engages the
Mobius Drive as required by experimental conditions. Rheologists no longer
have to buy two instruments, or choose one optimized for one approach
or another.
0.1
1
10 10
100
100
1
1000
0.01.001 .01 0.1 1 10 100 1000
10,000
Modulus G(t)
Time to set strain 60ms
0.0001
0.001
0.01
0.1
1
10
0.000010.001 0.01 0.1 1 10 100
100
Time to set speed 20ms
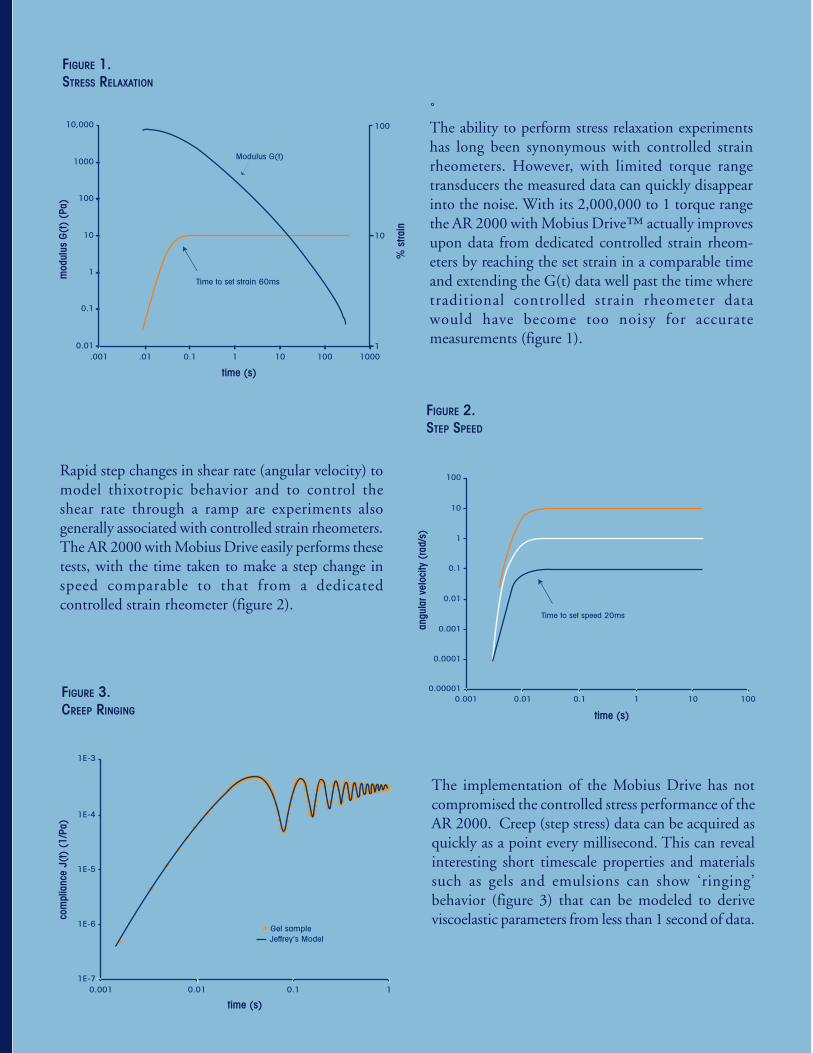
␣The ability to perform stress relaxation experimentshas long been synonymous with controlled strainrheometers. However, with limited torque rangetransducers the measured data can quickly disappearinto the noise. With its 2,000,000 to 1 torque rangethe AR 2000 with Mobius Drive™ actually improvesupon data from dedicated controlled strain rheom-eters by reaching the set strain in a comparable timeand extending the G(t) data well past the time wheretraditional controlled strain rheometer datawould have become too noisy for accuratemeasurements (figure 1).
Rapid step changes in shear rate (angular velocity) tomodel thixotropic behavior and to control theshear rate through a ramp are experiments alsogenerally associated with controlled strain rheometers.The AR 2000 with Mobius Drive easily performs thesetests, with the time taken to make a step change inspeed comparable to that from a dedicatedcontrolled strain rheometer (figure 2).
The implementation of the Mobius Drive has notcompromised the controlled stress performance of theAR 2000. Creep (step stress) data can be acquired asquickly as a point every millisecond. This can revealinteresting short timescale properties and materialssuch as gels and emulsions can show ‘ringing’behavior (figure 3) that can be modeled to deriveviscoelastic parameters from less than 1 second of data.
1E-4
1E-5
1E-6
1E-70.001
Gel sampleJeffrey's Model
0.01 0.1 1
1E-3
FIGURE 1.STRESS RELAXATION
FIGURE 2.STEP SPEED
FIGURE 3.CREEP RINGING
mod
ulus
G(t
) (P
a)
time (s)
% s
train
angu
lar v
eloc
ity (
rad/
s)
time (s)
com
plia
nce
J(t)
(1/
Pa)
time (s)
AR 2000 TEMPERATURE
CONTROL OPTIONS
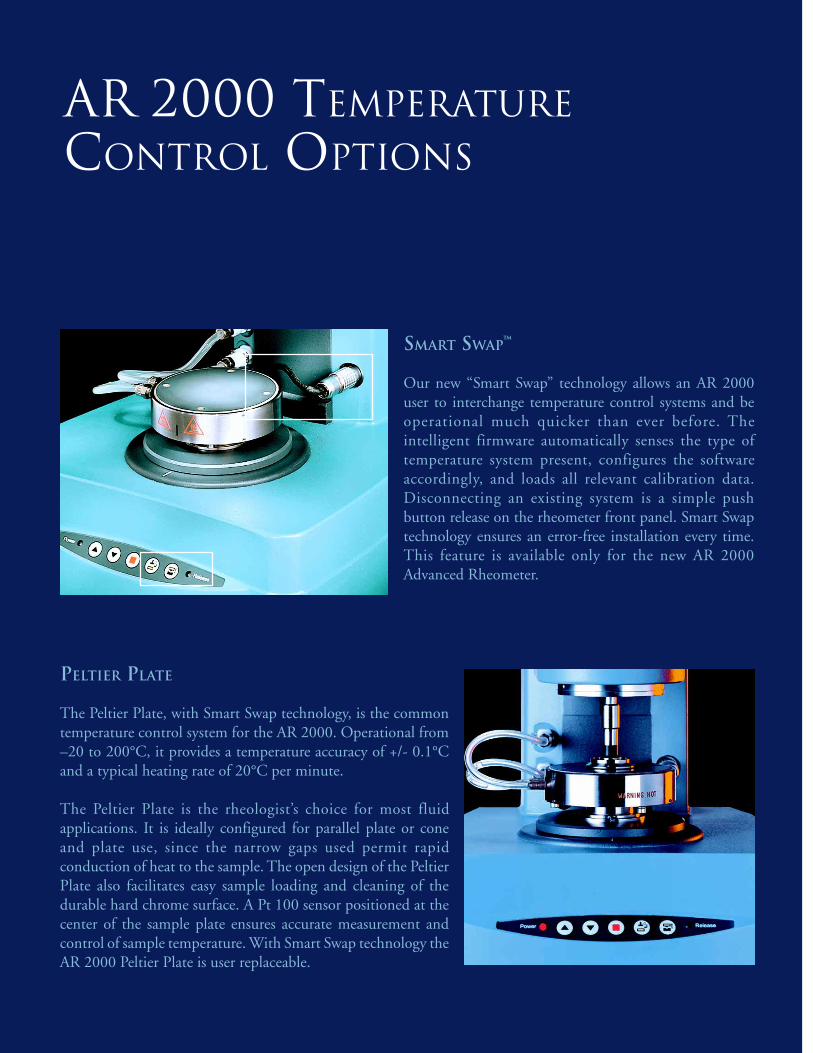
PELTIER PLATE
The Peltier Plate, with Smart Swap technology, is the commontemperature control system for the AR 2000. Operational from–20 to 200°C, it provides a temperature accuracy of +/- 0.1°Cand a typical heating rate of 20°C per minute.
The Peltier Plate is the rheologist’s choice for most fluidapplications. It is ideally configured for parallel plate or coneand plate use, since the narrow gaps used permit rapidconduction of heat to the sample. The open design of the PeltierPlate also facilitates easy sample loading and cleaning of thedurable hard chrome surface. A Pt 100 sensor positioned at thecenter of the sample plate ensures accurate measurement andcontrol of sample temperature. With Smart Swap technology theAR 2000 Peltier Plate is user replaceable.
SMART SWAP™
Our new “Smart Swap” technology allows an AR 2000user to interchange temperature control systems and beoperational much quicker than ever before. Theintelligent firmware automatically senses the type oftemperature system present, configures the softwareaccordingly, and loads all relevant calibration data.Disconnecting an existing system is a simple pushbutton release on the rheometer front panel. Smart Swaptechnology ensures an error-free installation every time.This feature is available only for the new AR 2000Advanced Rheometer.
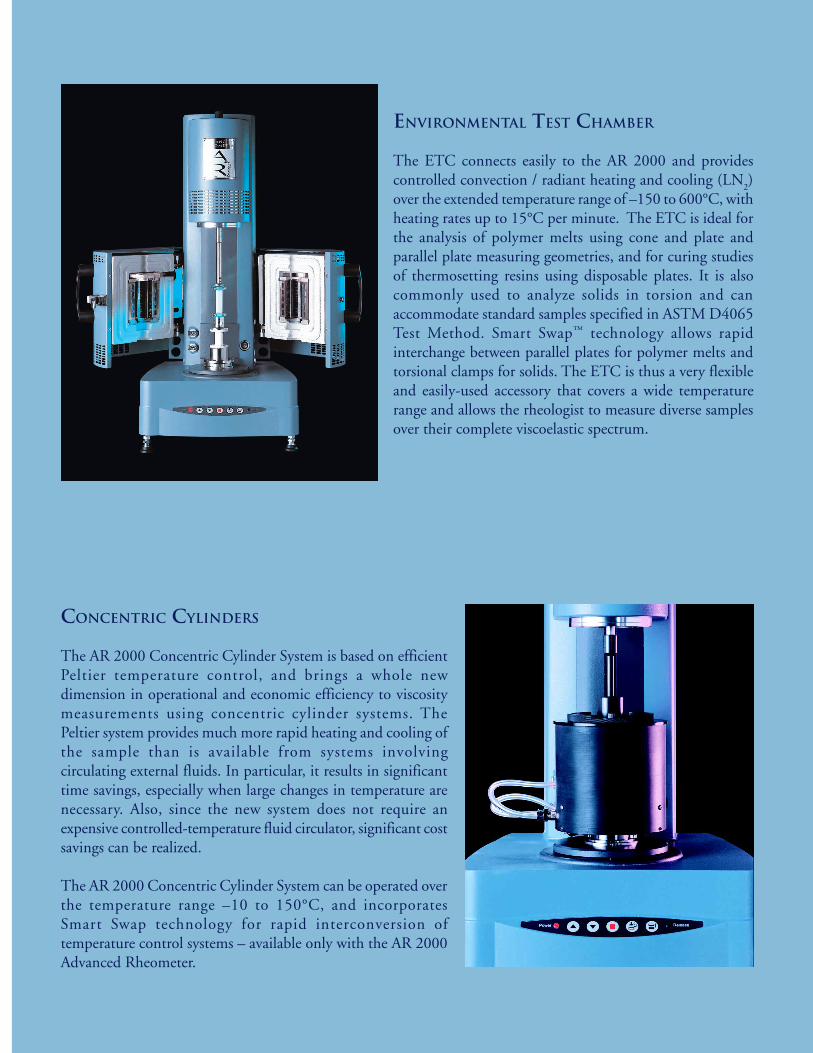
CONCENTRIC CYLINDERS
The AR 2000 Concentric Cylinder System is based on efficientPeltier temperature control, and brings a whole newdimension in operational and economic efficiency to viscositymeasurements using concentric cylinder systems. ThePeltier system provides much more rapid heating and cooling ofthe sample than is available from systems involvingcirculating external fluids. In particular, it results in significanttime savings, especially when large changes in temperature arenecessary. Also, since the new system does not require anexpensive controlled-temperature fluid circulator, significant costsavings can be realized.
The AR 2000 Concentric Cylinder System can be operated overthe temperature range –10 to 150°C, and incorporatesSmart Swap technology for rapid interconversion oftemperature control systems – available only with the AR 2000Advanced Rheometer.
ENVIRONMENTAL TEST CHAMBER
The ETC connects easily to the AR 2000 and providescontrolled convection / radiant heating and cooling (LN
2)
over the extended temperature range of –150 to 600°C, withheating rates up to 15°C per minute. The ETC is ideal forthe analysis of polymer melts using cone and plate andparallel plate measuring geometries, and for curing studiesof thermosetting resins using disposable plates. It is alsocommonly used to analyze solids in torsion and canaccommodate standard samples specified in ASTM D4065Test Method. Smart Swap™ technology allows rapidinterchange between parallel plates for polymer melts andtorsional clamps for solids. The ETC is thus a very flexibleand easily-used accessory that covers a wide temperaturerange and allows the rheologist to measure diverse samplesover their complete viscoelastic spectrum.
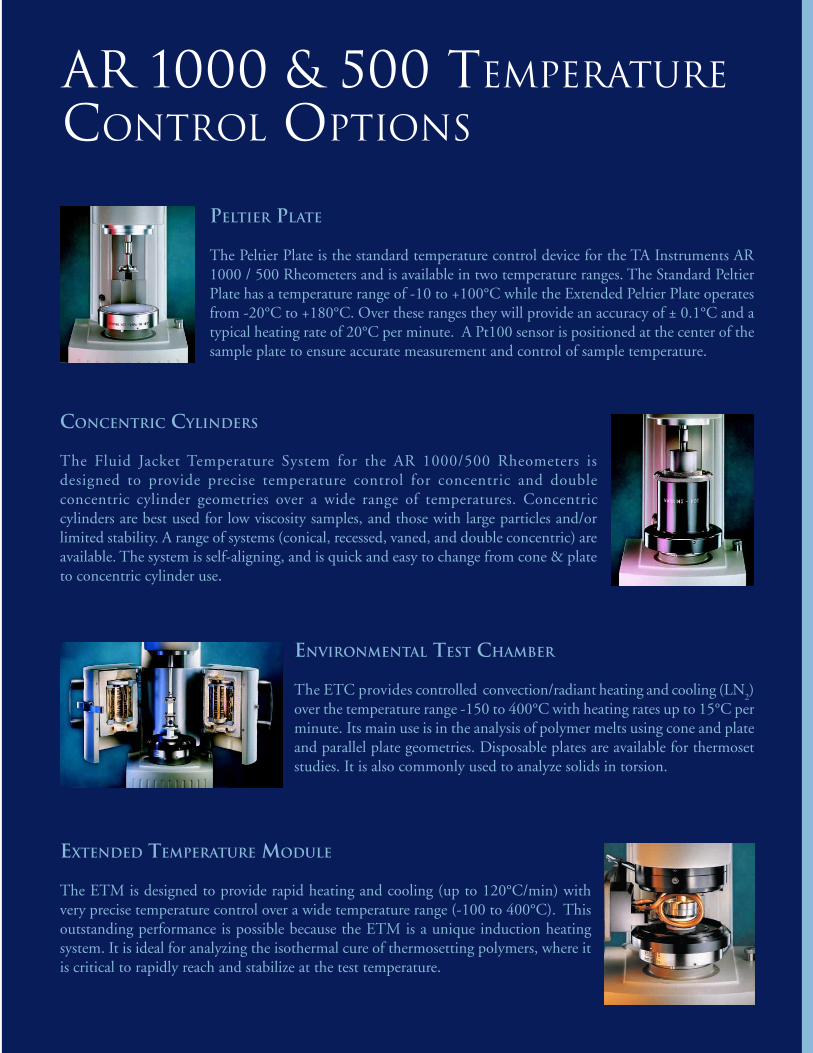
ENVIRONMENTAL TEST CHAMBER
The ETC provides controlled convection/radiant heating and cooling (LN2)
over the temperature range -150 to 400°C with heating rates up to 15°C perminute. Its main use is in the analysis of polymer melts using cone and plateand parallel plate geometries. Disposable plates are available for thermosetstudies. It is also commonly used to analyze solids in torsion.
PELTIER PLATE
The Peltier Plate is the standard temperature control device for the TA Instruments AR1000 / 500 Rheometers and is available in two temperature ranges. The Standard PeltierPlate has a temperature range of -10 to +100°C while the Extended Peltier Plate operatesfrom -20°C to +180°C. Over these ranges they will provide an accuracy of ± 0.1°C and atypical heating rate of 20°C per minute. A Pt100 sensor is positioned at the center of thesample plate to ensure accurate measurement and control of sample temperature.
CONCENTRIC CYLINDERS
The Fluid Jacket Temperature System for the AR 1000/500 Rheometers isdesigned to provide precise temperature control for concentric and doubleconcentric cylinder geometries over a wide range of temperatures. Concentriccylinders are best used for low viscosity samples, and those with large particles and/orlimited stability. A range of systems (conical, recessed, vaned, and double concentric) areavailable. The system is self-aligning, and is quick and easy to change from cone & plateto concentric cylinder use.
AR 1000 & 500 TEMPERATURE
CONTROL OPTIONS
EXTENDED TEMPERATURE MODULE
The ETM is designed to provide rapid heating and cooling (up to 120°C/min) withvery precise temperature control over a wide temperature range (-100 to 400°C). Thisoutstanding performance is possible because the ETM is a unique induction heatingsystem. It is ideal for analyzing the isothermal cure of thermosetting polymers, where itis critical to rapidly reach and stabilize at the test temperature.
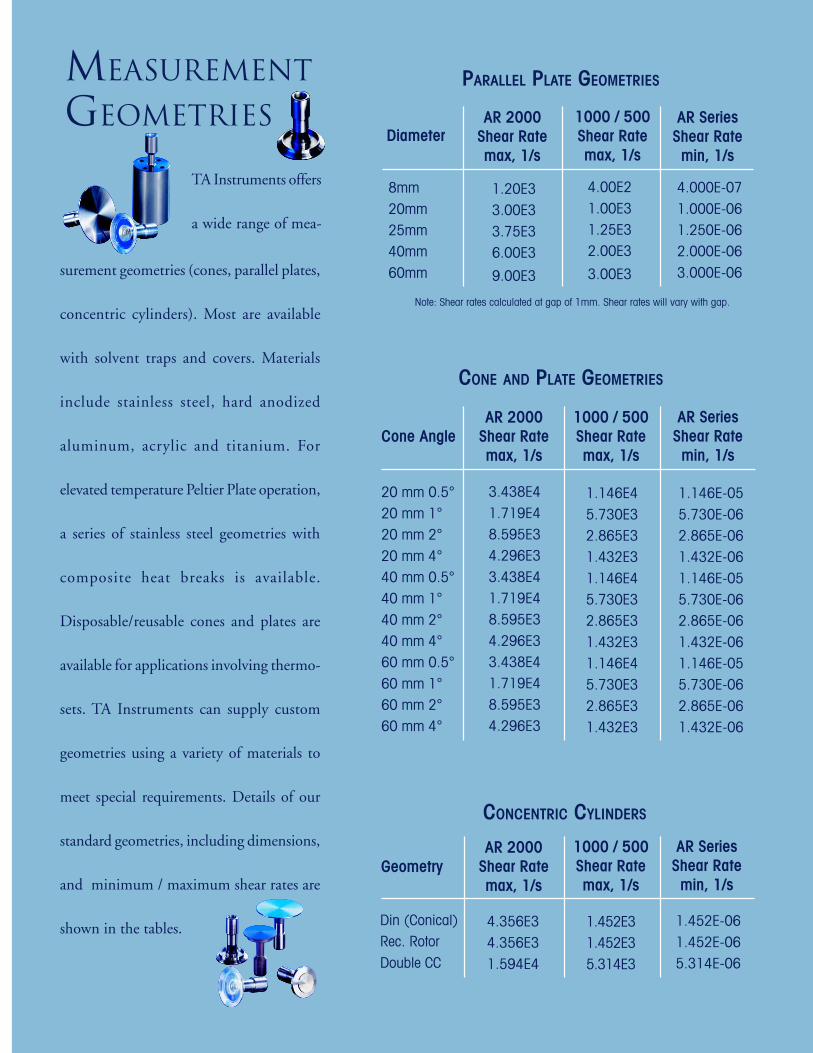
MEASUREMENT
GEOMETRIES
TA Instruments offers
a wide range of mea-
surement geometries (cones, parallel plates,
concentric cylinders). Most are available
with solvent traps and covers. Materials
include stainless steel, hard anodized
aluminum, acrylic and titanium. For
elevated temperature Peltier Plate operation,
a series of stainless steel geometries with
composite heat breaks is available.
Disposable/reusable cones and plates are
available for applications involving thermo-
sets. TA Instruments can supply custom
geometries using a variety of materials to
meet special requirements. Details of our
standard geometries, including dimensions,
and minimum / maximum shear rates are
shown in the tables.
Cone Angle
20 mm 0.5°20 mm 1°20 mm 2°20 mm 4°40 mm 0.5°40 mm 1°40 mm 2°40 mm 4°60 mm 0.5°60 mm 1°60 mm 2°60 mm 4°
AR SeriesShear Ratemin, 1/s
1.146E-055.730E-062.865E-061.432E-061.146E-055.730E-062.865E-061.432E-061.146E-055.730E-062.865E-061.432E-06
1000 / 500Shear Ratemax, 1/s
1.146E45.730E32.865E31.432E31.146E45.730E32.865E31.432E31.146E45.730E32.865E31.432E3
CONE AND PLATE GEOMETRIES
Geometry1000 / 500Shear Ratemax, 1/s
Din (Conical)Rec. RotorDouble CC
1.452E31.452E35.314E3
AR SeriesShear Ratemin, 1/s
1.452E-061.452E-065.314E-06
CONCENTRIC CYLINDERS
Diameter
8mm20mm25mm40mm60mm
AR SeriesShear Ratemin, 1/s
4.000E-071.000E-061.250E-062.000E-063.000E-06
1000 / 500Shear Ratemax, 1/s
4.00E21.00E31.25E32.00E3
3.00E3
PARALLEL PLATE GEOMETRIES
Note: Shear rates calculated at gap of 1mm. Shear rates will vary with gap.
AR 2000Shear Ratemax, 1/s
1.20E33.00E33.75E36.00E3
9.00E3
AR 2000Shear Ratemax, 1/s
3.438E41.719E48.595E34.296E33.438E41.719E48.595E34.296E33.438E41.719E48.595E34.296E3
AR 2000Shear Ratemax, 1/s
4.356E34.356E31.594E4
Polymers - Thermoplastics
Polymers - Thermosets
Polymers - Elastomers
Adhesives
Coatings - Paints
Coatings - Inks
Coatings - Powders
Foods - Pastes, Gels,Dispersions(Suspensions, Emulsion)
Pharmaceuticals & PersonalCare products - Pastes, GelsDispersions (Suspensions,Emulsions)
Ceramics - Slurries
Oils, Greases, Lubricants
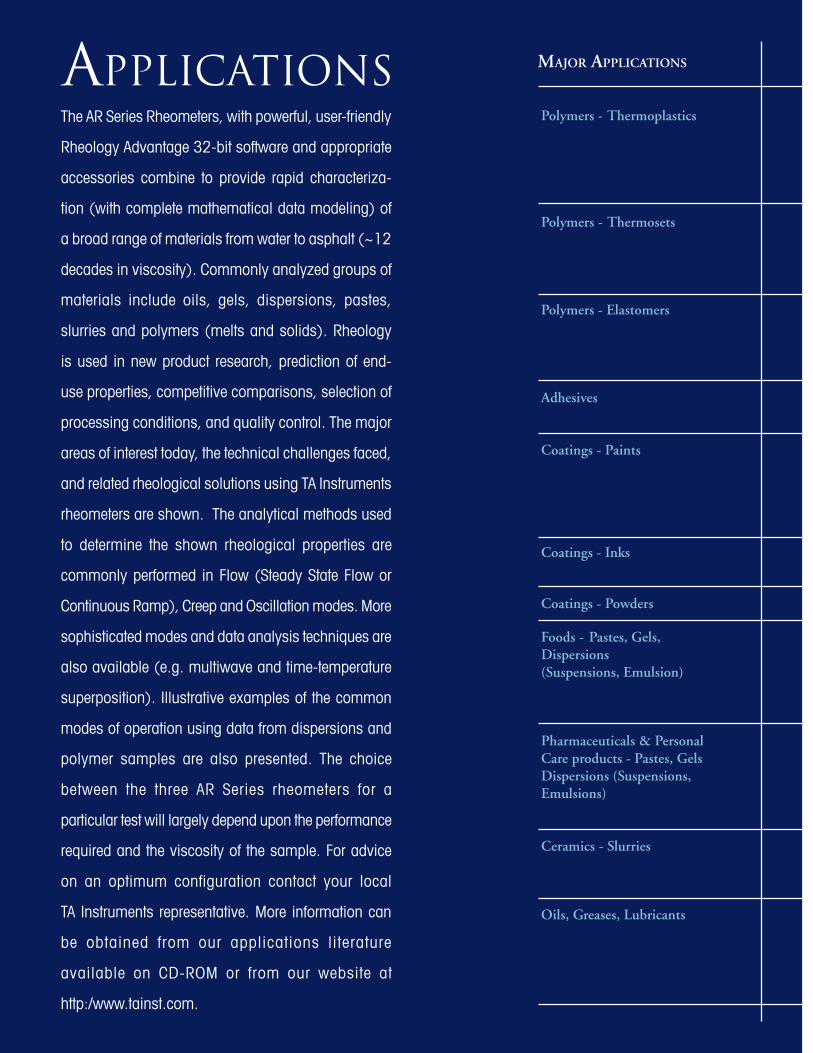
APPLICATIONS MAJOR APPLICATIONS
The AR Series Rheometers, with powerful, user-friendly
Rheology Advantage 32-bit software and appropriate
accessories combine to provide rapid characteriza-
tion (with complete mathematical data modeling) of
a broad range of materials from water to asphalt (~12
decades in viscosity). Commonly analyzed groups of
materials include oils, gels, dispersions, pastes,
slurries and polymers (melts and solids). Rheology
is used in new product research, prediction of end-
use properties, competitive comparisons, selection of
processing conditions, and quality control. The major
areas of interest today, the technical challenges faced,
and related rheological solutions using TA Instruments
rheometers are shown. The analytical methods used
to determine the shown rheological properties are
commonly performed in Flow (Steady State Flow or
Continuous Ramp), Creep and Oscillation modes. More
sophisticated modes and data analysis techniques are
also available (e.g. multiwave and time-temperature
superposition). Illustrative examples of the common
modes of operation using data from dispersions and
polymer samples are also presented. The choice
between the three AR Series rheometers for a
particular test will largely depend upon the performance
required and the viscosity of the sample. For advice
on an optimum configuration contact your local
TA Instruments representative. More information can
be obtained from our applications literature
available on CD-ROM or from our website at
http:/www.tainst.com.
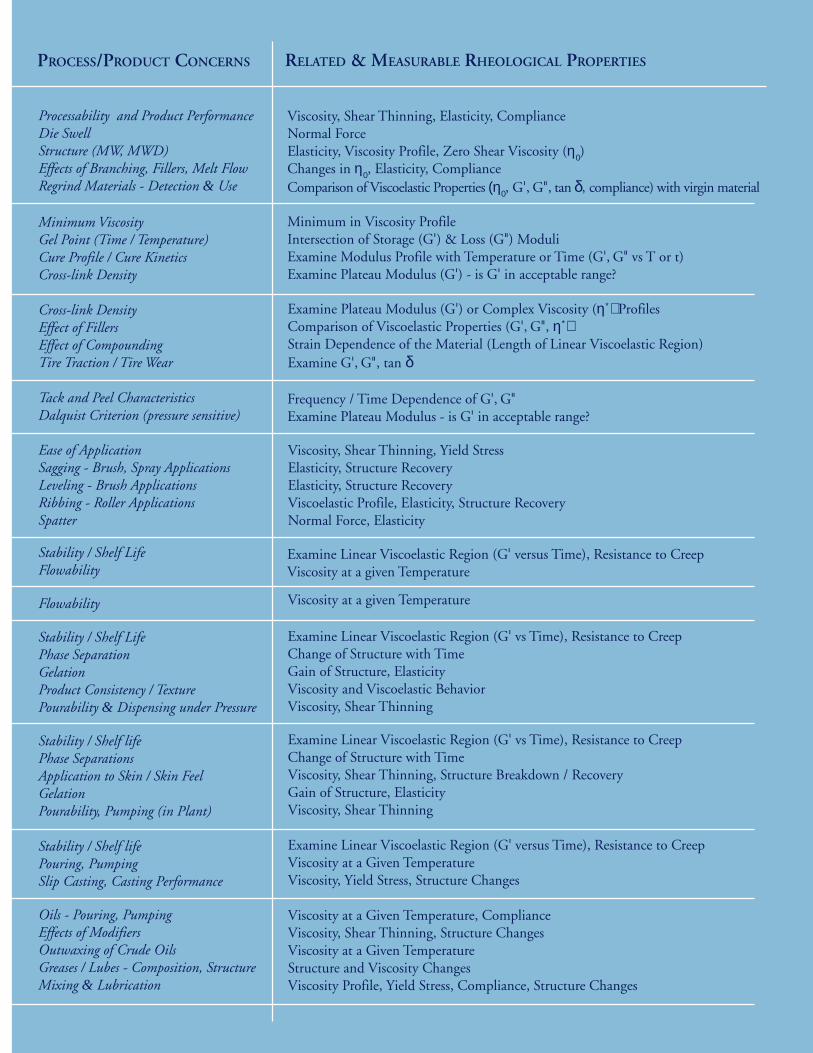
Processability and Product PerformanceDie SwellStructure (MW, MWD)Effects of Branching, Fillers, Melt FlowRegrind Materials - Detection & Use
Minimum ViscosityGel Point (Time / Temperature)Cure Profile / Cure KineticsCross-link Density
Cross-link DensityEffect of FillersEffect of CompoundingTire Traction / Tire Wear
Tack and Peel CharacteristicsDalquist Criterion (pressure sensitive)
Ease of ApplicationSagging - Brush, Spray ApplicationsLeveling - Brush ApplicationsRibbing - Roller ApplicationsSpatter
Stability / Shelf LifeFlowability
Flowability
Stability / Shelf LifePhase SeparationGelationProduct Consistency / TexturePourability & Dispensing under Pressure
Stability / Shelf lifePhase SeparationsApplication to Skin / Skin FeelGelationPourability, Pumping (in Plant)
Stability / Shelf lifePouring, PumpingSlip Casting, Casting Performance
Oils - Pouring, PumpingEffects of ModifiersOutwaxing of Crude OilsGreases / Lubes - Composition, StructureMixing & Lubrication
Viscosity, Shear Thinning, Elasticity, ComplianceNormal ForceElasticity, Viscosity Profile, Zero Shear Viscosity (η0)Changes in η0, Elasticity, ComplianceComparison of Viscoelastic Properties (η0, G', G", tan δ, compliance) with virgin material
Minimum in Viscosity ProfileIntersection of Storage (G') & Loss (G") ModuliExamine Modulus Profile with Temperature or Time (G', G" vs T or t)Examine Plateau Modulus (G') - is G' in acceptable range?
Examine Plateau Modulus (G') or Complex Viscosity (η∗) ProfilesComparison of Viscoelastic Properties (G', G", η∗)Strain Dependence of the Material (Length of Linear Viscoelastic Region)Examine G', G", tan δ
Frequency / Time Dependence of G', G"Examine Plateau Modulus - is G' in acceptable range?
Viscosity, Shear Thinning, Yield StressElasticity, Structure RecoveryElasticity, Structure RecoveryViscoelastic Profile, Elasticity, Structure RecoveryNormal Force, Elasticity
Examine Linear Viscoelastic Region (G' versus Time), Resistance to CreepViscosity at a given Temperature
Viscosity at a given Temperature
Examine Linear Viscoelastic Region (G' vs Time), Resistance to CreepChange of Structure with TimeGain of Structure, ElasticityViscosity and Viscoelastic BehaviorViscosity, Shear Thinning
Examine Linear Viscoelastic Region (G' vs Time), Resistance to CreepChange of Structure with TimeViscosity, Shear Thinning, Structure Breakdown / RecoveryGain of Structure, ElasticityViscosity, Shear Thinning
Examine Linear Viscoelastic Region (G' versus Time), Resistance to CreepViscosity at a Given TemperatureViscosity, Yield Stress, Structure Changes
Viscosity at a Given Temperature, ComplianceViscosity, Shear Thinning, Structure ChangesViscosity at a Given TemperatureStructure and Viscosity ChangesViscosity Profile, Yield Stress, Compliance, Structure Changes
RELATED & MEASURABLE RHEOLOGICAL PROPERTIESPROCESS/PRODUCT CONCERNS
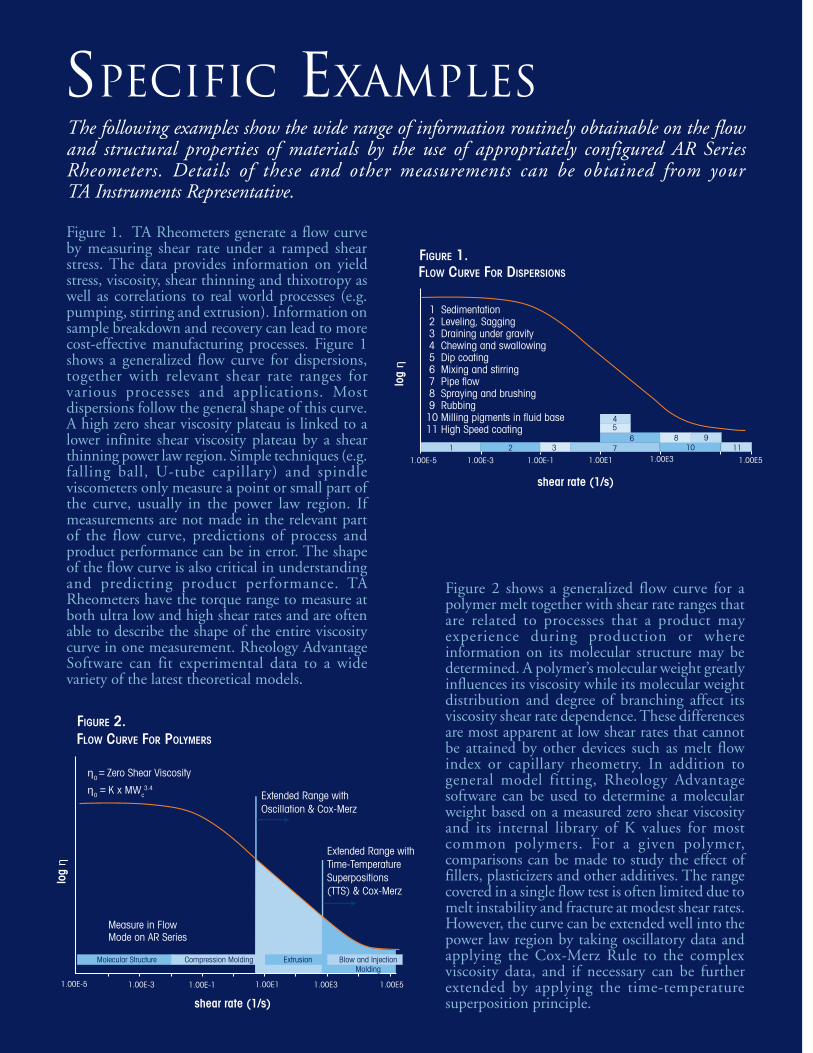
SPECIFIC EXAMPLESThe following examples show the wide range of information routinely obtainable on the flowand structural properties of materials by the use of appropriately configured AR SeriesRheometers. Details of these and other measurements can be obtained from yourTA Instruments Representative.
FLOW CURVE FOR DISPERSIONS
FIGURE 1.
Figure 1. TA Rheometers generate a flow curveby measuring shear rate under a ramped shearstress. The data provides information on yieldstress, viscosity, shear thinning and thixotropy aswell as correlations to real world processes (e.g.pumping, stirring and extrusion). Information onsample breakdown and recovery can lead to morecost-effective manufacturing processes. Figure 1shows a generalized flow curve for dispersions,together with relevant shear rate ranges forvarious processes and applications. Mostdispersions follow the general shape of this curve.A high zero shear viscosity plateau is linked to alower infinite shear viscosity plateau by a shearthinning power law region. Simple techniques (e.g.falling ball, U-tube capillary) and spindleviscometers only measure a point or small part ofthe curve, usually in the power law region. Ifmeasurements are not made in the relevant partof the flow curve, predictions of process andproduct performance can be in error. The shapeof the flow curve is also critical in understandingand predicting product performance. TARheometers have the torque range to measure atboth ultra low and high shear rates and are oftenable to describe the shape of the entire viscositycurve in one measurement. Rheology AdvantageSoftware can fit experimental data to a widevariety of the latest theoretical models.
shear rate (1/s)
η0 = Zero Shear Viscosity
η0 = K x MWc3.4
Extended Range withTime-TemperatureSuperpositions(TTS) & Cox-Merz
Measure in FlowMode on AR Series
Extended Range withOscillation & Cox-Merz
Molecular Structure Compression Molding Extrusion Blow and InjectionMolding
1.00E-5 1.00E-3 1.00E-1 1.00E1 1.00E3 1.00E5
log
η
log
η
shear rate (1/s)
1 Sedimentation 2 Leveling, Sagging 3 Draining under gravity 4 Chewing and swallowing 5 Dip coating 6 Mixing and stirring 7 Pipe flow 8 Spraying and brushing 9 Rubbing10 Milling pigments in fluid base11 High Speed coating
2 3
4
1.00E1
56
7
1.00E-5
8 910 111
1.00E-1 1.00E31.00E-3
FLOW CURVE FOR POLYMERS
FIGURE 2.
Figure 2 shows a generalized flow curve for apolymer melt together with shear rate ranges thatare related to processes that a product mayexperience during production or whereinformation on its molecular structure may bedetermined. A polymer’s molecular weight greatlyinfluences its viscosity while its molecular weightdistribution and degree of branching affect itsviscosity shear rate dependence. These differencesare most apparent at low shear rates that cannotbe attained by other devices such as melt flowindex or capillary rheometry. In addition togeneral model fitting, Rheology Advantagesoftware can be used to determine a molecularweight based on a measured zero shear viscosityand its internal library of K values for mostcommon polymers. For a given polymer,comparisons can be made to study the effect offillers, plasticizers and other additives. The rangecovered in a single flow test is often limited due tomelt instability and fracture at modest shear rates.However, the curve can be extended well into thepower law region by taking oscillatory data andapplying the Cox-Merz Rule to the complexviscosity data, and if necessary can be furtherextended by applying the time-temperaturesuperposition principle.
1.00E5
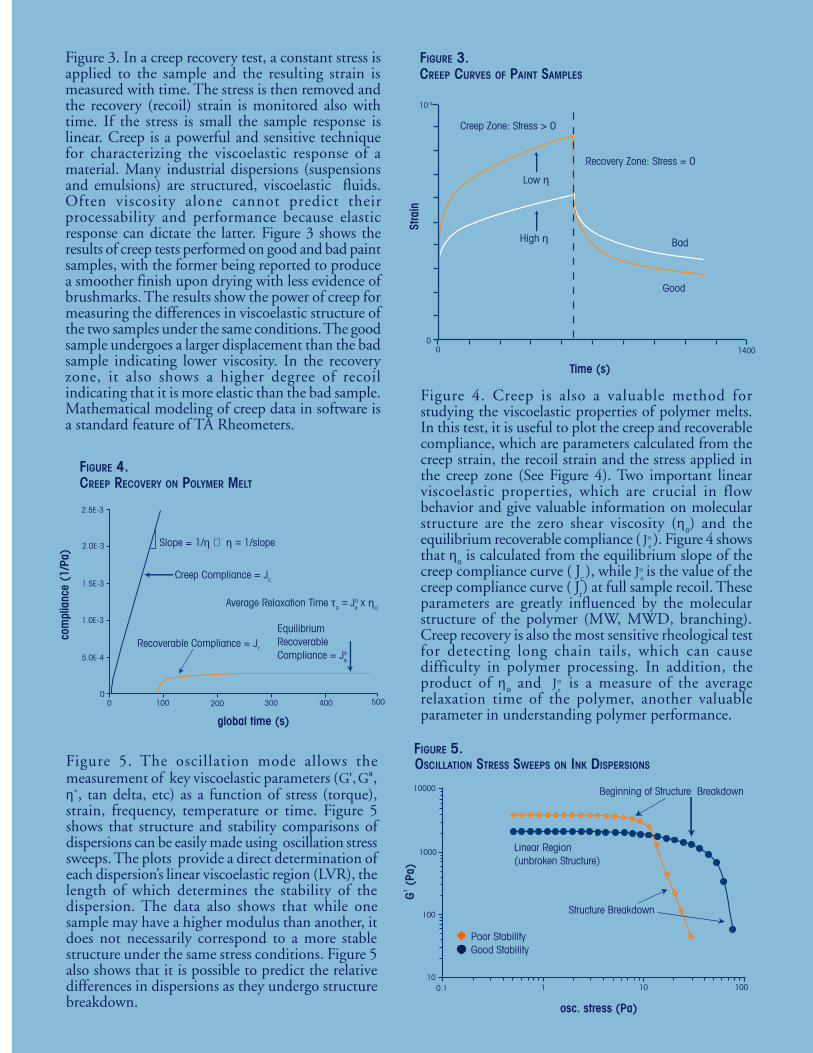
CREEP CURVES OF PAINT SAMPLES
Stra
in
Time (s)
Good
Bad
10-3
00 1400
FIGURE 3.
Creep Zone: Stress > 0
Recovery Zone: Stress = 0
Low η
High η
Figure 4. Creep is also a valuable method forstudying the viscoelastic properties of polymer melts.In this test, it is useful to plot the creep and recoverablecompliance, which are parameters calculated from thecreep strain, the recoil strain and the stress applied inthe creep zone (See Figure 4). Two important linearviscoelastic properties, which are crucial in flowbehavior and give valuable information on molecularstructure are the zero shear viscosity (ηο) and theequilibrium recoverable compliance ( Jo
e ). Figure 4 shows
that ηο is calculated from the equilibrium slope of thecreep compliance curve ( J
c ), while Jo
e is the value of the
creep compliance curve ( Jr ) at full sample recoil. These
parameters are greatly influenced by the molecularstructure of the polymer (MW, MWD, branching).Creep recovery is also the most sensitive rheological testfor detecting long chain tails, which can causedifficulty in polymer processing. In addition, theproduct of ηο and Jo
e is a measure of the average
relaxation time of the polymer, another valuableparameter in understanding polymer performance.
com
plia
nce
(1/P
a)
2.5E-3
2.0E-3
1.5E-3
1.0E-3
5.0E-4
00 100 200 300 400 500
global time (s)
Recoverable Compliance = Jr
Creep Compliance = Jc
EquilibriumRecoverableCompliance = Jo
e
Average Relaxation Time τo = Joe x ηo
Slope = 1/η ⇒ η = 1/slope
CREEP RECOVERY ON POLYMER MELT
FIGURE 4.
Figure 3. In a creep recovery test, a constant stress isapplied to the sample and the resulting strain ismeasured with time. The stress is then removed andthe recovery (recoil) strain is monitored also withtime. If the stress is small the sample response islinear. Creep is a powerful and sensitive techniquefor characterizing the viscoelastic response of amaterial. Many industrial dispersions (suspensionsand emulsions) are structured, viscoelastic fluids.Often viscosity alone cannot predict theirprocessability and performance because elasticresponse can dictate the latter. Figure 3 shows theresults of creep tests performed on good and bad paintsamples, with the former being reported to producea smoother finish upon drying with less evidence ofbrushmarks. The results show the power of creep formeasuring the differences in viscoelastic structure ofthe two samples under the same conditions. The goodsample undergoes a larger displacement than the badsample indicating lower viscosity. In the recoveryzone, it also shows a higher degree of recoilindicating that it is more elastic than the bad sample.Mathematical modeling of creep data in software isa standard feature of TA Rheometers.
Figure 5. The oscillation mode allows themeasurement of key viscoelastic parameters (G', G",η∗, tan delta, etc) as a function of stress (torque),strain, frequency, temperature or time. Figure 5shows that structure and stability comparisons ofdispersions can be easily made using oscillation stresssweeps. The plots provide a direct determination ofeach dispersion’s linear viscoelastic region (LVR), thelength of which determines the stability of thedispersion. The data also shows that while onesample may have a higher modulus than another, itdoes not necessarily correspond to a more stablestructure under the same stress conditions. Figure 5also shows that it is possible to predict the relativedifferences in dispersions as they undergo structurebreakdown.
10000
1000
100
100.1 1 10 100
Beginning of Structure Breakdown
Linear Region(unbroken Structure)
Structure Breakdown
G' (
Pa)
osc. stress (Pa)
OSCILLATION STRESS SWEEPS ON INK DISPERSIONS
Poor StabilityGood Stability
FIGURE 5.
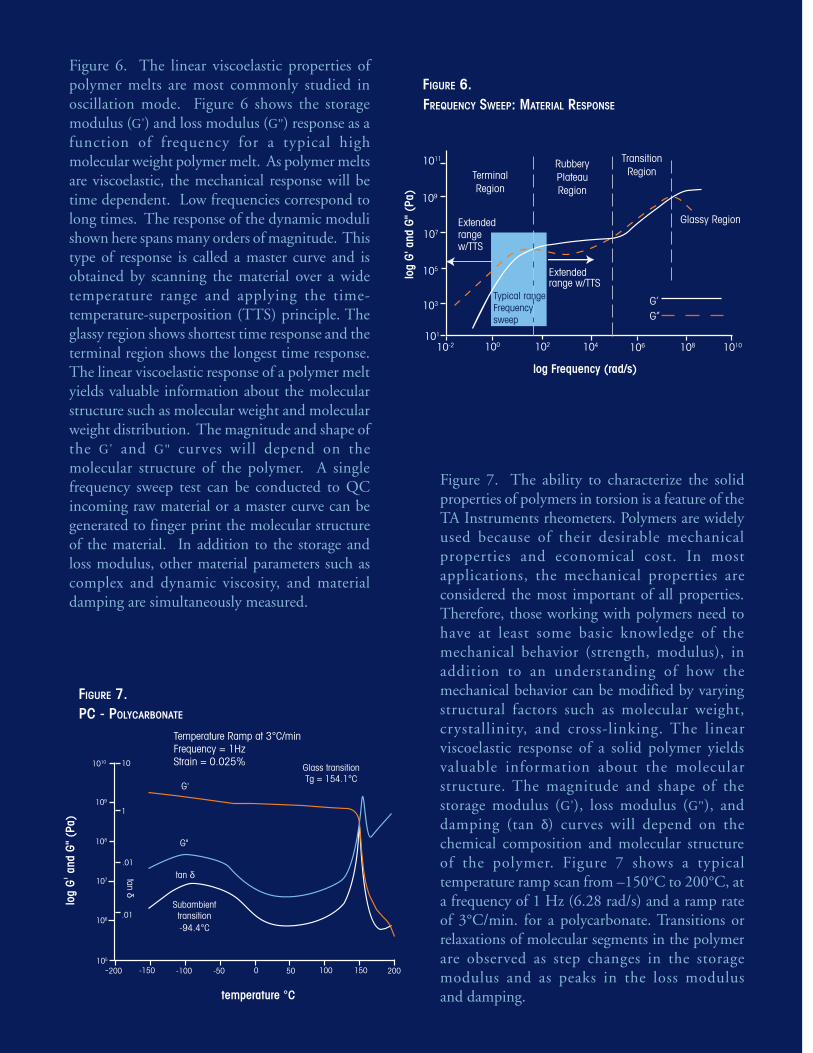
Figure 6. The linear viscoelastic properties ofpolymer melts are most commonly studied inoscillation mode. Figure 6 shows the storagemodulus (G') and loss modulus (G") response as afunction of frequency for a typical highmolecular weight polymer melt. As polymer meltsare viscoelastic, the mechanical response will betime dependent. Low frequencies correspond tolong times. The response of the dynamic modulishown here spans many orders of magnitude. Thistype of response is called a master curve and isobtained by scanning the material over a widetemperature range and applying the time-temperature-superposition (TTS) principle. Theglassy region shows shortest time response and theterminal region shows the longest time response.The linear viscoelastic response of a polymer meltyields valuable information about the molecularstructure such as molecular weight and molecularweight distribution. The magnitude and shape ofthe G' and G" curves will depend on themolecular structure of the polymer. A singlefrequency sweep test can be conducted to QCincoming raw material or a master curve can begenerated to finger print the molecular structureof the material. In addition to the storage andloss modulus, other material parameters such ascomplex and dynamic viscosity, and materialdamping are simultaneously measured.
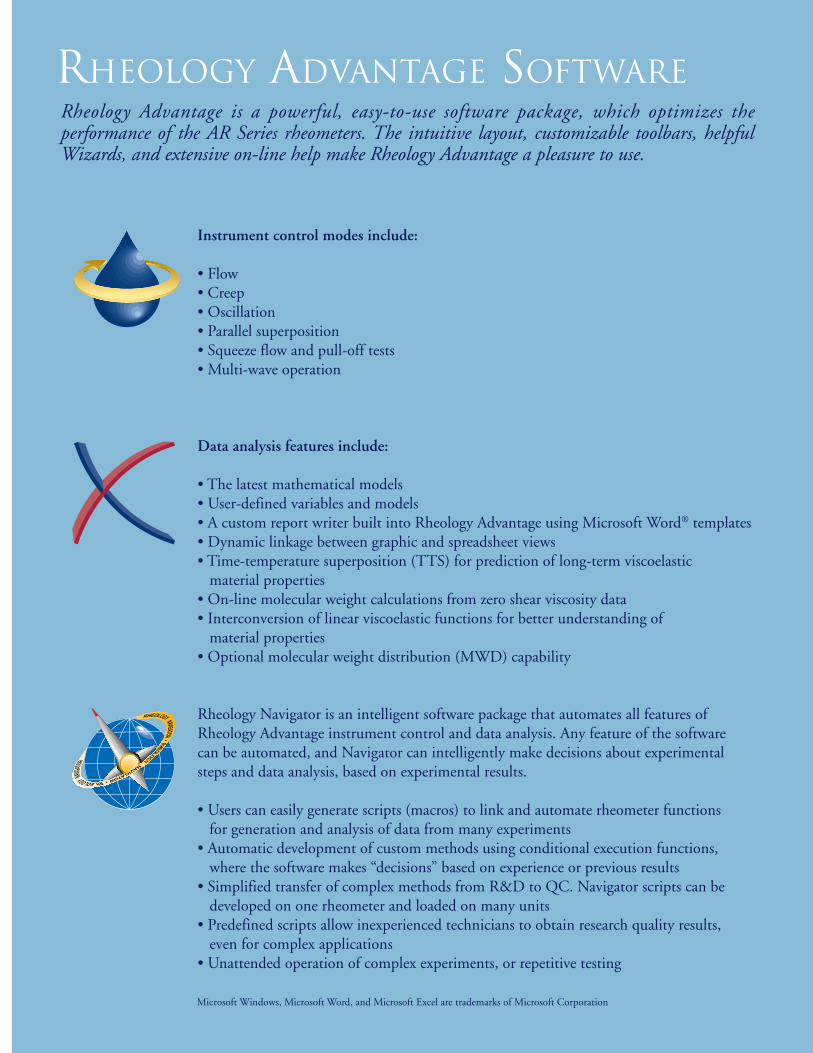
Figure 7. The ability to characterize the solidproperties of polymers in torsion is a feature of theTA Instruments rheometers. Polymers are widelyused because of their desirable mechanicalproperties and economical cost. In mostapplications, the mechanical properties areconsidered the most important of all properties.Therefore, those working with polymers need tohave at least some basic knowledge of themechanical behavior (strength, modulus), inaddition to an understanding of how themechanical behavior can be modified by varyingstructural factors such as molecular weight,crystallinity, and cross-linking. The linearviscoelastic response of a solid polymer yieldsvaluable information about the molecularstructure. The magnitude and shape of thestorage modulus (G'), loss modulus (G"), anddamping (tan δ) curves will depend on thechemical composition and molecular structureof the polymer. Figure 7 shows a typicaltemperature ramp scan from –150°C to 200°C, ata frequency of 1 Hz (6.28 rad/s) and a ramp rateof 3°C/min. for a polycarbonate. Transitions orrelaxations of molecular segments in the polymerare observed as step changes in the storagemodulus and as peaks in the loss modulusand damping.
log Frequency (rad/s)
Glassy Region
log
G' a
nd G
" (P
a)
TerminalRegion
RubberyPlateauRegion
TransitionRegion
Extendedrange w/TTS
Extendedrangew/TTS
FREQUENCY SWEEP: MATERIAL RESPONSE
G’G’’
FIGURE 6.
109
107
105
103
10-2 100 102 104 106 108 1010
Typical rangeFrequencysweep
1010
109
108
107
106
105
10
1
.01
.01
-200 -150 -100 -50 0 50 100 150 200
log
G' a
nd G
" (P
a)
temperature °C
tan δ
Glass transitionTg = 154.1°C
Temperature Ramp at 3°C/minFrequency = 1HzStrain = 0.025%
G"
G'
Subambienttransition-94.4°C
tan δ
FIGURE 7.PC - POLYCARBONATE
101
1011
Instrument control modes include:
• Flow• Creep• Oscillation• Parallel superposition• Squeeze flow and pull-off tests• Multi-wave operation
Data analysis features include:
• The latest mathematical models• User-defined variables and models• A custom report writer built into Rheology Advantage using Microsoft Word® templates• Dynamic linkage between graphic and spreadsheet views• Time-temperature superposition (TTS) for prediction of long-term viscoelastic
material properties• On-line molecular weight calculations from zero shear viscosity data• Interconversion of linear viscoelastic functions for better understanding of
material properties• Optional molecular weight distribution (MWD) capability
Rheology Navigator is an intelligent software package that automates all features ofRheology Advantage instrument control and data analysis. Any feature of the softwarecan be automated, and Navigator can intelligently make decisions about experimentalsteps and data analysis, based on experimental results.
• Users can easily generate scripts (macros) to link and automate rheometer functionsfor generation and analysis of data from many experiments
• Automatic development of custom methods using conditional execution functions,where the software makes “decisions” based on experience or previous results
• Simplified transfer of complex methods from R&D to QC. Navigator scripts can bedeveloped on one rheometer and loaded on many units
• Predefined scripts allow inexperienced technicians to obtain research quality results,even for complex applications
• Unattended operation of complex experiments, or repetitive testing
RHEOLOGY NAVIGATOR•RHEOLOGY
NAVIGATOR•RHEOLOGYNAVIGA
TORRHEOLOGY ADVANTAGE SOFTWARERheology Advantage is a powerful, easy-to-use software package, which optimizes theperformance of the AR Series rheometers. The intuitive layout, customizable toolbars, helpfulWizards, and extensive on-line help make Rheology Advantage a pleasure to use.
Microsoft Windows, Microsoft Word, and Microsoft Excel are trademarks of Microsoft Corporation
TO CONTACT YOUR LOCAL TA INSTRUMENTS
TECHNICAL REPRESENTATIVE VISIT OUR WEBSITE
AT WWW.TAINST.COM
•NEW CASTLE, DE USA - TELEPHONE: 1-302-427-4000
•PARIS, FRANCE - TELEPHONE: 33-1-30-48-94-60
•BRUSSELS, BELGIUM - TELEPHONE: 32-2-706-0080
•LEATHERHEAD, ENGLAND - TELEPHONE: 44-1372-360363
•ETTEN-LEUR, NETHERLANDS - TELEPHONE: 31-76-508-7270
•ALZENAU, GERMANY - TELEPHONE: 49-6023-96470
•MILANO, ITALY - TELEPHONE: 39-02-27421-283
•TOKYO, JAPAN - TELEPHONE: 81-3-5479-8418
•BARCELONA, SPAIN - TELEPHONE: 34-93-600-9300
•MELBOURNE, AUSTRALIA - TELEPHONE: 61-3-9553-0813
•STOCKHOLM, SWEDEN - TELEPHONE: 46-8-59-46-92-00
Rh075B