Embed Size (px)
Citation preview
Introduction to Life Cycle Cost Analysis for IMS Stations (Presentation to 5th O&M Workshop 2015)
Daniel Foster Logistics Technician [email protected] Logistics Support Unit (LSU) Monitoring Facilities Support (MFS) Section International Monitoring System (IMS) Division Preparatory Commission for the Comprehensive Nuclear-Test-Ban Treaty Organization With a reply from:
John Sharp TFD Group President [email protected]
T5-O16
Introduction
OPM-5 Presentation T5-O16 Page 3 IMS/MFS/LS
Life Cycle Costs (LCC) Analysis is one of several components
of the Integrated Logistics Support (ILS) system for the
International Monitoring System (IMS).
The ILS system is intended to ensure sustainment of certified
IMS facilities at optimal cost (protecting the investment already
made).
Ref.: PTS Information Paper 1163 (Integrated Logistics Support For The International Monitoring System)
Sustainment of the IMS network presents a formidable
challenge:
• Size of network, many environments – 337 facilities in 89 states
• Very high Data Availability (DA) requirements – Equivalent to only a few days downtime per year at each station
What Are Life Cycle Costs?
Life Cycle Cost refers to all costs over the life of a piece of
equipment or a system, from initial design, through its
operational life and ultimate disposal (i.e. the total cost of
ownership ‘from cradle to grave’).
Applies to equipment, systems, technologies...
and IMS stations (including infrastructure).
OPM-5 Presentation T5-O16 Page 4 IMS/MFS/LS
Life Cycle
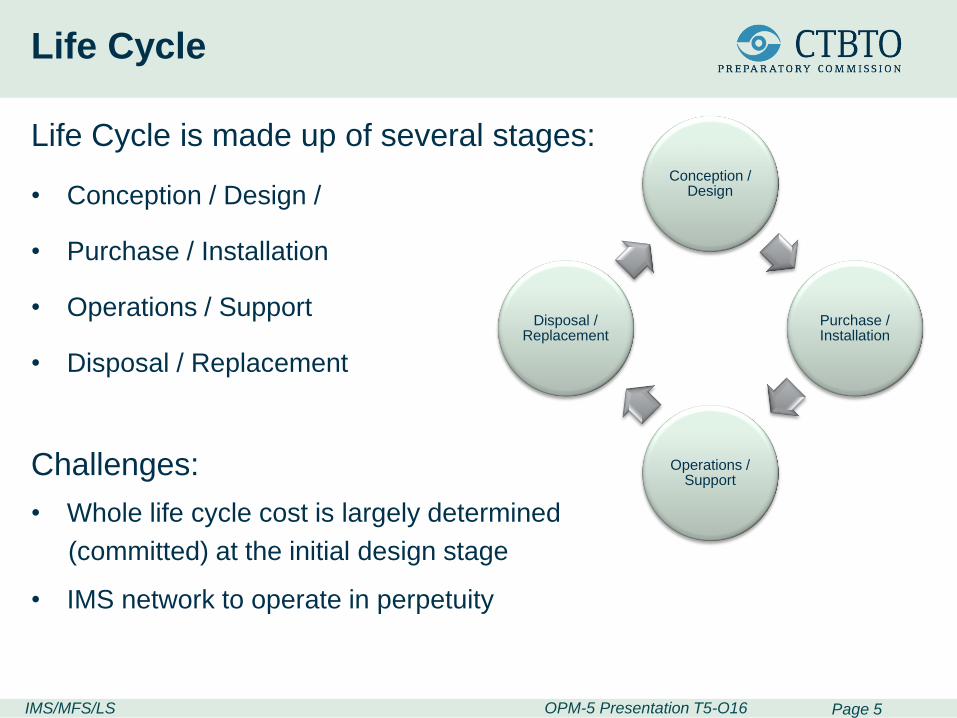
Life Cycle is made up of several stages:
• Conception / Design /
• Purchase / Installation
• Operations / Support
• Disposal / Replacement
Challenges:
• Whole life cycle cost is largely determined
(committed) at the initial design stage
• IMS network to operate in perpetuity
IMS/MFS/LS Page 5 OPM-5 Presentation T5-O16
Conception / Design
Purchase / Installation
Operations / Support
Disposal / Replacement
Examples of Life Cycle Expenditure
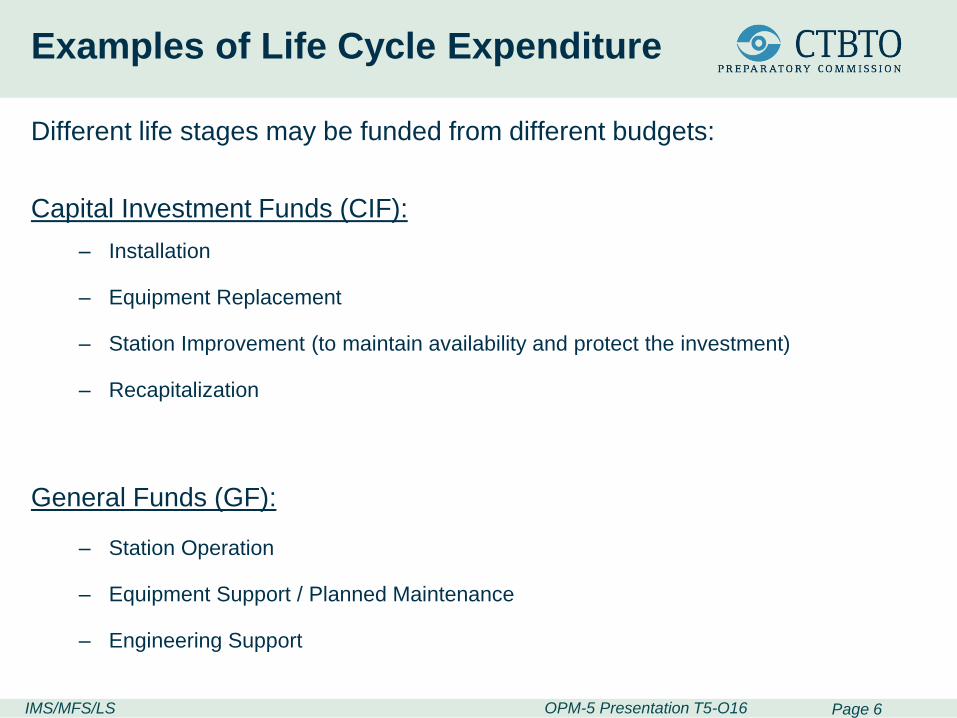
Different life stages may be funded from different budgets:
Capital Investment Funds (CIF):
– Installation
– Equipment Replacement
– Station Improvement (to maintain availability and protect the investment)
– Recapitalization
General Funds (GF):
– Station Operation
– Equipment Support / Planned Maintenance
– Engineering Support
IMS/MFS/LS Page 6 OPM-5 Presentation T5-O16
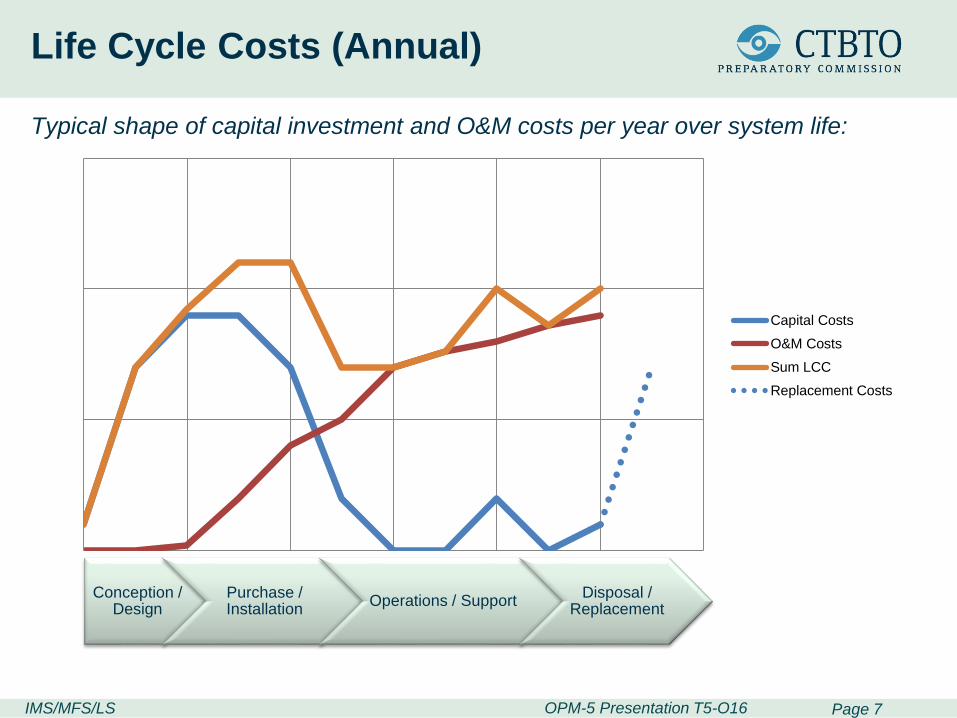
Life Cycle Costs (Annual)
Typical shape of capital investment and O&M costs per year over system life:
IMS/MFS/LS
Conception / Design
Purchase / Installation
Operations / Support Disposal /
Replacement
Page 7 OPM-5 Presentation T5-O16
Capital Costs
O&M Costs
Sum LCC
Replacement Costs
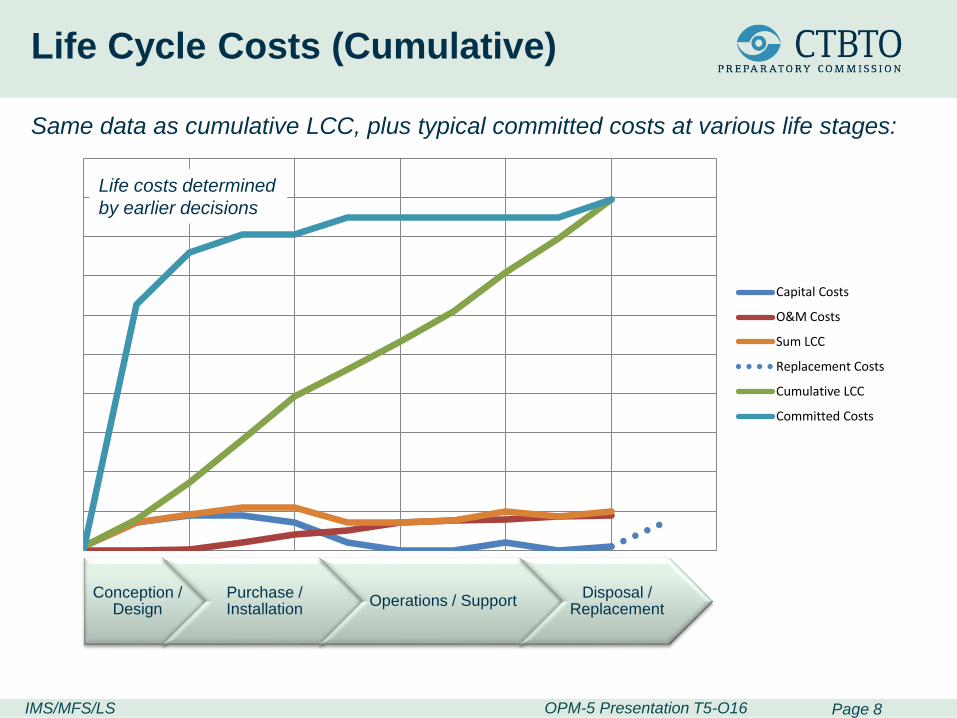
Life Cycle Costs (Cumulative)
Same data as cumulative LCC, plus typical committed costs at various life stages:
IMS/MFS/LS Page 8 OPM-5 Presentation T5-O16
Capital Costs
O&M Costs
Sum LCC
Replacement Costs
Cumulative LCC
Committed Costs
Conception / Design
Purchase / Installation
Operations / Support Disposal /
Replacement
Life costs determined
by earlier decisions
Benefits of LCC Analysis
Identifying the whole life cost of a system enables:
• Informed calculation of budget and resources required to support
financial planning
• Optimization of use of resources
(e.g. budget, manpower, etc.)
• Comparison of alternative solutions
(e.g. cost/benefit of choosing particular parts or particular maintenance policies)
• Documented justification for support decisions
In short, LCC Analysis supports the sustainment of certified IMS facilities at
optimal cost (protecting the investment already made).
IMS/MFS/LS Page 9 OPM-5 Presentation T5-O16
Introducing MAAP®
Life Cycle Costs and recapitalization forecasts are currently estimated
using arithmetic with assumptions and experience.
We are now preparing to introduce additional methods to analyse Life
Cycle Costs Analysis, using a combination of specialized commercial
software and other data analysis and modelling tools and techniques.
Our primary LCC software tool is MAAP®, a proprietary analytical tool
developed by TFD Group. MAAP shares a common database (and a
similar user interface) with another TFD tool, VMetric®, which we are
already using for spares optimization modelling.
This relationship with an established software tool will help with the
introduction of the new tool. Moreover, we can also utilize the extract,
transform and load (ETL) capability of our own Reference Database to build
initial models using DOTS data and/or existing VMetric models.
IMS/MFS/LS Page 10 OPM-5 Presentation T5-O16
What Data Does MAAP® Need?
• MAAP is an activity-based analytical and decision support tool that
analyzes the capability and support requirements for complex systems
subject to dynamic operating profiles and in any number of locations.
• Each system has a ‘future history’ of events, including:
– Operating events
– Maintenance events
• Each event has a duration (time), and requires one or more resources,
such as:
– Parts
– Skills
– Tools
– Software; Facilities; Data; Energy
• The amount of data required will depend on the scale and precision
required by the question.
IMS/MFS/LS Page 11 OPM-5 Presentation T5-O16
Please join with us and share your data!
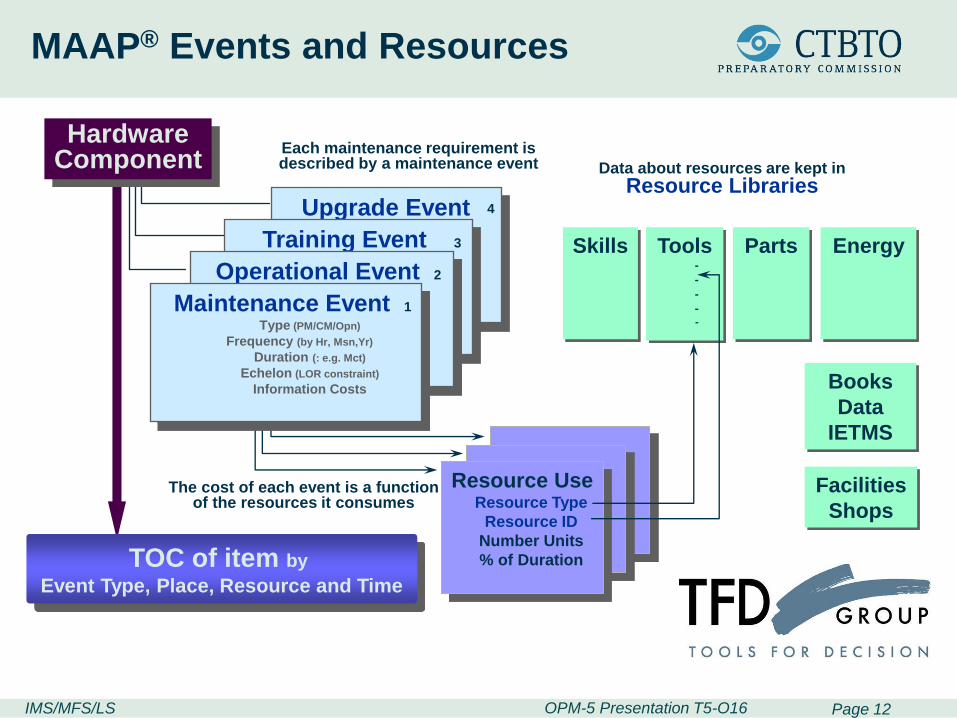
MAAP® Events and Resources
IMS/MFS/LS Page 12 OPM-5 Presentation T5-O16
Upgrade Event
Training Event 3
Operational Event 2
Hardware Component
Skills
Resource Use Resource Type
Resource ID
Number Units
% of Duration
Tools -
-
-
- -
TOC of item by Event Type, Place, Resource and Time
Resource Costs
Each maintenance requirement is described by a maintenance event
The cost of each event is a function of the resources it consumes
Data about resources are kept in
Resource Libraries 4
Parts
Books
Data
IETMS
Facilities
Shops
Maintenance Event 1
Type (PM/CM/Opn)
Frequency (by Hr, Msn,Yr)
Duration (: e.g. Mct)
Echelon (LOR constraint)
Information Costs
Energy
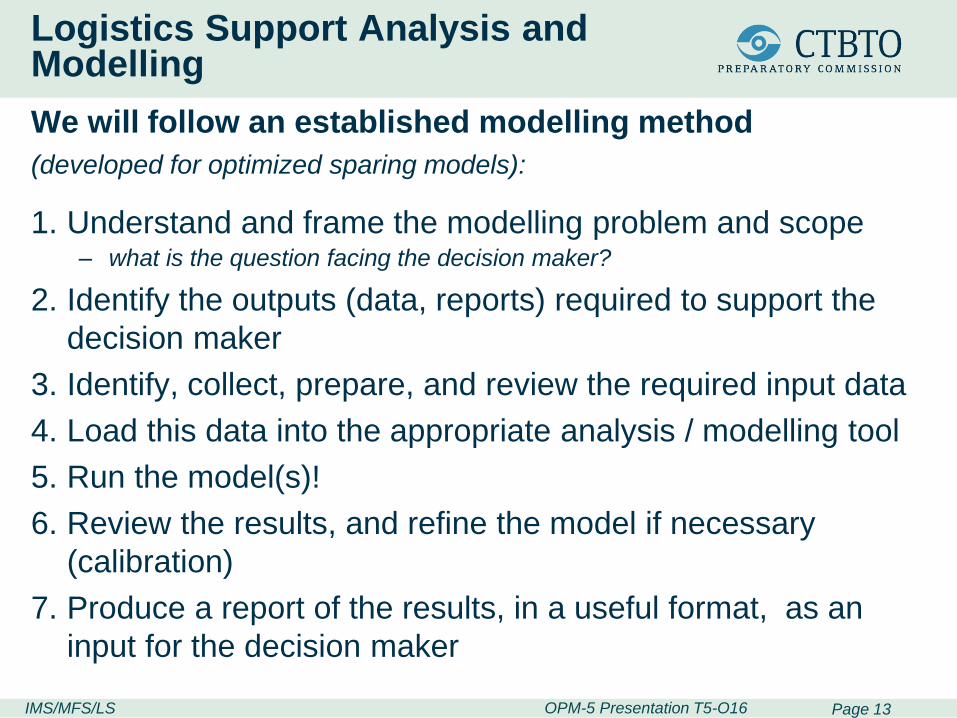
Logistics Support Analysis and Modelling
We will follow an established modelling method
(developed for optimized sparing models):
1. Understand and frame the modelling problem and scope – what is the question facing the decision maker?
2. Identify the outputs (data, reports) required to support the
decision maker
3. Identify, collect, prepare, and review the required input data
4. Load this data into the appropriate analysis / modelling tool
5. Run the model(s)!
6. Review the results, and refine the model if necessary
(calibration)
7. Produce a report of the results, in a useful format, as an
input for the decision maker
IMS/MFS/LS Page 13 OPM-5 Presentation T5-O16
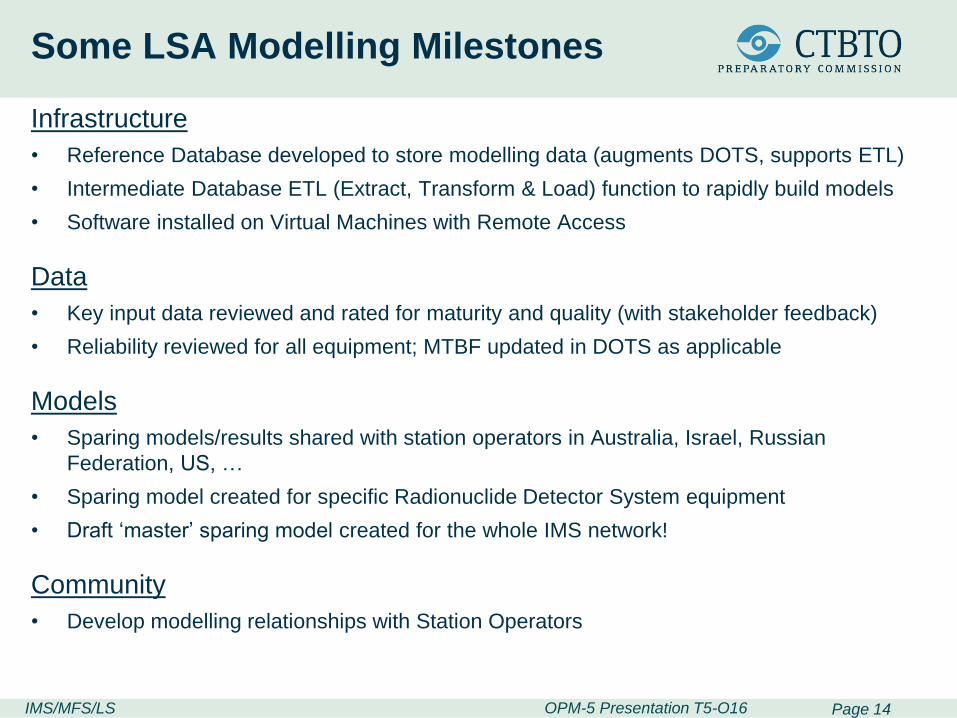
Some LSA Modelling Milestones
Infrastructure
• Reference Database developed to store modelling data (augments DOTS, supports ETL)
• Intermediate Database ETL (Extract, Transform & Load) function to rapidly build models
• Software installed on Virtual Machines with Remote Access
Data
• Key input data reviewed and rated for maturity and quality (with stakeholder feedback)
• Reliability reviewed for all equipment; MTBF updated in DOTS as applicable
Models
• Sparing models/results shared with station operators in Australia, Israel, Russian
Federation, US, …
• Sparing model created for specific Radionuclide Detector System equipment
• Draft ‘master’ sparing model created for the whole IMS network!
Community
• Develop modelling relationships with Station Operators
IMS/MFS/LS Page 14 OPM-5 Presentation T5-O16
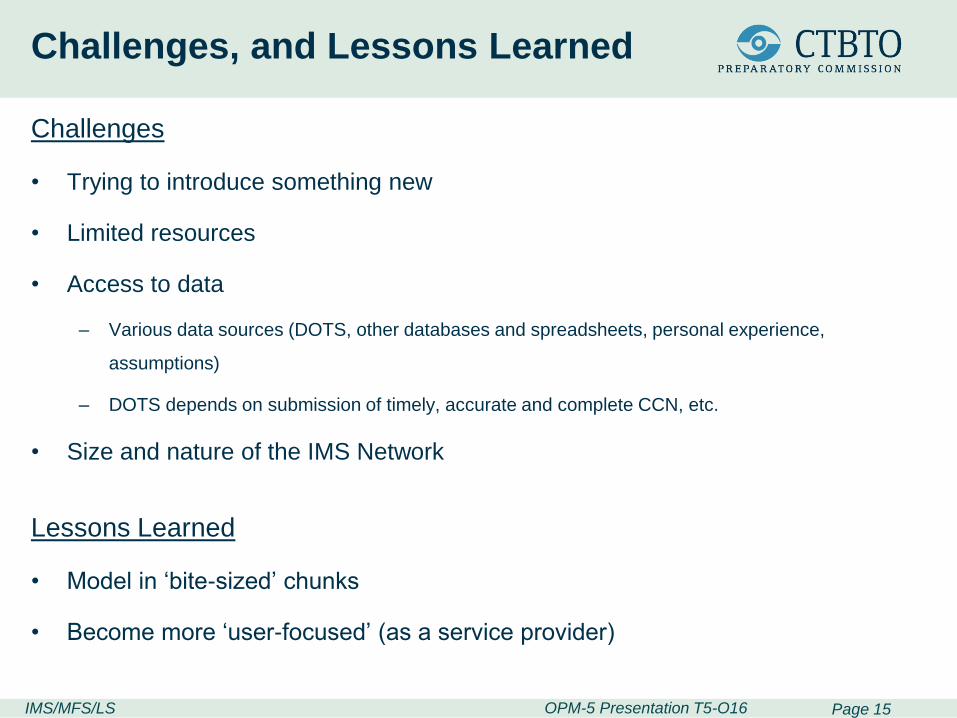
Challenges, and Lessons Learned
Challenges
• Trying to introduce something new
• Limited resources
• Access to data
– Various data sources (DOTS, other databases and spreadsheets, personal experience,
assumptions)
– DOTS depends on submission of timely, accurate and complete CCN, etc.
• Size and nature of the IMS Network
Lessons Learned
• Model in ‘bite-sized’ chunks
• Become more ‘user-focused’ (as a service provider)
IMS/MFS/LS Page 15 OPM-5 Presentation T5-O16
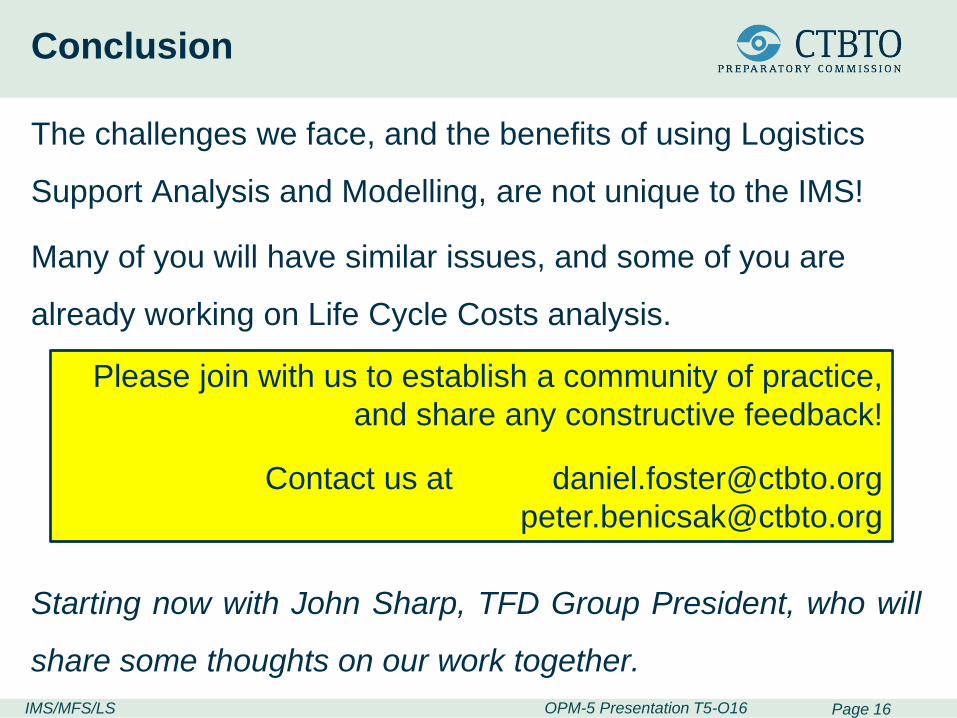
Conclusion
The challenges we face, and the benefits of using Logistics
Support Analysis and Modelling, are not unique to the IMS!
Many of you will have similar issues, and some of you are
already working on Life Cycle Costs analysis.
Starting now with John Sharp, TFD Group President, who will
share some thoughts on our work together.
IMS/MFS/LS Page 16 OPM-5 Presentation T5-O16
Please join with us to establish a community of practice,
and share any constructive feedback!
Contact us at [email protected]
Logistics Support Analysis The Route to Affordable Availability
John Sharp TFD Group President
Vienna 7 October 2015
CTBTO Operation and Maintenance Workshop
© Copyright 2001-2015 Systems Exchange, Inc., All Rights Reserved Worldwide
The MFS LSA Journey
Where have we got to: • PTS knew in advance the benefits of developing,
testing and costing systems support solutions using LSA models rather than intuitive judgement
• Learned modelling practice through initial narrow focus on spares inventory optimisation – Got good representation of IMS equipment breakdown
structure, sites and
– Understood data requirements (what is “good quality”) and how to make representative assumptions
• Has advanced capability for spares optimisation – best systems availability for least cost
© Copyright 2001-2015 Systems Exchange, Inc., All Rights Reserved Worldwide
The MFS LSA Journey
What lies ahead: • PTS must now raise its game
– Proper LCC is to Spares analysis like running is to walking
– Dealing with multiple resources – not just spares - the rewards are greater
• LCC is really “Supportability Analysis” – Cost is the medium of comparing different and complex
support solutions
• Smart modellers will iterate through developing ideas to get to a good balance of cost v performance
• But be logical and systematic – no “Duck Shooting”
• Record each model in the Modelling Log.
© Copyright 2001-2015 Systems Exchange, Inc., All Rights Reserved Worldwide
How can you help?
Anticipate MFS requests for data for LCC • Equipment Breakdown Structure
• Event data – Maintenance activity description
– Frequency, scheduled & unscheduled (MTBM)
– Duration
• Resources required for each Event – Skills breakdown
– Tools & test equipment (list and cost)
– Spares required (split repairable/consumable, cost)
– Facilities (air conditioned clean room etc, cost)
– Software (where relevant, cost)
– Energy (where significant - power and cost per unit)
© Copyright 2001-2015 Systems Exchange, Inc., All Rights Reserved Worldwide
Final Words?
• Whether or not advanced LSA models are used, data is the life blood of all analysis
• “Garbage in; garbage out” is a non-thinking statement by people who don’t understand modelling – A logically deduced assumption is not garbage
– Modelling with assumptions is proven to be better than not modelling at all
• An analyst is as much an artist as a technician – Who “paints an impression” of the world not a photographic
likeness – it only needs to be fit for purpose
– The ‘impression’ looks more lifelike as better data is available
• Tolerate and respond to analysts’ seemingly odd requests for data of all kinds; these are his ‘colours’
• Respond with sympathy and understanding
Thank you
OPM-5 Presentation T5-O16 IMS/MFS/LS Page 22