Embed Size (px)
Citation preview
1
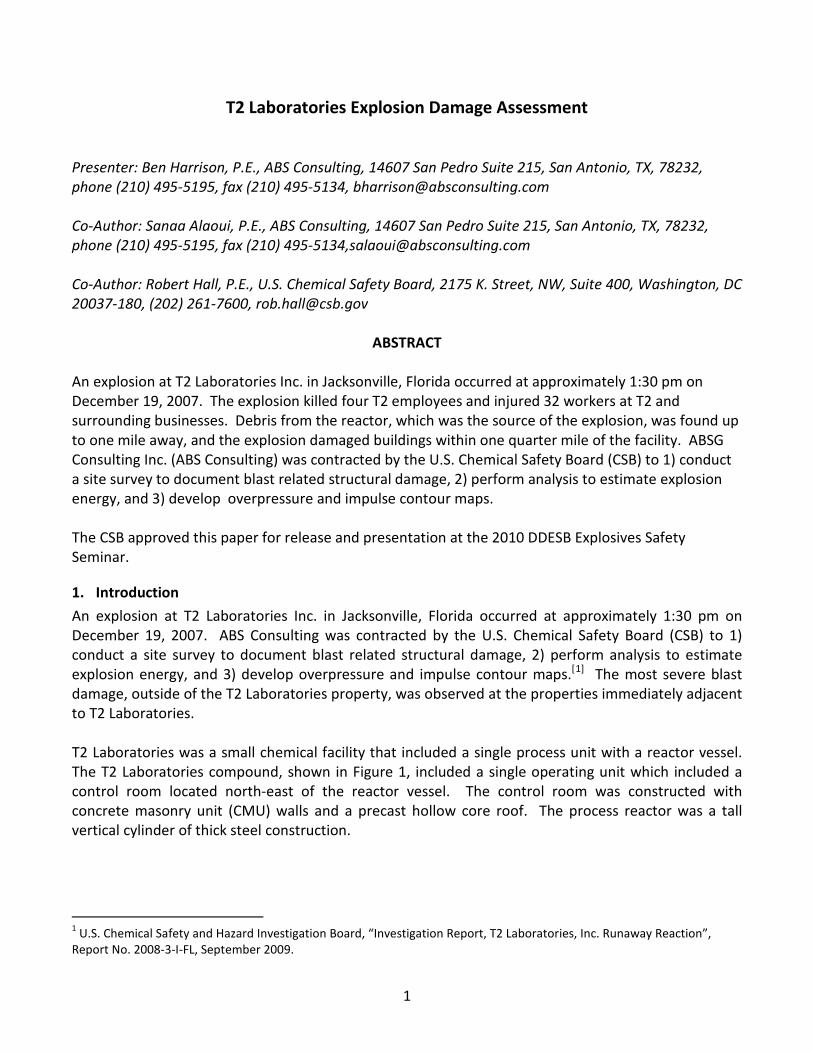
T2 Laboratories Explosion Damage Assessment Presenter: Ben Harrison, P.E., ABS Consulting, 14607 San Pedro Suite 215, San Antonio, TX, 78232, phone (210) 495-5195, fax (210) 495-5134, [email protected] Co-Author: Sanaa Alaoui, P.E., ABS Consulting, 14607 San Pedro Suite 215, San Antonio, TX, 78232, phone (210) 495-5195, fax (210) 495-5134,[email protected] Co-Author: Robert Hall, P.E., U.S. Chemical Safety Board, 2175 K. Street, NW, Suite 400, Washington, DC 20037-180, (202) 261-7600, [email protected]
ABSTRACT An explosion at T2 Laboratories Inc. in Jacksonville, Florida occurred at approximately 1:30 pm on December 19, 2007. The explosion killed four T2 employees and injured 32 workers at T2 and surrounding businesses. Debris from the reactor, which was the source of the explosion, was found up to one mile away, and the explosion damaged buildings within one quarter mile of the facility. ABSG Consulting Inc. (ABS Consulting) was contracted by the U.S. Chemical Safety Board (CSB) to 1) conduct a site survey to document blast related structural damage, 2) perform analysis to estimate explosion energy, and 3) develop overpressure and impulse contour maps. The CSB approved this paper for release and presentation at the 2010 DDESB Explosives Safety Seminar.
1. Introduction An explosion at T2 Laboratories Inc. in Jacksonville, Florida occurred at approximately 1:30 pm on December 19, 2007. ABS Consulting was contracted by the U.S. Chemical Safety Board (CSB) to 1) conduct a site survey to document blast related structural damage, 2) perform analysis to estimate explosion energy, and 3) develop overpressure and impulse contour maps.[1
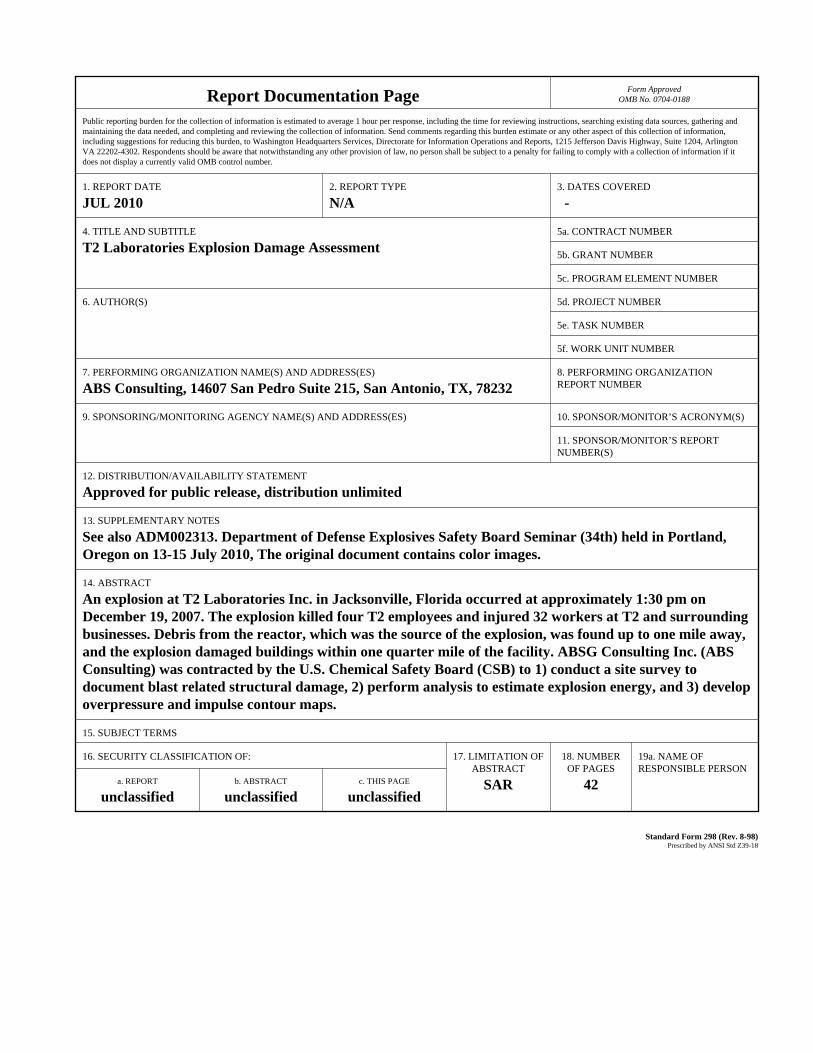
T2 Laboratories was a small chemical facility that included a single process unit with a reactor vessel. The T2 Laboratories compound, shown in
] The most severe blast damage, outside of the T2 Laboratories property, was observed at the properties immediately adjacent to T2 Laboratories.
Figure 1, included a single operating unit which included a control room located north-east of the reactor vessel. The control room was constructed with concrete masonry unit (CMU) walls and a precast hollow core roof. The process reactor was a tall vertical cylinder of thick steel construction.
1 U.S. Chemical Safety and Hazard Investigation Board, “Investigation Report, T2 Laboratories, Inc. Runaway Reaction”, Report No. 2008-3-I-FL, September 2009.
Report Documentation Page Form ApprovedOMB No. 0704-0188
Public reporting burden for the collection of information is estimated to average 1 hour per response, including the time for reviewing instructions, searching existing data sources, gathering andmaintaining the data needed, and completing and reviewing the collection of information. Send comments regarding this burden estimate or any other aspect of this collection of information,including suggestions for reducing this burden, to Washington Headquarters Services, Directorate for Information Operations and Reports, 1215 Jefferson Davis Highway, Suite 1204, ArlingtonVA 22202-4302. Respondents should be aware that notwithstanding any other provision of law, no person shall be subject to a penalty for failing to comply with a collection of information if itdoes not display a currently valid OMB control number.
1. REPORT DATE JUL 2010
2. REPORT TYPE N/A
3. DATES COVERED -
4. TITLE AND SUBTITLE T2 Laboratories Explosion Damage Assessment
5a. CONTRACT NUMBER
5b. GRANT NUMBER
5c. PROGRAM ELEMENT NUMBER
6. AUTHOR(S) 5d. PROJECT NUMBER
5e. TASK NUMBER
5f. WORK UNIT NUMBER
7. PERFORMING ORGANIZATION NAME(S) AND ADDRESS(ES) ABS Consulting, 14607 San Pedro Suite 215, San Antonio, TX, 78232
8. PERFORMING ORGANIZATIONREPORT NUMBER
9. SPONSORING/MONITORING AGENCY NAME(S) AND ADDRESS(ES) 10. SPONSOR/MONITOR’S ACRONYM(S)
11. SPONSOR/MONITOR’S REPORT NUMBER(S)
12. DISTRIBUTION/AVAILABILITY STATEMENT Approved for public release, distribution unlimited
13. SUPPLEMENTARY NOTES See also ADM002313. Department of Defense Explosives Safety Board Seminar (34th) held in Portland,Oregon on 13-15 July 2010, The original document contains color images.
14. ABSTRACT An explosion at T2 Laboratories Inc. in Jacksonville, Florida occurred at approximately 1:30 pm onDecember 19, 2007. The explosion killed four T2 employees and injured 32 workers at T2 and surroundingbusinesses. Debris from the reactor, which was the source of the explosion, was found up to one mile away,and the explosion damaged buildings within one quarter mile of the facility. ABSG Consulting Inc. (ABSConsulting) was contracted by the U.S. Chemical Safety Board (CSB) to 1) conduct a site survey todocument blast related structural damage, 2) perform analysis to estimate explosion energy, and 3) developoverpressure and impulse contour maps.
15. SUBJECT TERMS
16. SECURITY CLASSIFICATION OF: 17. LIMITATION OF ABSTRACT
SAR
18. NUMBEROF PAGES
42
19a. NAME OFRESPONSIBLE PERSON
a. REPORT unclassified
b. ABSTRACT unclassified
c. THIS PAGE unclassified
Standard Form 298 (Rev. 8-98) Prescribed by ANSI Std Z39-18
2
Figure 1. T2 Laboratories Post Incident Aerial Photograph [1]
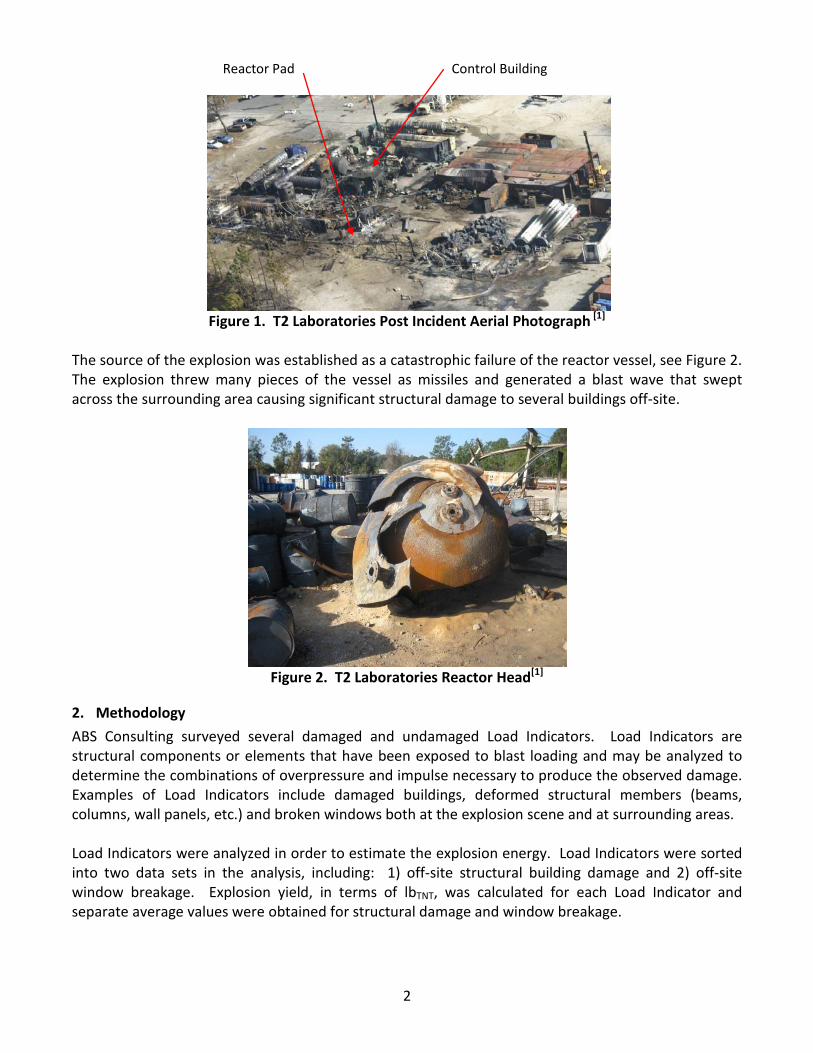
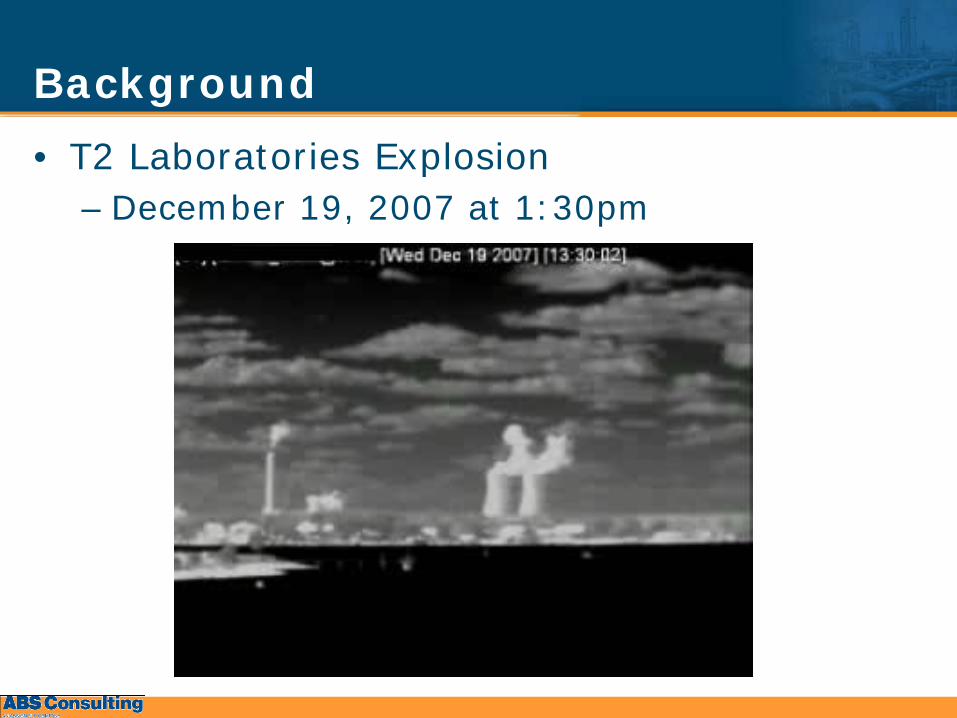
The source of the explosion was established as a catastrophic failure of the reactor vessel, see Figure 2. The explosion threw many pieces of the vessel as missiles and generated a blast wave that swept across the surrounding area causing significant structural damage to several buildings off-site.
Figure 2. T2 Laboratories Reactor Head[1]
2. Methodology ABS Consulting surveyed several damaged and undamaged Load Indicators. Load Indicators are structural components or elements that have been exposed to blast loading and may be analyzed to determine the combinations of overpressure and impulse necessary to produce the observed damage. Examples of Load Indicators include damaged buildings, deformed structural members (beams, columns, wall panels, etc.) and broken windows both at the explosion scene and at surrounding areas. Load Indicators were analyzed in order to estimate the explosion energy. Load Indicators were sorted into two data sets in the analysis, including: 1) off-site structural building damage and 2) off-site window breakage. Explosion yield, in terms of lbTNT, was calculated for each Load Indicator and separate average values were obtained for structural damage and window breakage.
Control Building Reactor Pad
3
An analysis of all measured damaged Load Indicators was performed using only the positive phase of the blast wave. The shape of a blast wave, from High Explosives (HE) such as trinitrotoluene (TNT), is a sudden rise in pressure which decays exponentially followed by a negative pressure with a smaller magnitude. A typical HE blast wave shape is shown below in Figure 3.
Figure 3. Typical Blast Load for High Explosives
Using the methods of Baker[2
0p
] for pressure vessel bursts (PVB), a scaled distance (Rbar) can be computed for each data point according to Equation 1, where is atmospheric pressure, R is the standoff distance to the given component, and E is the total explosive energy of the estimated TNT charge weight (W). The unit energy of TNT used in this analysis was 1.88x10⁷ lbf-in/lbTNT.
3/13/10 / ERpRbar = Equation 1
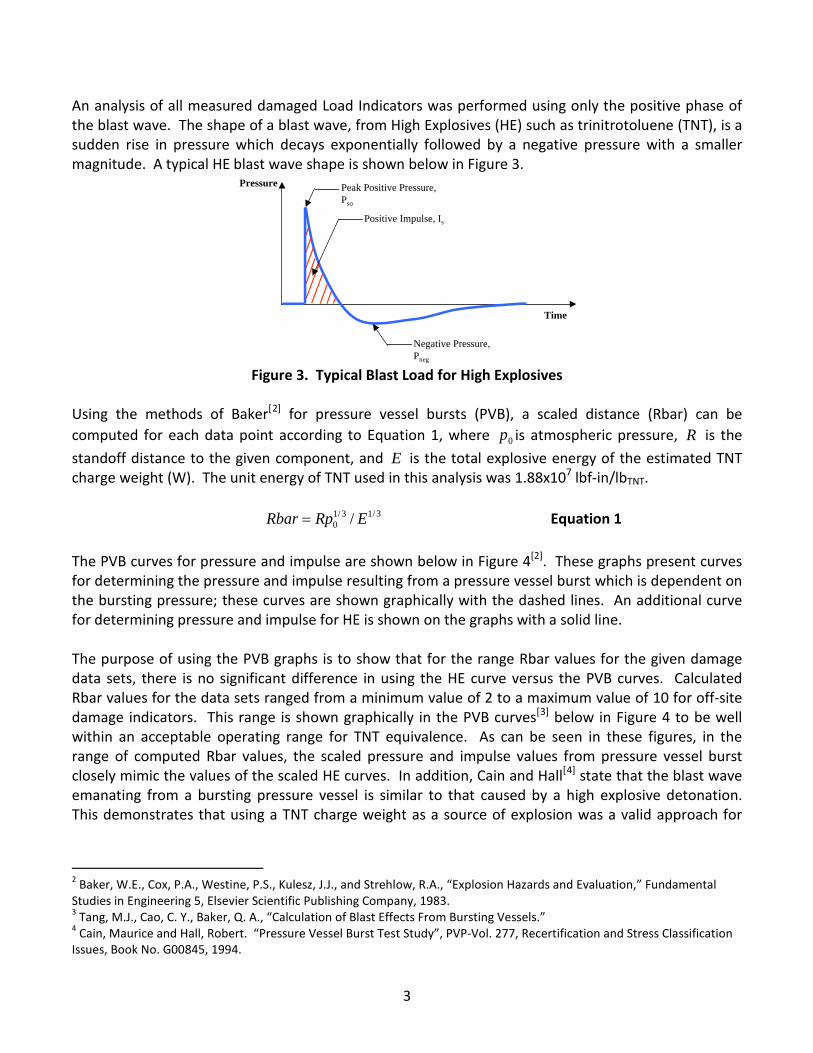
The PVB curves for pressure and impulse are shown below in Figure 4[2]. These graphs present curves for determining the pressure and impulse resulting from a pressure vessel burst which is dependent on the bursting pressure; these curves are shown graphically with the dashed lines. An additional curve for determining pressure and impulse for HE is shown on the graphs with a solid line. The purpose of using the PVB graphs is to show that for the range Rbar values for the given damage data sets, there is no significant difference in using the HE curve versus the PVB curves. Calculated Rbar values for the data sets ranged from a minimum value of 2 to a maximum value of 10 for off-site damage indicators. This range is shown graphically in the PVB curves[3 Figure 4] below in to be well within an acceptable operating range for TNT equivalence. As can be seen in these figures, in the range of computed Rbar values, the scaled pressure and impulse values from pressure vessel burst closely mimic the values of the scaled HE curves. In addition, Cain and Hall[4
2 Baker, W.E., Cox, P.A., Westine, P.S., Kulesz, J.J., and Strehlow, R.A., “Explosion Hazards and Evaluation,” Fundamental Studies in Engineering 5, Elsevier Scientific Publishing Company, 1983. 3 Tang, M.J., Cao, C. Y., Baker, Q. A., “Calculation of Blast Effects From Bursting Vessels.” 4 Cain, Maurice and Hall, Robert. “Pressure Vessel Burst Test Study”, PVP-Vol. 277, Recertification and Stress Classification Issues, Book No. G00845, 1994.
] state that the blast wave emanating from a bursting pressure vessel is similar to that caused by a high explosive detonation. This demonstrates that using a TNT charge weight as a source of explosion was a valid approach for
Peak Positive Pressure,Pso
Negative Pressure,Pneg
Pressure
Time
Positive Impulse, Is
4
this explosion incident for the measured damage indicators in the operating range highlighted in Figure 4.
Figure 4. Pressure and Impulse Relationships vs. .Scaled Range for Pressure Vessel Burst[3]
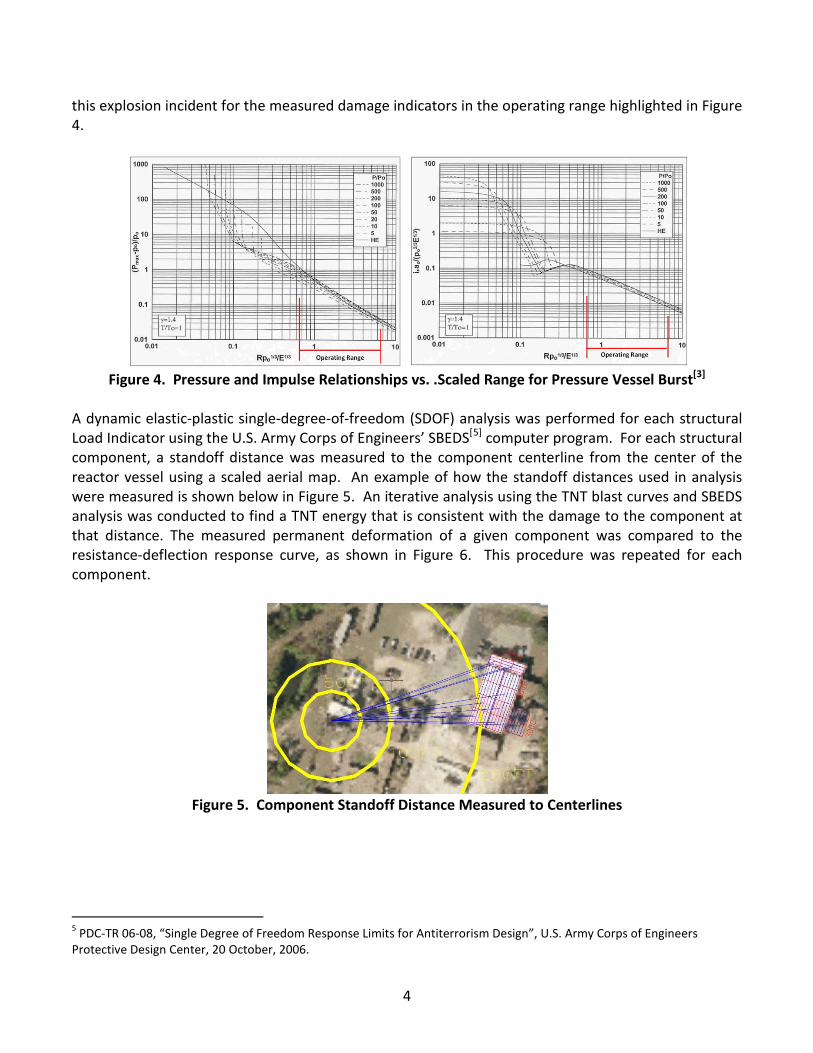
A dynamic elastic-plastic single-degree-of-freedom (SDOF) analysis was performed for each structural Load Indicator using the U.S. Army Corps of Engineers’ SBEDS[5
Figure 5
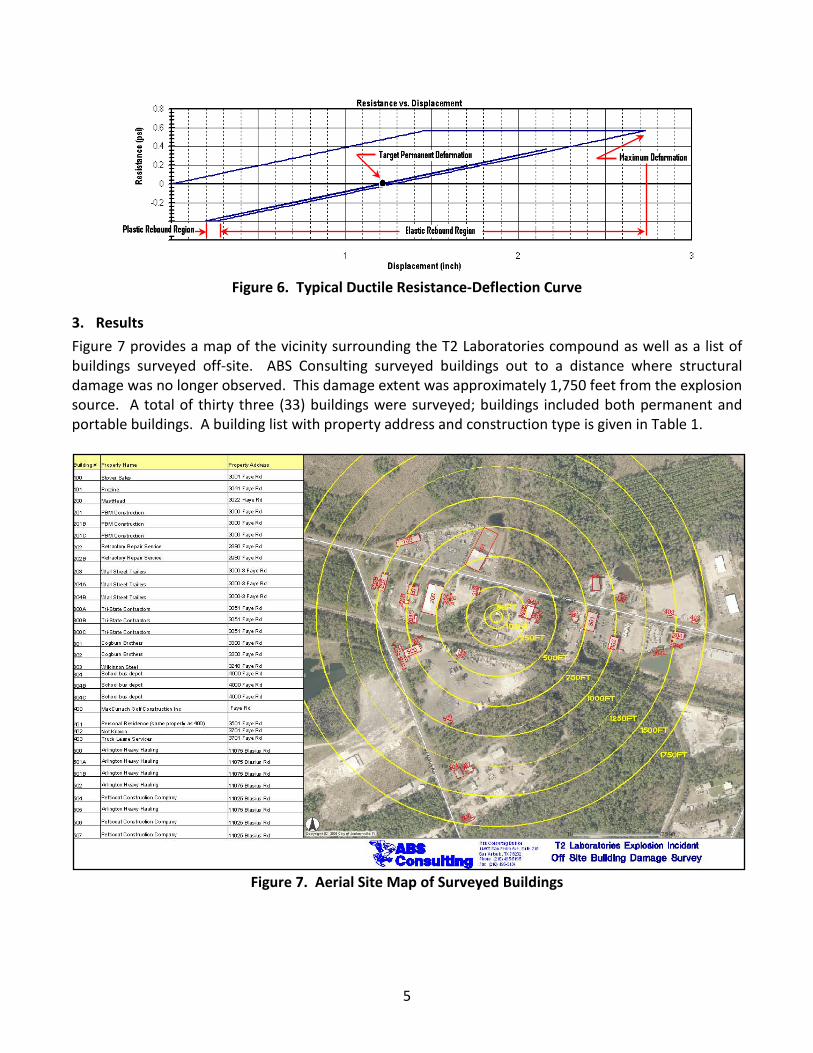
] computer program. For each structural component, a standoff distance was measured to the component centerline from the center of the reactor vessel using a scaled aerial map. An example of how the standoff distances used in analysis were measured is shown below in . An iterative analysis using the TNT blast curves and SBEDS analysis was conducted to find a TNT energy that is consistent with the damage to the component at that distance. The measured permanent deformation of a given component was compared to the resistance-deflection response curve, as shown in Figure 6. This procedure was repeated for each component.
Figure 5. Component Standoff Distance Measured to Centerlines
5 PDC-TR 06-08, “Single Degree of Freedom Response Limits for Antiterrorism Design”, U.S. Army Corps of Engineers Protective Design Center, 20 October, 2006.
5
Figure 6. Typical Ductile Resistance-Deflection Curve
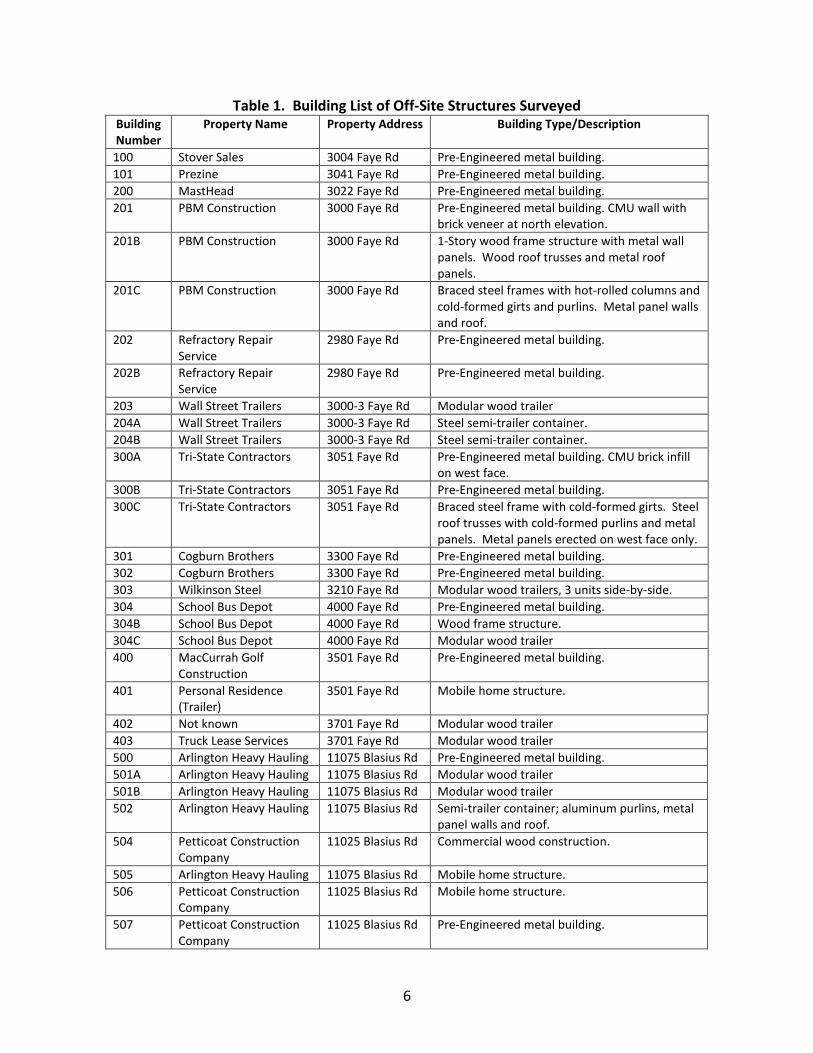
3. Results Figure 7 provides a map of the vicinity surrounding the T2 Laboratories compound as well as a list of buildings surveyed off-site. ABS Consulting surveyed buildings out to a distance where structural damage was no longer observed. This damage extent was approximately 1,750 feet from the explosion source. A total of thirty three (33) buildings were surveyed; buildings included both permanent and portable buildings. A building list with property address and construction type is given in Table 1.
Figure 7. Aerial Site Map of Surveyed Buildings
6
Table 1. Building List of Off-Site Structures Surveyed Building Number
Property Name Property Address Building Type/Description
100 Stover Sales 3004 Faye Rd Pre-Engineered metal building. 101 Prezine 3041 Faye Rd Pre-Engineered metal building. 200 MastHead 3022 Faye Rd Pre-Engineered metal building. 201 PBM Construction 3000 Faye Rd Pre-Engineered metal building. CMU wall with
brick veneer at north elevation. 201B PBM Construction 3000 Faye Rd 1-Story wood frame structure with metal wall
panels. Wood roof trusses and metal roof panels.
201C PBM Construction 3000 Faye Rd Braced steel frames with hot-rolled columns and cold-formed girts and purlins. Metal panel walls and roof.
202 Refractory Repair Service
2980 Faye Rd Pre-Engineered metal building.
202B Refractory Repair Service
2980 Faye Rd Pre-Engineered metal building.
203 Wall Street Trailers 3000-3 Faye Rd Modular wood trailer 204A Wall Street Trailers 3000-3 Faye Rd Steel semi-trailer container. 204B Wall Street Trailers 3000-3 Faye Rd Steel semi-trailer container. 300A Tri-State Contractors 3051 Faye Rd Pre-Engineered metal building. CMU brick infill
on west face. 300B Tri-State Contractors 3051 Faye Rd Pre-Engineered metal building. 300C Tri-State Contractors 3051 Faye Rd Braced steel frame with cold-formed girts. Steel
roof trusses with cold-formed purlins and metal panels. Metal panels erected on west face only.
301 Cogburn Brothers 3300 Faye Rd Pre-Engineered metal building. 302 Cogburn Brothers 3300 Faye Rd Pre-Engineered metal building. 303 Wilkinson Steel 3210 Faye Rd Modular wood trailers, 3 units side-by-side. 304 School Bus Depot 4000 Faye Rd Pre-Engineered metal building. 304B School Bus Depot 4000 Faye Rd Wood frame structure. 304C School Bus Depot 4000 Faye Rd Modular wood trailer 400 MacCurrah Golf
Construction 3501 Faye Rd Pre-Engineered metal building.
401 Personal Residence (Trailer)
3501 Faye Rd Mobile home structure.
402 Not known 3701 Faye Rd Modular wood trailer 403 Truck Lease Services 3701 Faye Rd Modular wood trailer 500 Arlington Heavy Hauling 11075 Blasius Rd Pre-Engineered metal building. 501A Arlington Heavy Hauling 11075 Blasius Rd Modular wood trailer 501B Arlington Heavy Hauling 11075 Blasius Rd Modular wood trailer 502 Arlington Heavy Hauling 11075 Blasius Rd Semi-trailer container; aluminum purlins, metal
panel walls and roof. 504 Petticoat Construction
Company 11025 Blasius Rd Commercial wood construction.
505 Arlington Heavy Hauling 11075 Blasius Rd Mobile home structure. 506 Petticoat Construction
Company 11025 Blasius Rd Mobile home structure.
507 Petticoat Construction Company
11025 Blasius Rd Pre-Engineered metal building.
7
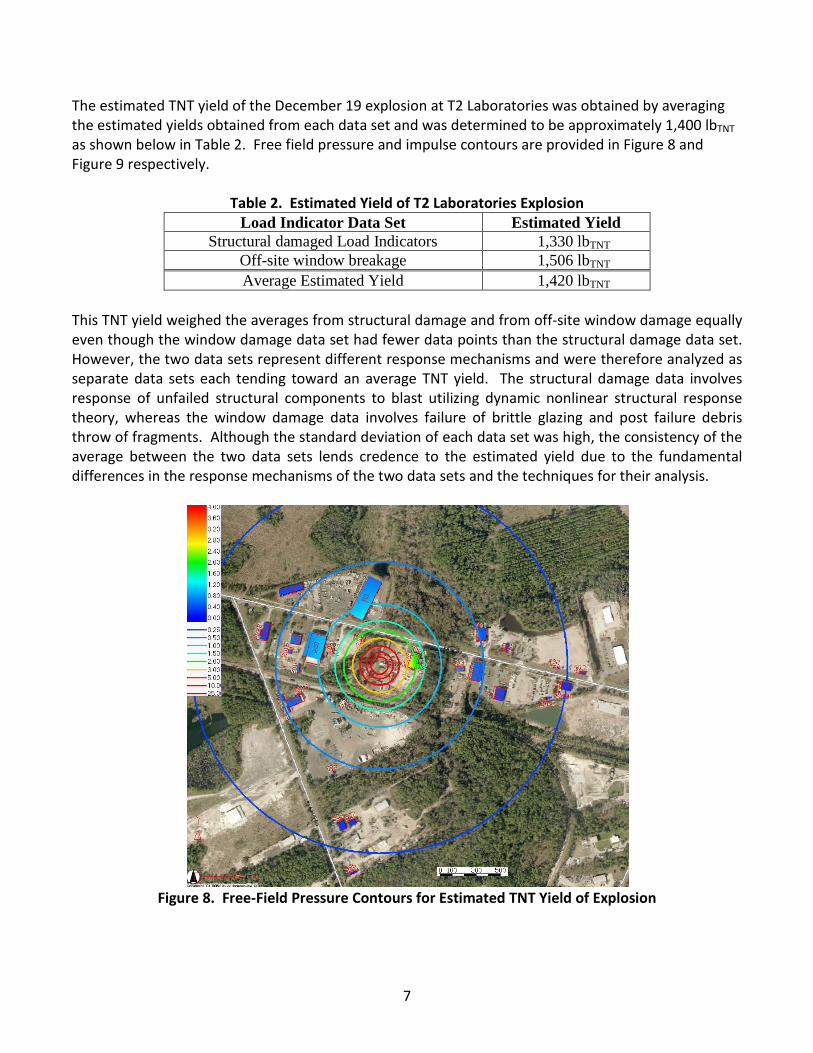
The estimated TNT yield of the December 19 explosion at T2 Laboratories was obtained by averaging the estimated yields obtained from each data set and was determined to be approximately 1,400 lbTNT as shown below in Table 2. Free field pressure and impulse contours are provided in Figure 8 and Figure 9 respectively.
Table 2. Estimated Yield of T2 Laboratories Explosion Load Indicator Data Set Estimated Yield
Structural damaged Load Indicators 1,330 lbTNT Off-site window breakage 1,506 lbTNT Average Estimated Yield 1,420 lbTNT
This TNT yield weighed the averages from structural damage and from off-site window damage equally even though the window damage data set had fewer data points than the structural damage data set. However, the two data sets represent different response mechanisms and were therefore analyzed as separate data sets each tending toward an average TNT yield. The structural damage data involves response of unfailed structural components to blast utilizing dynamic nonlinear structural response theory, whereas the window damage data involves failure of brittle glazing and post failure debris throw of fragments. Although the standard deviation of each data set was high, the consistency of the average between the two data sets lends credence to the estimated yield due to the fundamental differences in the response mechanisms of the two data sets and the techniques for their analysis.
Figure 8. Free-Field Pressure Contours for Estimated TNT Yield of Explosion
8
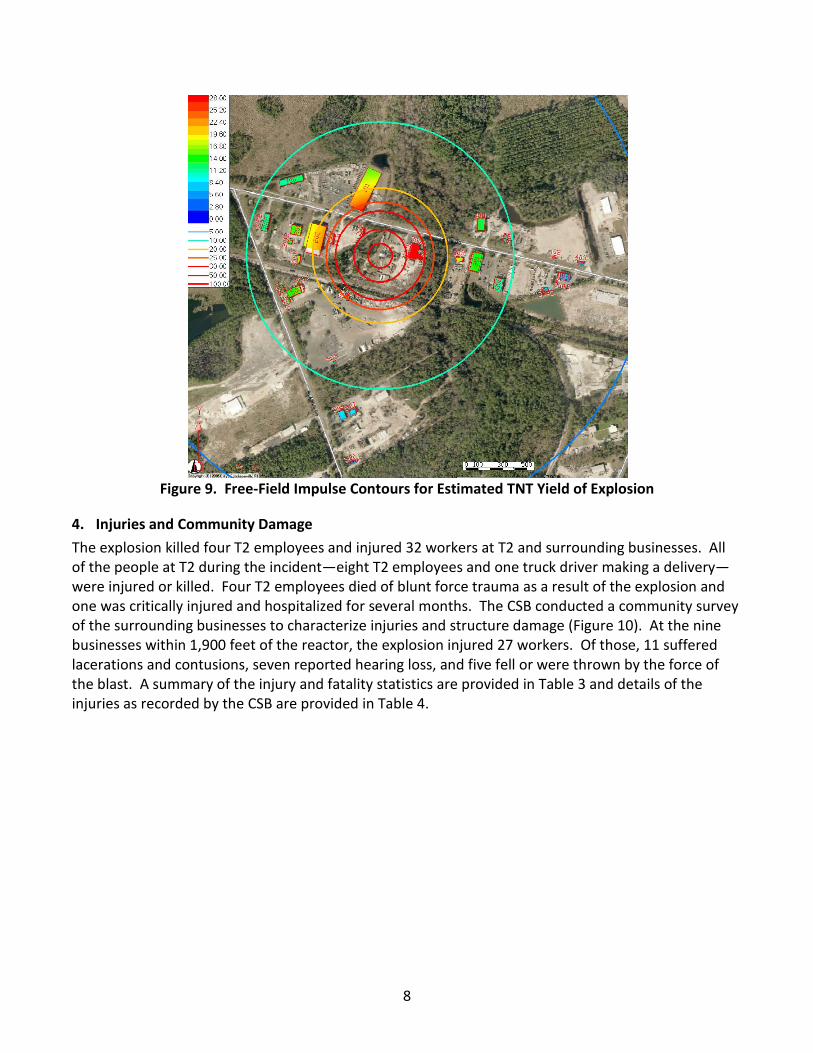
Figure 9. Free-Field Impulse Contours for Estimated TNT Yield of Explosion
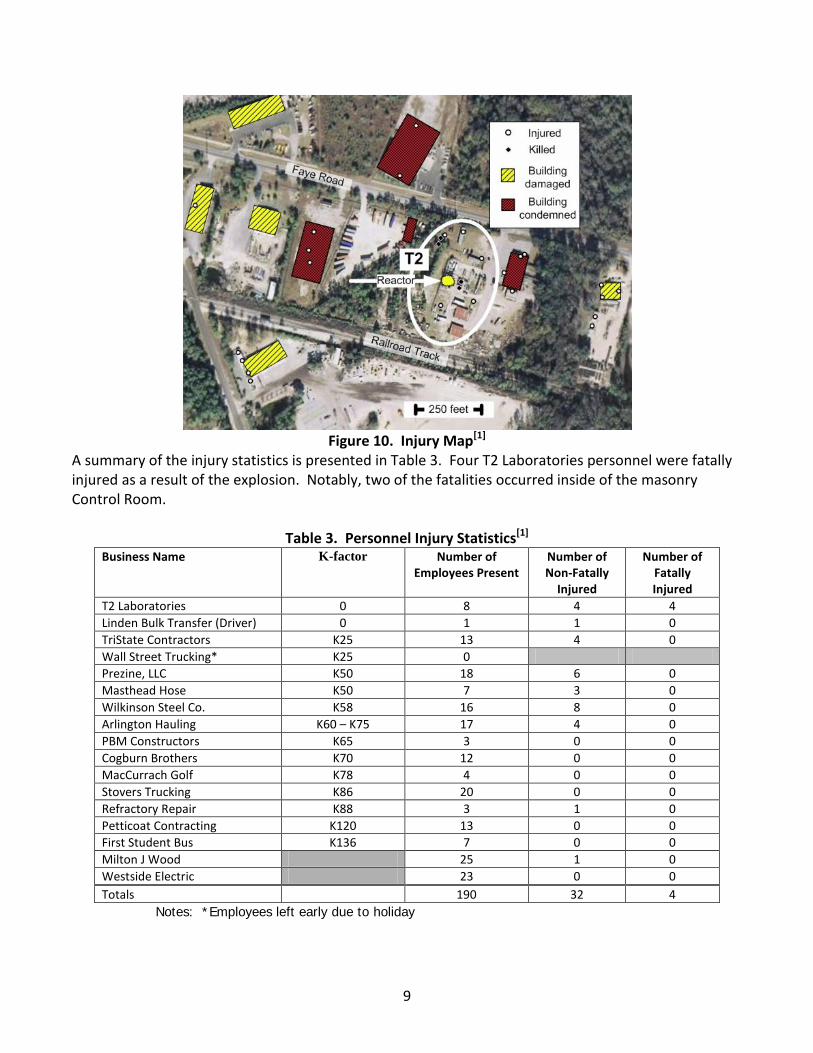
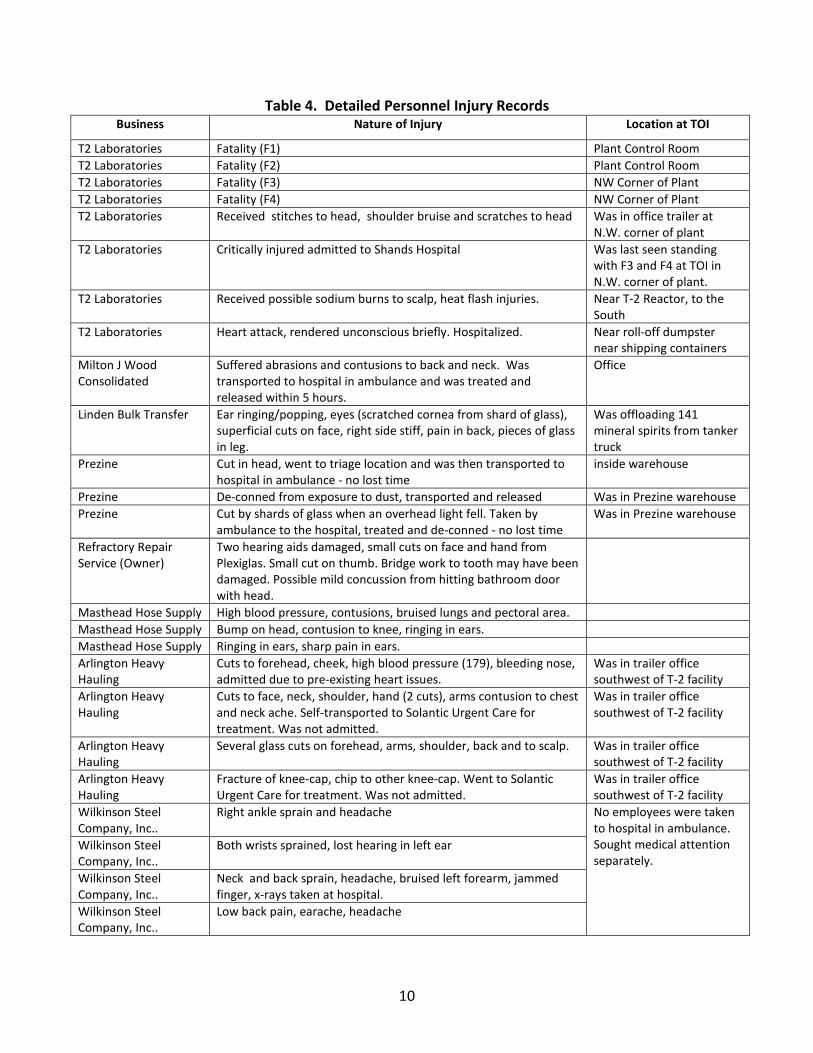
4. Injuries and Community Damage The explosion killed four T2 employees and injured 32 workers at T2 and surrounding businesses. All of the people at T2 during the incident—eight T2 employees and one truck driver making a delivery—were injured or killed. Four T2 employees died of blunt force trauma as a result of the explosion and one was critically injured and hospitalized for several months. The CSB conducted a community survey of the surrounding businesses to characterize injuries and structure damage (Figure 10). At the nine businesses within 1,900 feet of the reactor, the explosion injured 27 workers. Of those, 11 suffered lacerations and contusions, seven reported hearing loss, and five fell or were thrown by the force of the blast. A summary of the injury and fatality statistics are provided in Table 3 and details of the injuries as recorded by the CSB are provided in Table 4.
9
Figure 10. Injury Map[1]
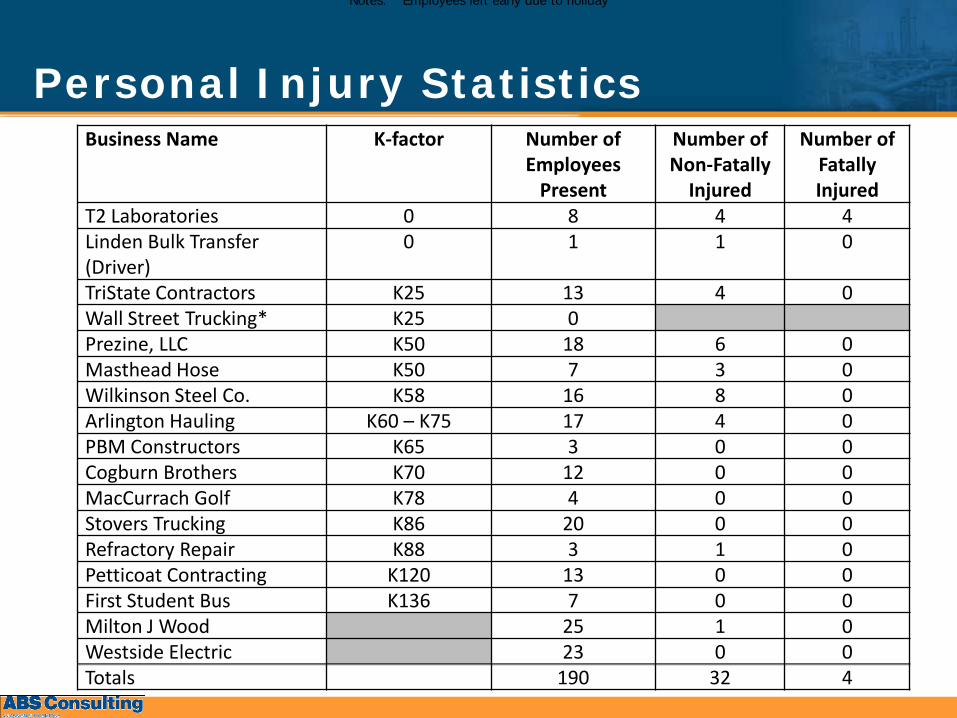
A summary of the injury statistics is presented in Table 3. Four T2 Laboratories personnel were fatally injured as a result of the explosion. Notably, two of the fatalities occurred inside of the masonry Control Room.
Table 3. Personnel Injury Statistics[1] Business Name K-factor Number of
Employees Present Number of Non-Fatally
Injured
Number of Fatally Injured
T2 Laboratories 0 8 4 4 Linden Bulk Transfer (Driver) 0 1 1 0 TriState Contractors K25 13 4 0 Wall Street Trucking* K25 0 Prezine, LLC K50 18 6 0 Masthead Hose K50 7 3 0 Wilkinson Steel Co. K58 16 8 0 Arlington Hauling K60 – K75 17 4 0 PBM Constructors K65 3 0 0 Cogburn Brothers K70 12 0 0 MacCurrach Golf K78 4 0 0 Stovers Trucking K86 20 0 0 Refractory Repair K88 3 1 0 Petticoat Contracting K120 13 0 0 First Student Bus K136 7 0 0 Milton J Wood 25 1 0 Westside Electric 23 0 0 Totals 190 32 4
Notes: *Employees left early due to holiday
10
Table 4. Detailed Personnel Injury Records Business Nature of Injury Location at TOI
T2 Laboratories Fatality (F1) Plant Control Room T2 Laboratories Fatality (F2) Plant Control Room T2 Laboratories Fatality (F3) NW Corner of Plant T2 Laboratories Fatality (F4) NW Corner of Plant T2 Laboratories Received stitches to head, shoulder bruise and scratches to head Was in office trailer at
N.W. corner of plant T2 Laboratories Critically injured admitted to Shands Hospital Was last seen standing
with F3 and F4 at TOI in N.W. corner of plant.
T2 Laboratories Received possible sodium burns to scalp, heat flash injuries. Near T-2 Reactor, to the South
T2 Laboratories Heart attack, rendered unconscious briefly. Hospitalized. Near roll-off dumpster near shipping containers
Milton J Wood Consolidated
Suffered abrasions and contusions to back and neck. Was transported to hospital in ambulance and was treated and released within 5 hours.
Office
Linden Bulk Transfer Ear ringing/popping, eyes (scratched cornea from shard of glass), superficial cuts on face, right side stiff, pain in back, pieces of glass in leg.
Was offloading 141 mineral spirits from tanker truck
Prezine Cut in head, went to triage location and was then transported to hospital in ambulance - no lost time
inside warehouse
Prezine De-conned from exposure to dust, transported and released Was in Prezine warehouse Prezine Cut by shards of glass when an overhead light fell. Taken by
ambulance to the hospital, treated and de-conned - no lost time Was in Prezine warehouse
Refractory Repair Service (Owner)
Two hearing aids damaged, small cuts on face and hand from Plexiglas. Small cut on thumb. Bridge work to tooth may have been damaged. Possible mild concussion from hitting bathroom door with head.
Masthead Hose Supply High blood pressure, contusions, bruised lungs and pectoral area. Masthead Hose Supply Bump on head, contusion to knee, ringing in ears. Masthead Hose Supply Ringing in ears, sharp pain in ears. Arlington Heavy Hauling
Cuts to forehead, cheek, high blood pressure (179), bleeding nose, admitted due to pre-existing heart issues.
Was in trailer office southwest of T-2 facility
Arlington Heavy Hauling
Cuts to face, neck, shoulder, hand (2 cuts), arms contusion to chest and neck ache. Self-transported to Solantic Urgent Care for treatment. Was not admitted.
Was in trailer office southwest of T-2 facility
Arlington Heavy Hauling
Several glass cuts on forehead, arms, shoulder, back and to scalp. Was in trailer office southwest of T-2 facility
Arlington Heavy Hauling
Fracture of knee-cap, chip to other knee-cap. Went to Solantic Urgent Care for treatment. Was not admitted.
Was in trailer office southwest of T-2 facility
Wilkinson Steel Company, Inc..
Right ankle sprain and headache No employees were taken to hospital in ambulance. Sought medical attention separately.
Wilkinson Steel Company, Inc..
Both wrists sprained, lost hearing in left ear
Wilkinson Steel Company, Inc..
Neck and back sprain, headache, bruised left forearm, jammed finger, x-rays taken at hospital.
Wilkinson Steel Company, Inc..
Low back pain, earache, headache
11
Business Nature of Injury Location at TOI
Wilkinson Steel Company, Inc..
Pain in right shoulder (No treatment)
Wilkinson Steel Company, Inc..
Anxiety attack, scratched left forearm
Wilkinson Steel Company, Inc..
Eyes and throat burning, sprained neck and back.
Wilkinson Steel Company, Inc..
Shard of glass in throat
Tristate Contractors Bruised shoulder - sought medical attention as a precaution Was standing next to forklift outside of rollup door at Tristate
Tristate Contractors Perforated ear drum - currently on medication Was standing in the front entrance of Tristate when the explosion took place
Tristate Contractors Hit with debris in the back of the thigh, muscle swelled and moved to calf
Was standing in break area behind Tristate
Tristate Contractors Shards of glass in arm, shoulder, back of head, dislocated ribs (4),strained wrist, fractured tail-bone
Was sitting at desk in office
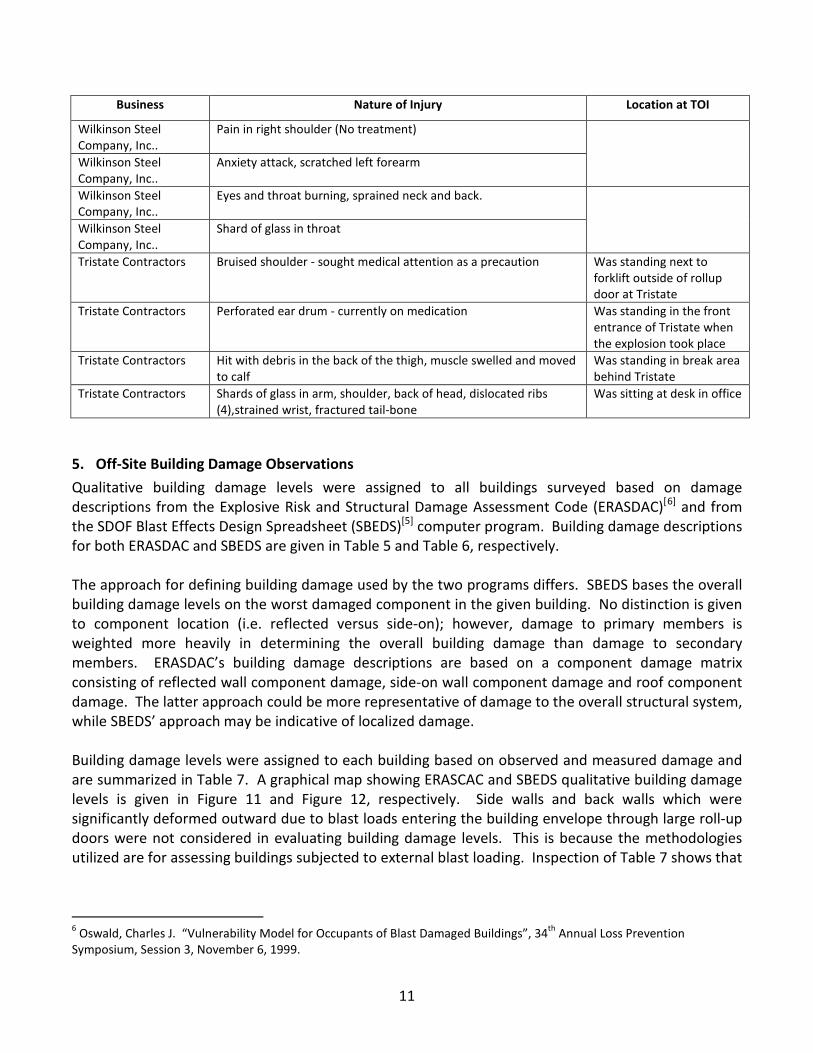
5. Off-Site Building Damage Observations Qualitative building damage levels were assigned to all buildings surveyed based on damage descriptions from the Explosive Risk and Structural Damage Assessment Code (ERASDAC)[6
5
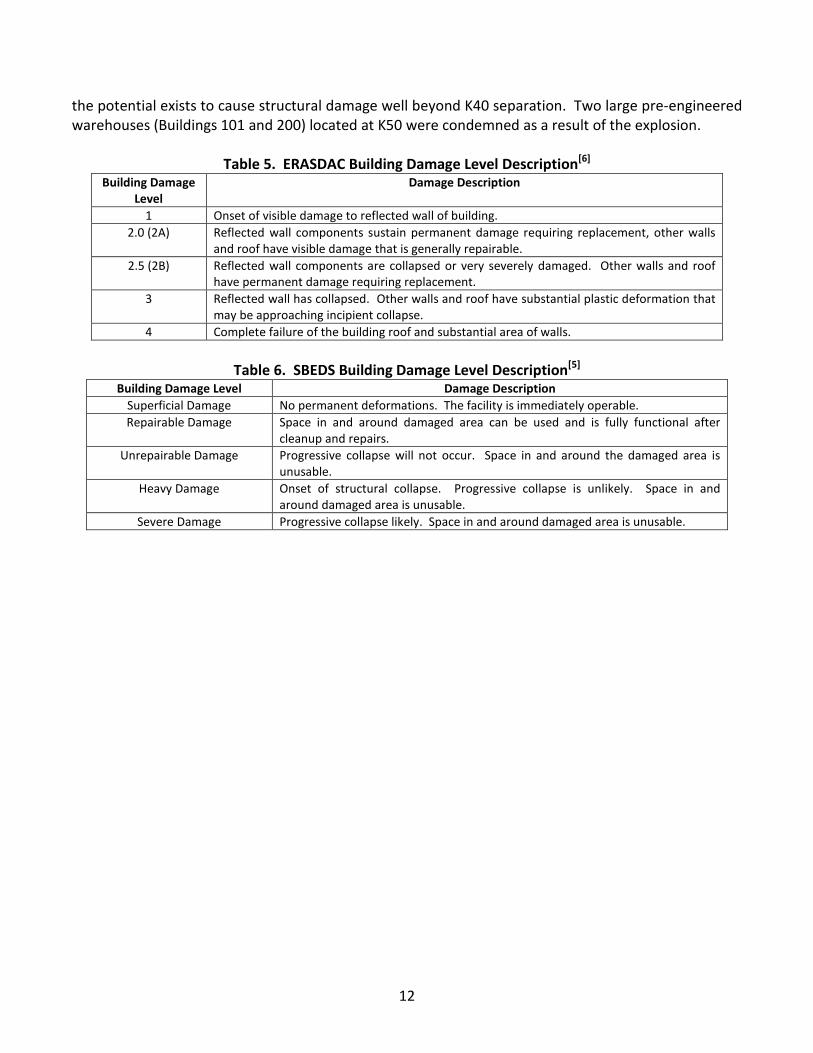
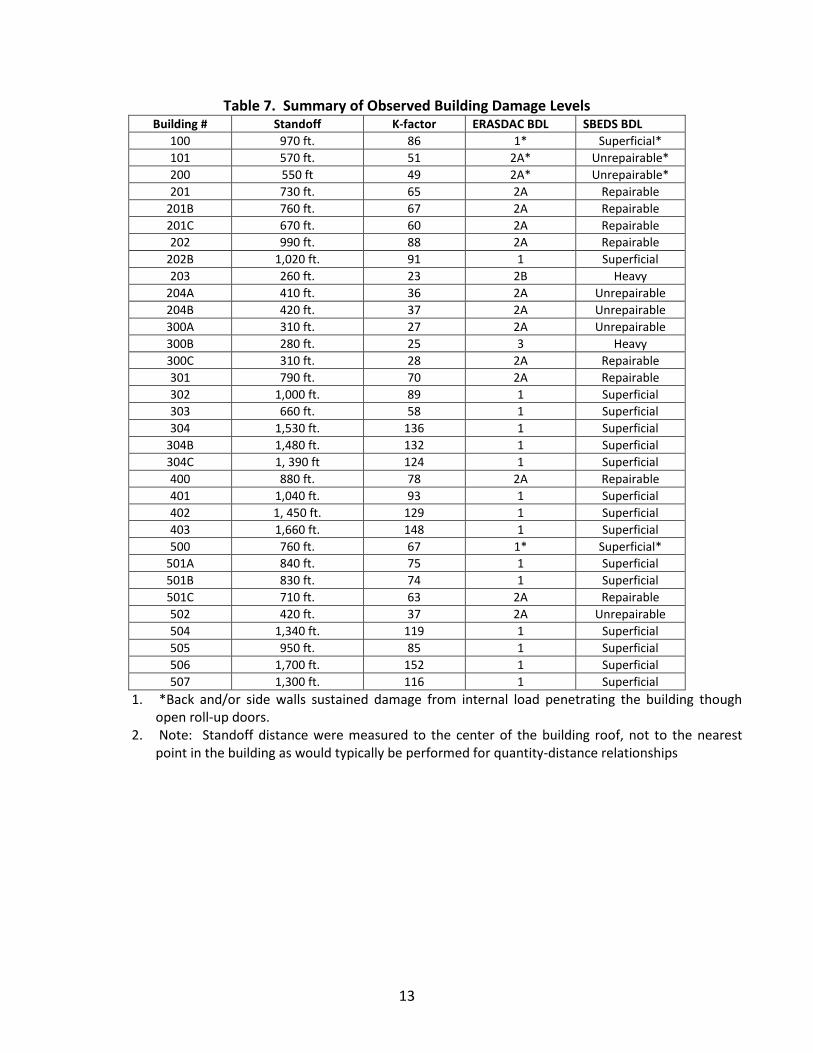
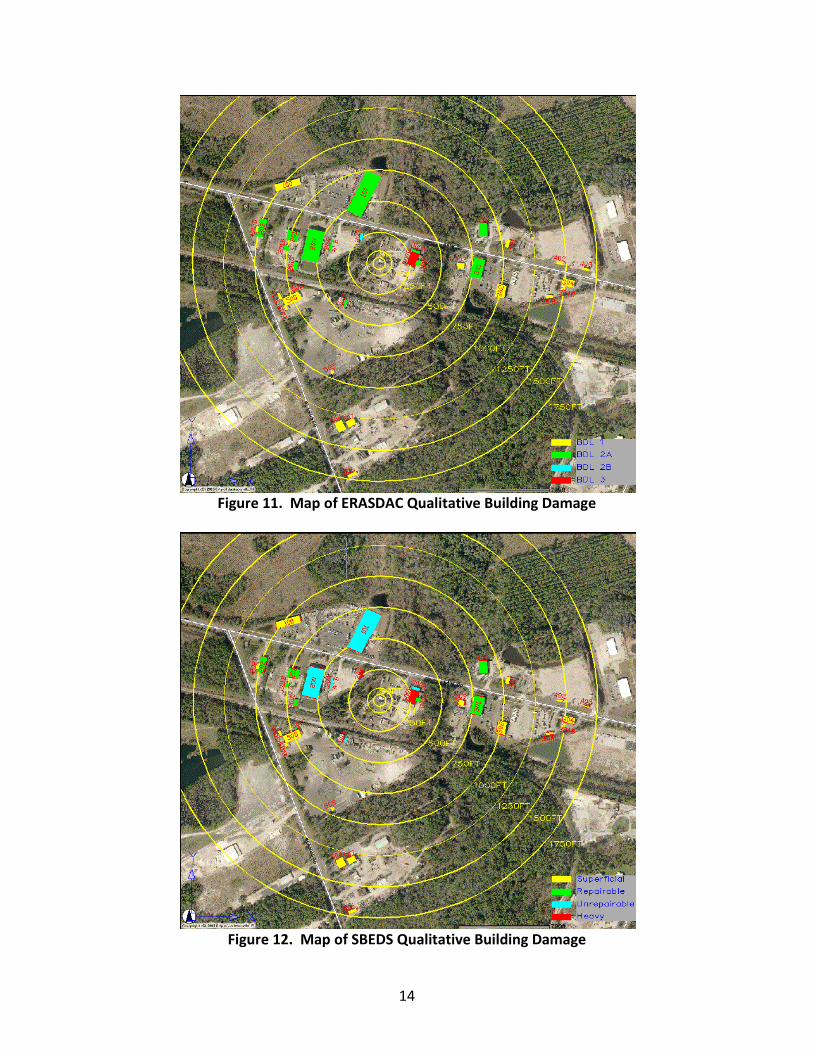
] and from the SDOF Blast Effects Design Spreadsheet (SBEDS)[ ] computer program. Building damage descriptions for both ERASDAC and SBEDS are given in Table 5 and Table 6, respectively. The approach for defining building damage used by the two programs differs. SBEDS bases the overall building damage levels on the worst damaged component in the given building. No distinction is given to component location (i.e. reflected versus side-on); however, damage to primary members is weighted more heavily in determining the overall building damage than damage to secondary members. ERASDAC’s building damage descriptions are based on a component damage matrix consisting of reflected wall component damage, side-on wall component damage and roof component damage. The latter approach could be more representative of damage to the overall structural system, while SBEDS’ approach may be indicative of localized damage. Building damage levels were assigned to each building based on observed and measured damage and are summarized in Table 7. A graphical map showing ERASCAC and SBEDS qualitative building damage levels is given in Figure 11 and Figure 12, respectively. Side walls and back walls which were significantly deformed outward due to blast loads entering the building envelope through large roll-up doors were not considered in evaluating building damage levels. This is because the methodologies utilized are for assessing buildings subjected to external blast loading. Inspection of Table 7 shows that
6 Oswald, Charles J. “Vulnerability Model for Occupants of Blast Damaged Buildings”, 34th Annual Loss Prevention Symposium, Session 3, November 6, 1999.
12
the potential exists to cause structural damage well beyond K40 separation. Two large pre-engineered warehouses (Buildings 101 and 200) located at K50 were condemned as a result of the explosion.
Table 5. ERASDAC Building Damage Level Description[6] Building Damage
Level Damage Description
1 Onset of visible damage to reflected wall of building. 2.0 (2A) Reflected wall components sustain permanent damage requiring replacement, other walls
and roof have visible damage that is generally repairable. 2.5 (2B) Reflected wall components are collapsed or very severely damaged. Other walls and roof
have permanent damage requiring replacement. 3 Reflected wall has collapsed. Other walls and roof have substantial plastic deformation that
may be approaching incipient collapse. 4 Complete failure of the building roof and substantial area of walls.
Table 6. SBEDS Building Damage Level Description[5]
Building Damage Level Damage Description Superficial Damage No permanent deformations. The facility is immediately operable. Repairable Damage Space in and around damaged area can be used and is fully functional after
cleanup and repairs. Unrepairable Damage Progressive collapse will not occur. Space in and around the damaged area is
unusable. Heavy Damage Onset of structural collapse. Progressive collapse is unlikely. Space in and
around damaged area is unusable. Severe Damage Progressive collapse likely. Space in and around damaged area is unusable.
13
Table 7. Summary of Observed Building Damage Levels Building # Standoff K-factor ERASDAC BDL SBEDS BDL
100 970 ft. 86 1* Superficial* 101 570 ft. 51 2A* Unrepairable* 200 550 ft 49 2A* Unrepairable* 201 730 ft. 65 2A Repairable
201B 760 ft. 67 2A Repairable 201C 670 ft. 60 2A Repairable 202 990 ft. 88 2A Repairable
202B 1,020 ft. 91 1 Superficial 203 260 ft. 23 2B Heavy
204A 410 ft. 36 2A Unrepairable 204B 420 ft. 37 2A Unrepairable 300A 310 ft. 27 2A Unrepairable 300B 280 ft. 25 3 Heavy 300C 310 ft. 28 2A Repairable 301 790 ft. 70 2A Repairable 302 1,000 ft. 89 1 Superficial 303 660 ft. 58 1 Superficial 304 1,530 ft. 136 1 Superficial
304B 1,480 ft. 132 1 Superficial 304C 1, 390 ft 124 1 Superficial 400 880 ft. 78 2A Repairable 401 1,040 ft. 93 1 Superficial 402 1, 450 ft. 129 1 Superficial 403 1,660 ft. 148 1 Superficial 500 760 ft. 67 1* Superficial*
501A 840 ft. 75 1 Superficial 501B 830 ft. 74 1 Superficial 501C 710 ft. 63 2A Repairable 502 420 ft. 37 2A Unrepairable 504 1,340 ft. 119 1 Superficial 505 950 ft. 85 1 Superficial 506 1,700 ft. 152 1 Superficial 507 1,300 ft. 116 1 Superficial
1. *Back and/or side walls sustained damage from internal load penetrating the building though open roll-up doors.
2. Note: Standoff distance were measured to the center of the building roof, not to the nearest point in the building as would typically be performed for quantity-distance relationships
14
Figure 11. Map of ERASDAC Qualitative Building Damage
Figure 12. Map of SBEDS Qualitative Building Damage
15
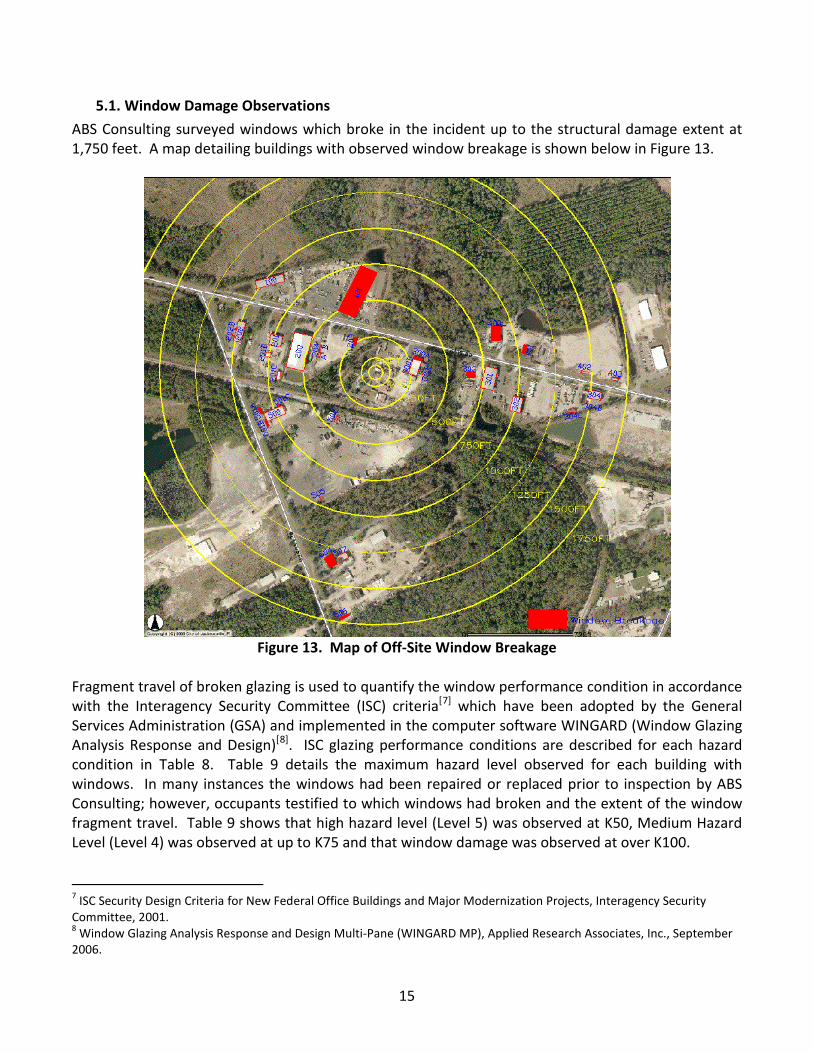
5.1. Window Damage Observations ABS Consulting surveyed windows which broke in the incident up to the structural damage extent at 1,750 feet. A map detailing buildings with observed window breakage is shown below in Figure 13.
Figure 13. Map of Off-Site Window Breakage
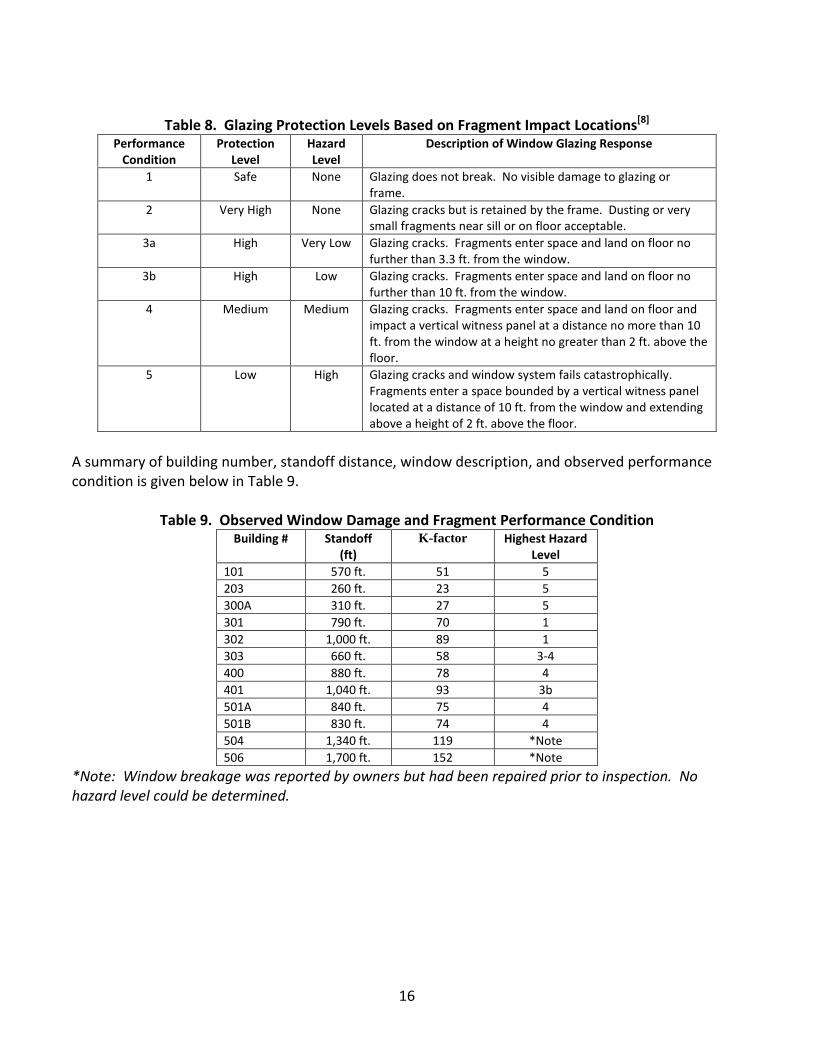
Fragment travel of broken glazing is used to quantify the window performance condition in accordance with the Interagency Security Committee (ISC) criteria[7] which have been adopted by the General Services Administration (GSA) and implemented in the computer software WINGARD (Window Glazing Analysis Response and Design)[8
Table 8
]. ISC glazing performance conditions are described for each hazard condition in . Table 9 details the maximum hazard level observed for each building with windows. In many instances the windows had been repaired or replaced prior to inspection by ABS Consulting; however, occupants testified to which windows had broken and the extent of the window fragment travel. Table 9 shows that high hazard level (Level 5) was observed at K50, Medium Hazard Level (Level 4) was observed at up to K75 and that window damage was observed at over K100. 7 ISC Security Design Criteria for New Federal Office Buildings and Major Modernization Projects, Interagency Security Committee, 2001. 8 Window Glazing Analysis Response and Design Multi-Pane (WINGARD MP), Applied Research Associates, Inc., September 2006.
16
Table 8. Glazing Protection Levels Based on Fragment Impact Locations[8]
Performance Condition
Protection Level
Hazard Level
Description of Window Glazing Response
1 Safe None Glazing does not break. No visible damage to glazing or frame.
2 Very High None Glazing cracks but is retained by the frame. Dusting or very small fragments near sill or on floor acceptable.
3a High Very Low Glazing cracks. Fragments enter space and land on floor no further than 3.3 ft. from the window.
3b High Low Glazing cracks. Fragments enter space and land on floor no further than 10 ft. from the window.
4 Medium Medium Glazing cracks. Fragments enter space and land on floor and impact a vertical witness panel at a distance no more than 10 ft. from the window at a height no greater than 2 ft. above the floor.
5 Low High Glazing cracks and window system fails catastrophically. Fragments enter a space bounded by a vertical witness panel located at a distance of 10 ft. from the window and extending above a height of 2 ft. above the floor.
A summary of building number, standoff distance, window description, and observed performance condition is given below in Table 9.
Table 9. Observed Window Damage and Fragment Performance Condition
*Note: Window breakage was reported by owners but had been repaired prior to inspection. No hazard level could be determined.
Building # Standoff (ft)
K-factor Highest Hazard Level
101 570 ft. 51 5 203 260 ft. 23 5 300A 310 ft. 27 5 301 790 ft. 70 1 302 1,000 ft. 89 1 303 660 ft. 58 3-4 400 880 ft. 78 4 401 1,040 ft. 93 3b 501A 840 ft. 75 4 501B 830 ft. 74 4 504 1,340 ft. 119 *Note 506 1,700 ft. 152 *Note
17
6. Conclusion ABSG Consulting Inc. (ABS Consulting) was contracted by the U.S. Chemical Safety Board (CSB) to 1) conduct a site survey to document blast related structural damage, 2) perform analysis to estimate explosion energy, and 3) develop overpressure and impulse contour maps for the T2 Laboratories Inc. in Jacksonville, Florida. The explosion energy was determined to be equivalent to approximately 1,400 lbTNT. The following observations were made pertaining to building damage and window hazards:
1. K50 a. Two pre-engineered metal buildings were condemned b. High Hazard glass fragment throw (Level 5)
2. K75 a. Repairable damage to pre-engineered buildings b. Medium Hazard fragment throw (Level 4)
In addition window breakage and injury were recorded at distances of K75 which is well in excess of K40 or incremental IBD. The T2 explosion shows that the potential exists to cause damage to structures and businesses as well as injury well outside of K40 separation and highlights the need to continue to investigate explosions and understand their consequences.
T2 Laboratories Explosion Damage Assessment
Presented by:Ben F. Harrison, P.E.
Co Authors:Sanaa Alaoui, P.E. – ABS Consulting
Robert Hall, P.E. – Chemical Safety Board
Background• T2 Laboratories Explosion
– December 19, 2007 at 1:30pm
Explosion Source
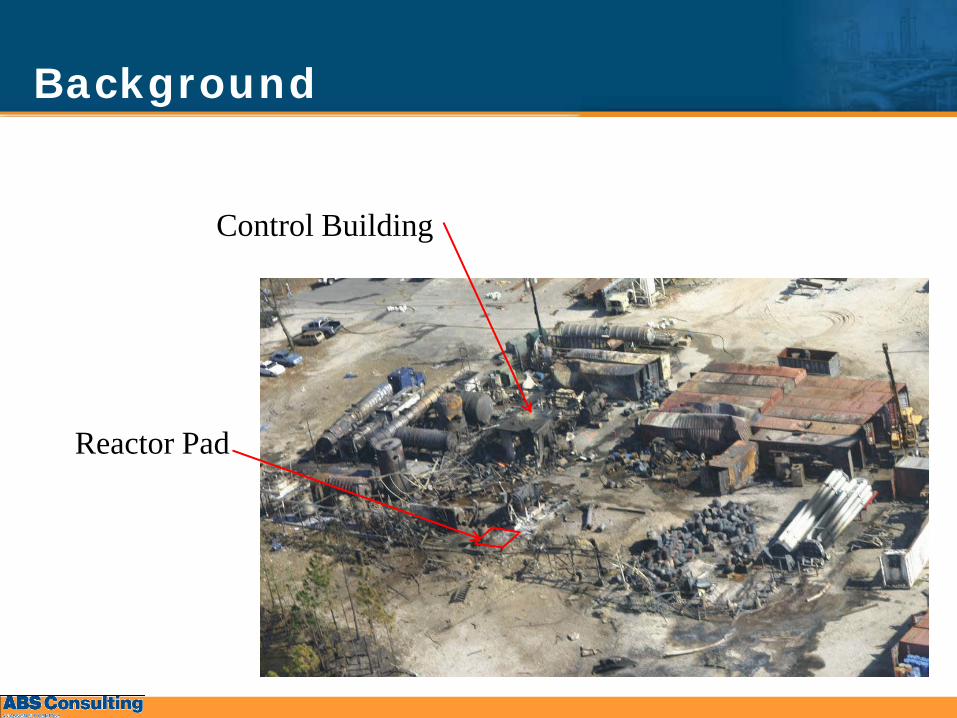
Background
Control Building
Reactor Pad
Investigation• Support CSB Root Cause Investigation
– Survey of Structural Damage– Perform an Estimate of Explosion Energy– Develop Overpressure and Impulse Contours
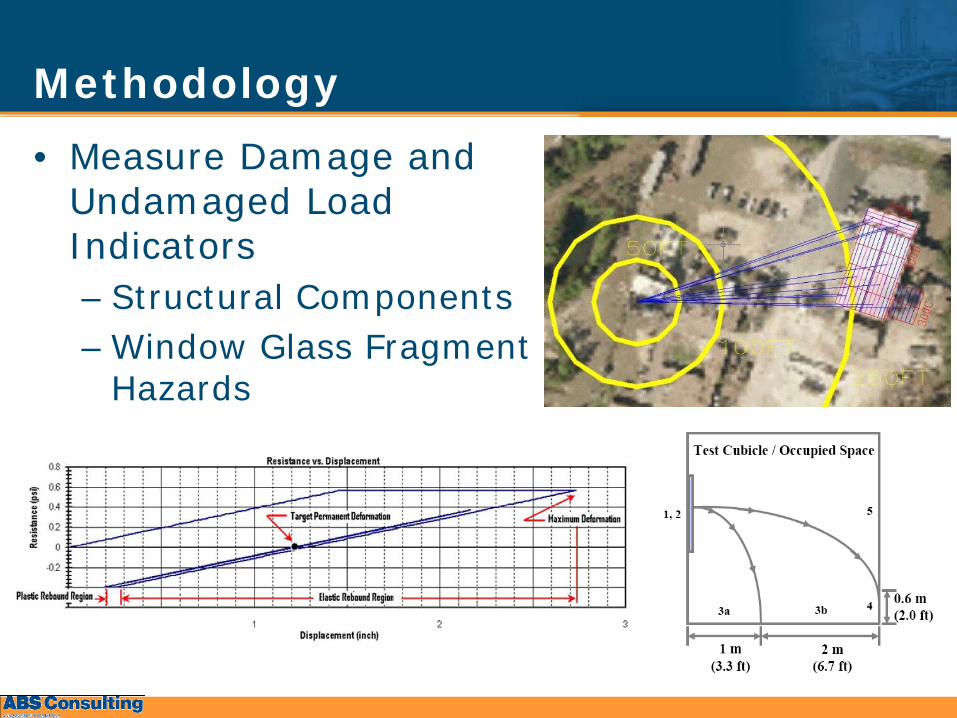
Methodology• Measure Damage and
Undamaged Load Indicators– Structural Components– Window Glass Fragment
Hazards
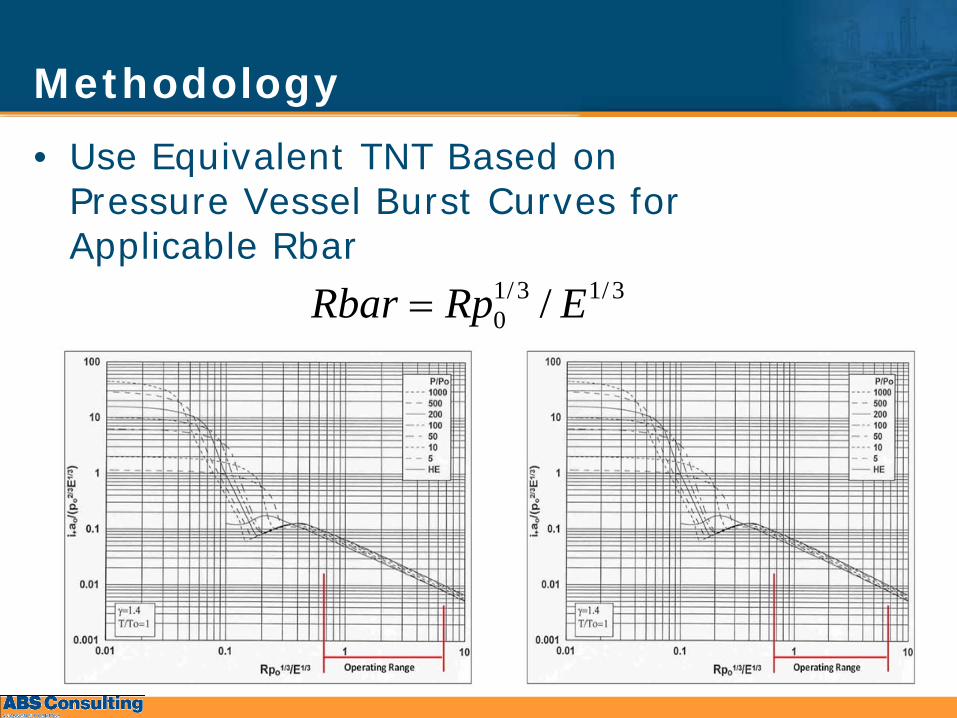
Methodology• Use Equivalent TNT Based on
Pressure Vessel Burst Curves for Applicable Rbar
3/13/10 / ERpRbar =
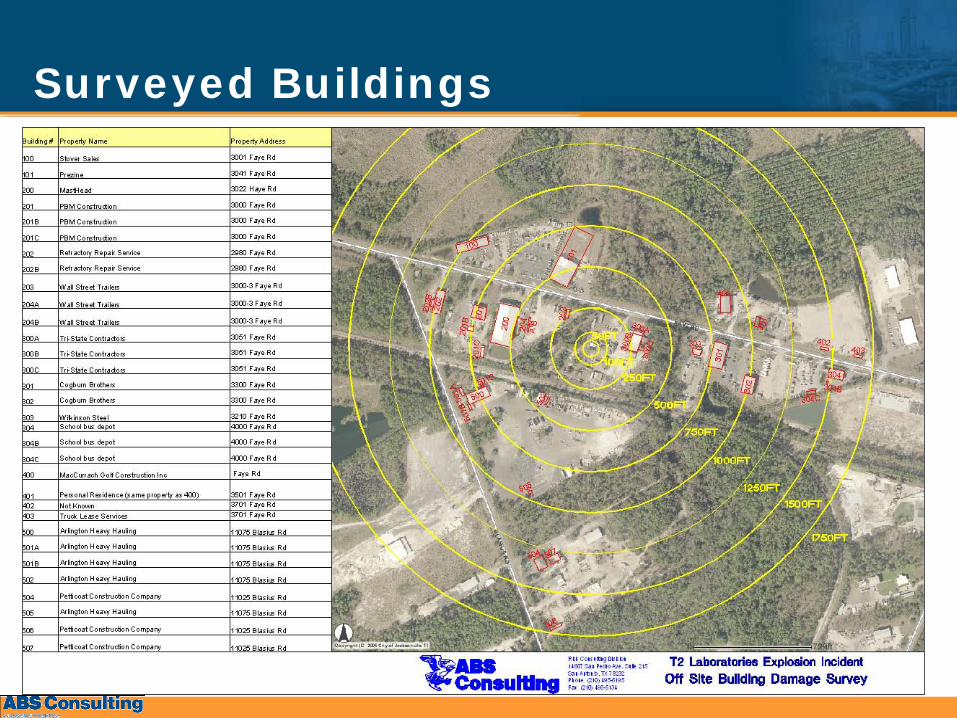
Surveyed Buildings
Estimated Yield – 1,400 lbTNT
• Structural Damage Indicators – ~1,300 lbTNT
• Window Fragment Hazards – ~1,500 lbTNT
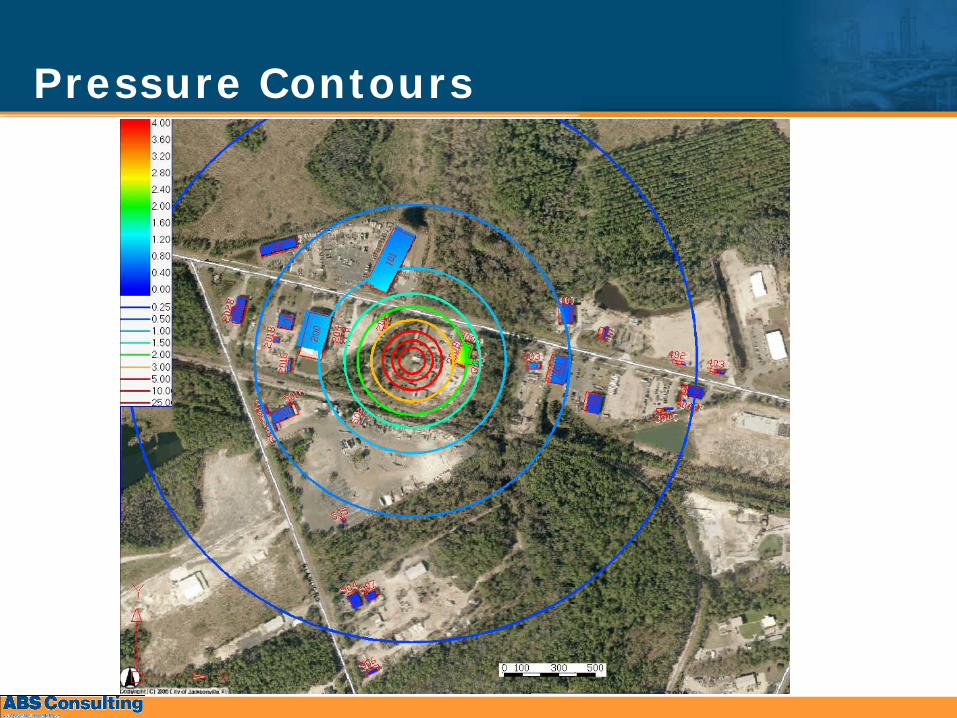
Pressure Contours
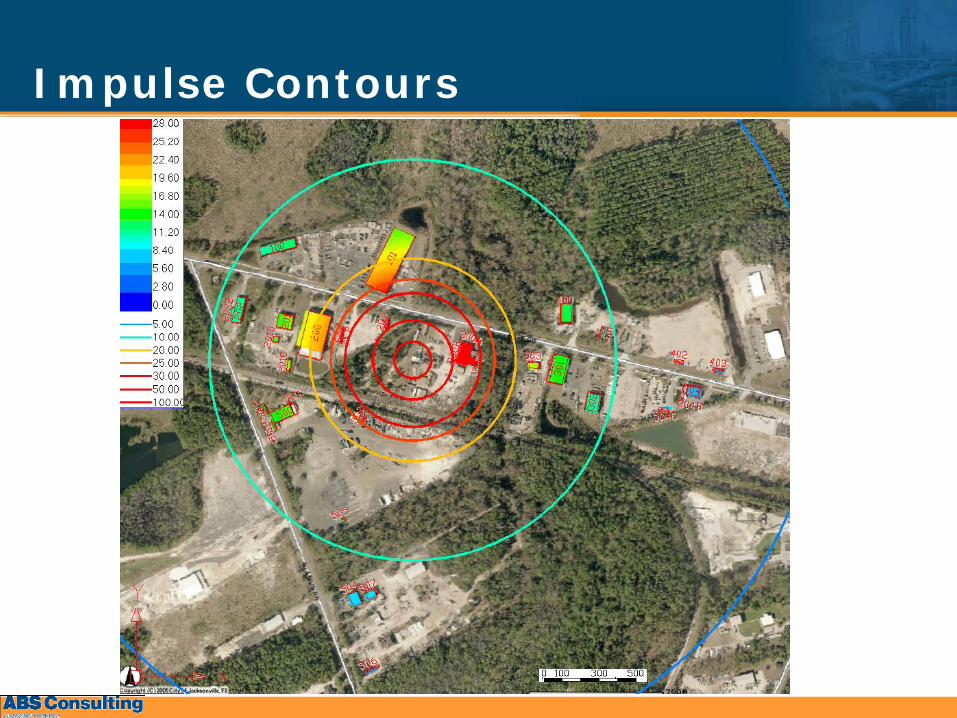
Impulse Contours
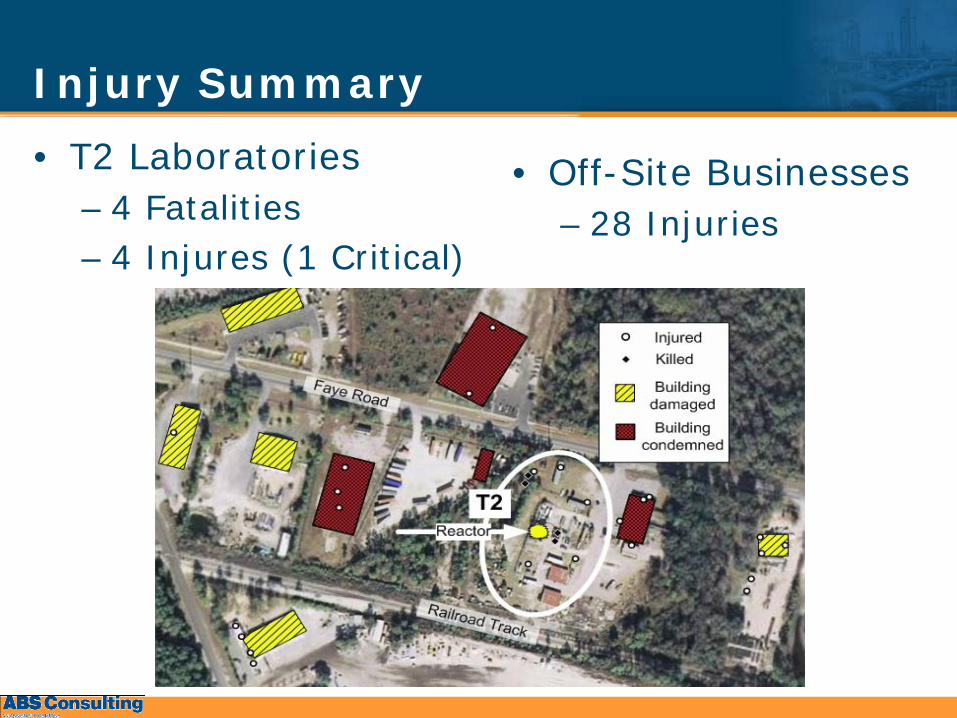
Injury Summary• T2 Laboratories
– 4 Fatalities– 4 Injures (1 Critical)
• Off-Site Businesses– 28 Injuries
Personal Injury StatisticsBusiness Name K-factor Number of
Employees Present
Number of Non-Fatally
Injured
Number of Fatally Injured
T2 Laboratories 0 8 4 4Linden Bulk Transfer (Driver)
0 1 1 0
TriState Contractors K25 13 4 0Wall Street Trucking* K25 0Prezine, LLC K50 18 6 0Masthead Hose K50 7 3 0Wilkinson Steel Co. K58 16 8 0Arlington Hauling K60 – K75 17 4 0PBM Constructors K65 3 0 0Cogburn Brothers K70 12 0 0MacCurrach Golf K78 4 0 0Stovers Trucking K86 20 0 0Refractory Repair K88 3 1 0Petticoat Contracting K120 13 0 0First Student Bus K136 7 0 0Milton J Wood 25 1 0Westside Electric 23 0 0Totals 190 32 4
Notes: *Employees left early due to holiday
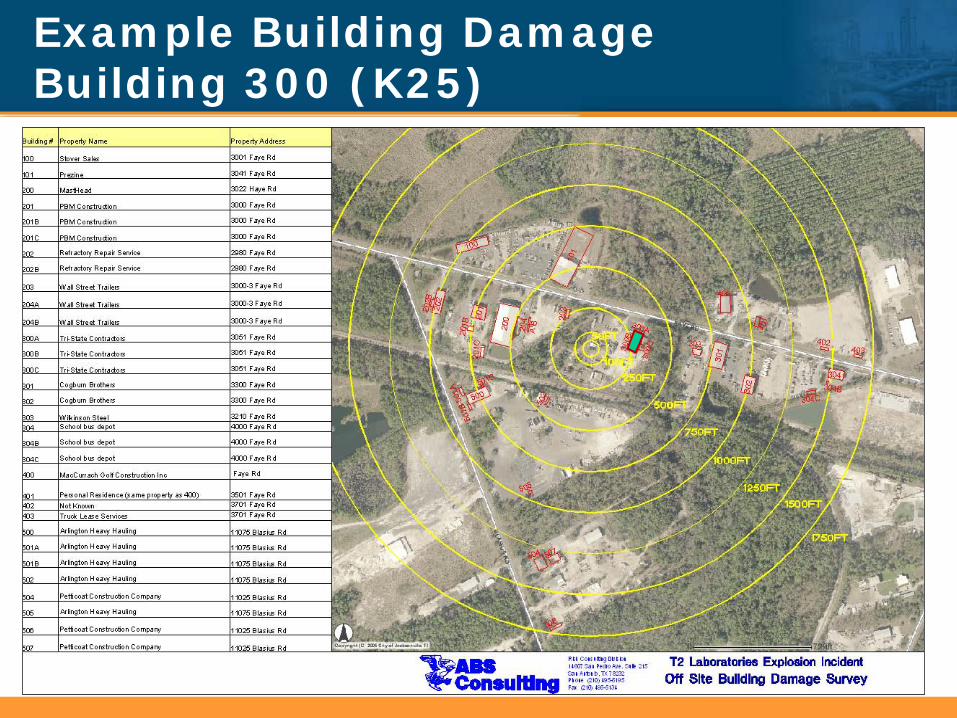
Example Building DamageBuilding 300 (K25)
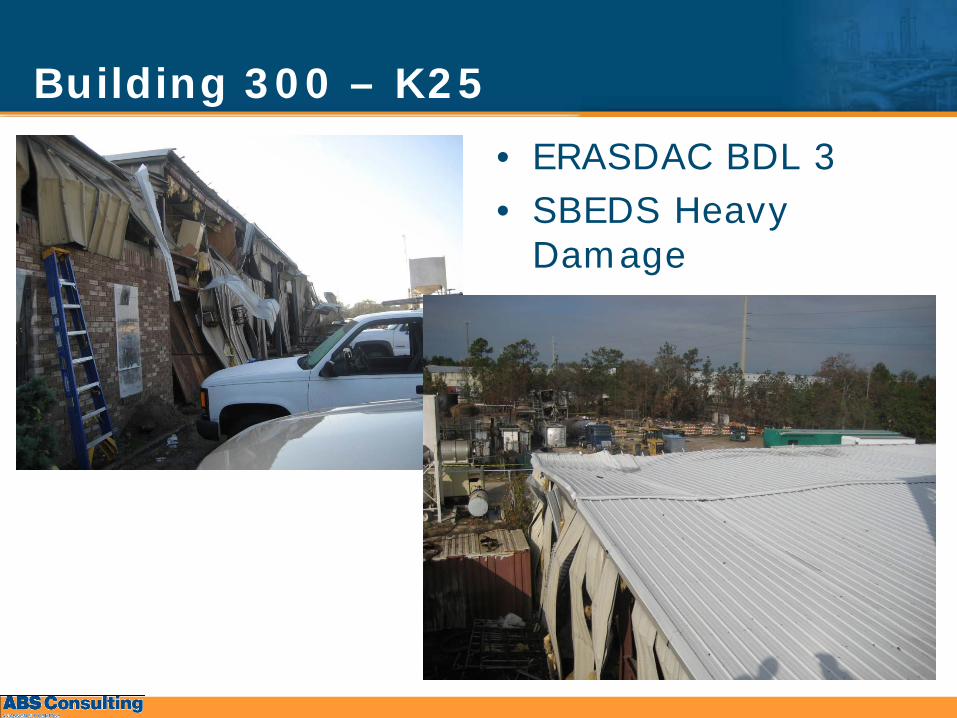
Building 300 – K25• ERASDAC BDL 3• SBEDS Heavy
Damage
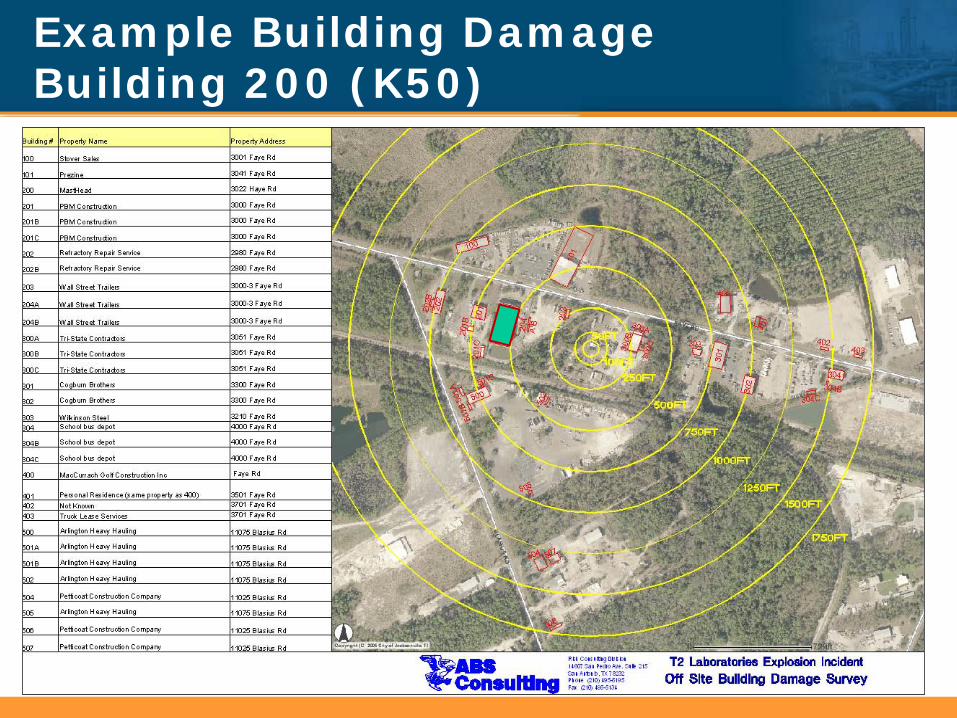
Example Building DamageBuilding 200 (K50)
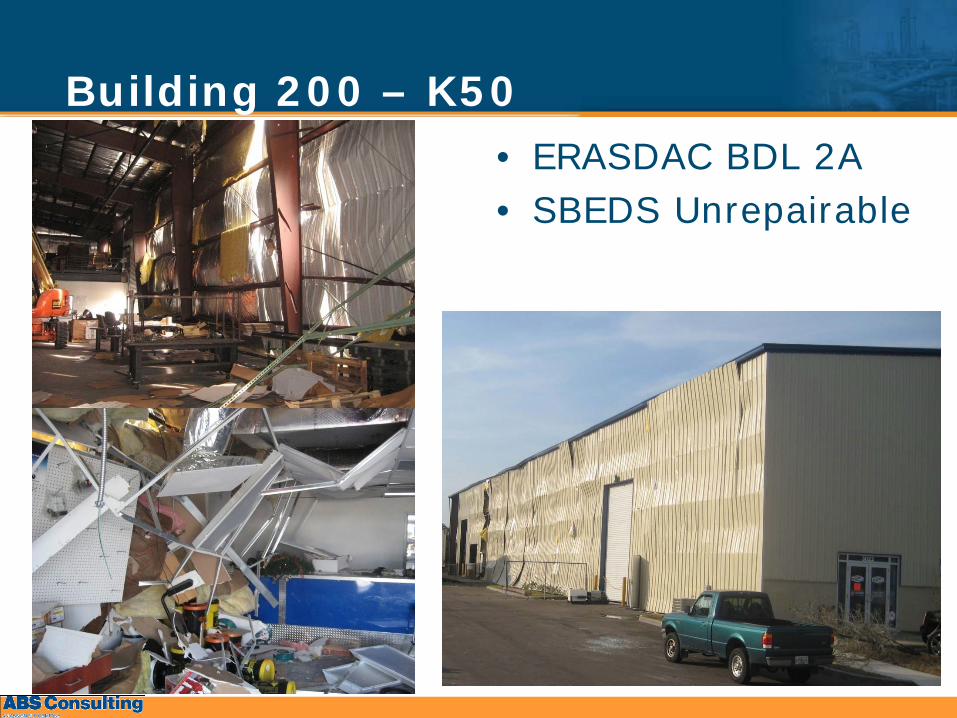
Building 200 – K50• ERASDAC BDL 2A• SBEDS Unrepairable
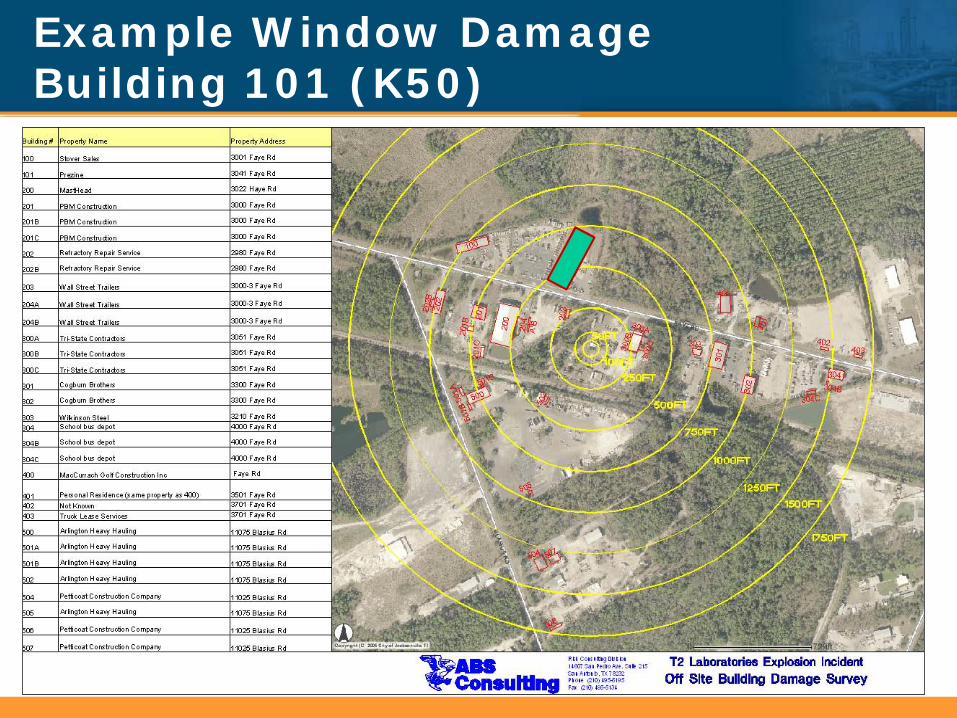
Example Window DamageBuilding 101 (K50)
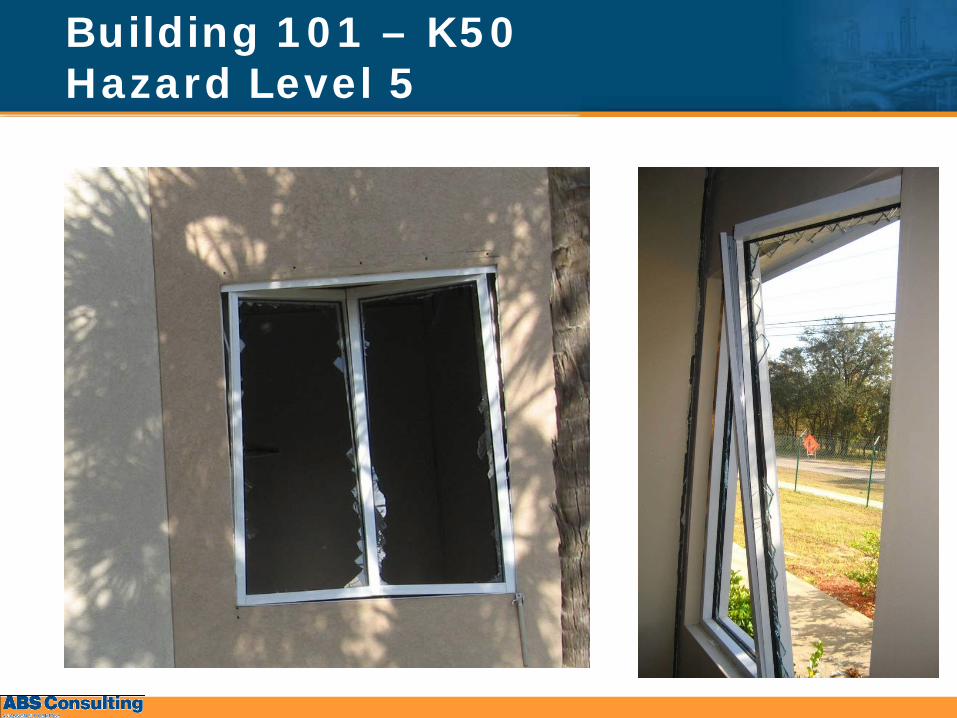
Building 101 – K50Hazard Level 5
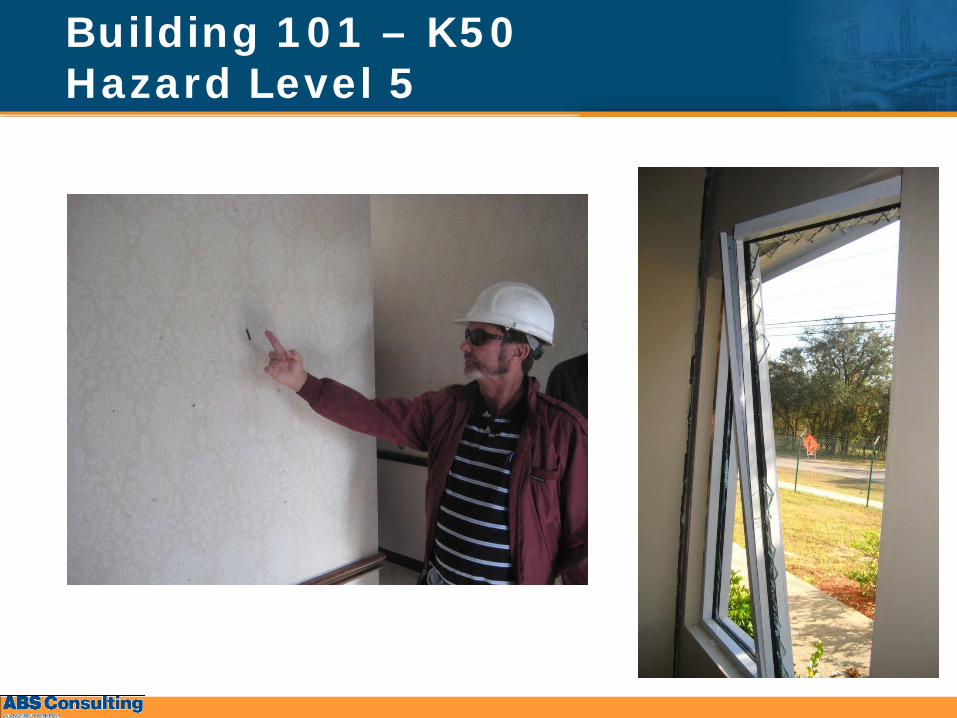
Building 101 – K50Hazard Level 5
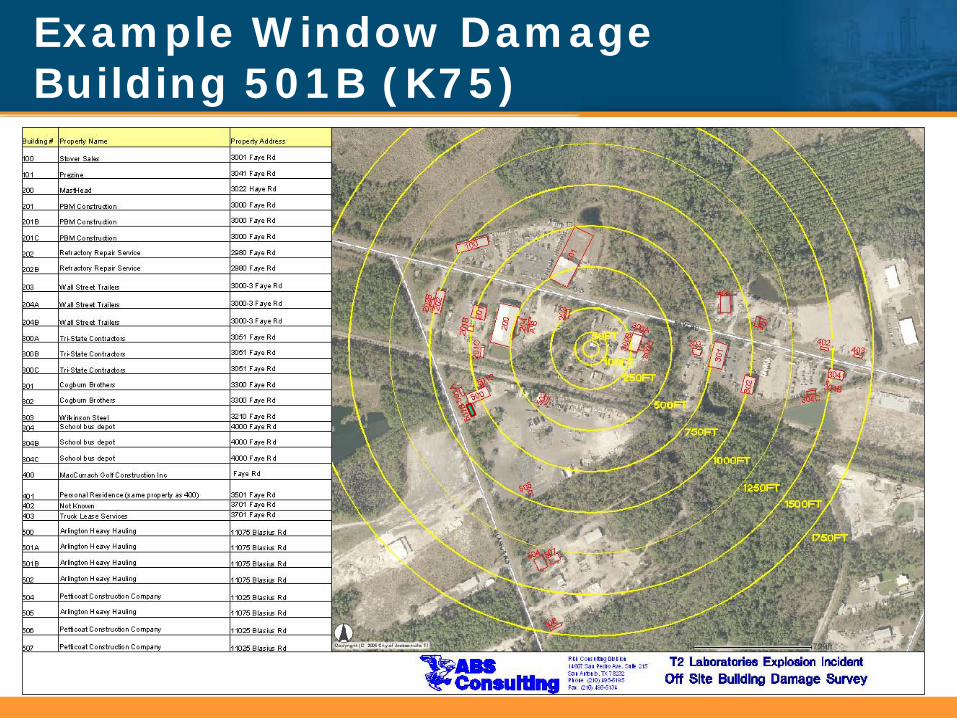
Example Window DamageBuilding 501B (K75)
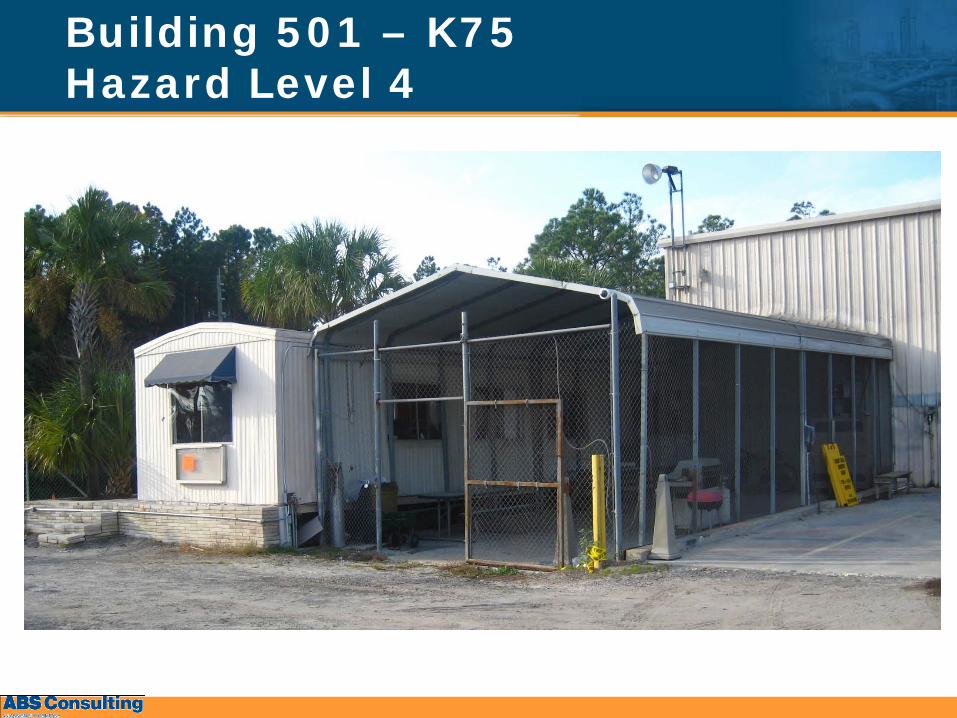
Building 501 – K75Hazard Level 4
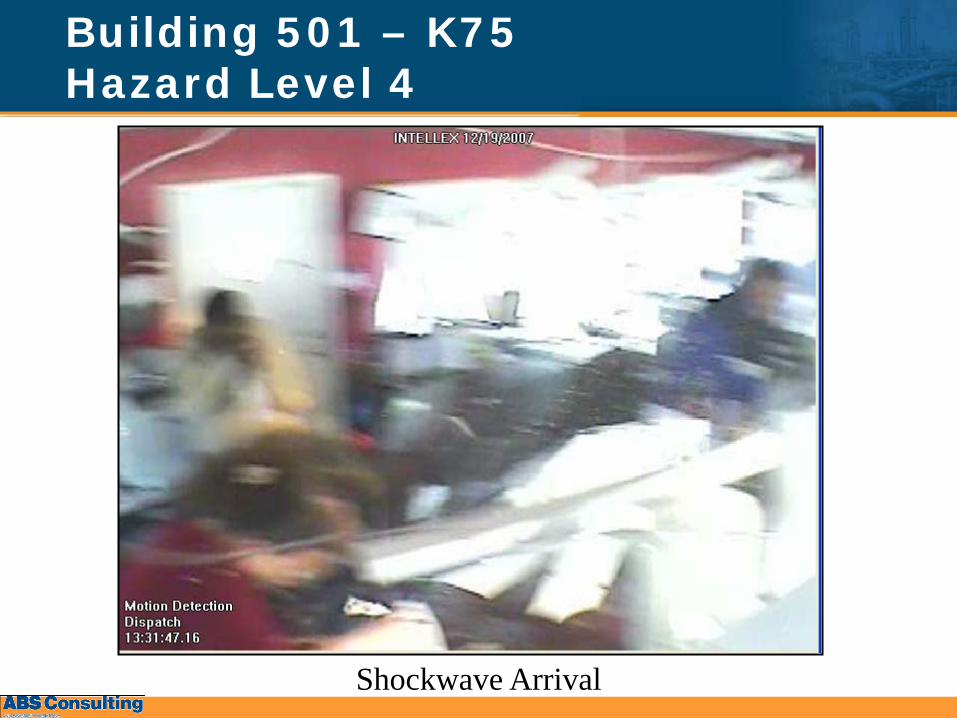
Shockwave Arrival
Building 501 – K75Hazard Level 4
Observations• K50
– Two Buildings Condemned– High Hazard glass fragment throw
• K75– Repairable Damage to Pre-Engineered
Buildings– Medium Hazard Fragment Throw
Conclusion• Window breakage and injury were recorded
at distances of K75 which is well in excess of K40 or incremental IBD.
• Potential exists to cause damage to structures and businesses as well as cause injury well outside of K40
• The T2 incident highlights the need to continue to investigate explosions and understand their consequences.