Embed Size (px)
Citation preview
[email protected] | www.bibby-scientific.com +44(01785) 810433 1
Technical Note T08-004A
Plus-Minus Scoring Analysis
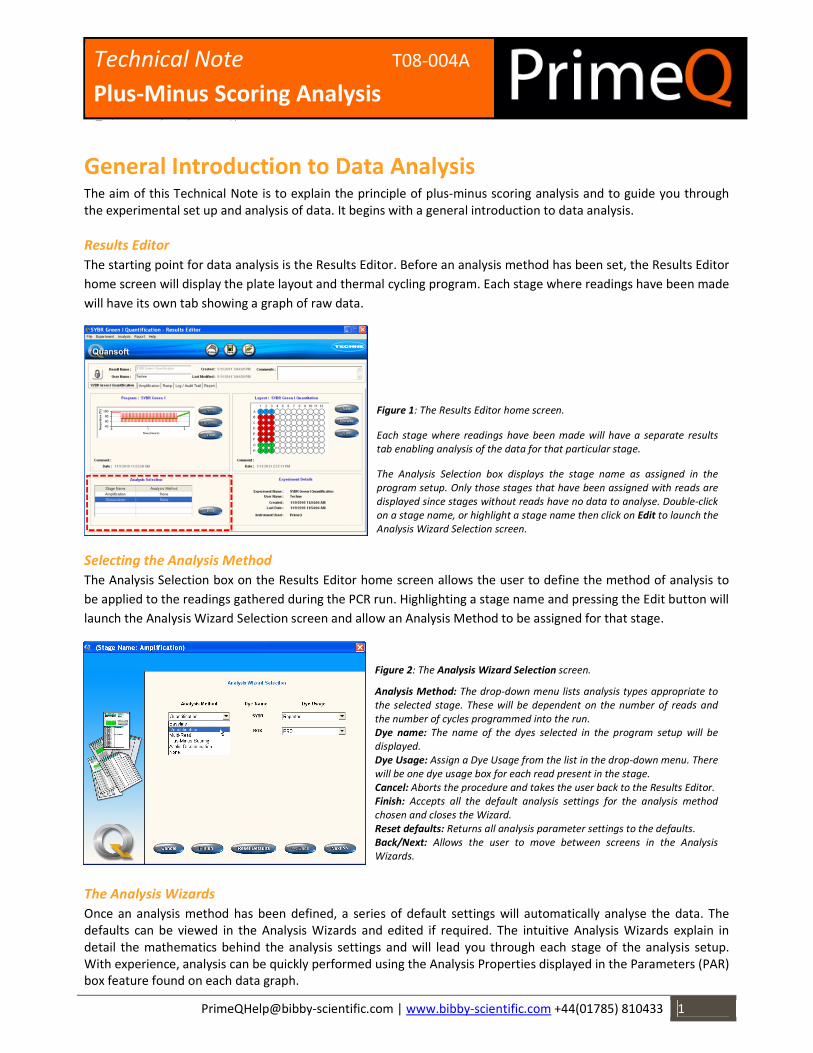
General Introduction to Data Analysis The aim of this Technical Note is to explain the principle of plus-minus scoring analysis and to guide you through
the experimental set up and analysis of data. It begins with a general introduction to data analysis.
Results Editor
The starting point for data analysis is the Results Editor. Before an analysis method has been set, the Results Editor
home screen will display the plate layout and thermal cycling program. Each stage where readings have been made
will have its own tab showing a graph of raw data.
Selecting the Analysis Method
The Analysis Selection box on the Results Editor home screen allows the user to define the method of analysis to
be applied to the readings gathered during the PCR run. Highlighting a stage name and pressing the Edit button will
launch the Analysis Wizard Selection screen and allow an Analysis Method to be assigned for that stage.
The Analysis Wizards
Once an analysis method has been defined, a series of default settings will automatically analyse the data. The
defaults can be viewed in the Analysis Wizards and edited if required. The intuitive Analysis Wizards explain in
detail the mathematics behind the analysis settings and will lead you through each stage of the analysis setup.
With experience, analysis can be quickly performed using the Analysis Properties displayed in the Parameters (PAR)
box feature found on each data graph.
Figure 1: The Results Editor home screen.
Each stage where readings have been made will have a separate results
tab enabling analysis of the data for that particular stage.
The Analysis Selection box displays the stage name as assigned in the
program setup. Only those stages that have been assigned with reads are
displayed since stages without reads have no data to analyse. Double-click
on a stage name, or highlight a stage name then click on Edit to launch the
Analysis Wizard Selection screen.
Figure 2: The Analysis Wizard Selection screen.
Analysis Method: The drop-down menu lists analysis types appropriate to
the selected stage. These will be dependent on the number of reads and
the number of cycles programmed into the run.
Dye name: The name of the dyes selected in the program setup will be
displayed.
Dye Usage: Assign a Dye Usage from the list in the drop-down menu. There
will be one dye usage box for each read present in the stage.
Cancel: Aborts the procedure and takes the user back to the Results Editor.
Finish: Accepts all the default analysis settings for the analysis method
chosen and closes the Wizard.
Reset defaults: Returns all analysis parameter settings to the defaults.
Back/Next: Allows the user to move between screens in the Analysis
Wizards.
[email protected] |www.bibby-scientific.com +44(01785) 810433 2
T08-004A: Plus-Minus Scoring Analysis
Analysis Method Options
The following analysis options are available in Quansoft:
Baseline This simple analysis method allows for correction of differences in background fluorescence. It is also incorporated
into many of the other analysis methods.
Quantification
Quantification analysis is used to determine the absolute or relative quantity of a target DNA template in a given
test sample by measuring the cycle-to-cycle change in the fluorescent signal. The fluorescent signal increases
proportionately to the amount of amplified DNA and quantification is performed either by comparison of the
fluorescence of a PCR product of unknown concentration with that of several dilutions of an external standard, or
by comparing the fluorescence of one product relative to another. To be able to make this comparison, the
fluorophore is measured at a point in the amplification where the reaction efficiency can be considered optimal.
This is generally around the cycle at which an increase in fluorescence is first detected.
Dissociation curve
Dissociation curve analysis can add to the information obtained from the PCR. Also known as melting curve
analysis, it measures the temperature at which the DNA strands separate into single strands. This provides a
measurement of the melting temperature or Tm, taken as the point at which 50% of the double stranded DNA
(dsDNA) molecules are dissociated. Using the easy-to-program ‘ramp’ function, PrimeQ will perform a thermal
ramping program that can be used to determine the Tm of the PCR product. This analysis provides the user with
extra confidence in experiments using intercalating dye chemistry for identifying amplification of non-specific
products or contamination.
Plus-minus scoring
This analysis exploits PrimeQ’s fluorescence technology to determine with ease and accuracy the presence or
absence of a PCR product in any given sample. Input data can either be kinetic (where readings are taken
throughout the amplification stage) or end-point (readings taken at the end of the run). The software scores the
samples as positive or negative according to user-defined thresholds.
Allelic discrimination
Users of PrimeQ have the option of this powerful technique capable of detecting single nucleotide differences
(SNPs). It can be used to discriminate between genotypes, mutations and polymorphisms within or between
samples simply by comparing the fluorescence signal obtained using allele-specific, dye-labeled probes.
Multi-read
This is a simple end point analysis method which will report the average fluorescence of a selected number of
readings. It is useful for assays other than PCR, for example fluorescence-based DNA assays, where just the
fluorescence of a sample needs to be measured; in this way PrimeQ can be used as a simple fluorescence plate
reader or fluorimeter.
[email protected] |www.bibby-scientific.com +44(01785) 810433 3
T08-004A: Plus-Minus Scoring Analysis
Analysis method: Plus-Minus Scoring This analysis method is used to record the presence or absence of a PCR product; it is therefore a qualitative rather
than a quantitative analysis method. The input data for the analysis is usually the end-point fluorescence (a few
readings taken at the end of the run – at least two are required). Since it is not strictly necessary to gather
fluorescence data during the amplification cycles, the amplification can be performed in a non-real time thermal
cycler as long as the reaction contains an appropriate fluorescence detection system for the target. The plate can
then be read a few times in PrimeQ to generate the fluorescence data required for the analysis. Note that
consumables appropriate for use in PrimeQ must be used.
Plus-minus assays can be performed with or without an internal positive control (IPC), although its use can prove
helpful to ensure that a failed PCR is not mistaken for a negative result. A no template control (NTC) is used to set
two confidence thresholds above which all unknowns will be scored as positive and below which they will be
scored as negative. Samples between the two threshold values are scored as undetermined. With no user input,
Quansoft will automatically analyse the raw data (or baseline corrected data) to measure the difference in
fluorescence between the unknown samples and NTC.
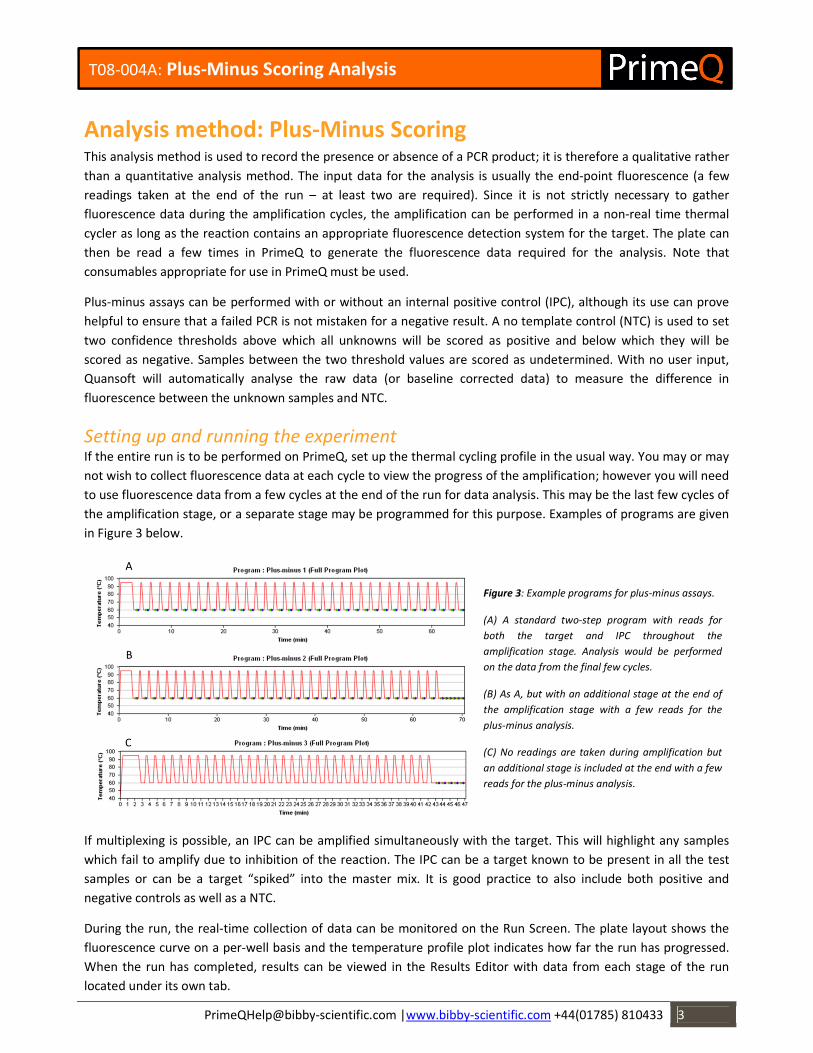
Setting up and running the experiment If the entire run is to be performed on PrimeQ, set up the thermal cycling profile in the usual way. You may or may
not wish to collect fluorescence data at each cycle to view the progress of the amplification; however you will need
to use fluorescence data from a few cycles at the end of the run for data analysis. This may be the last few cycles of
the amplification stage, or a separate stage may be programmed for this purpose. Examples of programs are given
in Figure 3 below.
If multiplexing is possible, an IPC can be amplified simultaneously with the target. This will highlight any samples
which fail to amplify due to inhibition of the reaction. The IPC can be a target known to be present in all the test
samples or can be a target “spiked” into the master mix. It is good practice to also include both positive and
negative controls as well as a NTC.
During the run, the real-time collection of data can be monitored on the Run Screen. The plate layout shows the
fluorescence curve on a per-well basis and the temperature profile plot indicates how far the run has progressed.
When the run has completed, results can be viewed in the Results Editor with data from each stage of the run
located under its own tab.
Figure 3: Example programs for plus-minus assays.
(A) A standard two-step program with reads for
both the target and IPC throughout the
amplification stage. Analysis would be performed
on the data from the final few cycles.
(B) As A, but with an additional stage at the end of
the amplification stage with a few reads for the
plus-minus analysis.
(C) No readings are taken during amplification but
an additional stage is included at the end with a few
reads for the plus-minus analysis.
[email protected] |www.bibby-scientific.com +44(01785) 810433 4
T08-004A: Plus-Minus Scoring Analysis
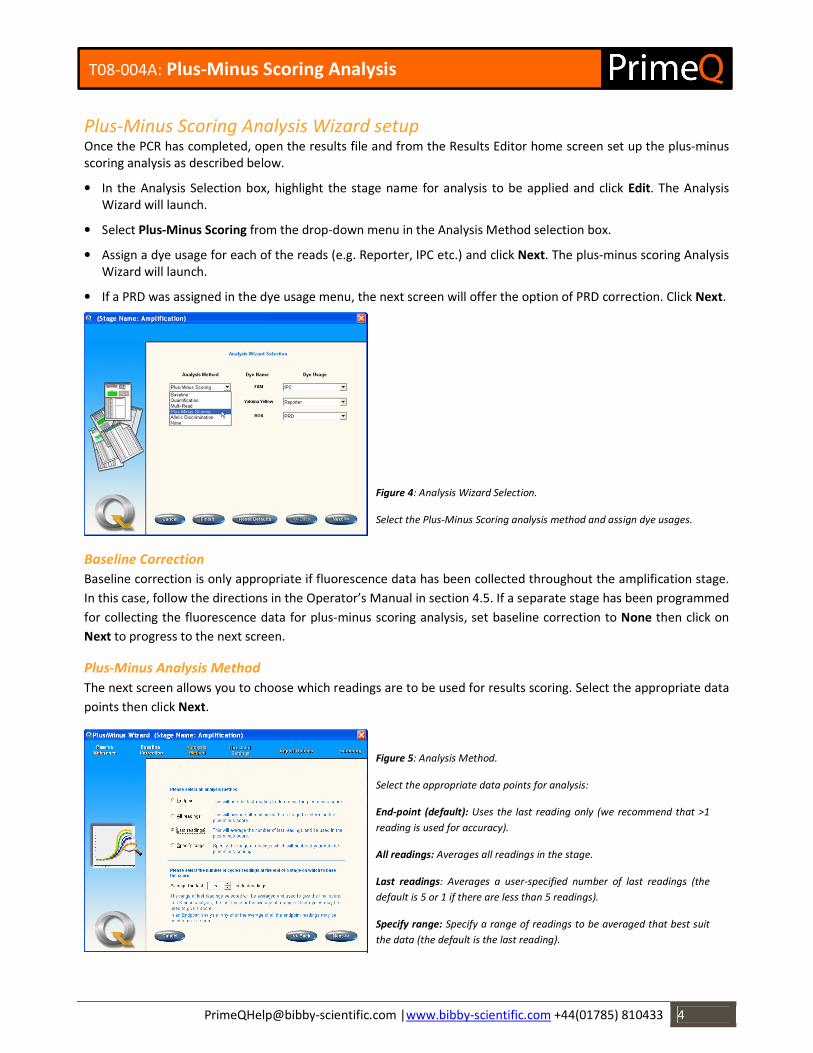
Plus-Minus Scoring Analysis Wizard setup Once the PCR has completed, open the results file and from the Results Editor home screen set up the plus-minus
scoring analysis as described below.
• In the Analysis Selection box, highlight the stage name for analysis to be applied and click Edit. The Analysis
Wizard will launch.
• Select Plus-Minus Scoring from the drop-down menu in the Analysis Method selection box.
• Assign a dye usage for each of the reads (e.g. Reporter, IPC etc.) and click Next. The plus-minus scoring Analysis
Wizard will launch.
• If a PRD was assigned in the dye usage menu, the next screen will offer the option of PRD correction. Click Next.
Baseline Correction
Baseline correction is only appropriate if fluorescence data has been collected throughout the amplification stage.
In this case, follow the directions in the Operator’s Manual in section 4.5. If a separate stage has been programmed
for collecting the fluorescence data for plus-minus scoring analysis, set baseline correction to None then click on
Next to progress to the next screen.
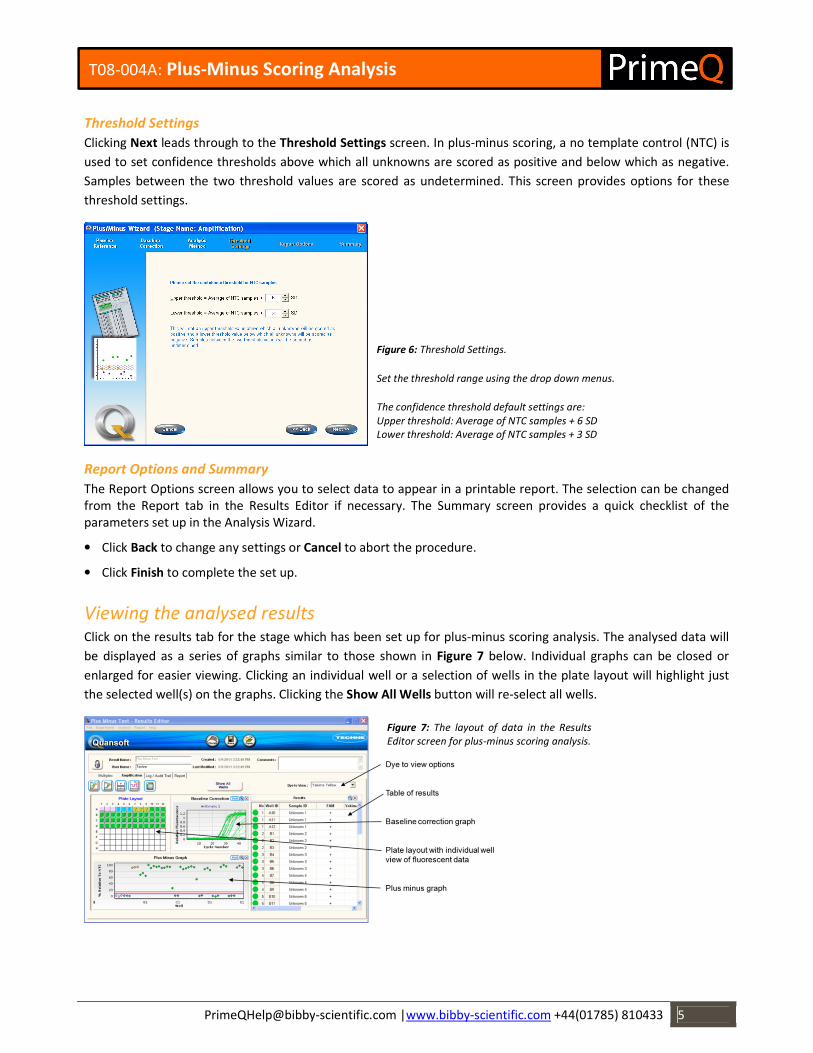
Plus-Minus Analysis Method
The next screen allows you to choose which readings are to be used for results scoring. Select the appropriate data
points then click Next.
Figure 4: Analysis Wizard Selection.
Select the Plus-Minus Scoring analysis method and assign dye usages.
Figure 5: Analysis Method.
Select the appropriate data points for analysis:
End-point (default): Uses the last reading only (we recommend that >1
reading is used for accuracy).
All readings: Averages all readings in the stage.
Last readings: Averages a user-specified number of last readings (the
default is 5 or 1 if there are less than 5 readings).
Specify range: Specify a range of readings to be averaged that best suit
the data (the default is the last reading).
[email protected] |www.bibby-scientific.com +44(01785) 810433 5
T08-004A: Plus-Minus Scoring Analysis
Threshold Settings
Clicking Next leads through to the Threshold Settings screen. In plus-minus scoring, a no template control (NTC) is
used to set confidence thresholds above which all unknowns are scored as positive and below which as negative.
Samples between the two threshold values are scored as undetermined. This screen provides options for these
threshold settings.
Report Options and Summary
The Report Options screen allows you to select data to appear in a printable report. The selection can be changed
from the Report tab in the Results Editor if necessary. The Summary screen provides a quick checklist of the
parameters set up in the Analysis Wizard.
• Click Back to change any settings or Cancel to abort the procedure.
• Click Finish to complete the set up.
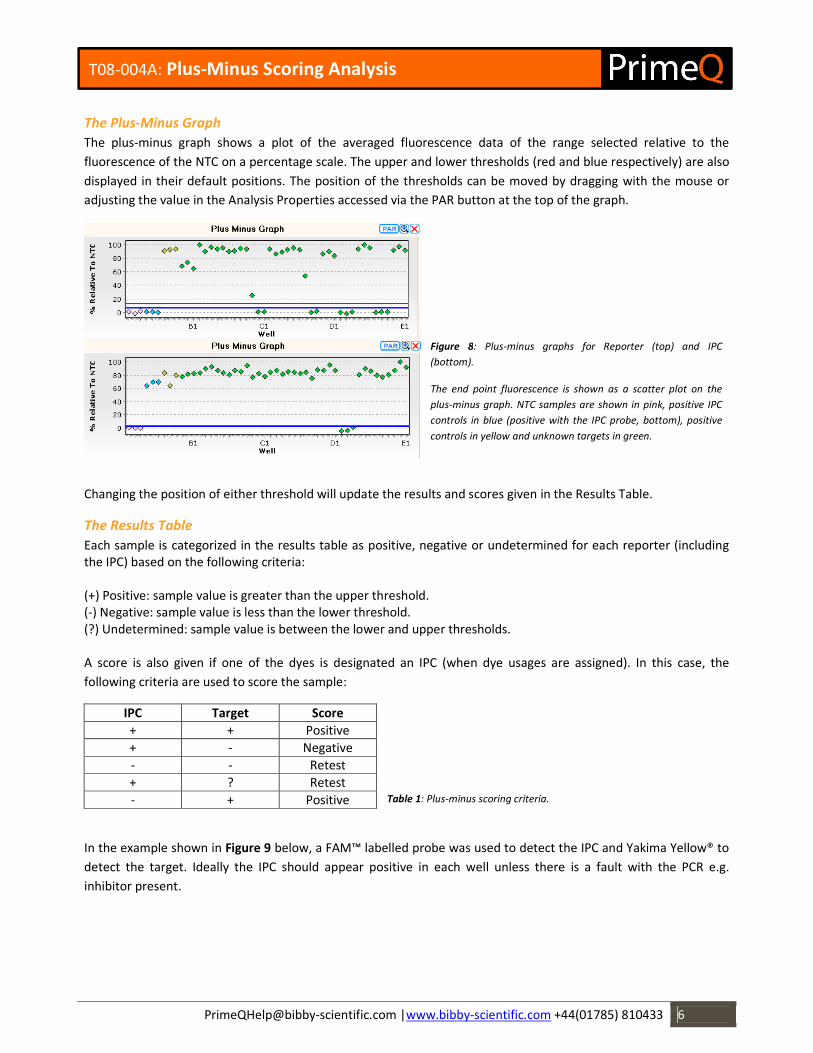
Viewing the analysed results Click on the results tab for the stage which has been set up for plus-minus scoring analysis. The analysed data will
be displayed as a series of graphs similar to those shown in Figure 7 below. Individual graphs can be closed or
enlarged for easier viewing. Clicking an individual well or a selection of wells in the plate layout will highlight just
the selected well(s) on the graphs. Clicking the Show All Wells button will re-select all wells.
Figure 7: The layout of data in the Results
Editor screen for plus-minus scoring analysis.
Figure 6: Threshold Settings.
Set the threshold range using the drop down menus.
The confidence threshold default settings are:
Upper threshold: Average of NTC samples + 6 SD
Lower threshold: Average of NTC samples + 3 SD
[email protected] |www.bibby-scientific.com +44(01785) 810433 6
T08-004A: Plus-Minus Scoring Analysis
The Plus-Minus Graph
The plus-minus graph shows a plot of the averaged fluorescence data of the range selected relative to the
fluorescence of the NTC on a percentage scale. The upper and lower thresholds (red and blue respectively) are also
displayed in their default positions. The position of the thresholds can be moved by dragging with the mouse or
adjusting the value in the Analysis Properties accessed via the PAR button at the top of the graph.
Changing the position of either threshold will update the results and scores given in the Results Table.
The Results Table
Each sample is categorized in the results table as positive, negative or undetermined for each reporter (including
the IPC) based on the following criteria:
(+) Positive: sample value is greater than the upper threshold.
(-) Negative: sample value is less than the lower threshold.
(?) Undetermined: sample value is between the lower and upper thresholds.
A score is also given if one of the dyes is designated an IPC (when dye usages are assigned). In this case, the
following criteria are used to score the sample:
IPC Target Score
+ + Positive
+ - Negative
- - Retest
+ ? Retest
- + Positive
In the example shown in Figure 9 below, a FAM™ labelled probe was used to detect the IPC and Yakima Yellow® to
detect the target. Ideally the IPC should appear positive in each well unless there is a fault with the PCR e.g.
inhibitor present.
Figure 8: Plus-minus graphs for Reporter (top) and IPC
(bottom).
The end point fluorescence is shown as a scatter plot on the
plus-minus graph. NTC samples are shown in pink, positive IPC
controls in blue (positive with the IPC probe, bottom), positive
controls in yellow and unknown targets in green.
Table 1: Plus-minus scoring criteria.
[email protected] |www.bibby-scientific.com +44(01785) 810433 7
T08-004A: Plus-Minus Scoring Analysis
Viewing and Changing the Parameters
The analysis parameters as set up in the plus-minus scoring Wizard can be changed at any time and can be easily
accessed via the PAR box on the plus-minus graph.
PrimeQ Report
If a printed report of the analysed data is required, open the Report tab of the Results Editor to view the plus-
minus scoring analysis report. To change any of the report contents, click on the Report Options icon to open up
the Report Options box. Tabs will display the report options relevant for each stage. Change as appropriate and
click Done to finish. The report can be printed or saved as a PDF file for future reference.
Saving
Saving will overwrite any previous analysis, therefore to preserve a particular analysis set up, click on File followed
by Save As… to save as a different file name.
Trademarks
FAM ™ and ROX™ are trademarks of Applera Corporation or its subsidiaries in the U.S. and certain other countries.
SYBR® is a registered trademark of Life Technologies Corporation.
Yakima Yellow® is a registered trademark of Epoch Biosciences, Inc.
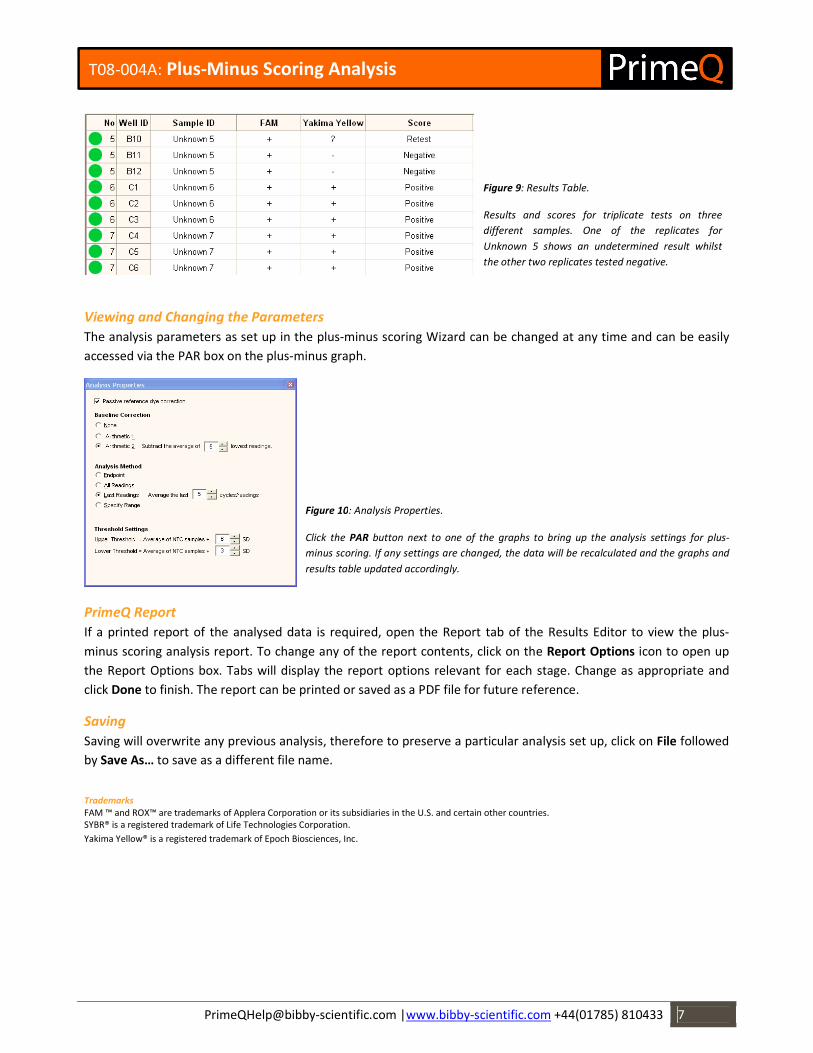
Figure 9: Results Table.
Results and scores for triplicate tests on three
different samples. One of the replicates for
Unknown 5 shows an undetermined result whilst
the other two replicates tested negative.
Figure 10: Analysis Properties.
Click the PAR button next to one of the graphs to bring up the analysis settings for plus-
minus scoring. If any settings are changed, the data will be recalculated and the graphs and
results table updated accordingly.