Embed Size (px)
Citation preview

t-Tests
Overview of t-Tests
How a t-Test Works Single-Sample t Independent Samples t Paired t Effect Size
How a t-Test Works The t-test is used to compare
means. The difference between means is
divided by a standard error The t statistic is conceptually
similar to a z-score.
How a t-Test Works
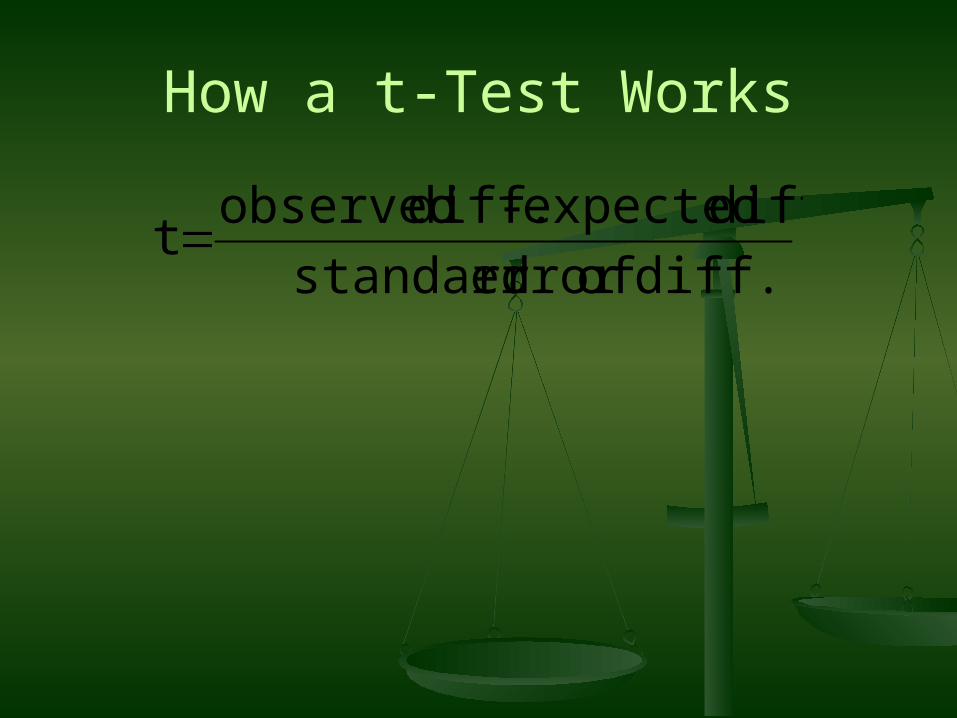
diff. oferror standard
diff. expected - diff. observed t
How a t-Test Works
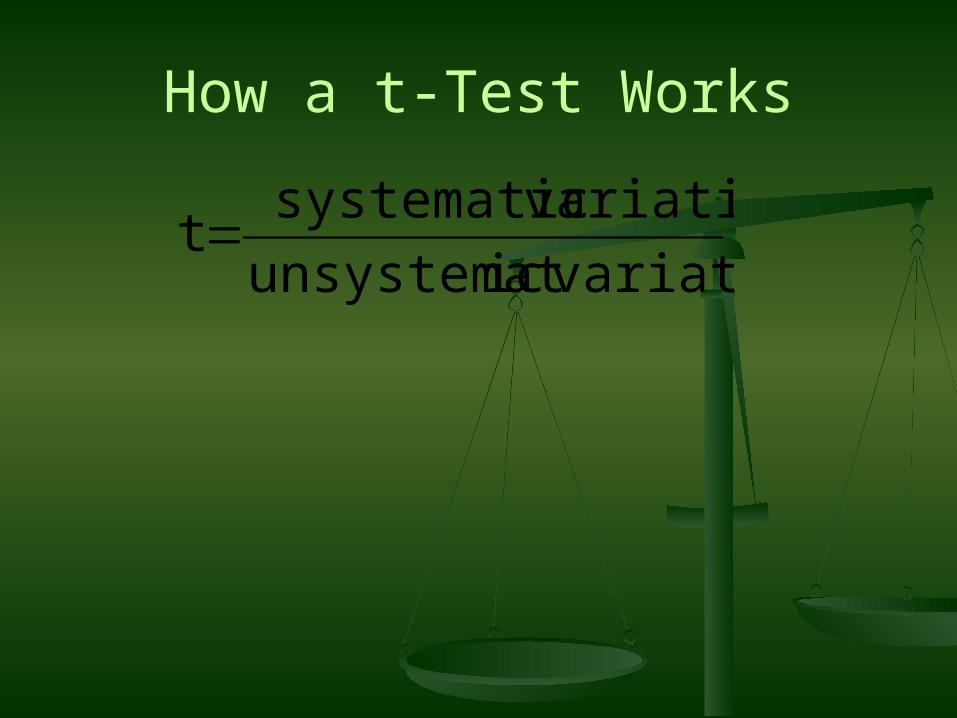
variationicunsystemat
variationsystematic t
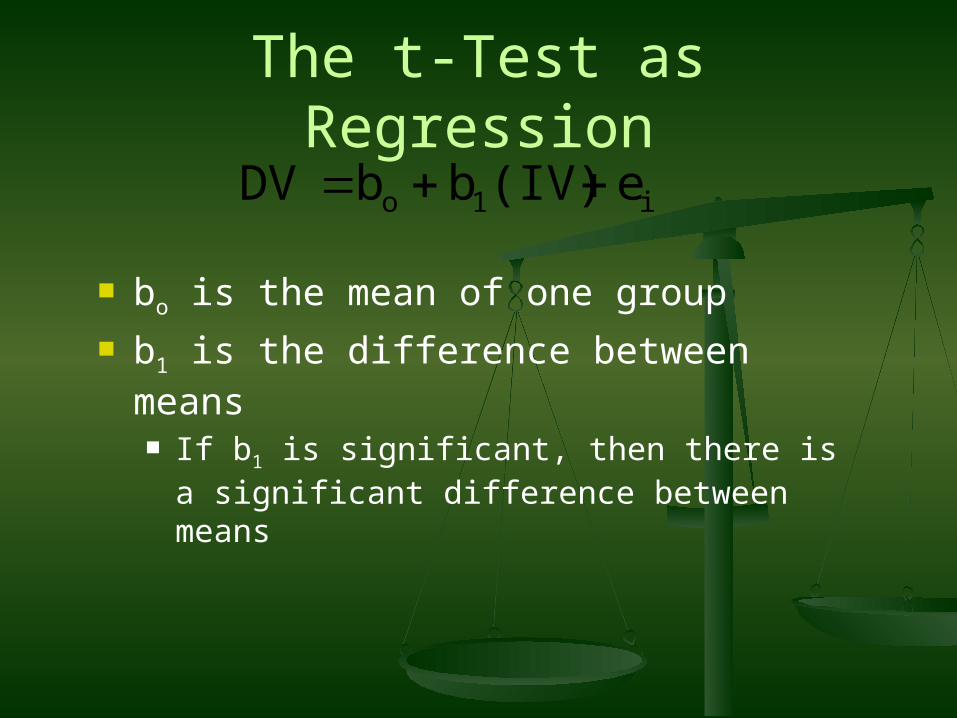
The t-Test as Regression
bo is the mean of one group b1 is the difference between means
If b1 is significant, then there is a significant difference between means
i1o e (IV)b b DV
Single Sample t-test
Compare a sample mean to a hypothesized population mean (test value based on previous research or norms)
Assumptions for Single-Sample t
1. Independent observations. 2. Population distribution is
symmetrical. 3. Interval or ratio level data.
Sampling Distribution of the Mean
The t distribution is symmetrical but flatter than a normal distribution.
The exact shape depends on degrees of freedom
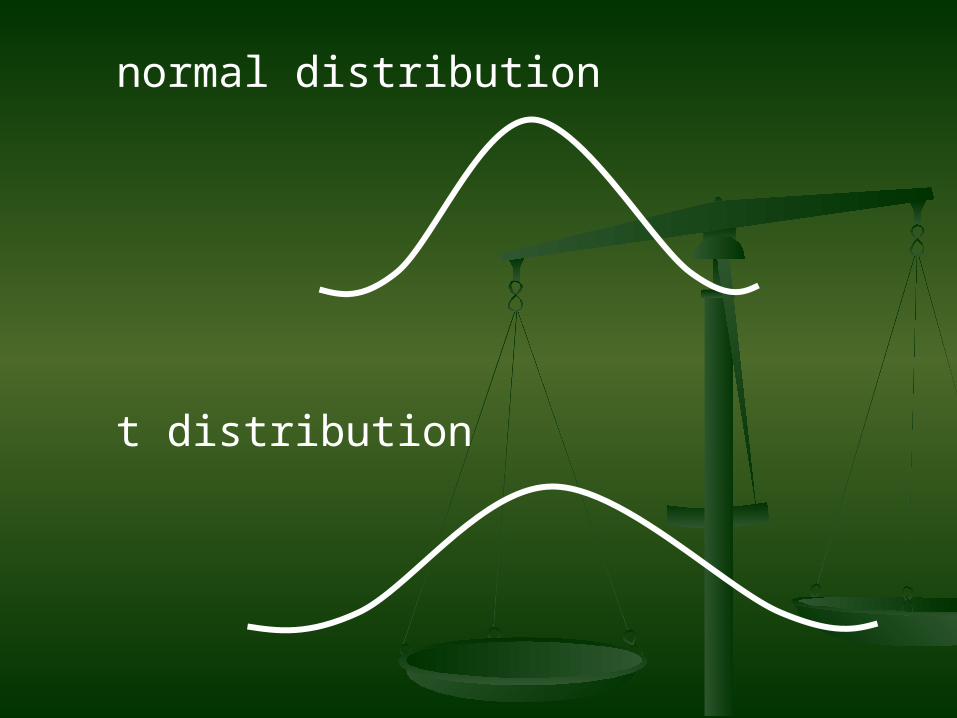
normal distribution
t distribution
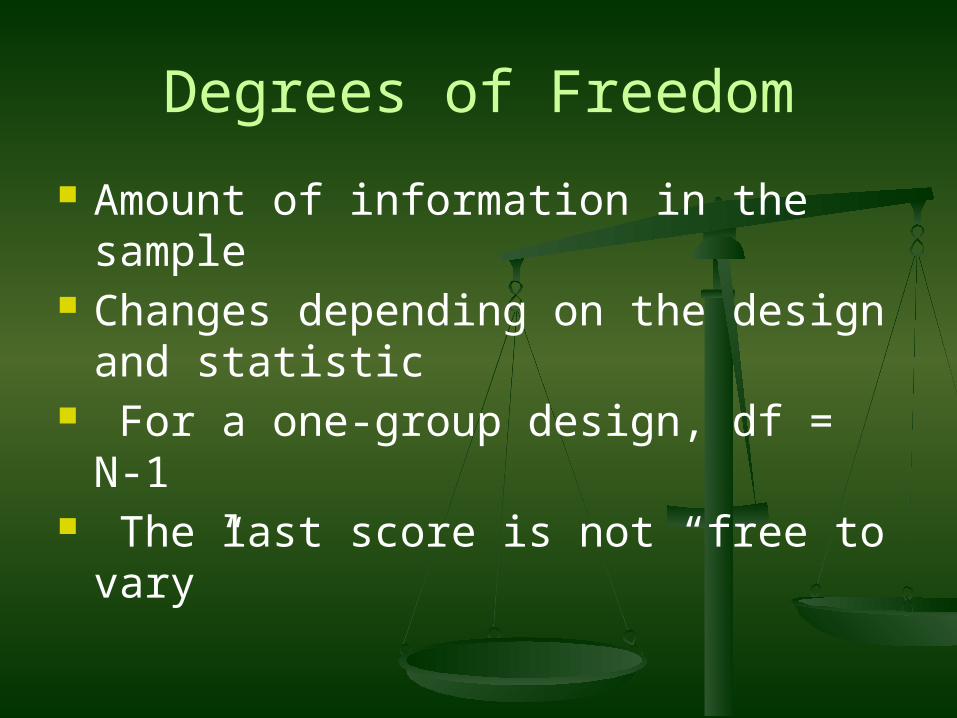
Degrees of Freedom
Amount of information in the sample Changes depending on the design
and statistic For a one-group design, df = N-1 The last score is not “free to vary”
Independent Samples t-test
Also called: Unpaired t-test Use with between-subjects,
unmatched designs
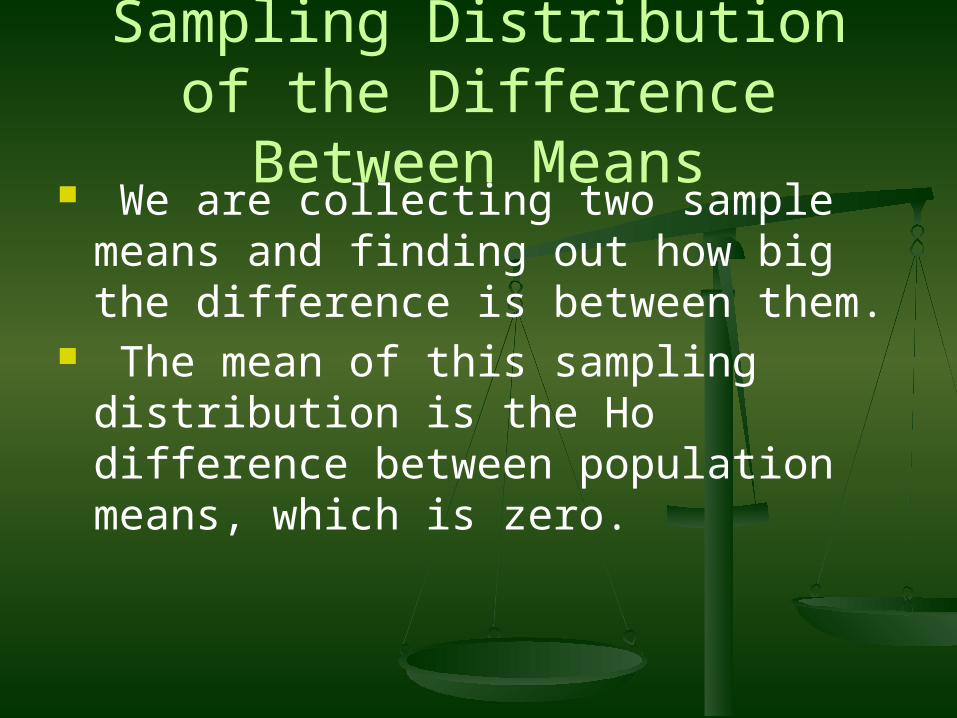
Sampling Distribution of the Difference Between Means
We are collecting two sample means and finding out how big the difference is between them.
The mean of this sampling distribution is the Ho difference between population means, which is zero.
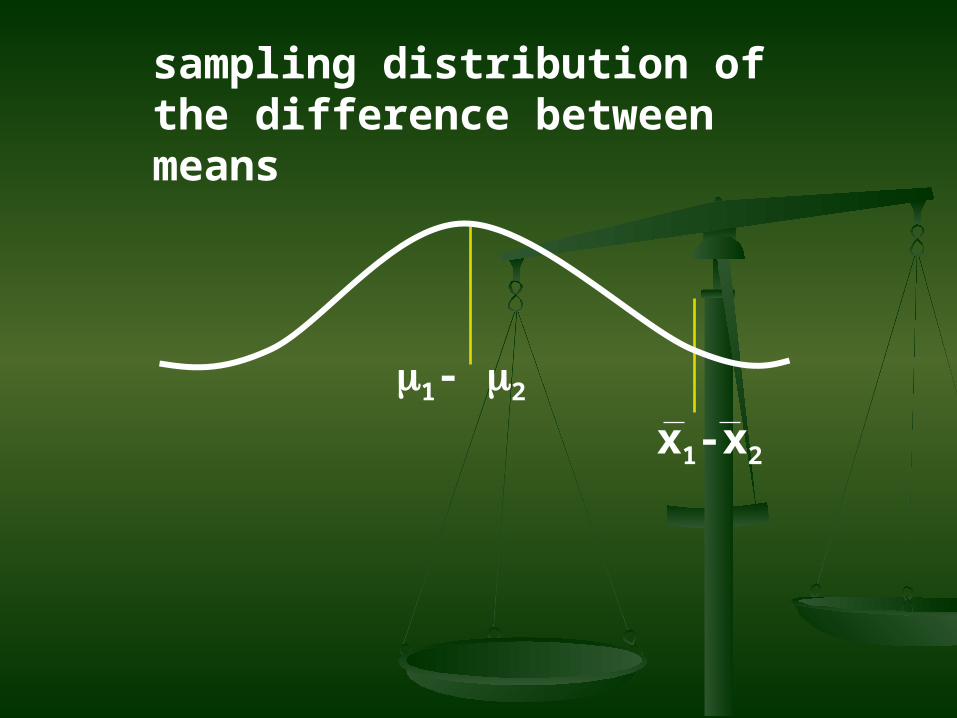
m1- m2
x1-x2
sampling distribution of the difference between means
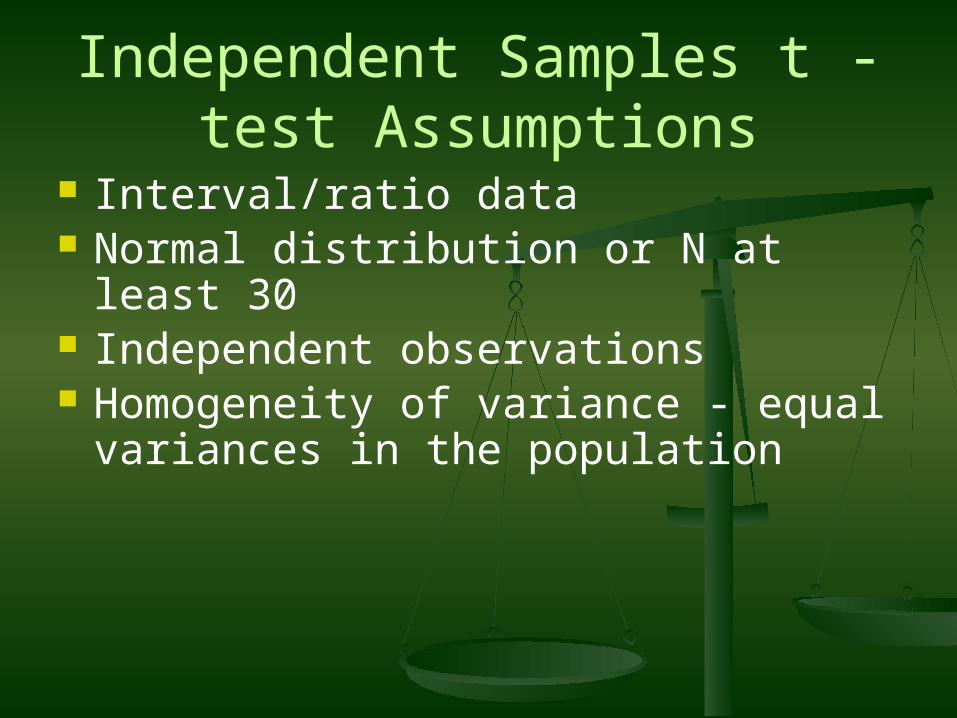
Independent Samples t -test Assumptions
Interval/ratio data Normal distribution or N at least 30 Independent observations Homogeneity of variance - equal
variances in the population
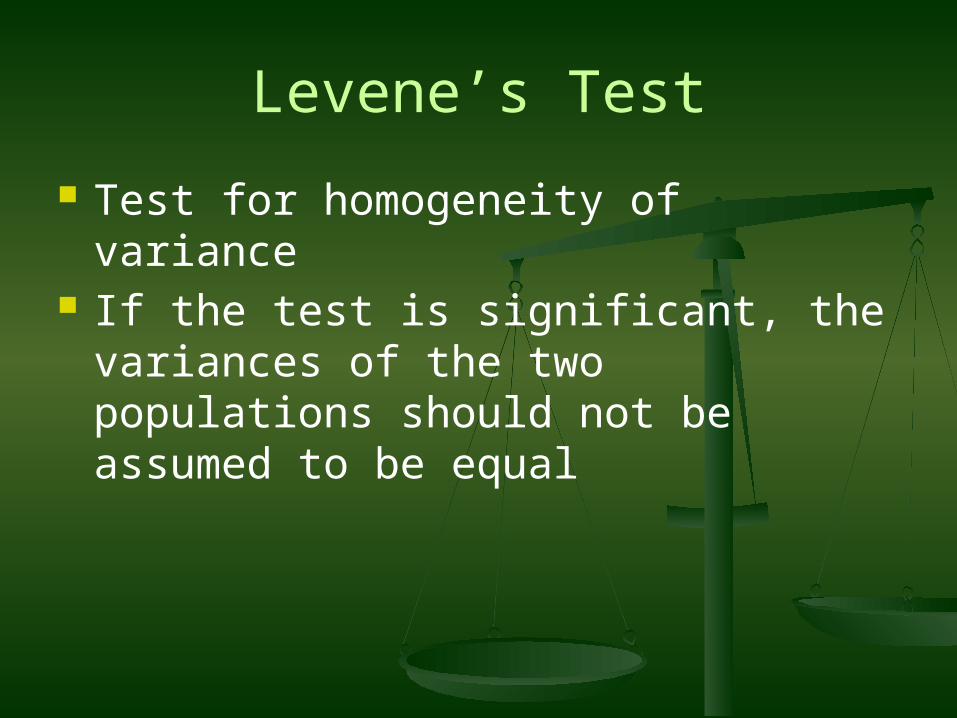
Levene’s Test
Test for homogeneity of variance If the test is significant, the variances
of the two populations should not be assumed to be equal
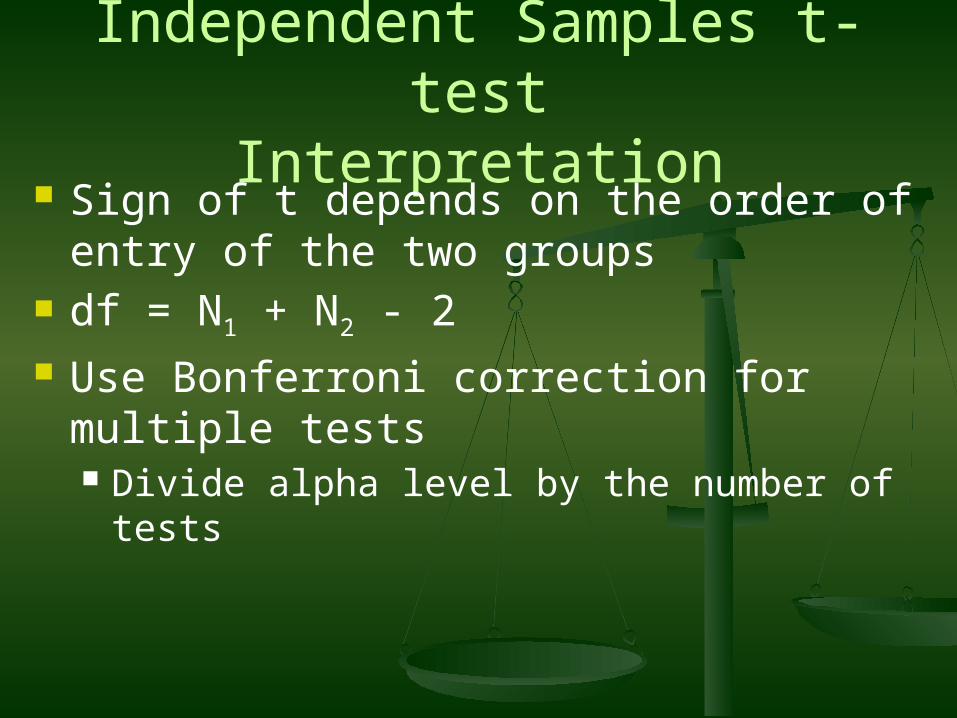
Independent Samples t-testInterpretation
Sign of t depends on the order of entry of the two groups
df = N1 + N2 - 2 Use Bonferroni correction for multiple
tests Divide alpha level by the number of tests
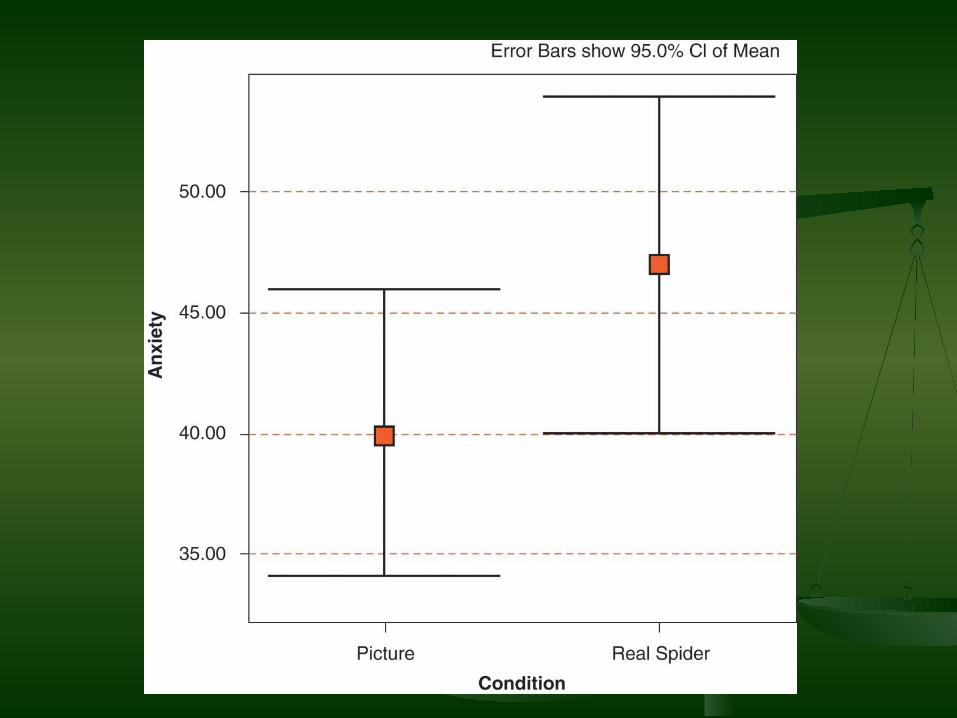
Paired t-Test
Also called: Dependent Samples or Related Samples t-test
Compares two conditions with paired scores: Within subjects design Matched groups design
Paired Samples t-Test Assumptions
Interval/ratio data Normal distribution or N at least 30 Independent observations
Paired Samples t-test - Interpretation
The sign of the t depends on the order in which the variables are entered
df = N-1 Use Bonferroni correction for multiple
tests
Effect Size
Statistical significance is about the Null Hypothesis, not about the size of the difference
A small difference may be significant with sufficient power
A significant but small difference may not be important in practice
Effect Size with r2
Compute the correlation between the independent and dependent variables
This will be a point-biserial correlation
Square the r to get the proportion of variance explained
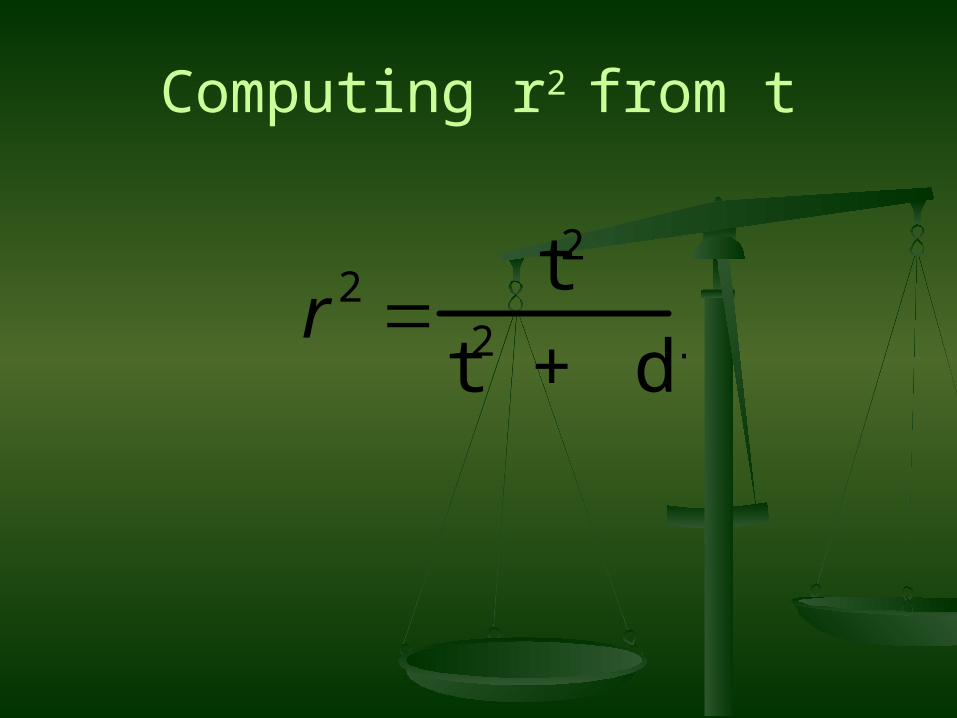
Computing r2 from t
r 2 t2
t2 + df
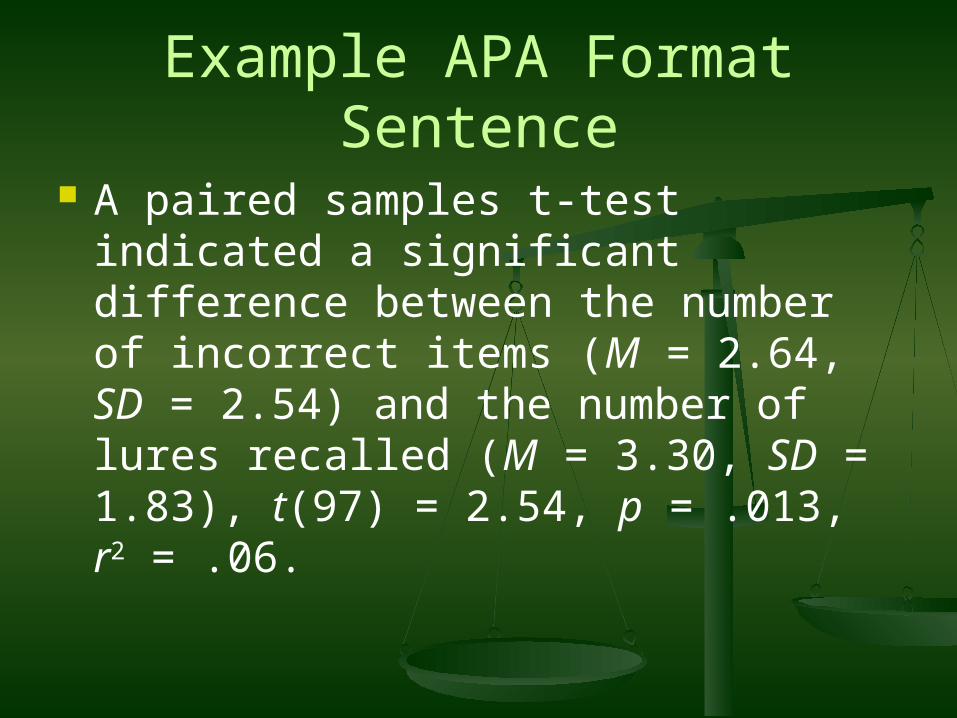
Example APA Format Sentence
A paired samples t-test indicated a significant difference between the number of incorrect items (M = 2.64, SD = 2.54) and the number of lures recalled (M = 3.30, SD = 1.83), t(97) = 2.54, p = .013, r2 = .06.
Take-Home Points
Every t-test compares a systematic difference to a measure of error
Effect size should be reported along with whether a difference is significant