Embed Size (px)
DESCRIPTION
basic definition and samples
Citation preview

T-test for Dependent/Correlated Samples
Reported by Faith
Content
1. What is the t-test for correlated samples?
2. When do we use the t-test for correlated samples?
3. Why do we use the t-test for correlated samples?
4. How do we use the t-test for correlated samples?
5. What are the steps in solving the t-test for correlated samples?
6. Solving by the stepwise method.
1. What is the t-test for correlated samples?
• The t-test for correlated samples is another parametric test applied to one group of samples. It can be used in the evaluation of a certain program or treatment. Since this is another parametric test, conditions must be met like the normal distribution and the use of interval or ratio data.
2. When do we use the t-test for correlated samples?
• The test for correlated samples is applied when the mean before and the mean after are being compared. The pretest (mean before) is measured, the treatment of the intervention is applied and then the posttest (mean after) is likewise measured. Then the two means (pretest vs. the posttest) are compared.
3. Why do we use the t-test for correlated samples?
• The t-test for correlated samples is used to find out if a difference exists between the before and after means. If there is a difference in favor of the posttest then the treatment or intervention is effective. However, if there is no significant difference then the treatment is not effective.
• This is an appropriate test for the evaluation of government programs. This is used in an experimental design to test the effectiveness of a certain technique or method or program that had been developed.
4. How do we use the t-test for correlated samples?
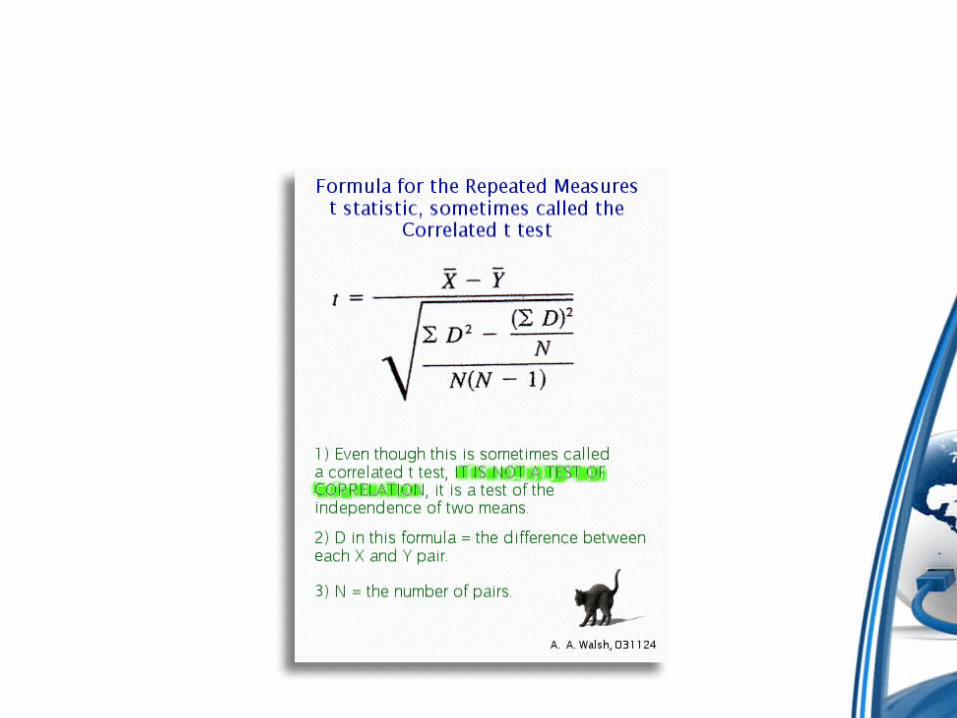
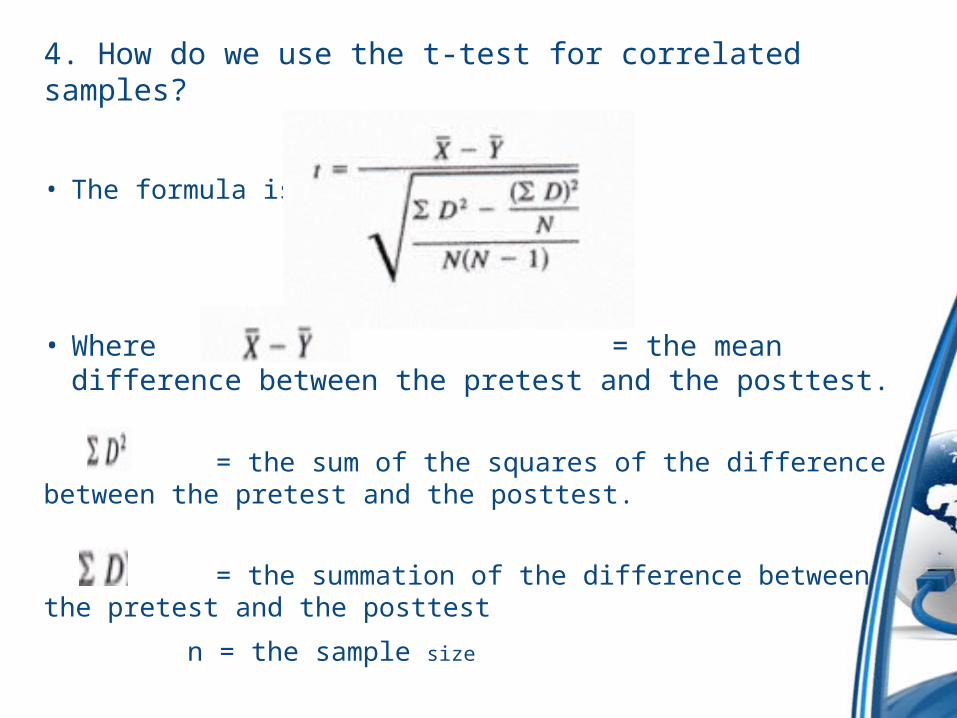
• The formula is
• Where = the mean difference between the pretest and the posttest.
= the sum of the squares of the difference between the pretest and the posttest.
= the summation of the difference between the pretest and the posttest
n = the sample size
Example 1
• An experimental study was conducted on the effect of programmed materials in English on the performance of 20 selected college students. Before the program was implemented the pretest was administered and after 5 months the same instrument was used to get the posttest result. The following is the result of the experiment.
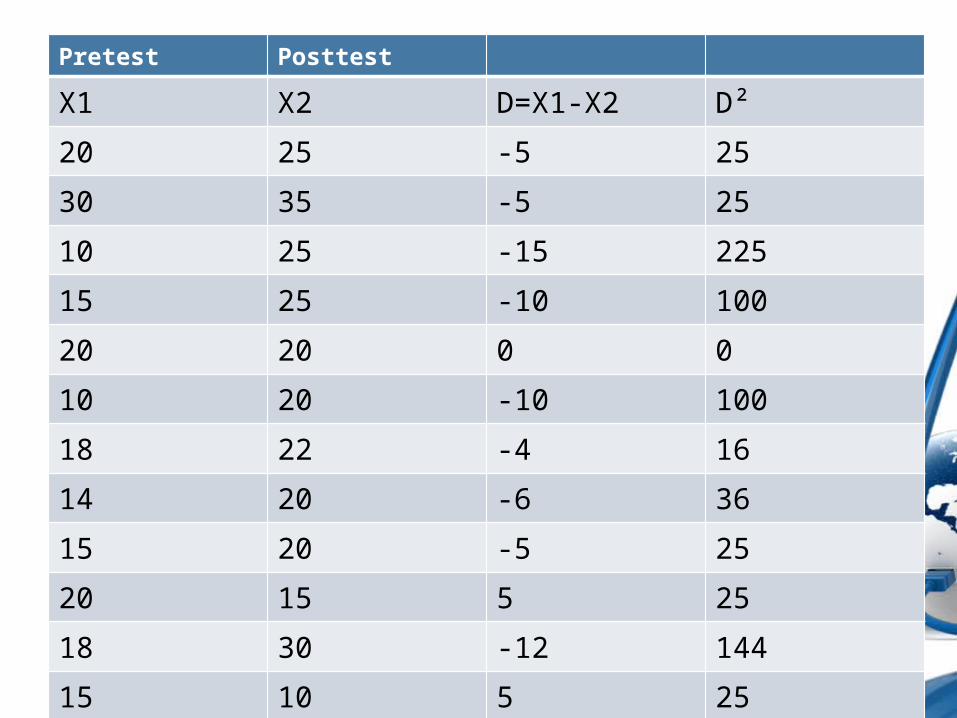
Pretest Posttest
X1 X2 D=X1-X2 D²
20 25 -5 25
30 35 -5 25
10 25 -15 225
15 25 -10 100
20 20 0 0
10 20 -10 100
18 22 -4 16
14 20 -6 36
15 20 -5 25
20 15 5 25
18 30 -12 144
15 10 5 25
15 16 1 1
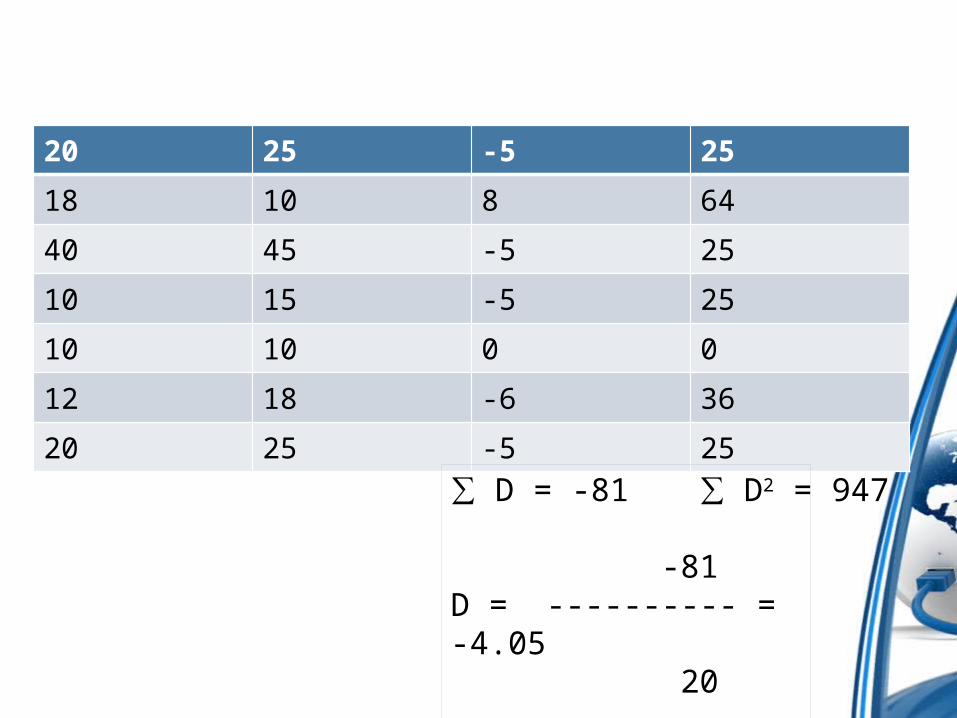
20 25 -5 25
18 10 8 64
40 45 -5 25
10 15 -5 25
10 10 0 0
12 18 -6 36
20 25 -5 25
∑ D = -81
-81D = ---------- = -4.05 20
∑ D2 = 947
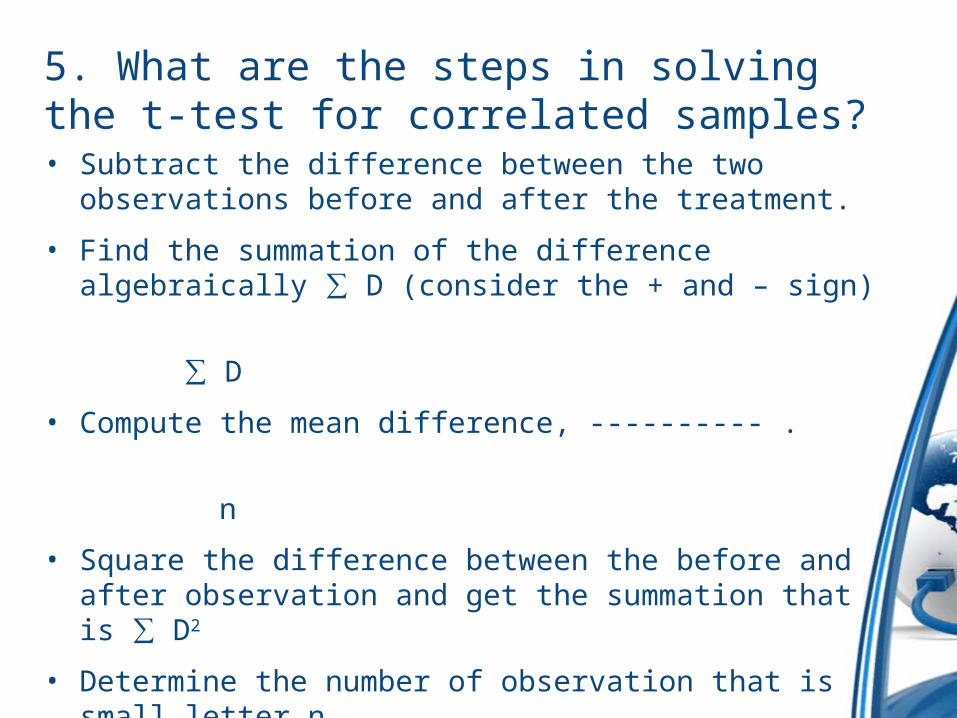
5. What are the steps in solving the t-test for correlated samples?• Subtract the difference between the two observations before
and after the treatment.
• Find the summation of the difference algebraically ∑ D (consider the + and – sign)
∑ D
• Compute the mean difference, ---------- .
n
• Square the difference between the before and after observation and get the summation that is ∑ D2
• Determine the number of observation that is small letter n.
• If the t-computed value is greater than or beyond critical value disconfirm the null hypothesis and confirm the research or alternative hypothesis.
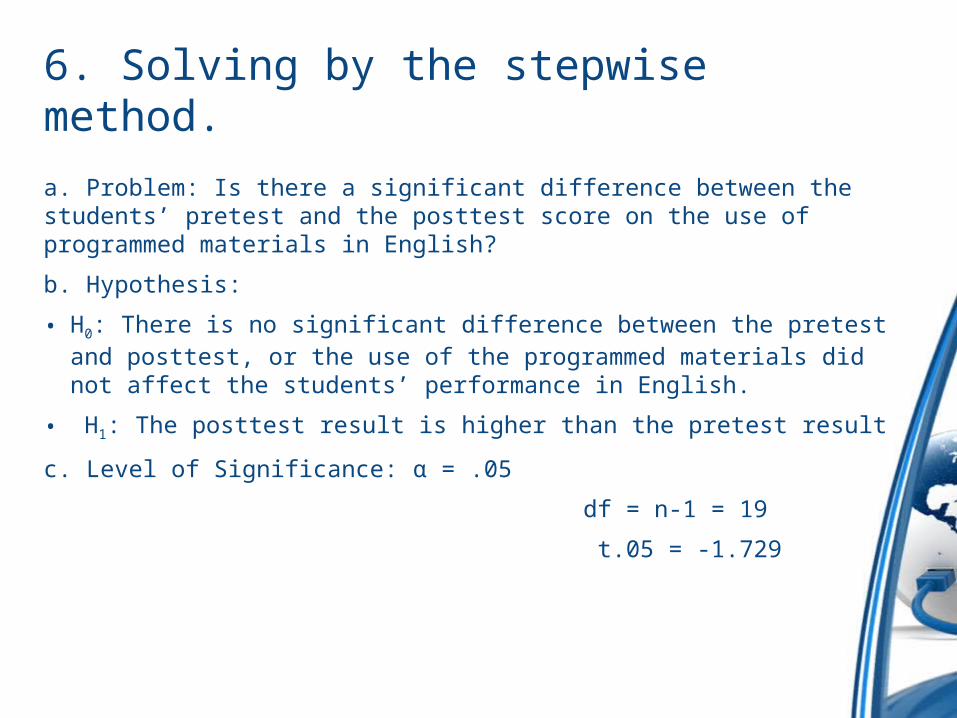
6. Solving by the stepwise method.
a. Problem: Is there a significant difference between the students’ pretest and the posttest score on the use of programmed materials in English?
b. Hypothesis:
• H0: There is no significant difference between the pretest and posttest, or the use of the programmed materials did not affect the students’ performance in English.
• H1: The posttest result is higher than the pretest result
c. Level of Significance: α = .05
df = n-1 = 19
t.05 = -1.729
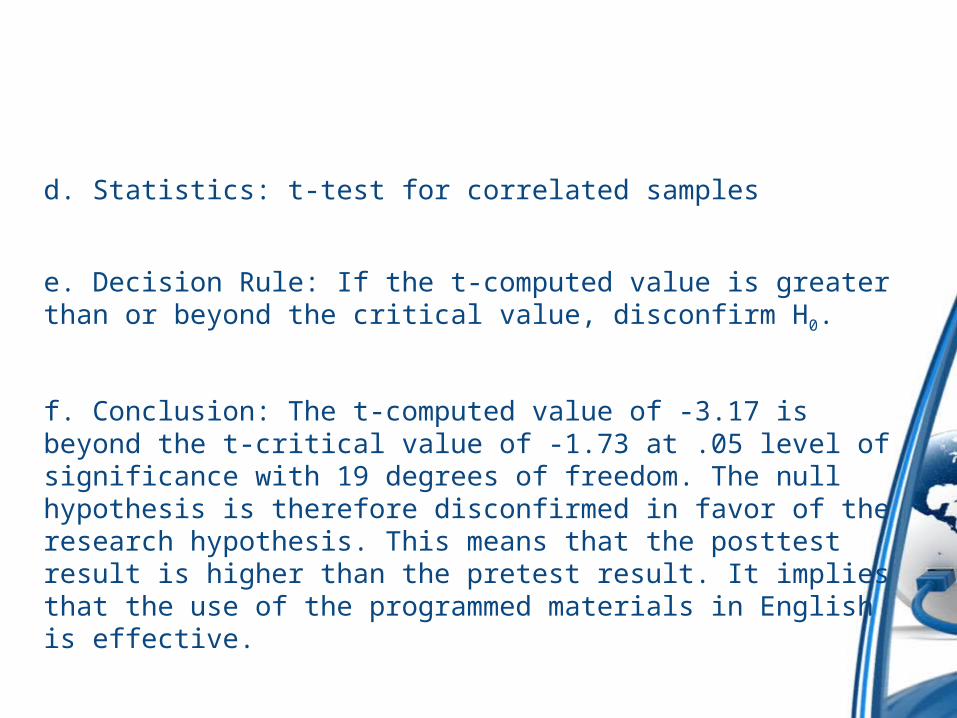
d. Statistics: t-test for correlated samples
e. Decision Rule: If the t-computed value is greater than or beyond the critical value, disconfirm H0.
f. Conclusion: The t-computed value of -3.17 is beyond the t-critical value of -1.73 at .05 level of significance with 19 degrees of freedom. The null hypothesis is therefore disconfirmed in favor of the research hypothesis. This means that the posttest result is higher than the pretest result. It implies that the use of the programmed materials in English is effective.