Embed Size (px)
Citation preview
'Surveying SME Use of Social Technologies'
JRC-SVQ-2012-J03-045-AMI
D1.1. Minutes of the meeting and agreed work plan,
methodological and practical issues and questionnaire
v.01
29/01/2013
2
INDEX
1. INTRODUCTION ............................................................................................................................ 4
2. OVERALL APPROACH .................................................................................................................. 5 2.1. OBJECTIVES AND CONSTRAINS ............................................................................................................... 5 2.2. PROJECT MANAGEMENT ......................................................................................................................... 6 2.3. WORK PLAN AND DELIVERABLES .......................................................................................................... 8
2.3.1. WP 1 Survey set up ............................................................................................................................. 8 2.3.2. WP 2 Survey implementation ........................................................................................................ 9 2.3.3. WP 3 Analysis of survey data ...................................................................................................... 10
2.4. PROJECT GANTT ..................................................................................................................................... 10 2.5. RESOURCES ALLOCATED ....................................................................................................................... 11
3. METHODOLOGICAL SET UP ....................................................................................................12 3.1. SELECTION OF THE TARGET ................................................................................................................. 12 3.2. SAMPLING PROPOSAL ............................................................................................................................ 16 3.3. TRANSLATION OF THE QUESTIONNAIRE ............................................................................................ 21 3.4. IMPLEMENTATION OF THE SURVEY – DISSEMINATION STRATEGY ................................................ 22
3.4.1. Interviewer selection and briefing ........................................................................................... 22 3.4.2. Target recruitment procedures – or dissemination strategy ...................................... 24 3.4.3. Web CATI survey procedures ...................................................................................................... 24
4. QUESTIONNAIRE DESIGN.........................................................................................................26
3
TABLES
Table 1. Distribution of enterprises by size ............................................................................ 14
Table 2. Enterprises having a web site or homepage (% of enterprises), 2011 ...... 17
Table 3. Target population, 2011 ............................................................................................... 18
Table 4. Target population, 2011 (percentages) .................................................................. 18
Table 5. Sampling by country, SME and ICT adoption ........................................................ 18
Table 6. Sampling errors by country, SME and ICT adoption .......................................... 19
FIGURES
Figure 1. Project Management main components and phases ........................................... 6
Figure 2. Research team composition .......................................................................................... 6
Figure 3. Project Gantt .................................................................................................................... 10
Figure 4. Internationalisation of European SME’s ............................................................... 15
4
1. Introduction
This is the Inception Report (contractual deliverable D1), as anticipated in our technical offer, we present the development of a detailed, robust and transparent methodological set up emphasising survey target, coverage and sampling proposal as well as the implementation plan (Task 1.2) considering the input from the kick-off meeting (Task 1.1). 'Surveying SME Use of Social Technologies' kick-off meeting took place in Barcelona on 10th January 2012 with the following assistants:
IPTS: Rene Van-Bavel, Michail Batikas and Aaron Martin. DG CONNECT: Loretta Anania. Block de Ideas: Nadia Stevens, Stefan Meissner, Maite Bocanegra and Rosa
Dalet Tech4i2: David Osimo and Francisco Lupiáñez-Villanueva
The aim of this meeting, as anticipated in our technical offer (WP1 – Task 1.1), was to present a detailed work plan and methodological proposal focussing on:
Work plan, deliverables and project management approach Research team composition and allocation of resources Methodological set up
Hence, the agenda of the meeting was:
10.30 Presentations 10.45 Work plan, deliverables and project management approach 11.15 Methodological set up, including questionnaire discussion 13.00 Research team composition and allocation of resources 14:00 Conclusion
This deliverable, being still a work-in-progress document, it contains for the sake of full clarity and transparency some ‘procedural’ parts (i.e. kick off issues and how we respond to them, disclaimers and limitations, etc.) that will be removed once we have obtained final acceptance from the IPTS of all proposed choices and deliver the final version.
5
2. Overall approach
2.1. Objectives and constrains As stated in the Tender Specifications the objectives of this projects are:
Survey set-up: Develop a questionnaire that takes 20-30 minutes to complete. The questionnaire should include an industrial profile of respondents (e.g. their sector, geographical base, revenues, number of staff, etc.) and questions on the organisation's current and future planned use of SN and SM tools, perceived benefits, best practices and barriers, and their expectations on the likely future evolution of the organisational use of these tools.
Survey implementation: Conduct a survey of at least 600 SMEs, across different economic sectors, on their use of SN and SM.
Analysis and reporting: Provide a descriptive analysis of the survey data, highlighting major findings and insights. Elaborate and document the methodology used to conduct the survey as per good research practice.
Whereas we reported above the objectives literally as phrased in the Tender Specifications, below we provide our own summary of the expected results:
Fill in a knowledge gap. Whereas there is more evidence on SNSMs usage in large enterprises, for SME the evidence is still anecdotal and the preliminary insights available (low usage, main barriers: lack of resources and concern about information security) need to be further corroborated, explored, and possibly refined;
Identify drivers and barriers. Given the policy importance of the topic and the objectives of Phase 2 of the SEA-SoNS project, it is of great importance to highlight what can facilitate and/or hamper more sustained and effective take up of SNSMs by SMEs in order also to define future evolution scenarios and to frame EU level to catalyse the adoption and use of these collaborative platforms by European SMEs;
Provide a holistic picture of the phenomenon. The previous two expected results rests so to speak on the following horizontal expected results: provide data and insight not only on whether SNSMs are used by SMEs, but also on how, to what extent, for what purpose, why are used (and for non-users why are not used)
To achieve these objectives it is worth pointing out the main constrains of this survey by contrasting it against the two surveys cited in the Tender Specifications1. These two surveys were based on large sample (i.e. about 4200 that by Bughin et al., 2011) and focussed mostly on large enterprises, whereas this study focuses on smaller sample and on SMEs.
1 Bughin, J., Byers, A., & Chui, M. (2011). How social technologies are extending the organisation. McKinsey Quarterly, November 2011. Kiron, D., Palmer, D., Phillips, D., & Kruschwitz, N. (2012). Social Business: What Are Companies Really Doing?'. MIT Sloan Management Review, May 2012
6
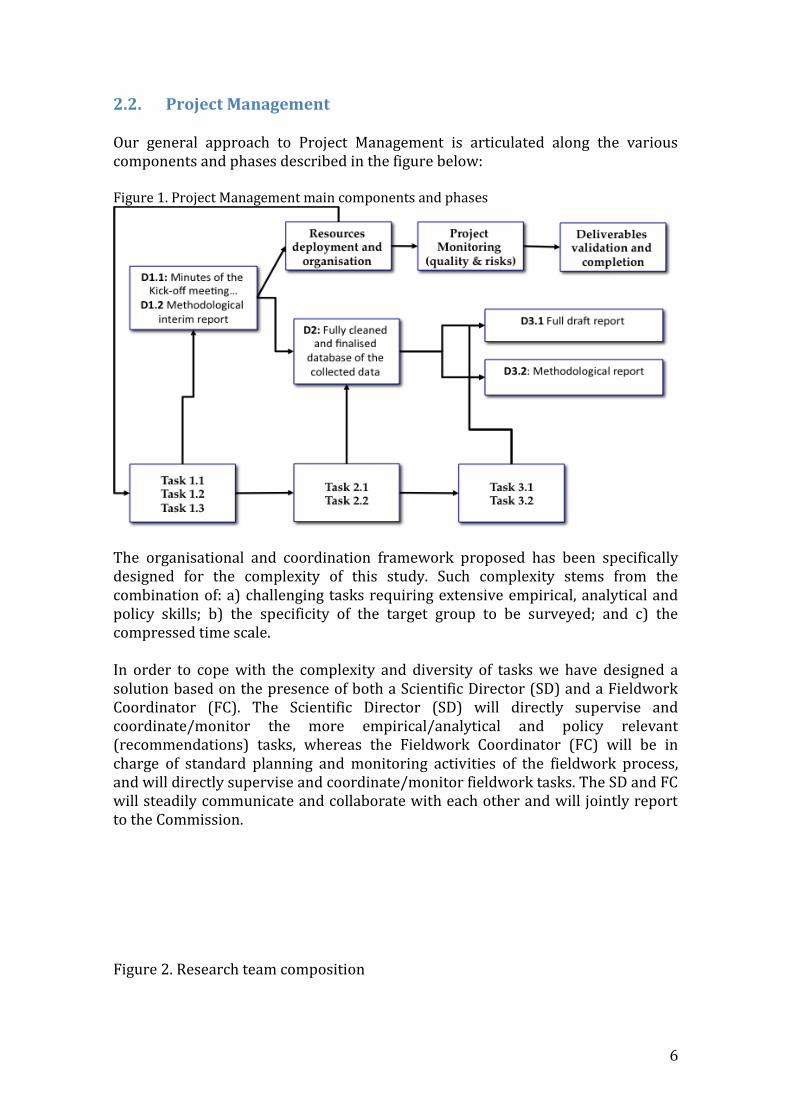
2.2. Project Management Our general approach to Project Management is articulated along the various components and phases described in the figure below: Figure 1. Project Management main components and phases
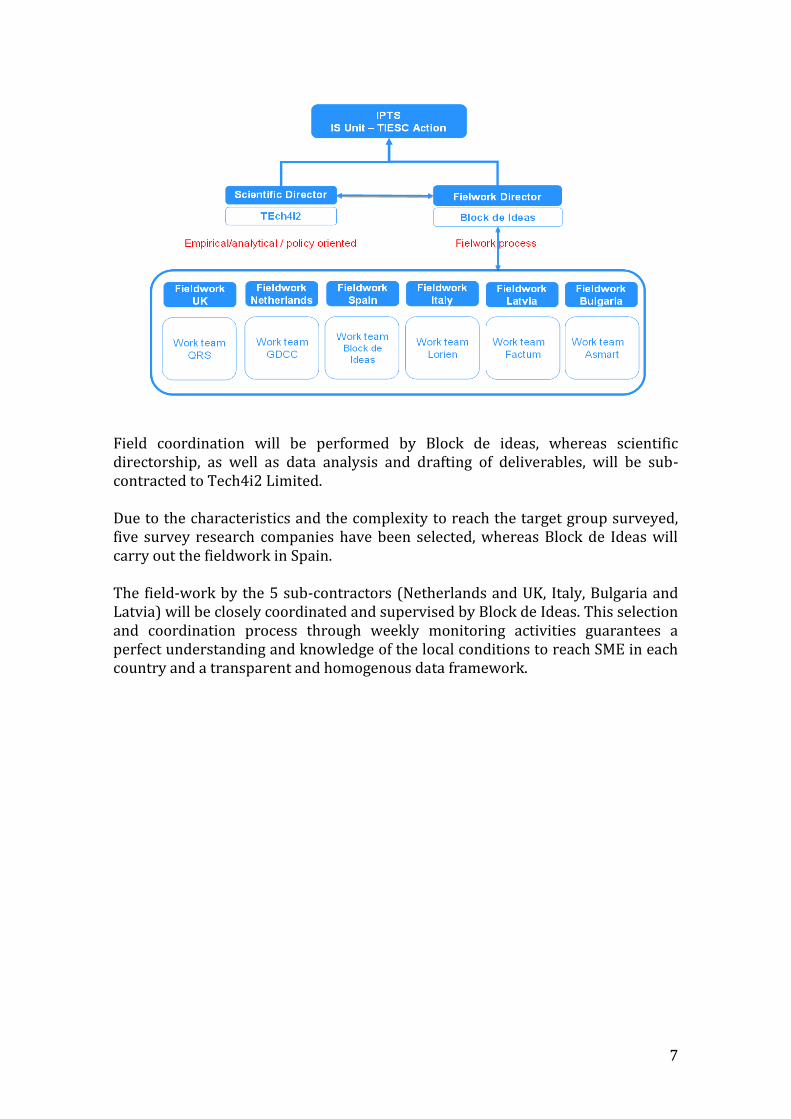
The organisational and coordination framework proposed has been specifically designed for the complexity of this study. Such complexity stems from the combination of: a) challenging tasks requiring extensive empirical, analytical and policy skills; b) the specificity of the target group to be surveyed; and c) the compressed time scale. In order to cope with the complexity and diversity of tasks we have designed a solution based on the presence of both a Scientific Director (SD) and a Fieldwork Coordinator (FC). The Scientific Director (SD) will directly supervise and coordinate/monitor the more empirical/analytical and policy relevant (recommendations) tasks, whereas the Fieldwork Coordinator (FC) will be in charge of standard planning and monitoring activities of the fieldwork process, and will directly supervise and coordinate/monitor fieldwork tasks. The SD and FC will steadily communicate and collaborate with each other and will jointly report to the Commission. Figure 2. Research team composition
7
Field coordination will be performed by Block de ideas, whereas scientific directorship, as well as data analysis and drafting of deliverables, will be sub-contracted to Tech4i2 Limited. Due to the characteristics and the complexity to reach the target group surveyed, five survey research companies have been selected, whereas Block de Ideas will carry out the fieldwork in Spain. The field-work by the 5 sub-contractors (Netherlands and UK, Italy, Bulgaria and Latvia) will be closely coordinated and supervised by Block de Ideas. This selection and coordination process through weekly monitoring activities guarantees a perfect understanding and knowledge of the local conditions to reach SME in each country and a transparent and homogenous data framework.
8
2.3. Work plan and deliverables
2.3.1. WP 1 Survey set up
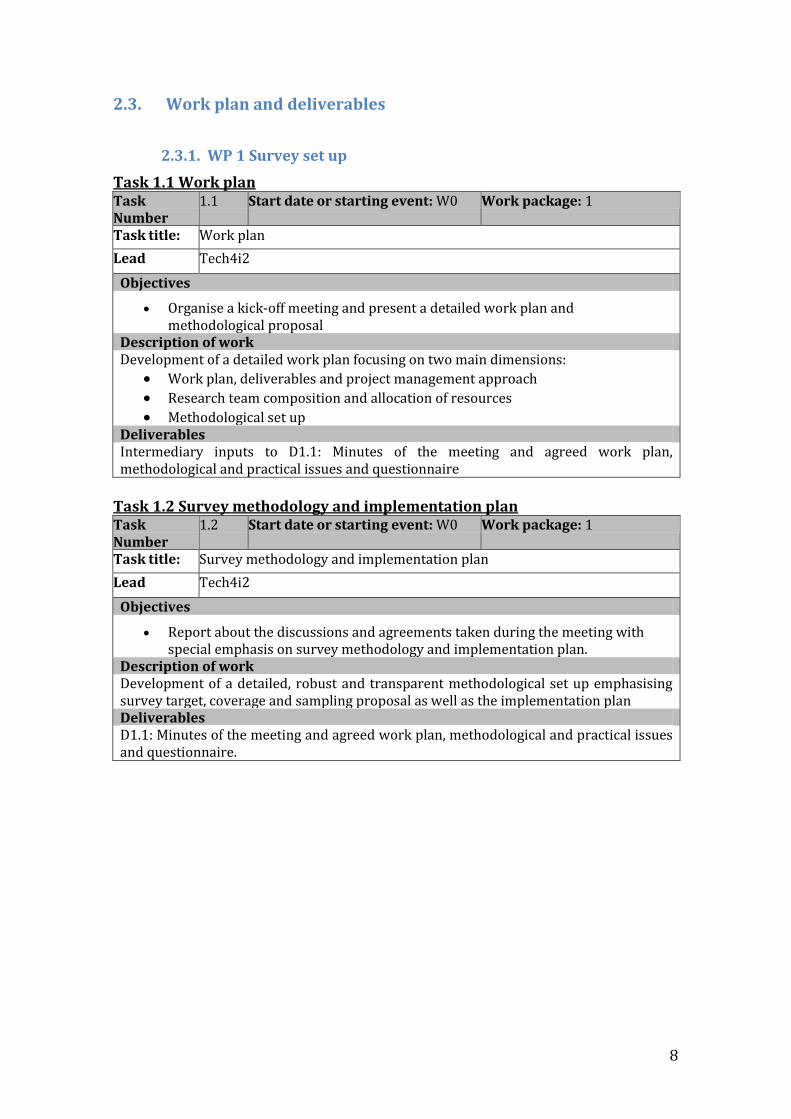
Task 1.1 Work plan Task Number
1.1 Start date or starting event: W0 Work package: 1
Task title: Work plan
Lead Tech4i2
Objectives
Organise a kick-off meeting and present a detailed work plan and methodological proposal
Description of work Development of a detailed work plan focusing on two main dimensions:
Work plan, deliverables and project management approach Research team composition and allocation of resources Methodological set up
Deliverables Intermediary inputs to D1.1: Minutes of the meeting and agreed work plan, methodological and practical issues and questionnaire
Task 1.2 Survey methodology and implementation plan Task Number
1.2 Start date or starting event: W0 Work package: 1
Task title: Survey methodology and implementation plan
Lead Tech4i2
Objectives
Report about the discussions and agreements taken during the meeting with special emphasis on survey methodology and implementation plan.
Description of work Development of a detailed, robust and transparent methodological set up emphasising survey target, coverage and sampling proposal as well as the implementation plan Deliverables D1.1: Minutes of the meeting and agreed work plan, methodological and practical issues and questionnaire.
9
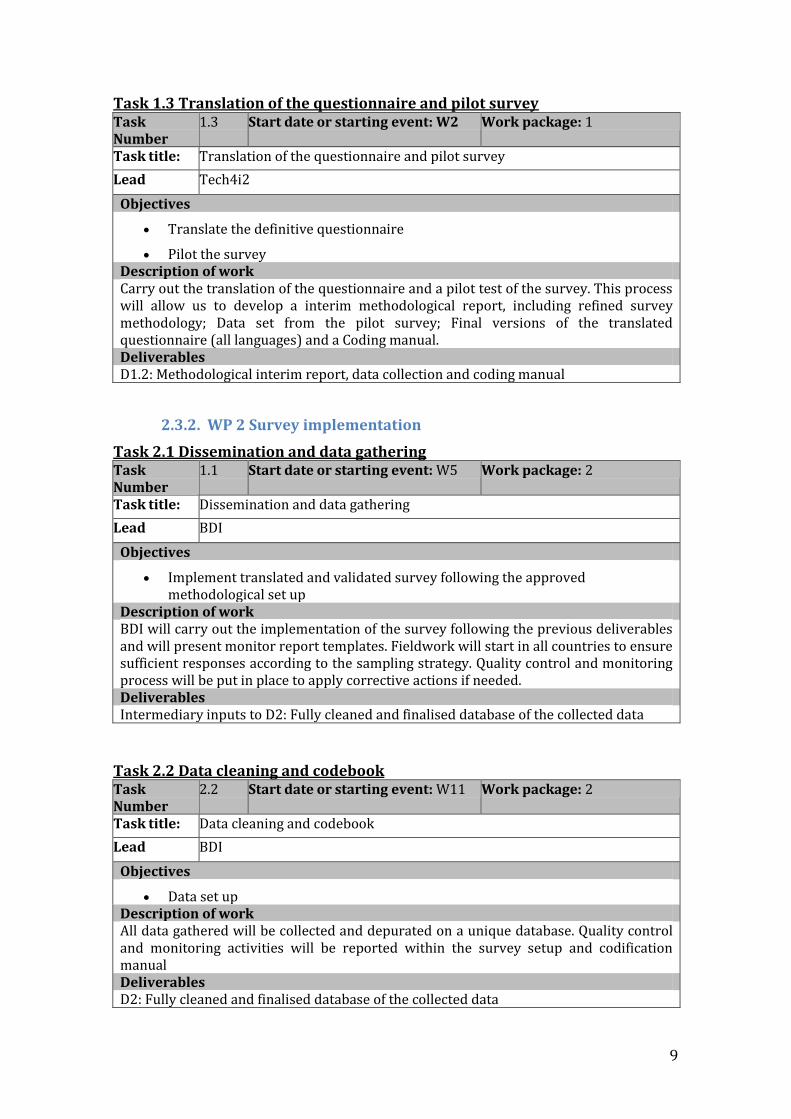
Task 1.3 Translation of the questionnaire and pilot survey Task Number
1.3 Start date or starting event: W2 Work package: 1
Task title: Translation of the questionnaire and pilot survey
Lead Tech4i2
Objectives
Translate the definitive questionnaire
Pilot the survey
Description of work Carry out the translation of the questionnaire and a pilot test of the survey. This process will allow us to develop a interim methodological report, including refined survey methodology; Data set from the pilot survey; Final versions of the translated questionnaire (all languages) and a Coding manual. Deliverables D1.2: Methodological interim report, data collection and coding manual
2.3.2. WP 2 Survey implementation
Task 2.1 Dissemination and data gathering Task Number
1.1 Start date or starting event: W5 Work package: 2
Task title: Dissemination and data gathering
Lead BDI
Objectives
Implement translated and validated survey following the approved methodological set up
Description of work BDI will carry out the implementation of the survey following the previous deliverables and will present monitor report templates. Fieldwork will start in all countries to ensure sufficient responses according to the sampling strategy. Quality control and monitoring process will be put in place to apply corrective actions if needed. Deliverables Intermediary inputs to D2: Fully cleaned and finalised database of the collected data
Task 2.2 Data cleaning and codebook Task Number
2.2 Start date or starting event: W11 Work package: 2
Task title: Data cleaning and codebook
Lead BDI
Objectives
Data set up
Description of work All data gathered will be collected and depurated on a unique database. Quality control and monitoring activities will be reported within the survey setup and codification manual Deliverables D2: Fully cleaned and finalised database of the collected data
10
2.3.3. WP 3 Analysis of survey data
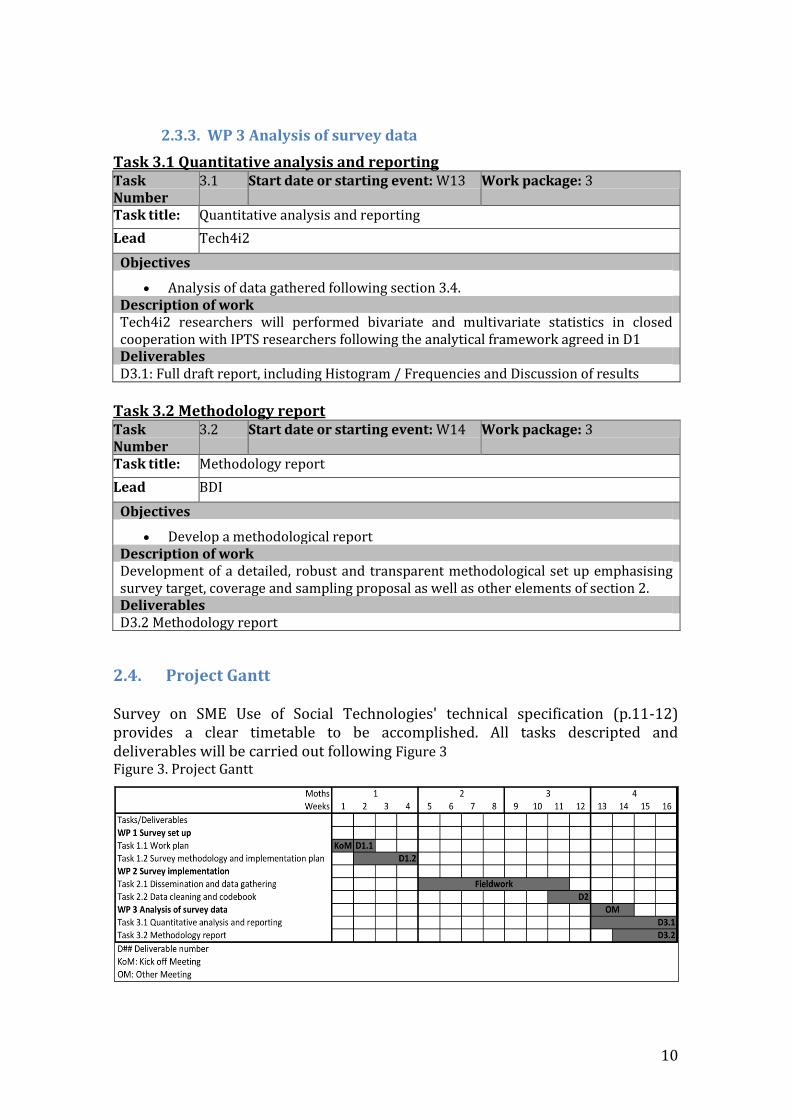
Task 3.1 Quantitative analysis and reporting Task Number
3.1 Start date or starting event: W13 Work package: 3
Task title: Quantitative analysis and reporting
Lead Tech4i2
Objectives
Analysis of data gathered following section 3.4. Description of work Tech4i2 researchers will performed bivariate and multivariate statistics in closed cooperation with IPTS researchers following the analytical framework agreed in D1 Deliverables D3.1: Full draft report, including Histogram / Frequencies and Discussion of results
Task 3.2 Methodology report Task Number
3.2 Start date or starting event: W14
Work package: 3
Task title: Methodology report
Lead BDI
Objectives
Develop a methodological report
Description of work Development of a detailed, robust and transparent methodological set up emphasising survey target, coverage and sampling proposal as well as other elements of section 2. Deliverables D3.2 Methodology report
2.4. Project Gantt Survey on SME Use of Social Technologies' technical specification (p.11-12) provides a clear timetable to be accomplished. All tasks descripted and deliverables will be carried out following Figure 3 Figure 3. Project Gantt
11
This Gantt, although it is already very much thought through, still has to be considered as preliminary because it should be approved and consolidated in the final version of D1.1.
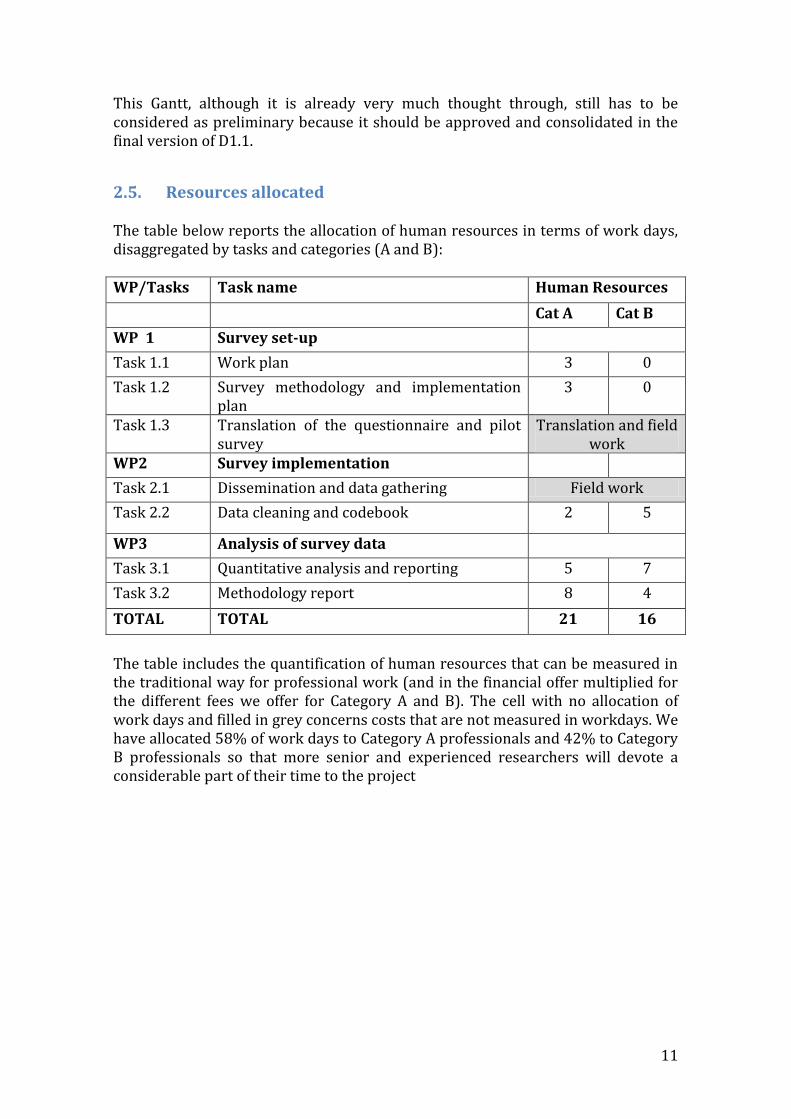
2.5. Resources allocated The table below reports the allocation of human resources in terms of work days, disaggregated by tasks and categories (A and B): WP/Tasks Task name Human Resources
Cat A Cat B
WP 1 Survey set-up
Task 1.1 Work plan 3 0
Task 1.2 Survey methodology and implementation plan
3 0
Task 1.3 Translation of the questionnaire and pilot survey
Translation and field work
WP2 Survey implementation
Task 2.1 Dissemination and data gathering Field work
Task 2.2 Data cleaning and codebook 2 5
WP3 Analysis of survey data
Task 3.1 Quantitative analysis and reporting 5 7
Task 3.2 Methodology report 8 4
TOTAL TOTAL 21 16
The table includes the quantification of human resources that can be measured in the traditional way for professional work (and in the financial offer multiplied for the different fees we offer for Category A and B). The cell with no allocation of work days and filled in grey concerns costs that are not measured in workdays. We have allocated 58% of work days to Category A professionals and 42% to Category B professionals so that more senior and experienced researchers will devote a considerable part of their time to the project
12
3. Methodological set up
3.1. Selection of the target The Technical Specification (section 4.1) stated out that:
The survey target will be at least 600 European small and medium-sized enterprises (n=600)
Coverage will reach at least 6 EU Member States, ensuring a balanced geographical spread (Northern Europe, Southern Europe, post-2004 Member States, etc.)
Coverage should also extend across economic sectors Consider businesses' Internet adoption and overall e-commerce strategy
Therefore in statistical terms this means:
Universe: Small and Medium-sized enterprises Target population: 600 European small and medium-sized enterprises. Coverage:
o Geographically: At least 6 EU Member States, ensuring a balanced geographical spread (Northern Europe, Southern Europe, post-2004 Member States, etc.).
o Sectorial: across economic sectors o ICT adoption: Internet adoption and overall e-commerce strategy
As it was mentioned in out technical offer, the standard practice in survey research is to first define the universe, from which a sample is then extracted. The universe has been contextualised and perfectly identified in Section 1 of the Technical Specification. Moreover, without a minimum set of parameters on the universe of reference, it would be impossible to define, develop and judge the quality of the sample and, especially, to define and assess (whether acceptable or not) the sampling error. Fortunately, official detailed statistics about ICT usage and eCommerce in Enterprise could be looked at EUROSTAT COMMUNITY SURVEY ON ICT USAGE AND E-COMMERCE IN ENTERPRISES2. This survey contains a set of parameters on the universe of reference that allows us to define and develop a sample following geographical, sectorial and ICT adoption coverage. As it was mentioned in the Technical offer we remarked the following:
It is worth pointing out that this data set covers three size class breakdowns: small enterprises: 10–49 persons employed; medium-sized enterprises: 50–249 persons employed and large enterprises: 250 or more persons employed. Unfortunately, there is lack of data regarding micro and mini enterprises to develop a sampling proposal, which included sampling errors. We understand that this was the reason to exclude these enterprises from the study (Technical specification does not contain any references to micro and mini enterprise). However, as it was explained in Section 1.1, due the
2 Available online at http://epp.eurostat.ec.europa.eu/portal/page/portal/information_society/introduction

13
percentage of enterprises in these two categories at EU level if IPTS’ researchers are interested we could include them into the sample randomly. This could be discussed during the kick-off meeting.
IPTS researchers noticed the importance of micro enterprises (less than 10 persons employed) for this study. This issue has raised the following statistical and advisability concerns:
1. Including micro enterprises in this study, who represent approximately 92.5% of all enterprises, would imply having an extremely ample and heterogeneous universe, in which would be comprised enterprises with workers from 1 to 250 and the weight of the smallest enterprises would be overwhelmingly high. Moreover, micro enterprises will presumably contain a high percentage of single person entities and we must also take into account that EUROSTAT COMMUNITY SURVEY ON ICT USAGE AND E-COMMERCE IN ENTERPRISES and EUROSTAT STRUCTURAL BUSINESS STATISTICS do not provide data on micro enterprises breakdowns.
2. Accepting this universe not only involves sampling issues that we will describe below, but the fact that the objectives and content of the questionnaire will be unique although catering to very different enterprises will cause important issues of adjustability and usefulness of results.
3. With the size of the suggested sample in the technical offer n=600, distributed in n=100 per country involved, for the margin of error not to be above +/- 10% (the commonly accepted maximum) the universe must be the most homogeneous possible.
4. If we integrate microenterprises in the Study’s universe, the complexity in terms of sample administration acquires huge proportions. If the distribution of the sample would be proportional (see Table 1), we would be prioritizing microenterprises in such a way that we could conclude that the Study would exclusively cover them. The dedication to Small and Medium enterprises would offer us results with no statistical significance, therefore making it unnecessary to include them in the sample. What would be the sense of having a sample with only 7 to 8 Small and Medium enterprises?
14
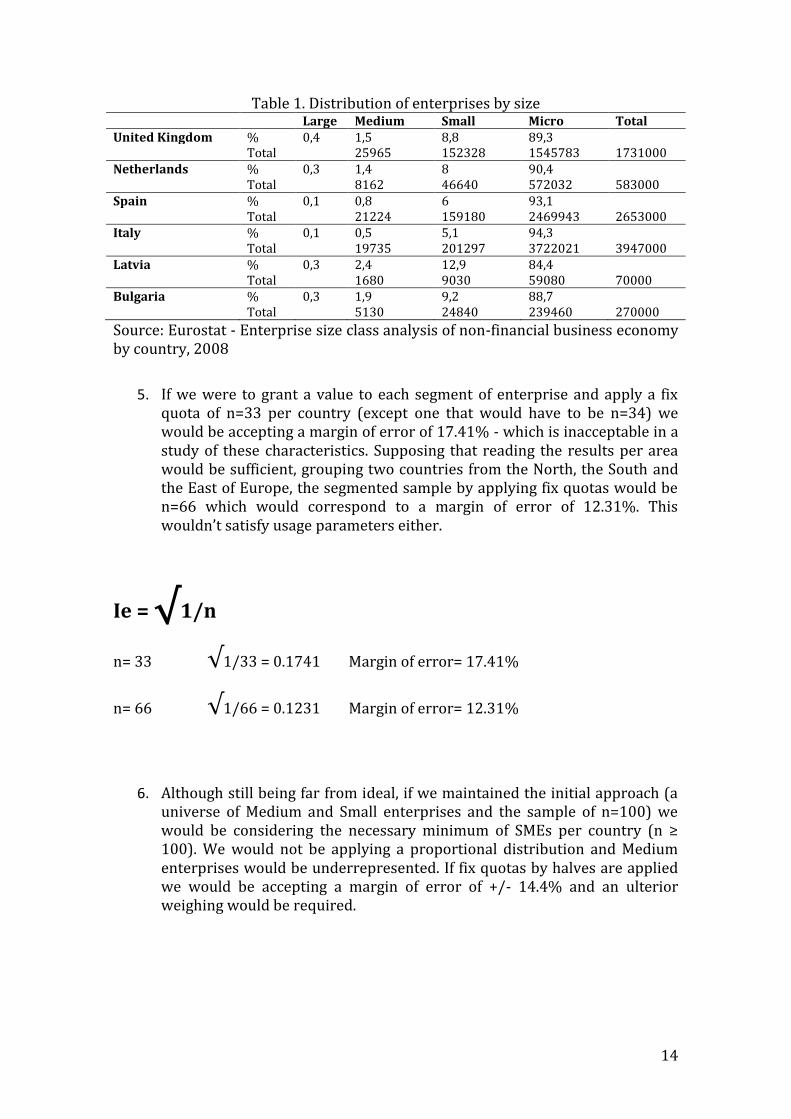
Table 1. Distribution of enterprises by size Large Medium Small Micro Total United Kingdom % 0,4 1,5 8,8 89,3 Total 25965 152328 1545783 1731000 Netherlands % 0,3 1,4 8 90,4 Total 8162 46640 572032 583000 Spain % 0,1 0,8 6 93,1 Total 21224 159180 2469943 2653000 Italy % 0,1 0,5 5,1 94,3 Total 19735 201297 3722021 3947000 Latvia % 0,3 2,4 12,9 84,4 Total 1680 9030 59080 70000 Bulgaria % 0,3 1,9 9,2 88,7 Total 5130 24840 239460 270000
Source: Eurostat - Enterprise size class analysis of non-financial business economy by country, 2008
5. If we were to grant a value to each segment of enterprise and apply a fix quota of n=33 per country (except one that would have to be n=34) we would be accepting a margin of error of 17.41% - which is inacceptable in a study of these characteristics. Supposing that reading the results per area would be sufficient, grouping two countries from the North, the South and the East of Europe, the segmented sample by applying fix quotas would be n=66 which would correspond to a margin of error of 12.31%. This wouldn’t satisfy usage parameters either.
Ie = √1/n
n= 33 √1/33 = 0.1741 Margin of error= 17.41%
n= 66 √1/66 = 0.1231 Margin of error= 12.31%
6. Although still being far from ideal, if we maintained the initial approach (a universe of Medium and Small enterprises and the sample of n=100) we would be considering the necessary minimum of SMEs per country (n ≥ 100). We would not be applying a proportional distribution and Medium enterprises would be underrepresented. If fix quotas by halves are applied we would be accepting a margin of error of +/- 14.4% and an ulterior weighing would be required.
15
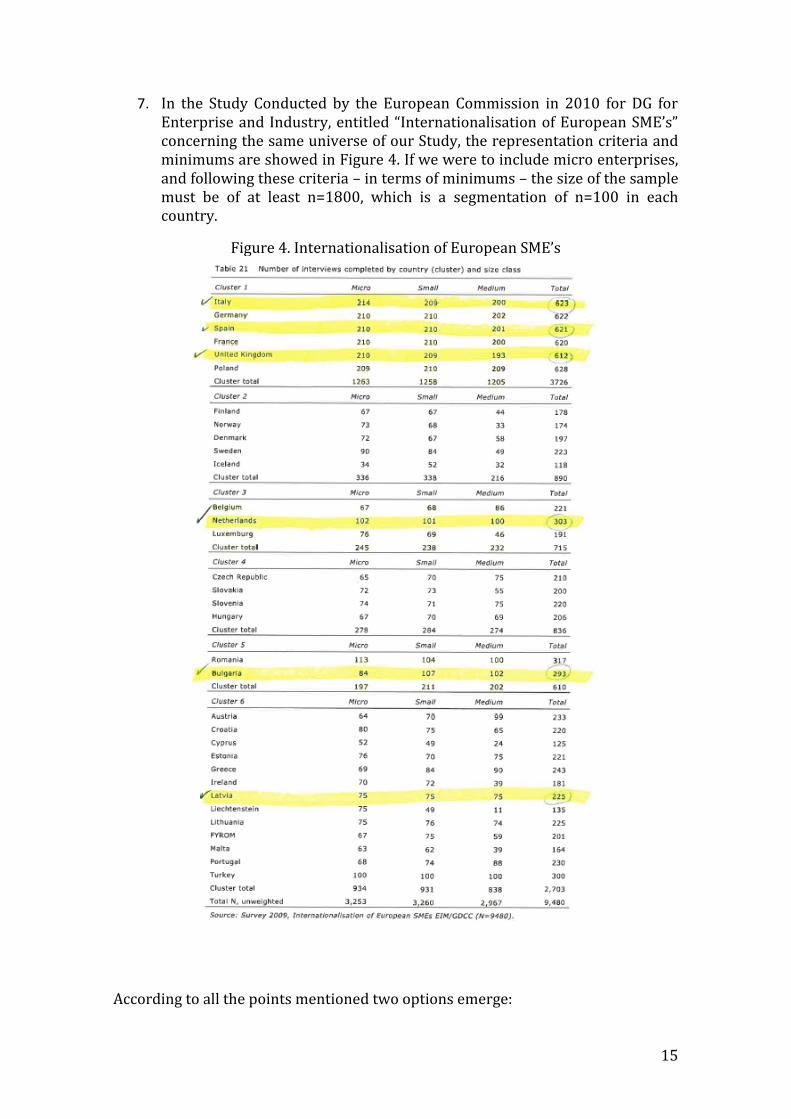
7. In the Study Conducted by the European Commission in 2010 for DG for Enterprise and Industry, entitled “Internationalisation of European SME’s” concerning the same universe of our Study, the representation criteria and minimums are showed in Figure 4. If we were to include micro enterprises, and following these criteria – in terms of minimums – the size of the sample must be of at least n=1800, which is a segmentation of n=100 in each country.
Figure 4. Internationalisation of European SME’s
According to all the points mentioned two options emerge:
16
A. To present this study exclusively for Small and Medium enterprises, as it
was foreseen initially and with a sample distribution that in the worst case scenario would provide information on both segments with an equivalent statistical signification.
B. To present a study of Micro enterprises, taking into consideration the large
existing diversity between them and the lack of information on their size distribution and ICT use by EUROSTAT, which would oblige us to have to collect data from various different sources in each country.
Due to statistical significance we strongly recommend option A. Moreover, if option B were selected we also face problems related with:
Social media jargon
Awareness of the respondents
Lack of breakdown data at EUROSTAT COMMUNITY SURVEY ON ICT USAGE AND E-COMMERCE IN ENTERPRISES and EUROSTAT STRUCTURAL BUSINESS STATISTICS.
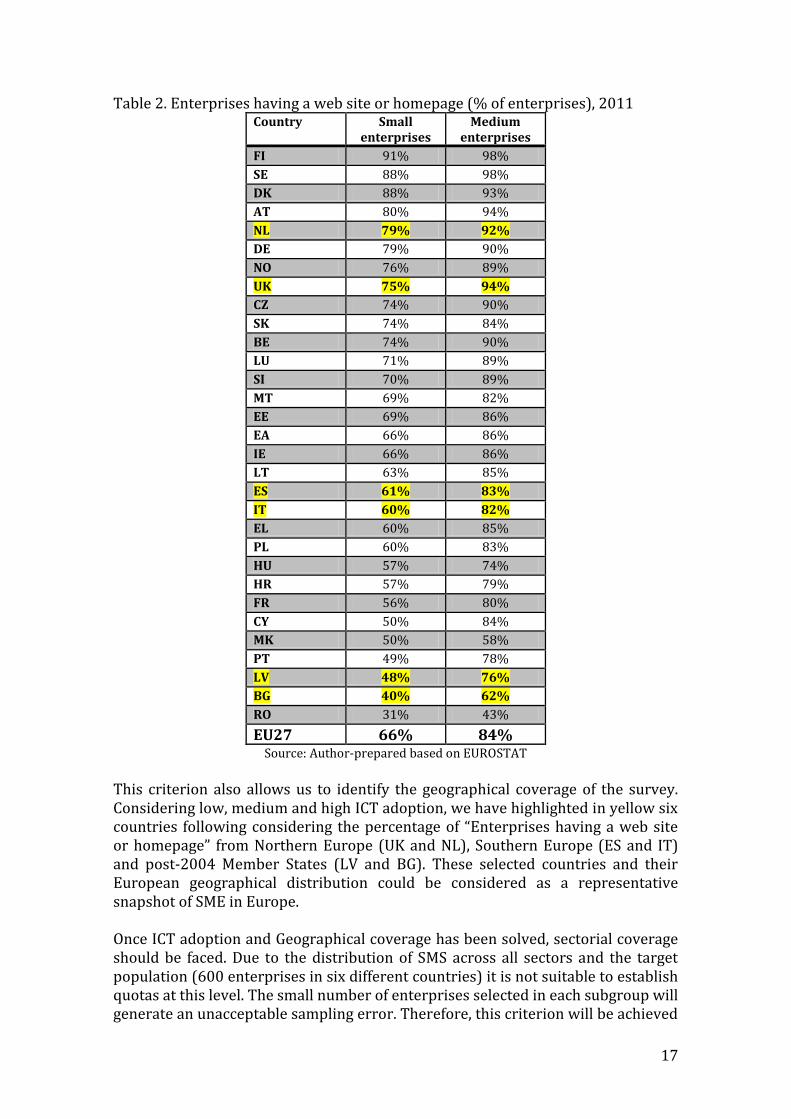
3.2. Sampling proposal Stratified Random Sampling will be used to select the SME. This probabilistic sampling method, also called proportional or quota random sampling, involves dividing the population of the universe into homogeneous subgroups and then taking a simple random sample in each subgroup. This technique assures that it will be possible to represent not only the overall population, but also key subgroups. Furthermore, sampling errors could be calculated to each subgroup and the target group. To develop these quotas, firstly, we tackle ICT adoption utilising the variable “Enterprises having a web site or homepage (e_web)”. This is the best starting baseline to tackle ICT adoption and eCommerce as it could be consider a first step to SNSM.
17
Table 2. Enterprises having a web site or homepage (% of enterprises), 2011 Country Small
enterprises Medium
enterprises
FI 91% 98%
SE 88% 98%
DK 88% 93%
AT 80% 94%
NL 79% 92%
DE 79% 90%
NO 76% 89%
UK 75% 94%
CZ 74% 90%
SK 74% 84%
BE 74% 90%
LU 71% 89%
SI 70% 89%
MT 69% 82%
EE 69% 86%
EA 66% 86%
IE 66% 86%
LT 63% 85%
ES 61% 83%
IT 60% 82%
EL 60% 85%
PL 60% 83%
HU 57% 74%
HR 57% 79%
FR 56% 80%
CY 50% 84%
MK 50% 58%
PT 49% 78%
LV 48% 76%
BG 40% 62%
RO 31% 43%
EU27 66% 84% Source: Author-prepared based on EUROSTAT
This criterion also allows us to identify the geographical coverage of the survey. Considering low, medium and high ICT adoption, we have highlighted in yellow six countries following considering the percentage of “Enterprises having a web site or homepage” from Northern Europe (UK and NL), Southern Europe (ES and IT) and post-2004 Member States (LV and BG). These selected countries and their European geographical distribution could be considered as a representative snapshot of SME in Europe. Once ICT adoption and Geographical coverage has been solved, sectorial coverage should be faced. Due to the distribution of SMS across all sectors and the target population (600 enterprises in six different countries) it is not suitable to establish quotas at this level. The small number of enterprises selected in each subgroup will generate an unacceptable sampling error. Therefore, this criterion will be achieved
18
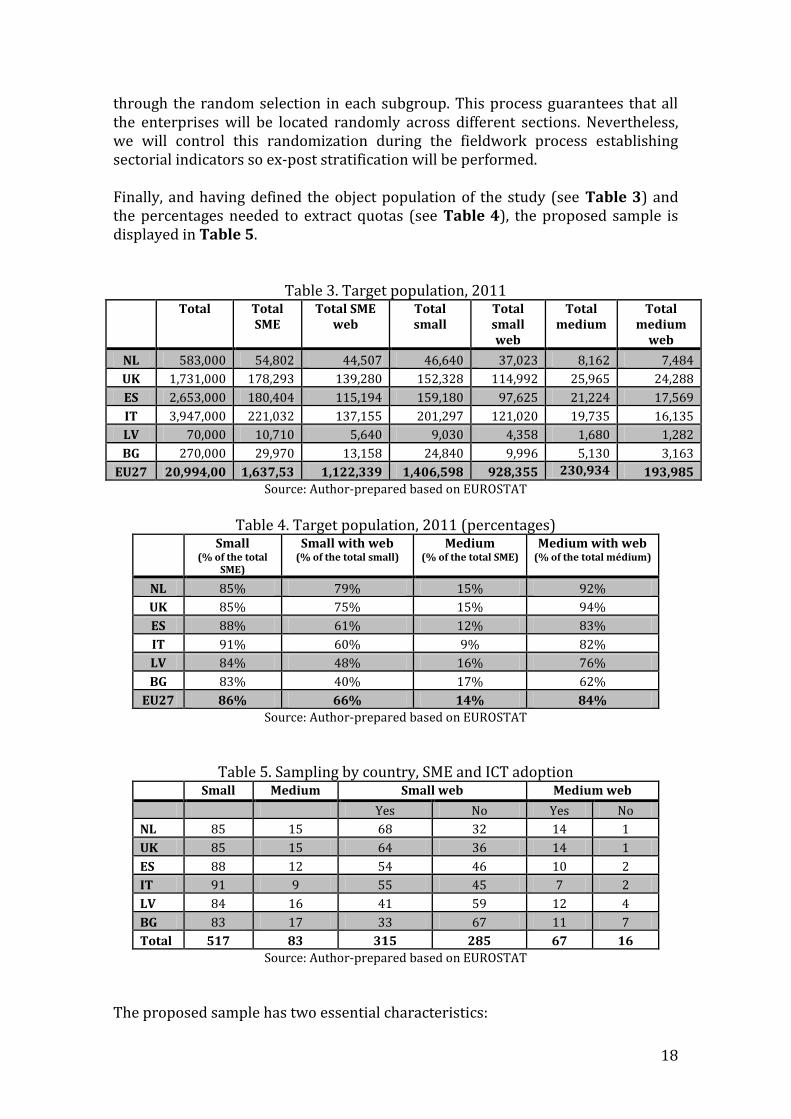
through the random selection in each subgroup. This process guarantees that all the enterprises will be located randomly across different sections. Nevertheless, we will control this randomization during the fieldwork process establishing sectorial indicators so ex-post stratification will be performed. Finally, and having defined the object population of the study (see Table 3) and the percentages needed to extract quotas (see Table 4), the proposed sample is displayed in Table 5.
Table 3. Target population, 2011 Total Total
SME Total SME
web Total small
Total small web
Total medium
Total medium
web
NL 583,000 54,802 44,507 46,640 37,023 8,162 7,484
UK 1,731,000 178,293 139,280 152,328 114,992 25,965 24,288
ES 2,653,000 180,404 115,194 159,180 97,625 21,224 17,569
IT 3,947,000 221,032 137,155 201,297 121,020 19,735 16,135
LV 70,000 10,710 5,640 9,030 4,358 1,680 1,282
BG 270,000 29,970 13,158 24,840 9,996 5,130 3,163
EU27 20,994,00 1,637,53 1,122,339 1,406,598 928,355 230,934 193,985
Source: Author-prepared based on EUROSTAT
Table 4. Target population, 2011 (percentages)
Small (% of the total
SME)
Small with web (% of the total small)
Medium (% of the total SME)
Medium with web (% of the total médium)
NL 85% 79% 15% 92%
UK 85% 75% 15% 94%
ES 88% 61% 12% 83%
IT 91% 60% 9% 82%
LV 84% 48% 16% 76%
BG 83% 40% 17% 62%
EU27 86% 66% 14% 84%
Source: Author-prepared based on EUROSTAT
Table 5. Sampling by country, SME and ICT adoption Small Medium Small web Medium web
Yes No Yes No
NL 85 15 68 32 14 1
UK 85 15 64 36 14 1
ES 88 12 54 46 10 2
IT 91 9 55 45 7 2
LV 84 16 41 59 12 4
BG 83 17 33 67 11 7
Total 517 83 315 285 67 16
Source: Author-prepared based on EUROSTAT
The proposed sample has two essential characteristics:
19
Firstly, an equal size sample has been chosen for each one of the countries being studied (100 enterprises). This will lead to an equal level of reliability in the results obtained in each one of the countries, due to the representativeness of each sample in each country.
Secondly, the choice was made to use a fully representative sample for the distribution of the target population, according to country, SME and ICT adoption, which means that there is no need for any ex post weighting to be applied to interpret the data.
Thirdly, to interpret the results at EU level weights will be applied to data gathered following EUROSTAT distribution of SME.
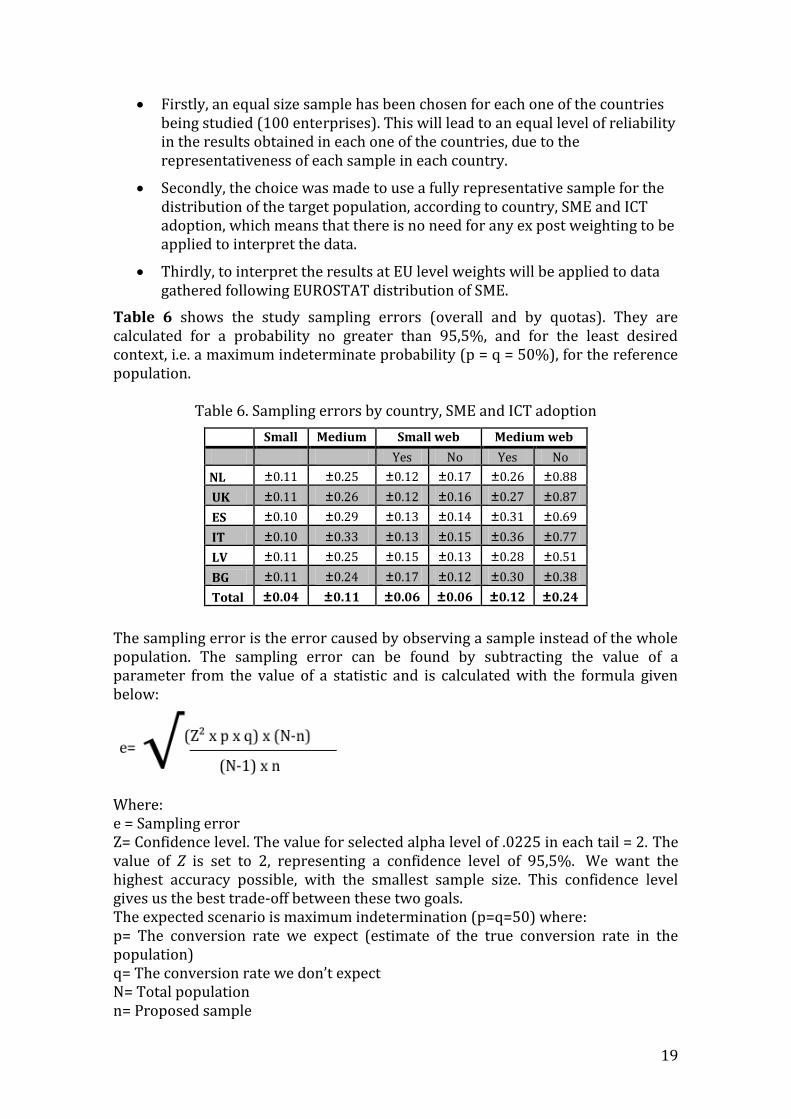
Table 6 shows the study sampling errors (overall and by quotas). They are calculated for a probability no greater than 95,5%, and for the least desired context, i.e. a maximum indeterminate probability (p = q = 50%), for the reference population.
Table 6. Sampling errors by country, SME and ICT adoption
Small Medium Small web Medium web
Yes No Yes No
NL ±0.11 ±0.25 ±0.12 ±0.17 ±0.26 ±0.88
UK ±0.11 ±0.26 ±0.12 ±0.16 ±0.27 ±0.87
ES ±0.10 ±0.29 ±0.13 ±0.14 ±0.31 ±0.69
IT ±0.10 ±0.33 ±0.13 ±0.15 ±0.36 ±0.77
LV ±0.11 ±0.25 ±0.15 ±0.13 ±0.28 ±0.51
BG ±0.11 ±0.24 ±0.17 ±0.12 ±0.30 ±0.38
Total ±0.04 ±0.11 ±0.06 ±0.06 ±0.12 ±0.24
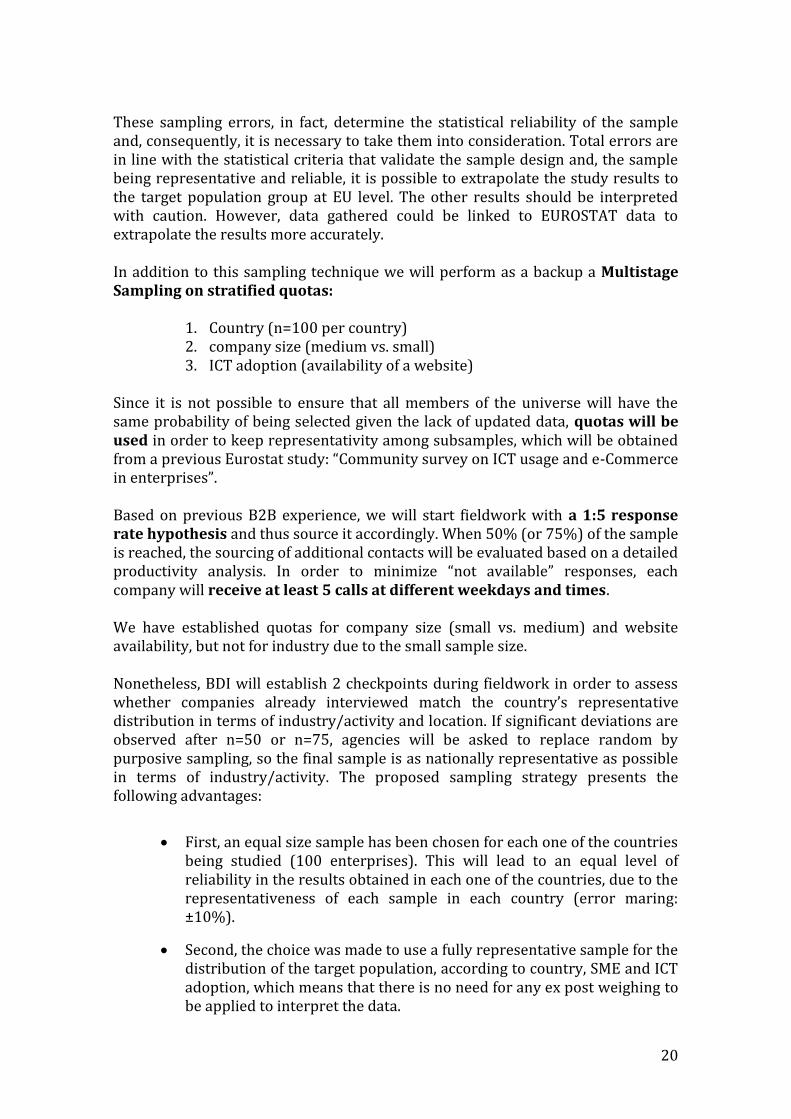
The sampling error is the error caused by observing a sample instead of the whole population. The sampling error can be found by subtracting the value of a parameter from the value of a statistic and is calculated with the formula given below:
Where: e = Sampling error Z= Confidence level. The value for selected alpha level of .0225 in each tail = 2. The value of Z is set to 2, representing a confidence level of 95,5%. We want the highest accuracy possible, with the smallest sample size. This confidence level gives us the best trade-off between these two goals. The expected scenario is maximum indetermination (p=q=50) where: p= The conversion rate we expect (estimate of the true conversion rate in the population) q= The conversion rate we don’t expect N= Total population n= Proposed sample
20
These sampling errors, in fact, determine the statistical reliability of the sample and, consequently, it is necessary to take them into consideration. Total errors are in line with the statistical criteria that validate the sample design and, the sample being representative and reliable, it is possible to extrapolate the study results to the target population group at EU level. The other results should be interpreted with caution. However, data gathered could be linked to EUROSTAT data to extrapolate the results more accurately. In addition to this sampling technique we will perform as a backup a Multistage Sampling on stratified quotas:
1. Country (n=100 per country) 2. company size (medium vs. small) 3. ICT adoption (availability of a website)
Since it is not possible to ensure that all members of the universe will have the same probability of being selected given the lack of updated data, quotas will be used in order to keep representativity among subsamples, which will be obtained from a previous Eurostat study: “Community survey on ICT usage and e-Commerce in enterprises”. Based on previous B2B experience, we will start fieldwork with a 1:5 response rate hypothesis and thus source it accordingly. When 50% (or 75%) of the sample is reached, the sourcing of additional contacts will be evaluated based on a detailed productivity analysis. In order to minimize “not available” responses, each company will receive at least 5 calls at different weekdays and times. We have established quotas for company size (small vs. medium) and website availability, but not for industry due to the small sample size. Nonetheless, BDI will establish 2 checkpoints during fieldwork in order to assess whether companies already interviewed match the country’s representative distribution in terms of industry/activity and location. If significant deviations are observed after n=50 or n=75, agencies will be asked to replace random by purposive sampling, so the final sample is as nationally representative as possible in terms of industry/activity. The proposed sampling strategy presents the following advantages:
First, an equal size sample has been chosen for each one of the countries being studied (100 enterprises). This will lead to an equal level of reliability in the results obtained in each one of the countries, due to the representativeness of each sample in each country (error maring: ±10%).
Second, the choice was made to use a fully representative sample for the distribution of the target population, according to country, SME and ICT adoption, which means that there is no need for any ex post weighing to be applied to interpret the data.
21
Third, to interpret the results at EU level, weights will be applied to data gathered following EUROSTAT distribution of SME.
Fourth, this technique assures that it will be possible to represent not only the overall population, but also key segments. Furthermore, sampling errors could be calculated to each subgroup and the target group.
3.3. Translation of the questionnaire We will adopt for translation a back-translation method combined with monolingual test. This allows detection and correction of discrepancies between source and target language versions, as well as a test for clarity and appropriate use with subjects who are monolingual in the target language. This method works as follows. First, a qualified translator carries out translation of the survey from the source language (English) into the target language. Second, another professional translator will translate the target language version back into English. Third, both source language versions will be compared. Finally, the target language version will be tested among monolingual subjects. The final version of each questionnaire will be programmed into a secure online platform specifically designed for survey research. Although the survey will not use the online channel, the telephone interviews will use a web-CATI: phone interviewing with real-time online data input (also known as “web-CATI” where CATI stands for Computer Assisted Telephone interviews). Once programmed, the questionnaire it is internally tested in two phases. First, Block de Ideas (henceforth BDI) Quality Control team will ensure that:
All questions exactly match the paper version questions, both in wording and order
Questionnaire logic works correctly (routing, conditions, inconsistencies, etc.).
Messages and instructions are clear and appropriately located in the questionnaire
Data file generated after survey is complete and consistent.
This version will provide the interviewers with special remarks regarding need of explanation of concepts, ethical issues such as privacy and confidentiality of the data; an informed consent and clear instructions that address the respect to respondents' dignity, and interest and benefit to participate will be considered. Before launching the final questionnaire for data collection, a pilot study is planned in three countries, one per each of the three macro-groups described in the previous paragraph with at least 20 valid testers (so 60 completed interviews in total). Particular focus will be placed on the clarity of the various SNSMs tools and of their relation to purpose, as well as to organisational context and practices. As a result, it will be ascertained whether or not any questions generate confusions, misunderstanding, rejection, top of the head replies, and whether or not the order is logical and also the length of the questionnaire acceptable. The reliability and
22
validity of the questionnaire will also be tested. The reliability of the questionnaire will be assessed in terms of consistency (using Cronbach's alpha analysis), temporal stability (test-retest for 10% of the interviews) and inter-observer agreement (using percentage agreement and the Kappa index).
3.4. Implementation of the survey – dissemination strategy
3.4.1. Interviewer selection and briefing
All interviewers to be deployed for this survey, irrespective of the fact whether employed by BDI or by the sub-contractors, will result from a comprehensive selection process the philosophy of which is recruiting candidates that excel in personal communication skills in terms of etiquette, linguistic ability, empathy, accuracy, attention to detail, persuasion, time management and above all, multi-cultural sensitivity. The selection process is structured in the following steps:
CV reception (spontaneous candidacies or advertised positions)
CV evaluation and screening
Initial phone contact
Secondary screening based on phone conversation
Face-to-face in-depth interview at our premises
Job offer and conditions explanation
Initial training on market research and company policies
Trial period (first market research study)
Performance evaluation and contracting decision
Additional training and mentoring
Candidates with prior experience in survey research, customer service or other activities where strong interpersonal communication skills are essential are also given preference, as well as candidates who have volunteered or done some type of community work. The following are the personal features sought when hiring interviewers:
Higher education (even if not completed)
Intermediate-high cultural level
Speech clarity & neutral accent
Appropriate voice pitch and intonation
Empathy
Objectivity
Seriousness
Commitment
23
Attention to detail
Accuracy
Synthetic ability
Computer literacy
For each specific study, BDI and its partners follow also the standard good practice of screening interviewers as to select those that might have already a good grasp of the domain at stake. In this case the plus would be familiarity with SNSMs in general and with the world of SMEs. At any rate all interviewers undergo a general training with the following modules:
Overview on market research: main uses and methodologies
Basic principles of personal data protection regulations (national and European)
Occupational Risk Prevention
Interviewing techniques: web-CATI
Additionally, all interviewers will undergo a specific briefing on this project, which will consist of the following items:
Framework (European Commission, IPTS, Digital Agenda, SNSMs usage in SME and enterprises in general)
Study Objectives (evidence base for policy making)
Workflow and follow-up protocols
Possible anomalies (also referred to as incidences)
Glossary & questionnaire terminology
Performance & quality monitoring criteria:
o Reading all questions literally (no omissions nor shortcuts)
o Keeping question order strictly
o No answer deduction nor interpretation with assistance with linguistic difficulties
o Asking only actual questions and no leading questions
o Not addressing external topics
o Not expressing a particular approach or opinion
o Not accepting ambiguous answers (politely re-asking or probing)
o Ability to create a mutual trust environment
o Showing courtesy and respect for respondent’s time at all times (no pushing)
o Allowing enough time for respondent to answer while attempting to keep interview dynamic and assisting respondent in case of linguistic difficulties
o Adaptation to respondent’s schedule, interferences and logistical needs
24
o Ability to convey respect for respondent’s culture and possible linguistic limitations.
3.4.2. Target recruitment procedures – or dissemination strategy
As we explained in the technical offer in relation to the sampling design, for strong methodological reasons we ruled out online dissemination. In all countries we will start from Dun&Bradstreet GRS Europa, which includes more than 65m companies across Europe. The selection of this source is justified as follow:
The diversity in public registries of companies in each country is problematic due to the different sources where they are generated (Chambers of Commerce, Ministries of Industry and government Agencies), their different formats, breadth and accuracy.
Commercial databases also vary across markets both terms of quantity and quality of data.
In order to ensure homogeneity in database quality across all markets, we propose to source the companies database from Dun & Bradstreet, the world’s leading provider of commercial information, with 170 of history and data on more than 205 million companies worldwide.
BDI will source enough SMEs contacts for each country and transfer them to each agency for fieldwork deployment. These contacts will be randomly selected from the D&B database in each country.
Within the selected SMEs, we will aim to interview different types of respondents based on the company size and activity, as the ability to respond to the questionnaire will be greatly based on those two parameters. In the smallest companies, we will aim for top-management positions (such as the owners or general managers), but may probe administrative staff (such as secretaries or clerks) to verify whether they are sufficiently informed on the matter. In the largest companies of the sample, we will aim for employees working in either marketing, sales or IT departments, who might be more informed than mid-level managers. In all cases the respondent should be a decision-maker. .
3.4.3. Web CATI survey procedures
Due to the interview selection process and interviewers briefing explained the interviewers will carry out the following: Before doing the interview, interviewers are expected to:
Identify and contact the target to be interviewed and make sure the interview will be done without interference;
Describe with accuracy and brevity the objective of the study as well as the estimated duration of the interview or offer the possibility of an appointment at a later time/date;
25
Checking that the candidate meets all screening criteria and qualifies for the interview;
Obtain the informed consent.
During the interview, interviewers are expected to:
Satisfactorily answer any pertinent question from interviewees;
Read questions completely and clearly, as well as all answer items when applicable;
Clarify any interpretation doubts that may arise for any question ;
Type answers without missing any relevant information
Being patient and assisting respondents with linguistic difficulties understanding the questions;
Common problems due to interviewers sub-standard performance are:
Questionnaire is administered incorrectly because questions are read incorrectly and answers are recorded incorrectly.
Questions are asked without a neutral, objective note, highlighting words that may induce to a specific interpretation or answer.
Replies to interviewees’ queries are not homogeneous and/or the attitude in addressing them is not courteous and helpful.
Interviewers will be warned that these are also crucial aspects for the successful completion of the questionnaire and that quality control monitoring will also verify their performance on these interviewing aspects. After the interview has been completed, interviewers are expected to:
Thank respondents for their time and consideration;
Inform respondents that their personal data will be treated with confidentiality and will be deleted after the study is completed;
Inform respondents of the possibility of getting a brief quality control (verification) call by another interviewer;
26
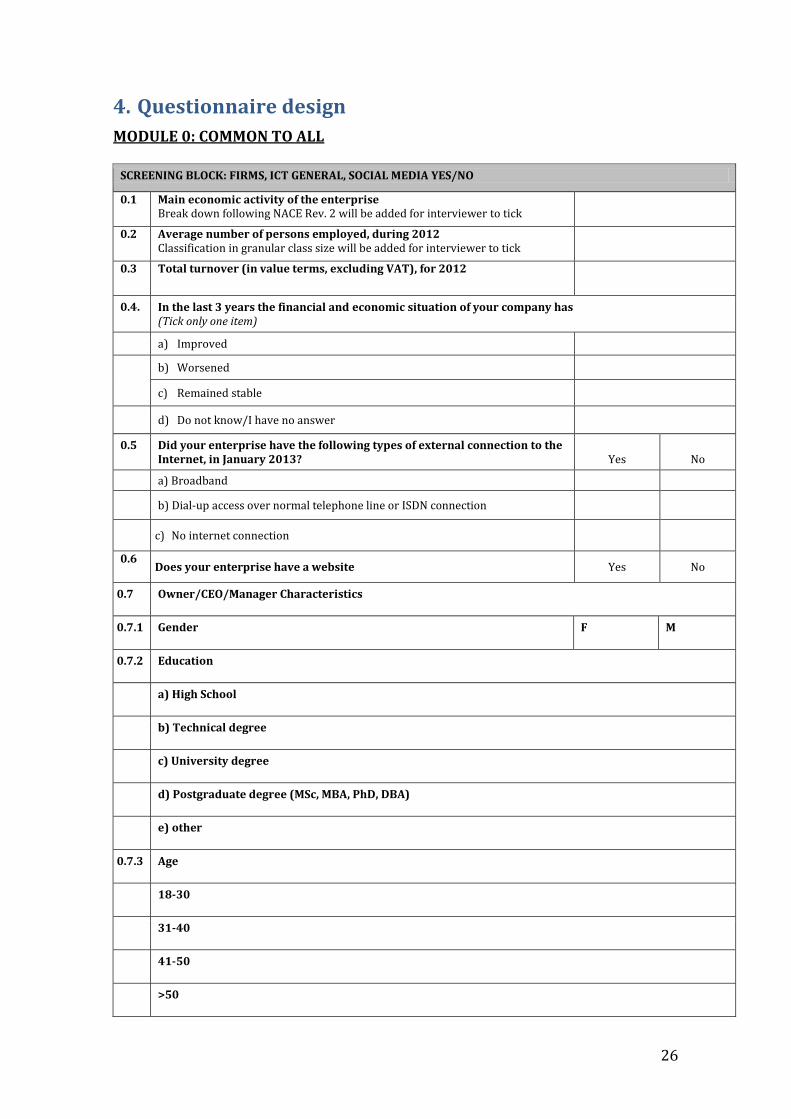
4. Questionnaire design
MODULE 0: COMMON TO ALL
SCREENING BLOCK: FIRMS, ICT GENERAL, SOCIAL MEDIA YES/NO
0.1 Main economic activity of the enterprise Break down following NACE Rev. 2 will be added for interviewer to tick
0.2 Average number of persons employed, during 2012 Classification in granular class size will be added for interviewer to tick
0.3 Total turnover (in value terms, excluding VAT), for 2012
0.4. In the last 3 years the financial and economic situation of your company has (Tick only one item)
a) Improved
b) Worsened
c) Remained stable
d) Do not know/I have no answer
0.5 Did your enterprise have the following types of external connection to the Internet, in January 2013? Yes No
a) Broadband
b) Dial-up access over normal telephone line or ISDN connection
c) No internet connection
0.6 Does your enterprise have a website Yes No
0.7 Owner/CEO/Manager Characteristics
0.7.1 Gender F M
0.7.2 Education
a) High School
b) Technical degree
c) University degree
d) Postgraduate degree (MSc, MBA, PhD, DBA)
e) other
0.7.3 Age
18-30
31-40
41-50
>50
27
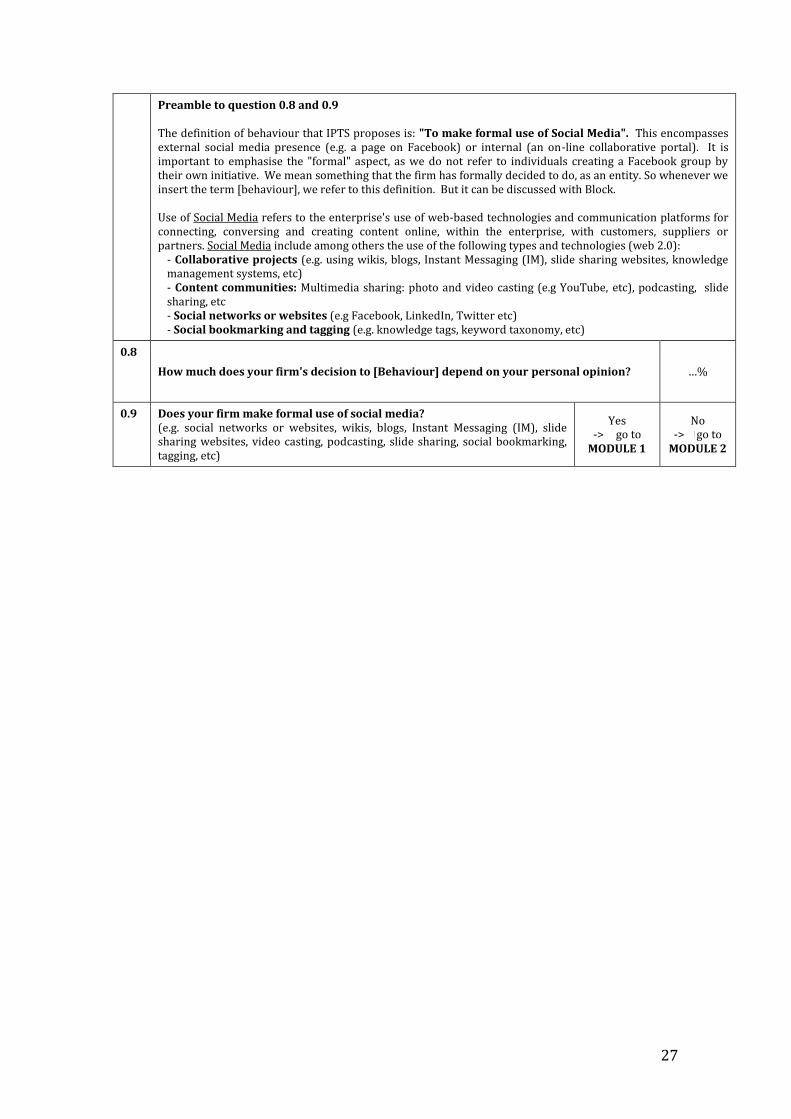
Preamble to question 0.8 and 0.9 The definition of behaviour that IPTS proposes is: "To make formal use of Social Media". This encompasses external social media presence (e.g. a page on Facebook) or internal (an on-line collaborative portal). It is important to emphasise the "formal" aspect, as we do not refer to individuals creating a Facebook group by their own initiative. We mean something that the firm has formally decided to do, as an entity. So whenever we insert the term [behaviour], we refer to this definition. But it can be discussed with Block. Use of Social Media refers to the enterprise's use of web-based technologies and communication platforms for connecting, conversing and creating content online, within the enterprise, with customers, suppliers or partners. Social Media include among others the use of the following types and technologies (web 2.0):
- Collaborative projects (e.g. using wikis, blogs, Instant Messaging (IM), slide sharing websites, knowledge management systems, etc) - Content communities: Multimedia sharing: photo and video casting (e.g YouTube, etc), podcasting, slide sharing, etc - Social networks or websites (e.g Facebook, LinkedIn, Twitter etc) - Social bookmarking and tagging (e.g. knowledge tags, keyword taxonomy, etc)
0.8
How much does your firm's decision to [Behaviour] depend on your personal opinion? …%
0.9 Does your firm make formal use of social media? (e.g. social networks or websites, wikis, blogs, Instant Messaging (IM), slide sharing websites, video casting, podcasting, slide sharing, social bookmarking, tagging, etc)
Yes -> go to
MODULE 1
No -> go to
MODULE 2
28
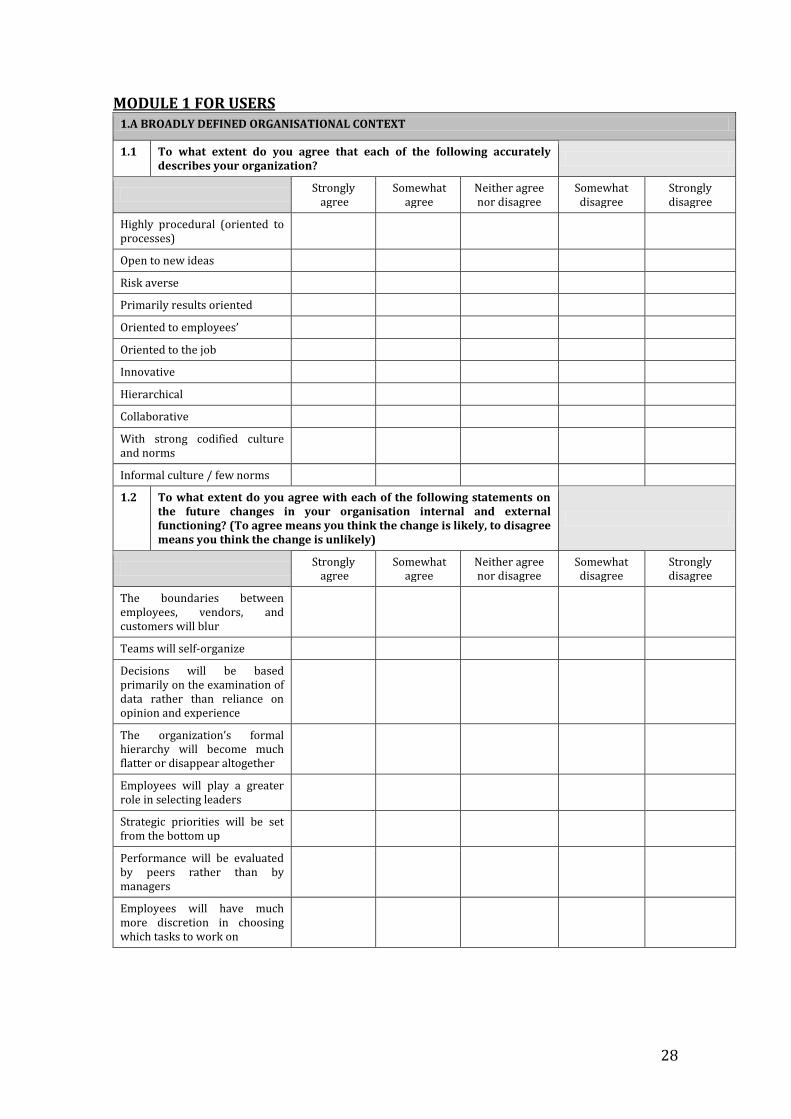
MODULE 1 FOR USERS 1.A BROADLY DEFINED ORGANISATIONAL CONTEXT
1.1 To what extent do you agree that each of the following accurately describes your organization?
Strongly
agree Somewhat
agree Neither agree nor disagree
Somewhat disagree
Strongly disagree
Highly procedural (oriented to processes)
Open to new ideas
Risk averse
Primarily results oriented
Oriented to employees’
Oriented to the job
Innovative
Hierarchical
Collaborative
With strong codified culture and norms
Informal culture / few norms
1.2 To what extent do you agree with each of the following statements on the future changes in your organisation internal and external functioning? (To agree means you think the change is likely, to disagree means you think the change is unlikely)
Strongly
agree Somewhat
agree Neither agree nor disagree
Somewhat disagree
Strongly disagree
The boundaries between employees, vendors, and customers will blur
Teams will self-organize
Decisions will be based primarily on the examination of data rather than reliance on opinion and experience
The organization’s formal hierarchy will become much flatter or disappear altogether
Employees will play a greater role in selecting leaders
Strategic priorities will be set from the bottom up
Performance will be evaluated by peers rather than by managers
Employees will have much more discretion in choosing which tasks to work on
29
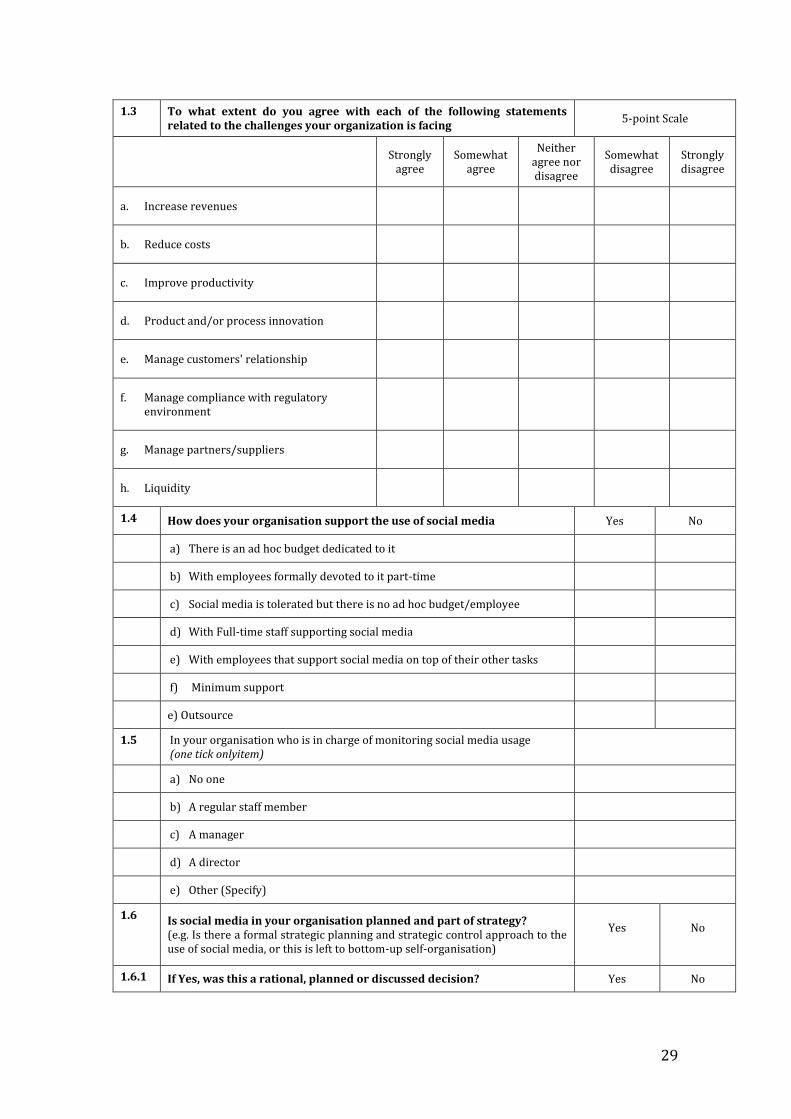
1.3 To what extent do you agree with each of the following statements related to the challenges your organization is facing
5-point Scale
Strongly
agree Somewhat
agree
Neither agree nor disagree
Somewhat disagree
Strongly disagree
a. Increase revenues
b. Reduce costs
c. Improve productivity
d. Product and/or process innovation
e. Manage customers' relationship
f. Manage compliance with regulatory environment
g. Manage partners/suppliers
h. Liquidity
1.4 How does your organisation support the use of social media Yes No
a) There is an ad hoc budget dedicated to it
b) With employees formally devoted to it part-time
c) Social media is tolerated but there is no ad hoc budget/employee
d) With Full-time staff supporting social media
e) With employees that support social media on top of their other tasks
f) Minimum support
e) Outsource
1.5 In your organisation who is in charge of monitoring social media usage (one tick onlyitem)
a) No one
b) A regular staff member
c) A manager
d) A director
e) Other (Specify)
1.6 Is social media in your organisation planned and part of strategy? (e.g. Is there a formal strategic planning and strategic control approach to the use of social media, or this is left to bottom-up self-organisation)
Yes
No
1.6.1 If Yes, was this a rational, planned or discussed decision? Yes No
30
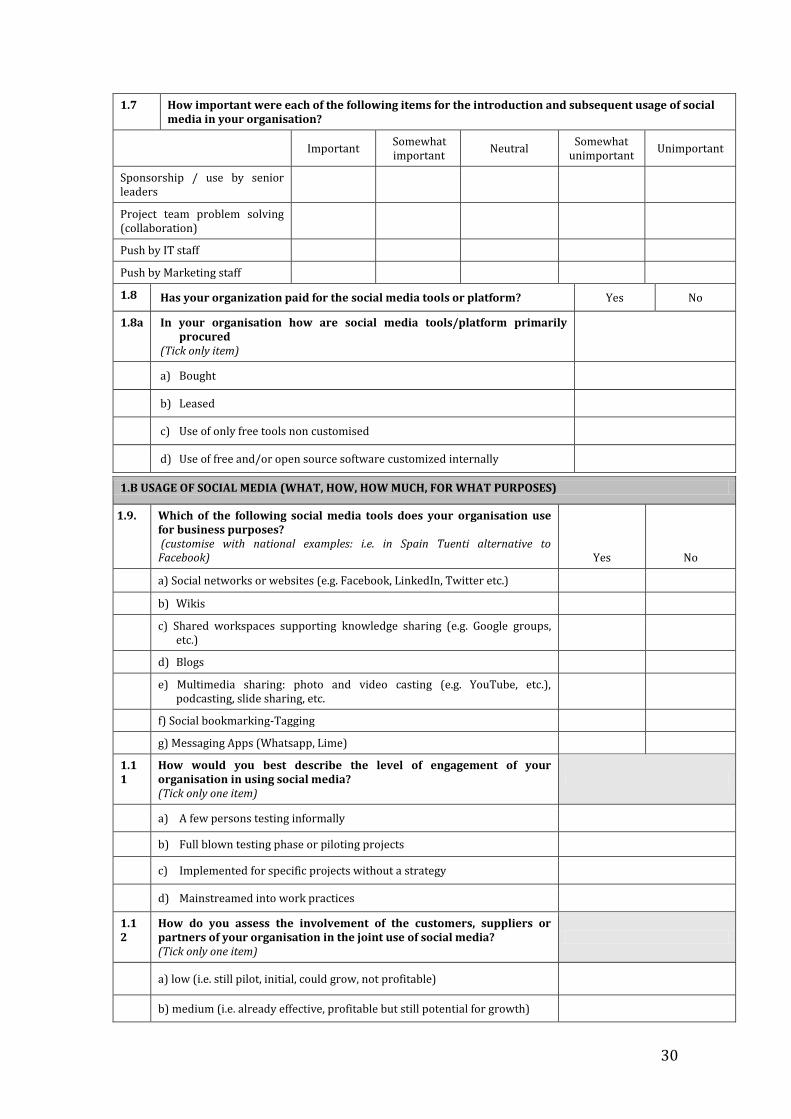
1.7 How important were each of the following items for the introduction and subsequent usage of social media in your organisation?
Important Somewhat important
Neutral Somewhat
unimportant Unimportant
Sponsorship / use by senior leaders
Project team problem solving (collaboration)
Push by IT staff
Push by Marketing staff
1.8 Has your organization paid for the social media tools or platform? Yes No
1.8a In your organisation how are social media tools/platform primarily procured
(Tick only item)
a) Bought
b) Leased
c) Use of only free tools non customised
d) Use of free and/or open source software customized internally
1.B USAGE OF SOCIAL MEDIA (WHAT, HOW, HOW MUCH, FOR WHAT PURPOSES)
1.9. Which of the following social media tools does your organisation use for business purposes? (customise with national examples: i.e. in Spain Tuenti alternative to Facebook) Yes No
a) Social networks or websites (e.g. Facebook, LinkedIn, Twitter etc.)
b) Wikis
c) Shared workspaces supporting knowledge sharing (e.g. Google groups,
etc.)
d) Blogs
e) Multimedia sharing: photo and video casting (e.g. YouTube, etc.),
podcasting, slide sharing, etc.
f) Social bookmarking-Tagging
g) Messaging Apps (Whatsapp, Lime)
1.11
How would you best describe the level of engagement of your organisation in using social media? (Tick only one item)
a) A few persons testing informally
b) Full blown testing phase or piloting projects
c) Implemented for specific projects without a strategy
d) Mainstreamed into work practices
1.12
How do you assess the involvement of the customers, suppliers or partners of your organisation in the joint use of social media? (Tick only one item)
a) low (i.e. still pilot, initial, could grow, not profitable)
b) medium (i.e. already effective, profitable but still potential for growth)
31
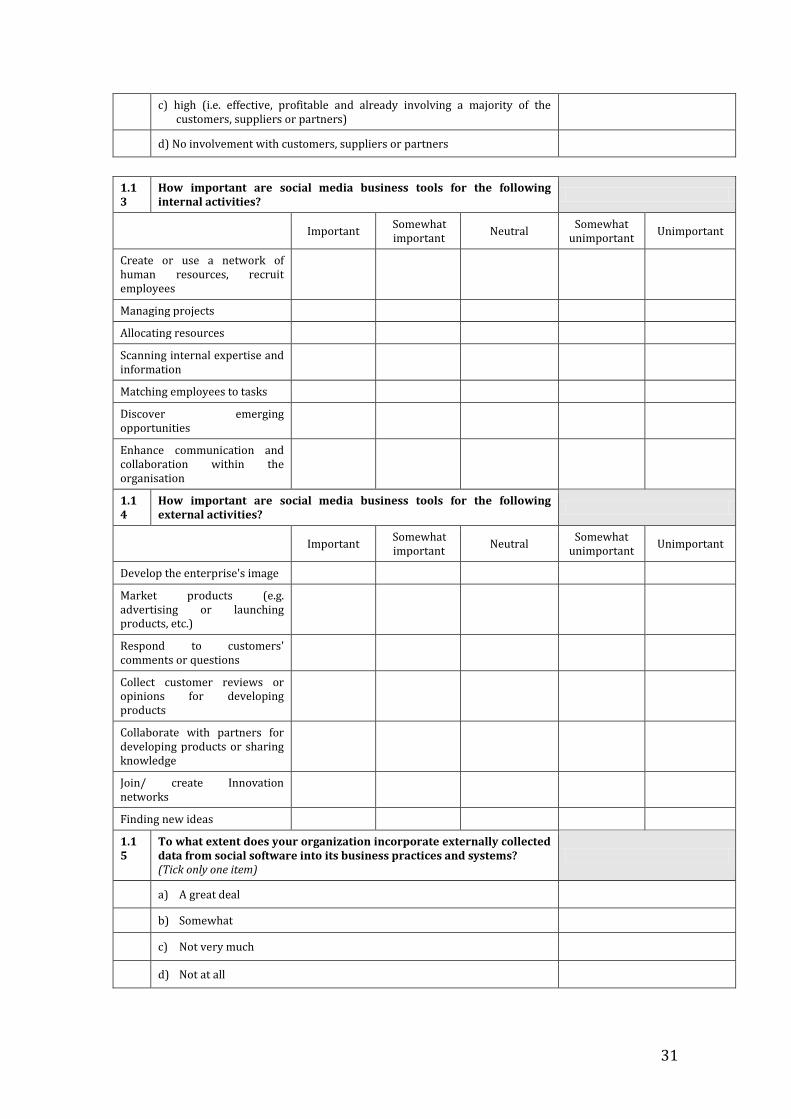
c) high (i.e. effective, profitable and already involving a majority of the
customers, suppliers or partners)
d) No involvement with customers, suppliers or partners
1.13
How important are social media business tools for the following internal activities?
Important Somewhat important
Neutral Somewhat
unimportant Unimportant
Create or use a network of human resources, recruit employees
Managing projects
Allocating resources
Scanning internal expertise and information
Matching employees to tasks
Discover emerging opportunities
Enhance communication and collaboration within the organisation
1.14
How important are social media business tools for the following external activities?
Important Somewhat important
Neutral Somewhat
unimportant Unimportant
Develop the enterprise's image
Market products (e.g. advertising or launching products, etc.)
Respond to customers' comments or questions
Collect customer reviews or opinions for developing products
Collaborate with partners for developing products or sharing knowledge
Join/ create Innovation networks
Finding new ideas
1.15
To what extent does your organization incorporate externally collected data from social software into its business practices and systems? (Tick only one item)
a) A great deal
b) Somewhat
c) Not very much
d) Not at all
32
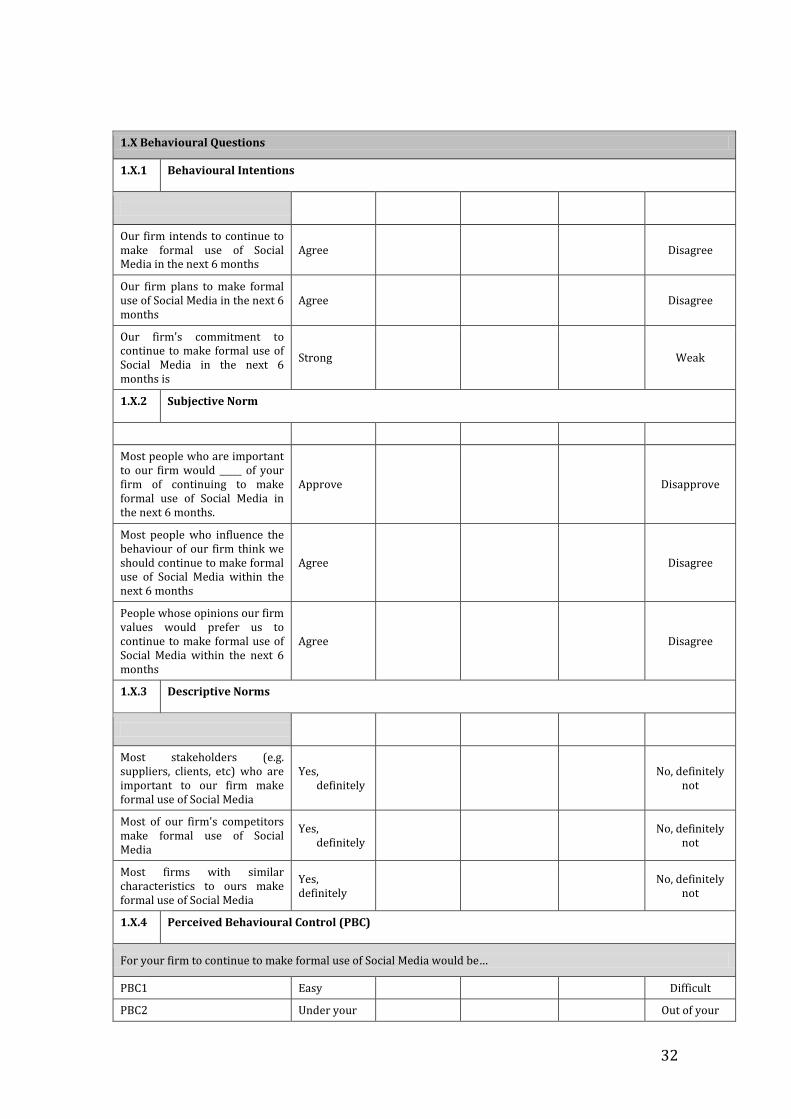
1.X Behavioural Questions
1.X.1 Behavioural Intentions
Our firm intends to continue to make formal use of Social Media in the next 6 months
Agree Disagree
Our firm plans to make formal use of Social Media in the next 6 months
Agree Disagree
Our firm's commitment to continue to make formal use of Social Media in the next 6 months is
Strong Weak
1.X.2 Subjective Norm
Most people who are important to our firm would _____ of your firm of continuing to make formal use of Social Media in the next 6 months.
Approve Disapprove
Most people who influence the behaviour of our firm think we should continue to make formal use of Social Media within the next 6 months
Agree Disagree
People whose opinions our firm values would prefer us to continue to make formal use of Social Media within the next 6 months
Agree Disagree
1.X.3 Descriptive Norms
Most stakeholders (e.g. suppliers, clients, etc) who are important to our firm make formal use of Social Media
Yes, definitely
No, definitely
not
Most of our firm's competitors make formal use of Social Media
Yes, definitely
No, definitely
not
Most firms with similar characteristics to ours make formal use of Social Media
Yes, definitely
No, definitely
not
1.X.4 Perceived Behavioural Control (PBC)
For your firm to continue to make formal use of Social Media would be…
PBC1 Easy Difficult
PBC2 Under your Out of your
33
firm's control
firm's control
PBC3 Simple to
arrange.
Complicated to arrange
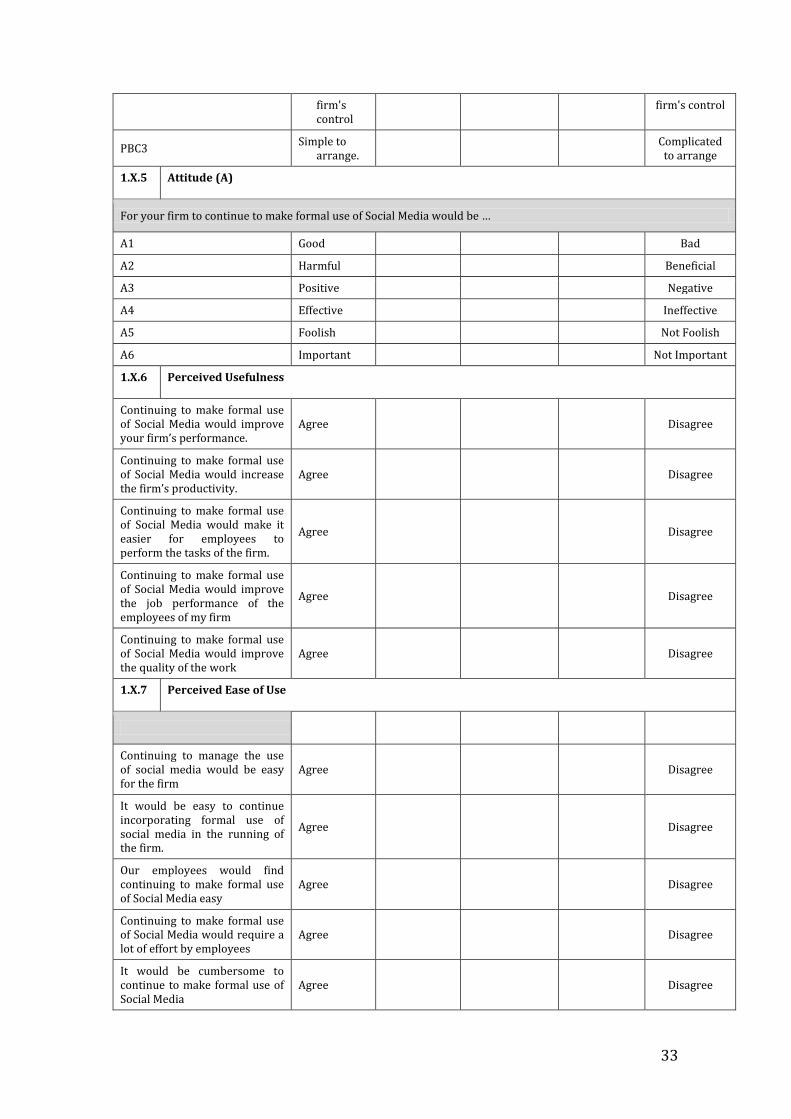
1.X.5 Attitude (A)
For your firm to continue to make formal use of Social Media would be …
A1 Good Bad
A2 Harmful Beneficial
A3 Positive Negative
A4 Effective Ineffective
A5 Foolish Not Foolish
A6 Important Not Important
1.X.6 Perceived Usefulness
Continuing to make formal use of Social Media would improve your firm’s performance.
Agree Disagree
Continuing to make formal use of Social Media would increase the firm’s productivity.
Agree Disagree
Continuing to make formal use of Social Media would make it easier for employees to perform the tasks of the firm.
Agree Disagree
Continuing to make formal use of Social Media would improve the job performance of the employees of my firm
Agree Disagree
Continuing to make formal use of Social Media would improve the quality of the work
Agree Disagree
1.X.7 Perceived Ease of Use
Continuing to manage the use of social media would be easy for the firm
Agree Disagree
It would be easy to continue incorporating formal use of social media in the running of the firm.
Agree Disagree
Our employees would find continuing to make formal use of Social Media easy
Agree Disagree
Continuing to make formal use of Social Media would require a lot of effort by employees
Agree Disagree
It would be cumbersome to continue to make formal use of Social Media
Agree Disagree
34
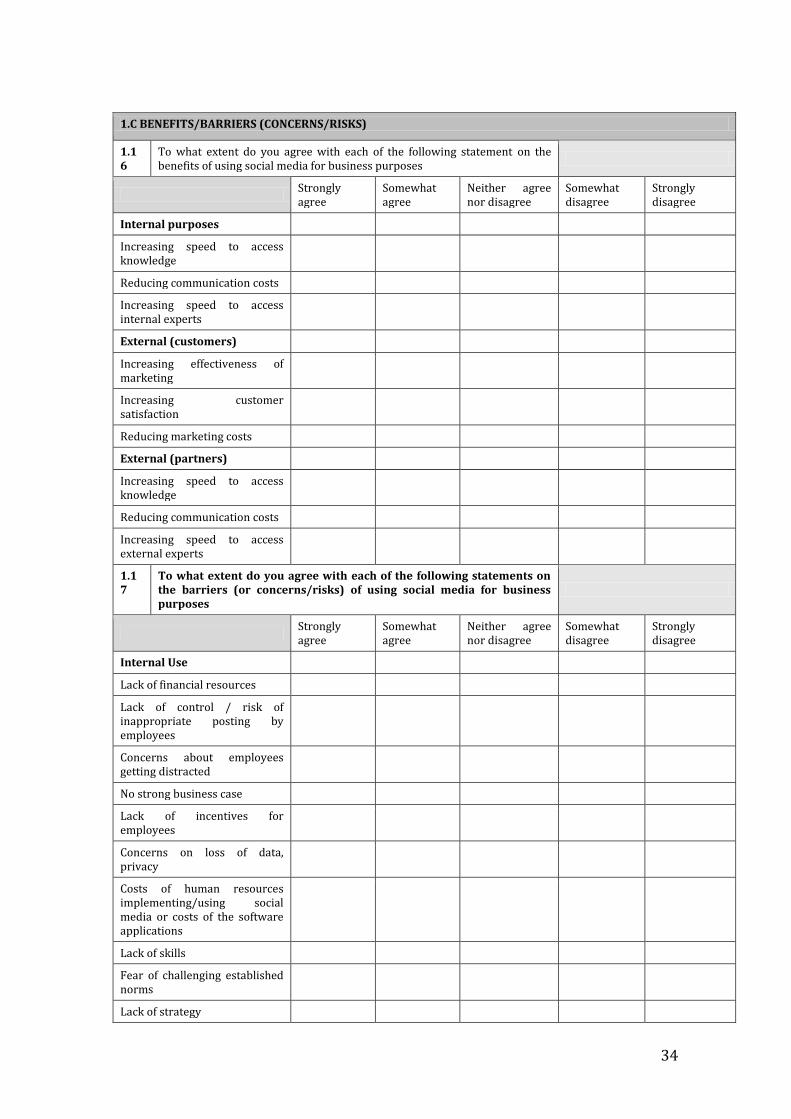
1.C BENEFITS/BARRIERS (CONCERNS/RISKS)
1.16
To what extent do you agree with each of the following statement on the benefits of using social media for business purposes
Strongly agree
Somewhat agree
Neither agree nor disagree
Somewhat disagree
Strongly disagree
Internal purposes
Increasing speed to access knowledge
Reducing communication costs
Increasing speed to access internal experts
External (customers)
Increasing effectiveness of marketing
Increasing customer satisfaction
Reducing marketing costs
External (partners)
Increasing speed to access knowledge
Reducing communication costs
Increasing speed to access external experts
1.17
To what extent do you agree with each of the following statements on the barriers (or concerns/risks) of using social media for business purposes
Strongly agree
Somewhat agree
Neither agree nor disagree
Somewhat disagree
Strongly disagree
Internal Use
Lack of financial resources
Lack of control / risk of inappropriate posting by employees
Concerns about employees getting distracted
No strong business case
Lack of incentives for employees
Concerns on loss of data, privacy
Costs of human resources implementing/using social media or costs of the software applications
Lack of skills
Fear of challenging established norms
Lack of strategy
35
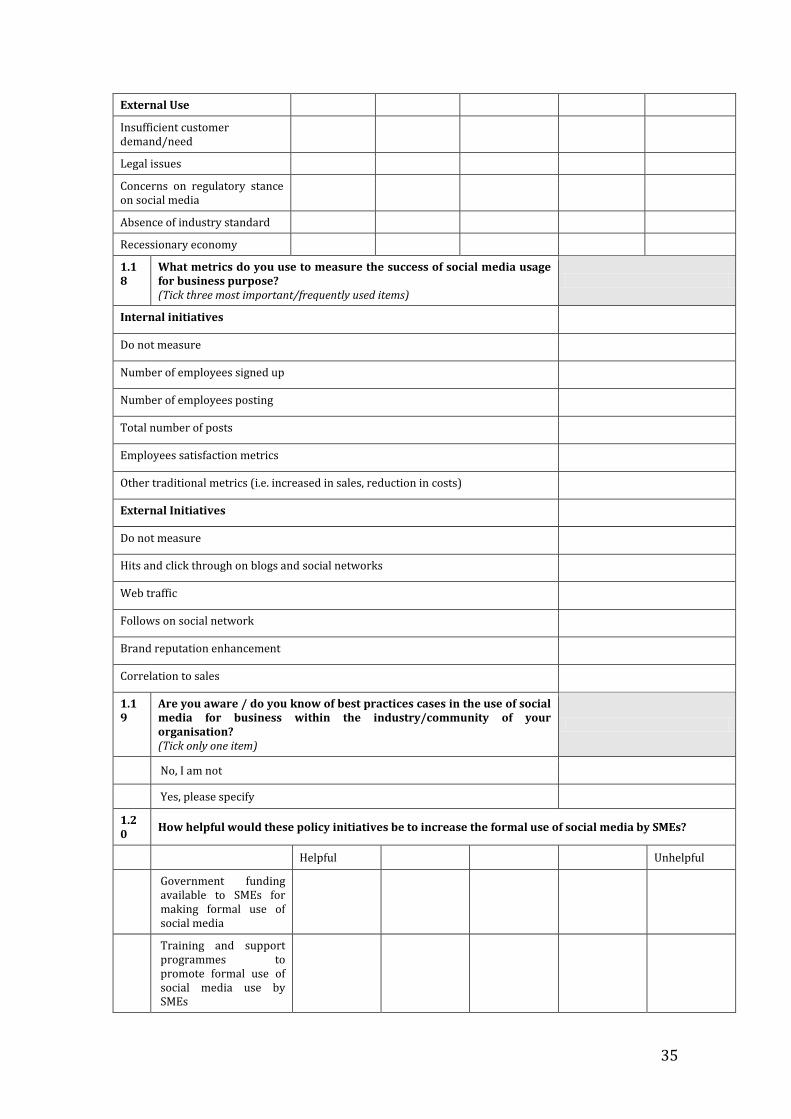
External Use
Insufficient customer demand/need
Legal issues
Concerns on regulatory stance on social media
Absence of industry standard
Recessionary economy
1.18
What metrics do you use to measure the success of social media usage for business purpose? (Tick three most important/frequently used items)
Internal initiatives
Do not measure
Number of employees signed up
Number of employees posting
Total number of posts
Employees satisfaction metrics
Other traditional metrics (i.e. increased in sales, reduction in costs)
External Initiatives
Do not measure
Hits and click through on blogs and social networks
Web traffic
Follows on social network
Brand reputation enhancement
Correlation to sales
1.19
Are you aware / do you know of best practices cases in the use of social media for business within the industry/community of your organisation? (Tick only one item)
No, I am not
Yes, please specify
1.20
How helpful would these policy initiatives be to increase the formal use of social media by SMEs?
Helpful Unhelpful
Government funding available to SMEs for making formal use of social media
Training and support programmes to promote formal use of social media use by SMEs
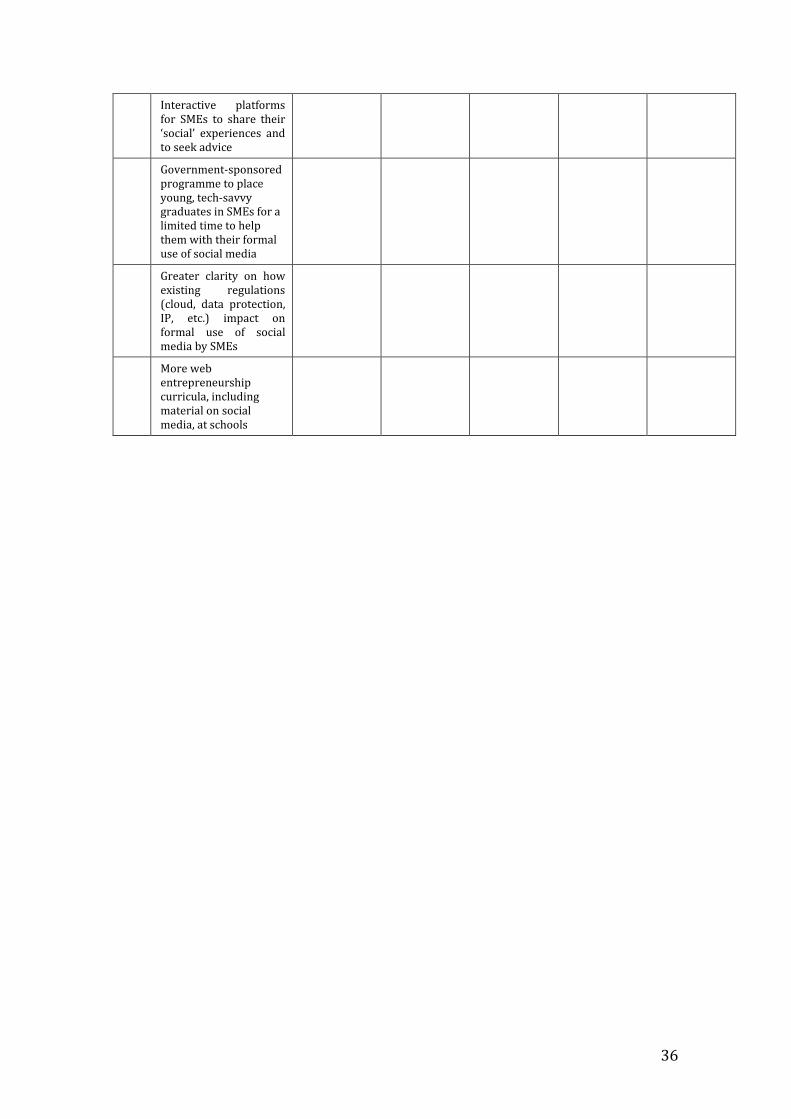
36
Interactive platforms for SMEs to share their ‘social’ experiences and to seek advice
Government-sponsored programme to place young, tech-savvy graduates in SMEs for a limited time to help them with their formal use of social media
Greater clarity on how existing regulations (cloud, data protection, IP, etc.) impact on formal use of social media by SMEs
More web entrepreneurship curricula, including material on social media, at schools
37
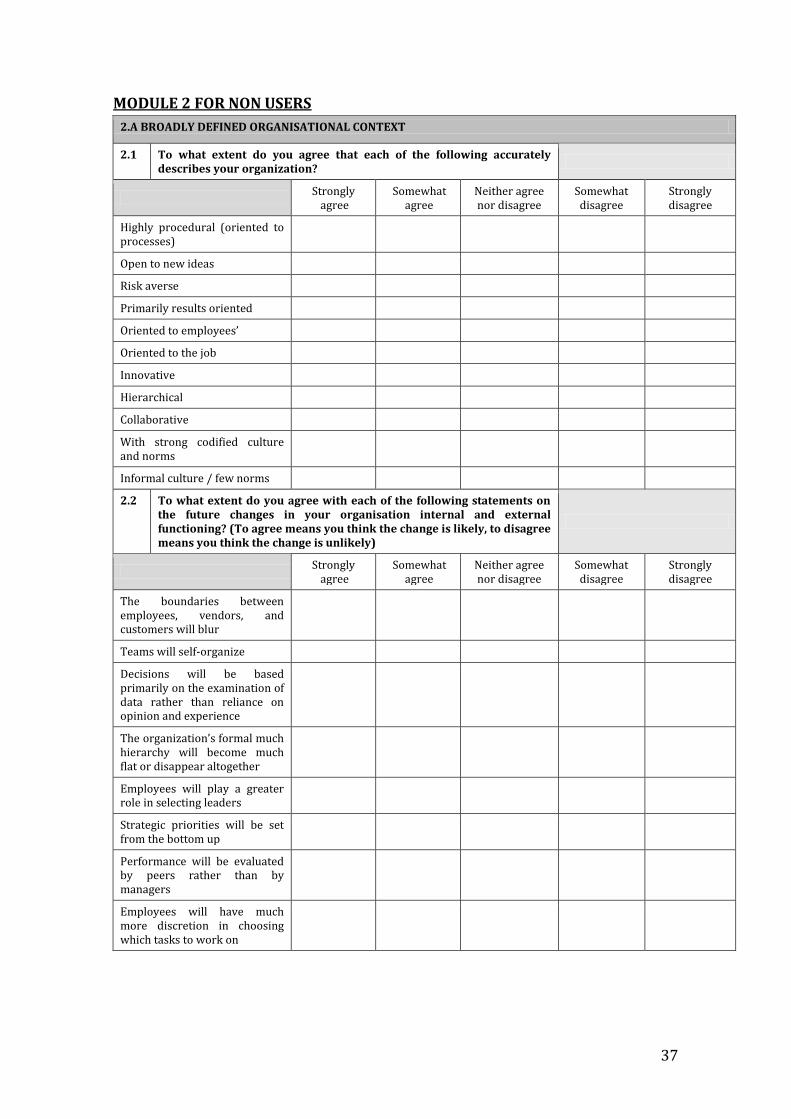
MODULE 2 FOR NON USERS
2.A BROADLY DEFINED ORGANISATIONAL CONTEXT
2.1 To what extent do you agree that each of the following accurately describes your organization?
Strongly
agree Somewhat
agree Neither agree nor disagree
Somewhat disagree
Strongly disagree
Highly procedural (oriented to processes)
Open to new ideas
Risk averse
Primarily results oriented
Oriented to employees’
Oriented to the job
Innovative
Hierarchical
Collaborative
With strong codified culture and norms
Informal culture / few norms
2.2 To what extent do you agree with each of the following statements on the future changes in your organisation internal and external functioning? (To agree means you think the change is likely, to disagree means you think the change is unlikely)
Strongly
agree Somewhat
agree Neither agree nor disagree
Somewhat disagree
Strongly disagree
The boundaries between employees, vendors, and customers will blur
Teams will self-organize
Decisions will be based primarily on the examination of data rather than reliance on opinion and experience
The organization’s formal much hierarchy will become much flat or disappear altogether
Employees will play a greater role in selecting leaders
Strategic priorities will be set from the bottom up
Performance will be evaluated by peers rather than by managers
Employees will have much more discretion in choosing which tasks to work on
38
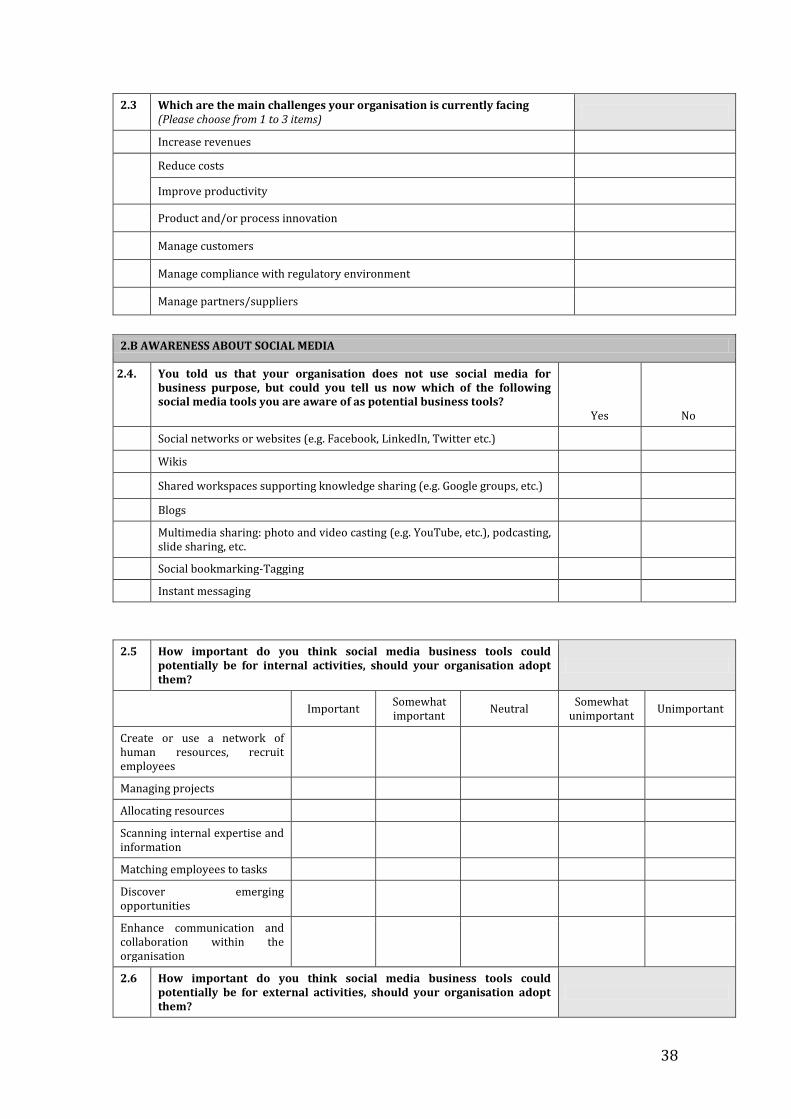
2.3 Which are the main challenges your organisation is currently facing (Please choose from 1 to 3 items)
Increase revenues
Reduce costs
Improve productivity
Product and/or process innovation
Manage customers
Manage compliance with regulatory environment
Manage partners/suppliers
2.B AWARENESS ABOUT SOCIAL MEDIA
2.4. You told us that your organisation does not use social media for business purpose, but could you tell us now which of the following social media tools you are aware of as potential business tools? Yes No
Social networks or websites (e.g. Facebook, LinkedIn, Twitter etc.)
Wikis
Shared workspaces supporting knowledge sharing (e.g. Google groups, etc.)
Blogs
Multimedia sharing: photo and video casting (e.g. YouTube, etc.), podcasting, slide sharing, etc.
Social bookmarking-Tagging
Instant messaging
2.5 How important do you think social media business tools could potentially be for internal activities, should your organisation adopt them?
Important Somewhat important
Neutral Somewhat
unimportant Unimportant
Create or use a network of human resources, recruit employees
Managing projects
Allocating resources
Scanning internal expertise and information
Matching employees to tasks
Discover emerging opportunities
Enhance communication and collaboration within the organisation
2.6 How important do you think social media business tools could potentially be for external activities, should your organisation adopt them?
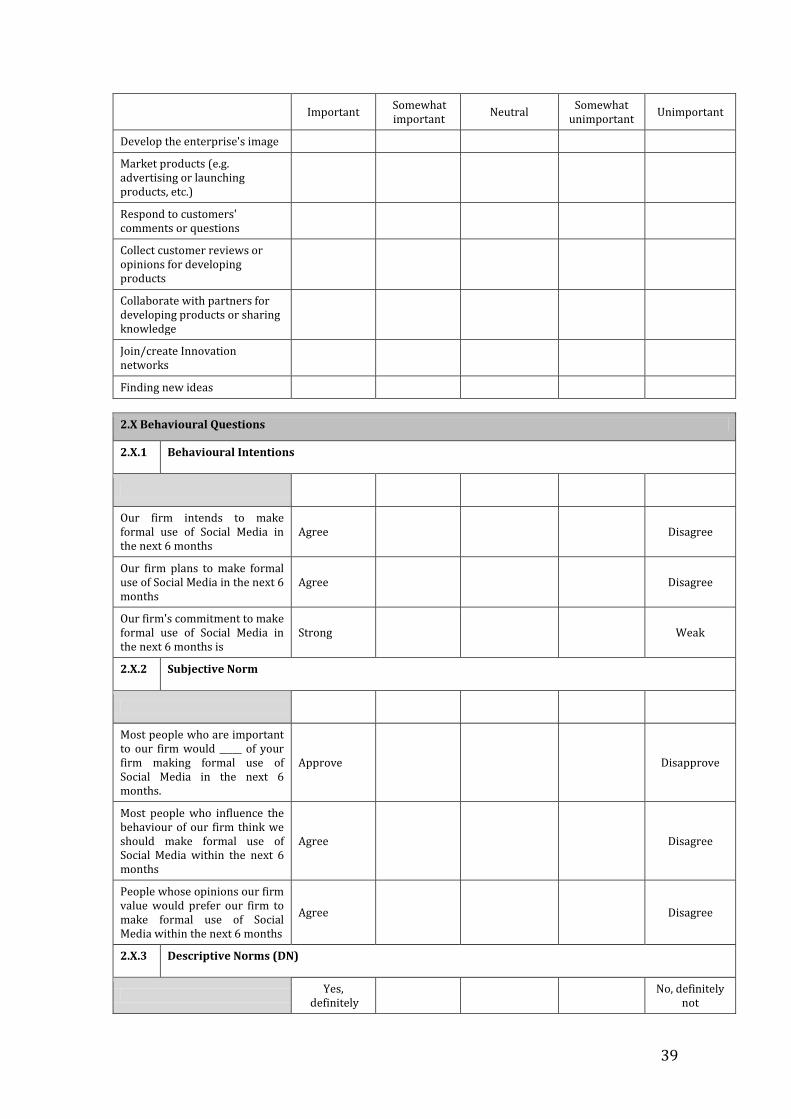
39
Important Somewhat important
Neutral Somewhat
unimportant Unimportant
Develop the enterprise's image
Market products (e.g. advertising or launching products, etc.)
Respond to customers' comments or questions
Collect customer reviews or opinions for developing products
Collaborate with partners for developing products or sharing knowledge
Join/create Innovation networks
Finding new ideas
2.X Behavioural Questions
2.X.1 Behavioural Intentions
Our firm intends to make formal use of Social Media in the next 6 months
Agree Disagree
Our firm plans to make formal use of Social Media in the next 6 months
Agree Disagree
Our firm's commitment to make formal use of Social Media in the next 6 months is
Strong Weak
2.X.2 Subjective Norm
Most people who are important to our firm would _____ of your firm making formal use of Social Media in the next 6 months.
Approve Disapprove
Most people who influence the behaviour of our firm think we should make formal use of Social Media within the next 6 months
Agree Disagree
People whose opinions our firm value would prefer our firm to make formal use of Social Media within the next 6 months
Agree Disagree
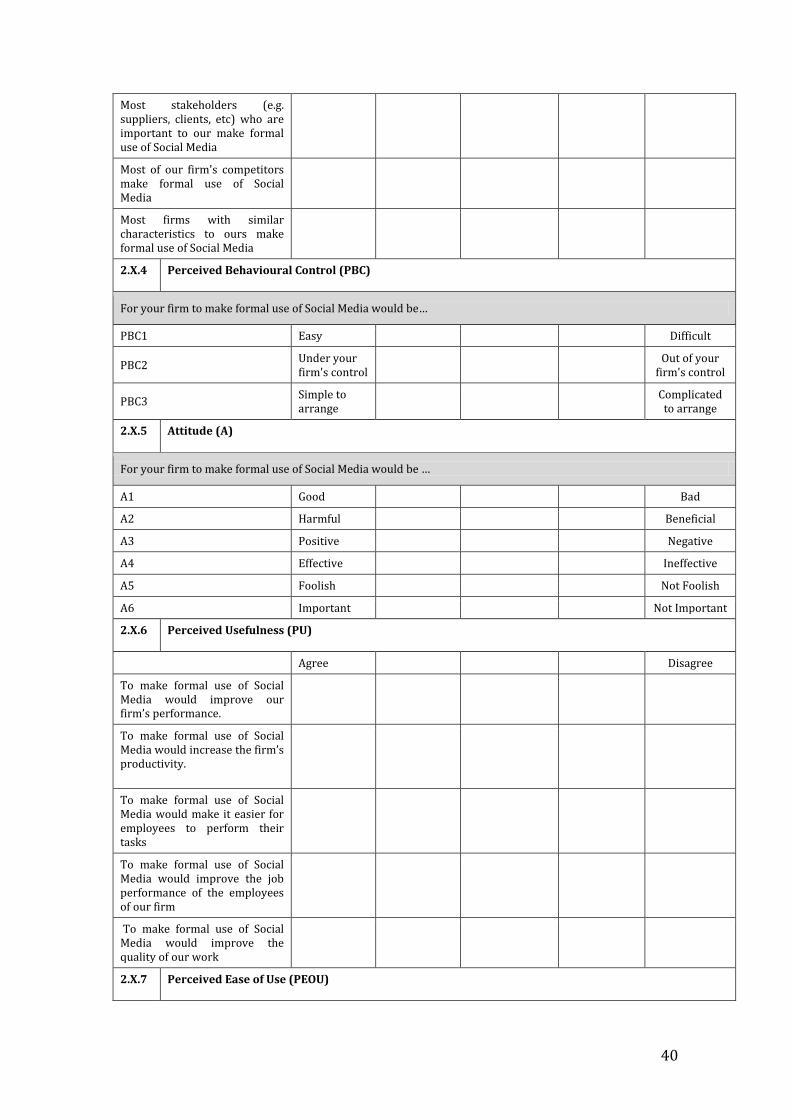
2.X.3 Descriptive Norms (DN)
Yes,
definitely
No, definitely not
40
Most stakeholders (e.g. suppliers, clients, etc) who are important to our make formal use of Social Media
Most of our firm's competitors make formal use of Social Media
Most firms with similar characteristics to ours make formal use of Social Media
2.X.4 Perceived Behavioural Control (PBC)
For your firm to make formal use of Social Media would be…
PBC1 Easy Difficult
PBC2 Under your firm's control
Out of your
firm's control
PBC3 Simple to arrange
Complicated
to arrange
2.X.5 Attitude (A)
For your firm to make formal use of Social Media would be …
A1 Good Bad
A2 Harmful Beneficial
A3 Positive Negative
A4 Effective Ineffective
A5 Foolish Not Foolish
A6 Important Not Important
2.X.6 Perceived Usefulness (PU)
Agree Disagree
To make formal use of Social Media would improve our firm’s performance.
To make formal use of Social Media would increase the firm’s productivity.
To make formal use of Social Media would make it easier for employees to perform their tasks
To make formal use of Social Media would improve the job performance of the employees of our firm
To make formal use of Social Media would improve the quality of our work
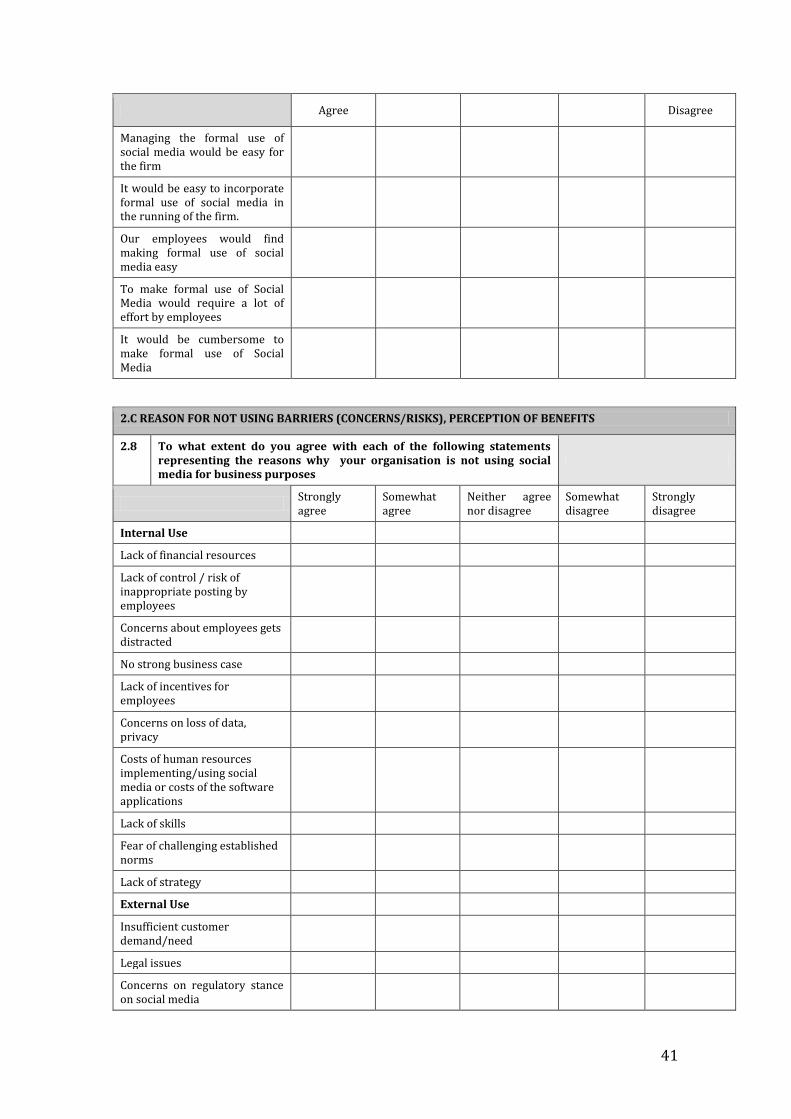
2.X.7 Perceived Ease of Use (PEOU)
41
Agree Disagree
Managing the formal use of social media would be easy for the firm
It would be easy to incorporate formal use of social media in the running of the firm.
Our employees would find making formal use of social media easy
To make formal use of Social Media would require a lot of effort by employees
It would be cumbersome to make formal use of Social Media
2.C REASON FOR NOT USING BARRIERS (CONCERNS/RISKS), PERCEPTION OF BENEFITS
2.8 To what extent do you agree with each of the following statements representing the reasons why your organisation is not using social media for business purposes
Strongly agree
Somewhat agree
Neither agree nor disagree
Somewhat disagree
Strongly disagree
Internal Use
Lack of financial resources
Lack of control / risk of inappropriate posting by employees
Concerns about employees gets distracted
No strong business case
Lack of incentives for employees
Concerns on loss of data, privacy
Costs of human resources implementing/using social media or costs of the software applications
Lack of skills
Fear of challenging established norms
Lack of strategy
External Use
Insufficient customer demand/need
Legal issues
Concerns on regulatory stance on social media
42
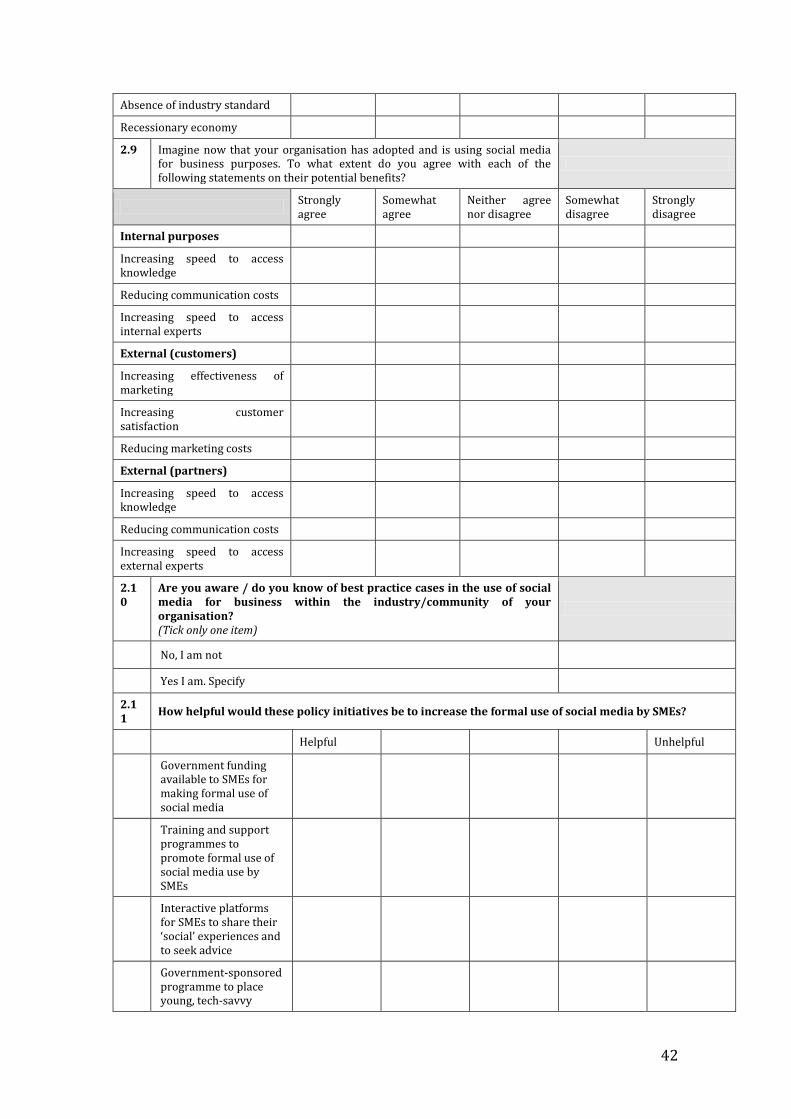
Absence of industry standard
Recessionary economy
2.9 Imagine now that your organisation has adopted and is using social media for business purposes. To what extent do you agree with each of the following statements on their potential benefits?
Strongly agree
Somewhat agree
Neither agree nor disagree
Somewhat disagree
Strongly disagree
Internal purposes
Increasing speed to access knowledge
Reducing communication costs
Increasing speed to access internal experts
External (customers)
Increasing effectiveness of marketing
Increasing customer satisfaction
Reducing marketing costs
External (partners)
Increasing speed to access knowledge
Reducing communication costs
Increasing speed to access external experts
2.10
Are you aware / do you know of best practice cases in the use of social media for business within the industry/community of your organisation? (Tick only one item)
No, I am not
Yes I am. Specify
2.11
How helpful would these policy initiatives be to increase the formal use of social media by SMEs?
Helpful Unhelpful
Government funding available to SMEs for making formal use of social media
Training and support programmes to promote formal use of social media use by SMEs
Interactive platforms for SMEs to share their ‘social’ experiences and to seek advice
Government-sponsored programme to place young, tech-savvy

43
graduates in SMEs for a limited time to help them with their formal use of social media
Greater clarity on how existing regulations (cloud, data protection, IP, etc.) impact on formal use of social media by SMEs
More web entrepreneurship curricula, including material on social media, at schools