Embed Size (px)
Citation preview

Hydraulics of Commercial Sand Media Filter Tanks used for Agricultural Drip Irrigation http://www.itrc.org/reports/mediafilters.htm ITRC Report No. R 10-001
IRRIGATION TRAINING AND RESEARCH CENTER
Commercial Sand Media Filter Tank Criteria for Energy Efficiency
- Agricultural Drip Irrigation
September 2010
TTeecchhnniiccaall RReeppoorrtt

Hydraulics of Commercial Sand Media Filter Tanks used for Agricultural Drip Irrigation http://www.itrc.org/reports/mediafilters.htm ITRC Report No. R 10-001
Prepared by Dr. Charles Burt, P.E. Irrigation Training and Research Center (ITRC) California Polytechnic State University San Luis Obispo, CA 93407-0730 805.756.2434 www.itrc.org
Disclaimer: Reference to any specific process, product or service by manufacturer, trade name, trademark or otherwise does not necessarily imply endorsement or recommendation of use by either California Polytechnic State University, the Irrigation Training and Research Center, or any other party mentioned in this document. No party makes any warranty, express or implied and assumes no legal liability or responsibility for the accuracy or completeness of any apparatus, product, process or data described previously. Irrigation Training and Research Center September 2010
IRRIGATION
TRAINING AND
RESEARCH
CENTER

Hydraulics of Commercial Sand Media Filter Tanks used for Agricultural Drip Irrigation http://www.itrc.org/reports/mediafilters.htm ITRC Report No. R 10-001
Irrigation Training and Research Center P a g e | i
TABLE OF CONTENTS
BACKGROUND.................................................................................................................................. 1
Media Tanks Tested .................................................................................................................... 2 Exterior and Interior Views of Tanks .......................................................................................... 3
UNDERDRAIN CHARACTERISTICS .................................................................................................. 5
Total Slot Open Area .................................................................................................................. 5 Horizontal Distribution of the Slots across the Bottom of the Tanks ........................................ 11 Vertical Distribution of the Slots across the Bottom of the Tanks ............................................ 13
HYDRAULIC CHARACTERISTICS .................................................................................................. 14
Media Description ..................................................................................................................... 17 Pressure Losses through the Underdrain (No Media) ............................................................... 18 Pressure Loss through the Media .............................................................................................. 19 Pressure Loss through the Backflush Valves ............................................................................ 20 Combined Pressure Loss ........................................................................................................... 21 Activation Pressures and Times for Backflush Valves ............................................................. 22
VISUAL INSPECTION OF THE TOP OF THE MEDIA BED AFTER BACKFLUSH ............................. 24
DISCHARGE OF MEDIA DURING BACKFLUSH ............................................................................. 26
TESTING WITH CONTAMINANTS .................................................................................................. 27
Contaminant Description........................................................................................................... 27 Backflushing of Contaminants .................................................................................................. 29 Contaminant Retained in the Media .......................................................................................... 30
BACKFLUSH PRESSURE VERSUS FLOW RATE .............................................................................. 32
SUMMARIZED OBSERVATIONS ..................................................................................................... 33
ENERGY IMPLICATIONS ................................................................................................................ 35

Hydraulics of Commercial Sand Media Filter Tanks used for Agricultural Drip Irrigation http://www.itrc.org/reports/mediafilters.htm ITRC Report No. R 10-001
Irrigation Training and Research Center P a g e | ii
LIST OF FIGURES Figure 1. Arkal AGF exterior and underdrain ................................................................................. 3 Figure 2. Flow-Guard exterior and underdrain ................................................................................ 3 Figure 3. Lakos exterior and underdrain ......................................................................................... 3 Figure 4. Waterman Wand (“spike”) exterior and underdrain ........................................................ 4 Figure 5. Waterman Dome exterior and underdrain ........................................................................ 4 Figure 6. Example micro drill bits ................................................................................................... 5 Figure 7. Arkal pod design. The photo with the pod arms shows a broken pod ............................ 6 Figure 8. Flow-Guard underdrain. Pods are found under the flat stainless disks. .......................... 7 Figure 9. Lakos underdrain. The longest wands have a non-perforated PVC pipe section
near their inlets. .............................................................................................................. 8 Figure 10. Waterman Dome underdrain. The pods are at different heights, due to the shape
of the inverted dome. Photo shows at least 3 locations where pods were expected to be found but were not installed. ................................................................................. 9
Figure 11. Waterman Wand (“spike”) underdrain. The top wands are shorter than the lower ones; slots are found along the complete length of each wand. ................................... 10
Figure 12. Arkal pod arrangement ................................................................................................. 11 Figure 13. Flow-Guard pod arrangement ...................................................................................... 11 Figure 14. Lakos open wand arrangement .................................................................................... 12 Figure 15. Waterman Dome pod arrangement .............................................................................. 12 Figure 16. Waterman Wand arrangement...................................................................................... 12 Figure 17. Schematic of the test setup for test with clean water ................................................... 14 Figure 18. Test layout for dirty water testing ................................................................................ 14 Figure 19. Locations of pressure measurements ........................................................................... 15 Figure 20. Measurement locations during filtration process ......................................................... 15 Figure 21. Measurement locations during backflush process ........................................................ 16 Figure 22. Pressure loss in the underdrain during filtration .......................................................... 18 Figure 23. Pressure loss in the underdrain during backflush ......................................................... 18 Figure 24. Pressure loss through the media during filtration mode. Clean media and water. ...... 19 Figure 25. Pressure loss through the media during backflush mode. Clean media and water. .... 19 Figure 26. Friction loss through the backflush valves – filtration mode ....................................... 20 Figure 27. Friction loss through the backflush valves – backflush mode ..................................... 20 Figure 28. Total pressure loss across tanks with clean water and media – filtration mode ........... 21 Figure 29. Total pressure loss across tanks with clean water and media – backflush mode ......... 21 Figure 30. Schematic of the test setup with backflush valve closed ............................................. 22 Figure 31. Schematic of the test setup with backflush valve open (actuated) ............................... 22 Figure 32. Arkal AGF-48” media bed after media cleaning ......................................................... 24 Figure 33. Flow-Guard media bed after media cleaning ............................................................... 24 Figure 34. Lakos media bed after media cleaning ......................................................................... 25 Figure 35. Waterman Wand (“spikes”) bed after media cleaning ................................................. 25 Figure 36. Waterman Dome bed after media cleaning .................................................................. 25 Figure 37. Examples of large amounts of media removed during backflush ................................ 26 Figure 38. Example data collected during filtration with contaminant ......................................... 27 Figure 39. Potting soil caught on inlet dissipation screen of the Lakos media tank. Flow-
Guard has a similar dissipation screen, but was not tested with potting soil. .............. 28 Figure 40. Potting soil that accumulated on the top of the media bed, even after repeated
backflushing ................................................................................................................. 28 Figure 41. Number of backflushes per day – Lakos ...................................................................... 29

Hydraulics of Commercial Sand Media Filter Tanks used for Agricultural Drip Irrigation http://www.itrc.org/reports/mediafilters.htm ITRC Report No. R 10-001
Irrigation Training and Research Center P a g e | iii
Figure 42. Number of backflushes per day – Flow-Guard ............................................................ 30 Figure 43. Plastic template used to position sampling cores across the top of the media ............. 30 Figure 44. PVC cores forced 4” deep into each hole in the template, with collected soil ............. 31 Figure 45. Duration of filtration compared to number of backflushes, showing that the
pressure at the bottom of the filter does not impact dirt removal, if the flow rate remains constant ........................................................................................................... 32
LIST OF TABLES
Table 1. Information supplied by manufacturers ............................................................................. 2 Table 2. Underdrain slot characteristics .......................................................................................... 5 Table 3. Horizontal area served by underdrain units ..................................................................... 13 Table 4. Fraction of the horizontal area covered by pods or slotted wands .................................. 13 Table 5. Minimum and maximum backflush valve closure times and pressures .......................... 23 Table 6. Sand collected during backflush tests.............................................................................. 26 Table 7. Contaminants injected during 15-day tests ...................................................................... 27 Table 8. Contaminant analysis from sand media ........................................................................... 31 Table 9. Characteristics of the media filter tanks .......................................................................... 33

Hydraulics of Commercial Sand Media Filter Tanks used for Agricultural Drip Irrigation http://www.itrc.org/reports/mediafilters.htm ITRC Report No. R 10-001
Irrigation Training and Research Center P a g e | 1
BACKGROUND Sand media filters are commonly used in agricultural drip irrigation systems. They have the advantages of simplicity and large capacities, and are favored by many farmers and designers over other filtration hardware. The primary justification for the research described in this report was to determine if it is possible and reasonable to use lower-than-accepted backflush pressures and thereby reduce the total pressure requirement for drip systems. Common design lore by manufacturers and irrigation dealers indicates that for media filters to backflush properly, at least 30–35 psi is needed downstream of the filters. This high pressure requirement can exceed what is needed for the combination of other system components and conveyance within a drip system – especially for row crop drip systems that have tapes operating in the 8-10 psi range. ITRC designed and performed a series of hydraulic tests on several different commercial sand media filter tanks (one unit of each of five models). The testing provided the following results:
1. There are substantially different friction losses across filters of different designs at different times:
a. During backflush b. During filtration
2. The primary pressure loss location is the backflush valves.
3. Large backflush flow rates can be accomplished at relatively low backflush pressures. This assumes correct backflush water discharge piping.
4. There are substantial differences between underdrains of various media tank models, regarding: a. The percent open area b. The uniformity of the sizes of the openings in the slots/wands c. The configurations of the slots/wands, including:
i. Positioning of slots/wands around the bottom of the tanks ii. Height of slots/wands within the tanks
5. No large initial high pressure was necessary during the ITRC testing to “break up the media bed” when backflush began.
6. Different underdrain designs create different patterns of cleaning the media.
7. There were substantial differences between models, regarding the amount of sand discharged from the system at a backflush flow rate of 190 GPM.

Hydraulics of Commercial Sand Media Filter Tanks used for Agricultural Drip Irrigation http://www.itrc.org/reports/mediafilters.htm ITRC Report No. R 10-001
Irrigation Training and Research Center P a g e | 2
Media Tanks Tested Five different tanks were obtained from four manufacturers. Only two tanks were tested over an extended period of time with contaminants, due to the complexity of those tests and the large amount of time needed. The various tanks are described individually below. Lakos later provided a tank with a modified, newer underdrain for some tests (listed as “newer design” in this report). Manufacturers modify their designs over time, and these tests were meant to investigate various designs – as opposed to attempting to compare manufacturers. Also, considerations such as corrosion, strength of tanks, longevity of valve actions, sensitivity to damage during transportation, and cost were not evaluated in this project. The intents of this publication are to increase awareness of how these important filters work, and to indicate factors that might be modified to improve their performance. Table 1 provides basic information for each tank. All tanks were 48” nominal diameter, and rated at 80 psi by the manufacturers.
Table 1. Information supplied by manufacturers
Arkal (Netafim)
Flow-Guard (Fresno Valves & Castings) Lakos Waterman Waterman
Model AGF – 48” SS – 48” SST – 48” Wand Dome
Underdrain material Plastic Stainless steel PVC plastic Plastic Plastic
Backflush flow rate (GPM) 176 - 264 200 188 Not provided Not provided
Filtration flow rate (GPM) 220 – 313 213 – 313 220 – 313 Not provided Not provided
Minimum backflush
pressure (psi) 28 Not provided 20 – 80 Not provided Not provided
Media sand requirement
(lb) 1200 1300 1300 800* 800
Gravel requirement
(lb) None 560 None Not stated Not stated
*The Waterman Wand had a recommendation of 800 lb of media, but ITRC added an additional 7.5 cm. of media depth to provide cover over the wands. The 800 lb would have only provided 2.5 cm of cover at the most shallow point.

Hydraulics of Commercial Sand Media Filter Tanks used for Agricultural Drip Irrigation http://www.itrc.org/reports/mediafilters.htm ITRC Report No. R 10-001
Irrigation Training and Research Center P a g e | 3
Exterior and Interior Views of Tanks Figures 1 through 5 show the various tanks that were tested.
Figure 1. Arkal AGF exterior and underdrain
Figure 2. Flow-Guard exterior and underdrain
Figure 3. Lakos exterior and underdrain

Hydraulics of Commercial Sand Media Filter Tanks used for Agricultural Drip Irrigation http://www.itrc.org/reports/mediafilters.htm ITRC Report No. R 10-001
Irrigation Training and Research Center P a g e | 4
Figure 4. Waterman Wand (“spike”) exterior and underdrain
Figure 5. Waterman Dome exterior and underdrain
These photos provide views of the underdrain designs and positioning near the base of the tanks. ITRC noticed the following upon delivery of the tanks:
1. The Waterman Dome appeared to be missing several pods, as can be seen in Figure 5. The tank was tested as-is.
2. One of the pods for the Arkal filter was broken. That pod was replaced before testing.

Hydraulics of Commercial Sand Media Filter Tanks used for Agricultural Drip Irrigation http://www.itrc.org/reports/mediafilters.htm ITRC Report No. R 10-001
Irrigation Training and Research Center P a g e | 5
UNDERDRAIN CHARACTERISTICS Total Slot Open Area Micro drill bits (e.g., Item #08WS97-90 from Drill Bit City) were used to measure underdrain slot open widths. Approximately 120 measurements were made for each filter. Because the drill bits have discrete sizes, the accuracies of the slot width measurements are only within +/-2%.
Figure 6. Example micro drill bits
At the start of the testing, it was thought that the total slot open area might be an important indicator of:
1. Pressure requirements for backflushing. 2. Uniformity of cleaning the media bed during backflush.
Table 2 provides a summary of measurements regarding the underdrain slots. It can be seen that there are substantial differences in:
1. Total slot open area. 2. Standard deviation of slot widths (a large standard deviation indicates large differences in slot
widths; with a “normal” distribution of widths, 95% of all slot widths should fall within +/- 2 standard deviations of the mean). Statistically speaking, one might expect 95% of all Flow-Guard slot sizes to fall between 0.165 mm – 0.291 mm. In fact, the absolute range of all measured sizes was 0.180 mm – 0.279 mm.
3. Mean slot widths. It might be noted that a large total slot area can be achieved by having a relatively smaller number of slots.
Table 2. Underdrain slot characteristics
Tank
Total # of pods or screen
sections
Mean slot width, mm.
Std. dev. of widths,
mm.
Total slot open
area, sq. cm.
Arkal 55 0.330 0.036 200 Flow-Guard 19 0.233 0.029 184 Lakos (original) 27 0.307 0.107 405 Lakos (newer design) 25 0.273 0.036 261 Waterman Dome 45 0.292 not meas. 108 Waterman Wand 16 0.189 0.026 343

Hydraulics of Commercial Sand Media Filter Tanks used for Agricultural Drip Irrigation http://www.itrc.org/reports/mediafilters.htm ITRC Report No. R 10-001
Irrigation Training and Research Center P a g e | 6
Figures 7-11 show close-up views of each underdrain pod or screen section.
Figure 7. Arkal pod design. The photo with the pod arms shows a broken pod

Hydraulics of Commercial Sand Media Filter Tanks used for Agricultural Drip Irrigation http://www.itrc.org/reports/mediafilters.htm ITRC Report No. R 10-001
Irrigation Training and Research Center P a g e | 7
Figure 8. Flow-Guard underdrain. Pods are found under the flat stainless disks.

Hydraulics of Commercial Sand Media Filter Tanks used for Agricultural Drip Irrigation http://www.itrc.org/reports/mediafilters.htm ITRC Report No. R 10-001
Irrigation Training and Research Center P a g e | 8
Figure 9. Lakos underdrain. The longest wands have a non-perforated PVC pipe section near their inlets.

Hydraulics of Commercial Sand Media Filter Tanks used for Agricultural Drip Irrigation http://www.itrc.org/reports/mediafilters.htm ITRC Report No. R 10-001
Irrigation Training and Research Center P a g e | 9
Figure 10. Waterman Dome underdrain. The pods are at different heights, due to the shape of the inverted dome. Photo shows at least 3 locations where pods were expected to be found but were not installed.

Hydraulics of Commercial Sand Media Filter Tanks used for Agricultural Drip Irrigation http://www.itrc.org/reports/mediafilters.htm ITRC Report No. R 10-001
Irrigation Training and Research Center P a g e | 10
Figure 11. Waterman Wand (“spike”) underdrain. The top wands are shorter than the lower ones; slots are
found along the complete length of each wand.

Hydraulics of Commercial Sand Media Filter Tanks used for Agricultural Drip Irrigation http://www.itrc.org/reports/mediafilters.htm ITRC Report No. R 10-001
Irrigation Training and Research Center P a g e | 11
Horizontal Distribution of the Slots across the Bottom of the Tanks It was hypothesized at the start of the tests that an even and dense distribution of slots across the bottom of a tank would be beneficial in providing a uniform cleaning of media during backflushing. For each of the tanks, areas of responsibility were assigned for each pod or open wand area. Sketches were developed and areas were computed, as shown in Figures 12-16.
Figure 12. Arkal pod arrangement
Figure 13. Flow-Guard pod arrangement

Hydraulics of Commercial Sand Media Filter Tanks used for Agricultural Drip Irrigation http://www.itrc.org/reports/mediafilters.htm ITRC Report No. R 10-001
Irrigation Training and Research Center P a g e | 12
Figure 14. Lakos open wand arrangement
Figure 15. Waterman Dome pod arrangement
Figure 16. Waterman Wand arrangement

Hydraulics of Commercial Sand Media Filter Tanks used for Agricultural Drip Irrigation http://www.itrc.org/reports/mediafilters.htm ITRC Report No. R 10-001
Irrigation Training and Research Center P a g e | 13
Table 3 shows the variation in horizontal tank area served per unit of open underdrain, for each of the models examined.
Table 3. Horizontal area served by underdrain units
Average area served, sq. cm. per unit cv
Arkal 214 0.24 Flow-Guard 613 0.14 Lakos 446 0.31 Waterman Dome 214 0.17 Waterman Wand 177 0.75
The “cv” in Table 3 is the coefficient of variation, which has no units or dimensions, and is defined as: cv = where 95% of the values are expected to approximately fall within +/- two cv’s of the average. For example, if the Waterman Dome had a normal distribution of areas per pod, almost all of the values should fall between 141 cm2 - 287 cm2. A small cv indicates a very uniform horizontal distribution of pods/units. The average area per unit may be misleading if examined alone. For example, a very long single wand, with many holes, might be responsible for a large area. An “Area covered ratio” was developed to indicate the percent of a horizontal plane that is occupied by pods or wands.
Area covered ratio =
=
Table 4. Fraction of the horizontal area covered by pods or slotted wands
Tank
Fraction of area covered by pods or
wands Arkal 0.089 Flow-Guard1 0.033 Lakos 0.071 Waterman Dome 0.124 Waterman Wand 0.316
1 For the Flow-Guard, the outside diameter of the pod was used to compute the area, rather than the much larger area of the flow distribution cap on top of the pods.
Vertical Distribution of the Slots across the Bottom of the Tanks No measurements were made of this aspect of uniformity. One can see from the photographs in this report that for some models the pods are at similar elevations; others have substantial variation.
Fraction of a horizontal plane that is occupied by pods or slotted wands

Hydraulics of Commercial Sand Media Filter Tanks used for Agricultural Drip Irrigation http://www.itrc.org/reports/mediafilters.htm ITRC Report No. R 10-001
Irrigation Training and Research Center P a g e | 14
HYDRAULIC CHARACTERISTICS Media tanks were examined individually for hydraulic characteristics. Figure 17 illustrates the layout for testing with clean water. Figure 18 is a schematic of water flow when contaminants were introduced.
Figure 17. Schematic of the test setup for test with clean water
Figure 18. Test layout for dirty water testing
All pressure measurements were pressure differential pressure measurements using a high-quality pressure transducer.
Hydraulics of Commercial Sand Media Filter Tanks used for Agricultural Drip Irrigation http://www.itrc.org/reports/mediafilters.htm ITRC Report No. R 10-001
Irrigation Training and Research Center P a g e | 15
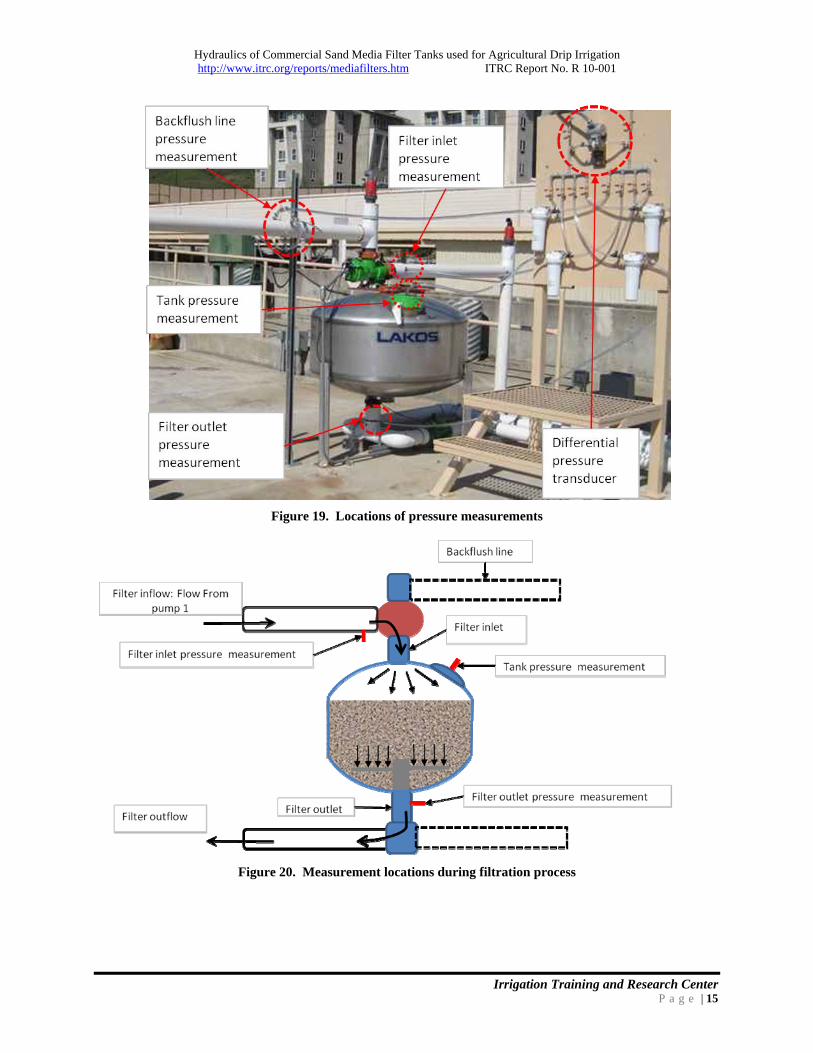
Figure 19. Locations of pressure measurements
Figure 20. Measurement locations during filtration process

Hydraulics of Commercial Sand Media Filter Tanks used for Agricultural Drip Irrigation http://www.itrc.org/reports/mediafilters.htm ITRC Report No. R 10-001
Irrigation Training and Research Center P a g e | 16
Figure 20 illustrates where pressure measurements were taken during “filtration”. The term “filtration” refers to the fact that water is flowing in the direction it would go, if water was being filtered. Only clean water was used for these tests. Because a pressure differential transducer was used, the “pressure loss” is technically not a “pressure loss” but rather an “energy loss”. If single transducers had been used, it would have been necessary to compensate for the elevation differences between the two transducers. The differential pressure readings were collected as follows:
Total pressure loss = (filter inlet pressure) - (filter outlet pressure)
(Underdrain + Media) pressure loss = (tank pressure) - (filter outlet pressure) Note: This includes the loss through the media, if it was present
Backflush valve pressure loss = (filter inlet pressure) - (tank pressure) Figure 21 illustrates where pressure measurements were taken during “backflush”. The term “backflush” refers to the fact that water is flowing in the opposite direction as water being filtered. Only clean water was used for these tests. The differential pressure readings were collected as follows:
Total pressure loss = (filter outlet pressure) - (backflush line pressure)
(Underdrain + Media) pressure loss = (filter outlet pressure) - (tank pressure) Note: This includes the loss through the media, if it was present
Backflush valve pressure loss = (tank pressure) - (backflush line pressure)
Figure 21. Measurement locations during backflush process

Hydraulics of Commercial Sand Media Filter Tanks used for Agricultural Drip Irrigation http://www.itrc.org/reports/mediafilters.htm ITRC Report No. R 10-001
Irrigation Training and Research Center P a g e | 17
For the clean water tests for which media was present, the media was cleaned prior to taking measurements, using the following procedure:
1. Start with a clean filter.
2. Fill up with sand media to the manufacturer-recommended level and close fill port. a. For the Flow-Guard (FV&C) tank, the gravel was placed first and cleaned with multiple
backflush cycles. b. The Waterman Wand tank received extra media, as noted earlier.
3. Close flow adjustment valve at Pump 2. Initial flow rate should be much lower than anticipated backflush flow rate (around 100 GPM).
4. Open backflush valve.
5. Start backflush pump (Pump 2).
6. Slowly increase the flow to the set backflush flow rate.
7. Allow pump to run for several minutes.
8. Stop pump and allow system to settle for several minutes.
9. Perform steps 3-8 at least 4 times.
10. Open the port on the filter to view the media in the tank.
11. Fill to the required level again and perform steps 3-8 one more time.
12. Open the port on the filter and view the amount of media in the tank. If it is too low, perform previous steps again until the tank contains the correct amount of clean media.
Media Description The media was the same as that used locally by irrigation dealers. Descriptive information is:
Manufacturer: P.W. Gillibrand Company, Simi Valley, CA Size: # 16 crushed silica Specifications by supplier: Uniformity Coefficient = 1.42; 150-200 mesh filtration

Hydraulics of Commercial Sand Media Filter Tanks used for Agricultural Drip Irrigation http://www.itrc.org/reports/mediafilters.htm ITRC Report No. R 10-001
Irrigation Training and Research Center P a g e | 18
Pressure Losses through the Underdrain (No Media) The pressure losses through the underdrain were measured at various flow rates and in two different flow directions (Figures 22 and 23). The losses are different in the “filtration” vs. “backflush” modes because of the different nature of entrance and entrance conditions around bends and through slots.
Figure 22. Pressure loss in the underdrain during filtration
Figure 23. Pressure loss in the underdrain during backflush
Although there are differences between the various tanks, it can be seen that the underdrain loss is relatively minor when compared to the overall pressure requirement of a drip system.

Hydraulics of Commercial Sand Media Filter Tanks used for Agricultural Drip Irrigation http://www.itrc.org/reports/mediafilters.htm ITRC Report No. R 10-001
Irrigation Training and Research Center P a g e | 19
Pressure Loss through the Media The media loss was computed by finding the difference in (underdrain + media) pressures when the tests were run with and without media. Figures 24 and 25 show the results. One would think that the loss through the media would be the same regardless of the tank, but there are differences in media height above and below the pods/wands, gravel in one tank, and different flow paths through the media depending upon the pod/wand configurations. The pressure loss through the media during backflush shows how the loss decreases as the flow increases – due to an expanded (and therefore less restrictive) media bed.
Figure 24. Pressure loss through the media during filtration mode. Clean media and water.
Figure 25. Pressure loss through the media during backflush mode. Clean media and water.

Hydraulics of Commercial Sand Media Filter Tanks used for Agricultural Drip Irrigation http://www.itrc.org/reports/mediafilters.htm ITRC Report No. R 10-001
Irrigation Training and Research Center P a g e | 20
Pressure Loss through the Backflush Valves The flow path configuration of the backflush valve can be quite different during backflush as compared to filtration. The impact on friction loss is clearly seen when one compares the results in Figures 26 and 27.
Figure 26. Friction loss through the backflush valves – filtration mode
Figure 27. Friction loss through the backflush valves – backflush mode
It is clear that some of the backflush valves have hydraulic characteristics during the backflush mode that require much more pressure for backflushing than other valves. This characteristic dominates the hydraulic pressure requirements for backflushing – when considering only the tank.

Hydraulics of Commercial Sand Media Filter Tanks used for Agricultural Drip Irrigation http://www.itrc.org/reports/mediafilters.htm ITRC Report No. R 10-001
Irrigation Training and Research Center P a g e | 21
Combined Pressure Loss Figures 28 and 29 show the combined energy loss across the tanks with media.
Figure 28. Total pressure loss across tanks with clean water and media – filtration mode
Figure 29. Total pressure loss across tanks with clean water and media – backflush mode

Hydraulics of Commercial Sand Media Filter Tanks used for Agricultural Drip Irrigation http://www.itrc.org/reports/mediafilters.htm ITRC Report No. R 10-001
Irrigation Training and Research Center P a g e | 22
Activation Pressures and Times for Backflush Valves Backflush valves are “hydraulic” valves and therefore depend on water flow into and out of a chamber that turns the flow on or off in one or more directions. If a backflush valve requires a high pressure to activate, it is possible that this high pressure may exceed all the other drip/micro irrigation system pressure requirements. An additional question is how quickly a backflush valve opens and closes. A quick-opening backflush valve will enable the media tank to be cleaned with less water during backflush, because the high flow rate will be quickly established or stopped – without wasting water during the starting and stopping process. The following physical arrangement was used to test the backflush valve actions. The arrangement put a pressure on both the inlet and “tank” sides of the valve at all times, and also allowed the inlet pressure to remain relatively constant during the on/off action.
Figure 30. Schematic of the test setup with backflush valve closed
Figure 31. Schematic of the test setup with backflush valve open (actuated)

Hydraulics of Commercial Sand Media Filter Tanks used for Agricultural Drip Irrigation http://www.itrc.org/reports/mediafilters.htm ITRC Report No. R 10-001
Irrigation Training and Research Center P a g e | 23
The test procedure was as follows:
1. Close bypass manifold valve.
2. Adjust flow control valve and pressure control valve for 5 or 6 psi and 250 GPM at the inlet of the test valve.
3. Open bypass manifold valve for 100 GPM through the bypass manifold.
4. Readjust flow control and pressure control valves to reestablish 5 psi and 250 GPM at the inlet of the test valve.
5. Record total flow rate, flow rates through the test and bypass manifolds, and pressure at the inlet and filter outlet of the test valve.
6. Open diaphragm pressure line to actuate the valve.
7. Record the time for the flow rate through the valve inlet to drop to 0 GPM.
8. Record final total flow rate, flow rates through the test and bypass manifolds, and pressure at the inlet and filter outlet of the test valve.
9. Repeat steps 1 – 8 at 6, 7, 8, 9, 10, 15, 20, and 25 psi. The two Waterman valves were of the same design and brand. The Flow-Guard and Lakos valves appeared to have the same design (with different filter outlet diameters and possibly different manufacturers). The valve closure time was measured for each of the filter backflush valves at a range of pressures between 5 psi and 25 psi. The Waterman valves actuated the quickest; at 5 psi the valves closed in 6.5 seconds and at 23 psi the valves closed in 4.5 seconds. The Arkal valve actuated the slowest. The Arkal valve did not begin to close until 13 psi was reached in the inlet line. At 13 psi the valve closed in 25 seconds and at 25 psi the valve closed in 13 seconds. The Flow-Guard and LAKOS valves also closed slowly.
Table 5. Minimum and maximum backflush valve closure times and pressures
Valve Minimum
Pressure (psi)
Valve Closure Time at Min. P.
(sec) Maximum
Pressure (psi)
Valve Closure Time at Max. P.
(sec) Average Final Flow (GPM)
Flow‐Guard 5 33 23 7 0
LAKOS 6 29 24 9 33*
Waterman 1 5 7 22 4 0
Waterman 2 6 6 24 5 0
Arkal 13** 25 25 13 0
*Although the “valve closure time” is measured as the time for the flow through the inlet of the backflush valve to drop from 250 GPM to 0 GPM, for the LAKOS valve there was some leakage through the inlet (ranging from 30 GPM to 38 GPM) after the valve was actuated for each of the pressures tested. ** The Arkal backflush valve did not actuate below 13 psi.

Hydraulics of Commercial Sand Media Filter Tanks used for Agricultural Drip Irrigation http://www.itrc.org/reports/mediafilters.htm ITRC Report No. R 10-001
Irrigation Training and Research Center P a g e | 24
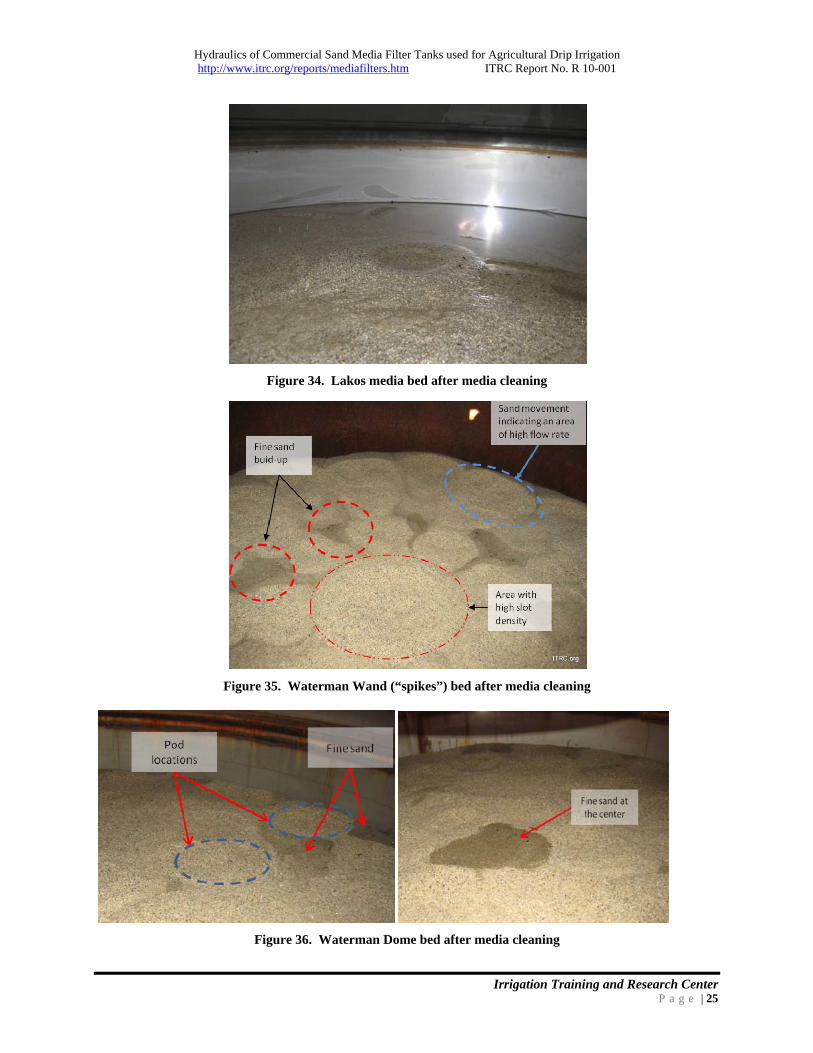
VISUAL INSPECTION OF THE TOP OF THE MEDIA BED AFTER BACKFLUSH
During the initial media cleaning process, the top of the media beds were visually inspected. The intent was to observe obvious uneven (bumpy) surfaces, or distinct color patterns. Such observations indicate uneven backflush flow patterns. The figures below illustrate what was seen.
Figure 32. Arkal AGF-48” media bed after media cleaning
Figure 33. Flow-Guard media bed after media cleaning
Hydraulics of Commercial Sand Media Filter Tanks used for Agricultural Drip Irrigation http://www.itrc.org/reports/mediafilters.htm ITRC Report No. R 10-001
Irrigation Training and Research Center P a g e | 25
Figure 34. Lakos media bed after media cleaning
Figure 35. Waterman Wand (“spikes”) bed after media cleaning
Figure 36. Waterman Dome bed after media cleaning

Hydraulics of Commercial Sand Media Filter Tanks used for Agricultural Drip Irrigation http://www.itrc.org/reports/mediafilters.htm ITRC Report No. R 10-001
Irrigation Training and Research Center P a g e | 26
DISCHARGE OF MEDIA DURING BACKFLUSH A general backflush flow recommendation for a 48” tank is about 190 GPM. Ideally, that would be evenly distributed through the media by the underdrain. If so, the velocities would be identical at all points at the top of the media. The average velocity of the water would be approximately 0.03 ft/sec. ITRC measured the rate of fall through water of the #16 silica media that was used in tests. Ninety-nine percent of the #16 silica sand used had a settling velocity of greater than 0.12 ft/sec. This means that if the backflush flow rates were evenly distributed, one would not expect any media to be removed during backflushing. It is common experience in the industry that high-than-recommended backflush flow rates have caused media to be removed. Little more than that general concept is commonly known. During the media cleaning process, a nylon sock was held over the backflush discharge pipe to collect any media that was removed with a backflush duration of 2 minutes.
Table 6. Sand collected during backflush tests
Filter
Backflush flow rate (GPM)
Mass of sand collected in 2 minutes (gram)
Arkal 200 0 250 0.2
Flow Guard 200 0.7 250 48.6
Lakos (new) 200 0.7 250 18.5
Waterman Dome
200 0.05 250 2.2
Waterman Wand
200 0.0 250 0.0
The flow rates in Table 6 are higher than the 190 GPM or so that is typically recommended. The higher flow rate of 250 GPM was used to examine one aspect of backflush flow uniformity. At the commonly recommended backflush flow rate of 190-200 GPM, all the designs provide little/no media removal.
Figure 37. Examples of large amounts of media removed during backflush

Hydraulics of Commercial Sand Media Filter Tanks used for Agricultural Drip Irrigation http://www.itrc.org/reports/mediafilters.htm ITRC Report No. R 10-001
Irrigation Training and Research Center P a g e | 27
TESTING WITH CONTAMINANTS The most complicated and time-consuming aspect of the tank testing involved the injection of a combination of organic and inorganic materials into water that subsequently passed through the filter tanks. Because of the complexity and difficulties, only two tanks were tested – the Flow-Guard and Lakos tanks. The filter backflush was controlled to start when the differential pressure was 4 psi greater than the clean total differential pressure at 250 GPM. Pressures and flows were continuously recorded. Figure 38 illustrates a typical set of data.
Figure 38. Example data collected during filtration with contaminant
Contaminant Description A combination of soil and organic matter was used. The soil was collected from the bottom of an irrigation canal near Corcoran, California at the JG Boswell Farm, which has a high percentage of silt. The soil was separated into 5 piles, one bucket at a time, to ensure the creation of 5 similar treatment piles (although only 2 were eventually used). The organic matter was ground manure from the Cal Poly compost facility. Contaminants were injected for 15 days, 8 hours/day.
Table 7. Contaminants injected during 15-day tests
Lakos Flow-Guard
Pounds of soil injected 432 432 Pounds of manure injected 264 264 Volume of water filtered (gallons) 1,501,700 1,543,100 Avg. ppm of contaminants 51 46

Hydraulics of Commercial Sand Media Filter Tanks used for Agricultural Drip Irrigation http://www.itrc.org/reports/mediafilters.htm ITRC Report No. R 10-001
Irrigation Training and Research Center P a g e | 28
The first attempts at introducing organic matter utilized several potting soils that were purchased at Home Depot. There were two major problems that were immediately encountered:
1. The potting soil appeared to catch on the inlet dissipater in the Lakos unit (see Figure 39). 2. The potting soil layered the top of the media and built up, and was not removed with backflushing
(see Figure 40).
Figure 39. Potting soil caught on inlet dissipation screen of the Lakos media tank. Flow-Guard has a similar
dissipation screen, but was not tested with potting soil.
Figure 40. Potting soil that accumulated on the top of the media bed, even after repeated backflushing
The experience with potting soil clearly demonstrated the need for having adequate pre-filtration of water before it enters media tanks.

Hydraulics of Commercial Sand Media Filter Tanks used for Agricultural Drip Irrigation http://www.itrc.org/reports/mediafilters.htm ITRC Report No. R 10-001
Irrigation Training and Research Center P a g e | 29
The weakest aspect of the contaminant testing was that the dirt injection mechanism was not continuous. Rather, an auger was activated over a 20-second period once every 7 minutes. The soil/manure mix was augured into a container that mixed it with water, and the mixture was subsequently pumped into the main supply pipe. The result was an injection of contaminants into the supply water for about 1 minute every 7 minutes. This certainly does not match standard injection conditions, although quite frequently media filters are subjected to bursts of contaminants. In spite of this injection problem, the injection was consistent over the tests and consistent between the two tanks that were tested. Therefore, the results of the two tank tests are comparable. ITRC does not know if the results are completely realistic. Backflushing of Contaminants ITRC does not propose some new term such as “filtration efficiency” or “filtration effectiveness”. It can be stated that measurement of the discharge water quality for solids, during filtration, was inconclusive. That means that both the Flow-Guard and the Lakos filters were removing the solids. In that sense, they might well be considered to be very “efficient”. The more challenging equation with media tank testing is to determine if the contaminants, once captured in the media, are removed during backflushing. Two measurements that might indicate the effectiveness of contaminant removal during backflushing include:
1. Do backflushing events become more frequent over time? 2. Can accumulated contaminants be measured throughout the media after the testing?
Frequency of backflushing. The two figures below show 17 days, although the time period of interest is 15 days. Some additional tests were run on the last 2 days.
Figure 41. Number of backflushes per day – Lakos

Hydraulics of Commercial Sand Media Filter Tanks used for Agricultural Drip Irrigation http://www.itrc.org/reports/mediafilters.htm ITRC Report No. R 10-001
Irrigation Training and Research Center P a g e | 30
Figure 42. Number of backflushes per day – Flow-Guard
No measurements or observations conclusively showed why the trends are so different for the Lakos versus the Flow-Guard. In particular, it seems unusual that the Flow-Guard would backflush less often over time. Contaminant Retained in the Media After the extended injection of contaminants, samples of the media were collected in a pattern defined by a template, as shown in Figure 43.
Figure 43. Plastic template used to position sampling cores across the top of the media

Hydraulics of Commercial Sand Media Filter Tanks used for Agricultural Drip Irrigation http://www.itrc.org/reports/mediafilters.htm ITRC Report No. R 10-001
Irrigation Training and Research Center P a g e | 31
Figure 44. PVC cores forced 4” deep into each hole in the template, with collected soil
The media collection process was:
1. At the end of the test with contaminant (17 days) if the process ended in the middle of filtration mode, the backflush mode was run to make sure that all the tanks were in the same situation at the end of the test.
2. The tank was drained. 3. With the media inside still wet, the plastic sampling location layout was placed in the tank. 4. In each location a 3” PVC pipe was pushed four inches deep into the media. 5. The media and contaminants inside the PVC tube were collected. 6. The media collected in PVC cylinders was divided into two parts:
a. Small sample at the bottom of the cylinder, where there are no large contaminant particles
b. Large sample from the surface (the upper part of the sample), where there are large particles
The contaminants were separated from the media and tabulated as a percentage by weight for each sample. Table 8 gives the results for the two tanks that were tested.
Table 8. Contaminant analysis from sand media
Top layer Bottom layer
Filter Percentage of
Non-media Standard
deviation, % cv Percentage of
Non-media Standard
deviation, % cv Flow-Guard 4.9 4.3 0.9 1.0 0.4 0.4
Lakos 12.0 3.9 0.3 3.1 2.6 0.8

Hydraulics of Commercial Sand Media Filter Tanks used for Agricultural Drip Irrigation http://www.itrc.org/reports/mediafilters.htm ITRC Report No. R 10-001
Irrigation Training and Research Center P a g e | 32
BACKFLUSH PRESSURE VERSUS FLOW RATE The backflush action of a media filter is dependent upon the backflush flow, not on the backflush pressure. Figure 45 shows that the pressure at the bottom of a filter does not impact the backflush – as long as the flow rate is the same. For all three bottom pressures, the backflush flow rate was the same.
Figure 45. Duration of filtration compared to number of backflushes, showing that the pressure at the
bottom of the filter does not impact dirt removal, if the flow rate remains constant

Hydraulics of Commercial Sand Media Filter Tanks used for Agricultural Drip Irrigation http://www.itrc.org/reports/mediafilters.htm ITRC Report No. R 10-001
Irrigation Training and Research Center P a g e | 33
SUMMARIZED OBSERVATIONS Most of the key physical characteristics are summarized below. In Table 9, the best values for each category are highlighted in blue; the lowest are highlighted in purple. The “Relative Importance” values are a very first attempt to designate which characteristics are more important than others. For example, a filter may receive a low rating for a characteristic that is not very important. Also, the various characteristics are not independent. For example, the amount of sand removal during backflush is highly dependent upon the design of the underdrain. The reader should be aware that the specific values are not as important as the relative values. For example, if 40 grams of sand is removed during backflush, it is not really important if it was 45 or 35—if other units had almost no sand removal. It is also clear that there are always some inaccuracies in measurement and small differences are not significant. A value of 0.8 psi friction for the Flow-Guard, and 0.9 psi for the Lakos valve were considered to be the same value by ITRC. Hence, both valves were given the same rating for that characteristic.
Table 9. Characteristics of the media filter tanks
Feature Characteristic
Measured Values for Different Tanks Relative
Importance* Arkal Flow‐Guard Lakos
Lakos New
Waterman Wand
Waterman Dome
Valve
Friction during filtration with #16 silica media @250 GPM, psi
2.3 0.8 0.9 2.2 2.1 2.5
Friction during backflush with #16 silica media @200 GPM, psi
5.0 3.0 2.8 11.5 11.5 5
Pressure required to open, psi 13.0 5.0 6.0 5.0 6.0 5Valve closure time at 22‐25 psi, sec. 13.0 7.0 9.0 4.0 5.0 6
System
Total friction loss during filtration @250 GPM when clean
4.3 2.2 2.5 3.6 3
Total friction loss during filtration @200 GPM when clean
6.0 3.5 3.0 13.0 5
Sand Removal
Mass of sand (grams) in 2 minutes @250 GPM 0.2 48.6 18.5 0.0 2.2 10Mass of sand (grams) in 2 minutes @200 GPM 0.0 0.7 0.7 0.0 0.1
Underdrain
Horizontal area (sq. cm.) served by each pod or wand unit
214 613 446 117 214 6
Coefficient of variation of the horizontal area served per pod/wand unit
0.24 0.14 0.31 0.75 0.17 8
% of the horizontal area that is covered by pods or wands
9 3 7 32 12 8
Mean slot width, mm. 0.33 0.23 0.27 0.19 0.29 Std. Deviation of slot widths, mm. 0.036 0.029 0.036 0.026 Not meas. 5Total slot open area, sq. Cm. 200 184 261 343 108 5
Summary Total best ratings 1 7 5 8 4
Total worst ratings 6 3 1 3 4 *The greater the Relative Importance value, the more important this characteristic is. What is apparent from Table 9 is that none of the units was consistently the best or the worst. Each had advantages and disadvantages.
Hydraulics of Commercial Sand Media Filter Tanks used for Agricultural Drip Irrigation http://www.itrc.org/reports/mediafilters.htm ITRC Report No. R 10-001
Irrigation Training and Research Center P a g e | 34
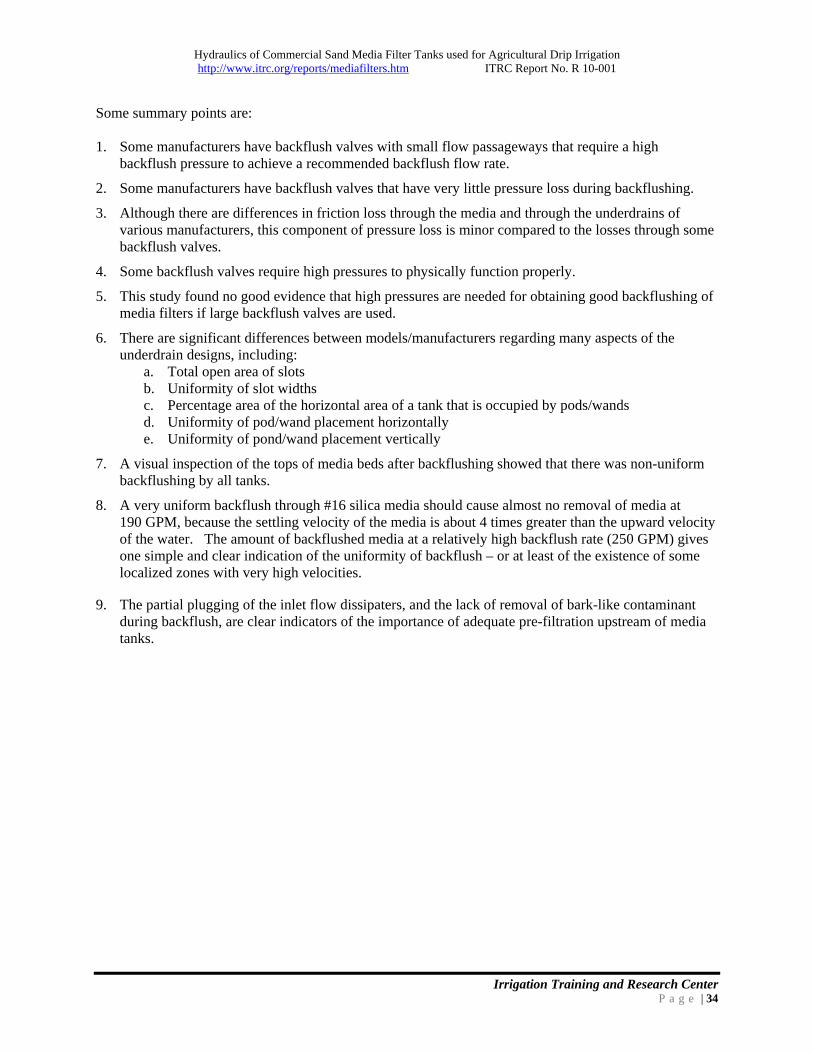
Some summary points are: 1. Some manufacturers have backflush valves with small flow passageways that require a high
backflush pressure to achieve a recommended backflush flow rate.
2. Some manufacturers have backflush valves that have very little pressure loss during backflushing.
3. Although there are differences in friction loss through the media and through the underdrains of various manufacturers, this component of pressure loss is minor compared to the losses through some backflush valves.
4. Some backflush valves require high pressures to physically function properly.
5. This study found no good evidence that high pressures are needed for obtaining good backflushing of media filters if large backflush valves are used.
6. There are significant differences between models/manufacturers regarding many aspects of the underdrain designs, including:
a. Total open area of slots b. Uniformity of slot widths c. Percentage area of the horizontal area of a tank that is occupied by pods/wands d. Uniformity of pod/wand placement horizontally e. Uniformity of pond/wand placement vertically
7. A visual inspection of the tops of media beds after backflushing showed that there was non-uniform backflushing by all tanks.
8. A very uniform backflush through #16 silica media should cause almost no removal of media at 190 GPM, because the settling velocity of the media is about 4 times greater than the upward velocity of the water. The amount of backflushed media at a relatively high backflush rate (250 GPM) gives one simple and clear indication of the uniformity of backflush – or at least of the existence of some localized zones with very high velocities.
9. The partial plugging of the inlet flow dissipaters, and the lack of removal of bark-like contaminant
during backflush, are clear indicators of the importance of adequate pre-filtration upstream of media tanks.

Hydraulics of Commercial Sand Media Filter Tanks used for Agricultural Drip Irrigation http://www.itrc.org/reports/mediafilters.htm ITRC Report No. R 10-001
Irrigation Training and Research Center P a g e | 35
ENERGY IMPLICATIONS 1. Common industry opinion is that media tanks require at least 30-40 psi to operate properly. This is a
significantly higher pressure than what is required for most row crop drip (i.e., tape) irrigation systems. Many row crop drip systems can be designed to operate at about 20 psi, not including the filter pressure requirements. In other words, a 30-40 psi requirement for filtration will determine the pump discharge pressure requirement.
2. The research presented in this report indicate that backflush valves (during the backflush mode) can be the major cause of a pressure drop during backflushing. Therefore, the following guidelines are recommended for the backflush valves of 48” media tanks:
a. Backflush valves should have no more than 5 psi loss during backflushing at 200 GPM b. Backflush valves should require no more than 6 psi to operate properly – in other words, to
securely seat in the backflush position with no leakage. If more pressure is required, that pressure should be supplied by a different pressure supply – one that is only actuated during backflush for the small flow rates needed to activate the valves.
c. Backflush valves should activate in both directions in less than 4 seconds at 25 psi, and in no more than 8 seconds at 15 psi.
3. It is common lore in the irrigation industry that a high pressure is needed for backflushing if the media beds plug up. It appears from this research, although it is not proven, that a non-uniform backflush flow through the media tank can cause much of the media to be ineffective. Therefore, it is hypothesized that a very uniform backflush will reduce problems with plugging up of the media beds. Continuing with this logic, if the media beds do not plug up, there is no need for a high pressure “on standby” to unplug a dirty media bed.
4. A uniform backflush of the media bed will provide better cleaning of the media and less gradual buildup of contaminant in poorly fluidized zones. More uniform backflushing should eventually result in less backflush volume per volume of water filtered, which in turn saves the energy associated with pumping that extra backflush water.
5. To minimize the pressure needed for backflushing, designers and installers must consider at least
three other points. Prior experience by ITRC points to these common problems: a. The backflush water disposal pipelines may be poorly designed and restrict the backflush
flow. Typical errors include not using large enough diameters, having long pipelines, and not including adequate air release valves in the backflush pipeline.
b. The backflush timing and flows (frequency, duration, flow rate) may be improperly adjusted. This can result in a “caking up” or “plugging up” of the media that requires either mechanical agitation or a very high pressure to break up.
c. Only two tanks are used. If only two tanks are used, the friction loss through the one functional tank (i.e., the tank that must filter the backflush water for the other tank, plus supply the irrigation system) can easily be 3-4 times the normal operating friction loss. Assuming that the tanks are set to backflush at a 6 psi differential, this means that during backflush the one flowing tank may have an 18-24 psi friction loss across it.

This report was prepared as part of CEC Contract Number 500‐06‐040.

This report was prepared as part of CEC Contract Number 500‐06‐040.