Embed Size (px)
Citation preview
oy (NAS A-CR--iS159564) Cr6 JET ENiN E- PE-RFO0imANCE.,T-tfj7 TtENT"PROGRAM. "SORT CORE EXHAUST NOZZLE PERFORM'NCE IMPROVIMENT CONCEPT (General E.lectric Co.) 113 p HC A-06/MF AO1
V-79-33-206
'Unclas
t CSCL 21E G3/07 38429
NASA, National Aeronautics and Space Administration
CF6 JET ENGINE PERFORMANCE IMPROVEMENT PROGRAM
SHORT CORE EXHAUST NOZZLE PERFORMANCE IMPROVEMENT CONCEPT
by
W. A. FASCHING
GENERAL ELECTRIC COMPANY
SEPTEMBER 1979 "
Prepared For
National Aeronautics and Space Administration
NASA Lewis Research Center
https://ntrs.nasa.gov/search.jsp?R=19790025035 2018-07-17T10:53:02+00:00Z
FOREWORD
The work was performed by the CF6 Engineering Department of GeneralElectric's Aircraft Engine Group, Aircraft Engine Engineering Division,Cincinnati, Ohio. The program was conducted for the National Aeronauticsand Space Administration, Lewis Research Center, Cleveland, Ohio, underSubtask 2.2 of the CF6 Jet Engine Performance Improvement Program, Contract Number NAS3-20629. This report was prepared by W.A. Fasching, GeneralElectric Program Manager, with the assistance of H. Word, B. Bonini, F. Keenanand B. Safriet. The NASA Project Engineer for this program was F.J. Hrach.The program was initiated in February 1978 and was completed in February1979.
? ECEDING PAGE LA K FILMED
ii

TABLE OF CONTENTS
PageSection
1.0 SUMMARY 1
2.0 TNTRODUCTTON 2
3.0 DESCRIPTION OF SHORT CORE NOZZLE CONCEPT 5
4.0 DESIGN AND FABRICATION 12
4 1 Overall Design Approach 12
4.2 I)es[gn DuscrLptIO 12
4 3 Core Cowl and Pylon Design 14
4.4 Maintainablity 14
4.5 Reliability 15
4.6 Safety 16
5 0 PERFORMANCE TFST 17
5.1 Test Configurations 17
5.2 Test Facility 17
5.3 [nstrumcntaLion 21
5 4 Test Procedure 25
5.5 Test Results 26
6 0 ACOUSTIC TEST 35
6.1 Test Configuration 35
6.2 Test Facility 35
6 3 Instrumentation 39
6.4 Test Procedure 41
6 5 Test Results 43
7 0 ENDURANCE TEST 92
7.1 Test Configuration 92
7.2 Test Facility 92
7.3 Test Procedure 92
7.4 Test Results 92
Iv
TABLE OF CONTENTS
Sect Lon Page
998.0 ECONOMIC ASSESSMENT
1019.0 SUMMARY OF RESULTS
103APPENDIX A - QUALITY ASSURANCE
106APPENDIX B - LIST OF SYMBOLS
108REFERENCES
V
1.0 SUMMARY
The purpose of the Short Core Exhaust Nozzle Program was to develop thetechnology and to demonstrate the technical feasibility of this performance improvement concept on a CF6-50 turbofan engine
Back-to-back performance and acoustic tests were conducted in order thatdirect comparisons could be made between the short core and the long coreexhaust nozzles. In addition, development endurance testing was performed
for mechanical design assurance.
The sea level performance testing substantiated within test accuraciesthe expected uninstalled performance improvement-(-0 3% improved nozzlethrust coefficient) which is predicted to be 0.9% internal sfc improvementat cruise. Flight tests conducted outside this program indicate a cruisesfc reduction of at least 0.9% can be obtained with the Short Core ExhaustNozzle on the Airbus Industrie A300B and the Douglas DC-10-30 aircraft. Theacoustic tests demonstrated that this performance gain was achieved without anincrease in engine noise. The nozzle hardware successfully completed 1000simulated flight cycles of endurance testing without any signs of distress.
An economic assessment of the improvement applied to engines on theBoeing 747 and the Douglas DC-10 is included in the report
I
2.0 INTRODUCTION
National energy demand has outpaced domestic supply creating an increasedU.S dependence on foreign oil. This increased dependence was dramatized bythe OPEC oil embargo in the winter of 1973 to 1974 In addition, the embargotriggered a rapid rise in the cost of fuel which, along with the potential offurther increases, brought about a changing economic circumstance with regardto the use of energy. These events, of course, were felt in the air transportindustry as well as other forms of transportation As a result of theseexperiences, the Government, with the support of the aviation industry, hasinitiated programs aimed at both the supply and demand aspects of the problem.The supply problem is being investigated by looking at increasing fuel availability from such sources as coal and oil shale. Efforts are currently underway to develop engine combustor and fuel systems that will accept fuels withbroader specifications.
Reduced fuel consumption is the other approach to deal with the overallproblem A long-range effort to reduce consumption is to evolve new technology which will permit development of a more energy efficient turbofan orthe use of a different propulsive cycle such as a turboprop. Although studieshave indicated large reductions in fuel usage are possible (e.g., 15 to 40%),the impact of this approachin any significant way would be 15 or more yearsaway In the near term, the only practical propulsion approach is to improvethe fuel efficiency of current engines. Examination of this approach has indicated that a 5% fuel reduction goal starting in the 1980 to 1982 time periodis feasible for the JF6 engine This engine is, and will continue to be, asignificant fuel user for the next 15 to 20 years.
Accordingly, NASA is sponsoring the Aircraft Energy Efficiency (ACEE) program(based on a congressional request) which is directed at reducing fuel consumptionof commercial transports. The Engine Component Improvement (ECI) program is theelement of the ACEE program directed at the fuel efficiency of current engines.The ECI program consists of two parts: engine diagonstics and performance improvement. The engine diagnostics effort is to provide information to identify thesources and causes of engine deterioration. The performance improvement effortis directed at developing engine performance improvements and retention componentsfor new production and retrofit engines The initial effort consisted of a feasibility analysis which was conducted in cooperation with the Boeing and Douglasaircraft companies and American and United Airlines. The study consisted of:
* The identification of engine and component modifications which exhibited a fuel savings potential over current practice in CF6 engi no's.
* The technical and economic assessment of the modifications,including the impact on airline acceptability and the probabilityof production introduction of the concepts by the 1980 to 1982time period as well as their retrofit potential
* The assessemnt of fuel savings for the DC-10-10, DC-10-30, and theB-747-200 aircraft.
2
* The selection of the most promising concepts and the preparationof Technology Development Plans for their development and evaluation in ground test facilities
The results of the feasibility analysis are reported in Reference 1.
One of the concepts selected for development was the Short Core ExhaustNozzle, hereafter referred to as the Short Core Nozzle. This report presentsthe results of the development work on the concept.
In 1974/1975, General Electric and the Douglas Aircraft Company conducted a series of model tests directed at performance improvement of the CF6-50core engine exhaust system The CF6-50 engine was initially designed to provide core engine thrust reversing, however, many airline operators subsequently deactivated the core reverser or adopted a fixed nozzle system thathad the same aerodynamic flowpath but did not provide the reversing function.The elimination of core engine thrust reversing capability on many aircraftprovided the necessary flexibility for design changes and potential performance improvements through reduced internal pressure losses and external drag reduction
The model tests cited above confirmed the potential for improvement, andpreliminary design studies were initiated by General Electric and Douglas.Subsequent work effort included additional model tests and full-scale flighttests The additional model tests included wind tunnel tests with wing-on inwhich Douglas determined an interference drag reduction potential; full-scaletuft and pressure surveys conducted on a DC-10 by Douglas substantiated thatthe interference drag observed on the model actually exists on the airplane.In August 1977, a static model test was conducted by General Electric toimprove the internal flowpath to achieve the desired nozzle flow area forengine thermodynamic cycle matching. Further wind tunnel scale model testswere conducted by General Electric in October 1977 on the selected configuration. These tests confirmed the results of the initial tests.
In late 1977, the Short Core Nozzle performance improvement concept was selected for development and evaluation in ground test facilities by the NASAEngine Component Improvement Program because of its high fuel saving potentialand high payback for the DC-10-30 aircraft.
The objective of the program was to develop the technology of the Short Core Nozzle system and to verify the predicted fuel savings by full-scale engine ground tests. Mechanical, cycle, performance, acoustic, and installation design studies were conducted in support of the engine tests.
In the program, a back-to-back sea level static performance test was conducted in a test cell on a CF6-50 engine equipped with a Long Fixed Core Nozzle and appropriate cowl doors and the same engine equipped with the ShortCore Nozzle and a new core cowl. The acoustic test consisted of a back-toback test of a CF6-50 engine equipped with the Core Reverser Nozzle and thesame engine equipped with the Short Core Nozzle in an outdoor noise testfacility Endurance testing of a CF6-50 engine with the Short Core Nozzle was performed in order to establish the life capability of the new exhaustsystem.
3
The performance test objective was to demonstrate with a back-to-backengine test the overall thrust coefficient improvement of the Short Core Nozzle versus the Long Fixed Core Nozzle configuration to substantiate scalemodel test results. The objectives of the acoustic test and subsequent dataanalysis were
* To establish the acoustical effect of the Short Core Nozzleon CF6-50 engine noise.
* To assess the impact of the engine modification on communitynoise levels for typical aircraft approach and takeoff flightconditions
The objective of the endurance test was to demonstrate the structuralintegrity of the Short Core Nozzle by subjecting it to 1000 simulated flight
4
3.0 DESCRIPTION OF SHORT CORE NOZZLE CONCEPT
The Short Core Nozzle is a replacement for a deactivated Core ReverserNozzle or the Long Fixed Core Nozzle, both of which are in use on the CF6-50high bypass turbofan engine (Figure 1). A comparison of the Short CoreNozzle with the Long Fixed Core Nozzle is shown in Figure 2. A comparison ofthe nacelle and pylon for the short exhaust system with the production DC-I030 installation is shown in Figure 3.
The Long Fixed Core Nozzle was introduced for DC-10 and 747 aircraft forthose airlines which do not require core stream reversing to meet their landing requirements. The lighter weight A300B aircraft do not require a coreexhaust reverser, and Long Fixed Core Nozzles are used. These nozzles haveessentially the same flow lines as the Core Reverser Nozzle Both the LongFixed Core Nozzle and Short Core Nozzle systems provide significant weightreductions by removal of the deflector structure, blocker doors, and actuation and position sensing hardware.
As can be seen in Figure 3, the Short Core Nozzle system requires reduced diameter fan flow lines aft of the fan reverser, therefore, recontouringthe engine core cowl as well as the core nozzle is needed. The reduceddiameters are due to the elimination of the exhaust reverser function. Thereverser hardware, in particular the stationary deflectors and reverser actuators, requires a larger cowl diameter at the engine turbine rear frame.This requires the boattail angle in the core nozzle region to be approximately12 degrees with the reverser rather than the 15 degrees, which is possible withthe deflector structure removed. The reduced diameter cowling and shorternozzle, therefore, reduce weight, core pressure loss and scrubbing drag.This drag and pressure loss reduction along with a recontoured lower pylonfairing was estimated to result in a significant sfc reduction during cruiseA weight reduction of 45 kg (100 lbs) over the Long Fixed Core Nozzle, and147 kg (325 ib) over the Core Reverser Nozzle would be achieved with the ShortCore Nozzle.
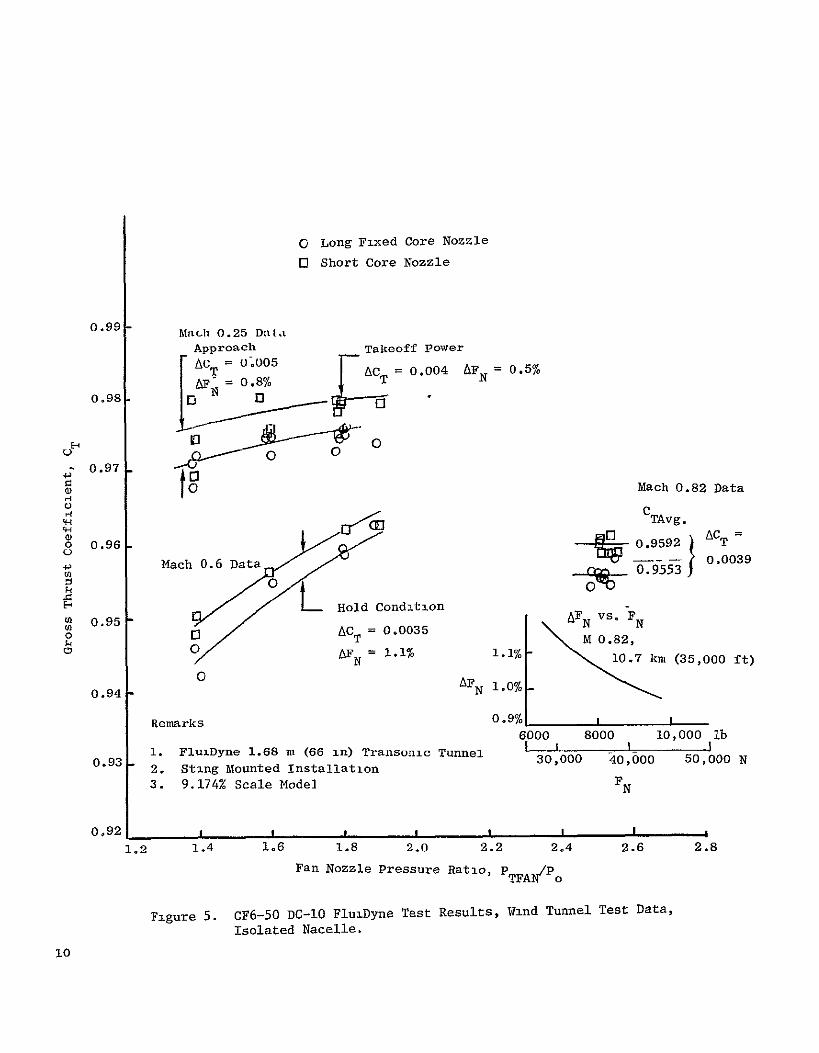
An assessment of Short Core Nozzle performance improvement was obtainedfrom isolated nacelle model tests at FluiDyne in March 1978. The modeltest included evaluation of both the Long Fixed Core Nozzle and the ShortCore Nozzle to obtain a direct measure of the improvement with the Short CoreNozzle. The gross thrust coefficients for these nozzles are presented inFigure 4 for the static testing and in Figure 5 for the external flow windtunnel testing. It can be seen from Figure 4 that the static test demonstrated improvements in gross thrust coefficient with the Short Core Nozzle of0 0036 and 0.0037 at maximum cruise power and normal cruise power pressureratios, respectively. At lower nozzle pressure ratios, there is more scatterin the test data and the improvement is approximately 0.0035 in gross thrustcoefficient. From Figure 5, it can be seen that the improvement with theshort nozzle is 0.0039 in gross thrust coefficient at M 0.82 cruise. Theinsert in Figure 5 shows that this improvement is approximately 1% net thrust(-1% sfc) at 40,000 N (9,000 ib) of net thrust and 10,668 m (35,000 ft)altitude. This improvement in cruise thrust coefficient is exactly the
5
Reverser Mechanism
,ore Reverser Nozzle
Long Fixed Core Nozzle
Current CF6-50 Core Nozzles.Figure 1.
6
Long Fixed Core Nozzle
Short Core Nozzle
Figure 2 Comparison of Short Core Nozzle to Long Fixed Core Nozzle
A -Core Reverser Nozzle or
Long Fixed Core Nozzle Section A-A
a) Production DC-10-30 Nacelle and Pylon - CF6-50 Engine with Core
Reverser Nozzle or Long Fixed Core Nozzle.
B C
> Section B-B Section C-C
Short Core Nozzle
Nodified Nacelle and Pylon Fairing - CF6-50 Engine with Short Core Nozzle.b)
Figure 3. CF6-50 Nacelle-Pylon-Core Nozzle Comparison.
O Long Fixed Core Nozzle O Short Core Nozzle
la-uo
Max. Cruise
Ac = 0.0036T
0.99
S ACT T .0.0035
UU
0 0.98003 HT
0 0.97 (Avg. of Cruise Points)
oE
(0 0.96
Remarks
0.95 1. FluiDyne Channel 7 Facility
2. Sting Mounted Installation3. 9.174% Scale Model
0.94 I I I I1.4 16 1.8 2.0 2.2 2.4 2.6 2.8 3.0
Fan Nozzle Pressure Ratio, pTFANPo
Figure 4. CF6-50 DC-10 FluiDyne Test Results, Static Test Data,Isolated Nacelle.
9
0
o Long Fixed Core Nozzle
C Short Core Nozzle
0.99 Mach 0.25 Data
Approach Takeoff power
ACT = 0.05 CT =0.004 AF = 0.5%
AF- = 0.8% 0.98. 0 U
L 0 0 0o45
0.97 -
Mach 0.82 Datato C)C
TAvg.13 ACT
o 0.96 0.9592 T o - - .-- 0 .0039
Mach 0.6 Data 0.9553
Hold Condition o 0.95
A C = 1 1 AFN =1.1% 10.7 km (35,000 ft)
0.94 0 AFN 1.0%
0.9% I IRemarks 6000 8000 I0,000 lb
1. FluiDyne 1.68 m (66 in) Transonic Tunnel I I I0.93 2, Sting Mounted Installation 30,000 40,000 50,000 N
EN3. 9.174% Scale Model
0,92 1 1 1 1 1 - I
2.0 2.2 2.4 2.6 2.81.2 1.4 1.6 1.8 Fan Nozzle Pressure Ratio, PTFAN/Po
Figure 5. CF6-50 DC-10 FluiDyne Test Results, Wind Tunnel Test Data,
Isolated Nacelle.
10
improvement that was obtained in the 1975 model test of an earlier version ofthe Short Core Nozzle. At lower Mach numbers (Mach 0.6 and 0.25 on Figure 5),there is more data scatter but the Short Core Nozzle shows an improvement atall conditions
Installation of the Short Core Nozzle is readily adaptable to all CF6-50series engines on the A300, DC-10-30, and 747 airplanes Utilization of theShort Core Nozzle requires a different core cowl and lower pylon fairing.
11
4 0 DESIGN AND FABRICATION
4.1 OVERALL DESIGN APPROACH
The Short Core Nozzle is functionally similar to the CF6-50 Long
Fixed Core Nozzle. In designing the Short Core Nozzle, core cowl and corenozzle contours were established which result in reduced scrubbing area and,therefore, drag The cowl diameter aft of the fan reverser and core nozzlelength and diameter were reduced The effect is that the boattail (divergence) angle aft of the fan was increased from 12 to 15 degrees providing thedrag improvement The nozzle is converging-diverging with an area ratio of1.035.
The Short Core Nozzle requires a minimum of modification to the engineNo changes in the fan reverser are made. Bolting flanges for the Short CoreNozzle, the Core Reverser Nozzle, and the Long Fixed Core Nozzle are common.However, since the core cowl diameter over the turbine rear frame is reduced,the envelope available for the supply and scavenge tubing in the vicinity ofthe turbine rear frame is also reduced. These tubes were formed to more closelyfollow the turbine rear frame Lontour than was previously the case Also,the core cowl hinge line on the pylon and pylon apron required modificationto accommodate the new flow lines Since the Short Core Nozzle does nottranslate as does the Core Reverser Nozzle, it no longer is necessary to provide a horizontal split line at the fairing juncture with the pylon. Therefore,it is advantageous to support the total fairing directly from the pylon ratherthan splitting the fairing and carrying half on the nozzle and half on thepylon.
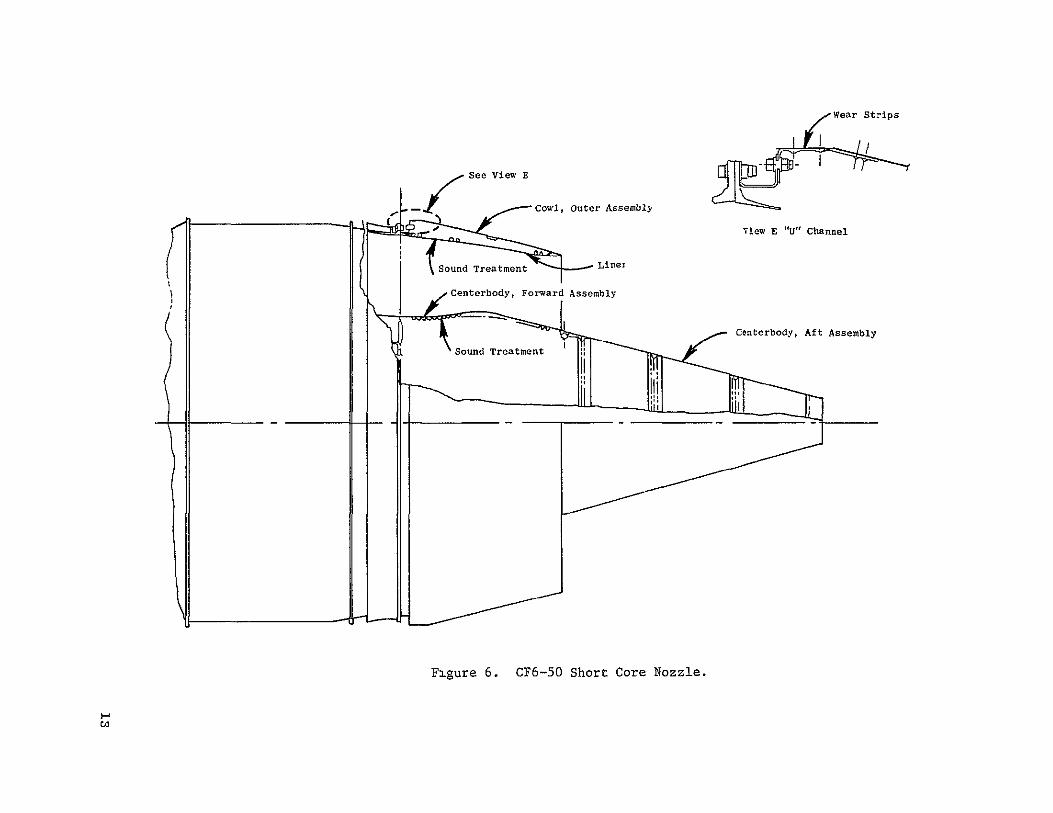
4 2 DESIGN DESCRIPTION
The Short Core Nozzle is depicted in Figure 6 The design includes anouter cowl with an integral core cowl support ring, exhaust nozzle liner,forward centerbody, aft centerbody, replaceable core cowl wear pads, baffle,and associated mounting hardware There are no provisions for pylon fairings or pylon fairing attachment structure, these fairings are part of the airframe pylon structure
The material used in this lightweight, high temperature structure isInco 625 for the sheet metal and stiffeners and the rolled and welded flanges.Wear surfaces are provided by plasma spraying of a wear-resistant coating,tungsten carbide Bolting hardware is Inco 718 due to the high temperaturelocations and the frequent removal/reasembly operations.
Both the inner and outer nozzle sections and the centerbodies are full360 degree bodies of revolution The sheet metal components are butt-weldedtogether, and reinforcing "hats" and doublers are attached by brazing
12
/See View E
wCowl, Outer Assembly
fTi E "U" Channel
j Sound Treatment Linei
Centerbody, Aft Assembly
Figure 6. CF6-50 Short Core Nozzle.
H4
The sound treatment design Lb the same type as that used on the Core Reverser Nozzle, i.e , the corrugated "top hat" type treatment In this design, the face sheets are perforated with 1.6 mm (0 063 in ) diameter holes onln 60 Itgi ,c nt ujg('redt paIl , i In to ohi 'in lhe reclutred 9% _t 2% open area To provide acoustic chambers, 0.19 mm (0 0075 in ) Inco 625 sheet metal isformed into circumferential corrugates to a height of approximately 9.5 mm(0.375 in ) dependent upon the tuning required and brazed to the nonflowpathbide of tie face sheet Fujl height 9 5 mm (0 375 in ) sheet metal partitionsplaced at every 76 mm (3 in.) of circumference in the corrugate serve toreduce any rotational wave propagation Drain holes are provided in eachcorrugate at bottom vertical to prevent accumulation of unburned fuel during
2"hot" starts In the concept utilized, there are approximately 1.44 m (15 5ft2) of sound treatment area in the outer liner and 0 88 m2 (9 5 ft2 ) in
2the centerbody for a total of 2.32 m (25-0 ft2 ) which is comparable to thatfor the current exhaust system.
4.3 CORE COWL AND PYLON DESIGN
Douglas Aircraft Company designed the core cowl and pylon modifications.The nacelle modification, exclusive of the pylon, involves the area aftof the fan reverser New, steeper external loft lines for the core cowl andcore nozzle necessitated a change to the core cowl attachment to the pylonThe present center and aft core cowl hinges were redesigned to a lower location so as not to protrude into the airstream. The pylon apron which sealsthe interface between the core cowl and the pylon was redesigned to relocateit to follow the new loft line The aft pylon fairing was redesigned to matchthe new short nozzle contour and the aerodynamic lines developed for thisshorter exhaust system.
Stress analyses were conducted to establish material gages for strengthrequirements. Material selections utilizing aluminum, steel, and titaniumwere made to minimize cost and weight consistent with the temperature environment Detailed design drawings were made for fabrication of the hardware.
Three sets of prototype core cowl doors were furnished by General Electric for engine test and the flight test program on the Airbus A300B TheDouglas flight test program was conducted with Douglas production cowling.These flight test programs are described in Section 4.6
Tnqtallation/rework drawingq were made for all the new components sothat the production airplanes used for flight testing could be readily configured for test and reworked back to the original production quality forlater delivery to the airplane customer
4.4 MAINTAINABILITY
Compared to the Core Reverser Nozzle, maintainability is improved, because with the Short Core Nozzle, there are no actuating components, and,therefore, rigging after assembly is not required. No parts have to be freeto translate, thus eliminating fretting and wear.
14
With regard to the Long Fixed Core Nozzle, however, there is no majorchange in maintainability with the Short Core Nozzle. Reducing the weight ofthe outer cowl of the nozzle is expected to simplify handling of that component The cowl door support land on the Short Core Nozzle has replaceablewear strips whereas the Long Fixed Nozzle core cowl support has wear coatingplasma sprayed directly on the support cone land and is more difficult torefurbish.
Access to the core cowl compartment is achieved in the same manner asbefore, through opening the core cowl doors The nozzle is a true body ofrevolution, and there are no pylon fairings mounted to it. The pylon fairlngsattached to t1f& pylon are not provided with "skirt" extensions, and there isno contact between the cowl surface and the pylon-mounted fairing.
The bolting hardware attaching the outer cowl and the forward and aftcenterbodies is made of Inco 718 with silver-plated Waspalloy nuts toaccommodate the high temperatures. The outer cowl has lifting bracketsattached to facilitate handling.
The-sheet metal and flange material used in the nozzle is Inco 625 whichis readily repair welded and requires no subsequent heat treatment to reestablish its properties. The thickness of the aft centerbody and the soundtreatment face sheet has been increased from 0.36 xmm (0 014 in.) and 0.46 mm(0.018 in.), respectively, to 0.63 mm (0.025 in.) in order to lessen handlingdamage.
4 5 RELIABILITY
Compared to the Core Reverser Nozzle, the reliability of the exhaustsystem is greatly improved because of the elimination of the translation mode. All actuation and position sensors utilized in the turbine reverser were removed
The Short Core Nozzle was designed to achieve a total useful life, with repair, of at least 35,000 projected flight cycles or 50,000 aircraft operating hours, whichever occurs first It was designed to operate for the power4(It(np ind wi thin the Fl iphi envolope defined In the Fngine Model Specifir111 LOil
Maneuver limit load factors for flight and landing, including landingimpact, have been established Loads were established consistent with methodsused on the Long Fixed Core Nozzle for combining translation accelerations,angular velocities, and thrust or drag. The additional constraint of engineoperation with higher inertia loadings due to a fan blade-out was also met
The temperatures and pressures to be encountered in the nozzle were takenfrom the 0F6-50 cycle deck. The applicable General Electric Design Practiceswere utilized in the design process
15
4.6 SAFETY
A detailed stress analysts of the individual components utilizing themaneuver, pressure and thermal inputs has been completed and documented.All flight envelope cases analyzed gave a positive margin of safety FAAAir-Worthiness Standards Aircraft Engines Part 33 Revised 10/31/74 and FAAAdvisory Circular AC33-1B guided the design.
The construction features and materials utilized are quite similar tothe well-proved Long Fixed Core and Core Reverser Nozzles.
In order to substantiate both reliability and safety, a series of enginetests was run. The endurance test described in Section 7.0 is one such test.Other tests included the following
rype, of Test flposure
Ground Test 88 simulated flight cycles
Airbus Industrie 19 flights accumulating 47A3OOB Flight Test hours and 30 minutes on each
nozzle plus a total of 10hours and 18 minutes ofground running
Douglas Aircraft Co 382 hours and 15 minutes ofDC-10 Flight Test flight testing including 415
total engine cycles cumulativeon all nozzles flown
For the ground test, the Short Core Nozzle was instrumented with accelerometers on both the nozzle and centerbody to establish response frequenciesfrom ground idle to takeoff power. Good agreement with calculated data wasobtained and accelerations were well within capability.
This nozzle was then used in the Airbus Industrie A300B flight test program. A total of 21 pressure taps installed on the outer cowl was monitoredduring flight testing to establish pressure distributions on the cowl.
16
5.0 PERFORMANCE TEST
5,1 TEST CONFIGURATIONS
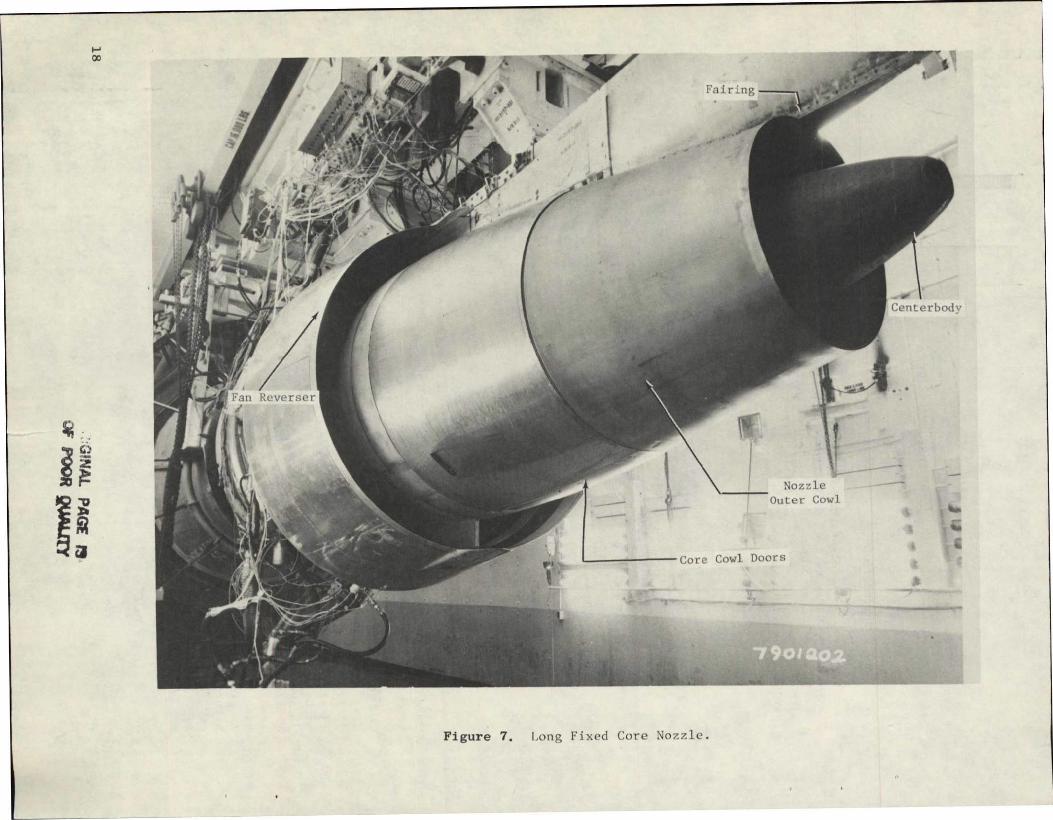
The test vehicle was the CF6-50 engine. Figure 7 shows the Long Fixed
Core Nozzle configuration including the pylon fairing simulating the wing
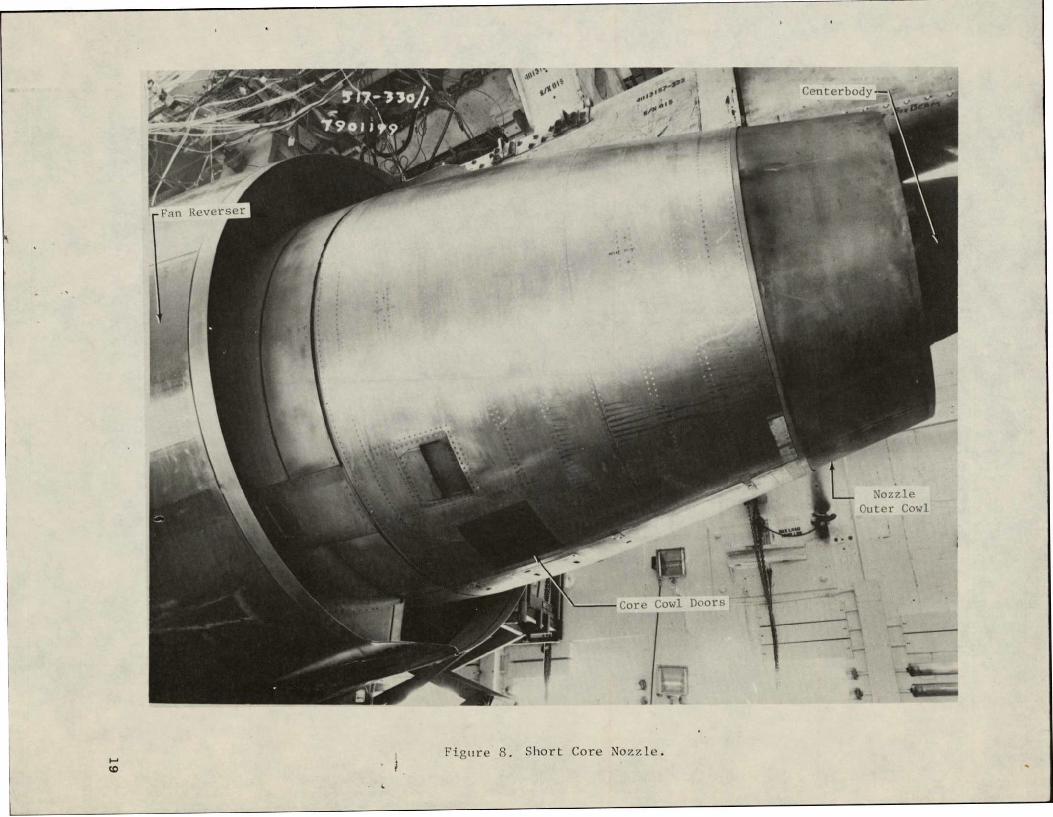
position on the airplane. Figure 8 shows the Short Core Nozzle configuration
with the Short Core Nozzle Core cowl doors. The Long Fixed Core Nozzle testhardware consisted of:
* Fan Reverser
* Core Cowl Doors
* Long Fixed Core Nozzle- Outer Cowl
- Forward Centerbody
- Aft Centerbody
* Nozzle Fairing
Changes made to install the Short Core Nozzle were:
* Core Cowl Doors
* Short Core Nozzle- .Outer Cowl
- Forwnrd Cent erbody
- Aft Ceaterbody
A flight-type engine cowling, a test inlet bellmouth for measurement of
inlet airflow and an inlet screen for foreign object damage protection wereused for the test.
5.2 TEST FACILITY
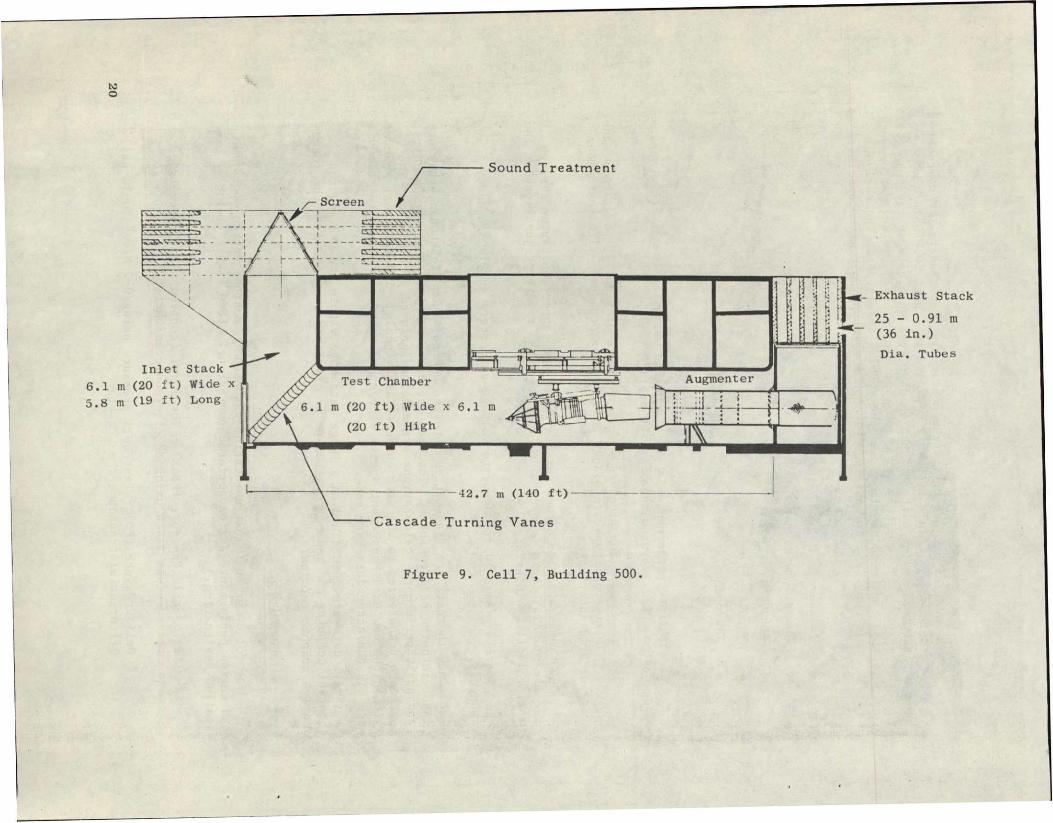
Iigure 9 is a schematic of engine test cell 7 in Building 500 of General
turbofan or turbojet test facilityElectric's Evendale Plant. It is a large
with inlet air heaters capable of up to 66* C (150* F) at 907 kg/sec (2000
The cell exhausts are water-cooled with sound-controlledlb/sec) airflow. vertical intakes and discharges. Overhead thrust frames can handle thrust
loads up to 445,000 N (100,000 lbs). All cells are equipped for automtic dataspeedshandling, including transient recording up to 400 analog channels at
ranging from 200 to 10,000 channels per second. Printed data are available
within 2 minutes after initiation of a reading.
17
I Reverser
..
Nozzle
Core Cowl Doors
Figure 7. Long Fixed Core Nozzle.
* ow A
Figure' 8. Short Care Nozzle.
to V
____
W
Sound Treatment
rScreen --- 1--... .
:v I!!, Exhaust Stack
Inlet Stack Test
,"AU~--,i \[
-1
25 -O.91m (36Dia.in.)Tubes
Tuber
6.1 m (20 ft) Wide 5.8 m (19 ft) Long
x 6.1
Test Chamber m (20 ft) Wide
(20 ft) High
x 6.1 mnW u e .
A
_-42.7 m (140 ft)
Cascade Turning Vanes
Figure 9. Cell 7, Building 500.
Engine control'and safety instrumentation is processed by the computerized control console. This system is depicted in Figure 10. Data are converted into engineering units and can be displayed on a cathode ray tube (CRT)by addressable call-up pages, bar graphs, or data plots. Limited performancecalculations can be accomplished and the results displayed on the call-uppages. Bard copy data are obtained through a teletype unit with capacities asfollows:
* Pressure - 39 channels
* Potentiometer Position - 6
* Frequency - 9
* Thrust - 1 channel
* Thermocouple - 43
* Vibration - 8
Steady state performance data are acquired using the on-site Data Management System (DMS). System capabilities are:
345 Pressures - The pressure system consists of eight 48-position scanner valves. Thirty positions are blanks or reference pressures with the number varying by scanner valve.
400 Temperatures - Either chromel-alumel or copper-constantan through the use of CATS blocks (copper alloy thermal sink) reference junctions at theengine facility interface.
There are also 10 frequency-to-voltage converters and 10 frequency counters.
Once the data are transmitted into the control room blockhouse, they are input into the cell computer. The data are converted into engineering units and basic performance calculations are made and printed out on-line. The data are transferred to the site computer at Evendale. The data base manager within the new Data Management System stores and retrieves each data item via its six character data base code..
All data are maintained on a large data base within the DMS and the central computer and can be recalled to be displayed or plotted on the interactive graphic terminals.
5.3 INSTRUMENTATION
The following test instrumeantation was used to monitor engine operationand engine perfratnce during performance testing. (See Figure 11 forstation designation.)
* Barometric Pressure (PBAR) - The local (control room) barometric pressure was taken using an electronic barometer.
* Cell Pressure (PO) - Test cell pressure using 0-7 N/cm2 (0-10 psi)differential transducer.
21
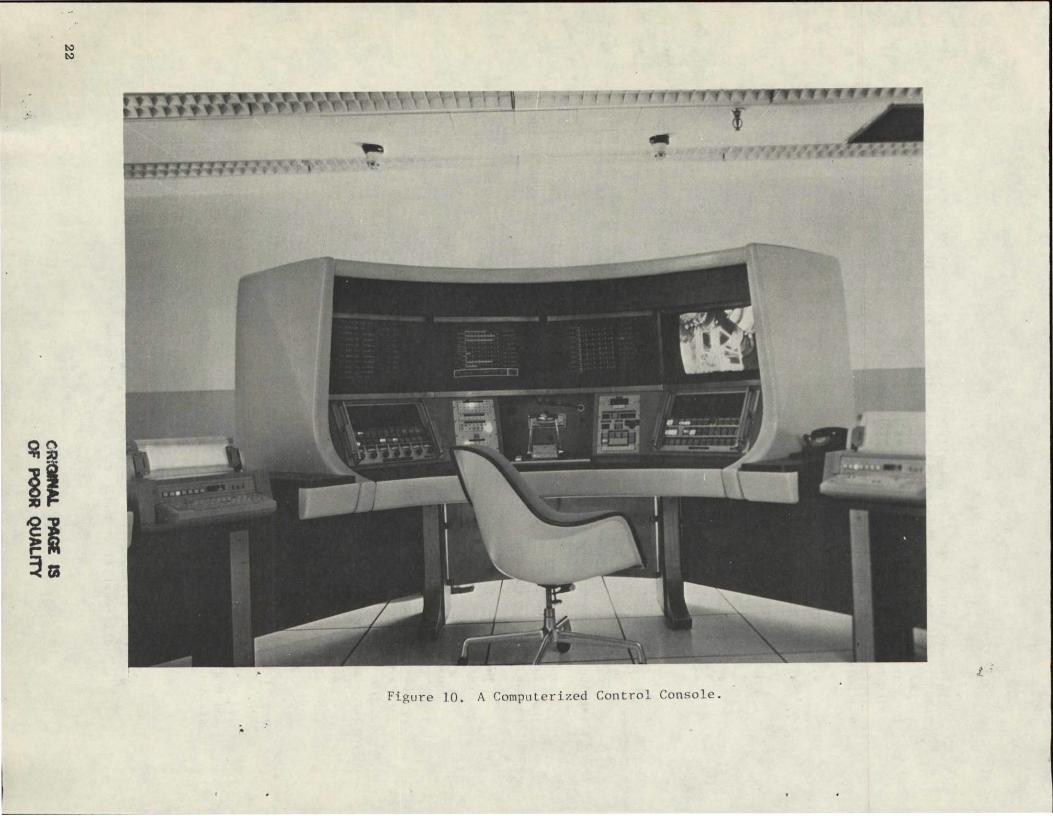
Figure 10. A Computerized Control Console.
* Humidity (HUM) - The absolute humidity in grains of moisture perpound of dry air was recorded using a wet/dry bulb sling psychrometer
* inlet Total Pressure (PT2) - Four 6-element total pressure rakeslocated in the engine inlet at the fan face and measured with 0-7N/cm 2 (0-10 psi) differential transducers and pressure scanningvalves were used The circumferential locations of these rakesmeasured from the engine top vertical centerline were 45, 135, 225,and 315 degrees
* Inlet Static Pressure (PS2) - Four 6-element rakes identical to thetotal pressure rakes were used
* Compressor Inlet Static Pressure (PS25) - One static pressure taplocated on the outer wall of the fan frame core flowpath wasrecorded. Measurements were made using a 0-10 N/cm2 (0-15 psi)differential transducer and pressure scanning valve.
* Compressor Inlet Temperature (TM25) - One ungrounded copper constantan thermocouple, replacing one of the mounting bolts for theCIT sensor, was utilized.
* Compressor Discharge Temperature (TT3) - One ungrounded chromelalumel probe mounted in the condition monitoring port of thecompressor rear frame was utilized.
Compressor Discharge Static Pressure (PS3) - A wall static pressuretap was located in a combustor borescope port and measured on a 0-345N/cm 2 (0 to 500 psi) absolute transducer.
* Low Pressure Turbine Inlet Total Pressure (PT49) - Five 4-elementprobes were manifolded by probe and measured on a 0-103 N/cm2
(0 to 150 psi) absolute transducer.
* Exhaust Gab Temperature (T49) - The low pressure turbine inlet temperature indicating system consisted of 11 dual-immersion chromelalumel thermocouples electrically averaged. The system was composedof four harnesses which were joined together by means of an aft leadwhich, in turn, connected to a forward lead. The foward lead hadanother electrical connector for transmission of the signal to theEGT indicator
* Low Pressure Turbine Discharge Pressure (PT5) - Four 5-element rakeswere manifolded together and located in the turbine rear frame PT5was measured with a 0-10 N/cm2 (0-15 psi) differential transducerand pressure scanning valves.
* Low Pressure Turbine Discharge Temperature (TT5) - Two 5-elementrakes were located in the turbine rear frame. The signals wereelectrically averaged thermocouples.
24
* Fan Discharge Pressure (PT13) - Four strap-on rakes Two each withfour elements and two each with three elements for a total of 70pressures were read by each immersion and located on the strut inthe fan frame. The measurement was made with a 0-10 N/cm2 (0-15 psi)differential transducer and pressure scanning valve.
* Fan Speed (NI) - Low pressure rotor speed was measured using two fan speed sensors.
* Core Speed (N2) - High pressure rotor speed was measured using an C1gtLue Cott. Sp d sLcaor driv.n off tlie end of OIL tube and scavenge pump.
* Main Fuel Flow (WFM) - Facility engine fuel flow was measured on avolumetric turbine flowmeter.
* Verification Fuel Flow (WFV) - Facility engine fuel flow was measuredin series with WFM.
* Fuel Temperature (TF) - Facility engine fuel temperature was measuredat the flowmeters using a copper-constantan thermocouple.
* Thrust (FGM) - 222,400 N (50,000 lb) three bridge load.
5.4 TEST PROCEDURE
The Long Fixed Core Nozzle configuration was tested first. Normal prefire checks, idle leak check, and mechanical checkout were completed. Thepower calibrations conducted for the test consisted of 15 steady state speedsettings from 2093 to 3980 rpm or 61 to 116% corrected speed. At each speedpoint, two readings were taken after a stabilization time of 3 minutes
The first power calibration was completed and the first six points wererepeated before instrumentation problems with PT49 (low pressure turbineinlet pressure) and PS3 (borescope compressor discharge static pressure)occurred Further attempts to complete the second power calibration resultedin failure due to icing on the inlet airflow rakes Bad weather forecastedfor the next three or four days was the deciding factor in the decision touse the inclement weather period to install the Short Core Nozzle configuration. The six top points of the second power calibration demonstrated goodrepeatability of the data and the total points completed were, therefore, considered adequate for representing the Long Fixed Core Nozzle charcteristics
The Short Core Nozzle configuration was installed and the power calibration was completed twice with no further problems.
25
5.5 TEST RESULTS
At sea level test cell operating conditions, the performance indicatorfor the Short Core Nozzle improvement is primarily the difference in overallgross thrust coefficient. The thrust coefficient is defined as follows-
CT = FiFanFO+ FiCore) ' where
.lcore - Ideal core nozzle thrust bascd on core measured pressures andcalculated core gas flow.
FiFan = Ideal fan nozzle thrust based on fan duct measured pressures, inlet total airflow, and calculated core flow.
Two methods were used in calculating the overall gross thrust coefficient difference. The first method utilized the scale model data nozzle flow coefficient difference. The first method utilized the scale model data nozzle flowcoefficients to determine core airflow and the second method utilized the lowpressure turbine effective area to determine core airflow. The fan flow wasobtained by subtracting the calculated core flow from the total flow determined from the inlet total pressure rakes.
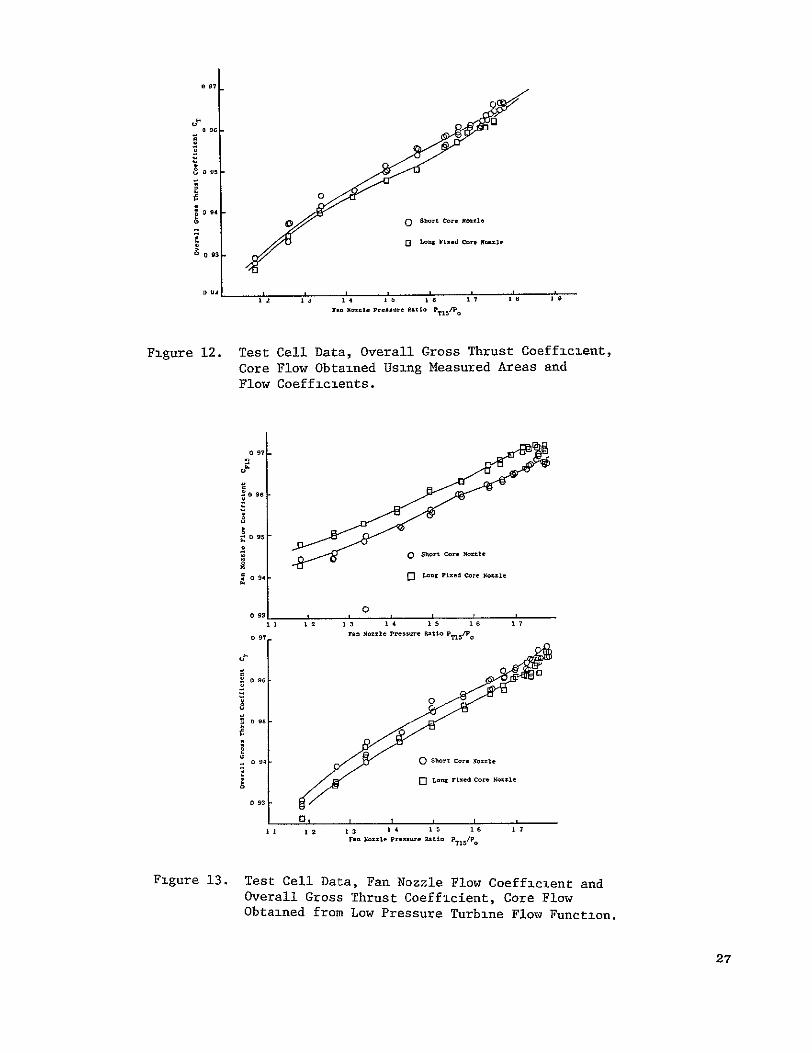
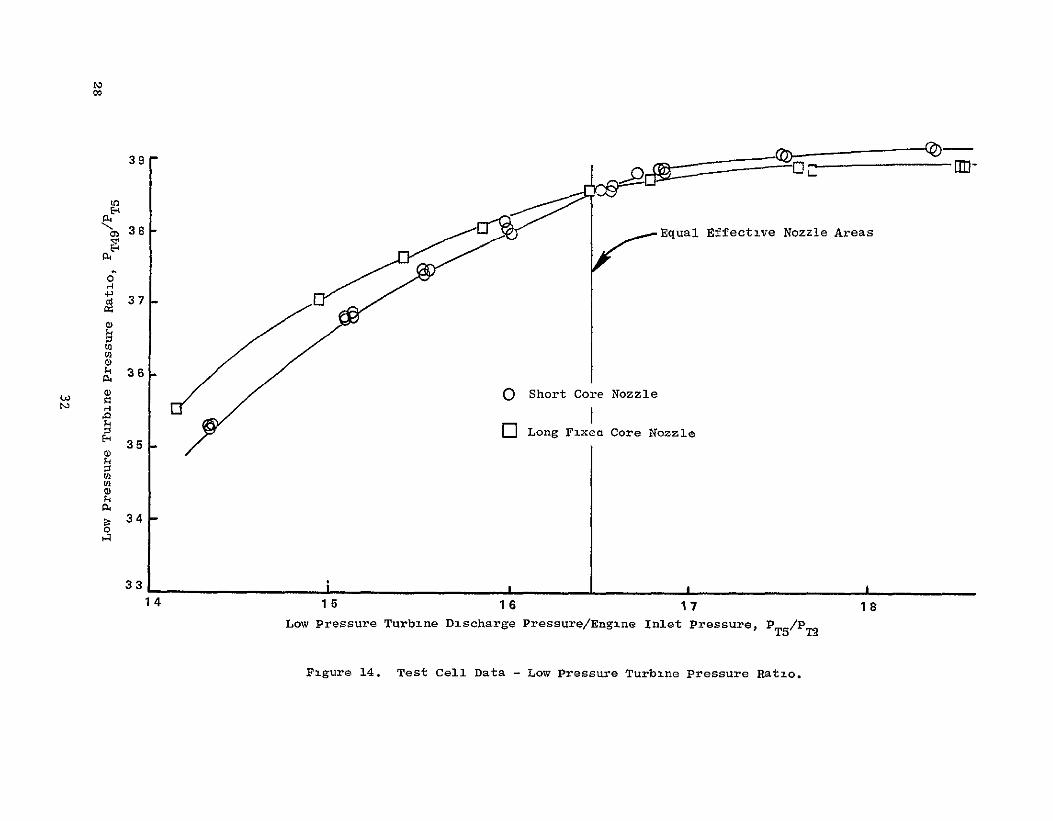
Both methods indicated overall gross thrust coefficient improvements inthe order of 0 0025 as shown in Figures 12 and 13. The first method is dependent on accurate physical area measurements of both Long Fixed and ShortCore Nozzles and accurate flow coefficient characteristics both in shape andin absolute level from the model test data. Any slight characteristic changebetween model and full scale hardware is to be reflected as a Root Sum Square (RSS) error in the overall gross thrust coefficient (CT) calculation. Calculating the overall gross thrust coefficient with the second method eliminatesthe above-mentioned potential errors but transfers the potential RSS error tothe repeatability of the test instrumentation since none of the hardwarechanges made influence the low pressure turbine effective area. Because ofthis, the second method can result in a more consistent gross thrust coefficient curve shape but contain the same amount of data scatter as in the firstmethod. In this test, the becond method did result in more Lonsistent curve shape characteristics as indicated in Figure 13.
It can be noted from Figure 13 that the data show an unexplained shiftin calculated fan nozzle flow coefficient. This indicates data inaccuraciesand, to some extent, appears to validate the 0.3% improvement in overall grossthrust coefficient. However, thrust at fan speed, thrust at engine pressureratio, and sfc at thrust show conclusive evidence of having demonstratedapproximately 0.3% improvement in gross thrust with the Short Core Nozzle.
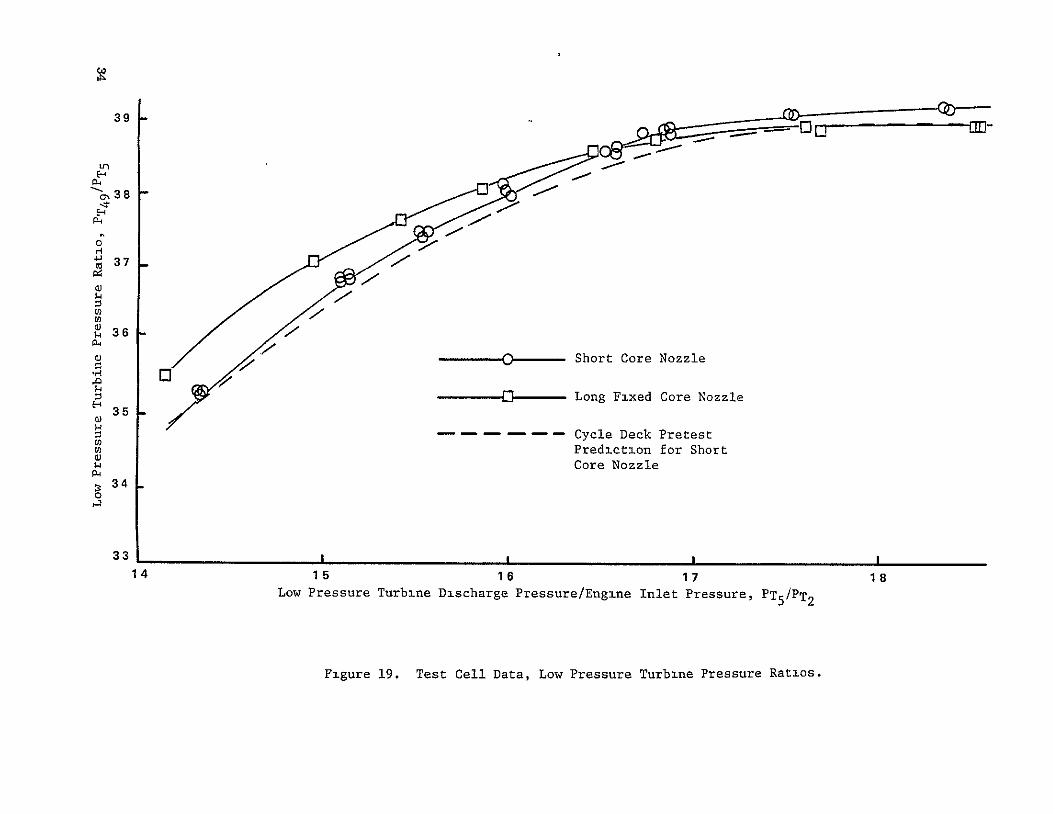
Figure 14 shows the low pressure turbine pressure ratio comparison between the Long Fixed and Short Core Nozzles. This figure indicates the relative effective core nozzle throat area for the two nozzles. Note the crossover point of the curve occurs at a low pressure turbine discharge to engine
26
007
oo00
0 9 short Core Motte
0 Lov V1zed Core Xz.
0 3
1
Is.ao-le pre**..-C Rtio PTln19
Figure 12. Test Cell Data, Overall Gross Thrust Coefficient, Core Flow Obtained Using Measured Areas and Flow Coefficients.
o97
- short No90le
o Short ore tle
0 11 12 13 1A 15 16 1 7
0 97 ran Nozzle pressure Pti OP rsF.
o 9 0, 0
F Mottle pressure Ctio o
Figure 13. Test Cell Data, Fan Nozzle Flow Coefficient andOverall Gross Thrust Coefficient, Core FlowObtained from Low Pressure Turbine Flow Function.
27
39
t4
"o) 38 Equal Effective Nozzle Areas
c 37
Ok 36
O Short Core Nozzle
E 3 5 C Long Fixea Core Nozzle
0)
to 34
0
14 15 16 17 18
Low Pressure Turbine Discharge Pressure/Engine Inlet Pressure, PT5/PT2
Figure 14. Test Cell Data - Low Pressure Turbine Pressure Ratio.
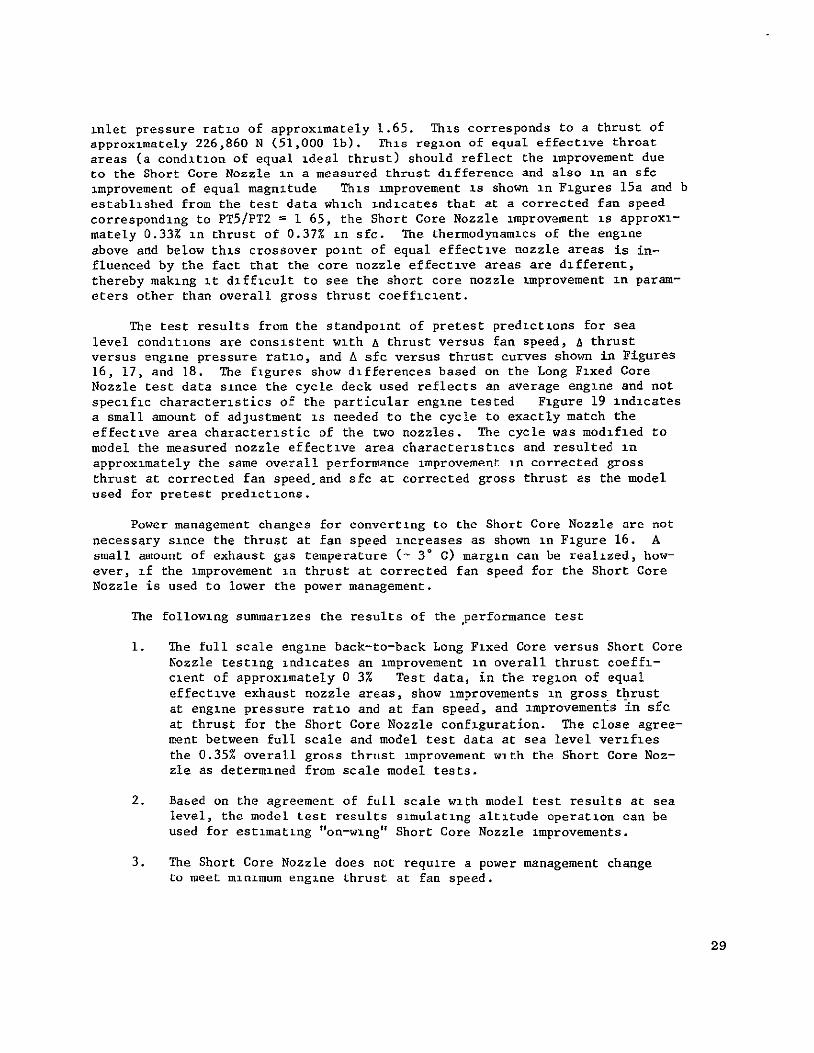
inlet pressure ratio of approximately 1.65. This corresponds to a thrust ofapproximately 226,860 N (51,000 Ib). This region of equal effective throatareas (a condition of equal ideal thrust) should reflect the improvement dueto the Short Core Nozzle in a measured thrust difference and also in an sfcimprovement of equal magnitude This improvement is shown in Figures 15a and bestablished from the test data which indicates that at a corrected fan speedcorresponding to PT5/PT2 = 1 65, the Short Core Nozzle improvement is approximately 0.33% in thrust of 0.37% in sfc. The thermodynamics of the engineabove and below this crossover point of equal effective nozzle areas is influenced by the fact that the core nozzle effective areas are different,thereby making it difficult to see the short core nozzle improvement in parameters other than overall gross thrust coefficient.
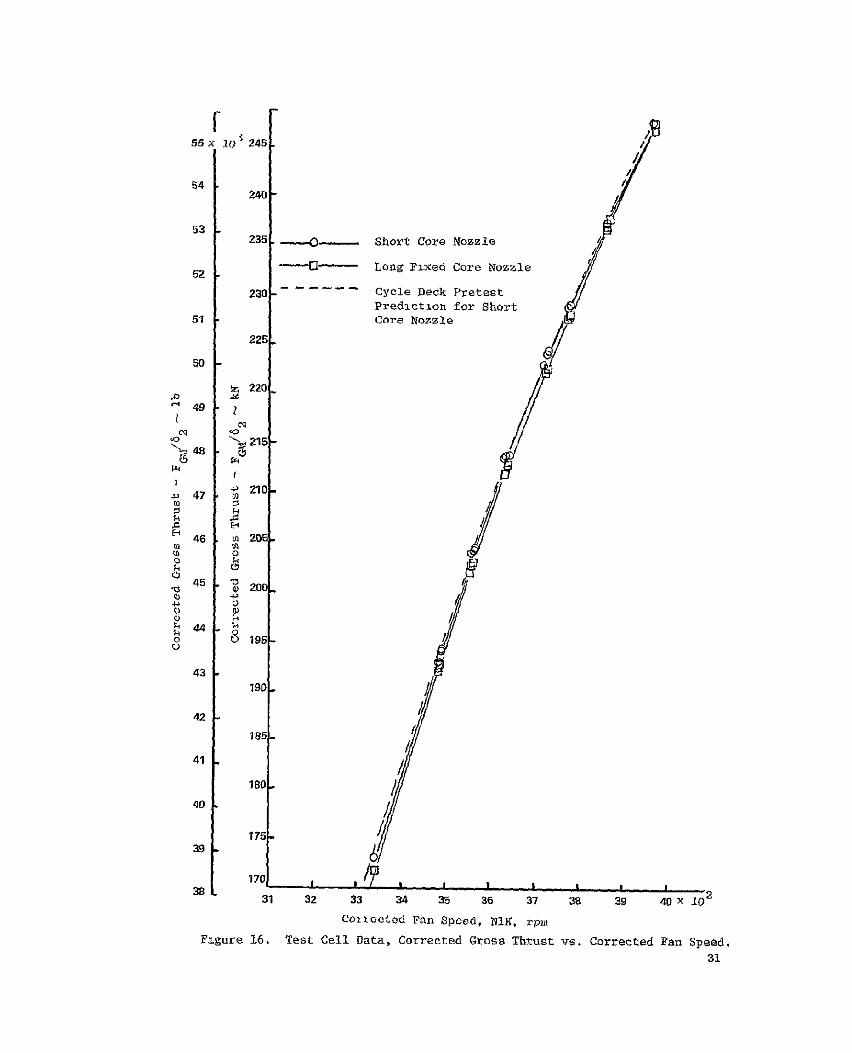
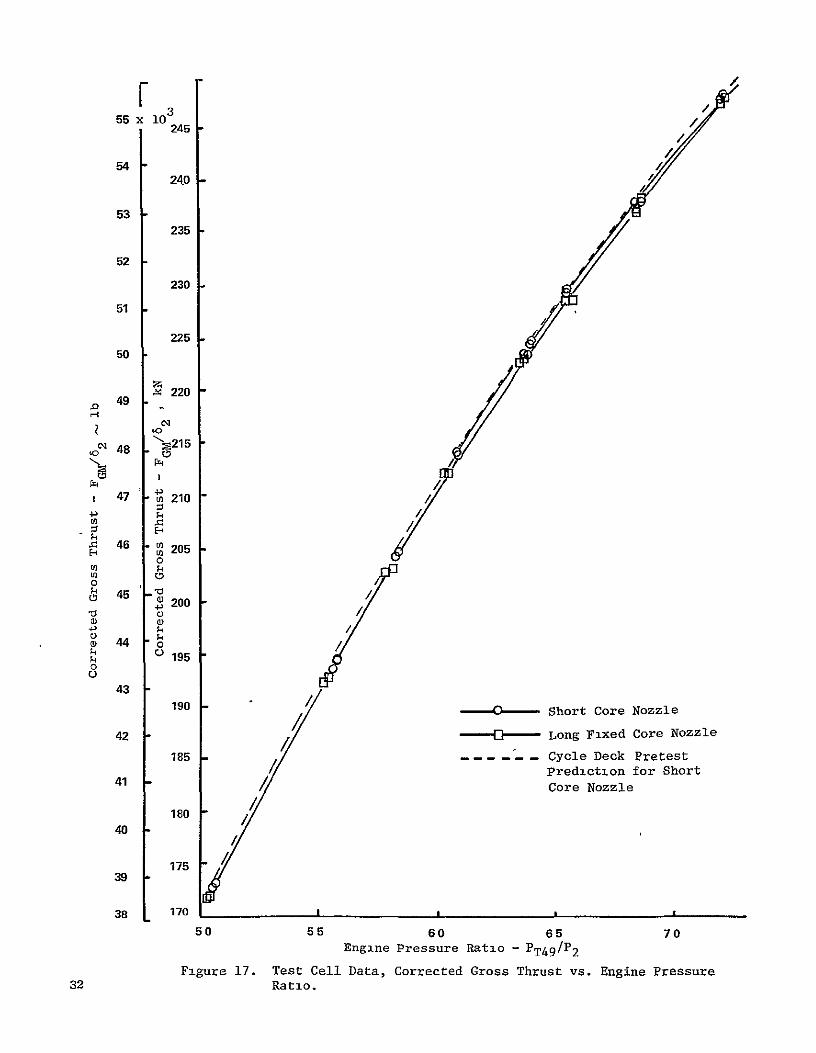
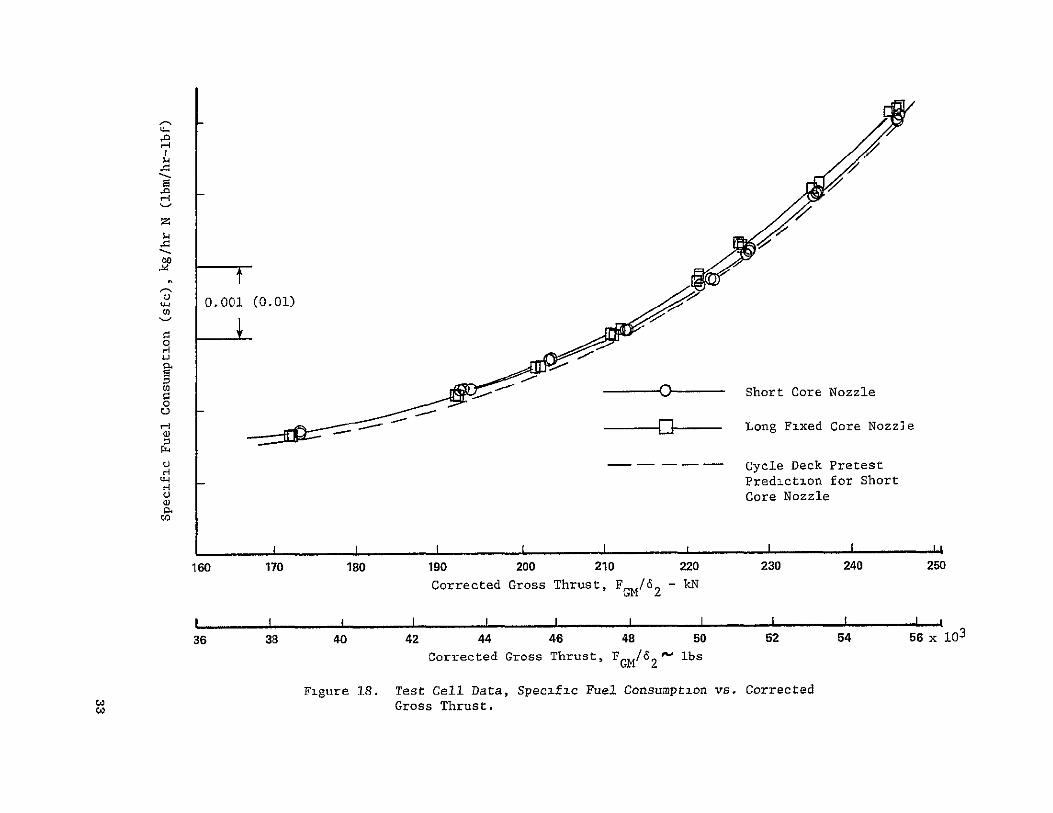
The test results from the standpoint of pretest predictions for sealevel conditions are consistent with A thrust versus fan speed, A thrustversus engine pressure ratio, and A sfe versus thrust curves shown in Figures16, 17, and 18. The figures show differences based on the Long Fixed CoreNozzle test data since the cycle deck used reflects an average engine and notspecific characteristics of the particular engine tested Figure 19 indicatesa small amount of adjustment is needed to the cycle to exactly match theeffective area characteristic of the two nozzles. The cycle was modified tomodel the measured nozzle effective area characteristics and resulted inapproximately the same overall performance improvement in corrected grossthrust at corrected fan speed and sfc at corrected gross thrust as the modelused for pretest predictions.
Power management changes for converting to the Short Core Nozzle are notnecessary since the thrust at fan speed increases as shown in Figure 16. Asmall amount of exhaust gas temperature (- 3 C) margin can be realized, however, if the improvement in thrust at corrected fan speed for the Short CoreNozzle is used to lower the power management.
The following summarizes the results of the performance test
1. The full scale engine back-to-back Long Fixed Core versus Short Core Nozzle testing indicates an improvement in overall thrust coefficient of approximately 0 3% Test data, in the region of equal effective exhaust nozzle areas, show improvements in gross thrust at engine pressure ratio and at fan speed, and improvements in sfe at thrust for the Short Core Nozzle configuration. The close agreement between full scale and model test data at sea level verifies the 0.35% overall gross thrust improvement with the Short Core Nozzle as determined from scale model tests.
2. Based on the agreement of full scale with model test results at sealevel, the model test results simulating altitude operation can beused for estimating "on-wing" Short Core Nozzle improvements.
3. The Short Core Nozzle does not require a power management changeto meet minimum engine thrust at fan speed.
29
03
K Equal Effective Nozzle Area
o4 '00 0. _ ..
0 Avg. % 'G&52 0.33
Q
02
215 220 225 230 235 240corrected Gro0s Thrust, FQG62 - RN
0 I I I I
49 50 51 52 53 x 10
Corrected Gross Thrust, F M62 - lb
Figure 15a. Test Cell Data, Thrust Improvement with
Short Core Nozzle.
05 -Equal Effective Nozzle Areas
U
00 -04 A sfc 0.37_0 Avg.
0 0
-02 215 220 225 230 235 240
Corrected Gross Thrust, FGM/62 kN
I I I I I I :
49 50 51 52 53 x 10
Corrected Gross Thrust, FGM/&2 lb
Figure 15b. Test Cell Data, SFC Improvement with Short
Core Nozzle.30
55X (i45
240
3235 -0- - Short Core Nozzle A
5Z ------ Long Fixed Core Nozzle
230
51
Cycle Deck Pretest Prediction for Short Core Nozzle
49
,o 215
48 / 7 210
7
46 220E
o45~20
-1951
43
1901
42
18541 /
40
39
170] I i/ 831 32 33 34 35 36 37 38 39 40 x 10 2
CotXOeted Pan Speed, NIK, rp,
Figure 16. Test Cell Data, Corrected Gross Thrust vs. Corrected Pan Speed.31
55 x 10345
54 240
53
52
51
50
235
230
225
a,.zso49 220
48 "215
U)
48 47.2050
o
a 44 43
42 0
3
190
185
145
" /
/Cycle
--0D---- Short Core Nozzle
--- O-]---- Long Fixed Core Nozzle
Deck Pretest Prediction for Short
180
38 170 50
I
55 Ip
60 Engine Pressure Ratio
65 - PTdo/
70
Figure 17. Test Cell Data, Corrected Gross Thrust vs. Engine Pressure 32c Ratio.
---
H/ 0,001 (0.01)
H ~Prediction o
0
E]
Short Core Nozzle
Long Fixed core Nozzie
Cycle Deck Pretest for Short
Core Nozzle
160 170 180 190 200 210 220 230 240 250
Corrected Gross Thrust, FGM/16 2 - N
36 38 40 42 44 46 48 50 52 54 56 x 103
Corrected Gross Thrust, FGM/S2 ibs
Figure 18. Test Cell Data, Specific Fuel Consumption vs. Corrected
Gross Thrust.
3 9 Ll
0
H 37
36
a) 0 Short Core Nozzle
Z 35
Long Fixed Core Nozzle
-.---.-.- Cycle Deck Pretest 0Prediction for Short
Core Nozzle
34
33 14 15 16 17 18
Low Pressure Turbine Discharge Pressure/Engine Inlet Pressure, PT5/PT2
Figure 19. Test Cell Data, Low Pressure Turbine Pressure Ratios.
6.0 ACOUSTIC TEST
6.1 TEST CONFIGURATIONS
A series of static back-to-back noise tests was conducted on a CF6-50engine with the Short Core Nozzle and the Core Reverser Nozzle.
The production CF6-50 engine was fitted with a reference acoustic inletand bellmouth lip and production fan and core exhaust duct acoustic treatment. A description of the acoustic treatment is shown in Table I below:
Table I. Acoustic Treatment.
Location Treatment Type Treatment Area
2Fan Inlet Single Degree of Freedom (SDOF) 5.57 m (60 ft2 )
2Fan Casing Multiple Degree of Freedom (MDOF) 5.85 m (63 ft2 )
2Fan Exhaust Duct Single Degree of Freedom (SDOF) 4.65 m (50 ft2 )
2Multiple Degree of Freedom (MDOF) 4.37 m (47 ft2 )
Short Core Nozzle "Tophat" (SDOF) 2.32 m2 (25 ft2 )
2Core Reverser Nozzle "Tophat" (SDOF) 1.95 m (21 ft2 )
The engine was configured with the advanced fan blades and a smooth microballoon shroud with a fan tip clearance of 1.9 mm (0.075 in.).
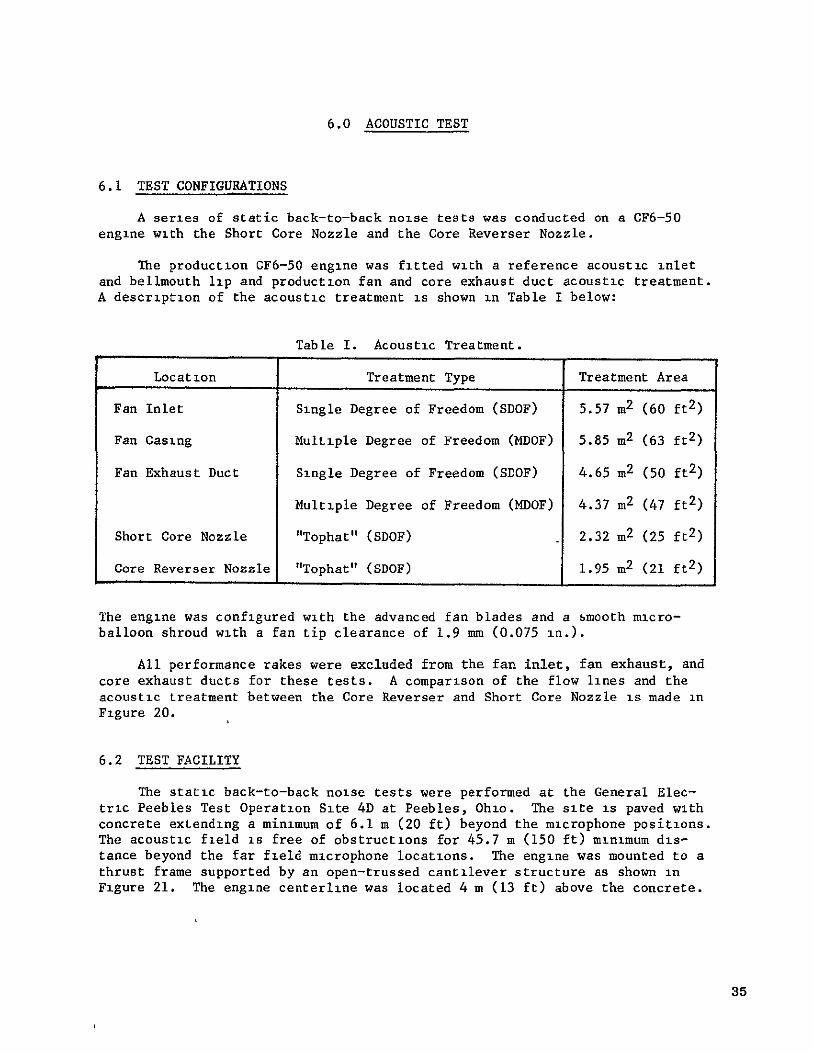
All performance rakes were excluded from the fan inlet, fan exhaust, andcore exhaust ducts for these tests. A comparison of the flow lines and theacoustic treatment between the Core Reverser and Short Core Nozzle is made inFigure 20.
6.2 TEST FACILITY
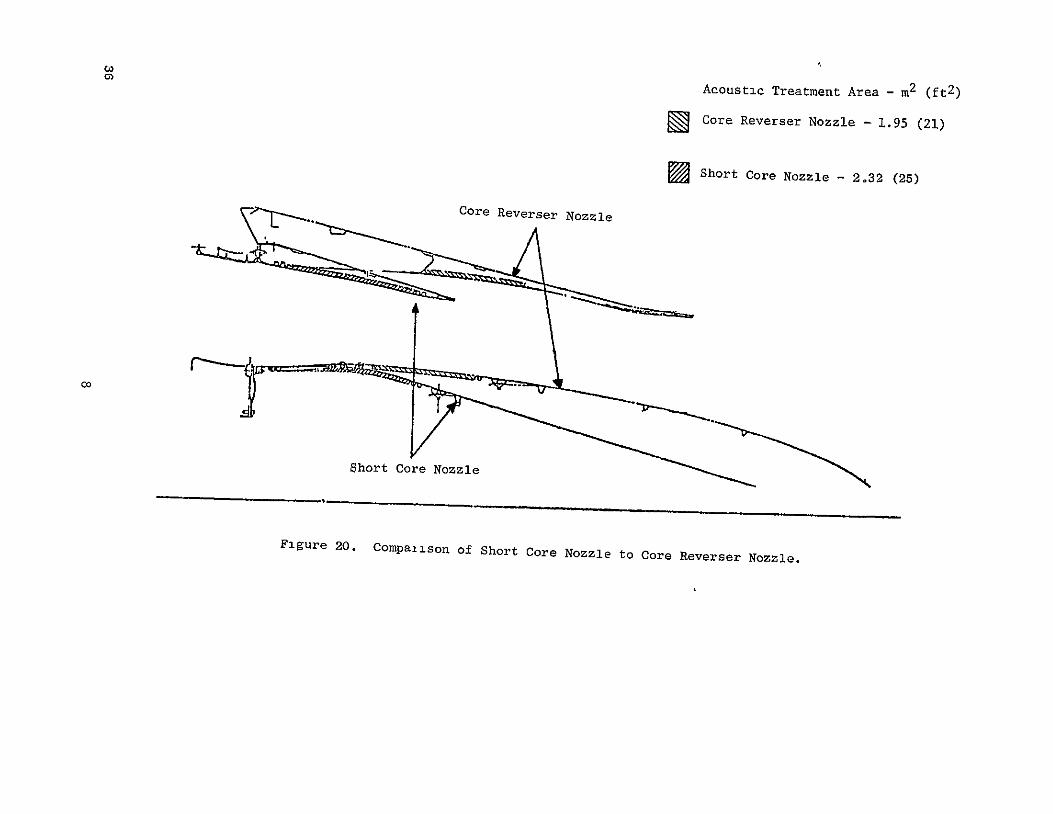
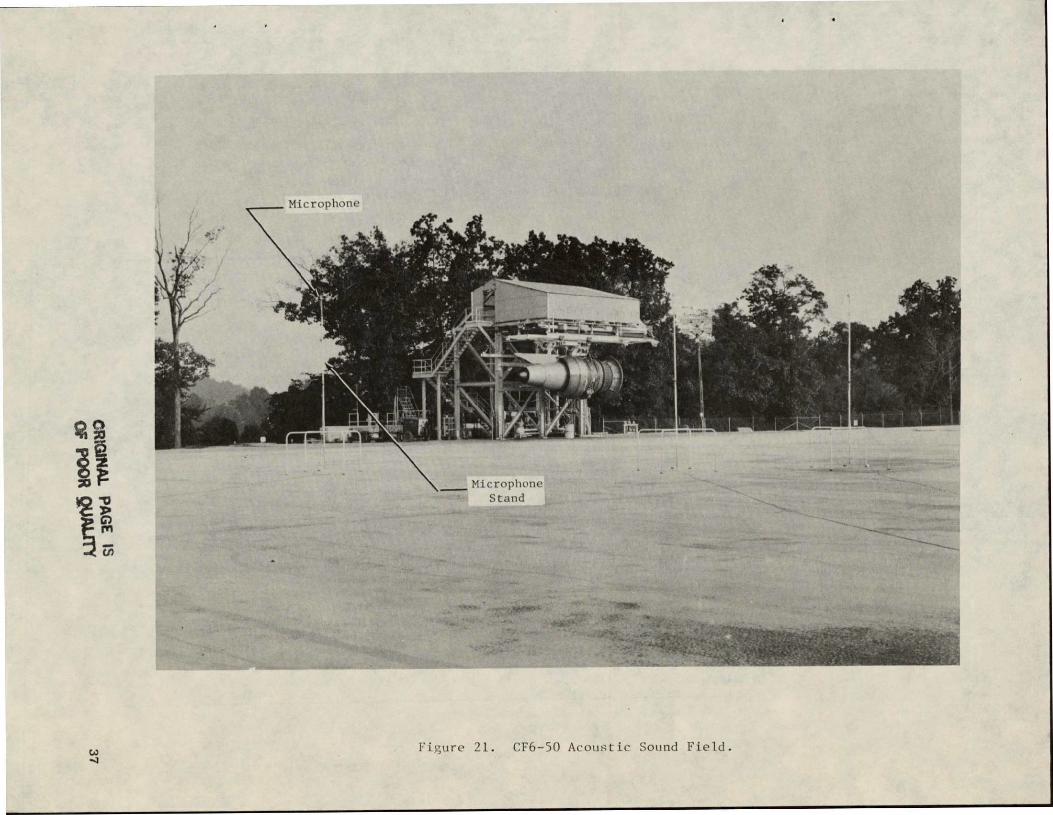
The static back-to-back noise tests were performed at the General Electric Peebles Test Operation Site 4D at Peebles, Ohio. The site is paved withconcrete extending a minimum of 6.1 m (20 ft) beyond the microphone positions.The acoustic field is free of obstructions for 45.7 m (150 ft) minimum distance beyond the far field microphone locations. The engine was mounted to athrust frame supported by an open-trussed cantilever structure as shown inFigure 21. The engine centerline was located 4 m (13 ft) above the concrete.
35
2Acoustic Treatment Area - m (ft2)
Core Reverser Nozzle - 1.95 (21)
Short Core Nozzle - 2,32 (25)
Core Reverser Nozzle
Short Core Nozzle
Figure 20. Compaaison of Short Core Nozzle to Core Reverser Nozzle.
iliiiiiii
F'igure 21. CF6-50 Acoustic Sound Field.
U,0
20
Portable Microphone Locations
at Engine Cj Height of 4 m (13 ft) 30-IL150 45.7 m (150 ft) 4 )r
TO CONTROL51.8 m+ 0
140 ROOM(170 ft)
+130++12 PORTABLE.125
1 5 ENVIRONMENTAL5 DATA WEATHER
CONCRETE TEST PAD 100 80
Figure 22. CF6-50 Sound Field Layout.
The microphone cartridge was replaced and, prior to each test, a 124 dB
pistonphone, traceable to the National Bureau of Standards, was applied to
each microphone. The microphone sensitivity was compared to the most recent
laboratory calibration data to assure compliance within ±1.5 dB; any sys
tem falling outside this band was replaced. The microphone outputs were then
normalized Using variable attenuators in order to record the same voltage lev
el with the pistonphone source input. At the conclusion of each test, the
pistonphone was feapplied and the voltage level was recorded as a verification
of microphone system integrity.
On several occasions throughout the test series, 2-minute recordings of
ambient noise were made with "facility on" and "facility off". These record
ings were made at gain settings used during the sound measurements to assure
acceptable signal-to-noise ratios for the acoustic data.
Turbine Sound Separation Probe
A water-cooled sound separation probe was used to record dynamic pres
sure fluctuations at the core exhaust nozzle. Two Kulite pressure transducers
spaced 12.7 cm (5.0 in.) apart in a line parallel to the engine axis were
flush-mounted on a 0.95 cm (0.375 in.) diameter tube. Water flowed through
the tube, cooling the transducers, thereby greatly extending the temperature
operating range. A laboratory calibration of the transducers to determine
pressure response was performed prior to probe assembly.
The probe tip containing two transducers was positioned 90 degrees to
the probe stem which was installed in an actuator to permit a radial traverse.The downstream transducer was positioned inside the core nozzle 1.27 cm (0.5
in.) from the exit plane. A box beam support attached to the concrete pad
held the probe stem horizontal to the ground at the 9 o'clock engine posi
tion, aft looking forward. A shield was positioned around the actuator in
order to reduce buffeting due to the fan exhaust flow.
The probe aft transducer was immersed to four positions when testing the
Short Core Nozzle (2.0, 6.4, 10.8 and 16.0 cm relative to the outer wall).
Data were recorded at 76.2 cm/sec (30 ips) for 1 minute at each immersion.
A 2-minute stabilization time was allowed between engine speed changes. The
data were recorded at average corrected fan speeds of 2207, 2400, 2598 and
2841 rpm. Prior to and following the test, a 3.45 N/cm 2 (5 psi) static
pressure was applied to the rear face of each Kulite diaphragm to verify probe
calibration
Atmospheric Test Condition Instrumentation
Barometric pressure was recorded for each test point. Wind speed, direc
tion, air temperature and dew point were all measured using a Portable Envi
ronmental Data Station (PEDS). Two of these stations were located approxi
mately 45 degrees from the inlet on a 51.2 m (168 ft) arc (Figure 22). The
sensors were positioned at a 4 m (13 ft) height. Wind speed and direction
measured on one of the PEDS were recorded continuously on strip charts. The
second PEDS incorporated wind speed and V cosO wind.direction instrumentation.
40
These signals were also recorded continuously on strip charts. Ambient temperature and dew point temperature were measured by aspirator resistance temperature devices. The dew point measurement was made with a hygrometer whichsampled air from the 4 m (13 ft) location. These measurements were all recorded on the DMS computer system.
6.4 TEST PROCEDURE
Atmospheric Test Condition Limits
Atmospheric condition limits were set prior to the test. Any data recorded outside these limits (listed below) were discarded:
Relative humidity 20% < RH < 95%
Temperature 2640 K (-90 C) < T < 3050 K (320 C)
Headwind <4.1 m/sec (including gusts)
Crosswind <2.6 m/sec (including gusts)
Tailwind 0 m/sec (including gusts)
Gusts <1.5 m/sec
Engine Test Conditions
The two engine configurations were run to obtain data for comparisons atthe same corrected thrust over a range of conditions that encompass the approach, cutback, and takeoff power ranges for aircraft powered by the CF6-50engine. The nominal test conditions consisted of 19 fan speeds covering therange of 2090 to 3905 rpm equivalent to the thrust range of 53,632 to 234,421 N(12,057 to 52,700 Ib).
For each configuration, the 19 test conditions were repeated twice in thesame order for a total of three readings at each power setting. A shutdown ofat least 30 minutes occurred between each test series. At each power setting, the engine was stabilized for at least 2 minutes prior to recording acousticdata.
The engine performance data were corrected to standard sea level pressure,zero humidity, zero wind day using the measured atmospheric data for ambienttemperature and pressure, absolute humidity, wind velocity, and wind direction.
Acoustic Data Recording
Acoustic data were recorded on magnetic tape using a 28-channel FM taperecorder system operated in the interrange instrumentation group (IRIG) wide
41
band Group I mode at a tape speed of 76.2 cm/sec (30 ips). The recorder wasset up for 40% carrier -deviation CU 40%) at full scale record level. Signalamplification was provided by a a.c/d.c preamp module. During testing, thetape recorder input and output were monitored to assure that adequate amplification was used and to assure proper operation of the recorder. Data wererecorded for at least 2 minutes at each speed point.
Acoustic Data Reduction
Off-line data reduction was performed using an automated 1/3 octave reduction system. The recorded data were played back on a 28-track system operating in the IRIG wide band Group 1 mode.
In the automatic operating mode, control of the system was provided bymeans of a minicomputer and operator-provided information. The data to besampled were located by means of a time code reader, indexing from the timecode signal recorded on the data tape. This tape-shuttling was continued foreach data channel with sampling performed over the same time increment untilall channels of a particular reading were processed. The system then advancedto the next data point, based on the operator-supplied time reference, and repeated the shuttling process. After the processing information (includingreading identification, reading time, gain changes, etc.) was set up by theoperator, the system ran without further operator assistance until a magnetictape change was required.
All 1/3 octave analyses were performed using a 1/3 octave analyzer. Thefrequency range of the data reduction process was 50 Hz through 10 kHz. Anormal integration time of 32 seconds was used to provide adequate samplingof the low frequency portion of the data signal. The data sampling for thespectrum analysis was done within the 52-second time interval for which theaverage,performance and ambient weather conditions were determined.
Each data channel output was passed through an interface to the mini1computer where data were corrected for both the frequency response of theacquisition and reduction system (as determined from the pink noise calibratLon) and for the microphone head response. The minicomputer was interfacedto a main frame computer to generate a file containing the 1/3 octave banddata for further processing. The 1/3 octave band data were also punched onpaper tape as a backup for the communication interface system.
The noise data at each test point were processed using a digital computerprogram to normalize the data to a 298 K (770 F)/70% relative humidity stan
dard day using the atmospheric data (ambient pressure and temperature andrelative humidity) and perform data extrapolations to various sideline distances. Overall sound pressure level (SPL), perceived noise level (PL)andtone corrected perceived noise level (PNLT) were computed for each angle atthe sideline distances. The sound power level for each 1/3 octave band and
-overall sound power level was computed for each test point. These resultswere used for subsequent analysis and data comparisons.
42
6.5 TEST RESULTS
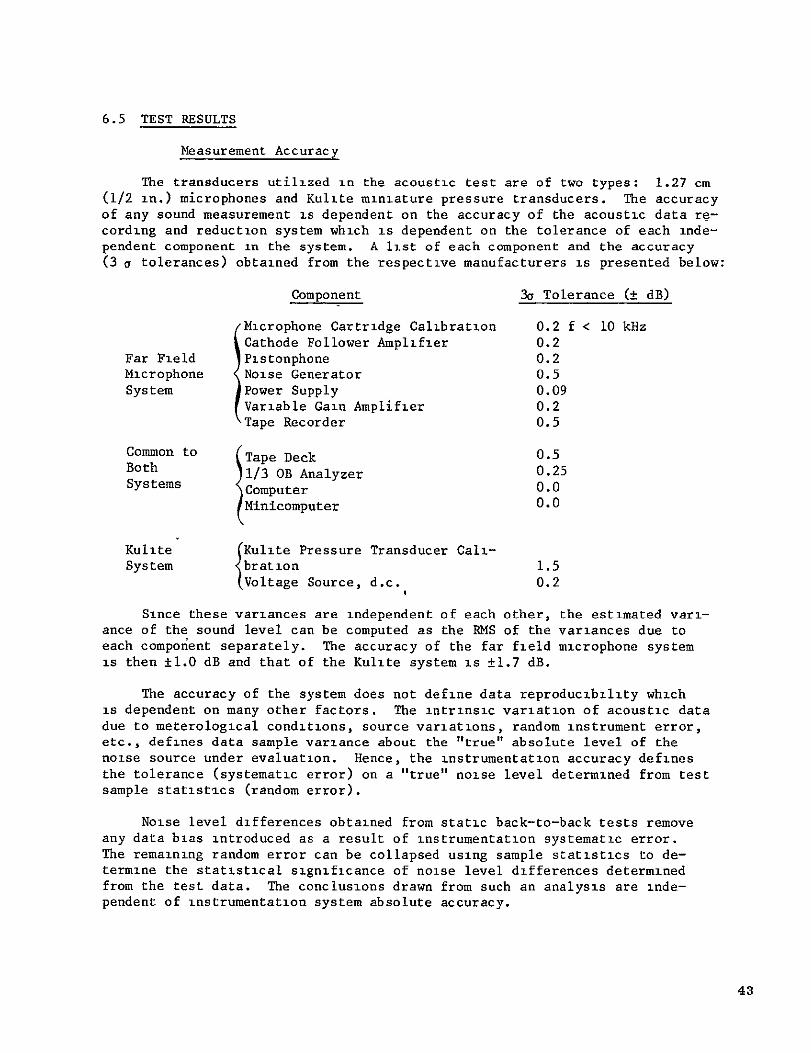
Measurement Accuracy
The transducers utilized in the acoustic test are of two types: 1.27 cm(1/2 in.) microphones and Kulite miniature pressure transducers. The accuracyof any sound measurement is dependent on the accuracy of the acoustic data recording and reduction system which is dependent on the tolerance of each independent component in the system. A list of each component and the accuracy(3 a tolerances) obtained from the respective manufacturers is presented below:
Component 3o Tolerance (± dB)
(Microphone Cartridge Calibration 0.2 f < 10 kHz
Cathode Follower Amplifier 0.2Far Field Pistonphone 0.2Microphone Noise Generator 0.5System Power Supply 0.09
Variable Gain Amplifier 0.2Tape Recorder 0.5
Common to (Tape Deck 0.5Both 31/3 OB Analyzer 0.25Systems Computer 0.0
Minicomputer 0.0
Kulite (Kulite Pressure Transducer Cali-System jbration 1.5
Voltage Source, d.c. 0.2
Since these variances are independent of each other, the estLmated variance of the sound level can be computed as the RMS of the variances due toeach component separately. The accuracy of the far field microphone systemis then ±1.0 dB and that of the Kulite system is ±1.7 dB.
The accuracy of the system does not define data reproducibility whichis dependent on many other factors. The intrinsic variation of acoustic datadue to meterological conditions, source variations, random instrument error,etc., defines data sample variance about the "true" absolute level of thenoise source under evaluation. Hence, the instrumentation accuracy definesthe tolerance (systematic error) on a "true" noise level determined from testsample statistics (random error).
Noise level differences obtained from static back-to-back tests removeany data bias introduced as a result of instrumentation systematic error.The remaining random error can be collapsed using sample statistics to determine the statistical significance of noise level differences determinedfrom the test data. The conclusions drawn from such an analysis are independent of instrumentation system absolute accuracy.
43
Prior to the test, it was postulated that the change from the Core Rever
ser Nozzle to the Short Core Nozzle could modify engine noise through the
following principal mechanisms- change in the thermodynamic cycle, change in
suppression of low pressure turbine (LPT) noise, and change in jet noise.
Results from the subject back-to-back static testing and daLa analysis to
evaluate small differences between the engine configurations are discussed
herein.
Cycle Effect on Noise
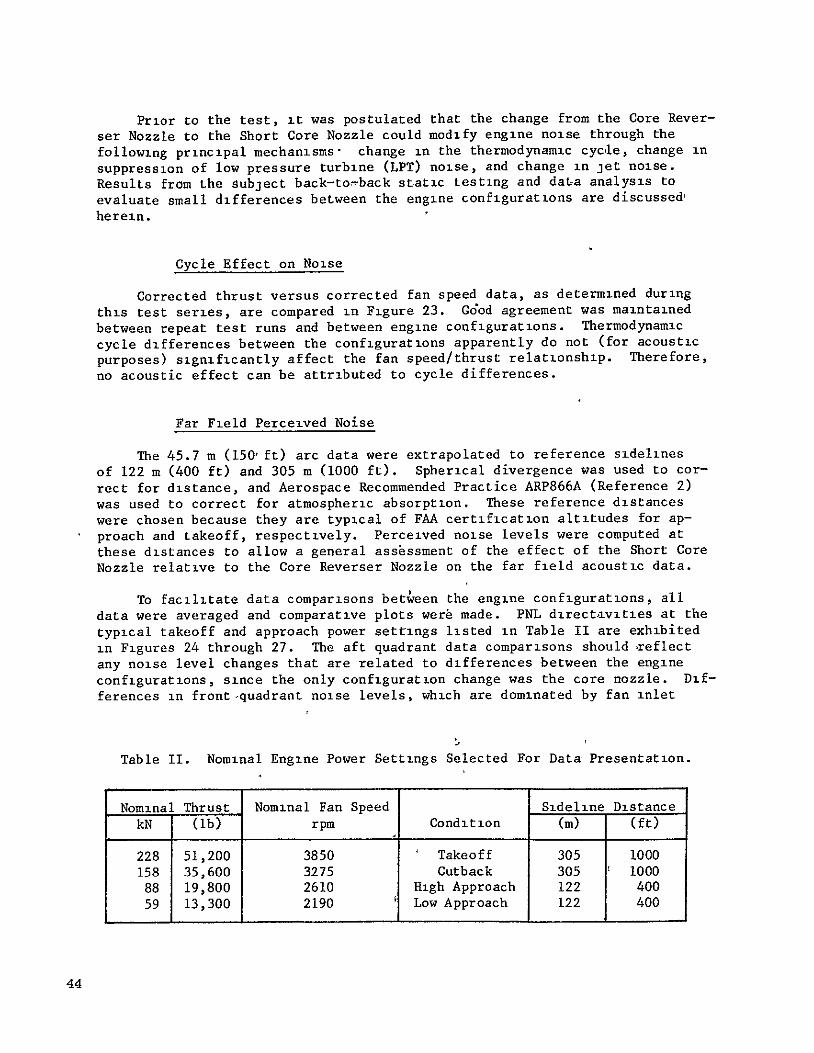
Corrected thrust versus corrected fan speed data, as determined during
this test series, are compared in Figure 23. God agreement was maintained
between repeat test runs and between engine configurations. Thermodynamic
cycle differences between the configurations apparently do not (for acoustic
purposes) significantly affect the fan speed/thrust relationship. Therefore,
no acoustic effect can be attributed to cycle differences.
Far Field Perceived Noise
The 45.7 m (150' ft) arc data were extrapolated to reference sidelines
of 122 m (400 ft) and 305 m (1000 ft). Spherical divergence was used to cor
rect for distance, and Aerospace Recommended Practice ARP866A (Reference 2)
was used to correct for atmospheric absorption. These reference distances
were chosen because they are typical of FAA certification altitudes for ap
proach and takeoff, respectively. Perceived noise levels were computed at
these distances to allow a general assessment of the effect of the Short Core
Nozzle relative to the Core Reverser Nozzle on the far field acoustic data.
To facilitate data comparisons between the engine configurations, all
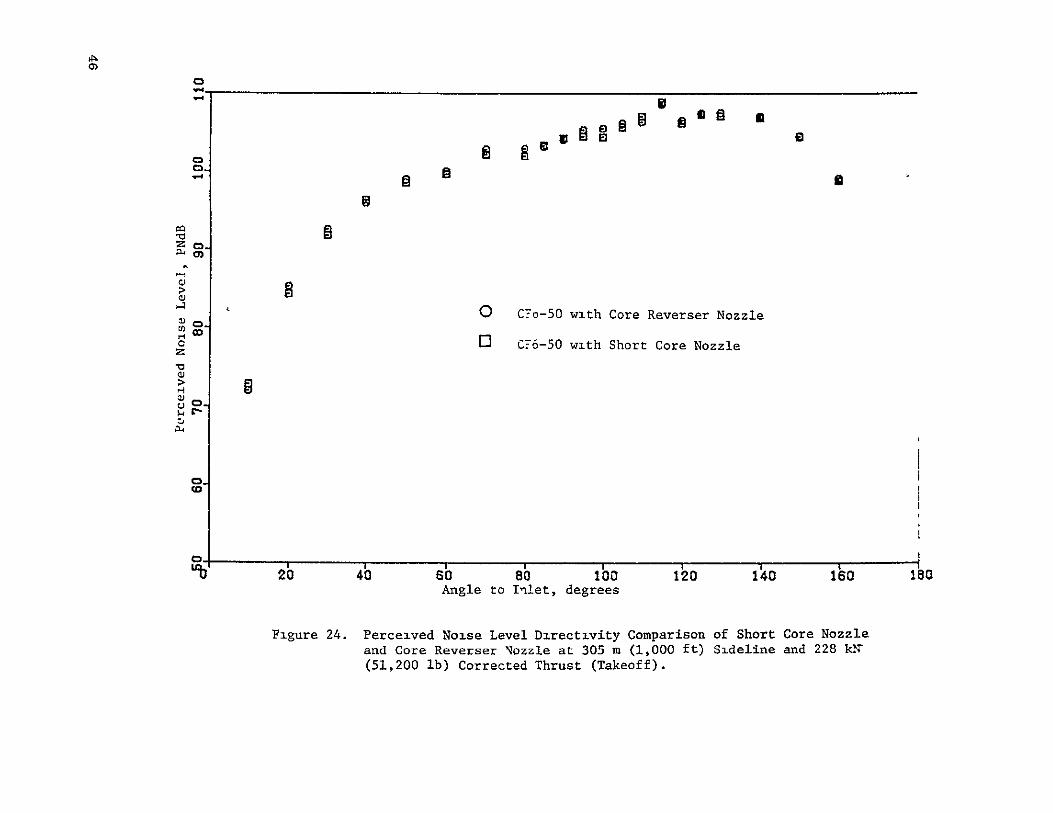
data were averaged and comparative plots wer6 made. PNL directavities at the
typical takeoff and approach power settings listed in Table II are exhibited
in Figures 24 through 27. The aft quadrant data comparisons should reflect
any noise level changes that are related to differences between the engine
configurations, since the only configuration change was the core nozzle. Dif
ferences in front-quadrant noise levels, which are dominated by fan inlet
Table II. Nominal Engine Power Settings Selected For Data Presentation.
Nominal Thrust Nominal Fan Speed Sideline Distance
kN (lb) rpm Condition m) (ft)
228 51,200 3850 Takeoff 305 1000
158 35,600 3275 Cutback 305 1000
88 19,800 2610 High Approach 122 400
59 13,300 2190 Low Approach 122 400
44
55 x 103
240
50 220
45 52200-*
C11
N
Z'40- 9)80
4j
43 =160 -
C 0140 o 30 -bU
0 CF6-50 with Core
Reverser Nozzle'
SCF6-50 with Short Core Nozzle
AM
j$4
25 o!
U0100
20
80
15.6
60
10 2200 2400 2600
I
2800 I I
3000 3200 3400
Corrected Fan Speed, NIK
3600
rpm
3800 4000 4200
Figure 23. Corrected Thrust/Corrected Fan Speed Relationship. C"i
C
o3-
Z ~
§ 3
Figure~~~ ~ C24-. wecieosLvlDrciit Coepevrser ozzlet oeozland~ ~ ~ Core Reverser NozzleCo50wta 0 I00f)Sdln n 2
and~Co-rO ~ withShorsCorNozzleat35m(,0f)Sienend28Y51,2006-5 with ShortteCorus Nozzlfe)(5,0zb orce hut(aef)
r4l
0E
M-0
cZ
C
8S
0
C3
CF6-50 with Core Reverser Nozzle
CF6-50 with Short Core Nozzle
"b 20
Figure 25.
40 60 Sb IbO 10 140 ISO' Angle to Inlet, degrees
Perceived Noise Level Directivity Comparison of Short Core Nozzle
and Core Reverser Nozzle at 305 m (1,000 ft) Sideline and 158 kN
(35,600 lb) Corrected Thrust (Cutback).
lbo
14
M
C
- 00
OI
z
0-
O
El
CF6-50 with Core Reverser Nozzle
CF6-50 wth Short Core Nozzle
20 40 60 sbo too 120 Angle to Inlet, degrees
140 16 IO
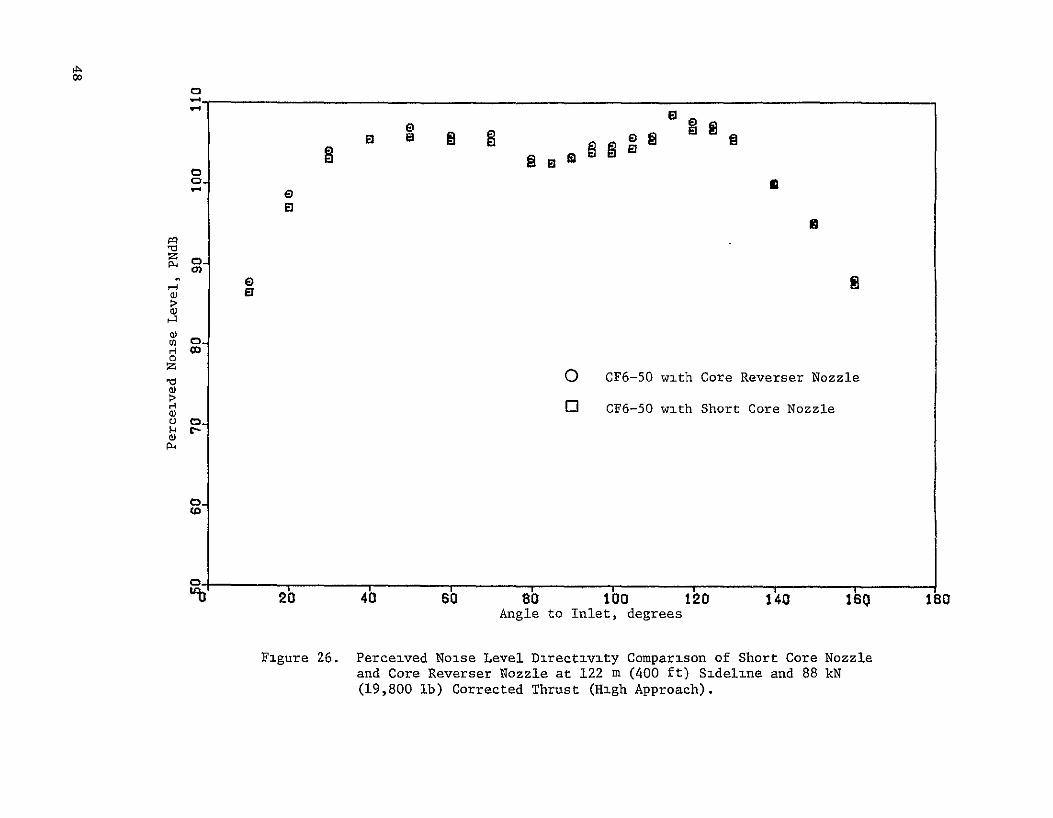
Figure 26. Perceived Noise Level Directivity Comparison of Short Core Nozzle and Core Reverser Nozzle at 122 m (400 ft) Sideline and 88 kN(19,800 lb) Corrected Thrust (High Approach).
C e El
08
-
' r CF6-50 wth Short Core Nozzle
20
Figure 27
40 60 so IOU 20 140 160 Angle to Inlet, degrees
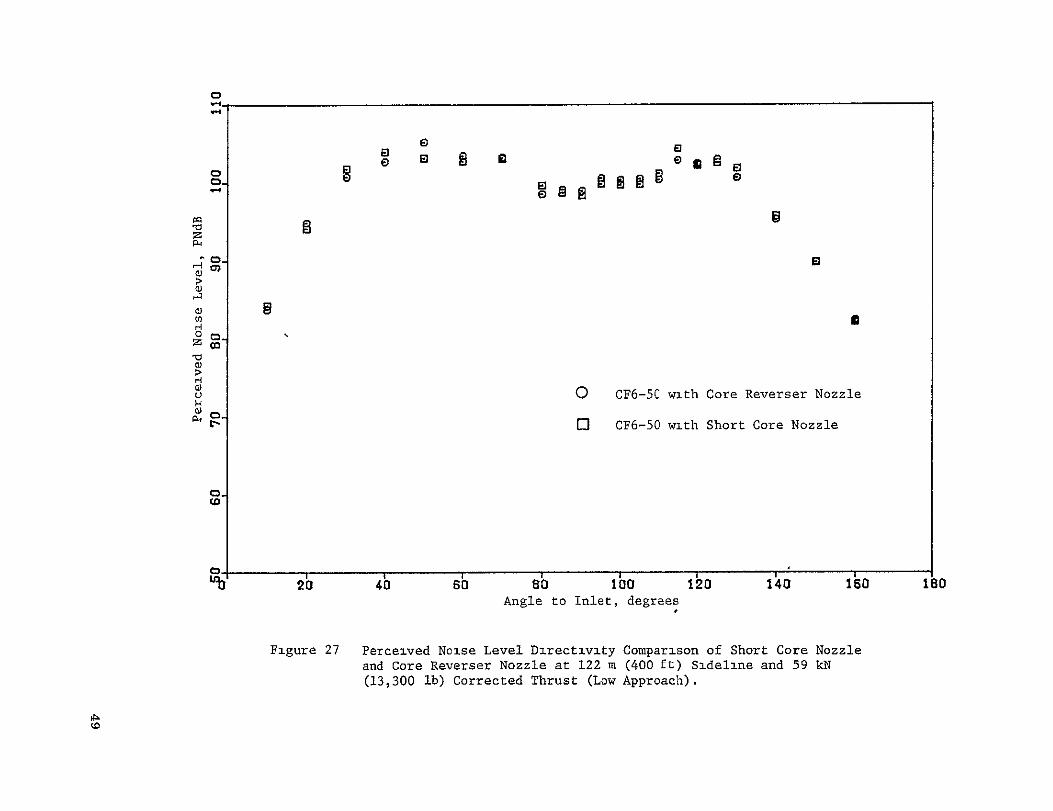
Perceived Noise Level Directivity Comparison of Short Core Nozzle and Core Reverser Nozzle at 122 m (400 Et) Sideline and 59 kN (13,300 lb) Corrected Thrust (Low Approach).
ISo
noise, are assumed to have been influenced by changes in meterological conditions, possibly atmospheric turbulence, even though all tests were run withinstringent wind limits. The PNL directivity behavior at the 305 m sidelinedistance for takeoff power settings is similar between the two configuraLons.This result implies that the Short Core Nozzle does not significantly affectjet noise sound levels nor directivity patterns.
PNL directivity behavior at the 122 m sideline distance at approach powersettings represents a superposition of the three primary noise components ofthe engine: jet noise, fan and low pressure turbine (LPT) noise. Of thesesources, the Short Core Nozzle should influence only the noise signatures ofthe LPT and the core jet. Differences in the fan noise characteristics between the two configurations should be independent of the core nozzle sincethe engine thermodynamic cycles are essentially identical. The small differences in the aft quadrant that occur between the configurations for approachpower settings at the 122 m sideline distance (Figures 26 and 27) may be dueto a difference in LPT noise levels. The apparent differences observed hereare discussed further under component noise analysis.
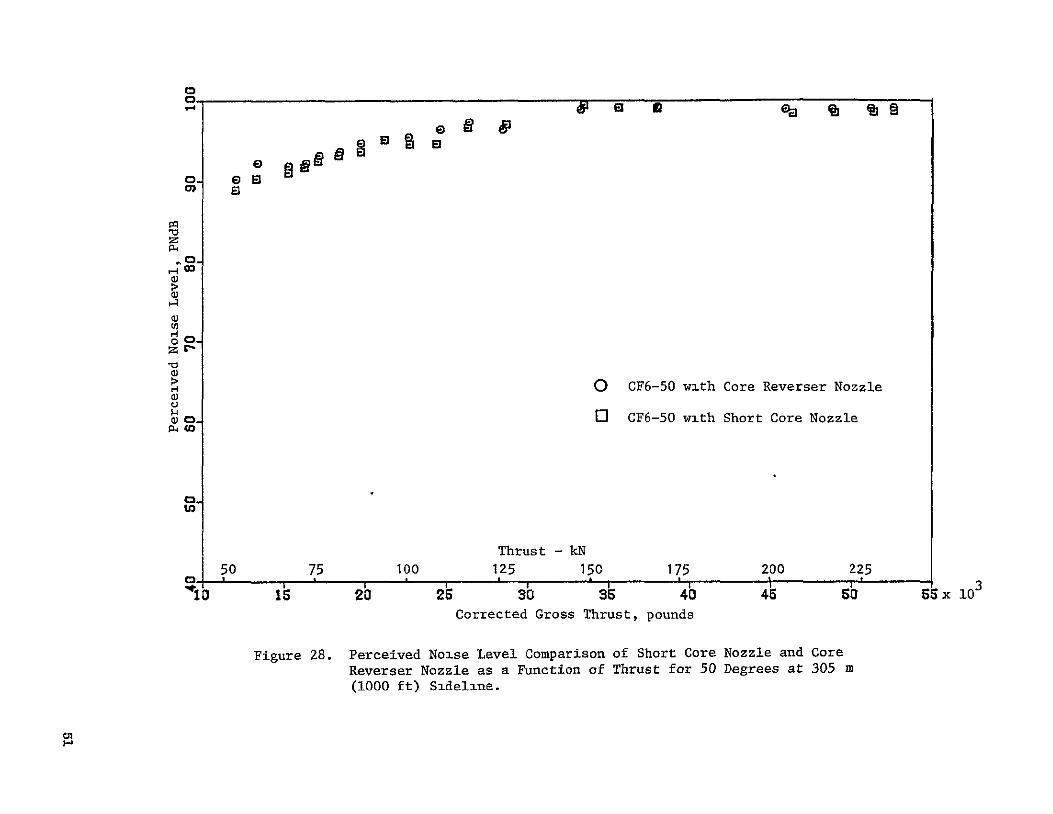
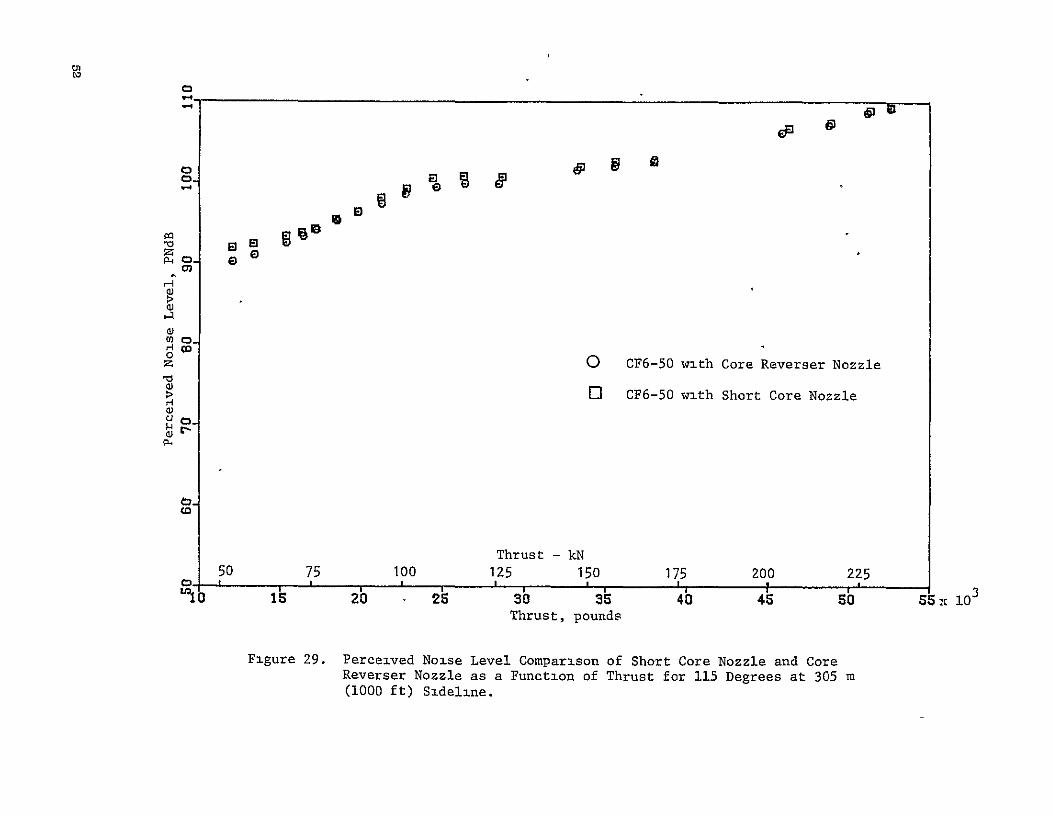
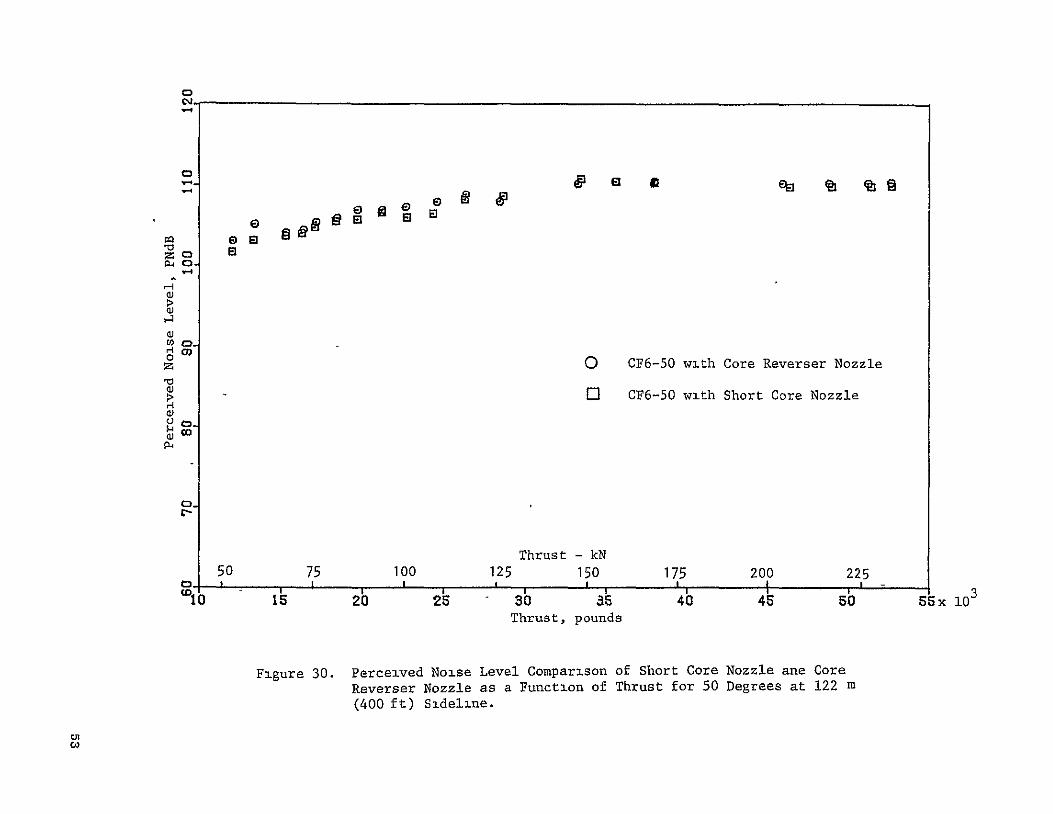
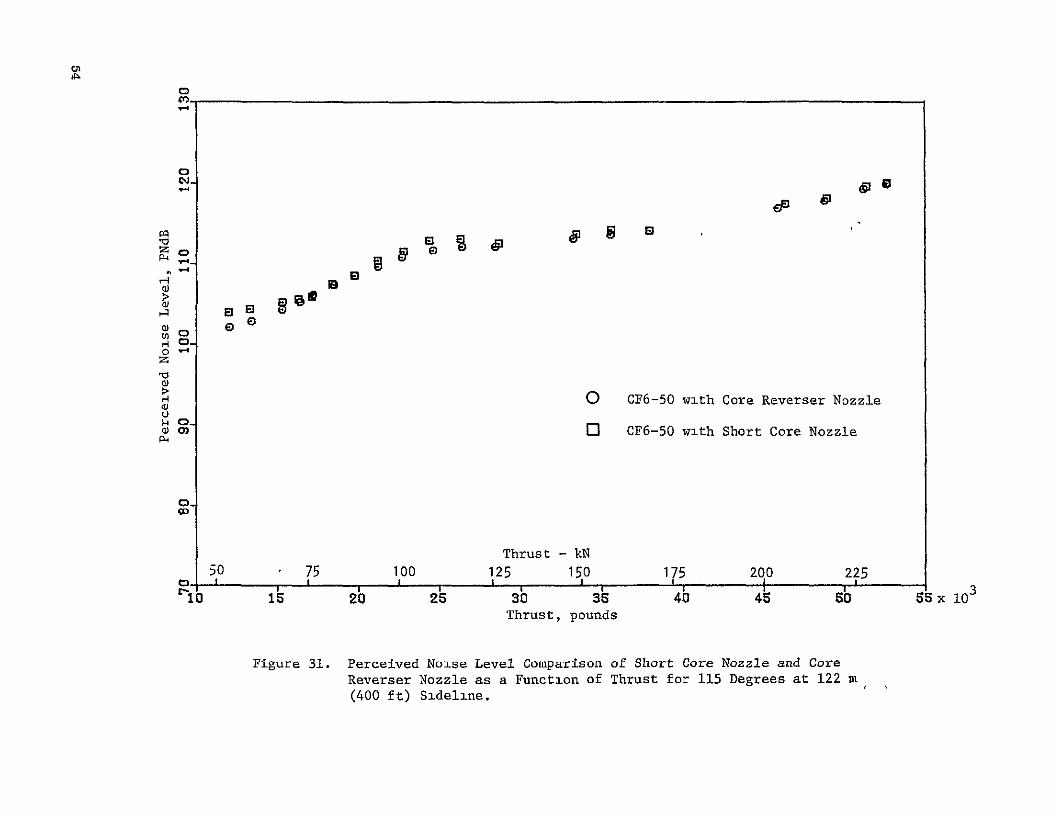
PNL data at typical peak forward and peak aft angles determined from thedirectivity plots are shown versus thrust in Figures 28 through 31 for 50 and 115 degrees at both the 305 and 122 m sideline distances. No significanttrends are discernible for the front quadrant angle. The PNL versus thrustdata for the Short Core Nozzle at 115 degrees diverges from the Core ReverserNozzle data at low power settings but is similar to the Core Reverser Nozzledata at high power settings. This behavior is the only difference that canbe attributed to the Short Core Nozzle when the engine configuration data arecompared on a PNL basis. It is possible that the LPT directivity pattern hasbeen influenced by the Short Core Nozzle producing the observed behavior. However, this result could only affect aircraft flyover noise at the very low
power approach conditions.
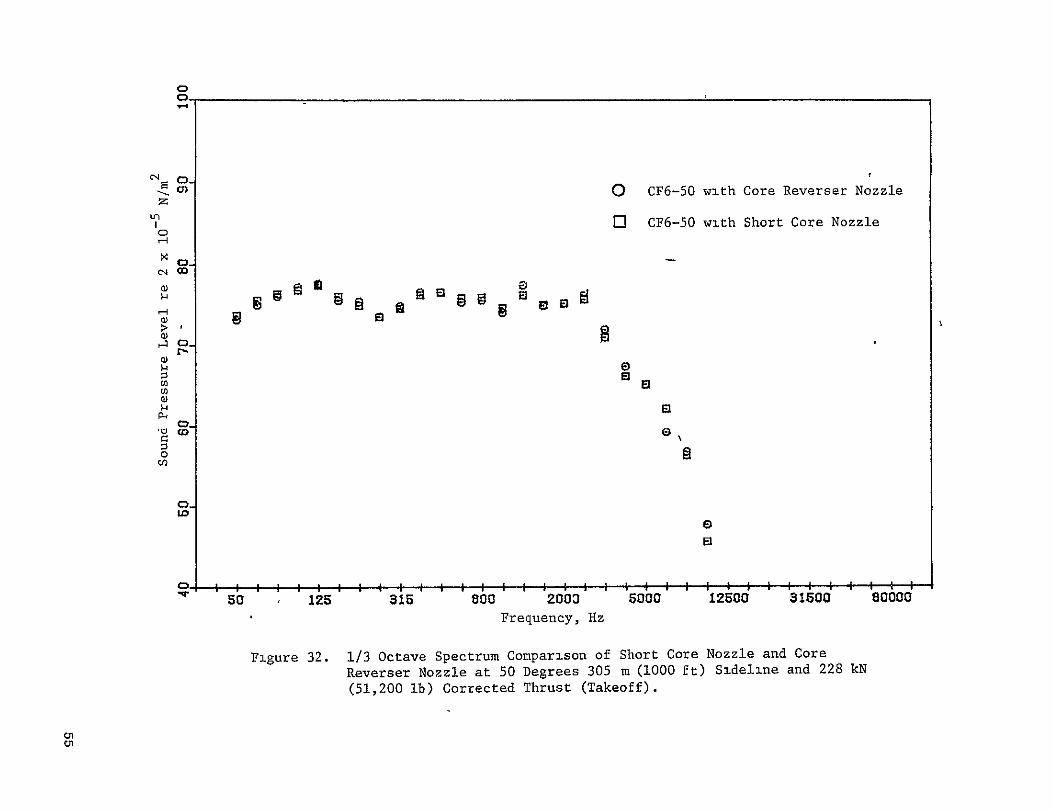
Far Field Noise Spectra
Averaged 1/3 octave spectra at angles of peak PNL (50 and 150 degrees)for the power settings listed in Table II are presented at the 305 and 122 msideline distances in Figures 32 through 39. Noise signature component differences are discussed in a later section while salient features common toeach are discussed below.
The post distinct feature common to all the noise spectra is the "null"that falls between the 160 to 315 Hz 1/3 octave bands. This is an interference phenomenon produced by the sound field. The minimum level associatedwith the "null" occurs in the frequency band where the path length differencebetween the direct path from the source to the microphone and the reflectedpath from the concrete surface of the pad is one-half wave length. For the45.7 m arc microphones at 4 11 centerline height, the minimum level occursat approximately 250 Hz. Reinforcement of the engine noise occurs when thepath length difference is one wave length with the maximum level occurringat approximately 500 Hz. Higher order mimina and maxima effects are washed
50
z
a)
Zr
>
.
O
[]
CF6-50 with Core Reverser Nozzle
CF6-50 with Short Core Nozzle
-I
50 I I
1is2a
Figure 28.
Thrust -kN F75 wit125 15R 175 20 Nzz5
I I . Ii' I,
2 so 35 4 45 50'
Corrected Gross Thrust, pounds
Perceived Noise Level Comparison of Short Core Nozzle and Core Reverser Nozzle as a Function of Thrust for 50 Degrees at 305 m
(5000 ft) Sideline.
0 3
55 x 1
cn3
0
P4
-3Oz O CF6-50 with Core Reverser Nozzle
> [] CF6-50 with Short Core Nozzle
50
"1 is 75
20 100
25
Thrust 125
3b
-kN 150 '35
175 40
200
45 225
"bbc1 Thrust, pounds
Figure 29. Perceived Noise Level Comparison of Short Core Nozzle and Core Reverser Nozzle as a Function of Thrust for 115 Degrees at 305 m (1000 ft) Sideline.

NASAFORMALREPORT
FFNo 665 Aug 65
10
leEl
ZP-4
CD
0
0O CF6-50 with Core Reverser Nozzle
C.o
-0 CF6-50 with Short Core Nozzle
C
50".
(011
75I
20
100I ,
25
Thrust - kN 125 150
' ,
30 35 Thrust, pounds
175
40 I
200
45
225I'
5sx - 0
10
Figure 30. Perceived Noise Level Comparison of Short Core Nozzle ane Core
Reverser Nozzle as a Function of Thrust for 50 Degrees at 122 m
(400 ft) Sideline.
C),
C
M
0,0 A0
0O CF6-50 with Core Reverser Nozzle0-
Thrust -kN 50 75 100 125 150 175 200 2:25_ - I I I I 1 ', i 1 3'1 s20 25 3b 3b 40 45 so 5 x 1O0
Thrust, pounds
Figure 31. Perceived Noise Level Comparison of Short Core Nozzle and CoreReverser Nozzle as a Function of Thrust for 115 Degrees at 122 m(400 ft) Sideline.
0
'
0 CF6-50 with Core Reverser Nozzle z
I CF6-50 with Short Core Nozzle
000
o 0V
0
r. -N
a) 002 a
R N B
oa)
0N
Vl ~ l l l ~lfl Sl l l ~ l l l l
501C 0 00500{50 § 310 00 FrCuny,)
Reverser1 Nozl 0a 0 eg 0ee 3 5m(000 ft)S5dl0 n an50 80800N
(51,200 it) Corrected Thrust (Takeoff).
0
0
0-0
M
E31
0El
0 C6-0wBhShr Cr Nzl
, El
0 CFG-50 with Core Reverser Nozzle
E5 CF6-50 with Short Core Nozzle
50 1Z5 $is 800 2000 8000 £2500 31500 86006
Frequency, Hz
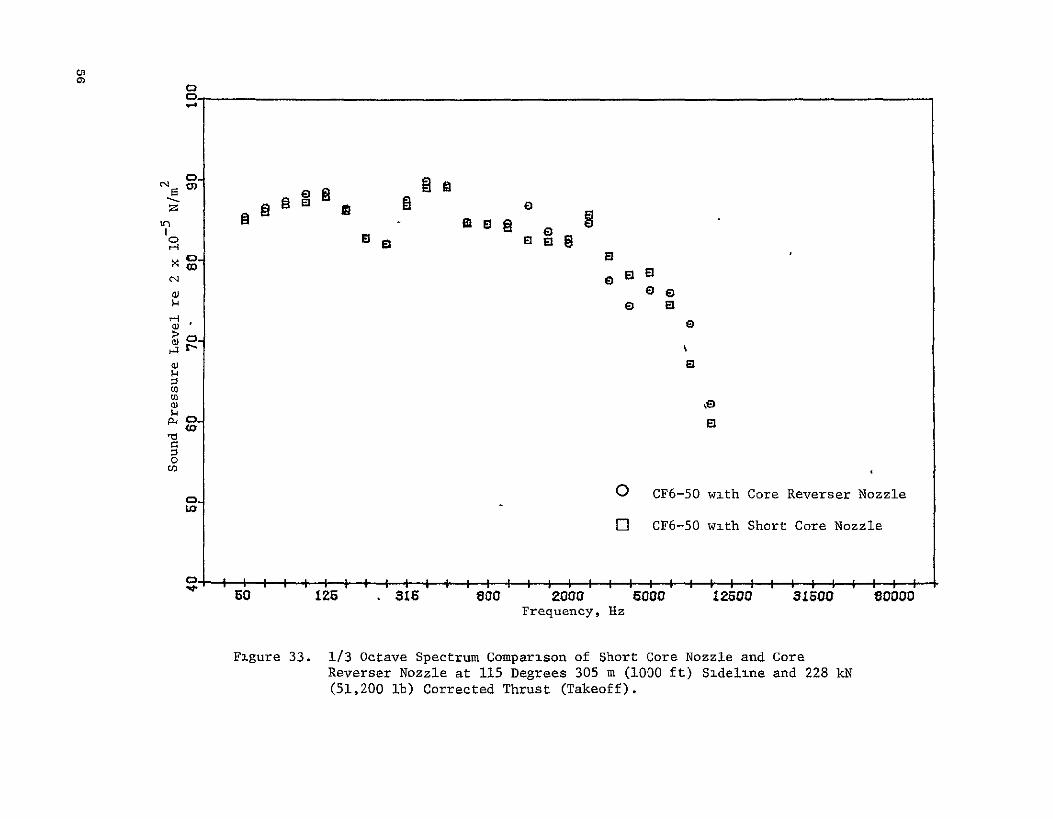
Figure 33. 1/3 Octave Spectrum Comparison of Short Core Nozzle and Core Reverser Nozzle at 115 Degrees 305 m (1000 ft) Sideline and 228 ks (51,200 lb) Corrected Thrust (Takeoff).
0.
C)-MD
w
c)
0
m
EDB
rEl
= El tj
El
"[]
O CF6-50 with Core Reverser Nozzle
CF6-50 with Short Core Nozzle
M 0 125 315 800 2000 6000 Frequency, Hz
12500 31600 80000
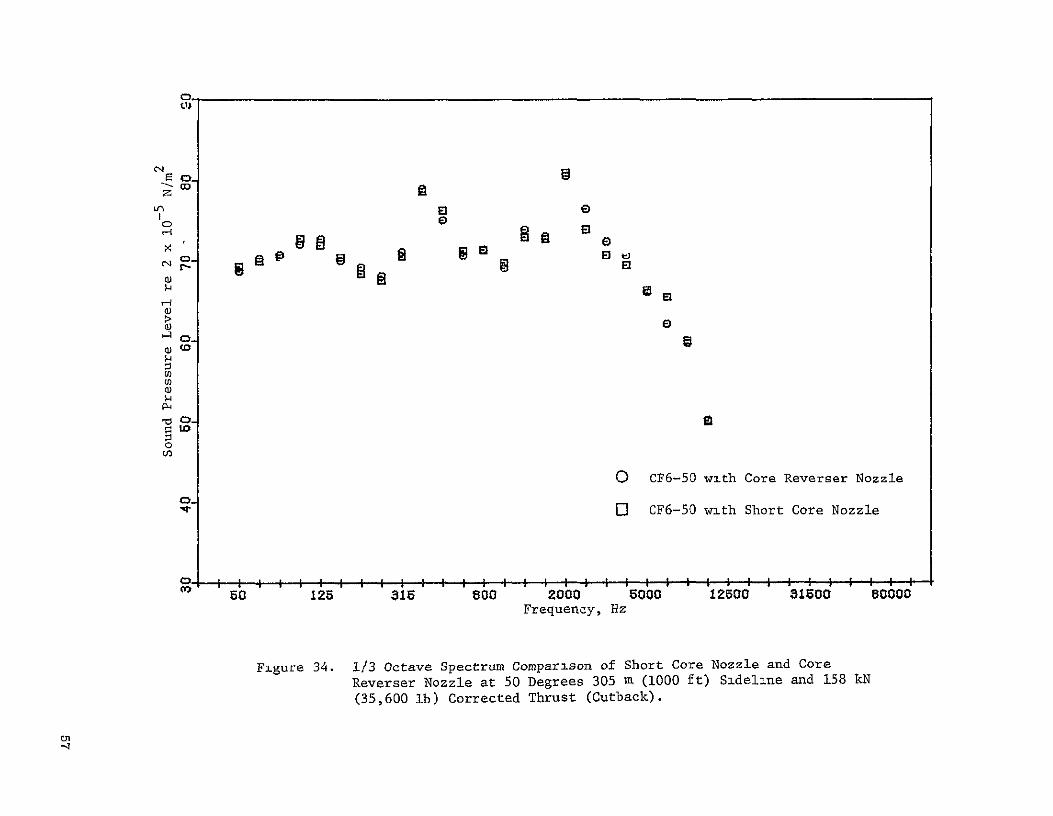
Figure 34. 1/3 Octave Spectrum Comparison of Short Core Nozzle and Core Reverser Nozzle at 50 Degrees 305 m (1000 ft) Sideline and 158 kN
(35,600 lb) Corrected Thrust (Cutback).
00
40 C :3 Ela
C-4
$4
H
CO O0 CF6-50 with Core Reverser Nozzle
0 C CF6-5O with Short Core Nozzle
50 125 800 2O000
Frequency, Hz
5000 12500 K0 80000
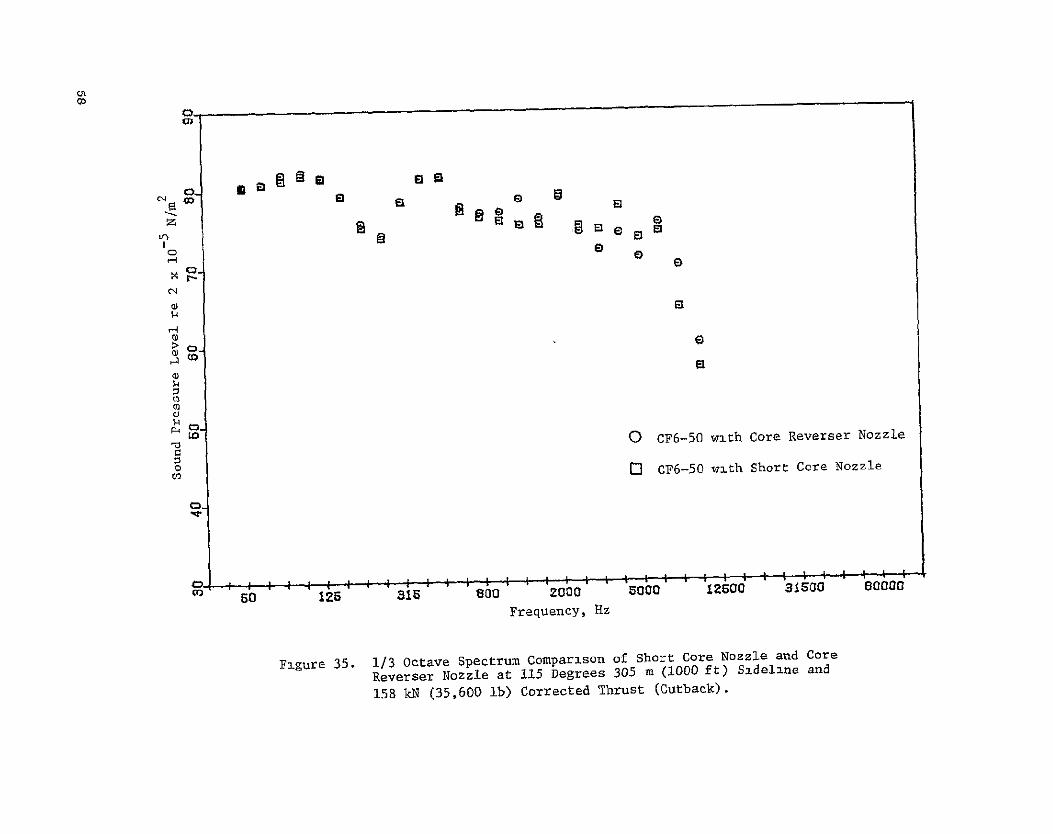
Figure 35. 1/3 octave Spectrum Comparison of Short Core Nozzle and Core Reverser Nozzle at 115 Degrees 305 m (1i00 ft) Sdelne and
158 kN (35,600 lb) Corrected Thrust (Cutback).
m
00
10)o 8 S SsS
E3l
0
SO diC
CF6-50 wth Core Reverser Nozzle
r CF6-50 with Short Core Nozzle
0
CAC
50 126 M1 Boo 2060 . . .B bo Frequency, Hz
12500 31600 60000
00
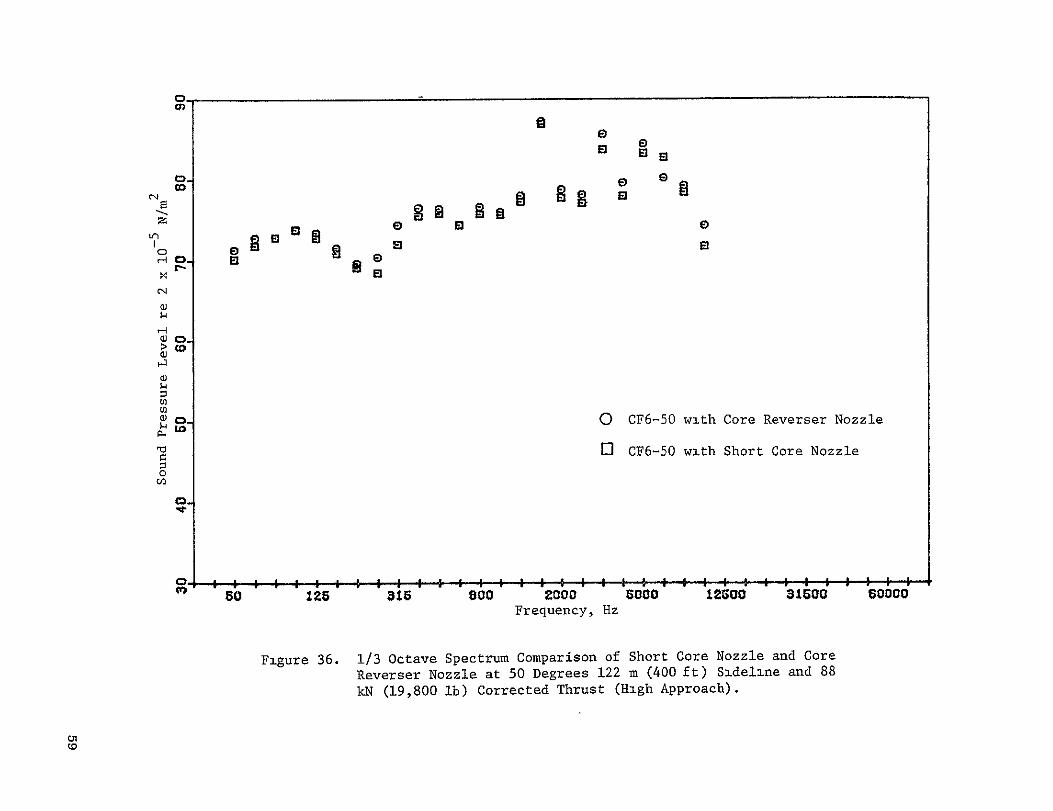
Figure 36. 1/3 Octave Spectrum Comparison of Short Core Nozzle and Core
Reverser Nozzle at 50 Degrees 122 m (400 ft) Sideline and 88
kN (19,800 lb) Corrected Thrust (High Approach).
0-
W W >B
I0
0 CF6-50 with Core Reverser Nozzle
o CF6-50 with Short Core Nozzle0
50 125 $15 800 2000 5000 Frequency, Hz
12500 31500 8606ad
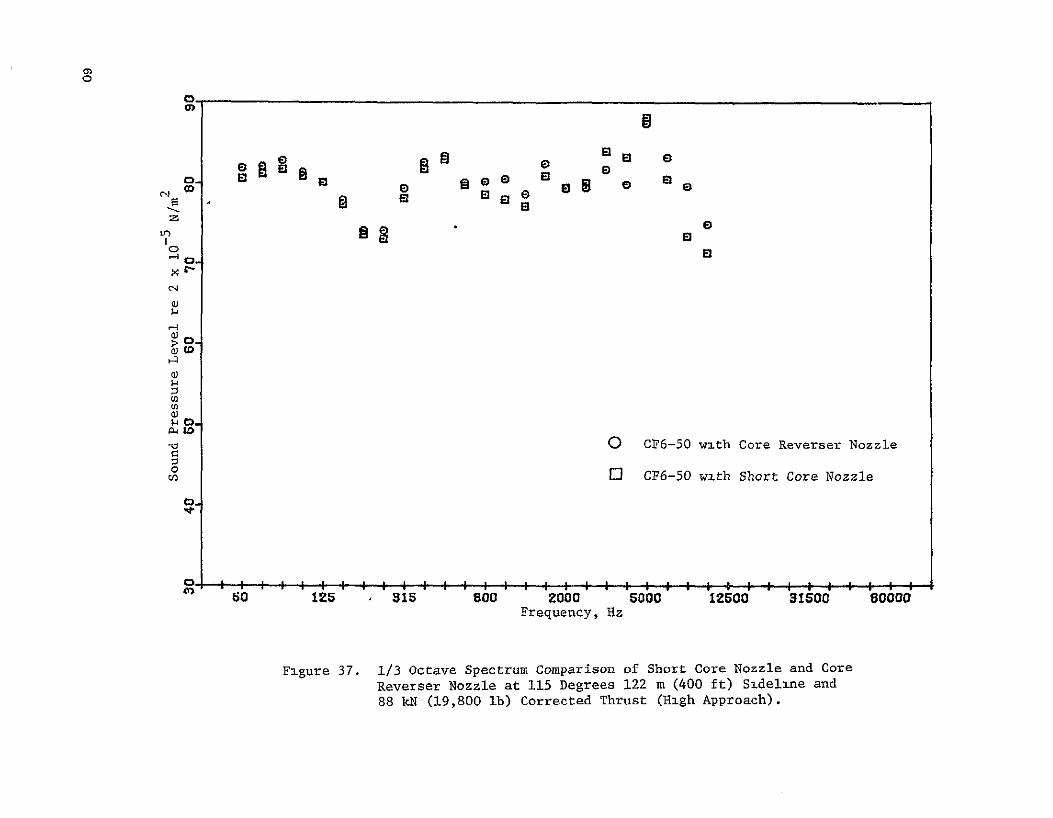
Figure 37. 1/3 octave Spectrum Comparison of Short Core Nozzle and Core Reverser Nozzle at 115 Degrees 122 m (400 ft) Sideline and 88 kN (19,800 lb) Corrected Thrust (High Approach).
El E
z0
El 0 2 0
0o
0 CF6-50 with Core Reverser Nozzle
E] CF6-50 with Short Core Nozzle
Frequency, Hz
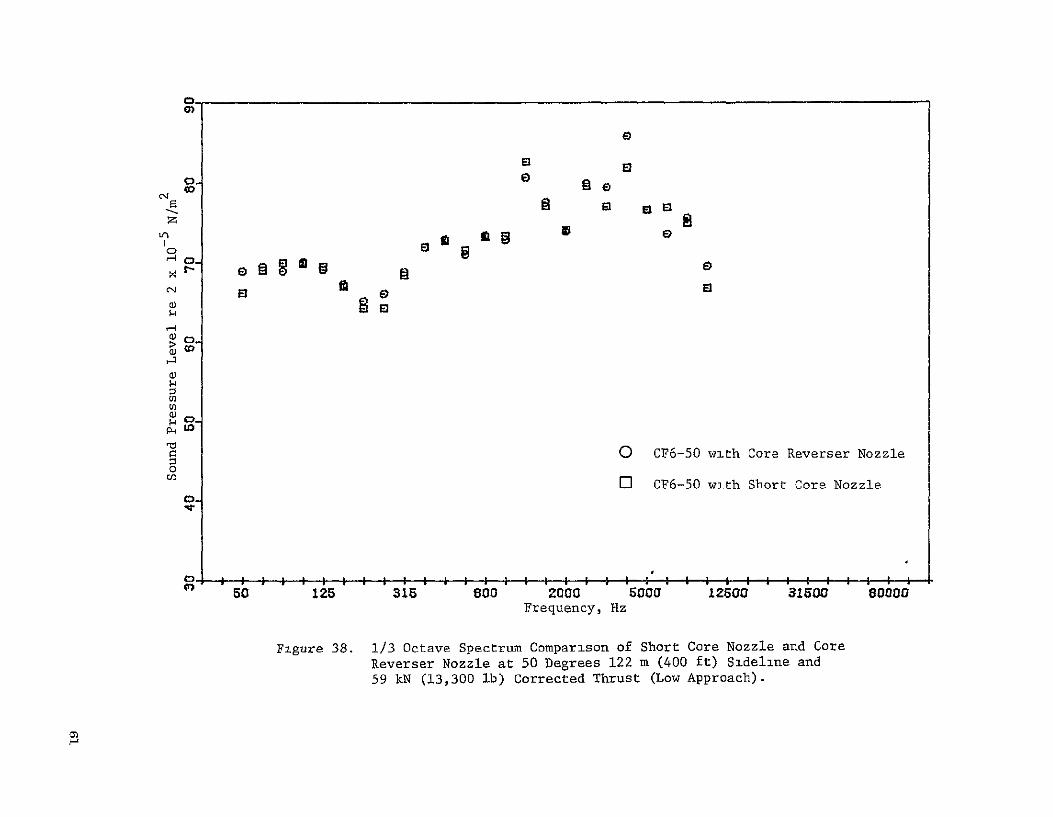
Figure 38. 1/3 Octave Spectrum Comparison of Short Core Nozzle and Core Reverser Nozzle at 50 Degrees 122 m (400 ft) Sideline and 59 kN (13,300 lb) Corrected Thrust (Low Approach).
Qo QD E Z
>M
0
C3N
C:)
O
[]
CF6-50 with Core Reverser Nozzle
CF6-50 with Short Core Nozzle
so
Figure 39.
125 315 BOB 2000 Boca 12500 315od Frequency, Hz
1/3 Octave Spectrum Comparison of Short Core Nozzle and Core
Reverser Nozzle at 115 Degrees 122 m (400 ft) Sideline and
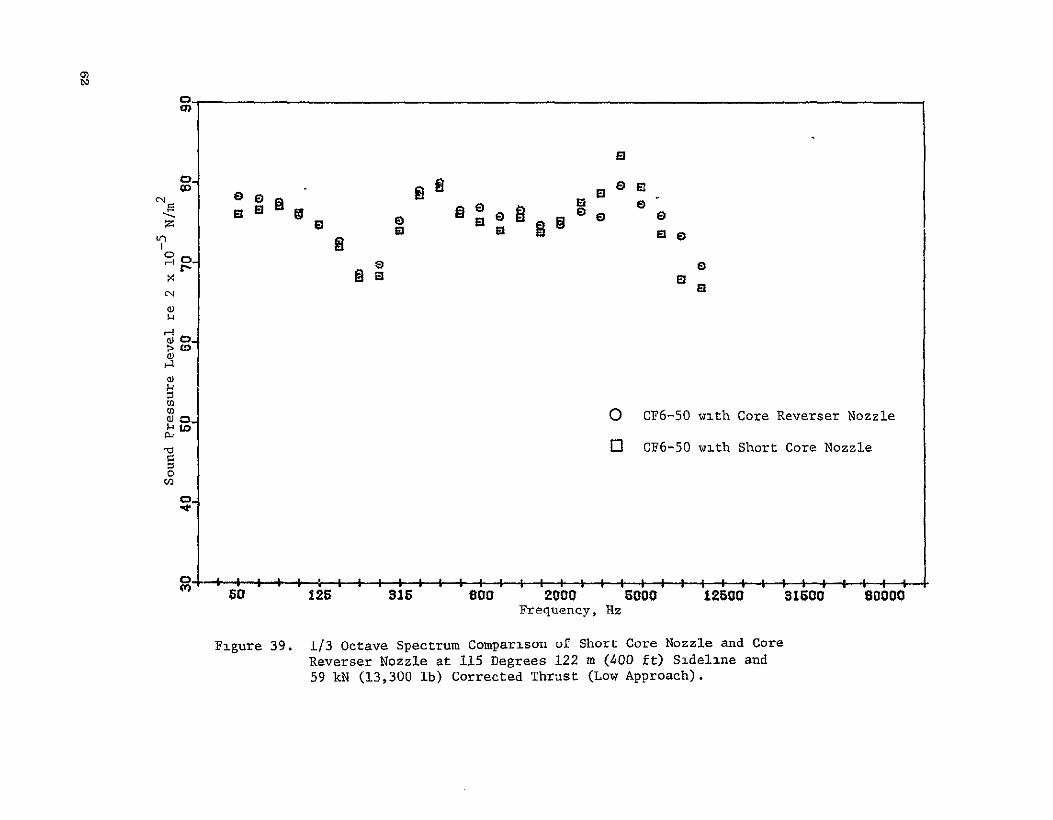
59 kN (13,300 lb) Corrected Thrust (Low Approach).
$606
out due to atmospheric turbulence, the extended nature of the source, broadband noise characteristics of the source, the intrinsic tLime variation of thesource noise levels, and the band width used for data analysis. Interferenceeffects above 1000 Hz are negligible when compared to the data scatter. Noattempt was made to correct the data for interference effects. This is justified by the reproducibility of the interference effect and the direct comparisons made between the back-to-back static test results. Data corrections forthis effect would have been required if the tests were performed under radically different environmental conditions.
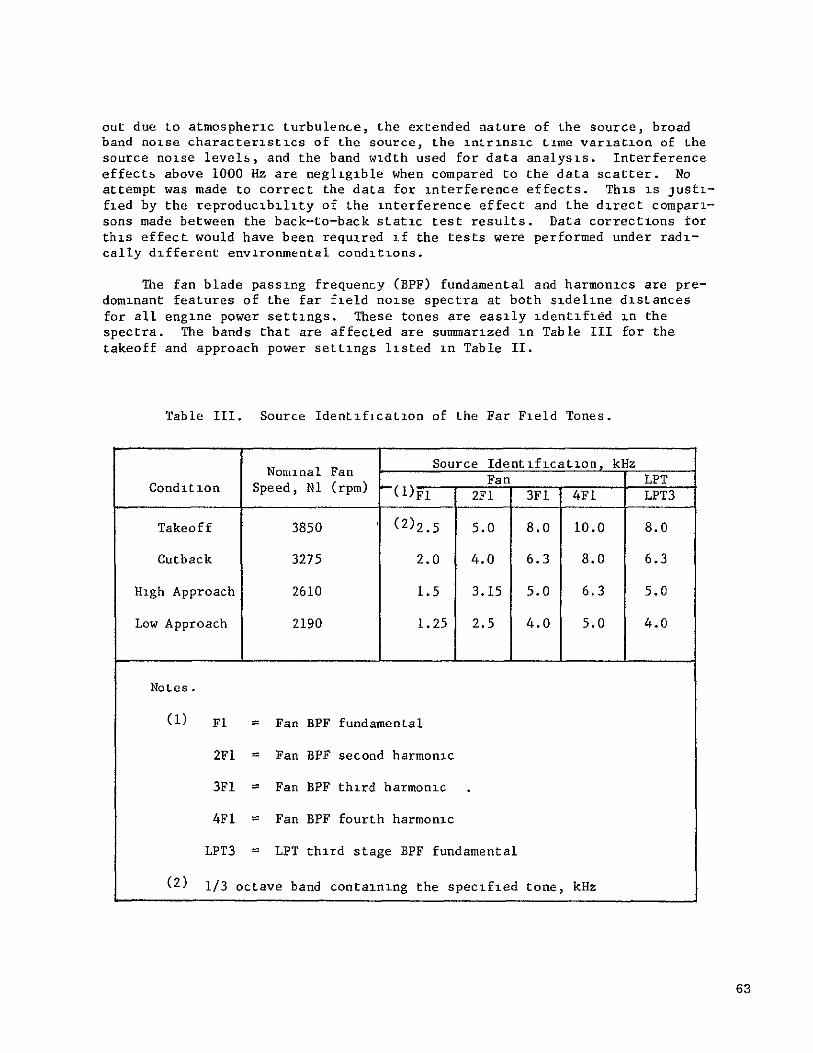
The fan blade passing frequency (BPF) fundamental and harmonics are predominant features of the far field noise spectra at both sideline distancesfor all engine power settings. These tones are easily identified in thespectra. The bands that are affected are summarized in Table III for thetakeoff and approach power settings listed in Table II.
Table III. Source IdentLificatLion of the Far Field Tones.
Source Identification, kHzNominal Fan Fn____ PFan LPT
Condition Speed, Ni (rpm) -()F1- 2FI 3F 4FI LPT3
Takeoff 3850 (2)2.5 5.0 8.0 10.0 8.0
Cutback 3275 2.0 4.0 6.3 8.0 6.3
High Approach 2610 1.5 3.15 5.0 6.3 5.0
Low Approach 2190 1.25 2.5 4.0 5.0 4.0
Notes.
() Fl = Fan BPF fundamental
2FI Fan BPF second harmonic
3F1 = Fan BPF third harmonic
4FI = Fan BPF fourth harmonic
LPT3 = LPT third stage BPF fundamental
(2) 1/3 octave band containing the specified tone, kHz
63
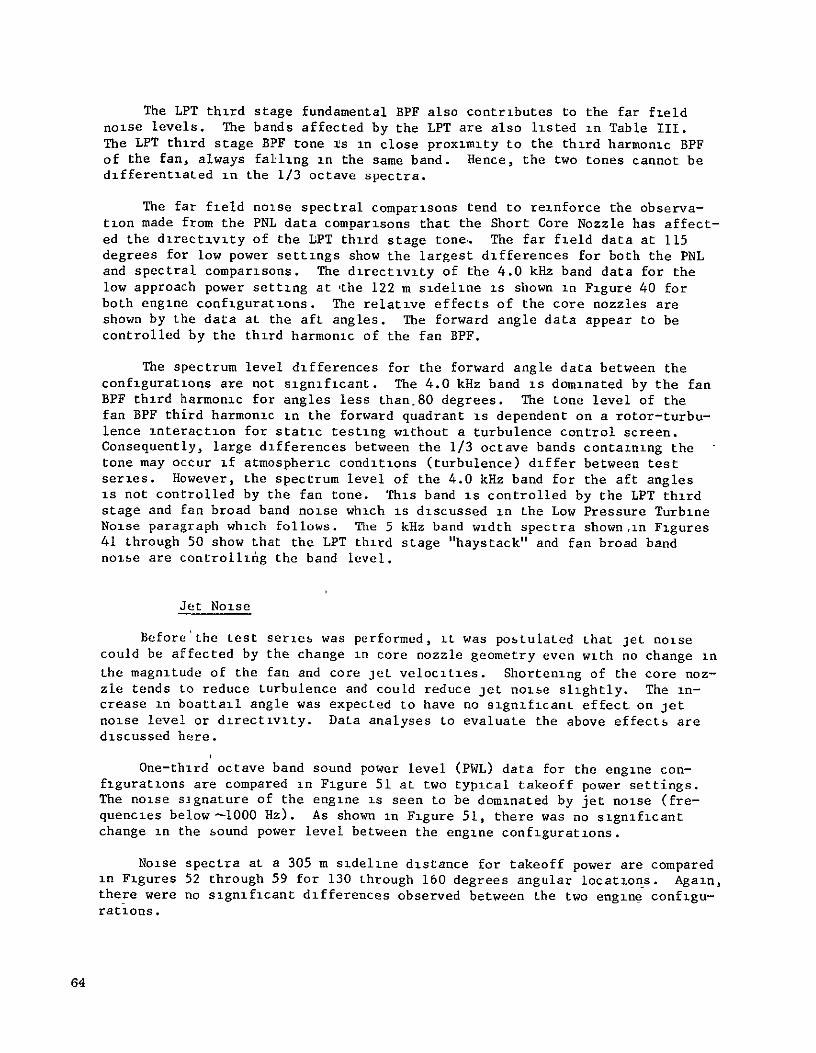
The LPT third stage fundamental BPF also contributes to the far fieldnoise levels. The bands affected by the LPT are also listed in Table III.The LPT third stage BPF tone is in close proximity to the third harmonic BPFof the fan, always fallng in the same band. Hence, the two tones cannot bedifferentiated in the 1/3 octave spectra.
The far field noise spectral comparisons tend to reinforce the observation made from the PNL data comparisons that the Short Core Nozzle has affected the directivity of the LPT third stage tone,. The far field data at 115degrees for low power settings show the largest differences for both the PNLand spectral comparisons. The directivity of the 4.0 kHz band data for thelow approach power setting at ,the 122 m sideline is shown in Figure 40 forboth engine configurations. The relative effects of the core nozzles areshown by the data at the aft angles. The forward angle data appear to becontrolled by the third harmonic of the fan BPF.
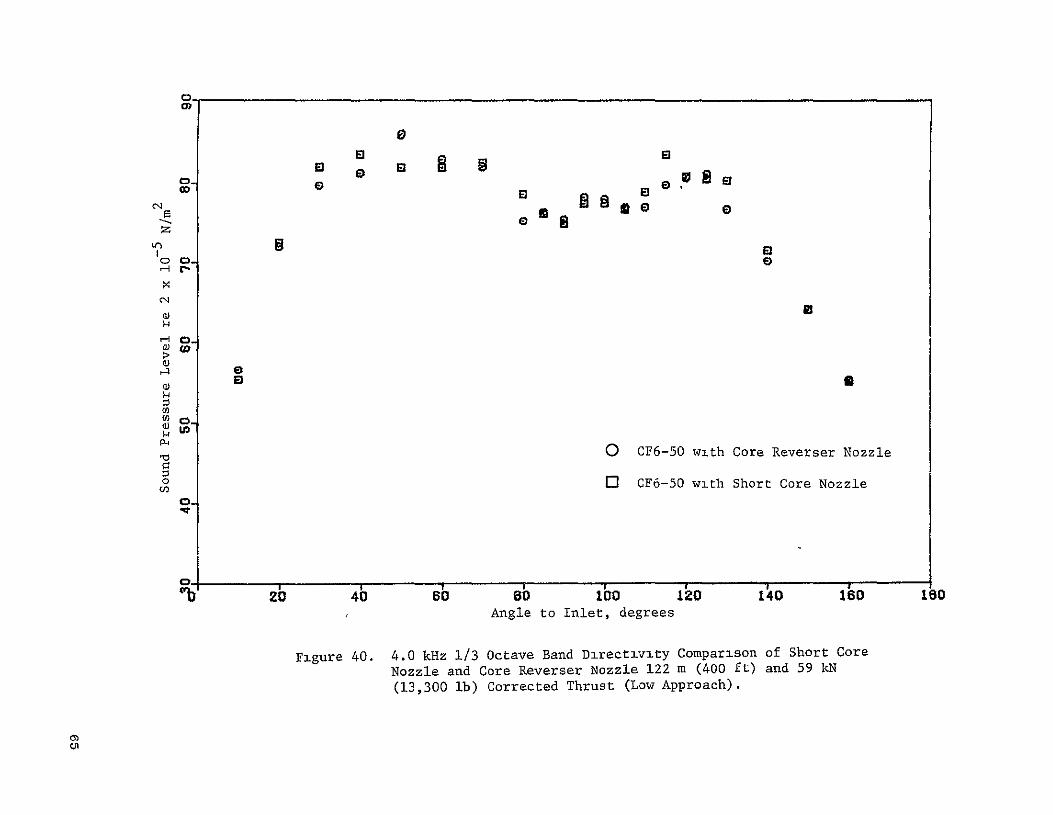
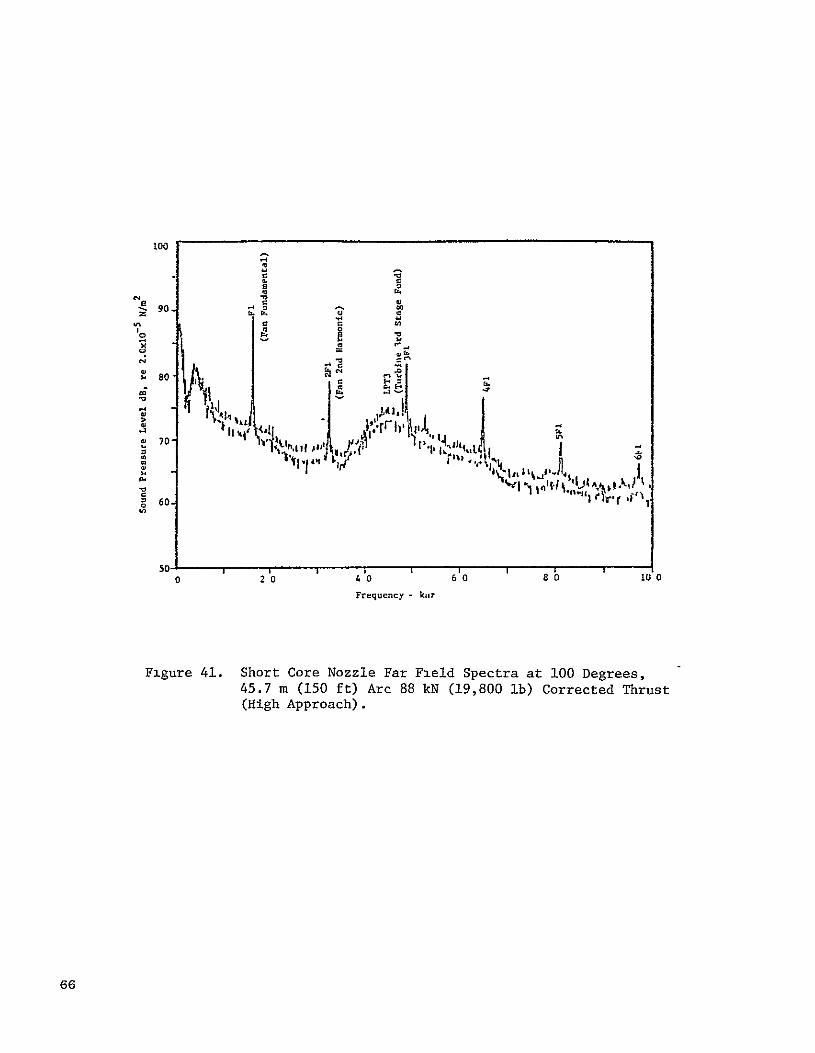
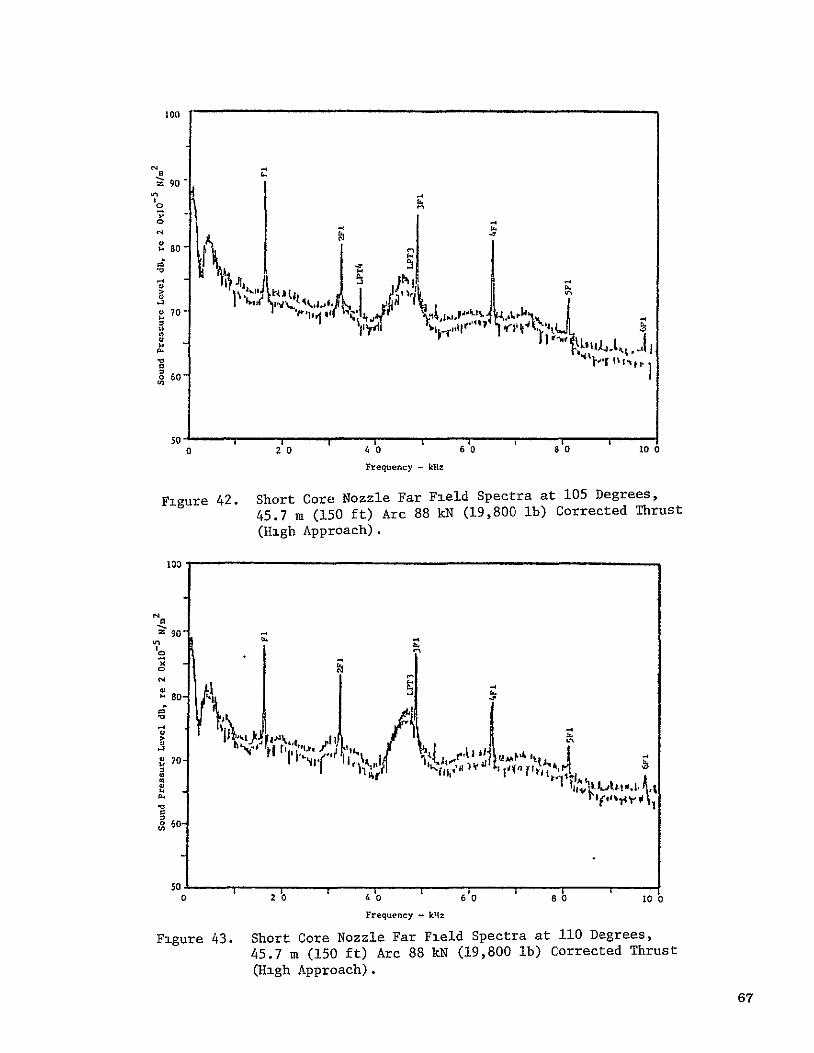
The spectrum level differences for the forward angle data between theconfigurations are not significant. The 4.0 kHz band is dominated by the fanBPF third harmonic for angles less than,80 degrees. The tone level of the fan BPF third harmonic in the forward quadrant is dependent on a rotor-turbulence interaction for static testing without a turbulence control screen.Consequently, large differences between the 1/3 octave bands containing thetone may occur if atmospheric conditions (turbulence) differ between testseries. However, the spectrum level of the 4.0 kHz band for the aft anglesis not controlled by the fan tone. This band is controlled by the LPT thirdstage and fan broad band noise which is discussed in the Low Pressure TurbineNoise paragraph which follows. The 5 kHz band width spectra shown, n Figures41 through 50 show that the LPT third stage "haystack" and fan broad bandnoise are controlling the band level.
Jet Noise
Before'the test series was performed, it was postulated that jet noisecould be affected by the change in core nozzle geometry even with no change inthe magnitude of the fan and core jet velocities. Shortening of the core nozzle tends to reduce turbulence and could reduce jet noise slightly. The increase in boattail angle was expected to have no significant effect on jetnoise level or directivity. Data analyses to evaluate the above effects arediscussed here.
I
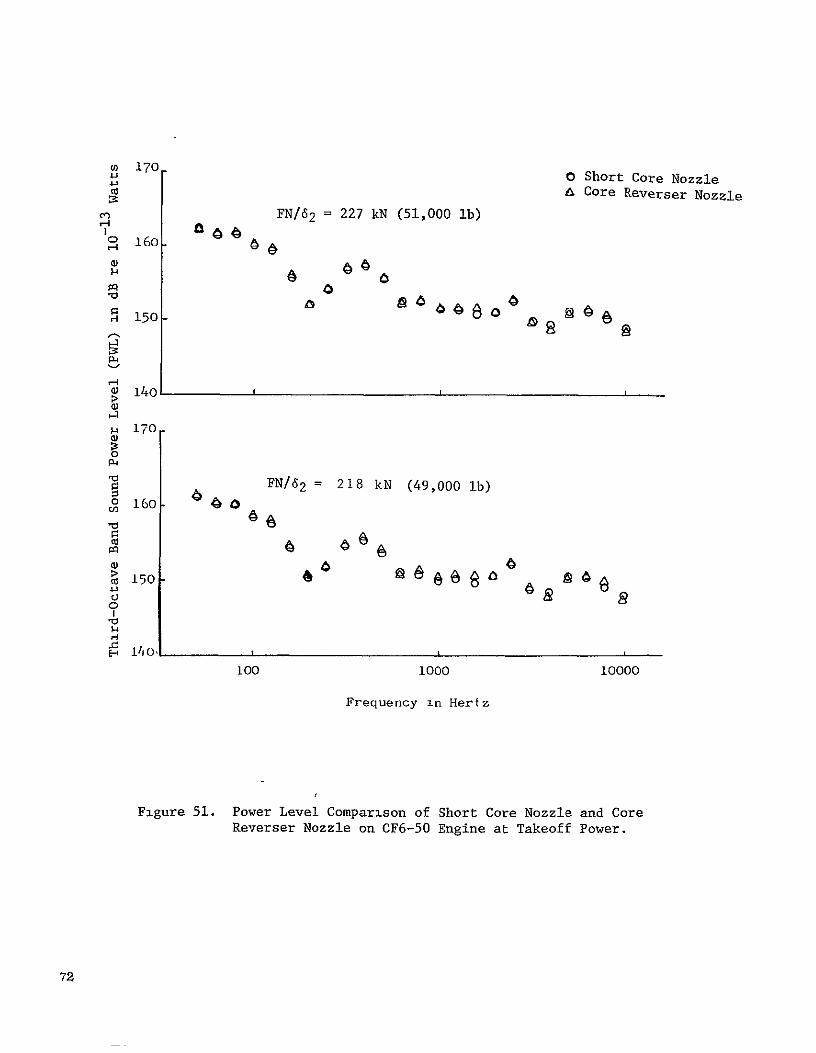
One-third octave band sound power level (PWL) data for the engine configurations are compared in Figure 51 at two typical takeoff power settings.The noise signature of the engine is seen to be dominated by jet noise (frequencies below -1000 Hz). As shown in Figure 51, there was no significantchange in the sound power level between the engine configurations.
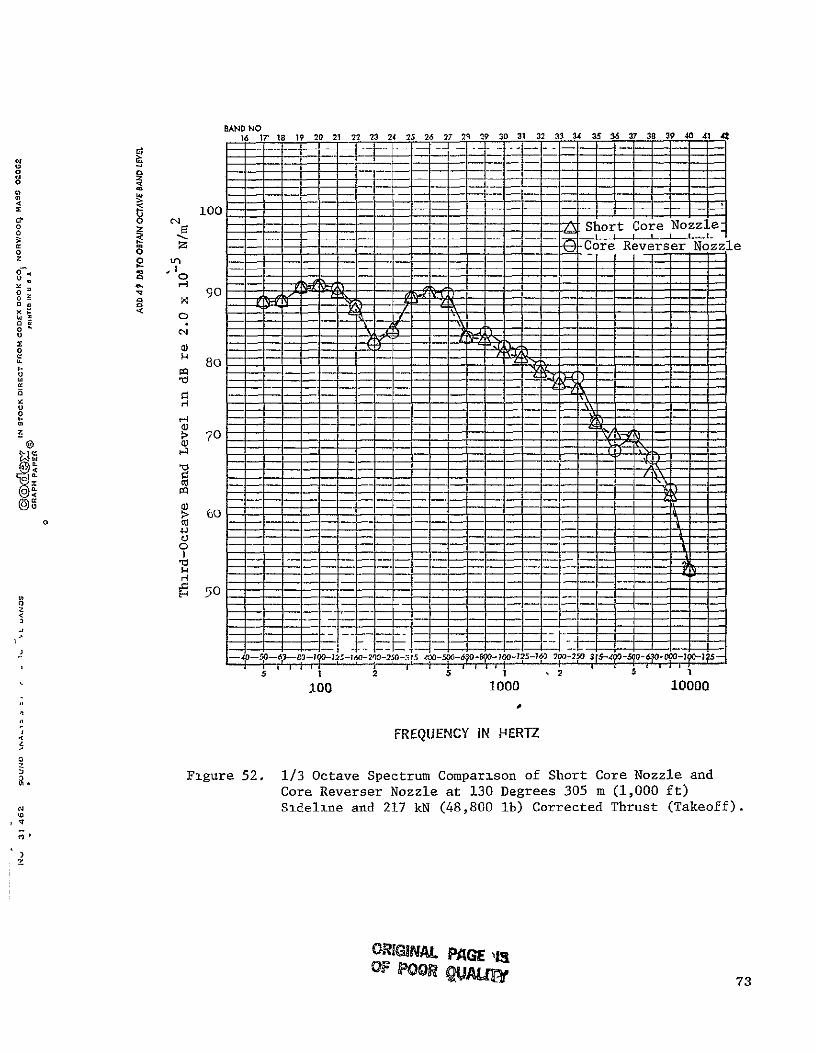
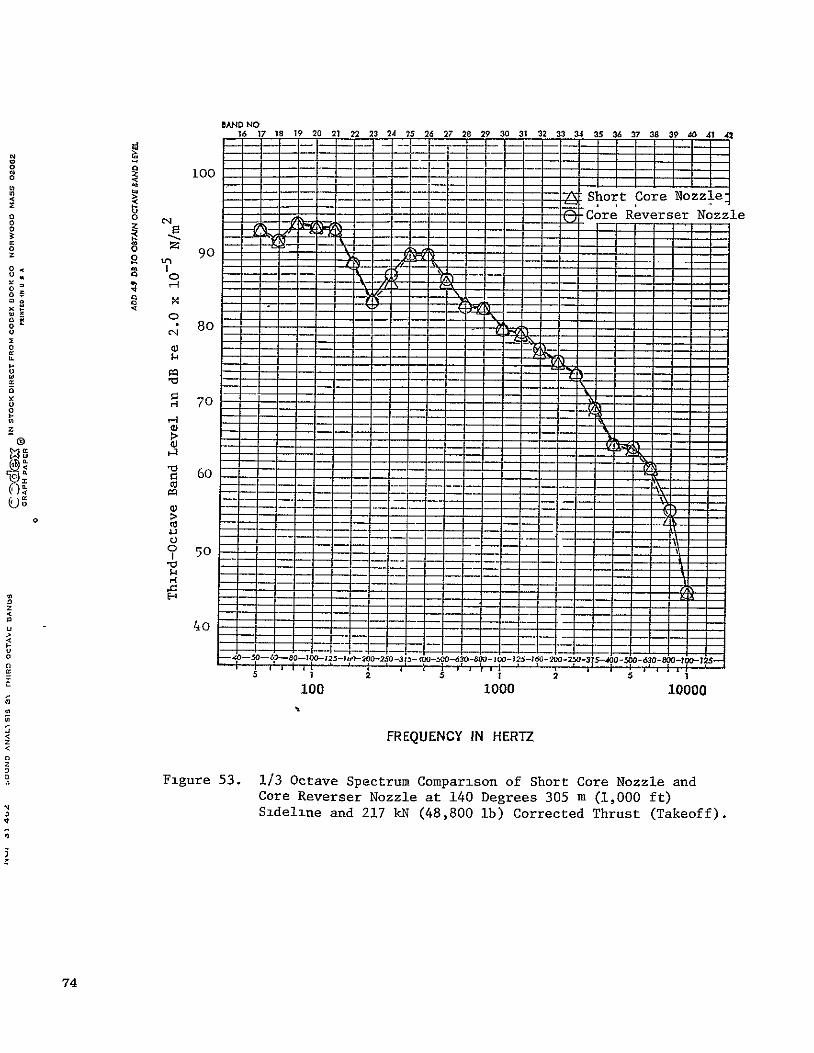
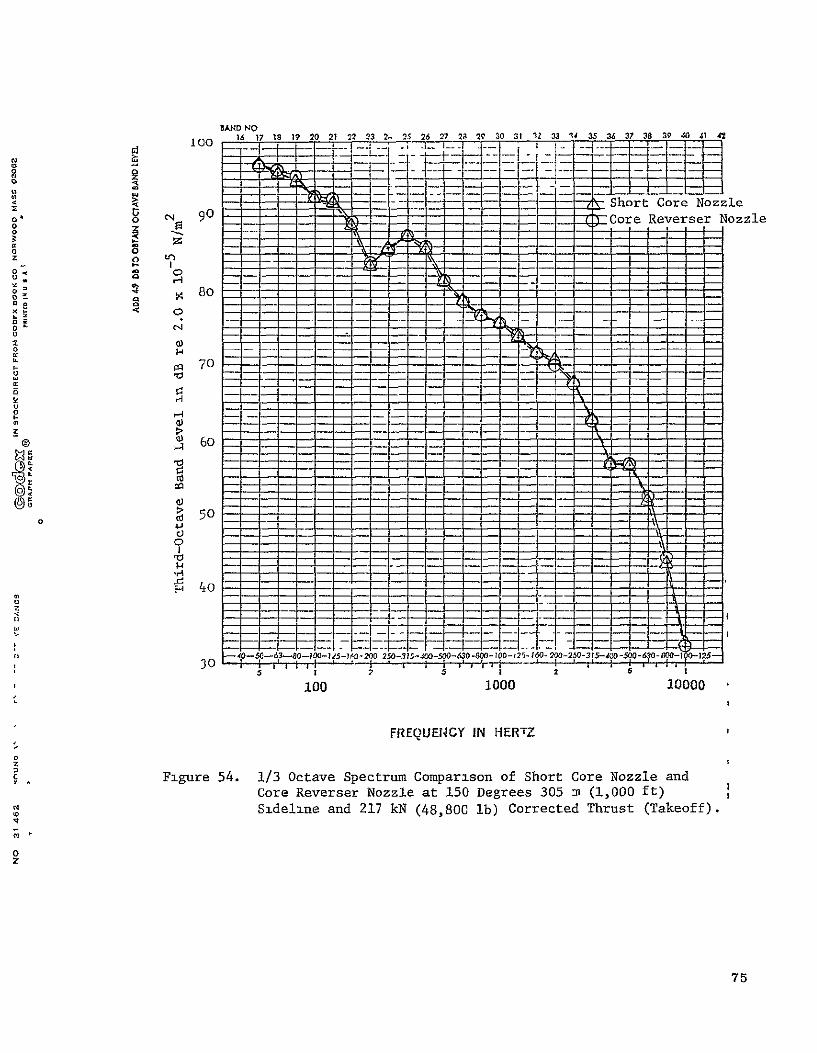
Noise spectra at a 305 m sideline distance for takeoff power are comparedin Figures 52 through 59 for 130 through 160 degrees angular locations. Again,there were no significant differences observed between the two engine configurations.
64
0
m
Z
E a
N
Lfl
MU
o
- Nz
0
0]
CF6-50 with Core Reverser Nozzle
CF6-50 with Short Core Nozzle
,% zb 4b so eb faoao i'oso leo
Angle to Inlet, degrees
Figure 40. 4.0 kHz 1/3 Octave Band flirectivity Comparison of Short Core Nozzle and Core Reverser Nozzle 122 m (400 f) and 59 kN (13,300 lb) Corrected Thrust (Low Approach).
100
90-
I IA
0 I
s 02 04 060 a 0 10 0
Frequency kar
Figure 41. Short Core Nozzle Far Field Spectra at 100 Degrees,45.7 m (150 ft) Arc 88 kN (19,800 lb) Corrected Thrust
(High Approach).
66
100
90
Io 80
C,,
-
50
0 20 40 60 80 10 0
Frequency - kHz
Short Core Nozzle Far Field Spectra at 105 Degrees,Figure 42. 45.7 m (150 ft) Arc 88 kN (19,800 lb) Corrected Thrust
(High Approach).
700
5040 60 80 1000 20
Frequency - kilz
Figure 43. Short Core Nozzle Far Field Spectra at 110 Degrees,
45.7 m (150 ft) Arc 88 kN (19,800 lb) Corrected Thrust
(High Approach).
67
go
- 90
0 (igA %,.,
a I. ,
0
d) 0
60
0
Figure 44.
100' 2 0 40 60 80 10
Frequency - kHz
Short Core Nozzle Far Field Spectra at 115 Degrees, 45.7 m (150 ft) Arc 88 kN (19,800 ib) Corrected Thrust (High Approach).
100
5D
50 ., .
14 800 I ] 8 * 1
(0Jg Aprach.
660
1 00
9 SC9O0
o 90 C g
CC
S80 Ac
Cd
C70 ,'IJ,
60.1",Ni
50 0 20 40 60 80 10
Frequency -klz
50
020 4 0 6 0 30 1O00
Frequency - kl 809Figure 46. Core Reverser Nozzle Far Field Spectra at 100 Degrees,
45.7 m (150 ft) Arc 88 kN (19,800 ft) Corrected Thrust
60. (High Approach).
o
jr 0 a01
70qunc k~ U.
Core Reverser Nozzle Far Field Spectra at 105 Degrees,Fgure 47. 45.7 m (150 ft) Arc 88 kN (19,800 it) Corrected Thrust
(High Approach).69
100
"go
80
t . . ,c70 ' jiji f~'
IAd
va60
50
0 2.0 4 0 6 0 8 0
Frequency - kllz
Figure 48. Core Reverser Nozzle Far Field Spectra at 110 Degrees,
45.7 m (150 ft) Arc 88 kN (19,800 ib) Corrected Thrust
(High Approach).
100
= '
o It
7) il - I
70
5 210 1 4'0 6.'D B'0 10 0(
Frequenc -lfz
Figure 49. Core Reverser Nozzle Far Field Spectra at 115 Degrees,
45.7 m (150 ft) Arc 88 kN (19,800 Ib) Corrected Thrust (High Approach).
70
100
8o0
50a. 41 I,I
so
S60
0 2.0 46 0 a 0 0
Frequency- kt
Figure 50. Core Reverser Nozzle Far Fi]eld Spectra at 1i20 Degrees,45.7 m (150 ft) Arc 88 kN (19,800 lb) Corrected Thrust(igh Approach).
71
1707o Short Core NozzleW aCore Reverser Nozzle
FN/ 2 = 227 kN (51,000 ib)o i6o cu
P
M
a 150
4) 140o 0)
, 170 0
P-4
r FN/6 2 = 218 kN (49,000 ib)0 160. '50
:j 456
W 45 cd 150'J U
E- 14 0)11
100 iO00 10000
Frequency in Hertz
Figure 51. Power Level Comparison of Short Core Nozzle and CoreReverser Nozzle on CF6-50 Engine at Takeoff Power.
72
BAND NO 1 17' 18 19 20 21 22 23 24 25 26 27 2Q 29 30 31 32 33 24 35 SA 37 38 39 40 41 4
0
0
0
0
t,.i
a)'
0
i00
go
-. - - - -
- --.-.-
- -----------
IN
Short Core Nozzle
-G-Core Reverser Nozzle
04
@ 05
a a
70
0
00
- - 5 - 1 -r
OFPORoA~y7
) FREQUENCY IN HERTZ
3
~Sideline
Figure 52, 1/3 Octave Spectrum Comparison of Short Core Nozzle and Core Reverser Nozzle at 130 Degrees 305 m (1,000 ft)
and 217 kN (48,800 ib) Corrected Thrust (Takeoff).
aMNLPAGE I
BAND NO 16 17 18 19 20 21 22 23 24 25 26 27 28 29 30 31 32 33 34 35 36 37 38 39 40 41
0 o
010
0
'a
0
090
1I00
Short Core Nozzle; -Core Reverser Nozzle
0;
OfO
SO8o
00
, 70
03
06
00 05
0l
6oo
-
4o I-I
+
ZH F U I
o 50
Figure 53. 1/3 Octave Spectrum Comparson of Short Core Nozzle andCore Reverser Nozzle at 140 Degrees 305 m (1,000 ft)Sideline and 217 kN (48,800 lb) Corrected Thrust (Takeoff).
74
1C0
BAND NO
16 17 18 19 20 21 22 23 2. 25 26 27 2S 2V S0 31 12 33 I4 35 36 37 38 39 M0 41 42
=t -Short Core Nozzle
9 F Core Reverser Nozzle
o 0
0- IIt0 0 .: 80 "-
U. -~ -
- - - - - - - -,t - - - - 4 LZ
0 0 -
0 -
00
o 6
x
0
iI
'033
7-b -4 03
'I ~~ ~ ~ ~ ~ idln an 27 215-(48,tO62800 l)-25 Corrcte Thru3-35-st-0-300(Taeof)
0 50
0 10 00 00
FREQUNCY IHERT
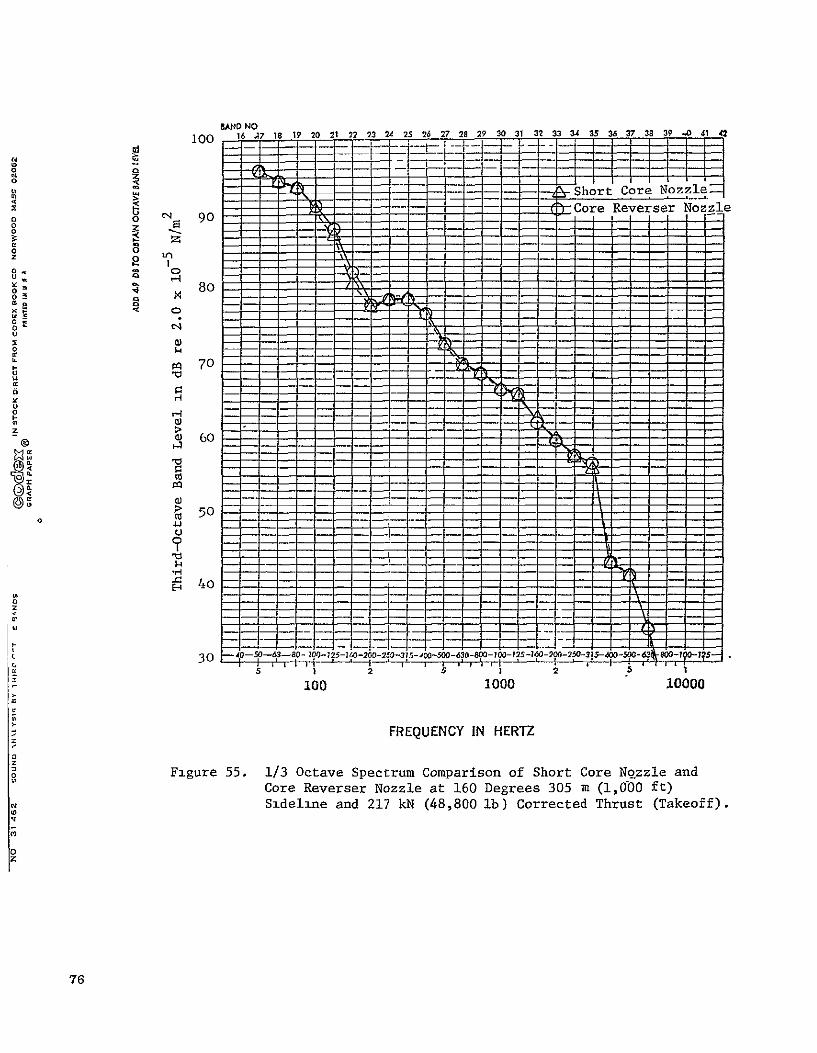
O NO 100 16 47 18 19 20 21 22 23 24 25 26 27 22 29 30 31 32 33 34 35 36 37 38 39 - 41 4C
Short Core,Nozzle =-_
o 90 -- Core Reverser Nozzle
o g
Oz
o8 0 00;
05!
70 o
0 -
) 60
I'-H 50 3
o5
i00 1000 10000
FREQUENCY IN HERTZ
0 Figure 55. 1/3 Octave Spectrum Comparison of Short Core N(2zzle and Core Reverser Nozzle at 160 Degrees 305 m (1,600 ft) Sideline and 217 kN (48,800 lb) Corrected Thrust (Takeoff).
76
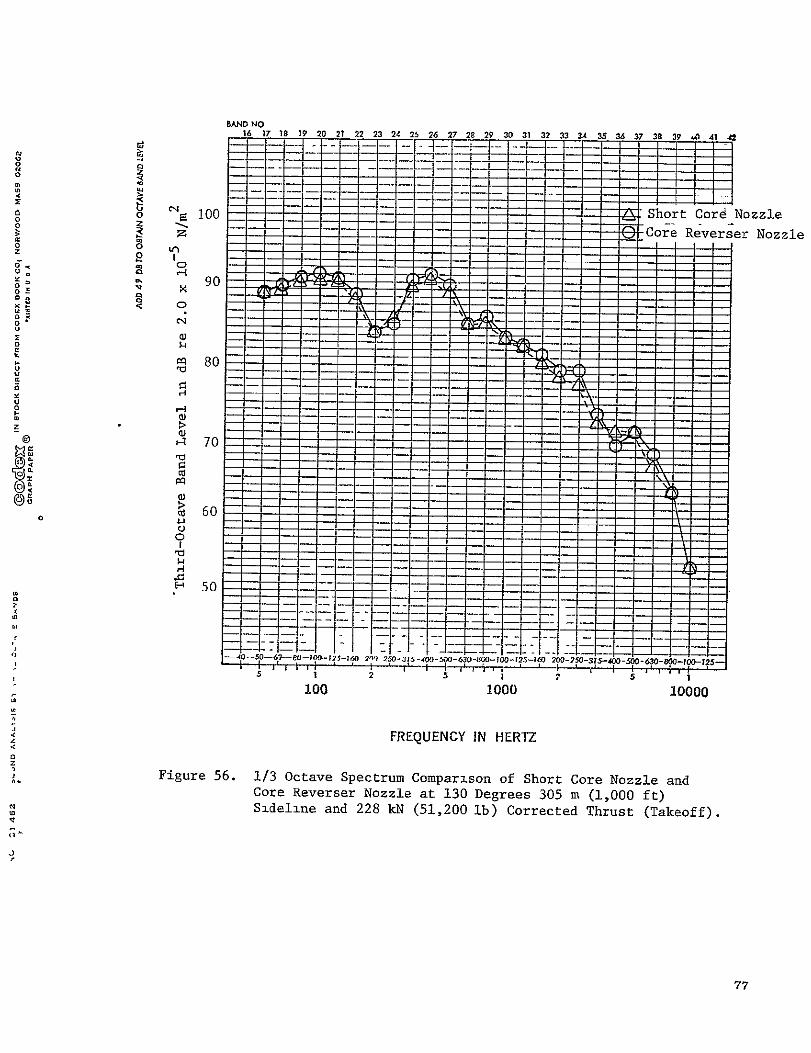
BAND NO16 17 18 19 20 21 22 22 24 25 26 27 28 29 30 31 32 33 34 35 3 37 3 9 41
d :m - - - L. .
o 100 -Short Cord Nozzle- O-Core Reverser Nozzle
0 z 52 £- - - - - -
9 _ 9005
0 0
PQm80
070 I&i
II
60
0 50
- 40-..0--6.--0--10--25_1.;02, , 25.:11-40 -60-8G -10 -125| 0 -25-31.--&0- 0. 0 -- (0--3 5_W-6
25 2w 11"ET5q5
100 1000 10000
FREQUENCY IN HERTZ
Figure 56. 1/3 Octave Spectrum Comparison of Short Core Nozzle andCore Reverser Nozzle at 130 Degrees 305 ma (1,000 ft)Sideline and 228 kN (51,200 lb) Corrected Thrust (Takeoff).
77
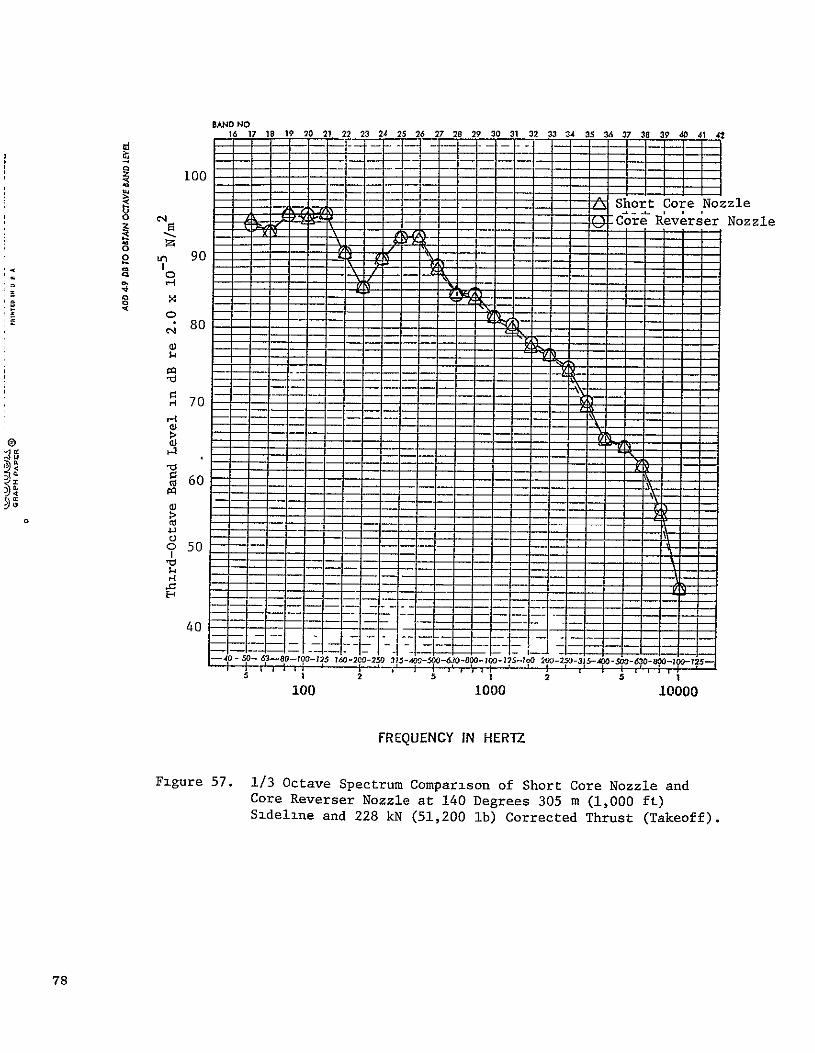
0
0
DND NO16 17 1 19 20 21 22 23 24 25 26 27 28 29 30 31 32 33 34 3S 34 37 38 39 40 41 42
S -~1 - -. . . . . . . . . . . .
i00
- Short Core Nozzle z9:Core Reverser Nozzle
90 =t70
S80
S70
4-) M
Cc
0 50
40
630 80 0 1 2 5 A)O-50-6 - M'125 T -200-250 315-40-9 - -1 o 0--3---00- - --
|2 5 2,,
100 i000 10000
FREQUENCY IN HERTZ
Figure 57. 1/3 Octave Spectrum Comparison of Short Core Nozzle andCore Reverser Nozzle at 140 Degrees 305 m (1,000 ft)Sideline and 228 kN (51,200 lb) Corrected Thrust (Takeoff).
78

--- - ------ --- -------
i oo( BAND NO
16 17 18 19 20 21 22 2324 25 26 27 28 29 30 31 32 3334 35 SA37 3a 39 sO_41_
I0
d 90
-
- - - -
-
-
-
-
oShort Core Nozzle Core Reverser Nozzle
0 U
00
0 U
6 0
05
xU
-F
40
0
L 10 1000 10000
IFREQUENCY 27 IN HERTZ
. Figure 58. 1/3 Octave Spectrum Comparison of Short Core Nozzle and
Core Reverser Nozzle at 150 Degrees 305 m (1,000 ft)
~Sideline and 228 kN (51,200 ib) Corrected Thrust (Takeoff).
e:
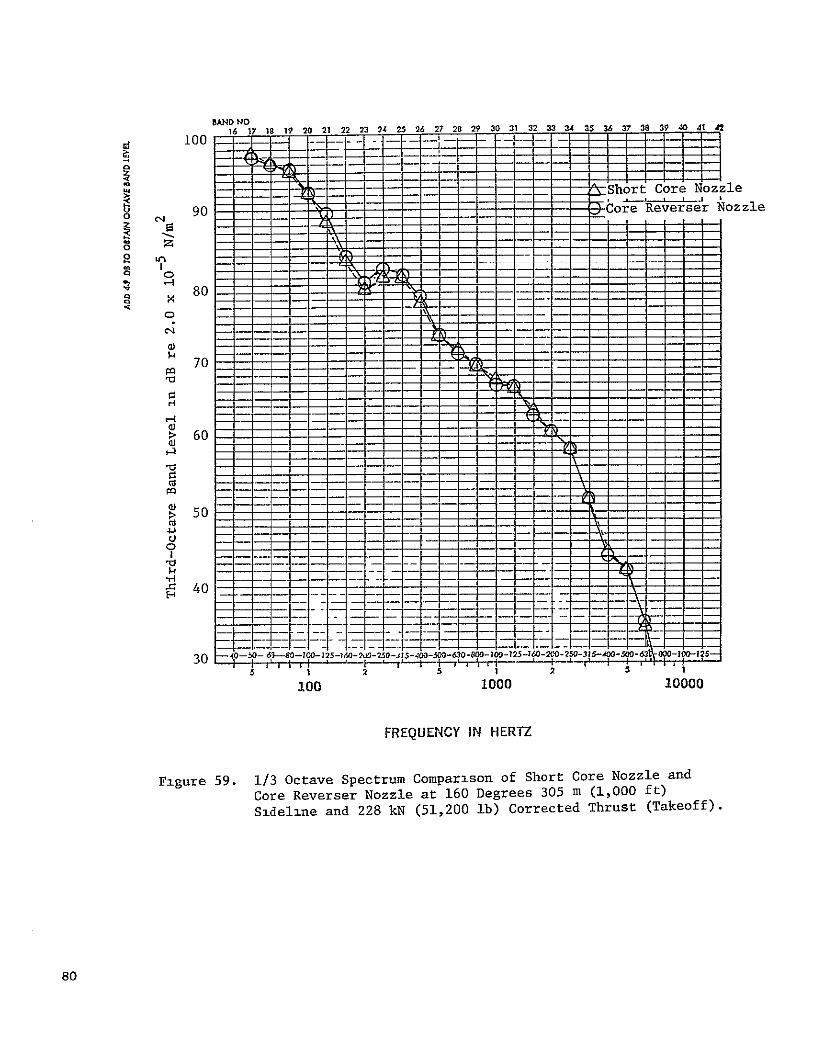
--
BAND NO=1 100 16 17 12 19 20 21 22 23 94 25 26 27 28 29 30 31 32 33 34 35 36 37 38 39 40 41 42
- - _--Short Core Nozzle
Core Reverser Nozzle
o 80
$4 7
PQ
ci
> 0
0
1-i
--' 40----
-
30 4
100 1000 10000
FREQUENCY IN HERTZ
Figure 59. 1/3 Octave Spectrum Comparison of Short Core Nozzle and
Core Reverser Nozzle at 160 Degrees 305 m (1,000 ft)
Sideline and 228 kN (51,200 ib) Corrected Thrust (Takeoff).
80
Low Pressure Turbine Noise
LPT noise suppression resulting from the acoustic treatment in the corenozzle was expected to be similar between the Short Core Nozzle and CoreReverser Nozzle configurations based on previous rectangular duct testing attemperatures and flow velocities which simulated the engine cycle. The rectangular duct testing, however, did not account for the complex shape of thereal core duct. The design of the acoustic treatment proper was not changedbetween the core nozzles. Unfortunately, test scheduling difficulties, dueto adverse weather conditions, did not permit comparative tests using thesound separation probe to evaluate treatment suppression performance between the nozzles.
Results from a 5 Hz band width spectrum analysis of the core nozzle dataand from a narrow band analysis of the 45.7 m far field data at 100 through120 degrees for a typical high approach power setting (88 kN) are shown inFigures 60 and 61. The Short Core Nozzle core probe data (immersion No. 1),as shown in Figure 60, clearly shows the fundamental BPF tones associated witheach turbine stage, and the dominance of the third stage tone. By comparisons,the far field data show no discernible turbine tones.
The phenomenon of "haystacking" as observed in the far field narrow bandspectra for the third stage tone has received considerable attention in the literature discussing turbine noise generation. Only the salient features ofthe mechanism will be discussed here. A detailed discussion of the phenomenonis given in Reference 3.
The transformation of the third stage turbine BPF tone into a "haystack"observed in the far field spectra is an apparent result of scattering of theacoustic wave by the core and fan jet turbulence. The observed spectralbroadening and amplitude modulation is hypothesized to be primarily producedby propagation through the jet interface and shear layers. In addition tospectral broadening, the turbulence scattering centers act as the source ofthe scattered wave. The far field data will exhibit a Doppler shift dependentupon the relative velocity of the turbulent boundary layers at each far fieldmicrophone location. For conditions where the energy of the scattered wave iscomparable to or less than that of the incident tone, the far field data willexhibit a haystack and an observable tone. The tone will not exhibit a frequency shift even though the peak frequency of the haystack exhibits a Dopplershift.
The far field properties of the third stage turbine BPF, as shown in Figures 41 to 50, are essentially as described above with both engine configurations exhibiting similar behavior. The fourth stage BPF fundamental tone isevident at 105 degrees for the Short Core Nozzle (Figure 42). Evidently,either there is an unknown mechanism that governs the far field propagationof this tone which differs from the scattering process described above, or thehaystack amplitude is below the broad band noise in this frequency region.
A composite of pressure levels which represent the envelope of pressureamplitudes measured at the eight transducer positions (see Section 6.3) is
81
100
90Z
x L Io
>' 4 4 4
0=60
50 I 8 20 40 60 80
Frequency -kH
Figure 60. Short Core Nozzle Core Probe Spectrum at Immersion No.
88 kN (19,800 lb) Corrected Thrust (High Approach).
82
-4
43
ciiot
00
a 2400 NIK
>
2598 NIK
2841 NIK
2.0 4.0 6.0 8.b
Frequency, k z
Short Core Nozzle Probe Measured Sound PressureFigure 61.
Level Envelope of Eight Spectra, 20 Hz Band Width.
83
shown in Figure 61 for four corrected fan speeds spanning the range of approach power settings. A 20 Hz band width tracking filter was used to reducethe data. The blade passing frequencies of the low pressure turbine (128,126, 112 and 86 blades, respectively, for the first through fourth stages) are seen ad-distinct tones. The third stage fundamental is always a predominant feature of the core probe spectrum. Second harmonics of the tones aswell as several sum and difference tones produced by tone modulation throughblade rows are also observed. Broad band levels remained fairly uniformacross the nozzle, but tone levels varied significantly, even between adjacentpositions.
The power levels of the strongest tones were calculated from the logarithimic average of all the pressure measurements and are shown in Figure 62for the four values of corrected fan speed. The duct cross section was assumed to be composed of eight equal area regions with uniform sound pressurelevel distributions over each area. The power level was calculated as shownbelow.
PWL = SPL + 10 Log A + 20 Log (1.0 + 0.707M) + 10 Log (P o /ps //T ) + 10 dB
where. PW = space average PWL, dB re I0- 13 watts
SPL = space average SPL, dB re 2.0 x 10- 5 N/m2
A = area of the nozzle (m2 )
M = duct Mach number
Po/Ps = ratio of ambient to duct static pressure
T/To = ratio of duct total temperature to ambient temperature
The spectral broadening of both the third stage low pressure turbine BFPfundamental and the fan BPF third harmonic tones in the far field results inan overlap of the broad band noise from each component. Correlation of thefar field data with the source is inconclusive due to the nonlinear scatteringprocess, preventing the determination of the spectral content due to eachcomponent in the frequency regions of interest. Hence, direct evaluation oftreatment performance between the two confLgurations could not be performed.Any conclusions regarding treatment effectiveness drawn from comparing thesmall spectrum level differences in this frequency region should be regardedas questionable.
Community Noise Impact Assessment
Community annoyance as a result of noise produced from aircraft operationis inherently subjective. Annoyance produced by aircraft noise is dependenton sound level, spectrum content, tone content, time duration, and an individ
84
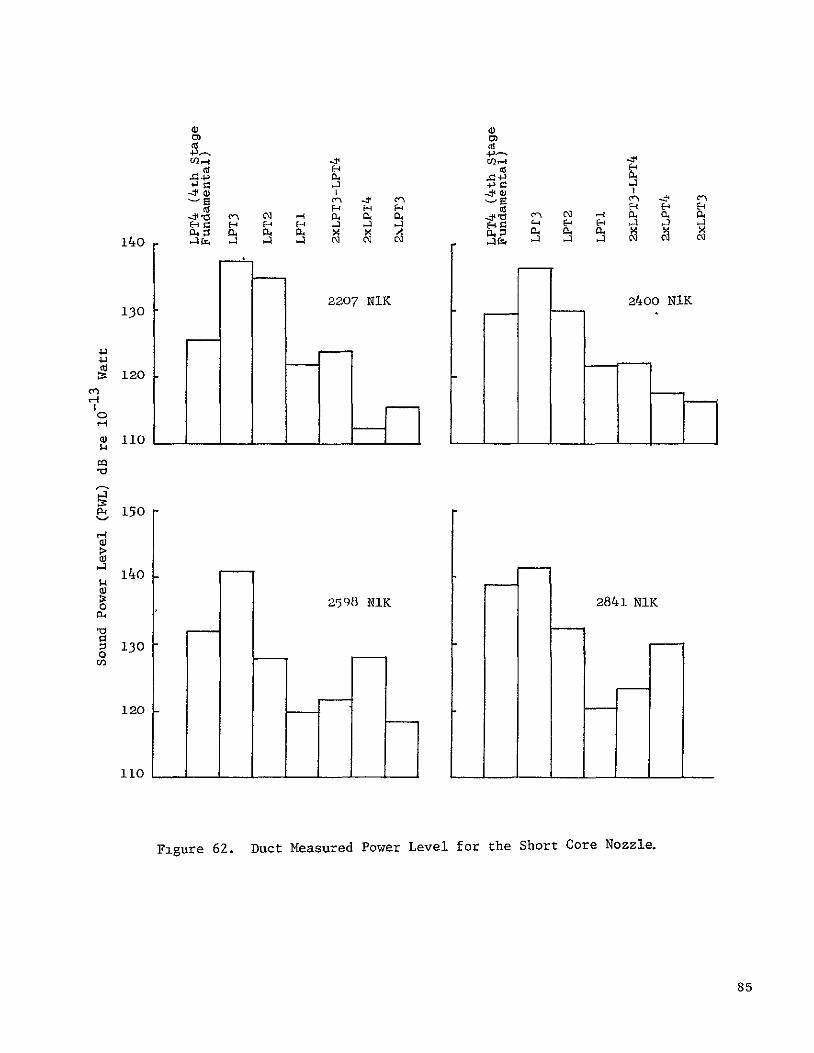
C) C
2 0
-±0 -.t w H Z 9- Z
0.41 a4 04 V. a. a.C4
140 A ( N - -3 1
130
4-)
! 120 en
a) 110 _
8150
140
o 2-98 111K 2841 NI1K P4
'130
120
110 ---
Figure 62. Duct Measured Power Level for the Short Core Nozzle.
85
ual's perception of the noise. In order to assess community noise annoyanceas related to a statistical population sampling that accounts for all of theabove variables, the effective perceived noise level (EPNL) was evolved. Current FAA regulations governing aircraft noise are based on EPNL. The regulations specify maximum EPNL as a function of gross takeoff weight for sideline,takeoff (flyover), and approach.
To evaluate the impact of the Short Core Nozzle on the CF6-50 engine community noise levels, simulated EPNL values were analytically obtained usingthe static noise data from this test. It was assumed that t e static PNLdata were measured flight levels recorded at typical aircraft velocities. Nocorrections were applied to estimate flight effects on engine noise. Simulated EPNL values were calculated at power settings typical of the DC-10-30,B-747, and A300B aircraft for approach and takeoff operating conditions.These power conditions and associated altitudes and velocities ire presentedin Table IV.
An analysis of the simulated EPNL values was performed to determinesample statistics for the population mean and variance for each engine configuration (CF6-50 with the Short Core Exhaust and the CF6-50 with theCore Reverser Nozzle). To assess the community noise impact of the Short Core Nozzle engine configuration, the differences between the average EPNL for eachengine configuration at the same thrust were determined and the resultingdelta evaluated against the hypothesis that the engine configurations areacoustically equivalent.
A least square fit of the EPNL data as a function of thrust was determined for each engine configuration using an orthogonal polynomial regressionmodel. The EPNL data were then interpolated to the nominal power settingsshown in Table V to remove data bias produced from thrust set-point scatter.Sample statistics for each power setting were calculated to obtain the samplemean, unbiased variance for the sample, and the pooled variance for the entireengine configuration data sample. The differences between the sample means(delta) were used to determine the change in community noise obtained with theShort Core Nozzle. The statistical parameters obtained from this analysisthat were used to construct confidence bands for the deltas between samplemeans are summarized in Table VI.
The hypothesis that the engine configurations are acoustically equivalentwas evaluated by comparing the magnitude of the deltas to the 90% confidenceband for the difference between sample means obtained from the pooled variance,centered about zero. Results of this evaluation are shown in Figure 63. TheShort Core Nozzle noise levels are "statistically equivalent" to those of theCore Reverser Nozzle if the delta value lies within the 90% confidence band,"statistically less than" if below the lower band limit, and "statisticallygreater than" if above the upper band limit.
As shown in Figure 63, the deltas between the subject engine configurations are always within or below the 90% band limits. Based on the aboveanalysis, these results imply that community noise levels for the CF6-50with the Short Core Nozzle are equivalent to or less than the CF6-50 withthe Core Reverser Nozzle engine configuration.
86
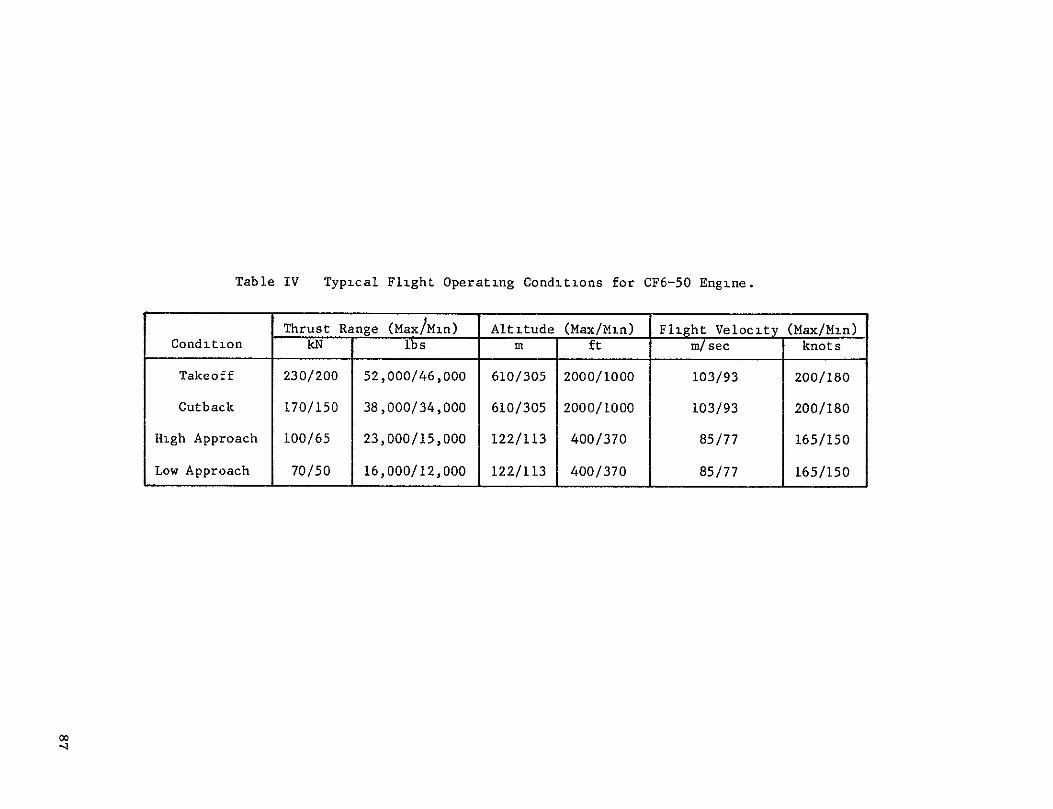
Table IV Typical Flight Operating Conditions for CF6-50 Engine.
Thrust Range (Max/Mn) Altitude (Max/Min) Flight Velocity (Max/Min)Condition kN lbs m ft m/sec knots
Takeoff 230/200 52,000/46,000 610/305 2000/1000 103/93 200/180
Cutback 170/150 38,000/34,000 610/305 2000/1000 103/93 200/180
High Approach 100/65 23,000/15,000 122/113 400/370 85/77 165/150
Low Approach 70/50 16,000/12,000 122/113 400/370 85/77 165/150
~-4
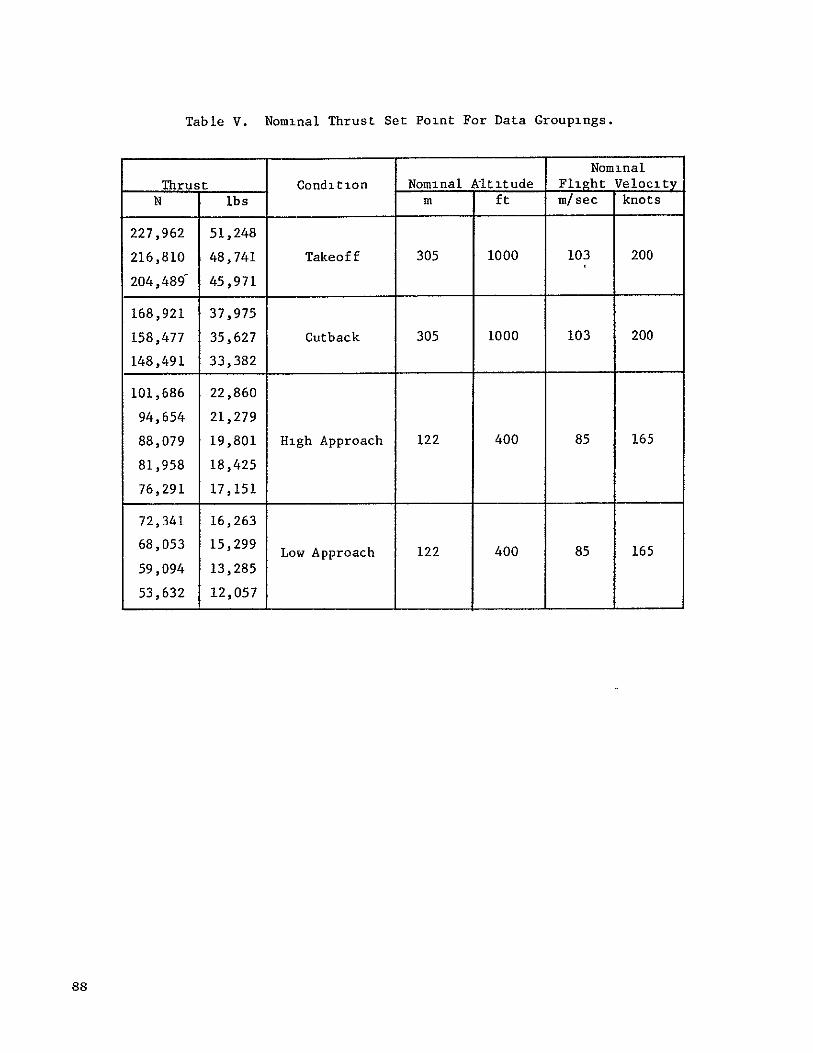
Table V. Nominal Thrust Set Point For Data Groupings.
Nominal
Thrust Condition Nominal Altitude Flight Velocity
N lbs m ft m/sec knots
227,962 51,248
216,810 48,741 Takeoff 305 1000 103 200
204,489 45,971
168,921 37,975
158,477 35,627 Cutback 305 1000 103 200
148,491 33,382
101,686 22,860
94,654 21,279
88,079 19,801 High Approach 122 400 85 165
81,958 18,425
76,291 17,151
72,341 16,263
68,053 15,299 Low Approach 122 400 85 165
59,094 13,285
53,632 12,057
88
Table VI. StatistLcal Parameters.
Engine 90% Confidence BandCondition Configuration 62 v N t(v) Limits on AEPNL
CF6-50 0.0280 19 3Takeoff w/Short Core Nozzle
andCutback CF6-50 0.0595 19 3
w/Core Reverser NozzlePooled 0.0438 38 1.684 ±0.29
CF6-50 0.1473 25 3w/Short Core Nozzle
ApproachCF6-50 0.1572 26 3
w/Core Reverser NozzlePooled 0.1523 51 1.678 ±0.54
Notes
02 Pooled unbiased estimate of sample variance
Up2 = Pooled unbiased estimate of configuration sample variance
v= Degrees of freedom of sample
N = Number of data samples comprising sample mean at each nominal thrust
t(v) = "c" statistic for v degrees of freedom, 95th percentile
90% Confidence Band limits for H O " AEPNL = 0, ±t(v) ap
He = Statistical hypothesis
N1 = Number of data samples comprising sample mean of Core Reverser Nozzle at each nominal thrust
N2 = Number of data samples comprising sample mean of Short Cord. .. Nozzle at each nominal thrust
N N 0 -0.8.900 Confidence Interval
Low Approach High Approach on LEPNL = 0.0 s- .0.6
(1) +0.4 ..... ".... Cutback Takeoff ............................. oii ....
0.:............... . .................iiiii............ .. ::iiii !!!i !!!i!!i~~iliili~ll ................
H . .::::.:.:::.:.:.:.:.:.:.:
. . . . . . .PO-0.2 . ..
.............
-0.4 o.......................................x
Q)
4
1z -0.8
Thrust -R
60.0 80.0 100.0 120.0 140.0 160.0 180.0 200.0 220.0 240.0
P4 10.0 15.0 20.0 25.0 30.0 35.0 40.0 45.0 50.0 55.0
Thrust - lb
Figure 63. Change in Community Noise Obtained With the CF6-50 Engine With the Short Core Nozzle.:
Based upon tatLIc back-to-back testing, the CF6-50 engine with a ShortCore Nozzle produces almost identlcal community noise levels as the CF6-50engine with a Core Reverser Nozzle when operated at identical corrected thrustand flight conditions. Results presented within this report document that thedominant noise components of the CF6-50 engine (fan, LPT, and core jet) werenot significantly impacted by the Short Core Nozzle.
Small changes in the directivity pattern of the third stage LPT fundamental BPF tone were observed for the Short Core Nozzle when compared to the CoreReverser Nozzle. The acoustic treatment suppression performance of the ShortCore Nozzle may have produced this change but no definitive conclusions couldbe drawn as a result of the LPT third stage tone modulation and scattering byengine exhaust turbulence. It is predicted that this result will not affectaircraft flyover noise characteristics with the possible exception of aircraftoperating at very low power approach flight conditions. Even at this condition, however, the overall system EPNL should not increase.
91
7.0 ENDURANCE TEST
7 1 TEST CONFIGURATION
Endurance testing of the Short Core Nozzle was conducted on a CF6-50Cconfiguration engine. Standard flight-type fan reverser doors and prototypecore cowling were installed on the engine The Short Core Nozzle outer cowland centerbody shown in Figures 64 through 66 were installed.
7.2 TEST FACILITY
In endurance testing of engine cowling, it has proven more representativeto perform these tests in an outdoor test site rather than an enclosed testcell to avoid pressure/noise perturbations from the cell walls. For reasons ofsite availability, it was decided to utilize the Edwards Flight Test Centeroutdoor test facility for endurance testing. The test site used was GeneralElectric's Test Site MB4 which is shown in Figure 67.
7.3 TEST PROCEDURE
Following the mechanical checkout, break-in run, and a short engineperformance analysis test, the engine was placed on "C" cycle enduranceA "C" cycle is a 15 minute cycle that simulates the transient movementsmade during a typical airline flight Figure 68 gives a graphical presentation of the cycle. The mission mix of exhaust gas temperatures wasselected to simulate the distribution of takeoff temperatures seen in airline service. If the required exhaust gas temperature could not be reachedwithout exceeding fan speed limits, the engine was shut down and bleed pipeswere installed The mixture of cycle was.
Takeoff EGT, 0 C (0 F) Number of Cycles
Below 878 (1613) 150 879 (1614) 914 (1678) 350 915 (1679) - 942 (1728) 300 943 (1729) - 950 (1742) 100 951 (1743) - 960 (1760) 100
Total 1000
7.4 TEST RESULTS
A detailed visual inspection upon completion of endurance testing of theShort Core Nozzle indicated that'there was no sign of distress after the completion of the 1000 endurance cycles. A formal dye-penetrant inspection corroborated these findings.
92
Figure 64. Disassembled Short Core Nozzle - View A.
OPst0 a
AFT CENTERBODY
iFORWARD
CENTERBODY
~SOUND TREATMENT
Figure 65. Disassembled Short Core Nozzle - View B.
C942
AFT CENTERBODY
FORWARDCENTERBODY
O0TER i
L. CORE COWL SUPPORT V• WEAR STRIPS
Figure 66. Disassembled Short Core Nozzle - View C.
95
A I
Figure 67. CF6-50 Engine at General Electric Test Site MB4, Edwards AFB.
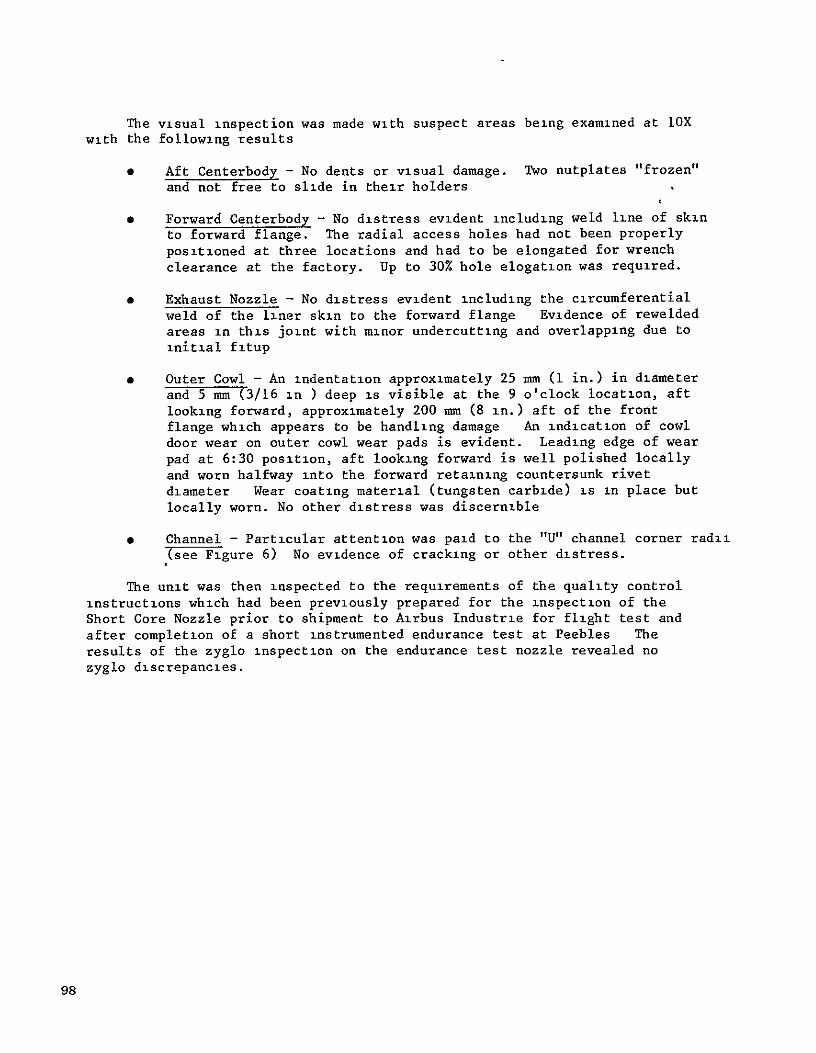
The visual inspection was made with suspect areas being examined at loXwith the following results
* Aft Centerbody - No dents or visual damage. Two nutplates "frozen"and not free to slide in their holders
* Forward Centerbody - No distress evident including weld line of skinto forward flange. The radial access holes had not been properlypositioned at three locations and had to be elongated for wrench
clearance at the factory. Up to 30% hole elogation was required.
* Exhaust Nozzle - No distress evident including the circumferential
weld of the liner skin to the forward flange Evidence of rewelded
areas in this joint with minor undercutting and overlapping due toinitial fitup
* Outer Cowl - An indentation approximately 25 mm (1 in.) in diameterand 5 mm (3/16 in ) deep is visible at the 9 o'clock location, aftlooking forward, approximately 200 mm (8 in.) aft of the frontflange which appears to be handling damage An indication of cowldoor wear on outer cowl wear pads is evident. Leading edge of wear
pad at 6:30 position, aft looking forward is well polished locallyand worn halfway into the forward retaining countersunk rivetdiameter Wear coating material (tungsten carbide) is in place butlocally worn. No other distress was discernible
* Channel - Particular attention was paid to the "U" channel corner radiis-eeFigure 6) No evidence of cracking or other distress.
The unit was then inspected to the requirements of the quality controlinstructions which had been previously prepared for the inspection of theShort Core Nozzle prior to shipment to Airbus Industrie for flight test andafter completion of a short instrumented endurance test at Peebles Theresults of the zyglo inspection on the endurance test nozzle revealed nozyglo discrepancies.
98
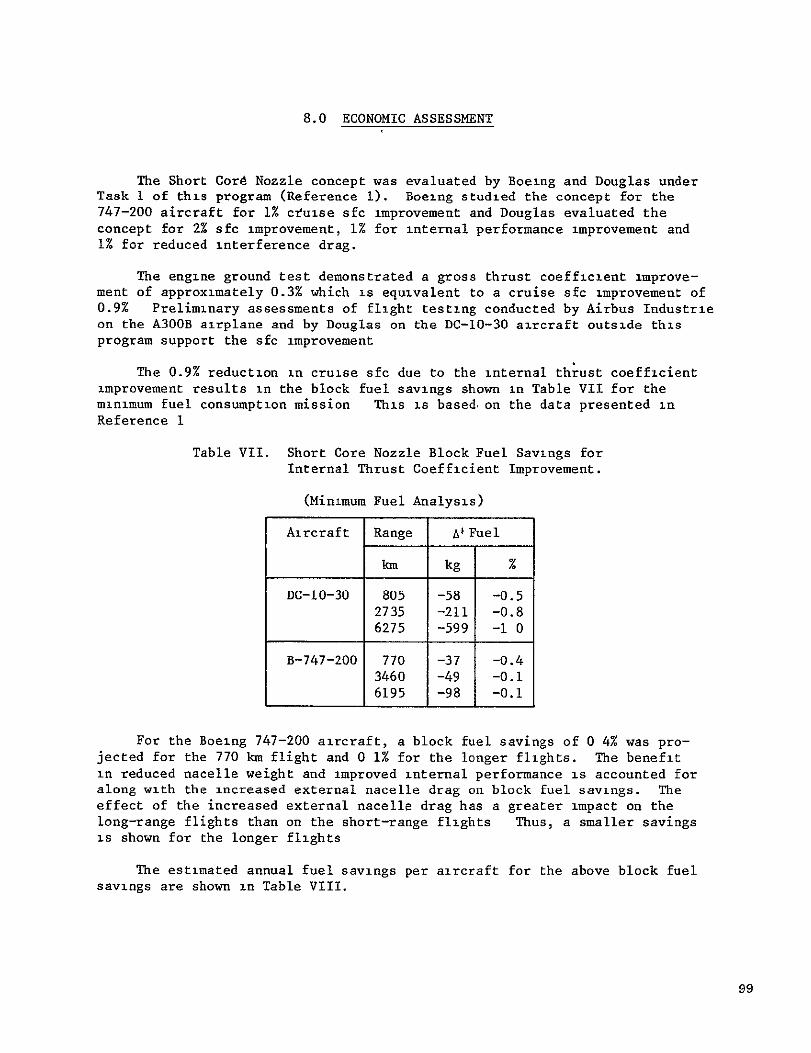
8.0 ECONOMIC ASSESSMENT
The Short Cord Nozzle concept was evaluated by Boeing and Douglas underTask I of this program (Reference 1). Boeing studied the concept for the747-200 aircraft for 1% ceuise sfc improvement and Douglas evaluated theconcept for 2% sfc improvement, 1% for internal performance improvement and1% for reduced interference drag.
The engine ground test demonstrated a gross thrust coefficient improvement of approximately 0.3% which is equivalent to a cruise sfc improvement of0.9% Preliminary assessments of flight testing conducted by Airbus Industrieon the A300B airplane and by Douglas on the DC-l0-30 aircraft outside thisprogram support the sfc improvement
The 0.9% reduction in cruise sfc due to the internal thrust coefficientimprovement results in the block fuel savings shown in Table VII for theminimum fuel consumption mission This is based,on the data presented inReference I
Table VII. Short Core Nozzle Block Fuel Savings forInternal Thrust Coefficient Improvement.
(Minimum Fuel Analysis)
Aircraft Range AtFuel
km kg %
DC-10-30 805 2735 6275
-58 -211 -599
-0.5 -0.8 -1 0
B-747-200 770 -37 -0.4 3460 -49 -0.1 6195 -98 -0.1
For the Boeing 747-200 aircraft, a block fuel savings of 0 4% was projected for the 770 km flight and 0 1% for the longer flights. The benefitin reduced nacelle weight and improved internal performance is accounted foralong with the increased external nacelle drag on block fuel savings. Theeffect of the increased external nacelle drag has a greater impact on thelong-range flights than on the short-range flights Thus, a smaller savings is shown for the longer flights
The estimated annual fuel savings per aircraft for the above block fuelsavings are shown in Table VIII.
99
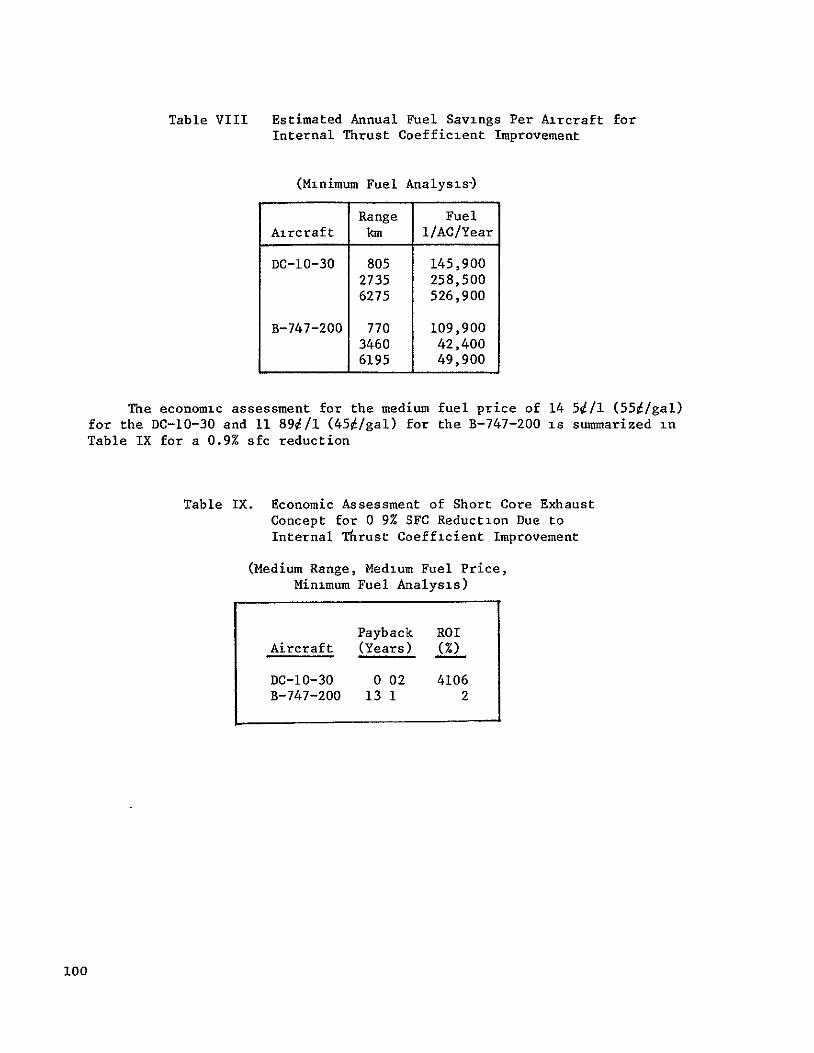
Table VIII Estimated Annual Fuel Savings Per Aircraft forInternal Thrust Coefficient Improvement
(Minimum Fuel Analysis)
Range Fuel Aircraft km i/AC/Year
DC-10-30 805 145,900 2735 258,500 6275 526,900
B-747-200 770 109,900 3460 42,400 6195 49,900
The economic assessment for the medium fuel price of 14 5j/1 (55U/gal)for the DC-10-30 and 11 89J/1 (451/gal) for the B-747-200 is summarized inTable IX for a 0.9% sfc reduction
Table IX. Economic Assessment of Short Core Exhaust Concept for 0 9% SFC Reduction Due toInternal Thrust Coefficient Improvement
(Medium Range, Medium Fuel Price,Minimum Fuel Analysis)
Payback ROI Aircraft (Years) (%)
DC-10-30 0 02 4106B-747-200 13 1 2
100
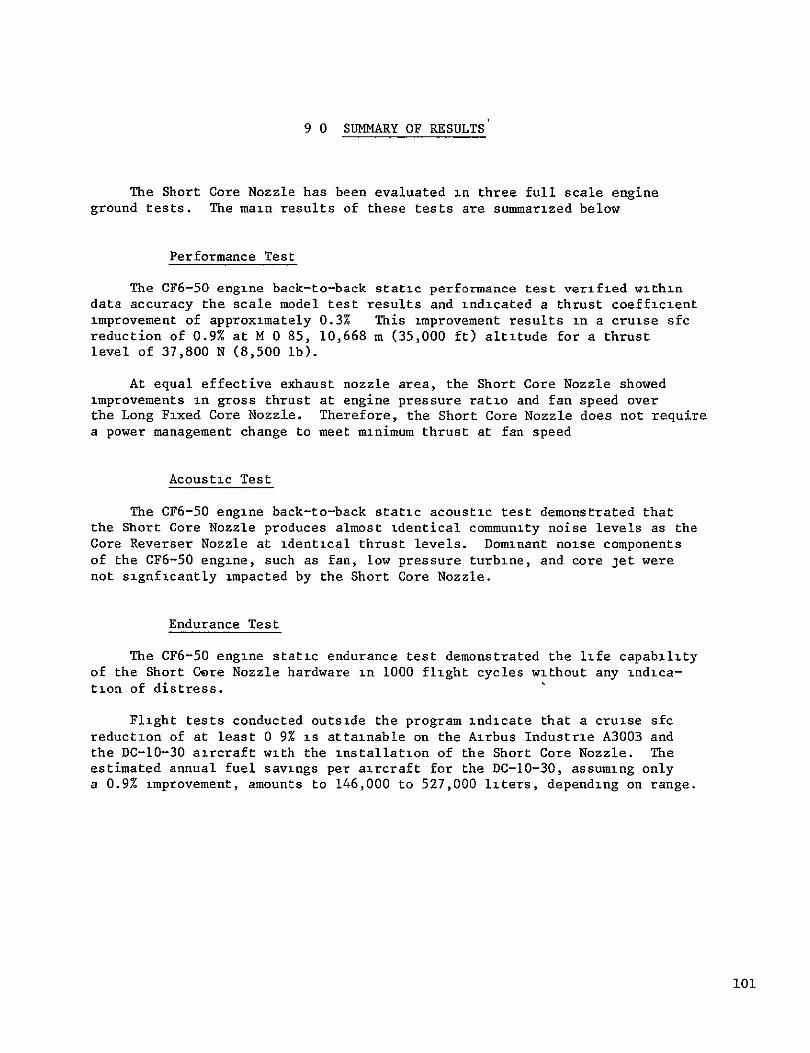
9 0 SUMMARY OF RESULTS
The Short Core Nozzle has been evaluated in three full scale engineground tests. The main results of these tests are summarized below
Performance Test
The CF6-50 engine back-to-back static performance test verified withindata accuracy the scale model test results and indicated a thrust coefficientimprovement of approximately 0.3% This improvement results in a cruise sfcreduction of 0.9% at M 0 85, 10,668 m (35,000 ft) altitude for a thrustlevel of 37,800 N (8,500 ib).
At equal effective exhaust nozzle area, the Short Core Nozzle showedimprovements in gross thrust at engine pressure ratio and fan speed overthe Long Fixed Core Nozzle. Therefore, the Short Core Nozzle does not requirea power management change to meet minimum thrust at fan speed
Acoustic Test
The CF6-50 engine back-to-back static acoustic test demonstrated thatthe Short Core Nozzle produces almost identical community noise levels as theCore Reverser Nozzle at identical thrust levels. Dominant noise components of the CF6-50 engine, such as fan, low pressure turbine, and core jet werenot signficantly impacted by the Short Core Nozzle.
Endurance Test
The CF6-50 engine static endurance test demonstrated the life capabilityof the Short Core Nozzle hardware in 1000 flight cycles without any indication of distress.
Flight tests conducted outside the program indicate that a cruise sfcreduction of at least 0 9% is attainable on the Airbus Industrie A300B andthe DC-10-30 aircraft with the installation of the Short Core Nozzle. Theestimated annual fuel savings per aircraft for the DC-10-30, assuming onlya 0.9% improvement, amounts to 146,000 to 527,000 liters, depending on range.
101
APPENDIX A
QUALITY ASSURANCE
INTRODUCTION
The quality program applied to this contract is a documented systemthroughout the design, manufacture, repair, overhaul, and modificationcycle for gas turbine aircraft engines. The quality system has been constructed to comply with military specifications MIL-Q-9858A, MIL-I-45208,and MIL-C-45662 and Federal Aviation Regulations FAR-145 and applicableportions of FAR-21.
The quality system and its implementation are defined by a complete
set of procedures which has been coordinated with the DOD and FAA and whichhas their concurrence In addition, the quality system as described inthe quality program for this contract is consistent with the requirementsestablished by NASA-Lewis Research Center. The following is a brief synopsis of
the requirements established by this system.
QUALITY SYSTEMS
The quality system is documented by operating procedures which coordinate
the quality-related activities in the functional areas of Engineering, Manufacturing- Materials, Purchasing, and Engine Programs The quality systemis a single-standard system wherein all product lines are controlled bythe common quality system. The actions and activities associated with determination of quality are recorded, and documentation is available for review.
Inherent in the system is the assurance of conformance to the qualityrequirements This includes material verification and the performance ofrequired inspections and tests. In addition, the system provides change
control requirements which assure that design changes are incorporated intomanufacturing, procurement and quality documentation, and into the products.
Measuring devices used for product acceptance and instrumentation used to
control, record, monitor, or indicate results of readings during inspection
and test are initially inspected and calibrated and periodically are reverified or recalibrated at a prescribed frequency. Such calrbration is performed by technicians against standards which are traceable to the National
Bureau of Standards. The gages are identified by a control number and are ona recall schedule for reverification and calibration. The calibration func
tion maintains a record of the location of each gage and the date it requiresrecalibration. Instructions implement the provisions of MIL-C-45662 and theappropriate FAR requirements.
IRECEDING PAGE BL M L 103
Work sent to outside vendors is subject to quality plans which providefor control and appraisal to assure conformance to the technical requirements.Purchase orders issued to vendors contain a,technical description of the workto be performed and instructions relative to quality requirements
Engine parts are inspected to documented quality plans which define thecharacteristics to be inspected, the gages and tools to be used, the conditions under which the inspection is to be performed, the sampling plan,laboratory and special process testing, and the identification and recordrequirements
Work instructions are issued for compliance by operators, inspectors,testers, and mechanics Component part manufacture provides for laboratoryoverview of all special and critical processes, including qualification andcertification of personnel, equipment and processes.
When work is performed in accordance with work instructions, the operator/inspector records that the work has been performed. This is accomplished by the operator/inspector stamping or signing the operation sequencesheet to signify that the operation has been performed.
Various designs of stamps are used to indicate the inspection status ofwork in-process and finished items. Performance or acceptance of specialprocesses is indicated by distinctive stamps assigned specifically to personnel performing the process or inspection Administration of the stampsystem and the issuance of stamps are functions of the Quality OperationThe stamps are applied to the paperwork identifying or denoting the itemsrequiring control. When stamping of hardware occurs, only laboratory approvedink is used to assure against damage.
The type and location of other part marking are specified by the designengineer on the drawing to assure effects do not compromise design requirements and part quality.
Control of part handling, storage, and delivery is maintained through theentire cycle Engines and assemblies are stored in special dollies and transportation carts. Finished assembled parts are stored so as to preclude damageand contamination, openings are covered, lines capped and protective coversapplied as required.
Nonconforming hardware is controlled by a system of material review atthe component source Both a Quality representative and an Engineeringrepresentative provide the accept (use-as-is or repair) decLsions Nonconformances are documented, including the disposition and, corrective action ifapplicable to prevent recurrence
The system provides for storage, retention for specified periods, and retrieval of nonconformance documentation Documentation for components isfiled in the area where the component is manufactured/inspected
104 VA._Jf,11MI>.;J
A buildup record and test log are maintained for the assembly, inspection and test of each manor component or engine. Component and engine testingis performed according to documented test instructions, test plans and instrumentation plans. Test and instrumentation plans are submitted to NASA forapproval to the testing.
Records essential to the economical and effective operation of the quality program are maintained, reviewed, and used as a basis for action. Theserecords include inspection and test results, nonconforming material findings,laboratory analysis, and receiving inspection.
Maintainability, reliability, and safety are items considered in thebasic design concept and are covered in Section 4.0.
105
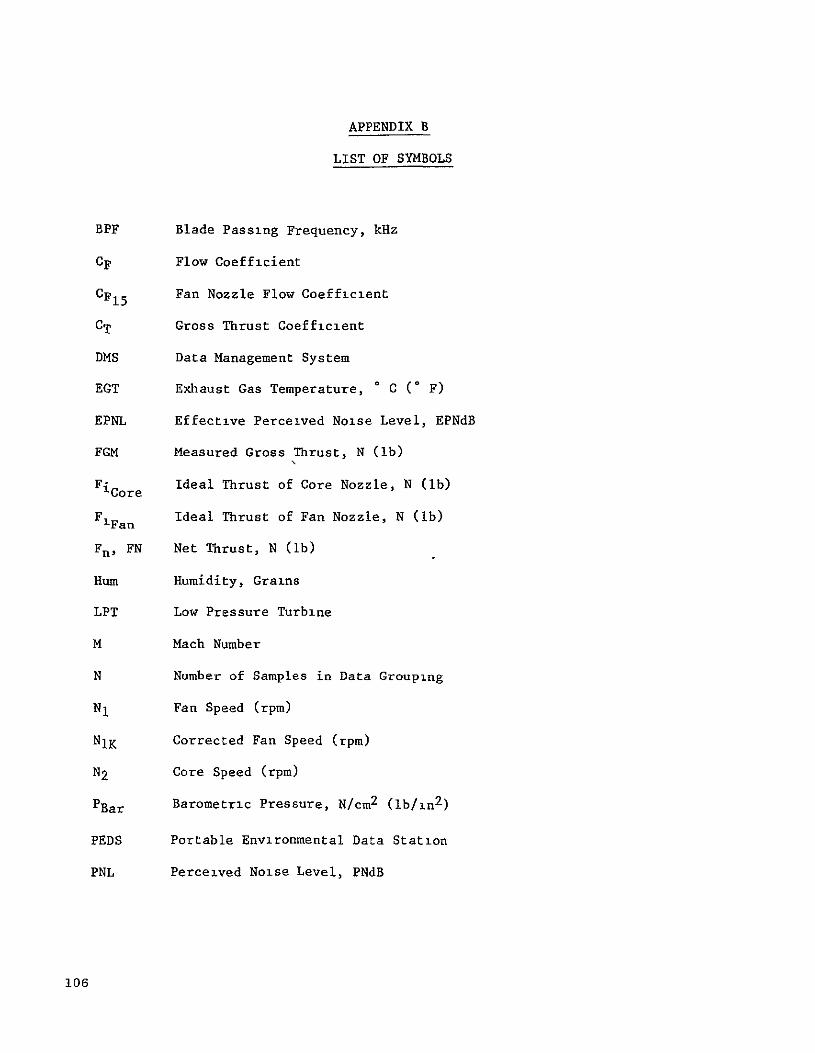
APPENDIX B
LIST OF SYMBOLS
BPF Blade Passing Frequency, kHz
CF Flow Coefficient
CF1 5 Fan Nozzle Flow Coefficient
CT Gross Thrust Coefficient
DMS Data Management System
EGT Exhaust Gas Temperature, 0 C C F)
EPNL Effective Perceived Noise Level, EPNdB
FGM Measured Gross Thrust, N (ib)
FiCore Ideal Thrust of Core Nozzle, N (lb)
FiFan Ideal Thrust of Fan Nozzle, N (ib)
Fn, FN Net Thrust, N (b)
Hum Humidity, Grains
LPT Low Pressure Turbine
M Mach Number
N Number of Samples in Data Grouping
NI Fan Speed (rpm)
NIK Corrected Fan Speed (rpm)
N2 Core Speed (rpm)
PBar Barometric Pressure, N/cm2 (lb/in 2 )
PEDS Portable Environmental Data Station
PNL Perceived Noise Level, PNdB
106
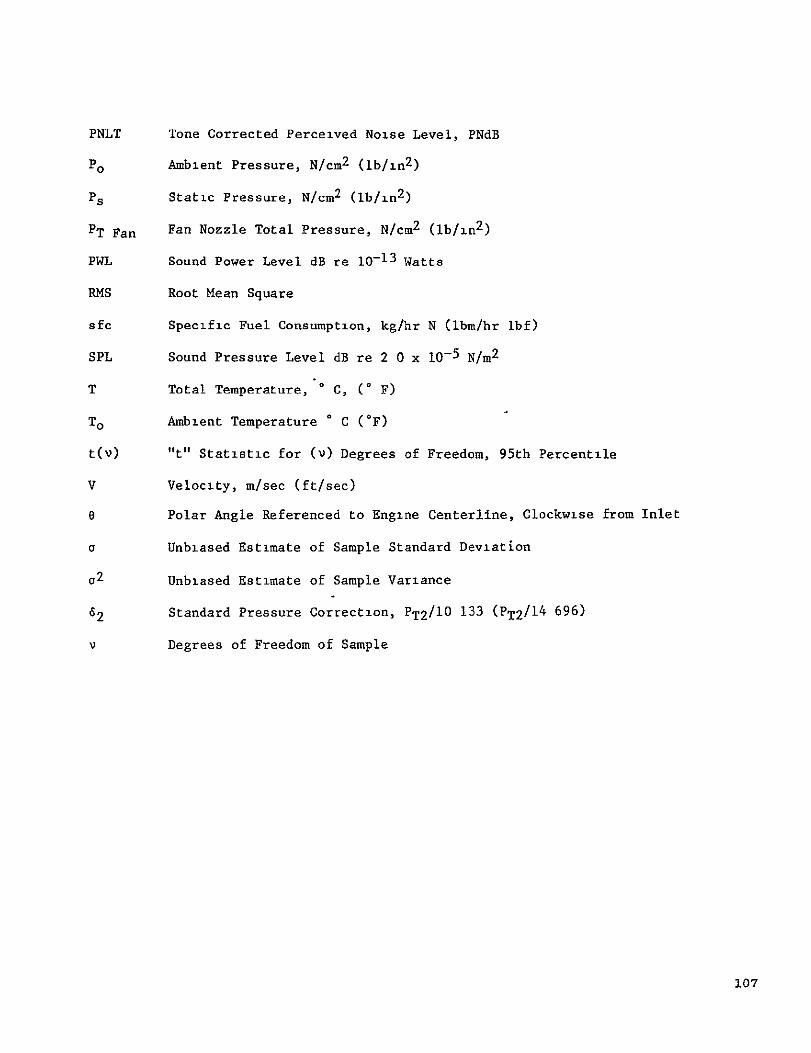
PNLT Tone Corrected Perceived Noise Level, PNdB
PO Ambient Pressure, N/cm2 (lb/in 2)
2PS Static Pressure, N/cm (lb/in 2)
PT Fan Fan Nozzle Total Pressure, N/cm2 (lb/in 2 )
PWL Sound Power Level dB re 10-13 Watts
RMS Root Mean Square
sfc Specific Fuel Consumption, kg/hr N (ibm/hr lbf)
-SPL Sound Pressure Level dB re 2 0 x 10 5 N/m2
T Total Temperature, 0 C, (0 F)
To Ambient Temperature * C (0F)
t(v) "t" Statistic for (V) Degrees of Freedom, 95th Percentile
V Velocity, m/sec (ft/sec)
o Polar Angle Referenced to Engine Centerline, Clockwise from Inlet
o Unbiased Estimate of Sample Standard Deviation
(y2 Unbiased Estimate of Sample Variance
62 Standard Pressure Correction, PT2/10 133 (PT2/14 696)
V Degrees of Freedom of Sample
107
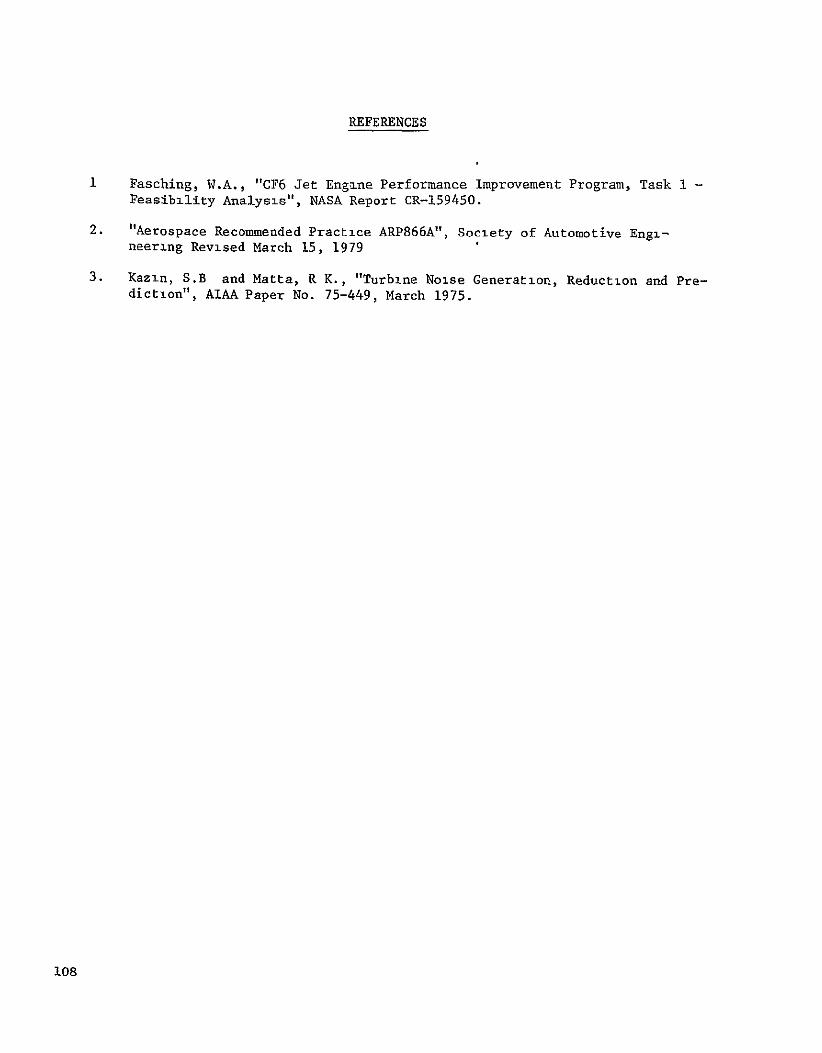
I
REFERENCES
Fasching, W.A., "CF6 Jet Eng-ine Performance Improvement Program, Task I -Feasibility Analysis", NASA Report CR-159450.
2. "Aerospace Recommended Practice ARP866A", Society of Automotive Engineering Revised March 15, 1979
3. Kazin, S.B and Matta, R K., "Turbine Noise Generation, Reduction and Prediction", AIAA Paper No. 75-449, March 1975.
108
COMPANY/PERSONNEL
Nielsen Engineering & Research510 Clyde AvenueMountain View, CA 94043
Dr. William Roberts
TRW Equipment, TRW Inc. 23555 Euclid Avenue Cleveland, OH 44117
C. S. Kortovich
Richard A. Whitaker
Electronic Supply divisionESB/OCNG MS 34Hanscom AFB, MA 01731
Major Robert P. Couch
Computer Avionics Corporation120 Charcot AvenueSan Jose, CA 95131
Milton E. Gregory
General Electric Company
AFPRO (Det. 28)Cincinnati, OH 45215
R. Glindmeyer/Mail Drop N-iChief, Plans Requirements & Eval. Branch
109
AUG 08197. NASA/LeRC Approved Distribution List
COMPANY/PERSONNEL COMPANYIPERSONNEL
National Aeronautics & Space Robert E. Jones/60-6Administration
Washington, DC 20546 Lawrence P. Ludwig/23-2Dr James J. Krarner/R
Harold E. Rohlik/77-2Dr. Raymond S. Colladay/RJP-2 C(sqi!S) I
Tita'T. Serafini/49-1George C. Deutsch/RT-6
Kenneth E. Skeels/500-305William S. Aiken/RD-5
Lewis LibraryIS-3 (2-capes.)Harry W. Johnson/RJG-4
Report Control/5-5 C. Robert Nysmith/RP-4
NASA Langley Research CenterRichard A. Rudey/RTP-6 Hampton, VA 23665
SRobert W. Leonard, Dr./158Stafford W. Wilbur/RJP-4
Ray V.,Hood/158Roger L. Winblade/RHG-5
NASA Ames Research CentdrNASA Lewis Research Center Moffett Field, CA 9403521000 Brookpark Road Louis*J. Williams/237-9Cleveland, Ohio 44135
Dr. John M. Klineberg/3-3 NASA Dryden Flight ResearchPO Box 273
Warner L.Stewart/3-5 Edwards, CA 93523James A. Albers, Dr./2089Donald L. Nored/301-2 William 1. K0o/34820
Joseph A. Ziemianski/301-4 (!copies)
Frank V. Olinger/2093(20copies)John E.McAulay/301-4
NASA Scientific and Technical Edward M. Szanca/301-4 (20_coples) Information Facility
PO Box 8757 Milton A. Beheim/86-1 Balt/Wash Intl Airport, MD 21240
Accessioning Department (3Qcqqie)Robert W. HaH/49-1
Federal Aviation AdministrationMelvin J. Hartmann/5-3 DOT/FAA/NAFEC
ANA-410, Bldgl 211Richard A. Rudey/60-4 Atlantic City, NJ 08405
Gary FringsRobert W Schroeder/500-207
Department of TransporationWilliam J. Anderson/23-2 21000 Second St., SW
Washington, DC 20591Salvatore J. Grisaffe/49-3 Harold True/ARD 550
Marvin H. Hirschberg/49-1 William T.Westfield/ARD 500
Robert S. Zuckerman/ARD 550110
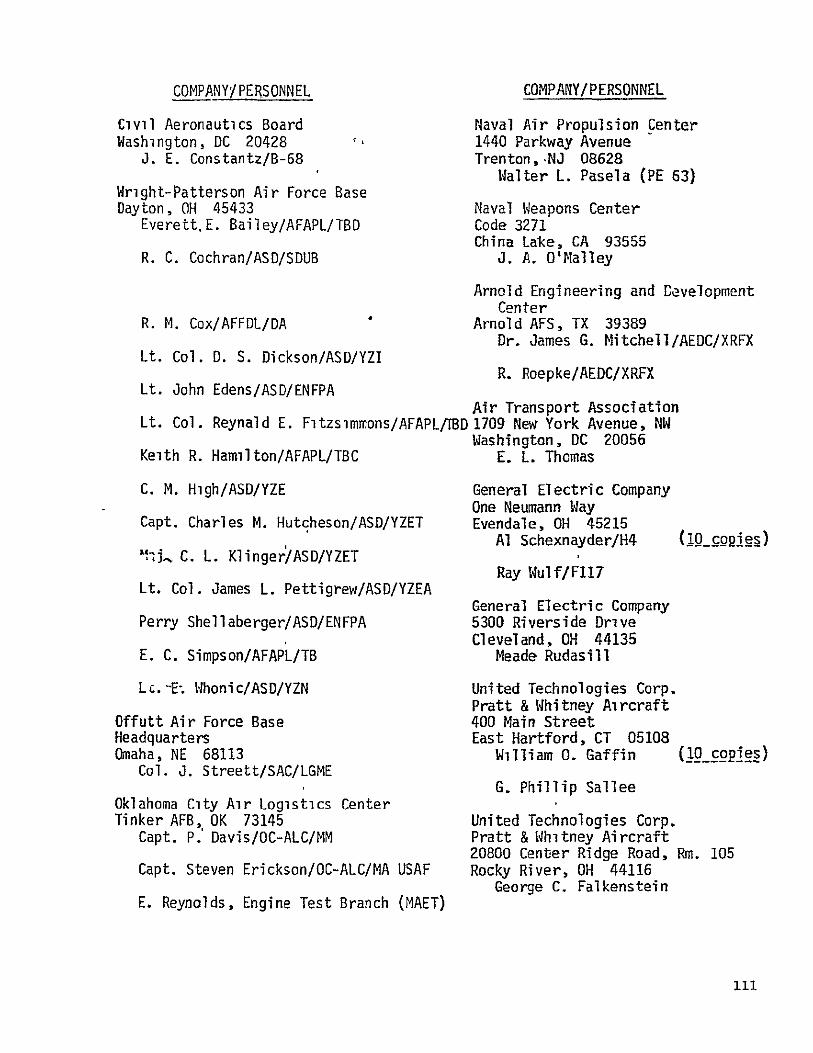
COMPANY/PERSONNEL
Civil Aeronautics Board Washington, DC 20428 L
J. E. Constantz/B-68
Wright-Patterson Air Force Base Dayton, OH 45433
Everett.E. Bailey/AFAPL/TBD
R. C. Cochran/ASD/SDUB
R. M. Cox/AFFDL/DA S
Lt. Col. D. S. Dickson/ASD/YZI
Lt. John Edens/ASD/ENFPA
Lt. Col. Reynald E. Fitzsmmons/AFAPL/TBD 1709 New York Avenue, NW
COMPANY/PERSONNEL
Naval Air Propulsion Center1440 Parkway AvenueTrenton,,NJ 08628
Walter L. Pasela (PE 63)
Naval Weapons CenterCode 3271China Lalke, CA 93555
J. A. O'Nalley
Arnold Engineering and DevelopmentCenter
Arnold AFS, TX 39389Dr. James G. Nitchell/AEDC/XRFX
R. Roepke/AEDC/XRFX
Air Transport Association
Keith R.Hamilton/AFAPL/TBC
C.M. High/ASD/YZE
Capt. Charles M. Hutcheson/ASD/YZET
",t. C. L. Klinger/ASD/YZET
Lt. Col. James L. Pettigrew/ASD/YZEA
Perry Shellaberger/ASD/ENFPA
E. C. Simpson/AFAPL/TB
Le.-E; Whonic/ASD/YZN
Offutt Air Force Base Headquarters Omaha, NE 68113
Col. J. Streett/SAC/LGME
Oklahoma City Air Logistics CenterTinker AFB, OK 73145
Capt. P. Davis/OC-ALC/MM
Capt. Steven Erickson/OC-ALC/MA USAF
E. Reynolds, Engine Test Branch (MAET)
Washington, DC 20056E. L. Thomas
General Electric CompanyOne Neumann WayEvendale, OH 45215
Al Schexnayder/H4 Qg_ggie)
Ray Wulf/F117
General Electric Company5300 Riverside DriveCleveland, CH 44135
Meade Rudasill
United Technologies Corp.Pratt & Whitney Aircraft400 Main StreetEast Hartford, CT 05108
William 0. Gaffin (L9_EoPies)
G. Phillip Sallee
United Technologies Corp.Pratt & Whitney Aircraft20800 Center Ridge Road, Rm. 105Rocky River, OH 44116
George C. Falkenstein
111
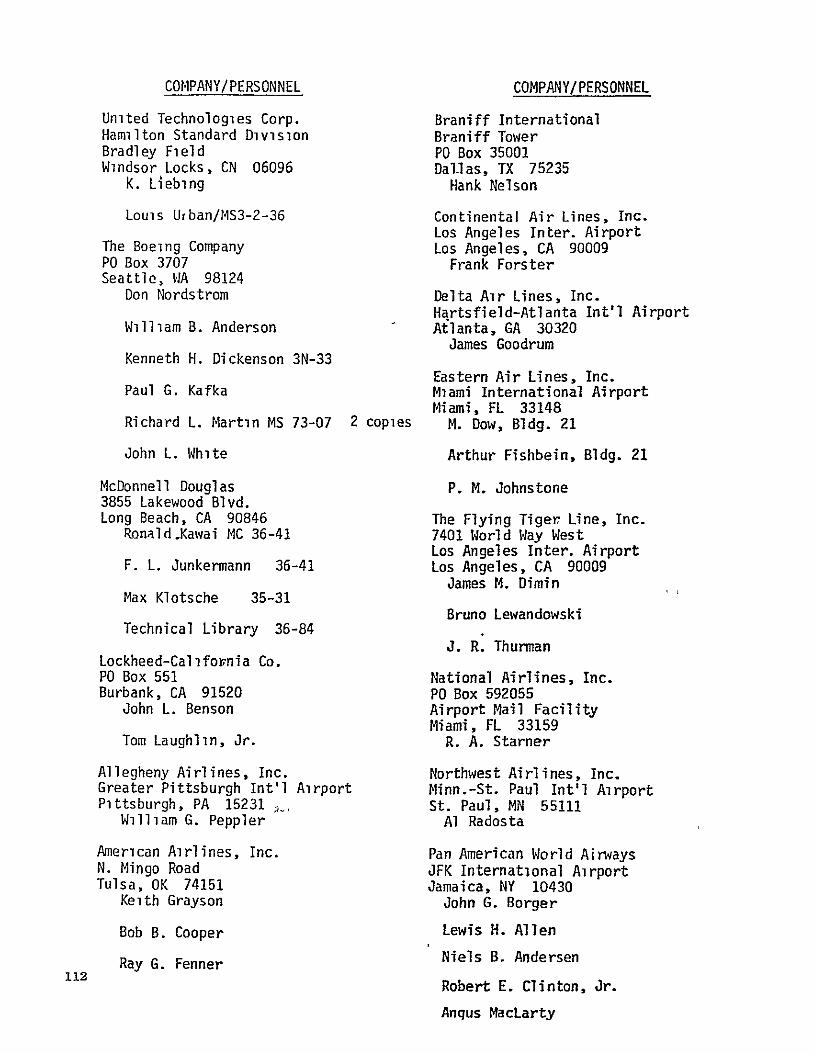
COMPANY/PERSONNEL COMPANY/PERSONNEL
United Technologies Corp. Hamilton Standard Division Bradley Field Windsor Locks, CN 06096
K. Liebing
Louis Urban/MS3-2-36
The Boeing Company PO Box 3707 Seattle, WA 98124
Don Nordstrom
William B. Anderson
Kenneth H. Dickenson 3N-33
Paul G. Kafka
Richard L.Martin MS 73-07 2 copies
John L.White
McDonnell Douglas3855 Lakewood Blvd. Long Beach, CA 90846
Ronald-Kawai MC 36-41
F. L.Junkermann 36-41 35-31Max Klotsche
Technical Library 36-84
Lockheed-California Co. PO Box 551 Burbank, CA 91520
John L. Benson
Tom Laughlin, Jr.
Allegheny Airlines, Inc. Greater Pittsburgh Int'l Airport Pittsburgh, PA 15231 ,
William G. Peppler
American Airlines, Inc. N. Mingo Road Tulsa, OK 74151
Keith Grayson
Bob B. Cooper
Ray G. Fenner
Braniff International Braniff Tower PO Box 35001 Dallas, TX 75235
Hank Nelson
Continental Air Lines, Inc. Los Angeles Inter. AirportLos Angeles, CA 90009
Frank Forster
Delta Air Lines, Inc. Hartsfield-Atlanta Int'l Airport Atlanta, GA 30320
James Goodrum
Eastern Air Lines, Inc. Miami International Airport Miami, FL 33148 M. Dow, Bldg. 21
Arthur Fishbein, Bldg. 21
P. M. Johnstone
The Flying Tiger Line, Inc. 7401 World Way West Los Angeles Inter. Airport Los Angeles, CA 90009
James 14. Dimin
Bruno Lewandowski
J. R. Thurman
National Airlines, Inc. PO Box 592055 Airport Mail Facility Miami, FL 33159 R. A. Starner
Northwest Airlines, Inc. Minn.-St. Paul Int'l Airport St. Paul, MN 55111
Al Radosta
Pan American World Airways JFK International Airport Jamaica, NY 10430
John G. Borger
Lewis H. Allen
Niels B. Andersen Robert E. Clinton, Jr.
Anqus MacLarty
112
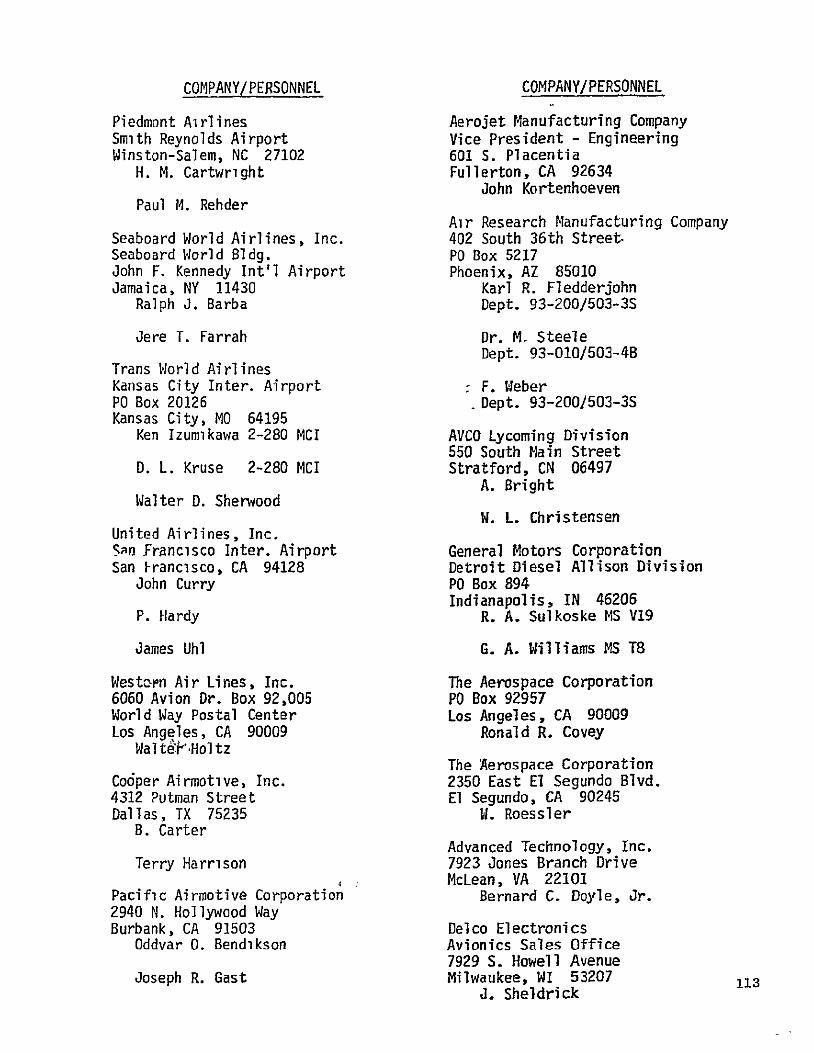
COMPANY/PERSONNEL
Piedmont Airlines Smith Reynolds Airport Winston-Salem, NC 27102
H. M. Cartwright
Paul M. Rehder
Seaboard World Airlines, Inc. Seaboard World Bldg. John F. Kennedy Int'l Airport Jamaica, NY 11430
Ralph J. Barba
Jere T. Farrah
Trans World AirlinesKansas City Inter. Airport PO Box 20126 Kansas City, MO 64195
Ken Izumikawa 2-280 MCI
D.L. Kruse 2-280 MCI
Walter D.Sherwood
United Airlines, Inc.Sn Francisco Inter. Airport San Francisco, CA 94128
John Curry
P.Hardy
James Uhl
Westarn Air Lines, Inc. 6060 Avion Dr. Box 92,005 World Way Postal Center Los Angeles, CA 90009
Wal tgktHol tz
Co6per Airmotive, Inc. 4312 Putman Street Dallas, TX 75235
B. Carter
Terry Harrison
Pacific Airmotive Corporation 2940 N.Hollywood WayBurbank, CA 91503
Oddvar 0. Bendikson
Joseph R. Gast
COMPANY/PERSONNEL
Aerojet Manufacturing CompanyVice President - Engineering601 S. PlacentiaFullerton, CA 92634
John Kortenhoeven
Air Research Manufacturing Company402 South 36th Street.PO Box 5217 Phoenix, AZ 85010
Karl R. FledderjohnDept. 93-200/503-3S
Dr. M. SteeleDept. 93-010/503-4B
F. Weber Dept. 93-2001503-3S
AVCO Lycoming Division550 South Main StreetStratford, CN 06497
A. Bright
W. L. Christensen
General Motors CorporationDetroit Diesel Allison DivisionPO Box 894Indianapolis, IN 46206
R.A. Sulkoske MS V19
G. A. Williams MS T8
The Aerospace Corporation PO Box 92957 Los Angeles, CA 90009
Ronald R. Covey
The Aerospace Corporation2350 East El Segundo Blvd.El Segundo, CA 90245
W. Roessler
Advanced Technology, Inc.7923 Jones Branch DriveMcLean, VA 22101
Bernard C. Doyle, Jr.
Delco ElectronicsAvionics Sales Office7929 S. Howell AvenueMilwaukee, WI 53207
J. Sheldrick113