Embed Size (px)
Citation preview
Extending the SHIPS Hurricane Intensity Forecasts with some
Dynamical Variables.
T. N. Krishnamurti Dept. of Meteorology
Florida State University
Collaborators: A. Bhardwaj, A. Simon and David Zelinsky
March 6, 2012 The 66th Interdepartmental Hurricane Conference (IHC)
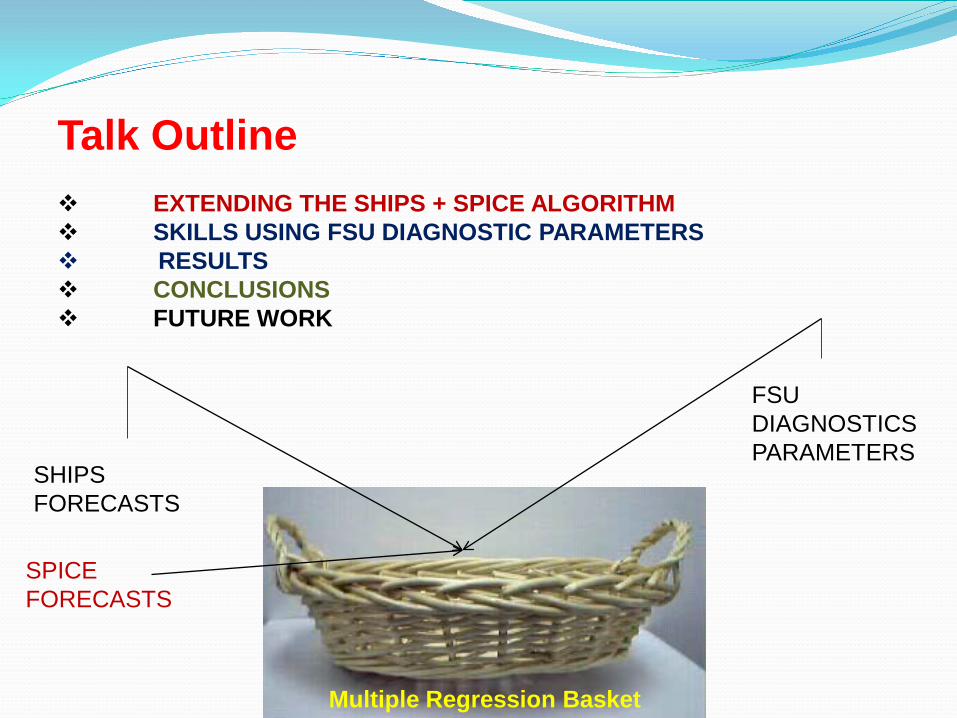
Talk Outline EXTENDING THE SHIPS + SPICE ALGORITHM SKILLS USING FSU DIAGNOSTIC PARAMETERS RESULTS CONCLUSIONS FUTURE WORK
Multiple Regression Basket
SHIPS FORECASTS
FSU DIAGNOSTICS PARAMETERS
SPICE FORECASTS
SHIPS
21 total predictors used Atmospheric Predictors from GFS SST from Reynolds weekly fields Predictors from satellite data
Ocean Heat content from altimetry GOES IR window channel brightness temperature
SHIPS Predictors Persistence
12hr intensity change Max winds at t = 0 (Vmax) Vmax * 12 hr intensity change
Upper Level Temperature 200mb Temperature 250mb Temperature (relative to threshold temperature
of -44 C) Sea Surface Potential
Difference between forecasted Max Potential Intensity and t = 0 intensity
Sea Surface Potential squared GFS Vortex Tendency
Change in GFS 0-600km average symmetric tangential wind at 850mb
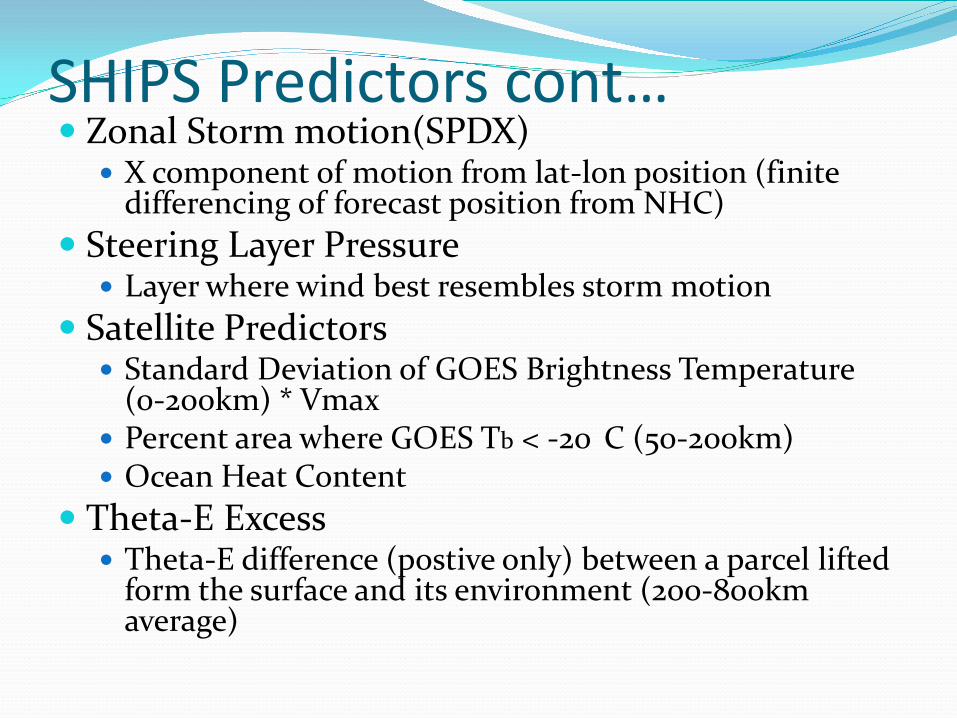
SHIPS Predictors cont… Zonal Storm motion(SPDX)
X component of motion from lat-lon position (finite differencing of forecast position from NHC)
Steering Layer Pressure Layer where wind best resembles storm motion
Satellite Predictors Standard Deviation of GOES Brightness Temperature
(0-200km) * Vmax Percent area where GOES Tb < -20 C (50-200km) Ocean Heat Content
Theta-E Excess Theta-E difference (postive only) between a parcel lifted
form the surface and its environment (200-800km average)
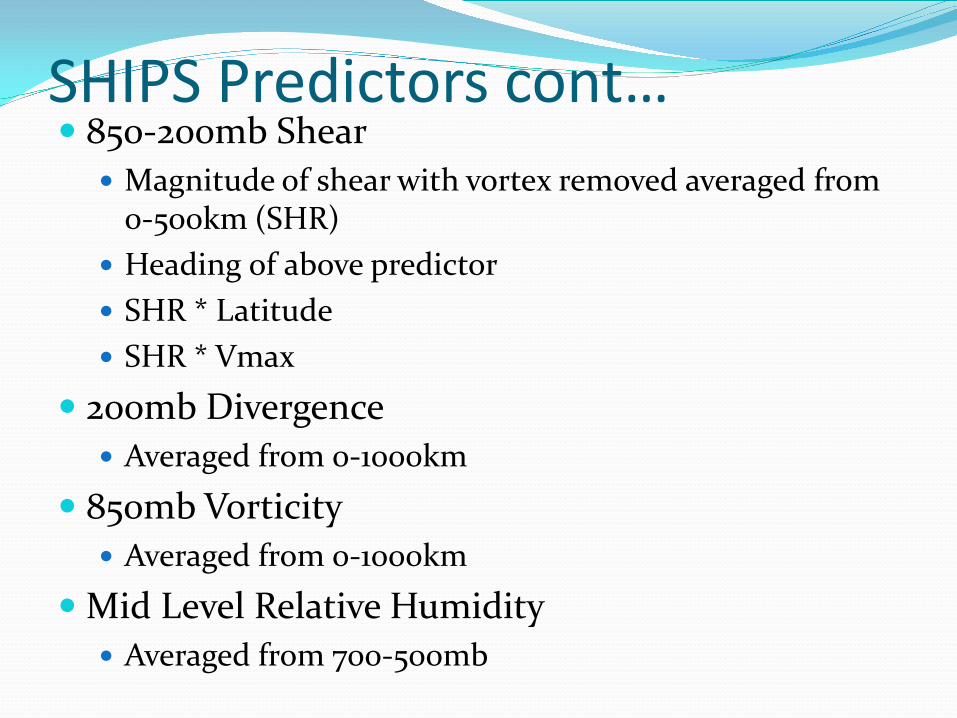
SHIPS Predictors cont… 850-200mb Shear
Magnitude of shear with vortex removed averaged from 0-500km (SHR)
Heading of above predictor SHR * Latitude SHR * Vmax
200mb Divergence Averaged from 0-1000km
850mb Vorticity Averaged from 0-1000km
Mid Level Relative Humidity Averaged from 700-500mb
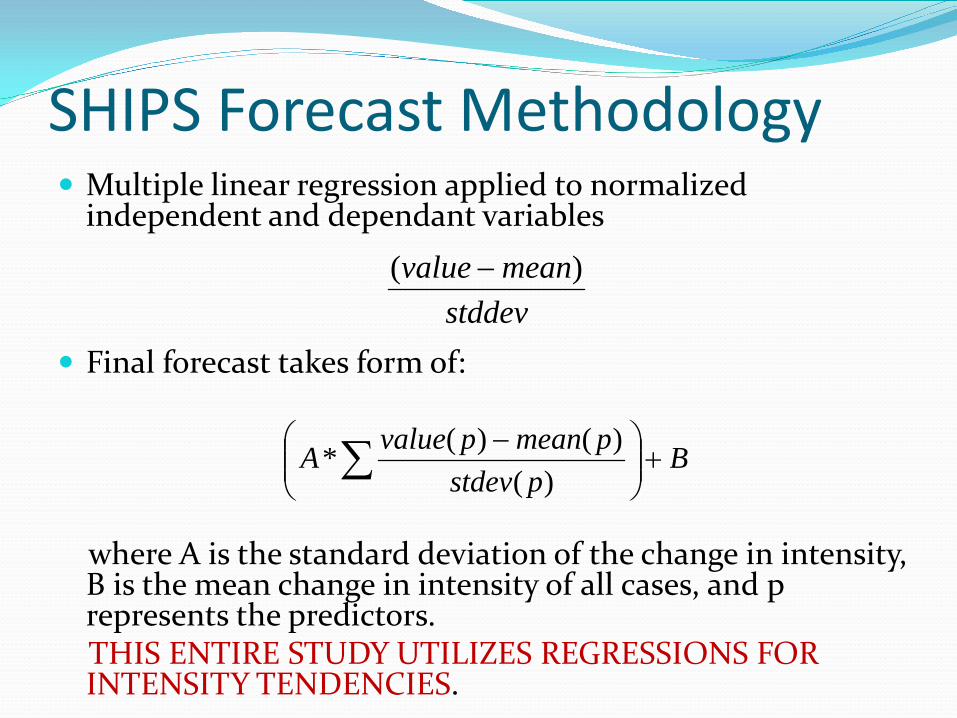
SHIPS Forecast Methodology Multiple linear regression applied to normalized
independent and dependant variables
Final forecast takes form of: where A is the standard deviation of the change in intensity,
B is the mean change in intensity of all cases, and p represents the predictors.
THIS ENTIRE STUDY UTILIZES REGRESSIONS FOR INTENSITY TENDENCIES.
stddevmeanvalue )( −
Bpstdev
pmeanpvalueA +
−∑ )()()(*
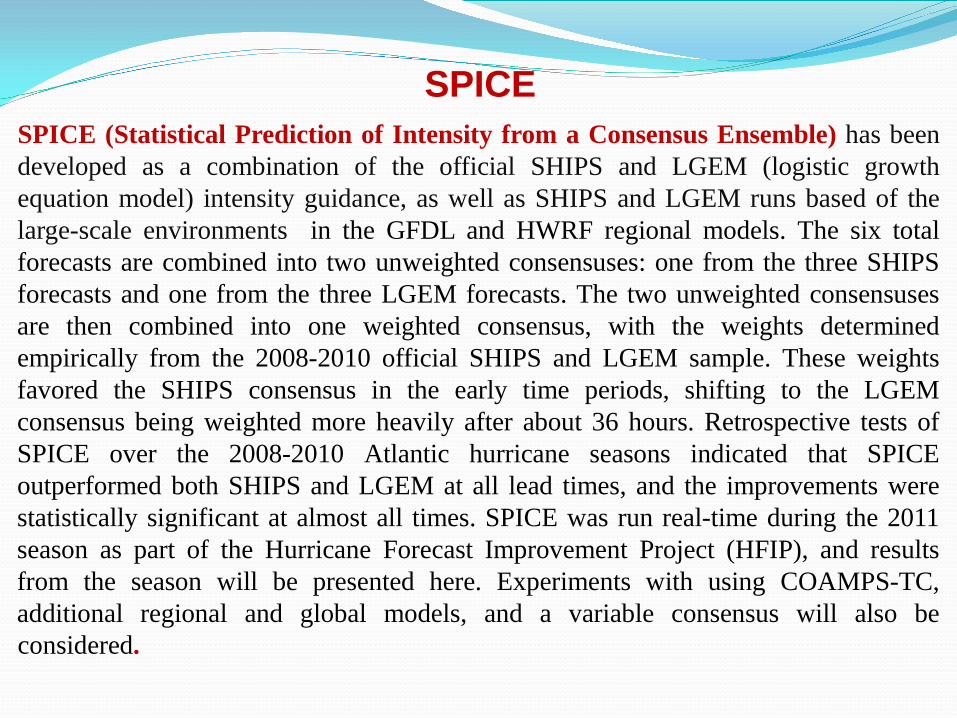
SPICE (Statistical Prediction of Intensity from a Consensus Ensemble) has been developed as a combination of the official SHIPS and LGEM (logistic growth equation model) intensity guidance, as well as SHIPS and LGEM runs based of the large-scale environments in the GFDL and HWRF regional models. The six total forecasts are combined into two unweighted consensuses: one from the three SHIPS forecasts and one from the three LGEM forecasts. The two unweighted consensuses are then combined into one weighted consensus, with the weights determined empirically from the 2008-2010 official SHIPS and LGEM sample. These weights favored the SHIPS consensus in the early time periods, shifting to the LGEM consensus being weighted more heavily after about 36 hours. Retrospective tests of SPICE over the 2008-2010 Atlantic hurricane seasons indicated that SPICE outperformed both SHIPS and LGEM at all lead times, and the improvements were statistically significant at almost all times. SPICE was run real-time during the 2011 season as part of the Hurricane Forecast Improvement Project (HFIP), and results from the season will be presented here. Experiments with using COAMPS-TC, additional regional and global models, and a variable consensus will also be considered.
SPICE

List of FSU Diagnostic Parameters
1. Vertical Differential of Heating
2. Transformation of Shear to Curvature Vorticity
3. Energy Exchange from the Divergent to the Rotational Kinetic Energy in the Inner Core
4. Angular Momentum
DATA SETS USED FOR FSU DIAGNOSTICS: The data sets we used for the extended SHIPS were based on a reanalysis that was provided to us by the HWRF group. It carried the following steps: 1. Start with GFS analysis at T 382L64 , transform grid separation roughly 35 km 2. Remove vortex from GFS using GFDL method , Kurihara et al 3. Use HWRF's 12 hour forecast as a first guess to redefine a new initial vortex 4. Use above within GFS to re-assimilate that vortex along with the dropwindsonde data sets.
For this study we includes 154 forecast segments for every forecast at 12 hour interval between hours 12 to 108 hours. The diagnostic variables: vertical differential of heating (for the complete PV equation), shear to curvature kinematics and the transformation of divergent kinetic energy into rotational kinetic energy are all evaluated from the final HWRF analysis at the 850hPa level. The advection of earths and relative angular momentum are averaged over a three dimensional box that covers the same horizontal area as above, in the vertical the box average extends from the surface to 100 hPa. The domain of these computations is a 10 degree latitude by 10 degree longitude box, with the hurricane located close to the center of the box. These computations are carried out every 12 hours and are designed to provide guidance for 12 hourly intensity forecasts.

Diabatic Potential Vorticity
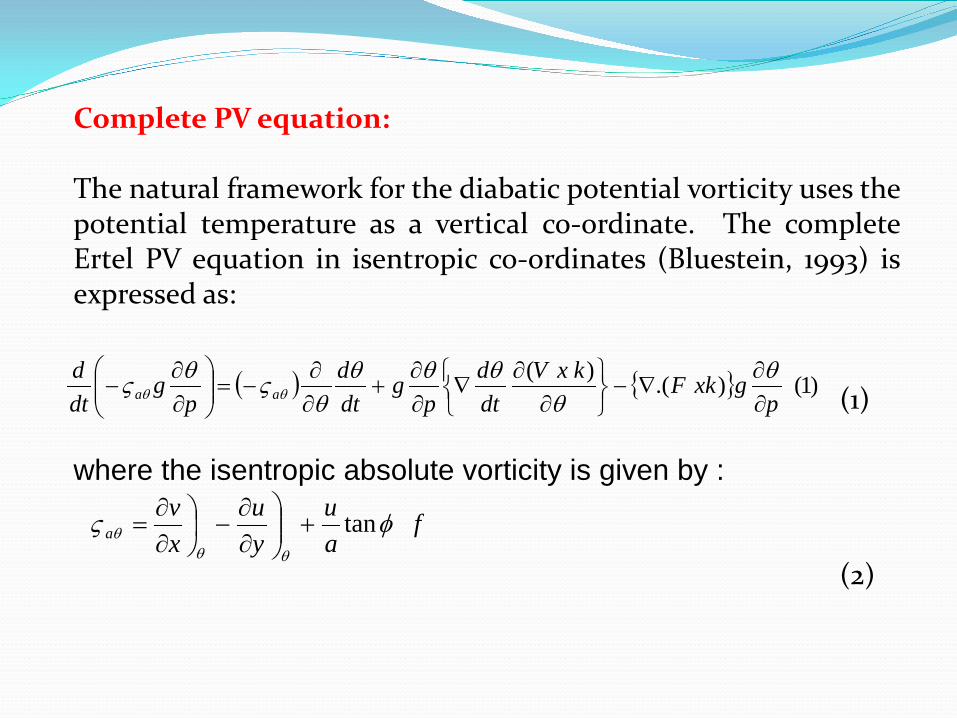
Complete PV equation: The natural framework for the diabatic potential vorticity uses the potential temperature as a vertical co-ordinate. The complete Ertel PV equation in isentropic co-ordinates (Bluestein, 1993) is expressed as: (1) where the isentropic absolute vorticity is given by : (2)
( ) { } )1().()(p
gxkFkxVdtd
pg
dtd
pg
dtd
aa ∂∂
∇−
∂∂
∇∂∂
+∂∂
−=
∂∂
−θ
θθθθ
θςθς θθ
fau
yu
xv
a φςθθ
θ tan+
∂∂
−
∂∂
=
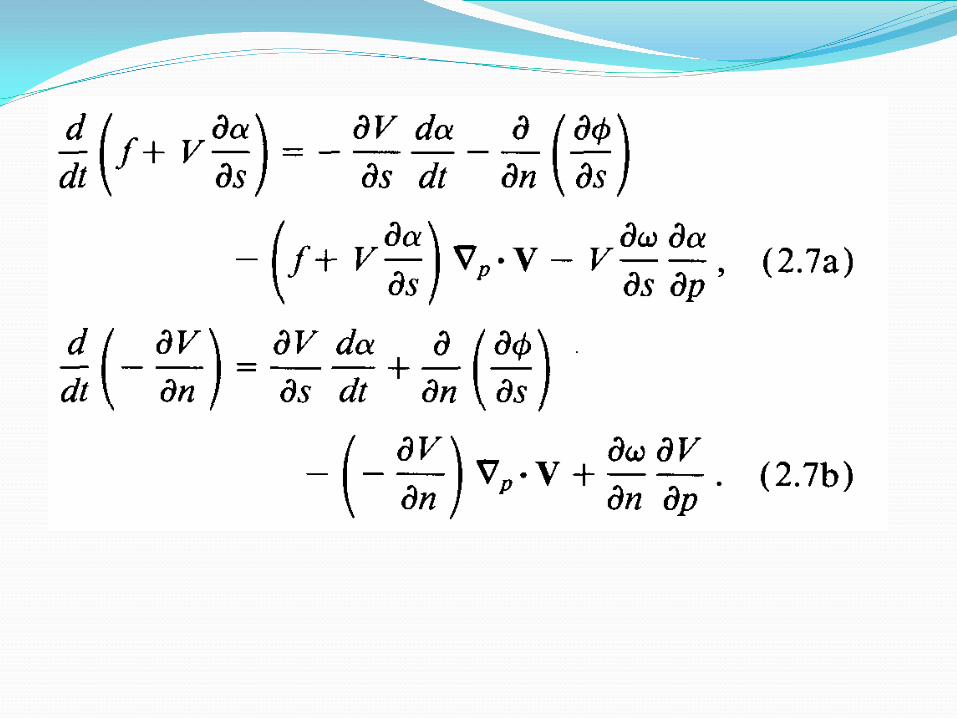
On an isentropic surface, the local rate of change of PV is the sum of (1) horizontal advection of PV; (2) vertical advection of PV; (3) vertical differential of heating; (4) horizontal differential of heating; (5) the friction term. If the last four terms are neglected, equation 4 reduces to the adiabatic equation for the conservation of potential vorticity. Retaining these terms allows us to account for the generation or destruction of potential vorticity arising from the horizontal or vertical heating differentials and friction.
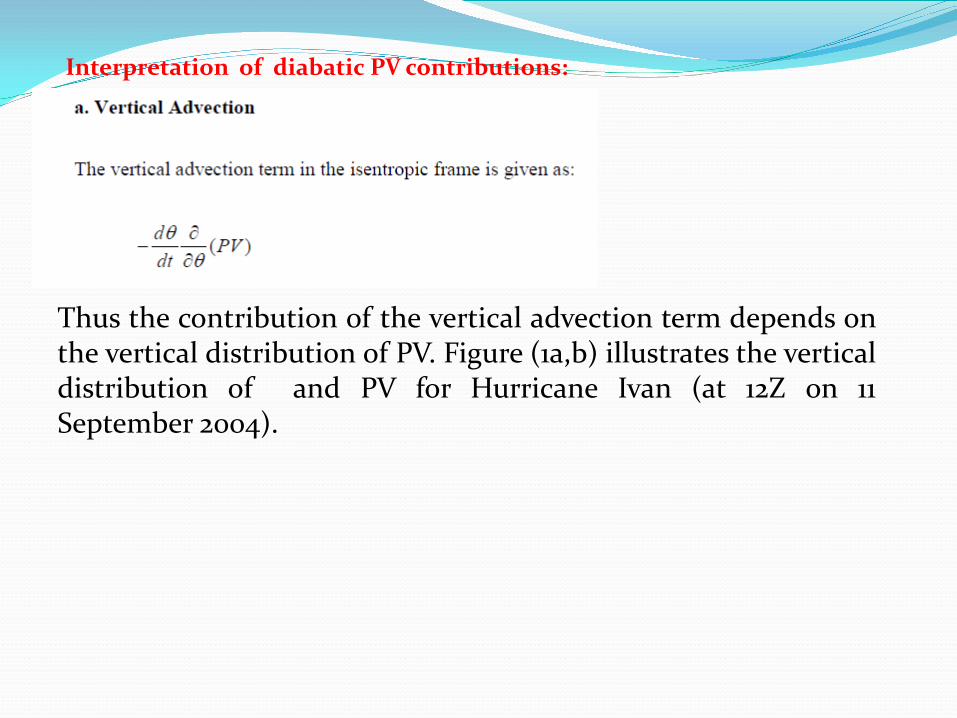
Interpretation of diabatic PV contributions:
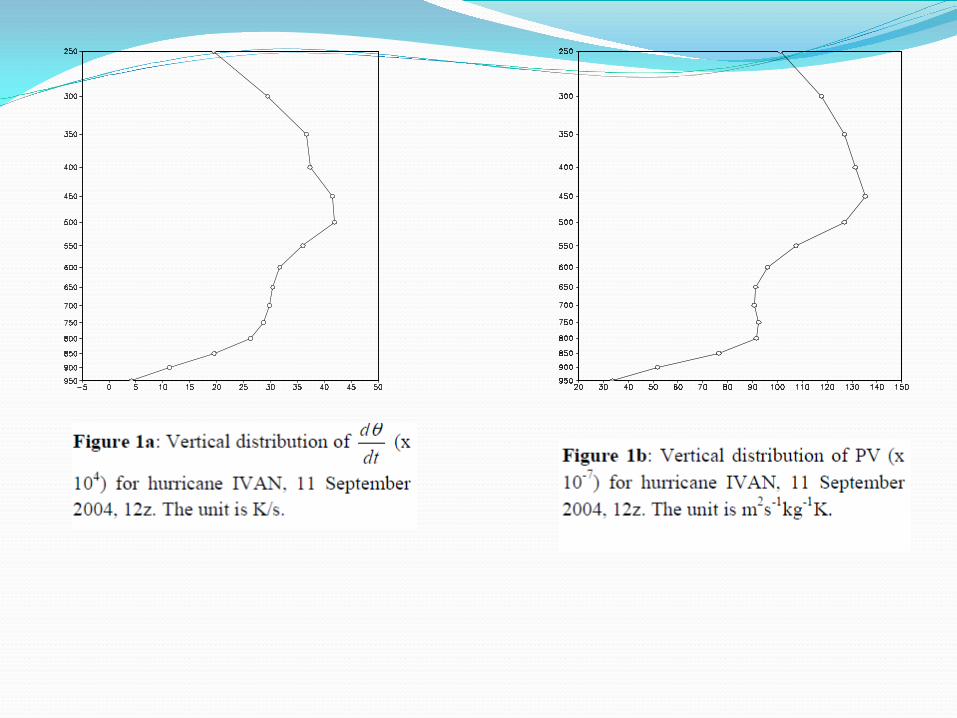
Thus the contribution of the vertical advection term depends on the vertical distribution of PV. Figure (1a,b) illustrates the vertical distribution of and PV for Hurricane Ivan (at 12Z on 11 September 2004).
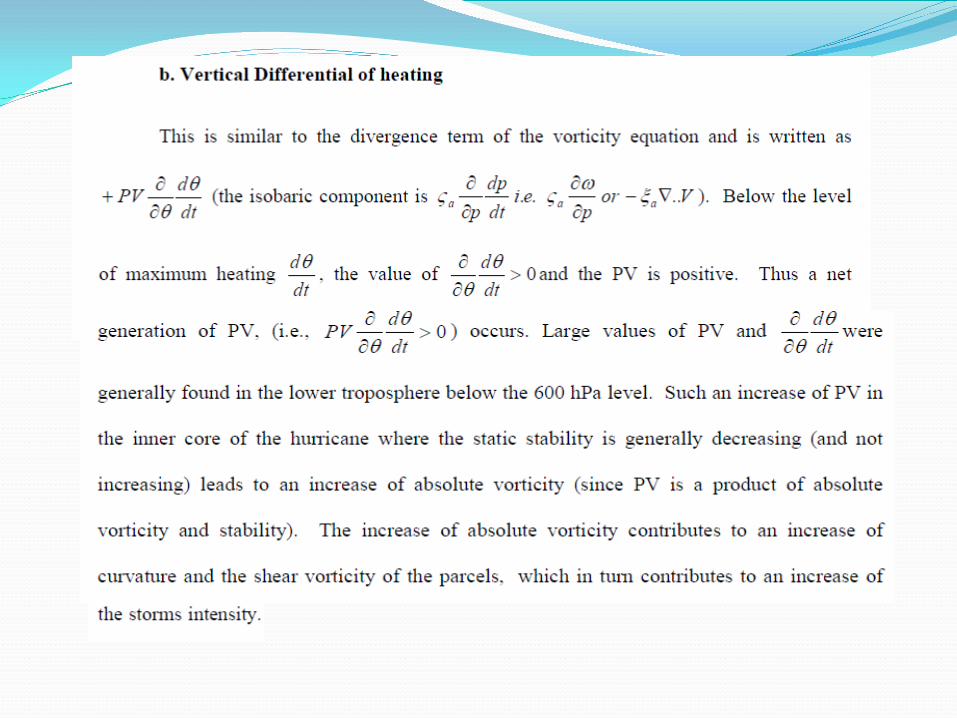
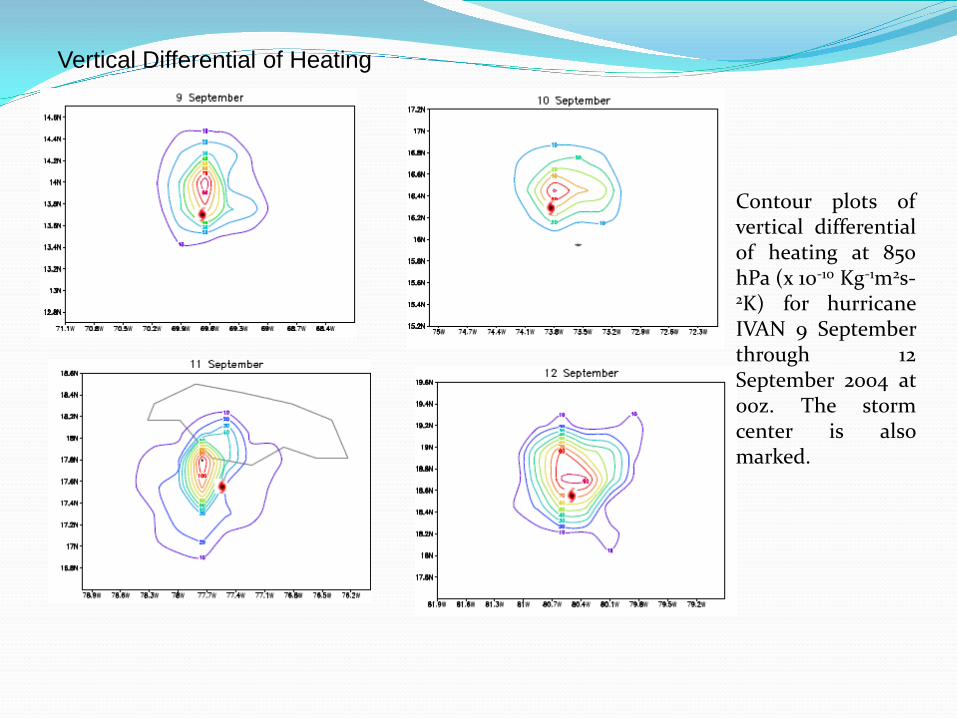
Vertical Differential of Heating
Contour plots of vertical differential of heating at 850 hPa (x 10-10 Kg-1m2s-2K) for hurricane IVAN 9 September through 12 September 2004 at 00z. The storm center is also marked.
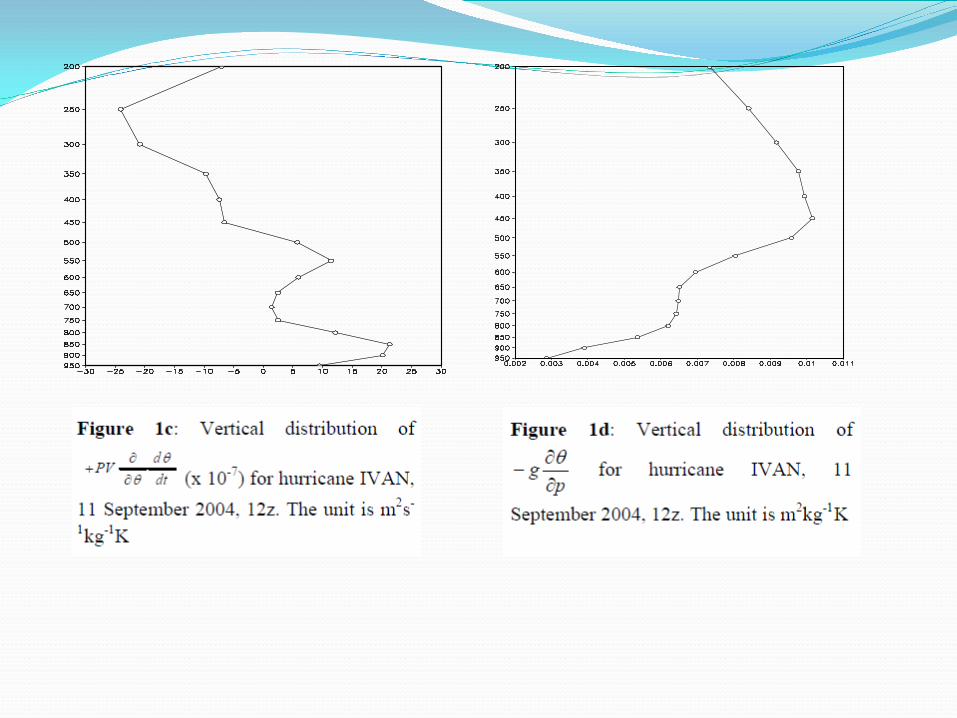

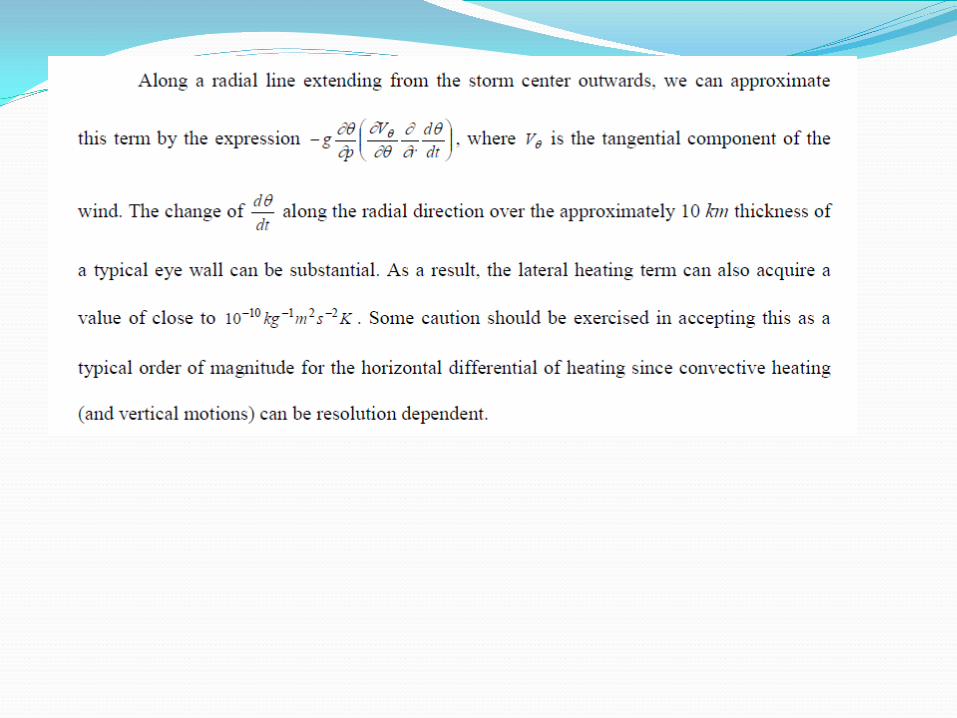
c. Horizontal Differential of heating
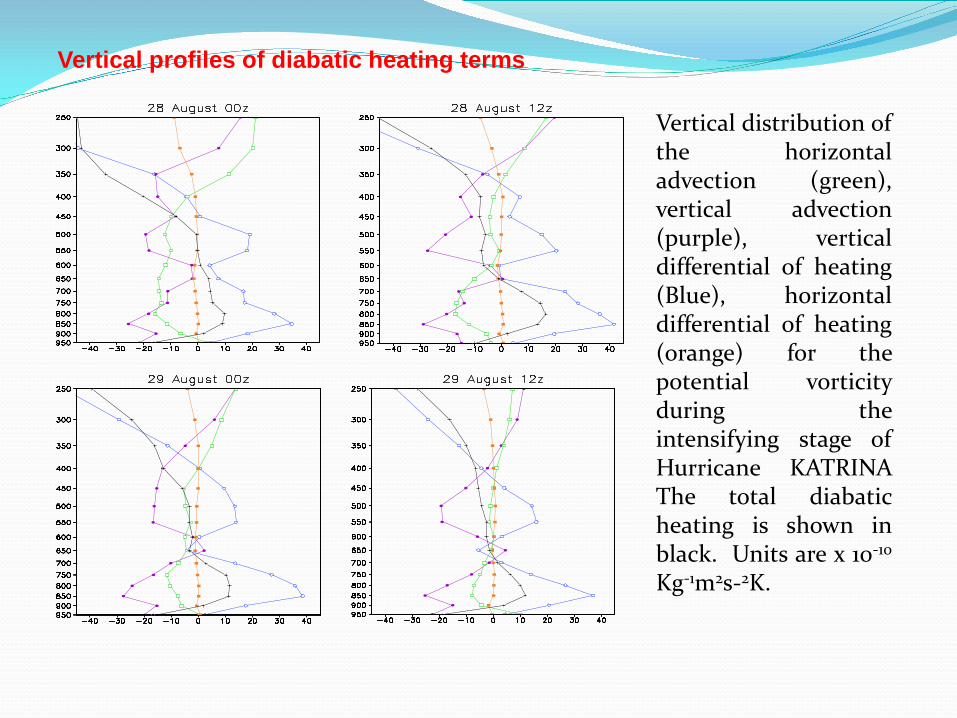
Vertical profiles of diabatic heating terms
Vertical distribution of the horizontal advection (green), vertical advection (purple), vertical differential of heating (Blue), horizontal differential of heating (orange) for the potential vorticity during the intensifying stage of Hurricane KATRINA The total diabatic heating is shown in black. Units are x 10-10 Kg-1m2s-2K.

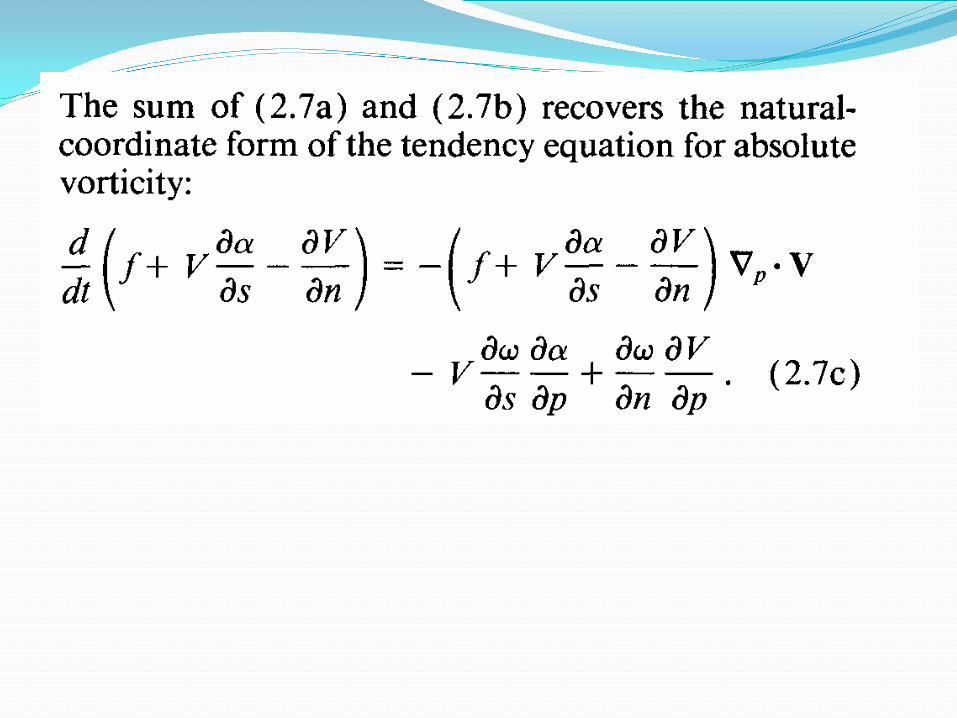
Transformation of Shear to Curvature Vorticity

Bell, G.D., and D. Keyser. 1993. Shear and Curvature vorticity and Potential-Vorticity Interchanges: Interpretation and Application to a Cutoff Cyclone Event. Mon. Wea. Rev. 121(76–102). Viúdez, A., and R.L. Haney. 1996. On the Shear and Curvature Vorticity Equations. J. Atmos. Sci., 53(3384–3394).

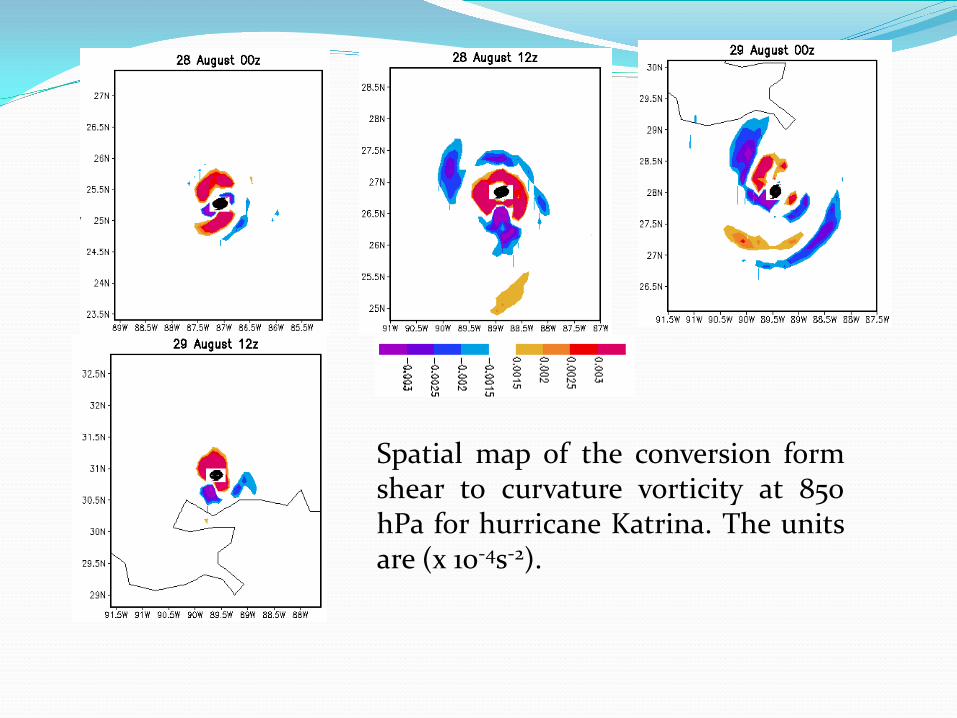
Spatial map of the conversion form shear to curvature vorticity at 850 hPa for hurricane Katrina. The units are (x 10-4s-2).

Energy Exchange from the Divergent to the Rotational Kinetic Energy in the Inner Core
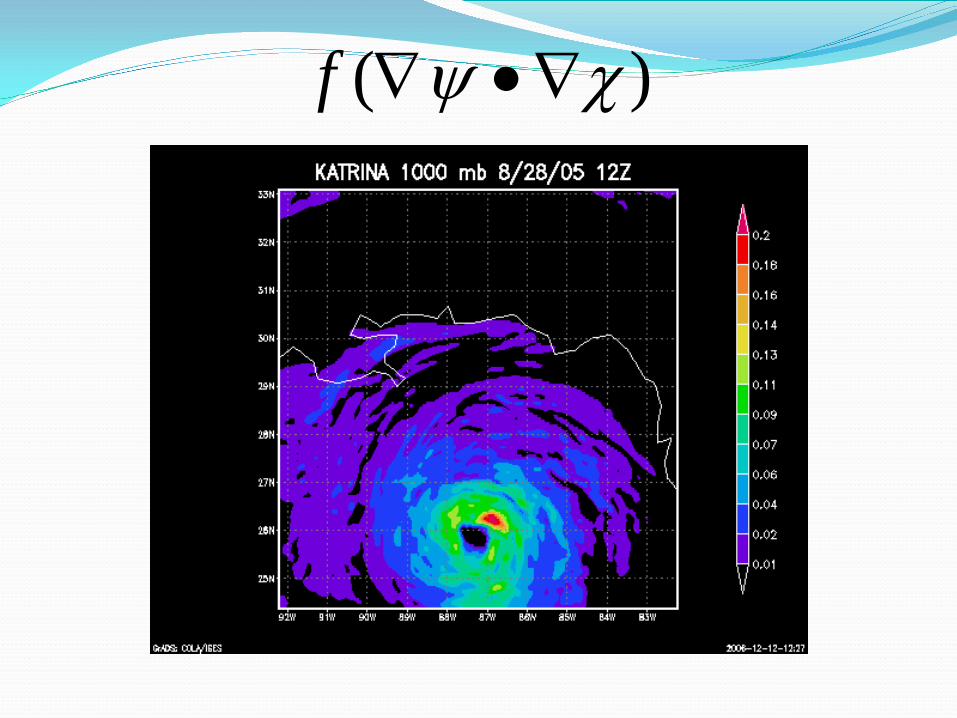
( )f ψ χ∇ •∇
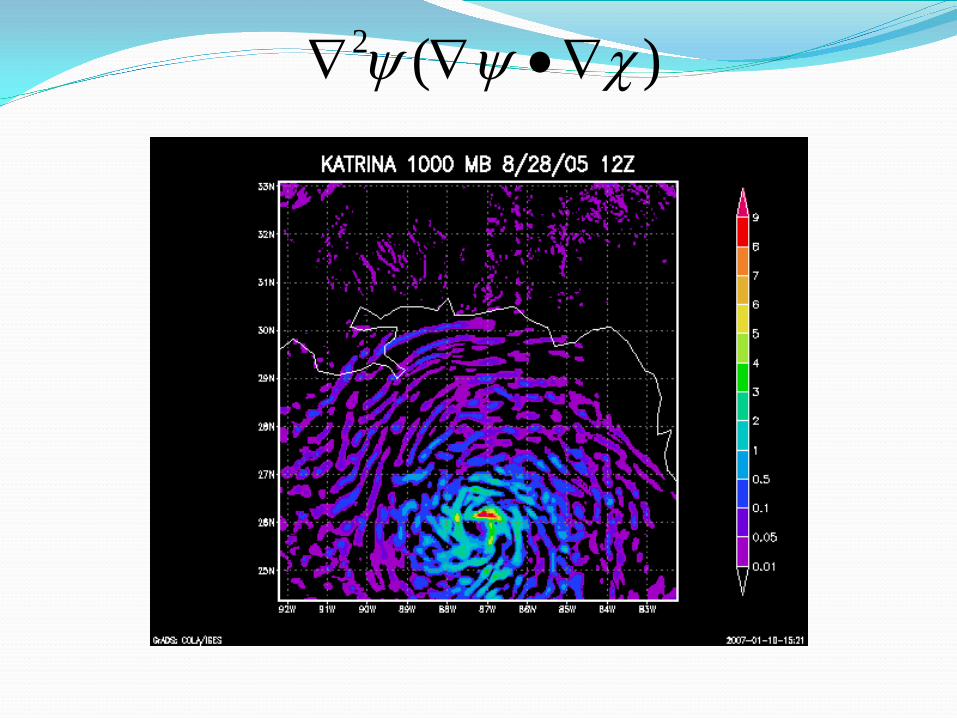
2 ( )ψ ψ χ∇ ∇ •∇
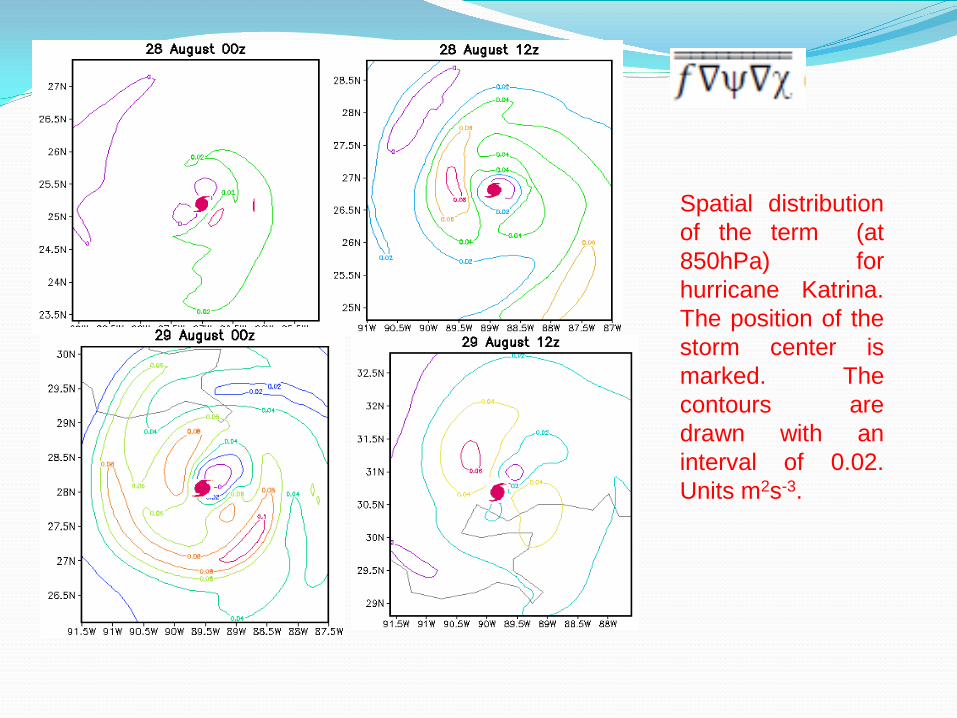
Spatial distribution of the term (at 850hPa) for hurricane Katrina. The position of the storm center is marked. The contours are drawn with an interval of 0.02. Units m2s-3.
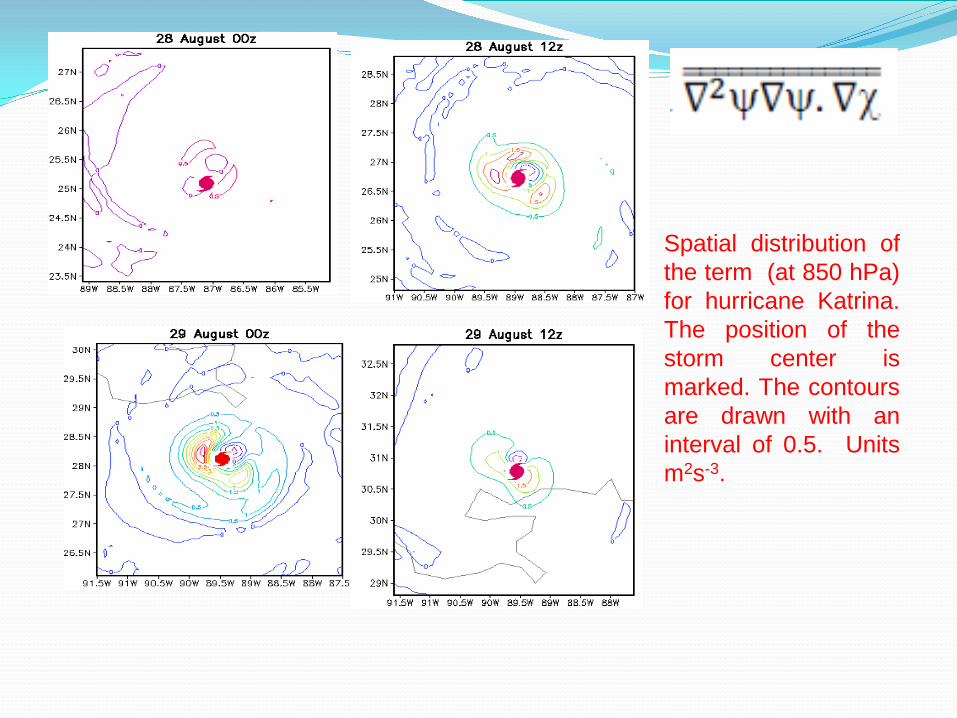
Spatial distribution of the term (at 850 hPa) for hurricane Katrina. The position of the storm center is marked. The contours are drawn with an interval of 0.5. Units m2s-3.

Angular Momentum
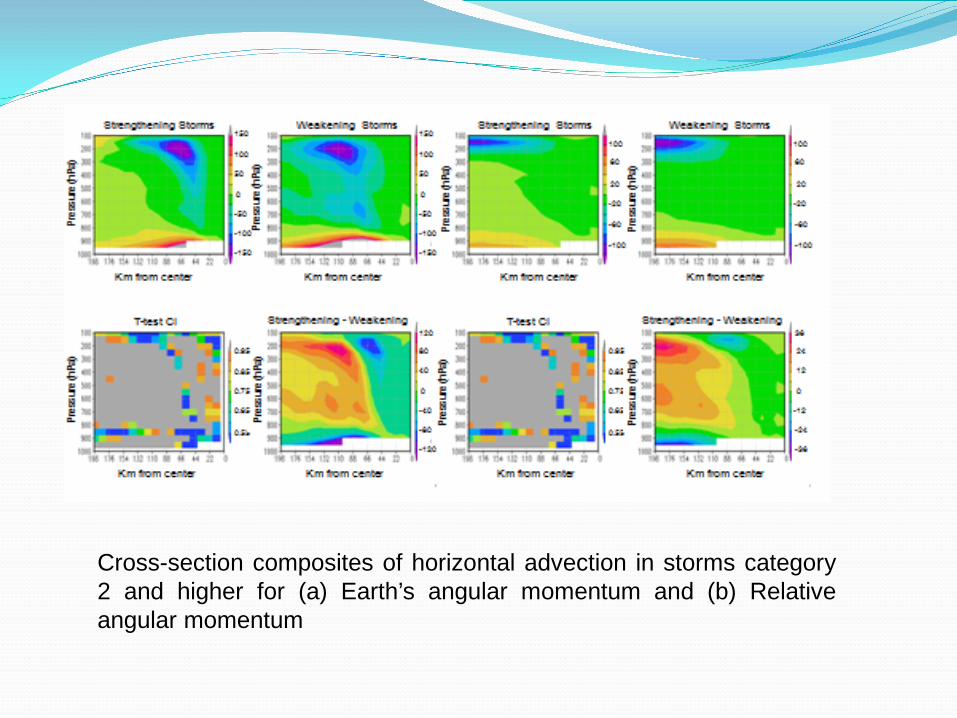
Cross-section composites of horizontal advection in storms category 2 and higher for (a) Earth’s angular momentum and (b) Relative angular momentum
Data sets of the present study 1. FSU Diagnostic parameters are computed from HWRF
Forecast for many hurricane cases during the 2008 and 2009 seasons.
2. HWRF model simulations carry two nested domains 27km and 9km. We have used Inner nest domain (9km resolution) data for computation of FSU Diagnostics parameters.
3. Data sets used for Regressions (154 hurricanes) include most of the 2008 and 2009 Hurricane cases, this does not include cases that were deliberately left out for forecast applications (15 hurricanes) presented here.
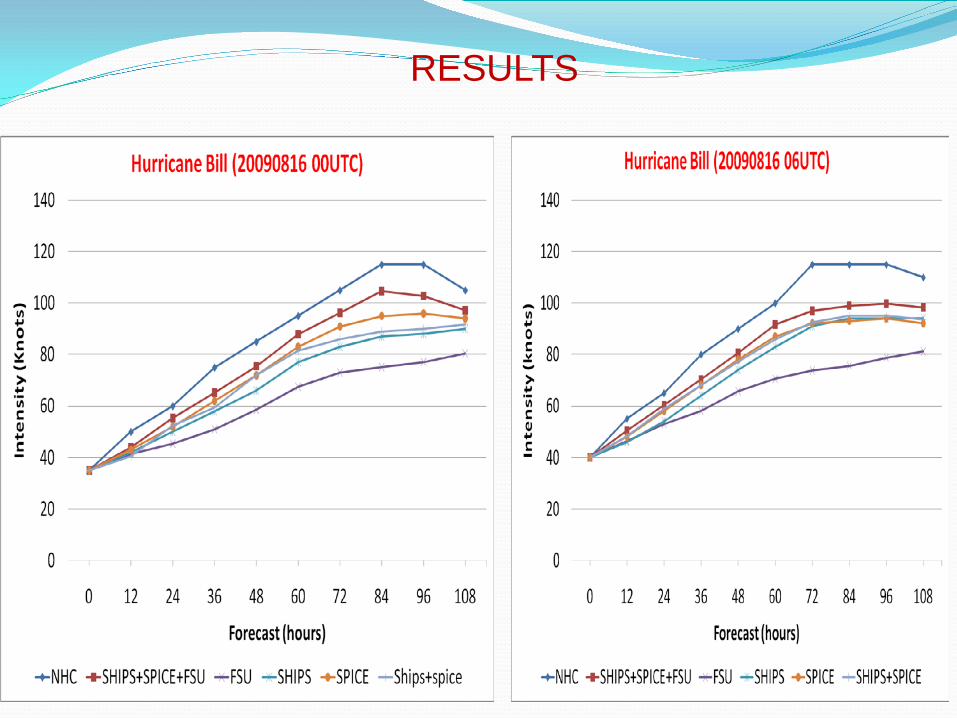
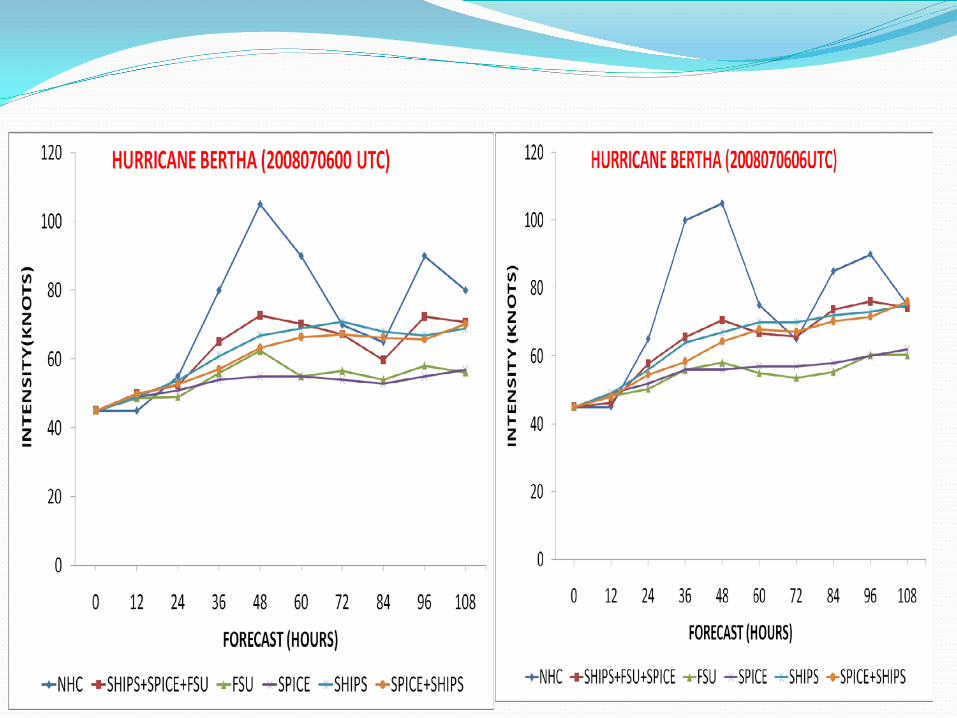
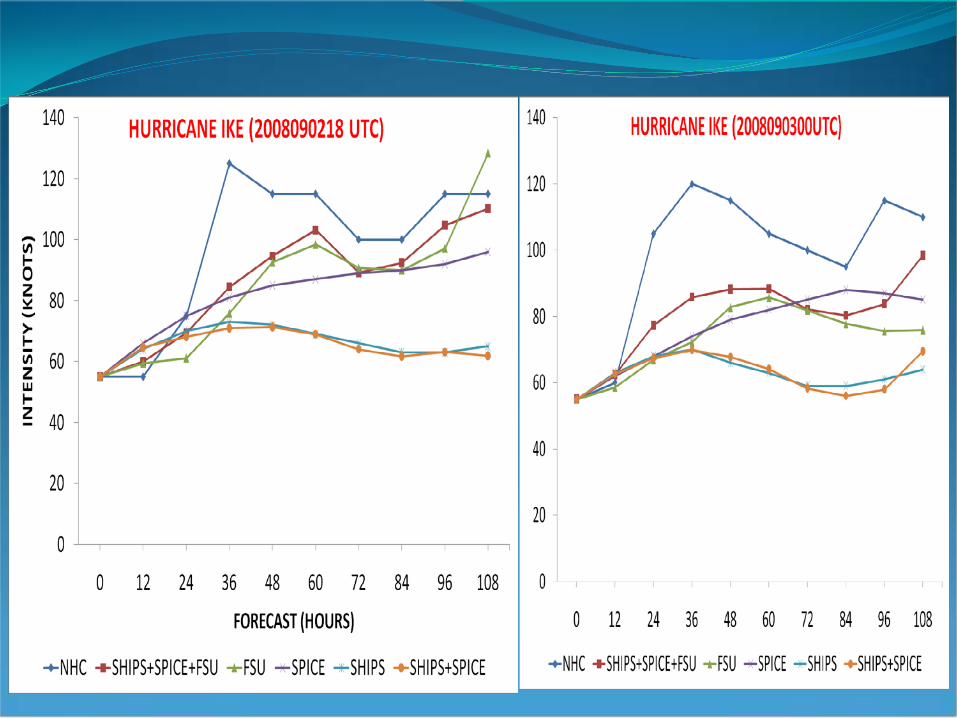
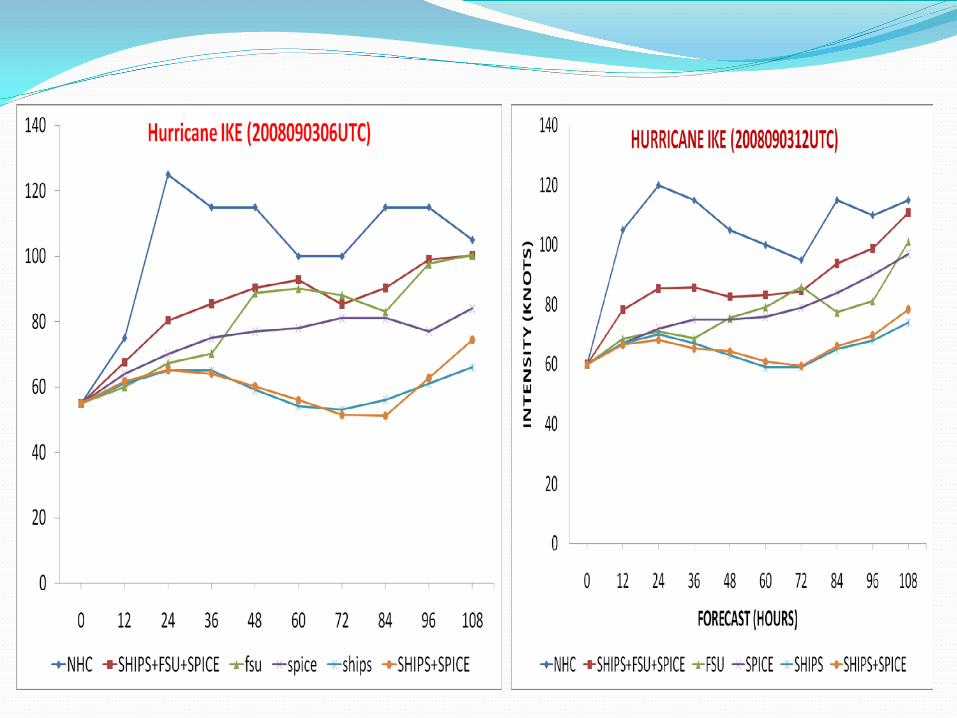
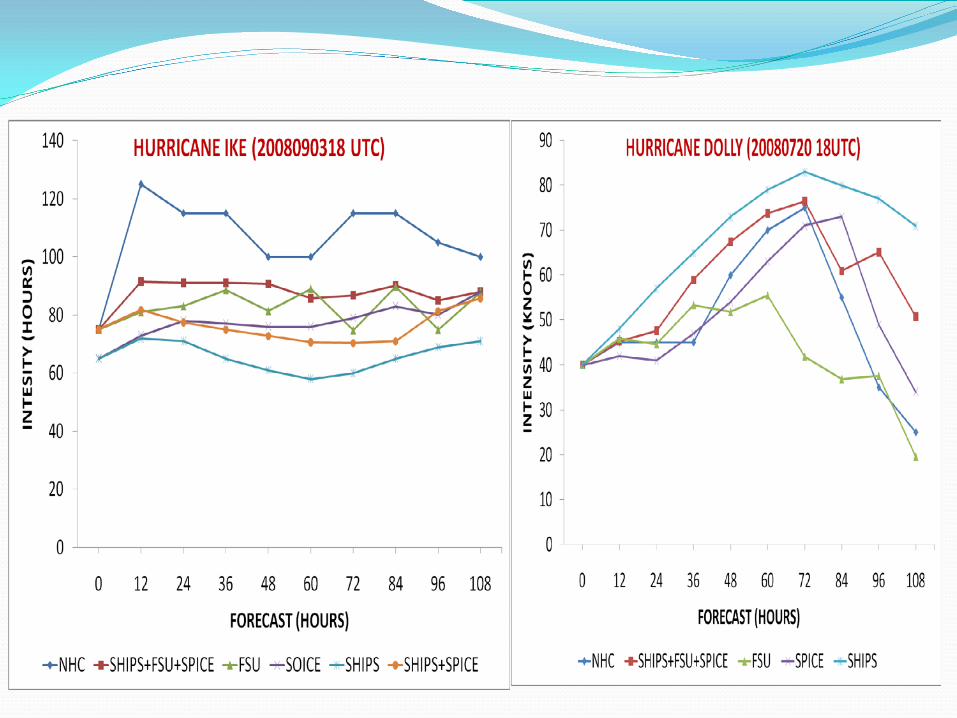
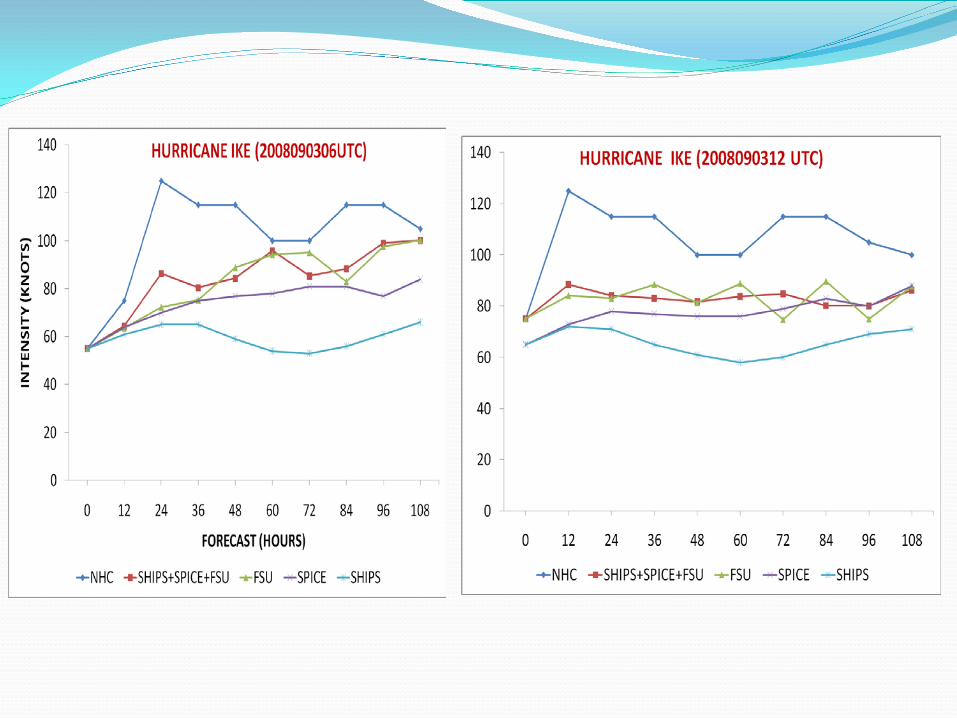
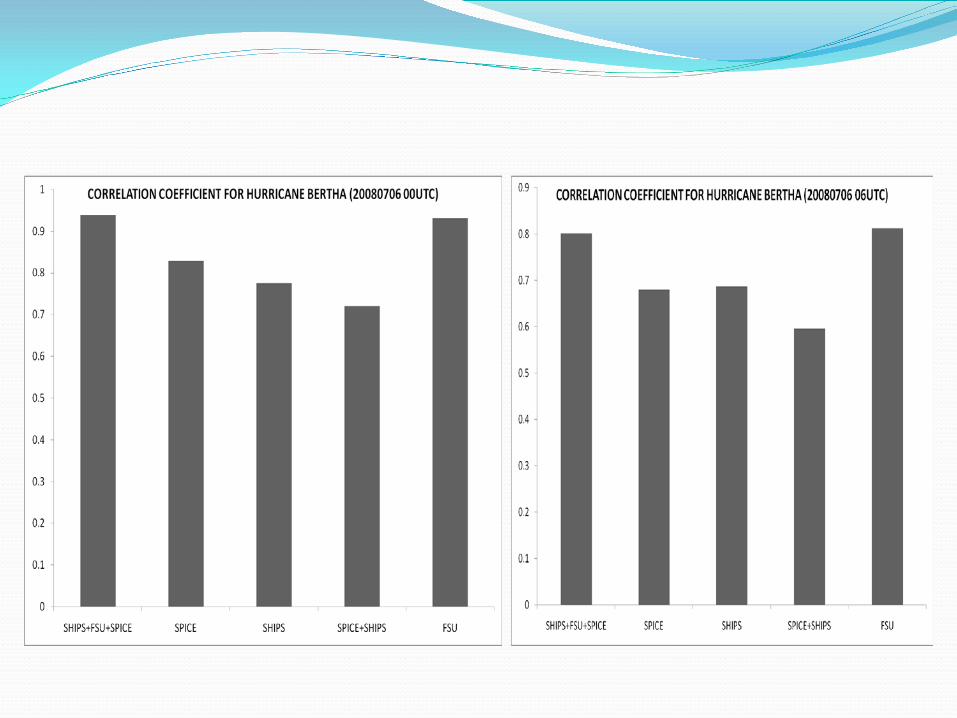
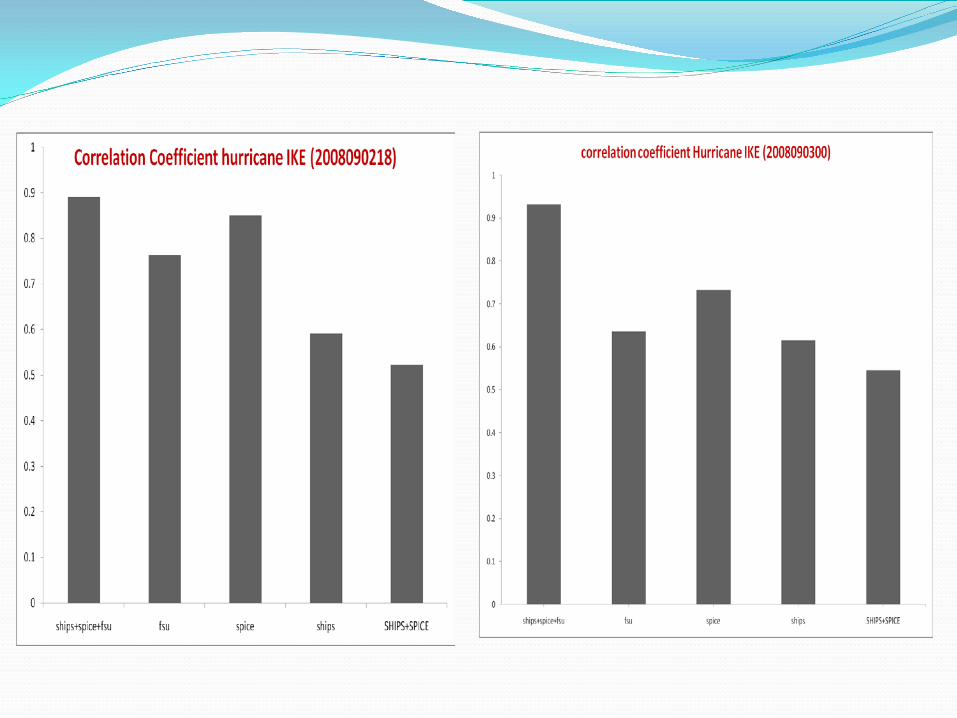
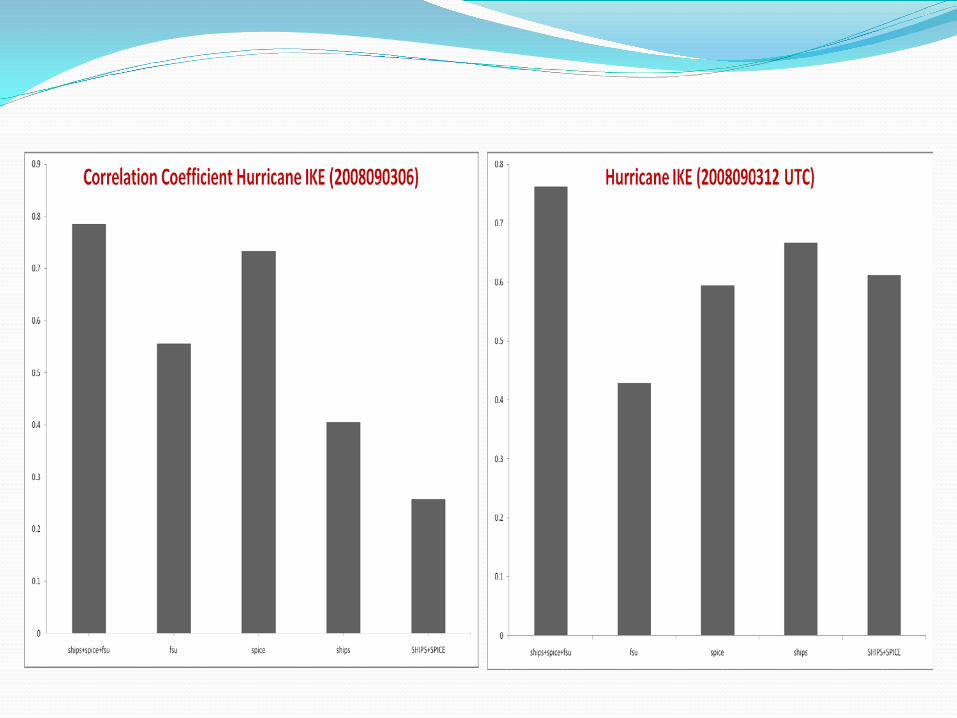
RESULTS
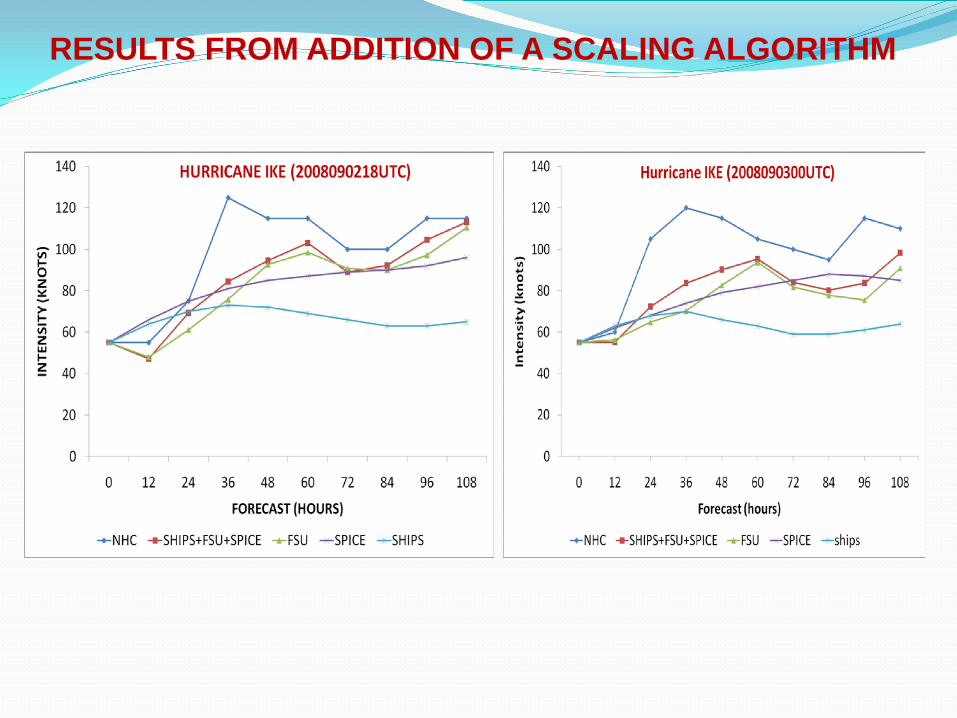
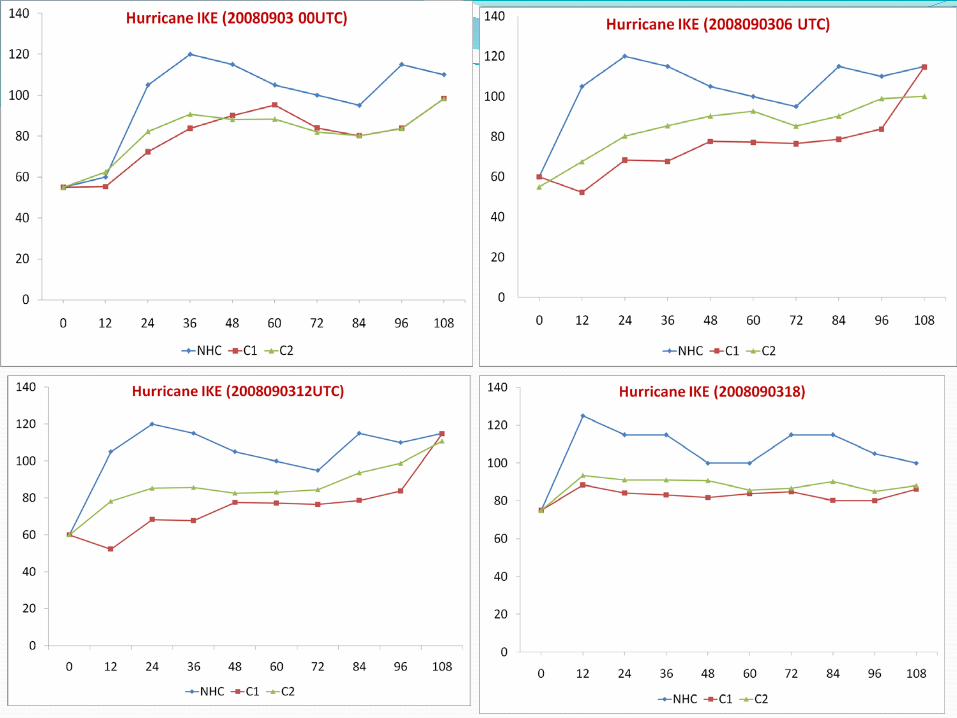
RESULTS FROM ADDITION OF A SCALING ALGORITHM
CONCLUSIONS
FSU EXTENDED SHIPS/SPICE ALGORITHM FOR HURRICANE INTENSITY FORECAST IMPROVEMENTS IS ALMOST READY FOR OPERATIONS.
THE FSU DIAGNOSTIC VARIABLES BASED ON DIABATIC PV,
ANGULAR MOMENTUM TRANSPORTS INTO HURRICANE CORE , ENERGY PROVIDED BY DIVERGENT WINDS AND THE SHEAR TO CURVATURE KINEMATICS PROVIDE GREAT STRENGTHS TO THE CURRENT SHIPS AND THE SPICE FORECAST PARAMETERS.
RESULTS SHOW THAT A COMBINATION OF THE SHIPS, SPICE AND FSU PARAMETRS PROVIDES, CONSISTENTLY, THE BEST HURRICANE INTENSITY FORECASTS.
FOR DAY 3 FORECAST THE COMBINED ALOGORITH IMPROVE INTENSITY FORECAST BY 7% COMPARE TO SPICE AND FOR 108 HOUR FORECAST THE IMPROVEMENTS ARE AROUND 5%.
NOT TIME TO ABANDON SHIPS YET
THANK YOU