Embed Size (px)
Citation preview

THE LAST-MILE SOLUTION: HYBRID FSO RADIO
Scott Bloom, PhD W. Seth Hartley, MSChief Technical Officer Optical Propagation SpecialistAirFiber, Inc. AirFiber, Inc.
INTRODUCTION Presently the “last mile” remains an unsolved dilemma for the world's telecom-munications carriers, despite the many attempts at attacking the problem:
• DSL and cable modems can, to some extent, take advantage of existing wired networks; however, they cannot provide true broadband services in a deter-ministic way. DSL technology is plagued by the actual topology of the copper to which it is attached, and is limited in distance (from the central office) and capacity (several Mbps). Cable modems enjoy higher capacity, yet the chan-nel is shared and the amount of bandwidth at any given time is not guaran-teed.
• Unlicensed wireless RF technologies are also limited in capacity, and carri-ers are reluctant to install systems that might have interference issues. Licensed wireless RF technologies can provide very high capacity, but the nonrecurring initial capital expenditures for spectrum licenses usually makes the business model very difficult to implement. Additionally, in any given city the licenses permit only two carriers to participate.
• Free-space optical (FSO) technologies offer optical capacity but are typically deployed at lengths under a kilometer for reasonable availability. FSO has a major time-to-market advantage over fiber. Fiber builds often take 6 to 9 months, whereas an FSO link can be operational in a few days.
• Millimeter wave technology at 60 GHz is unlicensed due to oxygen absorp-tion and is capable of higher capacity than frequencies at longer wave-lengths. However, it is susceptible to outage in heavy rain regions and is thus limited in range (about 400 m or so).
• W-band technologies are just starting to come out of the lab and are being licensed on a link-by-link basis. However, they are likely to be licensed in the future due to their relatively good propagation characteristics.
802-0008-000 M-A1 Copyright © May 2002, AirFiber, Inc. 1

THE SOLUTION: HYBRID FSO RADIO
A new solution to the last-mile problem uses the strengths of two of these technologies to mutually mitigate each other's weakness. Hybrid FSO Radio (HFR) combines free-space optical and 60 GHz millimeter wave (MMW) technologies to provide, for the first time, a true carrier grade (99.999%) wireless, redundant, unlicensed system capable of ranges greater than 1 km in all weather conditions. HFR is poised to be the disruptive technology that will help carriers liquidate bandwidth assets currently locked in fiber networks.
Free-Space Optics and Range LimitationsThe link equation for a free-space optical system is actually very simple at a high level (leaving out optical efficiencies, detector noises, etc.). The equation, illustrated in Figure 1, shows that the amount of received power is proportional to the amount of power transmitted and the area of the collection aperture. It is inversely proportional to the square of the beam divergence and the square of the link range. It is also inversely proportional to the exponential of the product of the atmospheric attenuation coefficient (in units of 1/distance) and the link range.
Figure 1. Basic FSO link equation
Areceiver
(Div Range)2P
received = P
transmit .. . exp (–α Range).
Receiver area
Beam divergenceAtmospheric
attenuation factor
1
km( )
(km)
The amount of received power scales linearly with transmit power and aperture area, but inversely with the square of the beam divergence. The exponential Beer's Law attenuation factor (α) completely dominates the performance of FSO systems in real atmospheric conditions for carrier-grade availabilities. Terms used in the equation are defined as:
• Preceived = received power
• Ptransmit = transmit power
• Areceiver = receiver area
• Div = beam divergence (in radians)
• Range = link length
The Last-Mile Solution: Hybrid FSO Radio 2

As shown in this equation, the variables that can be controlled are the transmit power, the receive aperture size, the beam divergence and the range of the link. The atmo-spheric attenuation coefficient is uncontrollable in an outdoor environment and is roughly independent of wavelength in heavy attenuation conditions. Unfortunately, the received power is exponentially dependent on the product of the atmospheric extinction coefficient and the range. In real atmospheric situations and for carrier-class products (i.e., availabilities at 99.9% or better), this term overwhelms everything else in the equation. What this means is that a system designer can choose to use huge transmit laser powers, design large apertures, and employ very tight beam divergences, yet the amount of received power will remain essentially unchanged.
In foggy conditions, the atmospheric loss component of the link equation dominates by many orders of magnitude, essentially overwhelming any system design choices that could affect availability. For connections that are intended to be carrier class using free-space optical systems, this fact needs to be accepted and must be taken into account for network design. The only other variable under the designer's control is link range, which must be kept short enough that atmospheric attenuation is not the domi-nant term in the link equation. As will be discussed in a later section, this implies that the link range must be less than 500 m for carrier-class availability. Under this con-straint, efficient designs can be produced that provide economical, reliable operation.
Figure 2 shows a tabular link budget for the top five free-space optical system manufac-turers. Most of the system parameters are freely available from manufacturers data sheets; however, where a parameter has been assumed, it is noted. The assumed atmo-spheric attenuation condition is 100 dB/km, which is a moderate fog. The link ranges were adjusted for each system such that the margins came out to approximately zero, representing the threshold of communication. It is interesting to note the wide variety of aperture size, wavelengths, transmit divergences and transmit power (all of the adjustable system parameters) employed in these systems. However, as previously dis-cussed, the maximum link ranges are all about the same (about ±30 m or so), illustrat-ing the point that there is not a lot system designers can do to increase link range in realistic carrier-grade atmospheric conditions.
The key issue for carriers deploying free-space optical systems is system availability. System availability depends on many factors, such as equipment reliability and net-work design (redundancy for example), but these are well known and fairly quantifi-able. The biggest unknown is the statistics of atmospheric attenuation. While almost all major airports around the world maintain visibility statistics (which can be con-verted to attenuation coefficients), the spatial scale of visibility measurements is rough (generally 100 m or so) and the temporal scale is infrequent (hourly in most cases). With the crude spatial and temporal scales, estimates of availability for carrier-grade equipment (99.9% or better) are limited to 99.9% or worse. These huge databases are therefore not useful except for estimating the lowest acceptable carrier grade of service. To permit carriers to write reasonable service-level agreements, better data is needed. AirFiber has deployed instruments capable of acquiring this data running continuously for several years. These instruments, which include a nephelometer and a weather benchmark system, provide data at the correct spatial and temporal resolution for accurate estimates of availability and link range to be made.
The Last-Mile Solution: Hybrid FSO Radio 3

Figure 2. FSO vendor performance comparison
Figure 3 plots this data for two cities, Tokyo and San Diego. The cumulative probabil-ity density functions for Tokyo and San Diego are represented by solid boxes and open boxes, respectively. Also plotted is the link budget equation for an AirFiber product (other vendors’ products will have roughly the same link margin). The left vertical axis shows the percentage of time that attenuation is greater than or equal to a given value.
The horizontal axis is attenuation in dB/km, while the right vertical axis is the maxi-mum link range at zero link margin. To use the chart, choose an availability, say 99.9% (as shown by the green dotted line); move horizontally to the desired city (Tokyo in this example); move vertically to the link budget equation; and finally move horizontally to the maximum link range (in the case of Tokyo, it is about 350 m). It is interesting to note that Tokyo is qualitatively in the top 10% of cities for clarity of the atmosphere and San Diego is in the bottom 10%. Therefore, for most deployments, the maximum range will fall somewhere in between these two cities, certainly less than 500 m in most cases.
AirFiber Vendor A Vendor B Vendor C Vendor D Vendor E
Transmitter AlGaAs AlGaAs EDFA InGaAs AlGaAs AlGaAs
Modulation Format NRZ OOK NRZ OOK NRZ OOK NRZ OOK NRZ OOK NRZ OOK
Receiver Si APD Si APD PIN PIN Si APD Si APD
Wavelength 785 850 1550 1550 850 910 nm
Data Rate 1250 1250 1250 155 1250 622 Mbps
Average Laser Power 18 30 1000 320 16 25 mW
Peak Laser Power 36 60 2000 640 31 50 mW
Transmit Aperture 8 5 40 5 5 15 cm
Transmit Divergence 0.5 2.0 2.0 4.3 2.0 11.0 mrad(1/e2)
Receive Aperture 8 20 40 20 19 17 cm
Optical Background 0 0 0 0 0 0 W/m2/nm/sr
Receiver Field of View 3 3 3 3 3 3 mrad(1/e2)
Receive Filter Width 25 25 25 25 25 25 nm
Receiver Sensitivity 1000 1000 1000 1000 1000 1000 nW
Bit Error Rate 1 x 10-12 1 x 10⁻¹⁰
ATMOSPHERIC EFFECTS
Attenuation - Moderate Fog -100 -100 -100 -100 -100 -100 dB/km
Peak Laser Transmit Power -14 -12 3 -2 -15 -13 dBW
Extinction Ratio Degradation 0 0 0 0 0 0 dB
Transmit Optics Degradation 0 0 -15 0 0 0 dBW
Pointing Loss -1 -1 -1 -1 -1 -1 dB
Geometric Range Loss -7 -10 -6 -18 -10 -22 dB
Atmospheric Loss -34 -33 -38 -36 -30 -20 dB
Atmospheric Loss -34 -33 -38 -36 -30 -20 dB
Atmospheric Scintillation Fade -1 -1 -1 -1 -1 -1 dB
Receive Optics Attenuation -1 -1 -1 -1 -1 -1 dB
Bandpass Filter Loss -1 -1 -1 -1 -1 -1 dB
Miscellaneous Loss Elements 0 0 0 0 0 0 dB
Received Peak Power at Detector -60 -60 -60 -60 -60 -60 dBW
Required Peak Power at Detector -60 -60 -60 -60 -60 -60 dBW
Link Margin at Range 0 0 0 0 0 0 dB
Range 341 331 381 361 305 203 m
PRODUCT SPECIFICATIONS
ZERO RECEIVE POWER
1 x 10-12 1 x 10-12 1 x 10-12 1 x 10-12
Even with a variety of design approaches:
– Transmit power
– Receive apertures
– Beam divergence
... when a modest 100 dB/km fog is encountered...
the net difference in link range is only about +/-30 m
The system design space of transmit power, receive aperture size, beam divergence, and wavelength has been fairly well explored by vendors, yet in a modest fog (100 dB/km) the range performance of all of the products is very similar.
The Last-Mile Solution: Hybrid FSO Radio 4

Figure 3. FSO availability examples
Another topic of frequent discussion concerning the performance of free-space optical systems is the issue of atmospheric propagation and wavelength. One generally held belief is that systems operating at longer wavelengths have better range performance than systems at shorter wavelengths. Figure 4 shows several calculations performed using MODTRAN—an industry standard atmospheric propagation modeling tool—for a 1 km path length for which the x-axis is wavelength. The conditions were a visibility range of 200 m, typical of an advection fog. The y-axis in the top panel is transmission from a minimum of 0 to a maximum of 1. The top panel shows the amount of absorption due to water only in the atmosphere. Here there are many wavelengths that propagate very poorly due to absorption by water vapor, particularly near 1.3–1.4 microns. The second panel shows absorption due to oxygen and carbon dioxide, which are relatively narrow lines and are easily avoided.
The third panel shows the effects of Mie scattering by water droplets in the fog. Clearly this is the dominant loss mechanism under these conditions and is basically indepen-dent of wavelength (it’s actually a little worse at 1.5 microns than at 785 nm, for exam-ple). Finally the bottom panel shows the combined effects of all three loss mechanisms. Again the result is basically independent of wavelength. There is no advantage in prop-agation range by using longer wavelengths in any reasonably thick fog. Finally, the same calculations were carried out all the way to millimeter waves, as illustrated in Figure 5. This was done for completeness and to ensure that the attenuation reduced at RF frequencies to generally accepted values. Not until the wavelength reaches millime-ter size (RF) is attenuation markedly reduced.
Tokyo and San Diego Availability (1999-2001)
0.0001
0.001
0.01
0.1
1
10
100
0 50 100 150 200 250 300 350
1-A
vaila
bilit
y(%
)
0
100
200
300
400
500
600
700
800
900
1000
Ran
ge (m
)
1-Availability:Tokyo
Range
1-Availability: San Diego
Atmospheric attenuation (dB/km)
This data was taken over a 2-year time period, 1-s temporal resolution, 300-dB/km maximum attenuation limit. Link margin curve is typical of that offered in the indus-try at attenuations greater than about 50 dB/km.
The Last-Mile Solution: Hybrid FSO Radio 5

Figure 4. MODTRAN calculation of propagation versus wavelength in moderate fog
The top panel shows water absorption bands; the next panel shows molecular absorp-tion lines; the third panel shows Mie scattering; and the bottom panel is a sum of the top three, which is how the actual atmospheric path behaves. The attenuation coeffi-cient is nearly independent of wavelength (approximately 85 dB/km in midvisible).
The Last-Mile Solution: Hybrid FSO Radio 6

Figure 5. Same calculation as in Figure 4, extended to millimeter waves (and presented as attenuation rather than transmission)
In summary, we can clearly state that for the majority of cities around the world, the carrier-class distance (as defined by 99.9% availability or better) for FSO is less than 500 m. In addition, despite numerous claims, all free-space optics vendors have about the same range performance in carrier-grade conditions (99.9% or better) due to com-plete domination of the link budget equation by the atmospheric attenuation factor in high attenuation situations. Finally, wavelength has virtually no effect on propagation range under carrier-grade conditions for wavelengths from visible all the way up to mil-limeter wave (RF) scales.
60 GHz mm Waves and Rain AttenuationThe link equation for an MMW system can be written identically to that for an FSO system. There are three components of loss: free-space loss, gaseous loss, and loss due to particulate scattering, primarily from precipitation. Just as in FSO, free-space loss is driven by transmit power, receive aperture size, and beam divergence. MMW systems at 60 GHz are limited to output powers of about 500 mW (total radiated power) for license-free operation. System designers are free to choose the antenna size, which generally dictates its gain. The size of the antenna determines the amount of inter-cepted MMW energy and determines the beam divergence, since the system is diffrac-tion limited.
No optical wavelengths have low attenuation in fog.
The Last-Mile Solution: Hybrid FSO Radio 7
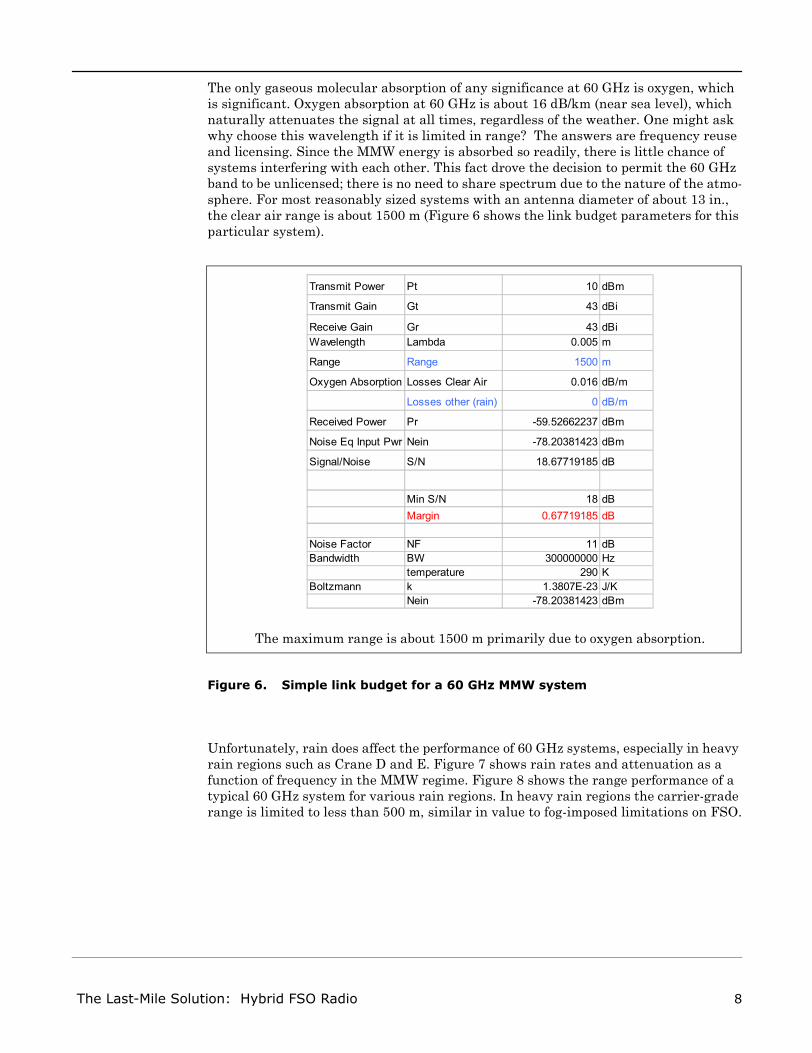
The only gaseous molecular absorption of any significance at 60 GHz is oxygen, which is significant. Oxygen absorption at 60 GHz is about 16 dB/km (near sea level), which naturally attenuates the signal at all times, regardless of the weather. One might ask why choose this wavelength if it is limited in range? The answers are frequency reuse and licensing. Since the MMW energy is absorbed so readily, there is little chance of systems interfering with each other. This fact drove the decision to permit the 60 GHz band to be unlicensed; there is no need to share spectrum due to the nature of the atmo-sphere. For most reasonably sized systems with an antenna diameter of about 13 in., the clear air range is about 1500 m (Figure 6 shows the link budget parameters for this particular system).
Figure 6. Simple link budget for a 60 GHz MMW system
Unfortunately, rain does affect the performance of 60 GHz systems, especially in heavy rain regions such as Crane D and E. Figure 7 shows rain rates and attenuation as a function of frequency in the MMW regime. Figure 8 shows the range performance of a typical 60 GHz system for various rain regions. In heavy rain regions the carrier-grade range is limited to less than 500 m, similar in value to fog-imposed limitations on FSO.
Transmit Power Pt 10 dBm
Transmit Gain Gt 43 dBi
Receive Gain Gr 43 dBi
Wavelength Lambda 0.005 m
Range Range 1500 m
Oxygen Absorption Losses Clear Air 0.016 dB/m
Losses other (rain) 0 dB/m
Received Power Pr -59.52662237 dBm
Noise Eq Input Pwr Nein -78.20381423 dBm
Signal/Noise S/N 18.67719185 dB
Min S/N 18 dB
Margin 0.67719185 dB
Noise Factor NF 11 dB
Bandwidth BW 300000000 Hz
temperature 290 K
Boltzmann k 1.3807E-23 J/K
Nein -78.20381423 dBm
The maximum range is about 1500 m primarily due to oxygen absorption.
The Last-Mile Solution: Hybrid FSO Radio 8

Figure 7. Rain rate and attenuation at MMW frequencies
From FCC Bulletin Number 70, July 1997.
The Last-Mile Solution: Hybrid FSO Radio 9

Figure 8. Range performance of a 60 GHz system in a heavy rain region
ONE + ONE EQUALS FIVE (9S): HFR
Typically, nature can be cruel; however, sometimes she permits symbiotic relationships where the whole is greater than the sum of the parts. This is the case with an HFR sys-tem. It turns out that fog has virtually no impact on the propagation distance of 60 GHz radios, as shown by Figure 9. The arrow at the 60 GHz frequency indicates that attenu-ation due to fog is less than 0.2 dB/km, essentially lost in the noise for link range calcu-lations. Fortunately it also turns out that rain does not cause a major problem for FSO systems.
Radio “up” Time Rain Rate (Region E) Max. Range for
% of Year mm/Hr BER = 1x10⁻⁷
99 6 1,345 m99.9 35 973 m99.99 98 681 m99.999 165 545 m
S/N vs. Rain Rates for a typical 60 GHz radio
FLORIDA (Region E)
-20.0
-10.0
0.0
10.0
20.0
30.0
40.0
50.0
60.0
200 300 400 500 600 700 800 900 1000
Range (m)
S/N
(d
B)
S/N (clear air)
S/N (6 mm rain/hr)
S/N (35 mm rain/hr)
S/N (98 mm rain/hr)
S/N (165 mm rain/hr)
In very heavy rain the maximum range of a 60 GHz wireless link is about 500 m.
The Last-Mile Solution: Hybrid FSO Radio 10

Figure 9. Attenuation by wavelength for fog and rain conditions from visible to millimeter wavelengths
Figure 10 shows aggregated nephelometer data collected in 13 locations over roughly 2 years. We believe that the black curve, which is a fit to all of the data—measured and theoretical—shown on the figure, represents actual field conditions on average. Because these calculations are very sensitive to rain drop size distributions, an average over actual data plus theoretical values provides a realistic picture of what is seen in the field. For very heavy rain regions (>150 mm/hr), where the MMW system will be down, the curves predict FSO attenuation around 30 dB/km. This supports our belief that a 1-km range HFR system will operate at very high availability. If the raindrop size distribution leans towards larger droplets (4 mm or so) the attenuation at a rain rate of 150 mm/hr will be about 16 dB/km; if the droplet size is more like 2 mm, the attenuation could be as high as 35 dB/km.
Shown by the uppermost curve is attenuation at all wavelengths of interest due to aheavy fog (attenuation of 120 dB/km, visibility of about 100 m). This curve includes all atmospheric losses (droplet scattering and gaseous absorption). Shown by the lower three curves is attenuation due to rain at 25, 50, and 150 mm per hour rainrates. These curves only include droplet scattering. As shown by the uppermostcurve, there is also an additional 16 dB/km background attenuation due to oxygenabsorption near 60 GHz. The background attenuation in visible and near-IR wave-lengths is about 1 dB/km.
The Last-Mile Solution: Hybrid FSO Radio 11

Figure 10. AirFiber nephelometer and theoretical data—rain rate versus attenuation
Aggregated nephelometer data collected in 13 locations over roughly 2 years is shown by open circles. The corresponding vertical error bars represent one standard deviation in the attenuation measurements when aggregated by reported rain rate. Solid squares represent output of the MODTRAN model. Diamonds show droplet scattering results from a Mie routine with reasonable drop size distributions. Error bars on these values are determined by increasing or decreasing the droplet concentration by a factor of two. The dashed curve is a fit to nephelometer-measured data alone. The solid curve is a fit to data obtained by all three methods. In obtaining this fit, the two largest nephelometer data points were removed and a 50% uncertainty was assumed on the MODTRAN results.
The Last-Mile Solution: Hybrid FSO Radio 12

Symbiosis between the two technologies means that a combined system, where the path data is switched hitlessly between the two paths in a protocol-independent man-ner, has a greatly extended range at carrier grade (99.999%) availability. Figure 11 shows the Crane model rain regions for the United States, while Figure 12 shows the associated rain rate and CDF of rain rate for all the defined rain regions. Using these statistical models for rain rate in the various regions, along with detailed models of FSO and MMW subsystem performance, highly accurate availability predictions for an HFR system are possible. Figures 13–15 are bar graphs of range at a given availability (99.999%, 99.995%, 99.99%); the 60 GHz system alone is shown in gray and an HFR system is shown in black. Qualitatively the HFR has about twice the range of the 60 GHz subsystem alone. For North America, the shortest 99.999% distance for the HFR (E rain region) is between 800 m to 1 km. For 99.995% availability, the distance for an HFR system in all of North America is over 1 km. The HFR system offers the best data rate, range performance, and statistical availability of any unlicensed wire-less system built to date.
Figure 11. Rain regions for the United States
FCC Bulletin Number 70, July 1997.
The Last-Mile Solution: Hybrid FSO Radio 13

Figure 12. Rain rates cumulative probability density function in various rain regions
Figure 13. Predicted MMW and HFR maximum ranges in various rain regions for 99.999% statistical path availability
From FCC Bulletin Number 70, July 1997.
99.999%
780
650
480 450380
650720
550
420
350
320
850
0
200
400
600
800
1000
1200
1400
1600
B C D E G H
Rain Region
Ra
ng
e(m
)
60 GHz+FSO
60 GHz
The Last-Mile Solution: Hybrid FSO Radio 14
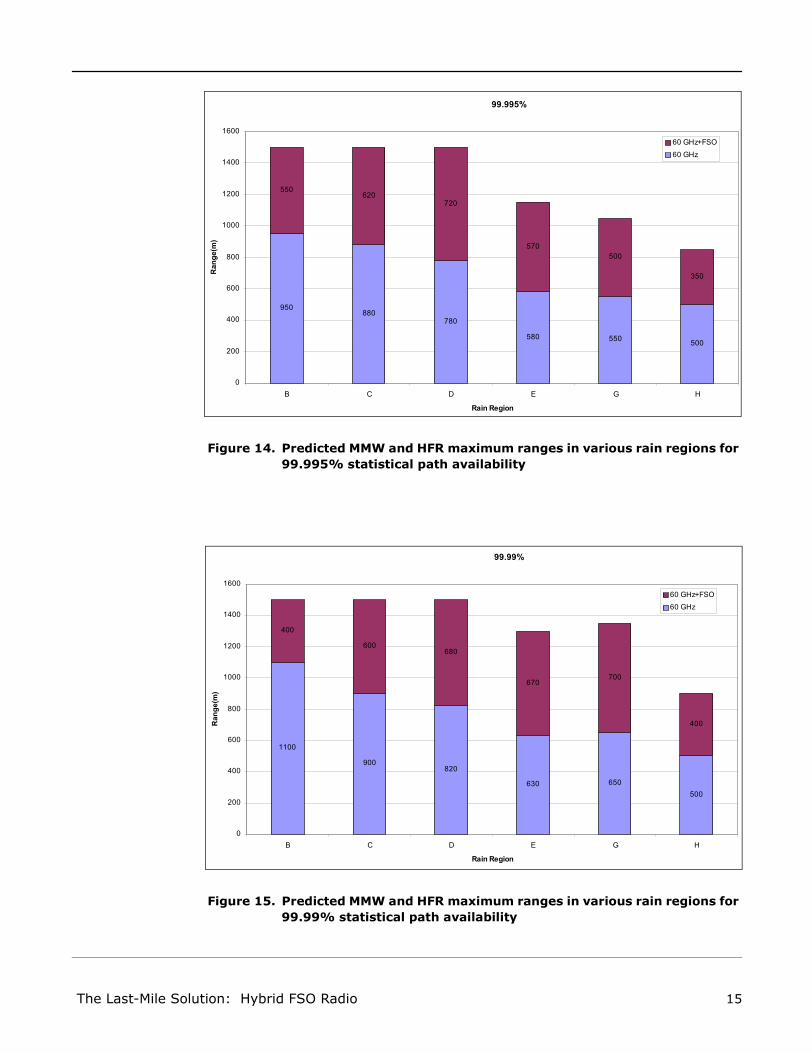
Figure 14. Predicted MMW and HFR maximum ranges in various rain regions for 99.995% statistical path availability
Figure 15. Predicted MMW and HFR maximum ranges in various rain regions for 99.99% statistical path availability
99.995%
950880
780
580 550500
550620
720
570
500
350
0
200
400
600
800
1000
1200
1400
1600
B C D E G H
Rain Region
Ra
ng
e(m
)
60 GHz+FSO
60 GHz
99.99%
1100
900820
630 650
500
400
600680
670700
400
0
200
400
600
800
1000
1200
1400
1600
B C D E G H
Rain Region
Ra
ng
e(m
)
60 GHz+FSO
60 GHz
The Last-Mile Solution: Hybrid FSO Radio 15

There is anecdotal evidence (from deployed system performance figures) that dry snow is not an issue at 60 GHz. Wet snow, however, might be similar to rain, although it is doubtful it could reach the water density of a very heavy rain storm.
Redundant Link Controller and HFR SystemsThe optimal technique for implementing an HFR system is to use the Redundant Link Controller (RLC), an AirFiber patent-pending innovation. The RLC serves two func-tions. First, it provides the HFR system with a hitless capability. This means that when the path conditions are such that one technology begins to fail and the other begins to take over, not a single bit is lost, even if the path is rapidly switching back and forth due to changing weather conditions or other obstructions on either path.
A good example of regularly occurring obstructions is the periodic interruption of either path by bird fly-through. This seems rather minor, yet the errors lost on a high-speed connection can be significant and unacceptable for real-time communications, such as voice. Bird interruptions occur on all FSO systems, regardless of the size of the aper-ture or the number of beams deployed. The RLC function eliminates this problem; it completely corrects for temporary blockages. This is not the case with a typical router or ADM failover circuit, where there is a significant delay and therefore lost data dur-ing a switchover.
Figure 16 shows schematically how the RLC maintains data integrity on a frame-by-frame basis. By using two paths, one MMW and one FSO, the RLC compares, on a frame-by-frame basis, a CRC bit inserted into the frame. If the frame is corrupted, the RLC takes the matching frame from the other path and passes it to the user. Since the frames are pipelined, there is absolutely no bit loss or delay introduced into the system. All framing and bit stuffing is removed before the data stream is dropped to the user; as far as the user is concerned, the system is a piece of protocol-independent fiber.
Figure 16. Schematic representation of RLC functionality
F/OSPLF/OSPL
F/OSPL
Lost DataLost Data
1. Both receivers are active
2. Data shared between each OTU
3. CRC check completed by each
OTU to determine correct data
4. Correct data path dropped to fiber
Guaranteed 10-12 BER—Beam Block Mitigation
– Bird blocks
– Window washing equipment
– Required for wholesale opportunities
Two FSO paths are depicted in the diagram, in the HFR system one of the paths is 60 GHz MMW.
The Last-Mile Solution: Hybrid FSO Radio 16

The other benefit the RLC provides is true equipment and path redundancy. If one piece of the HFR system failed or required servicing, in almost all cases it could be removed from the system with no bit loss to the customer. (In the rare event that the RLC electronics themselves failed, the second RLC takes over, potentially resulting in a 50-ms outage.) Figure 17 shows the fail-over scenario using an RLC. A passive 3 dB combiner/splitter combines the signal outputs from each RLC to provide true redun-dancy, even in the event of an RLC failure.
Figure 17. Redundant paths and failover capability using the RLC
This unique solution utilizes links running at the same capacity to provide a consistent and guaranteed data rate at all times during all weather conditions. This approach is significantly different than previous attempts to marry FSO with microwave, and it is not considered a “backup” system. Microwave backups utilize lower capacity microwave systems to handle communications during foggy conditions. Typically, this would result in loss of data during the switchover and a dramatically lower capacity during fog events.
Customer’snetwork
F/OSPL
F/OSPL
X
Monitored by Hot-Standby Configuration
Customer’snetwork
– For nonintermittent failures, the redundant feature will switch from the active to the standby unit
– Allows for FRU replacement without system outage
Two FSO paths are depicted; in the HFR system one of the paths is 60 GHz MMW.
The Last-Mile Solution: Hybrid FSO Radio 17

Real HFR Results for a Massive 300 dB/km Fog EventFigure 18 is a photograph of the HFR system developed by AirFiber. Figure 19 shows a time series of data recorded by a nephelometer mounted on the rooftop next to an HFR system. The nephelometer measures the attenuation of the atmosphere as a function of time. In this case, a massive fog that lasted over 6 hours and reached a peak attenua-tion of 300 dB/km is depicted. There were several FSO-only systems operating at the time, with link ranges of 300 to 800 m. All the FSO-only systems were out for nearly the entire duration of the fog event. The remarkable thing is that an HFR system at 800 m range performed flawlessly, switching seamlessly between FSO and 60 GHz as necessary depending on the atmospheric conditions. The user saw no lost bits during this massive fog event due to path attenuation. Similarly if the same system were oper-ating in rain the system would switch to FSO as soon as the rain attenuation caused errors on the 60 GHz link, again with no bit errors to the user. Figure 20 is a summary of error statistics taken during this fog event. The small residual bit errors are due to a low-level error rate on the 60 GHz equipment caused by a temporary issue in over-speeding the MMW unit beyond its design range—they are not due to losses incurred during RLC switching.
Figure 18. HFR prototype system
The parabolic dish is 13-in. diameter.
The Last-Mile Solution: Hybrid FSO Radio 18

Figure 19. A deep fog fade in Poway, CA at the AirFiber, Inc. 760-m range outdoor test facility
Hybrid 4-14-02 760 m
0
50
100
150
200
250
300
350
9:3
1:4
9
9:4
5:1
9
9:5
8:4
9
10:1
2:1
9
10:2
5:4
8
10:3
9:1
8
10:5
2:4
8
11:0
6:1
8
11:1
9:4
8
11:3
3:1
7
11:4
6:4
7
12:0
0:1
7
12:1
3:4
7
12:2
7:1
6
12:4
0:4
6
12:5
4:1
6
13:0
7:4
6
13:2
1:1
5
13:3
4:4
5
13:4
8:1
5
14:0
1:4
5
14:1
5:1
4
14:2
8:4
4
14:4
2:1
4
14:5
5:4
4
15:0
9:1
3
15:2
2:4
3
15:3
6:1
3
15:4
9:4
3
16:0
3:1
2
16:1
6:4
2
Time
dB
/km
The HFR system took no path hits during this event in which the FSO path (and any FSO system) was down for about 6 hours.
The Last-Mile Solution: Hybrid FSO Radio 19

.
Figure 20. Some BER statistics for the prototype HFR system
CONCLUSIONS For carriers to unlock the value in their very substantial fiber assets, they need to solve the last-mile problem. The only solution, other than burying fiber everywhere, is to use an HFR system. With HFR, carriers can sell to a customer and deliver fiber-like speeds and availabilities in days at a fraction of the cost of running fiber. An HFR system is unlicensed, which means multiple customers can enjoy deployment of these systems without having to pay up-front for spectrum rights. HFR is truly the last-mile solution that can allow carriers to greatly increase revenues while reducing costs associated with building that revenue base.
References
• The Physics of FSO white paper, AirFiber, Inc., December 2001
• FCC Bulletin Number 70, July 1997
750-m Redundant Link Summary
Error Period (error streams from start to end) Total = 7 hr 15 min
Start Bit error count
04/14/2002 1:39am 102 bits
End
04/14/2002 8:54am 4898 bits
Transitions
Date&Time a-b b-a
4/14, 16:55 1
4/13, 17:00 1
4/14, 01:30 1 Error period
4/14, 02:00 1
4/14, 02:30 2 1
4/14, 13:15 1 1
4/14, 13:25 1
4/14, 13:30 1
4,14, 17:55 1
4/14, 18:45 1
4/14, 22:35 1
4/14, 23:30 1
4/15, 04:40 1
Error Free Period
4/12, 5:51pm to 4/14, 1:24 am : 31 hr and 32 min
4/14, 8:54am to 4/15, 8:54am : 12 hr
These statistics were obtained for the prototype HFR system through the deep fog fade shown in Figure 19. The a–b column shows a switch from FSO to MMW, and b–a shows a switch from MMW to FSO. Total BER is about 10-9, due solely to a residual BER of 10-9 on the MMW system in clear air resulting from a clocking issue when the system was over-sped (3%) to operate with the AirFiber RLC. This issue does not exist on the MMW system when run at its design speed; we are currently modifying the equipment to eliminate this residual error.
The Last-Mile Solution: Hybrid FSO Radio 20