Embed Size (px)
Citation preview
THE SHADOW PRICE OF ENVIRONMENTAL SERVICES FROM U.S. FORESTSOR
Valuing ecosystem services from productive forests in the U.S. (and elsewhere): A Supply-side Approach
Daowei ZhangAlumni and George W. Peake Jr. Professor
Auburn University, [email protected]
OUTLINE Purpose/Motivations Methods
Assumptions/Arguments Linkage between timber market
and the market for environmental services: Supporting evidences
Computation/Calculations Results
Discussion

PURPOSE To quantify the marginal value
of environmental services from productive forests in the U.S. (arguably, from all U.S. forests) in a simplistic and economic fashion in aggregation In the long-run (although the marginal
value is an annual estimate)
for informed debatefor tradeoff (decision-making)

NOTES Environmental services
=Ecosystem servicesMy definition is slightly
different from UN 2004 Millennium Ecosystem Assessment
Forests produce timber and else (environmental services)
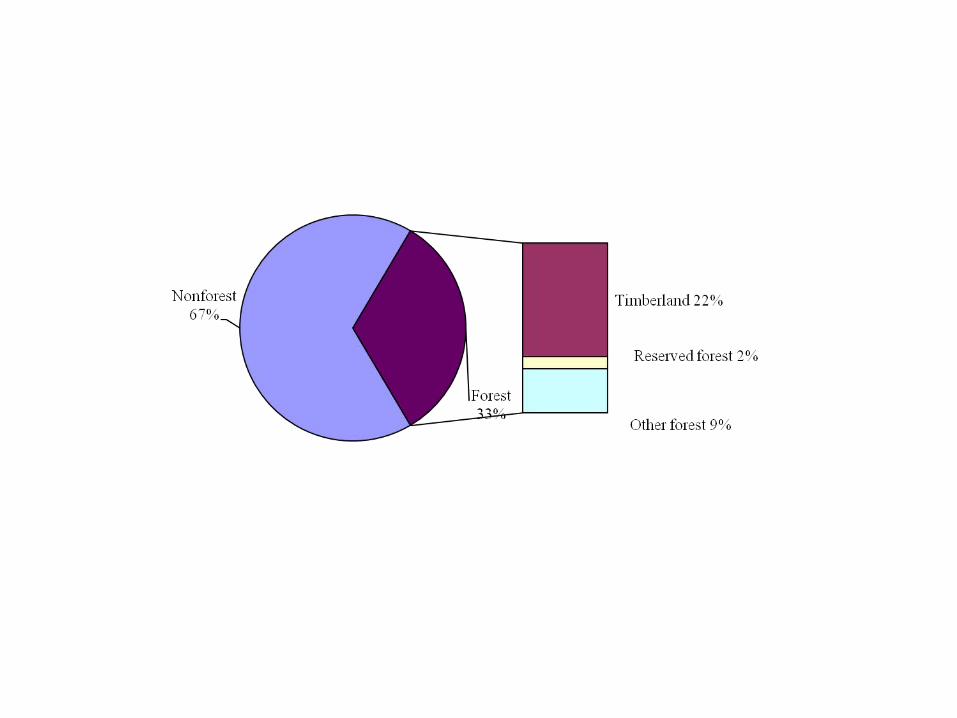
Productive forests=Timberland=forest land can produce >1.43 m3/ha/year, not being restricted from timber production (harvesting)
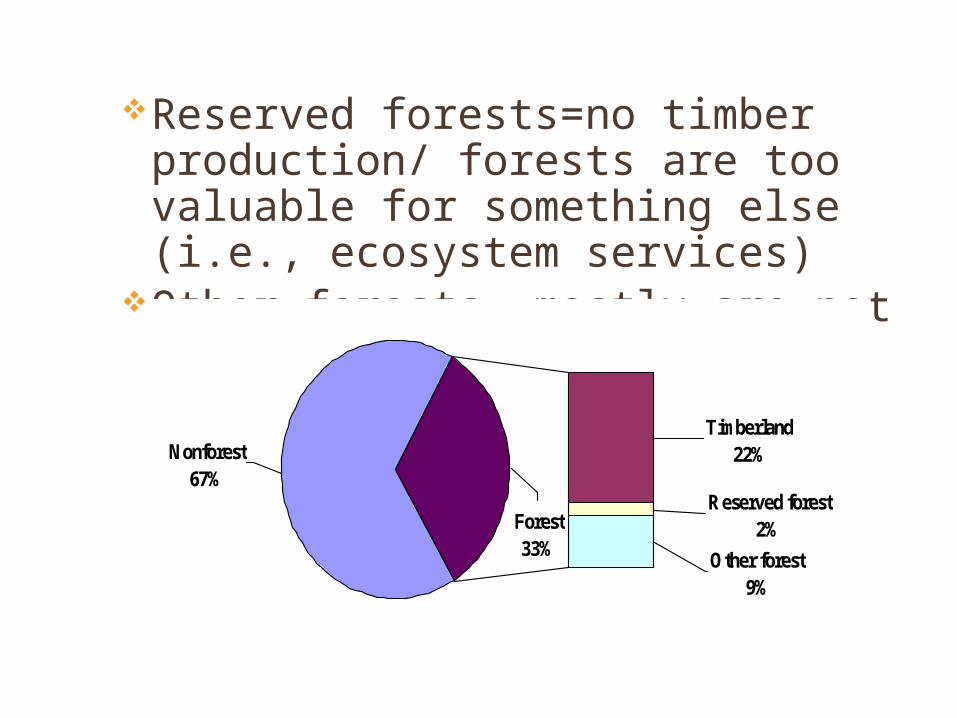
Forest33%
Nonforest 67%
Timberland 22%
Reserved forest 2%
Other forest 9%
Reserved forests=no timber production/ forests are too valuable for something else (i.e., ecosystem services)
Other forests= mostly are not recoverable economically for timber
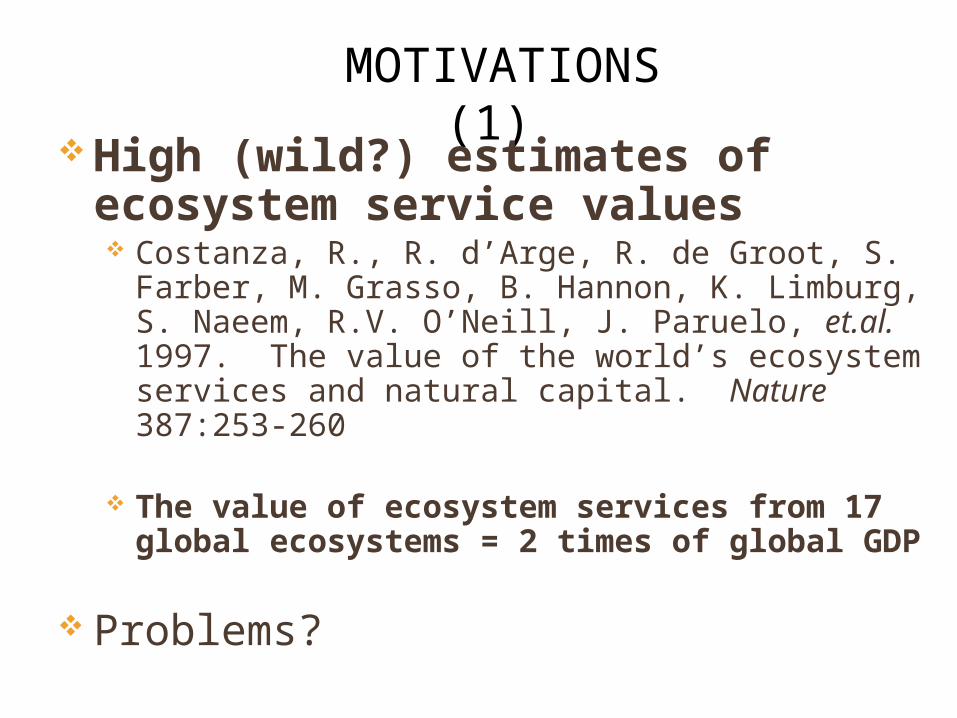
MOTIVATIONS (1)
High (wild?) estimates of ecosystem service values Costanza, R., R. d’Arge, R. de Groot, S. Farber, M. Grasso,
B. Hannon, K. Limburg, S. Naeem, R.V. O’Neill, J. Paruelo, et.al. 1997. The value of the world’s ecosystem services and natural capital. Nature 387:253-260
The value of ecosystem services from 17 global ecosystems = 2 times of global GDP
Problems?
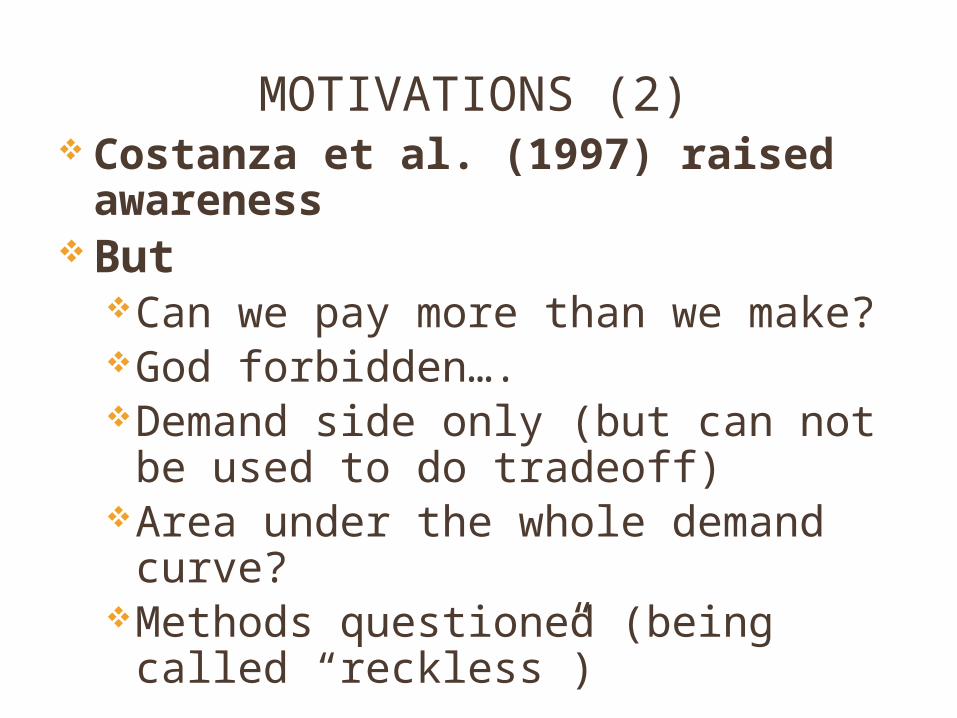
MOTIVATIONS (2) Costanza et al. (1997) raised
awareness But
Can we pay more than we make?God forbidden….Demand side only (but can not be
used to do tradeoff)Area under the whole demand
curve?Methods questioned (being called
“reckless”)
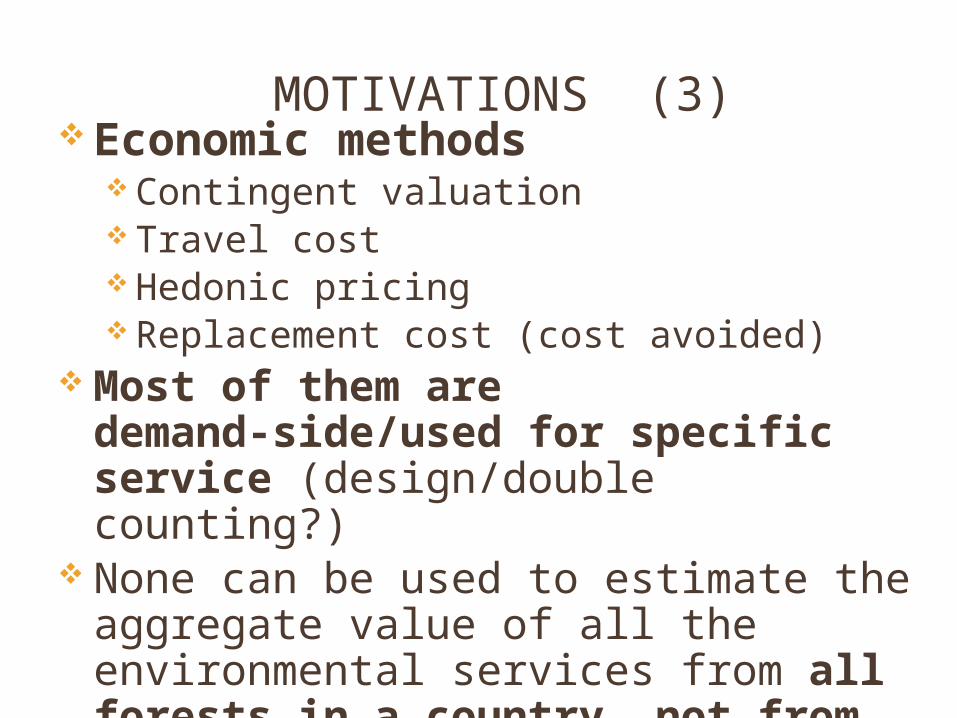
MOTIVATIONS (3) Economic methods
Contingent valuation Travel cost Hedonic pricing Replacement cost (cost avoided)
Most of them are demand-side/used for specific service (design/double counting?)
None can be used to estimate the aggregate value of all the environmental services from all forests in a country, not from the supply-side
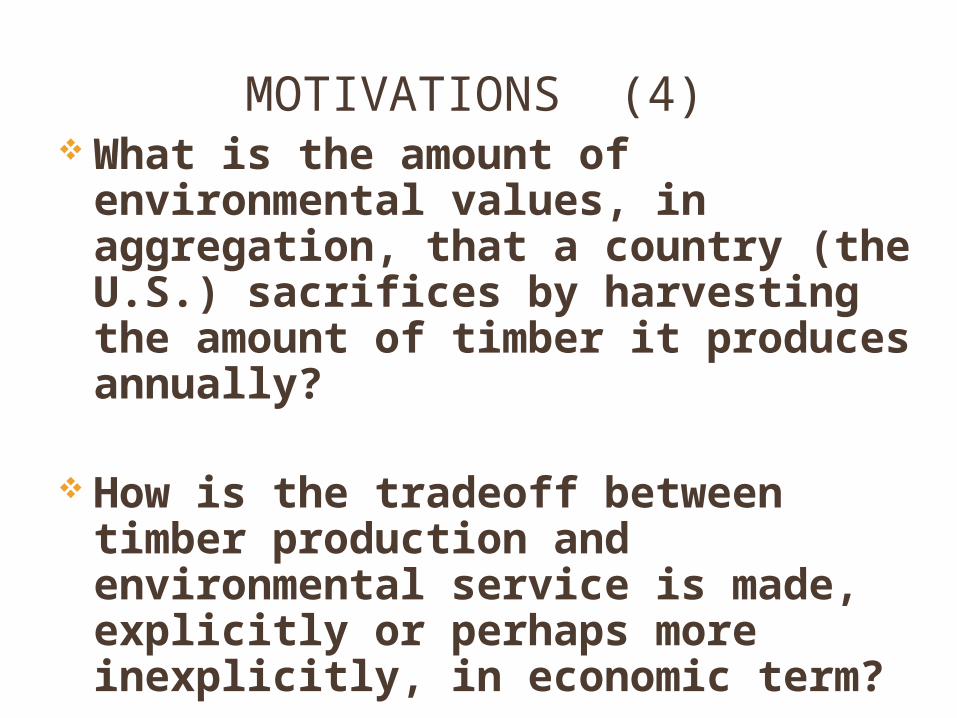
MOTIVATIONS (4) What is the amount of
environmental values, in aggregation, that a country (the U.S.) sacrifices by harvesting the amount of timber it produces annually?
How is the tradeoff between timber production and environmental service is made, explicitly or perhaps more inexplicitly, in economic term?
Methods
Assumptions/Arguments
Supporting evidencesCalculationsResults

Two Primary Forest Goods TimberEnvironmental services
Water/air quality + climate mitigation
Biodiversity/habitatRecreationSpiritual/culturalNon-timber forest products (hunting, fruits, mushroom)

ARGUMENT 1: Timber & Environmental Service Are Competing Uses
Timer and environmental services are competing uses, at least in a large scale
Some of these environmental services are complementary to timber production, and therefore need not to be compensated (not to be “studied”?) in economic sense
In other cases, simply produce one of them (either…. or….)
Theory on multiple/combinations of Uses
• See pages 175-182 in Zhang and Pearse. 2011. Forest Economics. UBC Press
Complementary uses
T
R
Competing usesA
Cubic metres of timber
per year
Recreation days per year0
T
R
Mutually exclusive uses
B
0
T
R
Highly conflicting uses
C
0
T
R
Constantly substitutable
uses
D
0
T
R
Independent uses
E
0
T
R
0
F
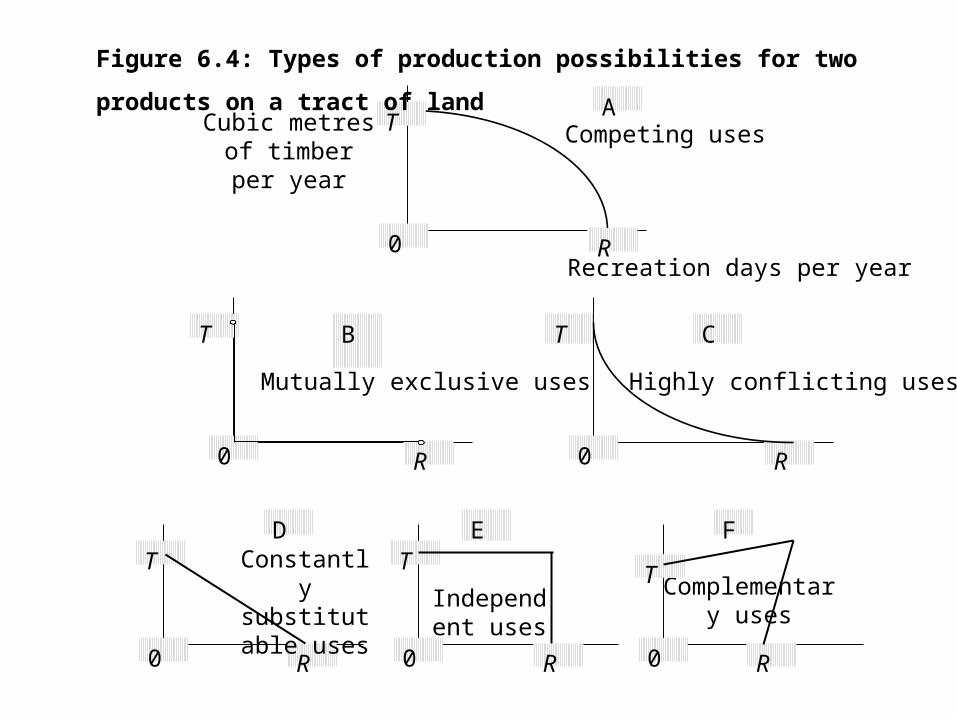
Figure 6.4: Types of production possibilities for two products on a tract of land
Resource allocation (1)• For mutually exclusive, highly conflicting and,
in most case, constant substitutable uses (Figure 6.4B, 6.4C, 6.4F): Always produce one of these uses
• Some forests, because the environmental services they produce are so significant, need to be reserved/protected, and only used for producing these service
• For example, Yellowstone, Yosemite…
Resource allocation (2)
• For independent and complementary uses (Figure 6.4E, 6.4F): Always produce both
• Some environmental services produced by private landowners need not to be compensated (One can value them, but compensation is not necessary, not efficient, and not fair)
Resource allocation (3)• For competing use (timber and ecosystem services):
the allocation of resource depends on the relative value/price
• But most environmental services are not priced
• There is little incentive to supply them• Yet, a growing population and rising personal income
increase the demand for these services (environmental Kuznets curve?)
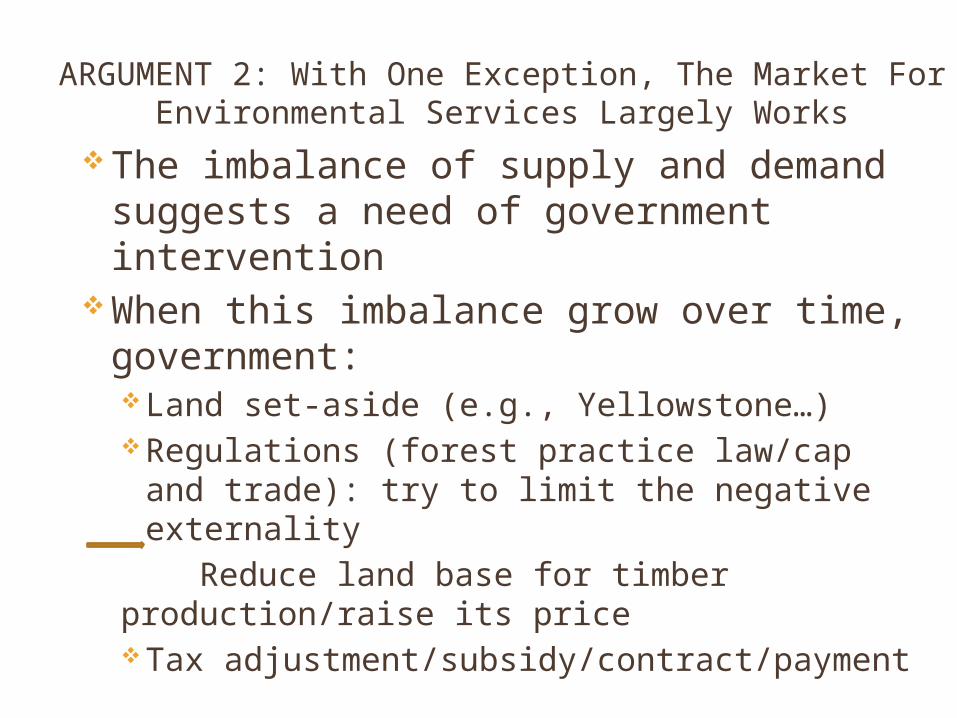
ARGUMENT 2: With One Exception, The Market For Environmental Services Largely Works
The imbalance of supply and demand suggests a need of government intervention
When this imbalance grow over time, government: Land set-aside (e.g., Yellowstone…) Regulations (forest practice law/cap and
trade): try to limit the negative externality Reduce land base for timber production/raise its price Tax adjustment/subsidy/contract/payment
A Political Market For Environmental Services
Supplier---politiciansDemanders---the public Is the political market for environmental
services effective and efficient? Can it meets the demand of the public for
these services? Can it restrict the negative externality in a
efficient way? YES, NO, Maybe. What is the better
alternative other than this political market?

Summary for my first 2 arguments• Efficient allocation of competing uses is
based on the relative value/price• Even though most environmental services
are not priced, and their supply mostly depend political process, their demand/supply is affected by the development of timber side of the forest sector
• Human demand for environmental services influence the supply/price of timber
• Through market and mostly politics, society decides how much forests are used to produce timber and environmental services, either exclusively or jointly
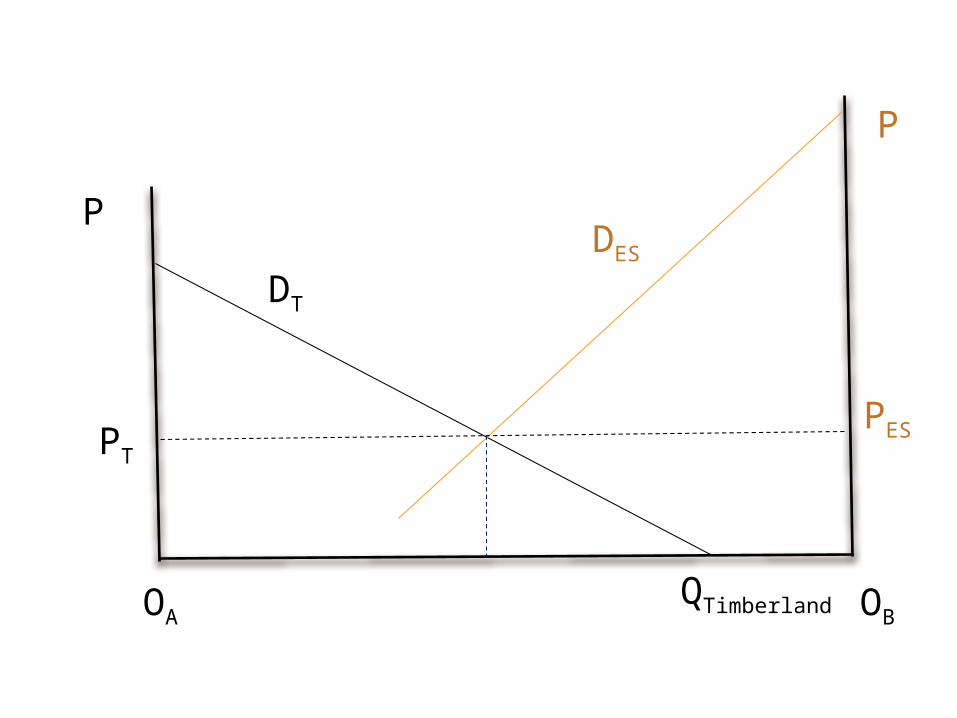
ARGUMENT 3: There Is A Tradeoff
These environmental services be valued from the supply-side
Tradeoff is made at the margin
Thus, the focus of this paper is “marginal benefits”, not total benefit
OA OB
DT
DESP
P
QTimberland
PTPES
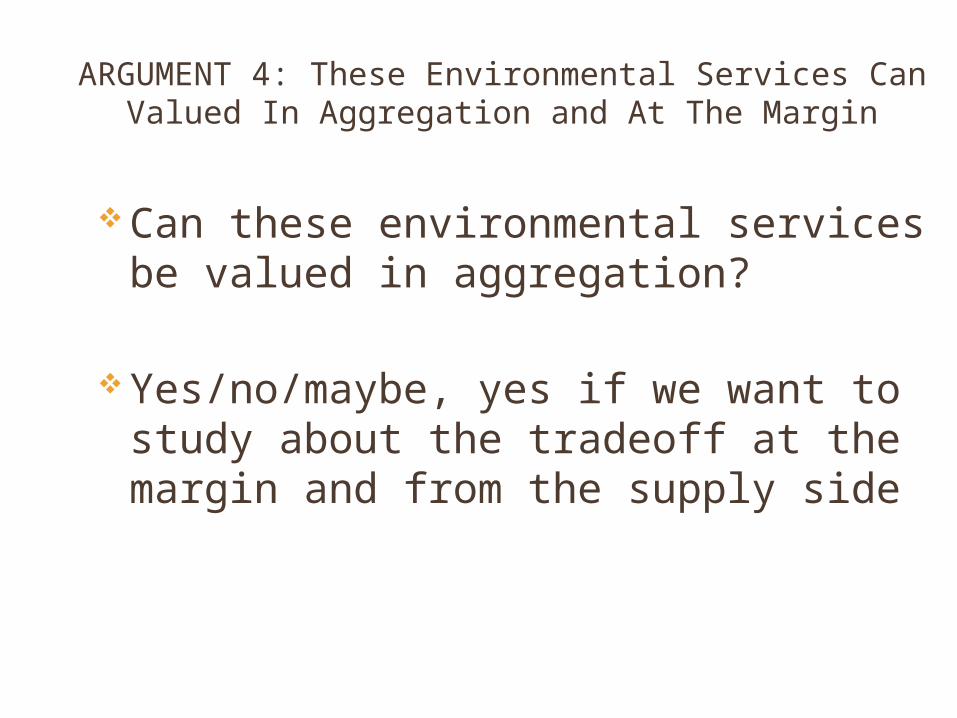
ARGUMENT 4: These Environmental Services Can Valued In Aggregation and At The Margin
Can these environmental services be valued in aggregation?
Yes/no/maybe, yes if we want to study about the tradeoff at the margin and from the supply side

All are produced from forests; vary with forest age + structure
Often not priced Demand: increase with income Supply:
A lot of public good in nature (non-exclusiveness + non-rivalry)
Some aspect of private good, which is taken care of in the market
There is nothing wrong to think them as one, theoretically
I Argue They Can Be Aggregated
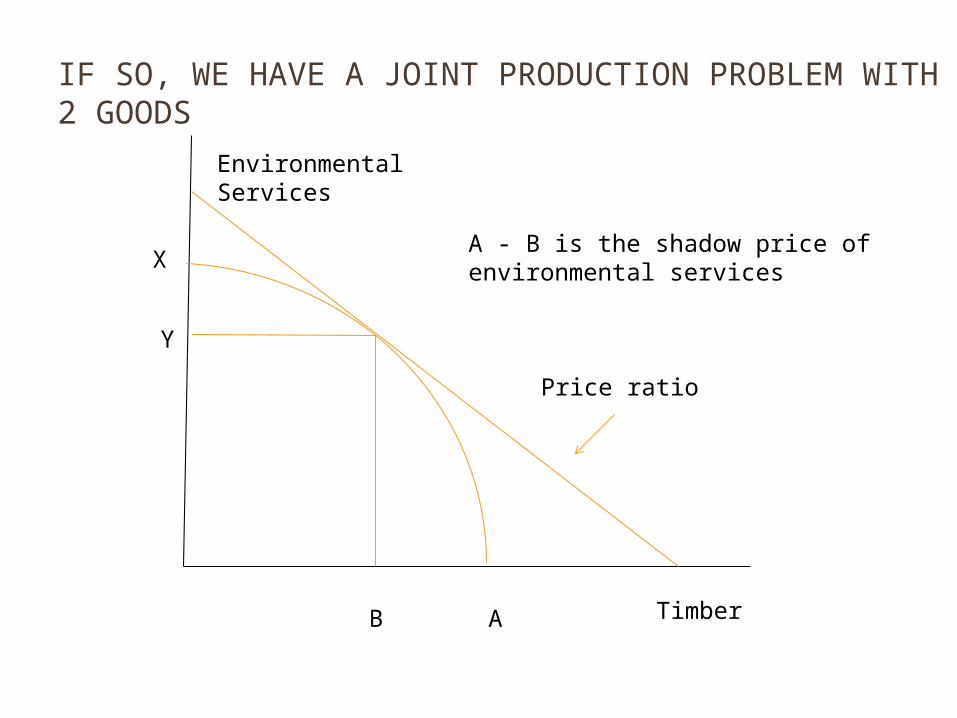
IF SO, WE HAVE A JOINT PRODUCTION PROBLEM WITH 2 GOODS
Environmental Services
Timber
Price ratio
B A
X
Y
A - B is the shadow price of environmental services
Dynamics In The Forest Sector In The Long-run And Large Scale
Timber/Environmental services Joint production of timber and
environmental services from forests in a country
Estimating Shadow price of environmental services
Let us think about timber only at first

Faustmann Formula: Timber Only
Price P(t) is a function of time land expectation value of a typical old-growth forest
long-term balance relationship
Adding an afforestation cost (or reforestation cost, C) will only modify the RHS term slightly

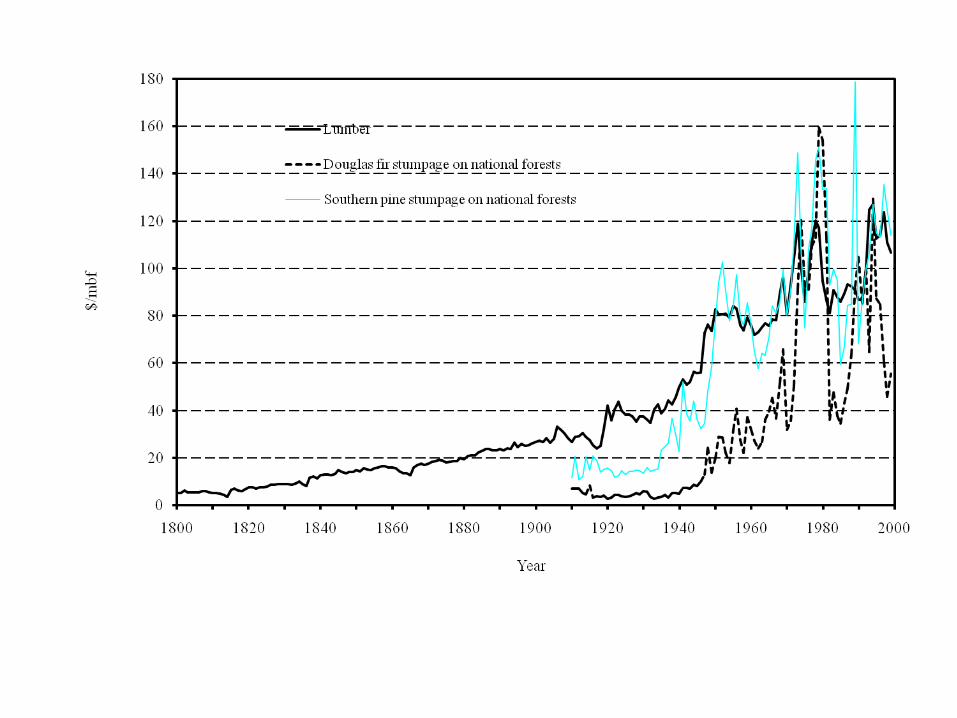
Timber Production In The U.S.
European settlement: timber was harvested for building materials and fuel wood land was cleared for pasture and agriculture
As timber inventory declines, timber becomes increasingly scarce and prices increase
Price rise is not limitless as shifts in extensive margin forest protection plantation forests Technology change in manufacturing Substitution

Now Adding Environmental Services
Demand is increasing, but most are not priced Likely (undersupply) in a market economy Government steps in periodically to reflect
society’s desire Governmental means
Public ownership –land set-aside; less timber harvesting
Regulations of private forestry – BMPs Subsidy – Conservation Reserve Program Tax --- lower tax for timber income/reforestation tax
credits Private means
Private demand (thus supply through private means) increases along with income
All government + private means change the price and volume…
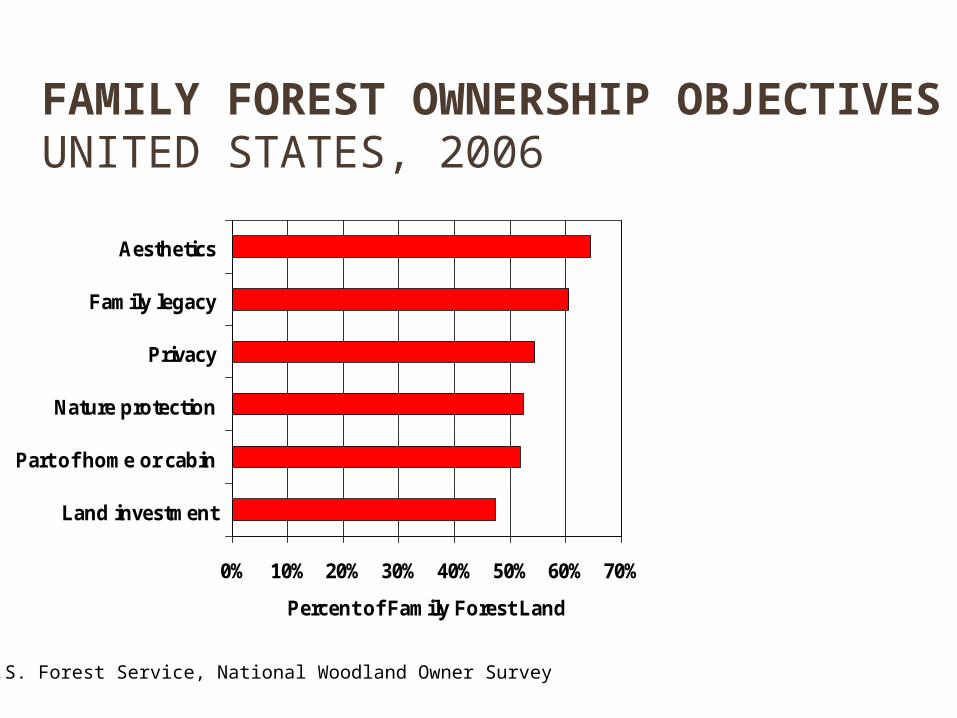
FAMILY FOREST OWNERSHIP OBJECTIVESUNITED STATES, 2006
0% 10% 20% 30% 40% 50% 60% 70%
Land investment
Part of home or cabin
Nature protection
Privacy
Family legacy
Aesthetics
Percent of Family Forest Land
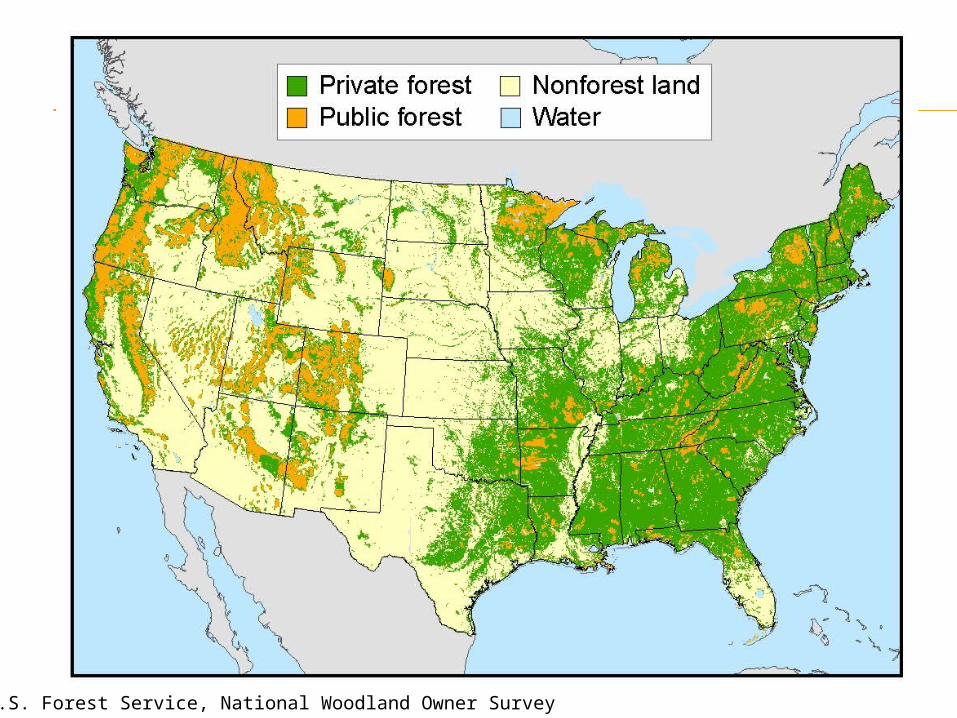
U.S. Forest Service, National Woodland Owner Survey
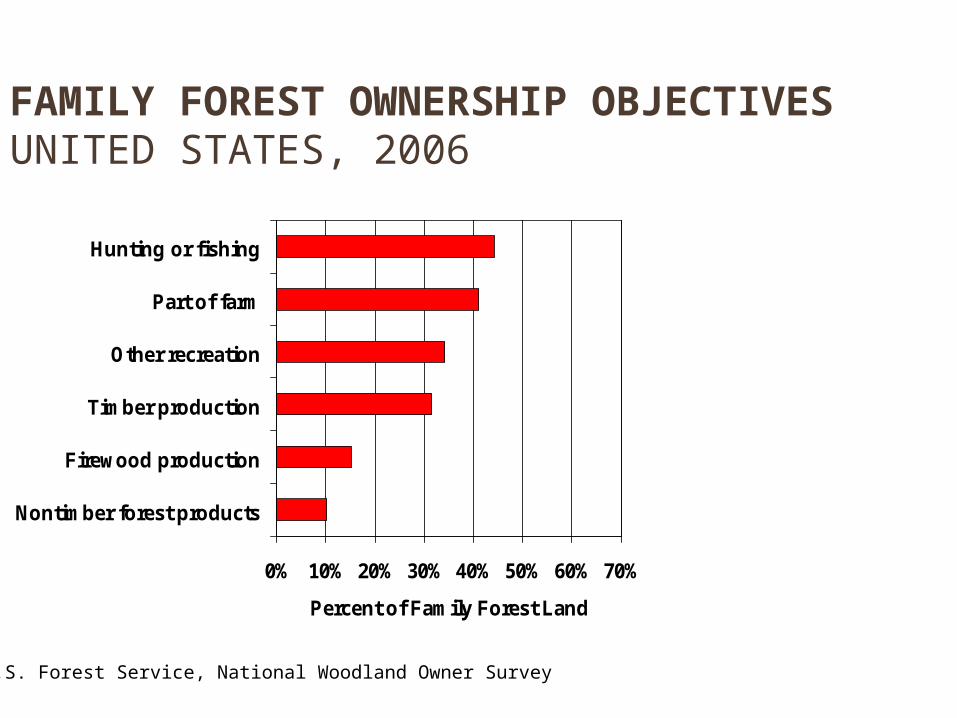
FAMILY FOREST OWNERSHIP OBJECTIVESUNITED STATES, 2006
0% 10% 20% 30% 40% 50% 60% 70%
Nontimber forest products
Firewood production
Timber production
Other recreation
Part of farm
Hunting or fishing
Percent of Family Forest Land
U.S. Forest Service, National Woodland Owner Survey
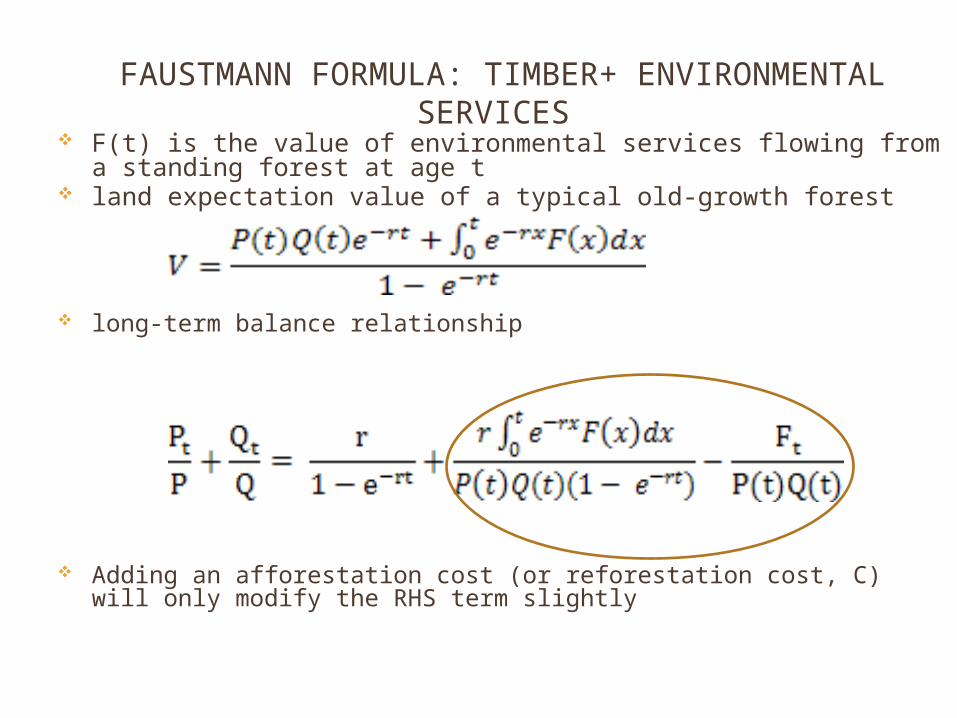
FAUSTMANN FORMULA: TIMBER+ ENVIRONMENTAL SERVICES
F(t) is the value of environmental services flowing from a standing forest at age t
land expectation value of a typical old-growth forest
long-term balance relationship
Adding an afforestation cost (or reforestation cost, C) will only modify the RHS term slightly
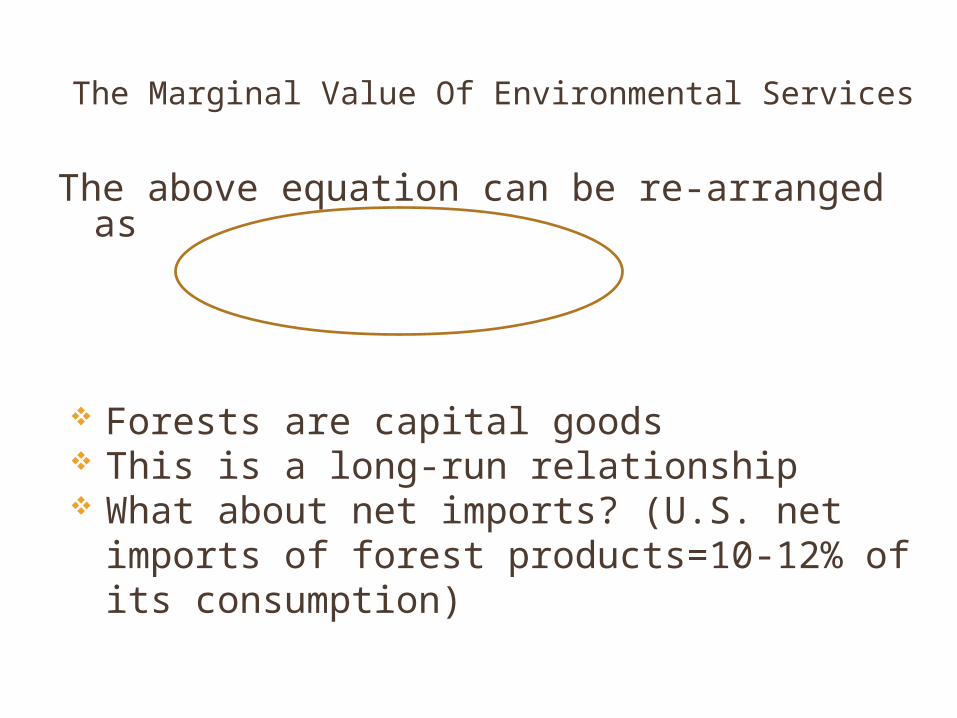
The Marginal Value Of Environmental Services
The above equation can be re-arranged as
Forests are capital goods This is a long-run relationship What about net imports? (U.S. net imports
of forest products=10-12% of its consumption)
U.S. Forest Service, National Woodland Owner Survey

Softwood And Hardwood Growing Stock Volume, Net Growth And Growth Rate, 1977 To 2002
Volume (million cf) Net growth (million cf) Growth rate
Softwood Hardwood Total Softwood Hardwood Total Softwood Hardwood Total
1977 466960 266096 733056 12501.3 9425 21926.3 2.68 3.54 2.991987 467575 314081 781656 12520 9562.4 22082.4 2.68 3.04 2.831992 449895 335722 785617 11973.9 9652.3 21626.2 2.66 2.88 2.751997 483855 351816 835671 13393.5 10155.7 23549.2 2.77 2.89 2.822002 491800 364257 856057 13666.5 10022.3 23688.8 2.78 2.75 2.77
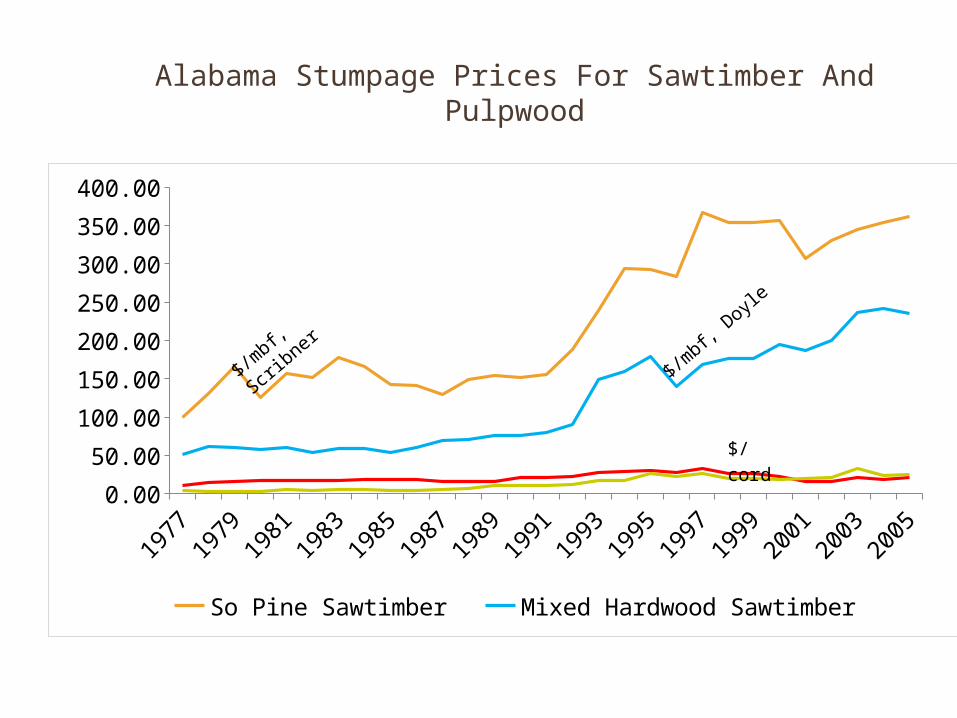
Alabama Stumpage Prices For Sawtimber And Pulpwood
1977
1979
1981
1983
1985
1987
1989
1991
1993
1995
1997
1999
2001
2003
2005
0.00
50.00
100.00
150.00
200.00
250.00
300.00
350.00
400.00
So Pine Sawtimber Mixed Hardwood Sawtimber
$/mbf,
Doyle
$/cord
$/mbf,
Scrib
ner
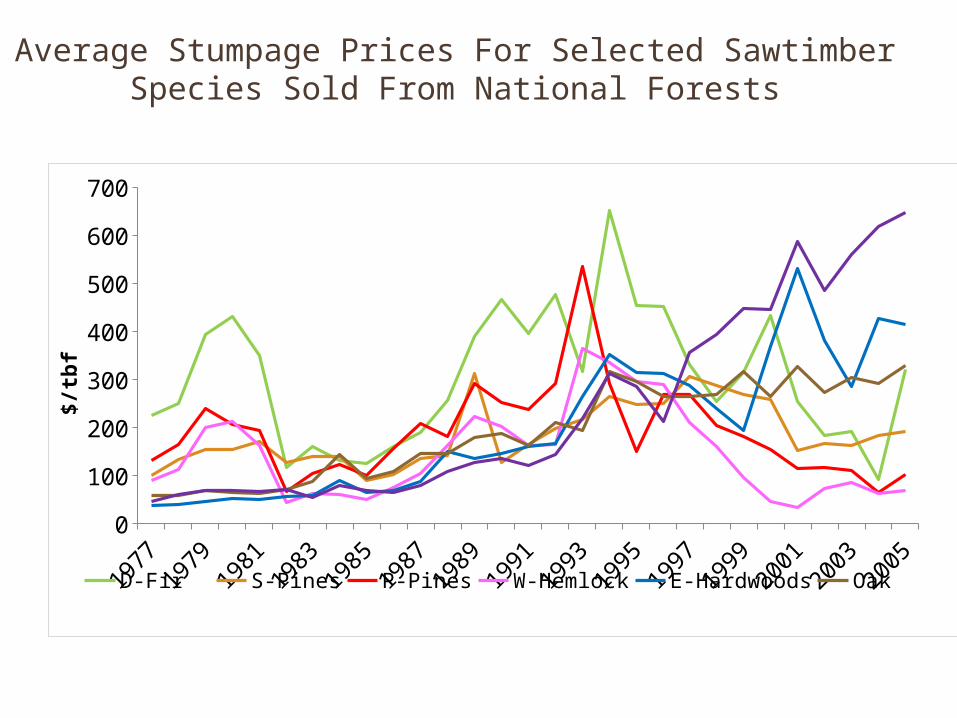
Average Stumpage Prices For Selected Sawtimber Species Sold From National Forests
1977
1979
1981
1983
1985
1987
1989
1991
1993
1995
1997
1999
2001
2003
2005
0
100
200
300
400
500
600
700
D-Fir S-Pines P-Pines W-Hemlock E-Hardwoods Oak
$/t
bf
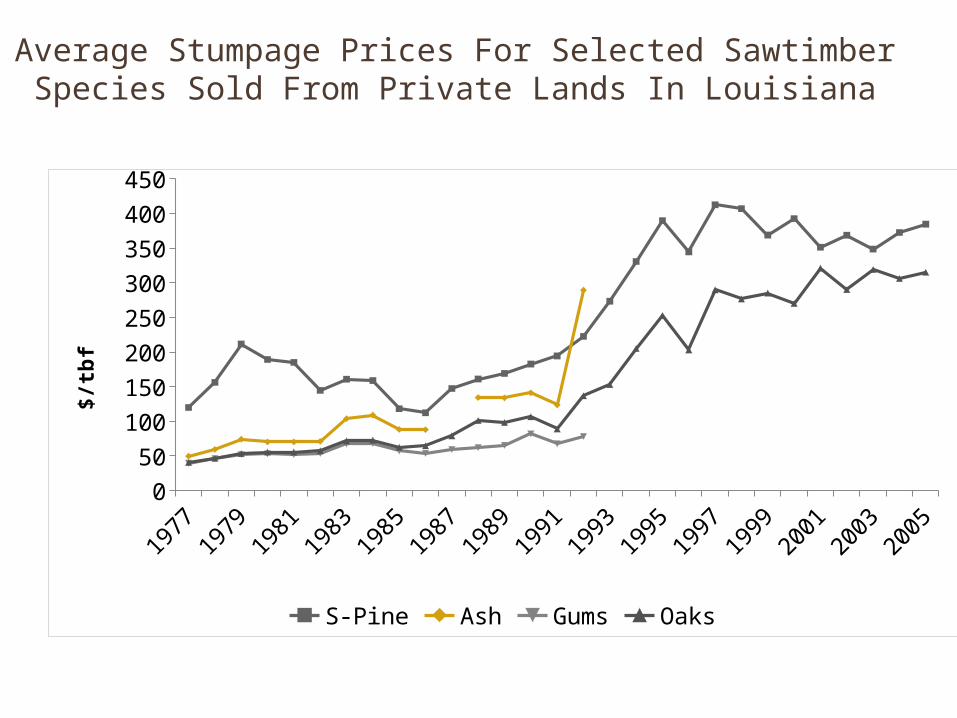
Average Stumpage Prices For Selected Sawtimber Species Sold From Private Lands In Louisiana
1977
1979
1981
1983
1985
1987
1989
1991
1993
1995
1997
1999
2001
2003
2005
0
50
100
150
200
250
300
350
400
450
S-Pine Ash Gums Oaks
$/t
bf
1977
1979
1981
1983
1985
1987
1989
1991
1993
1995
1997
1999
2001
2003
2005
0123456789
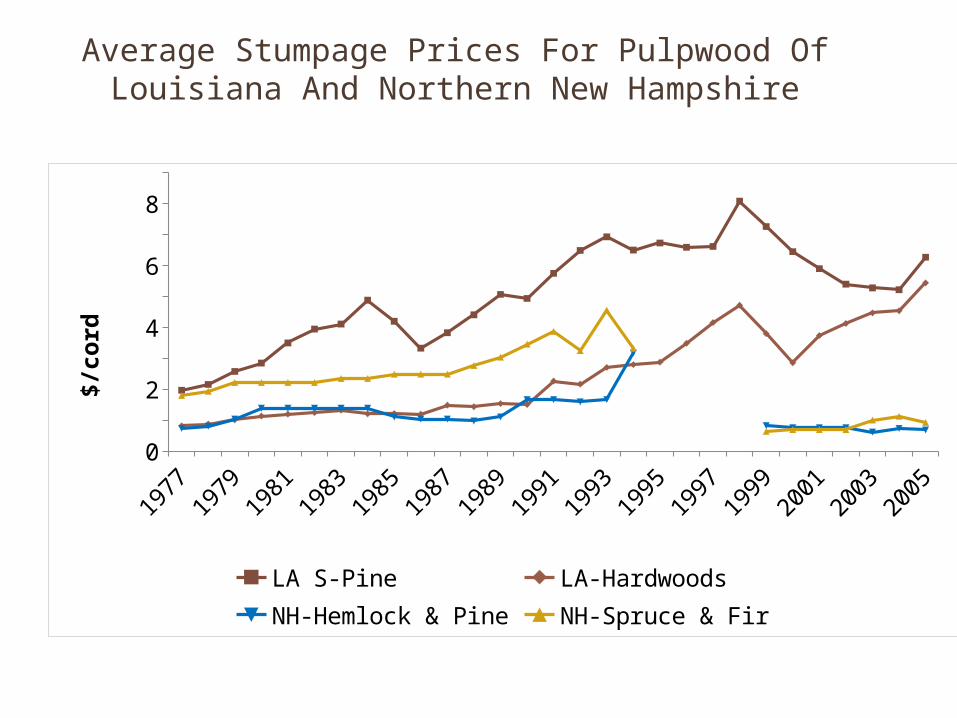
LA S-Pine LA-HardwoodsNH-Hemlock & Pine NH-Spruce & Fir
$/c
ord
Average Stumpage Prices For Pulpwood Of Louisiana And Northern New Hampshire
0.88%
(in real terms)In The U.S. South
From 1956 to 2005
The Weighted Average Rate Of Annual Change in Stumpage Priceis
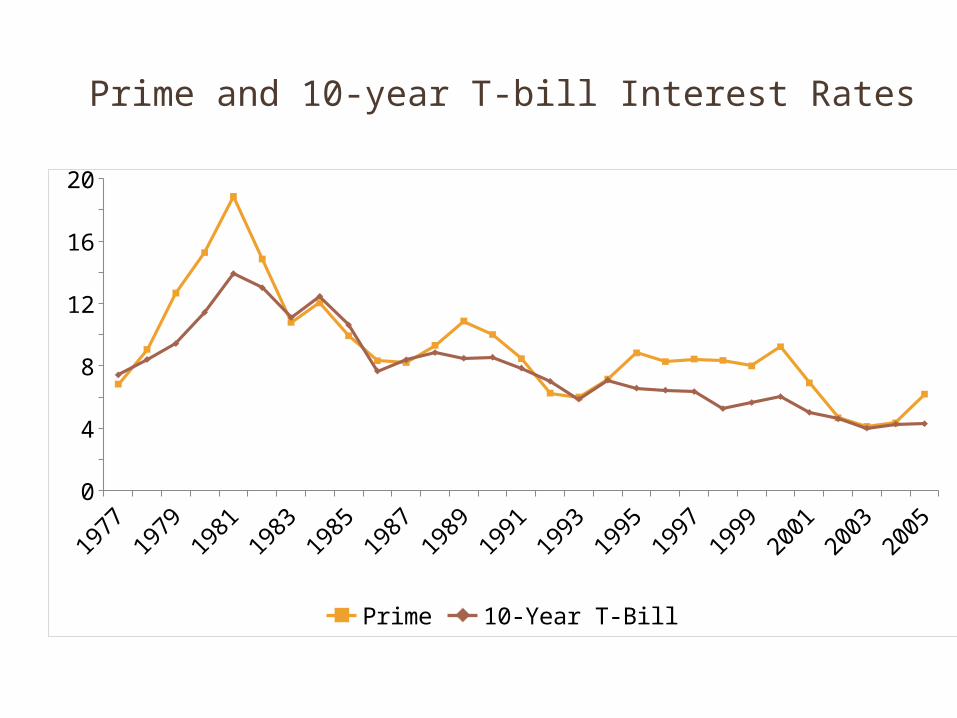
Prime and 10-year T-bill Interest Rates
1977
1979
1981
1983
1985
1987
1989
1991
1993
1995
1997
1999
2001
2003
2005
02468
101214161820
Prime 10-Year T-Bill
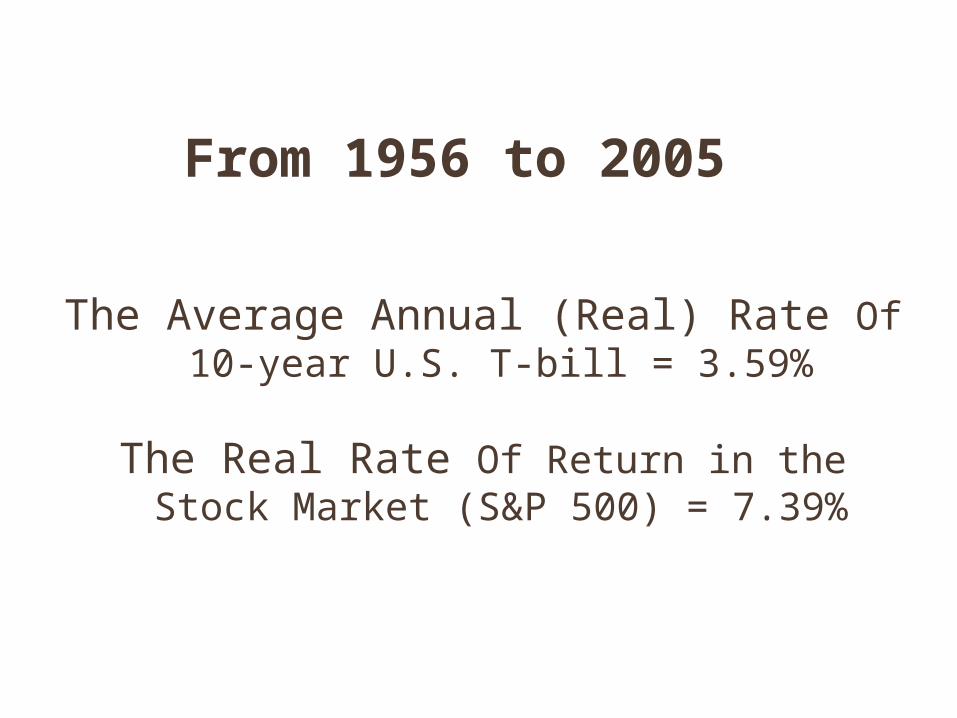
The Average Annual (Real) Rate Of 10-year U.S. T-bill = 3.59%
The Real Rate Of Return in the Stock Market (S&P 500) = 7.39%
From 1956 to 2005
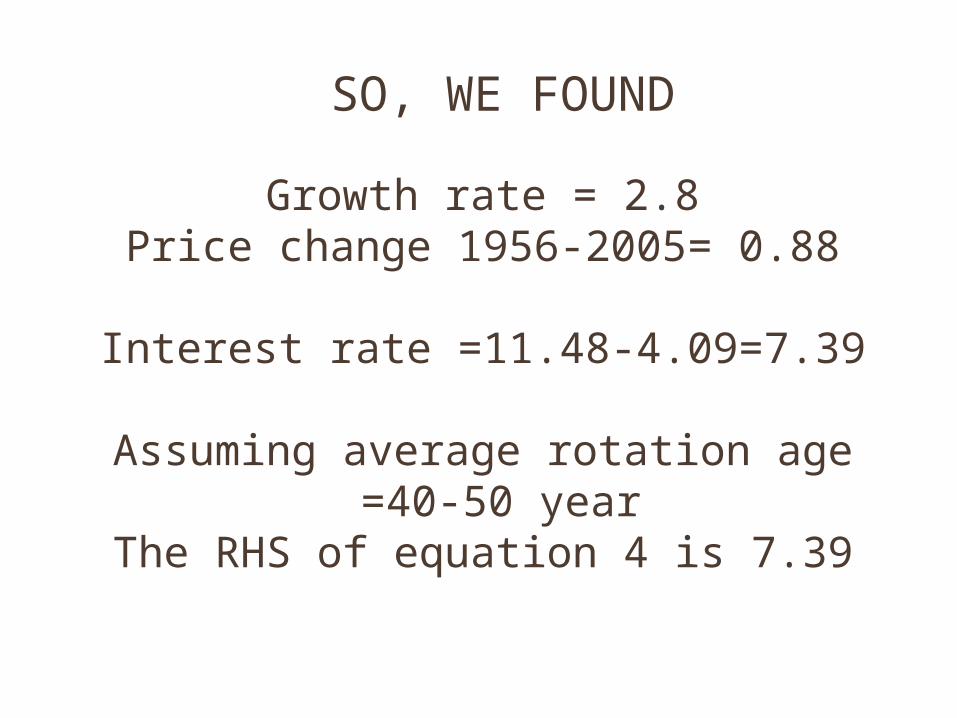
Growth rate = 2.8Price change 1956-2005= 0.88
Interest rate =11.48-4.09=7.39
Assuming average rotation age =40-50 year
The RHS of equation 4 is 7.39
SO, WE FOUND

Equation 4Left-hand-side=2.8%+0.88%=3.68%
Right-hand-side=7.39%
7.39% - 4.68%=3.71%
This 3.71% represents the disparity (margin) between managing the forests for timber and environmental services, and managing the forests for timber alone
LONG TERM (IM)BALANCE

margin = 3.71% average stumpage price in Alabama in 2005
= $1.03/ft3
U.S. forest growing stock in 2005 = 856 billion ft3
$33.25 billon of environmental services(Forest Sector’s contribution to US GDP = 1.0%
or $121 billion in 2005)
SHADOW PRICE OF ENVIRONMENTAL SERVICES

Is this a valid method? Based on marginal analysis from the
supply-side Consistent with economic theory
(tradeoff) Using a stand-level model to the whole
forest sector in a country? Results does not fluctuate much in the
long-run, but it does not work in the short-run (r and P fluctuate too much) or a small region (Q fluctuate too much)
What interest rate to use? The MBES may become negative!
Cannot assume all timber growth is for the value of timber! There is an environmental service component in it
DISCUSSION (1)

Does society/political + economic markets behave efficiently? In the long-run, maybe
Can we aggregate all environmental services?
What about the total value of environmental services in other forests (not timberland)?
If the method is valid, I plan to ….
DISCUSSION (2)
SUMMARY Purpose/Motivations Methods
Assumptions: 1 good (timber) / 1 service ( all environmental services in aggregation)
The political market for environmental services influence the timber market /production and vise versa (there is a tradeoff)
Dynamic Faustmann formula Results
Discussion