Embed Size (px)
Citation preview
THE EFFECT OF SUGAR CONCENTRATION IN WATER ON THE GROWTH OF PLANTBjay Hyun
PROBLEM STATEMENT/HYPOTHESIS
Will the sugar concentration affect the pinto bean plant growth?
If the concentration of sugar levels in water increases then plants will grow less.
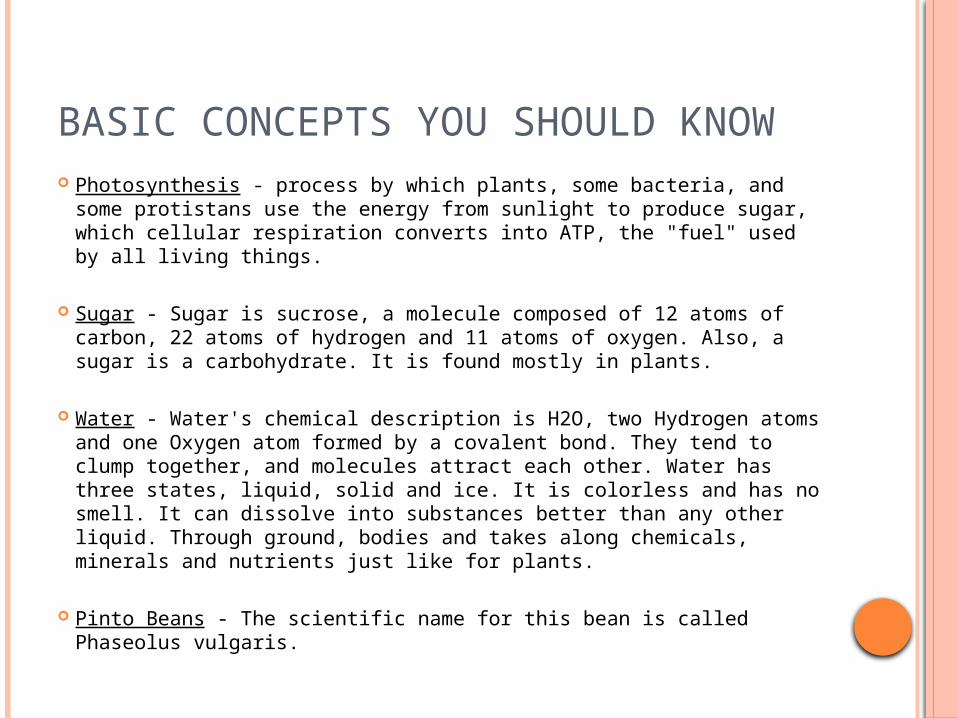
BASIC CONCEPTS YOU SHOULD KNOW Photosynthesis - process by which plants, some bacteria, and some
protistans use the energy from sunlight to produce sugar, which cellular respiration converts into ATP, the "fuel" used by all liv-ing things.
Sugar - Sugar is sucrose, a molecule composed of 12 atoms of car-
bon, 22 atoms of hydrogen and 11 atoms of oxygen. Also, a sugar is a carbohydrate. It is found mostly in plants.
Water - Water's chemical description is H2O, two Hydrogen atoms and one Oxygen atom formed by a covalent bond. They tend to clump together, and molecules attract each other. Water has three states, liquid, solid and ice. It is colorless and has no smell. It can dissolve into substances better than any other liquid. Through ground, bodies and takes along chemicals, minerals and nutrients just like for plants.
Pinto Beans - The scientific name for this bean is called Phaseolus vulgaris.
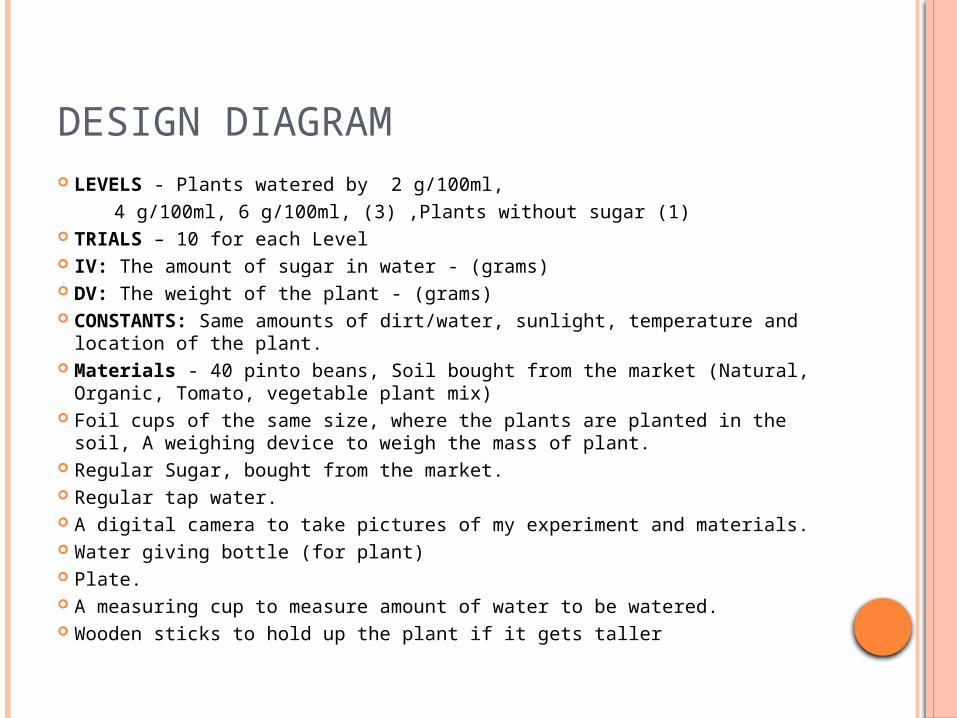
DESIGN DIAGRAM LEVELS - Plants watered by 2 g/100ml, 4 g/100ml, 6 g/100ml, (3) ,Plants without sugar (1) TRIALS – 10 for each Level IV: The amount of sugar in water - (grams) DV: The weight of the plant - (grams) CONSTANTS: Same amounts of dirt/water, sunlight, temperature and
location of the plant. Materials - 40 pinto beans, Soil bought from the market (Natural, Or-
ganic, Tomato, vegetable plant mix) Foil cups of the same size, where the plants are planted in the soil, A
weighing device to weigh the mass of plant. Regular Sugar, bought from the market. Regular tap water. A digital camera to take pictures of my experiment and materials. Water giving bottle (for plant) Plate. A measuring cup to measure amount of water to be watered. Wooden sticks to hold up the plant if it gets taller
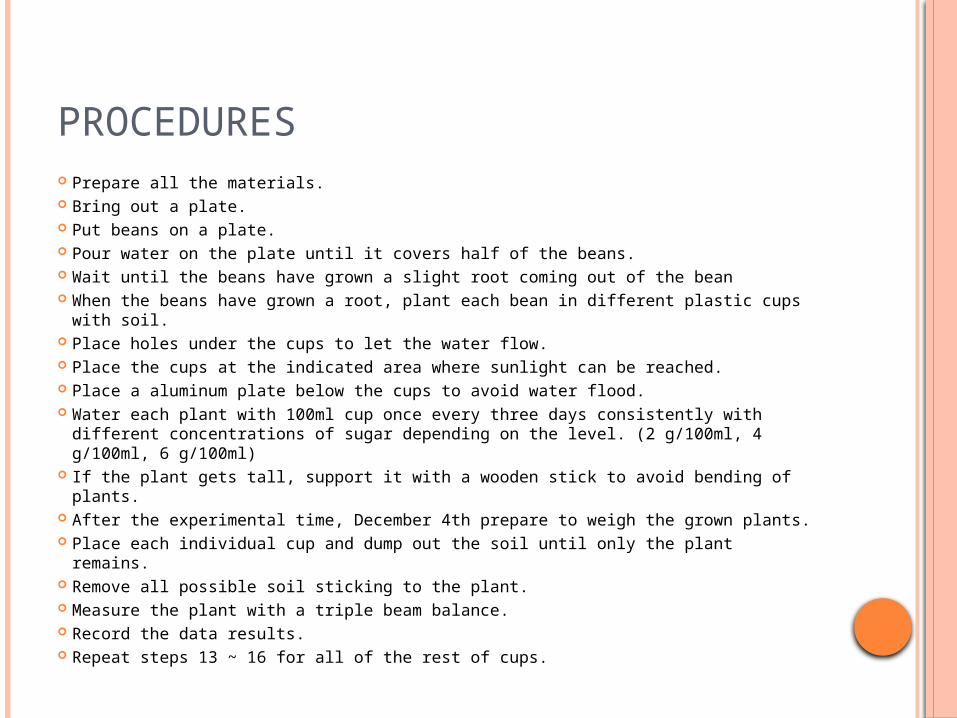
PROCEDURES Prepare all the materials. Bring out a plate. Put beans on a plate. Pour water on the plate until it covers half of the beans. Wait until the beans have grown a slight root coming out of the bean When the beans have grown a root, plant each bean in different plastic cups
with soil. Place holes under the cups to let the water flow. Place the cups at the indicated area where sunlight can be reached. Place a aluminum plate below the cups to avoid water flood. Water each plant with 100ml cup once every three days consistently with
different concentrations of sugar depending on the level. (2 g/100ml, 4 g/100ml, 6 g/100ml)
If the plant gets tall, support it with a wooden stick to avoid bending of plants. After the experimental time, December 4th prepare to weigh the grown plants. Place each individual cup and dump out the soil until only the plant remains. Remove all possible soil sticking to the plant. Measure the plant with a triple beam balance. Record the data results. Repeat steps 13 ~ 16 for all of the rest of cups.
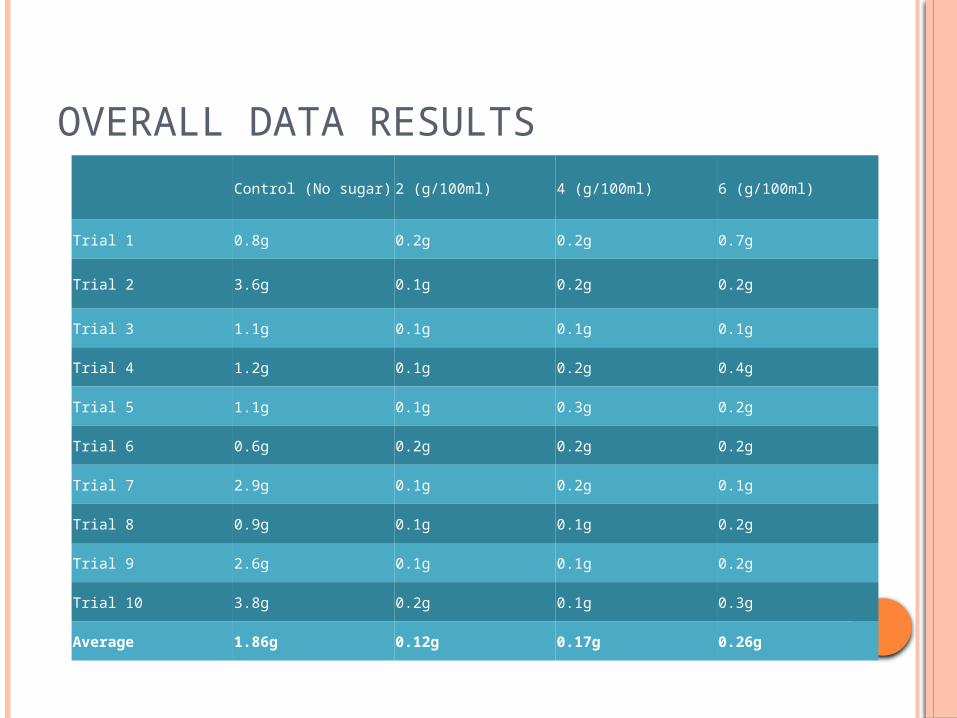
OVERALL DATA RESULTSControl (No sugar) 2 (g/100ml) 4 (g/100ml) 6 (g/100ml)
Trial 1 0.8g 0.2g 0.2g 0.7g
Trial 2 3.6g 0.1g 0.2g 0.2g
Trial 3 1.1g 0.1g 0.1g 0.1g
Trial 4 1.2g 0.1g 0.2g 0.4g
Trial 5 1.1g 0.1g 0.3g 0.2g
Trial 6 0.6g 0.2g 0.2g 0.2g
Trial 7 2.9g 0.1g 0.2g 0.1g
Trial 8 0.9g 0.1g 0.1g 0.2g
Trial 9 2.6g 0.1g 0.1g 0.2g
Trial 10 3.8g 0.2g 0.1g 0.3g
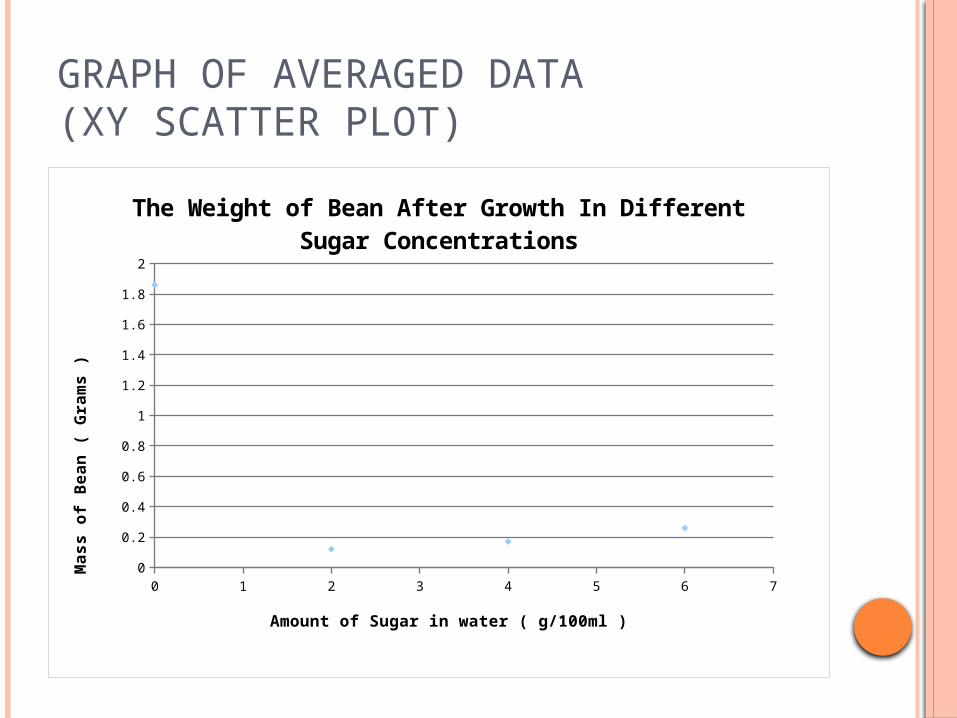
Average 1.86g 0.12g 0.17g 0.26g
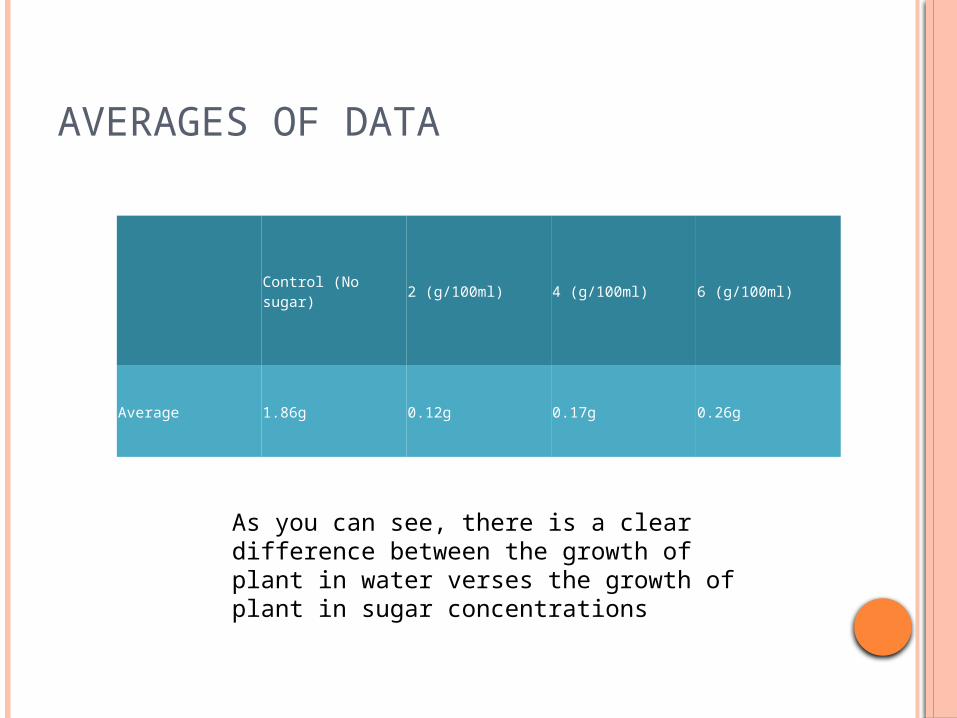
AVERAGES OF DATA
Control (No sugar) 2 (g/100ml) 4 (g/100ml) 6 (g/100ml)
Average 1.86g 0.12g 0.17g 0.26g
As you can see, there is a clear difference between the growth of plant in water verses the growth of plant in sugar concen-trations
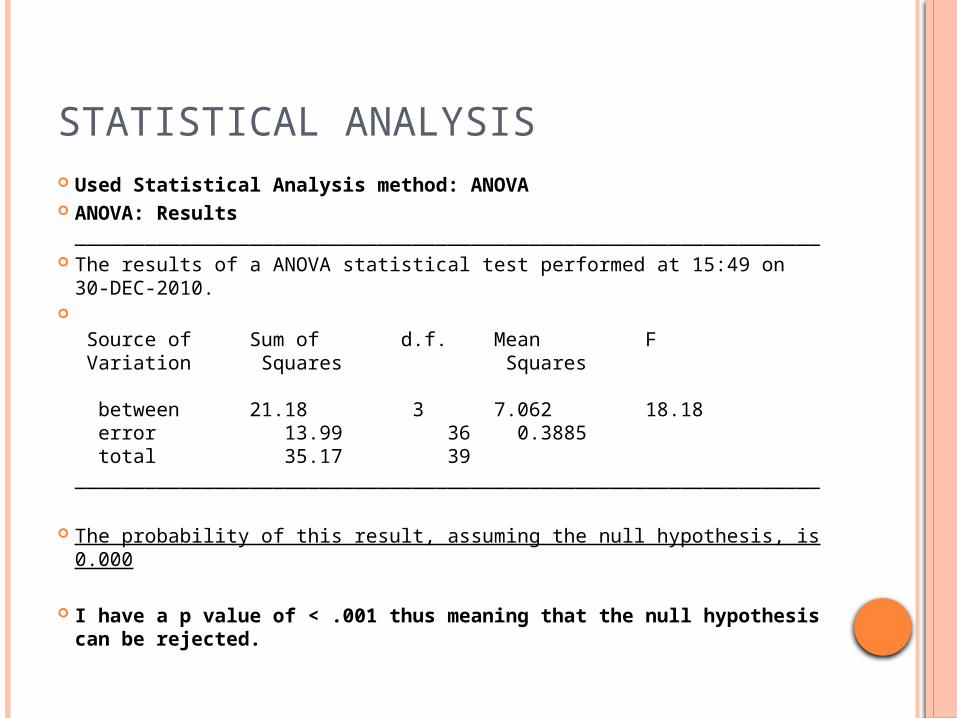
STATISTICAL ANALYSIS Used Statistical Analysis method: ANOVA ANOVA: Results
________________________________________________________________ The results of a ANOVA statistical test performed at 15:49 on 30-
DEC-2010.
Source of Sum of d.f. Mean F Variation Squares Squares
between 21.18 3 7.062 18.18 error 13.99 36 0.3885 total 35.17 39________________________________________________________________
The probability of this result, assuming the null hypothesis, is 0.000
I have a p value of < .001 thus meaning that the null hy-pothesis can be rejected.
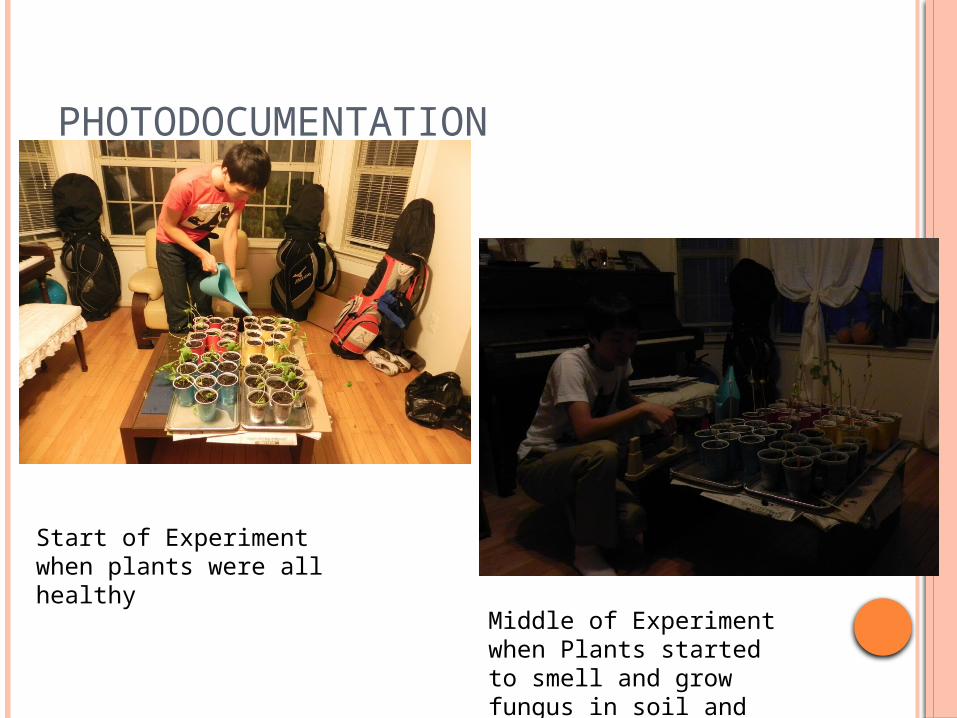
PHOTODOCUMENTATION
Start of Experiment when plants were all healthy
Middle of Experiment when Plants started to smell and grow fungus in soil and die
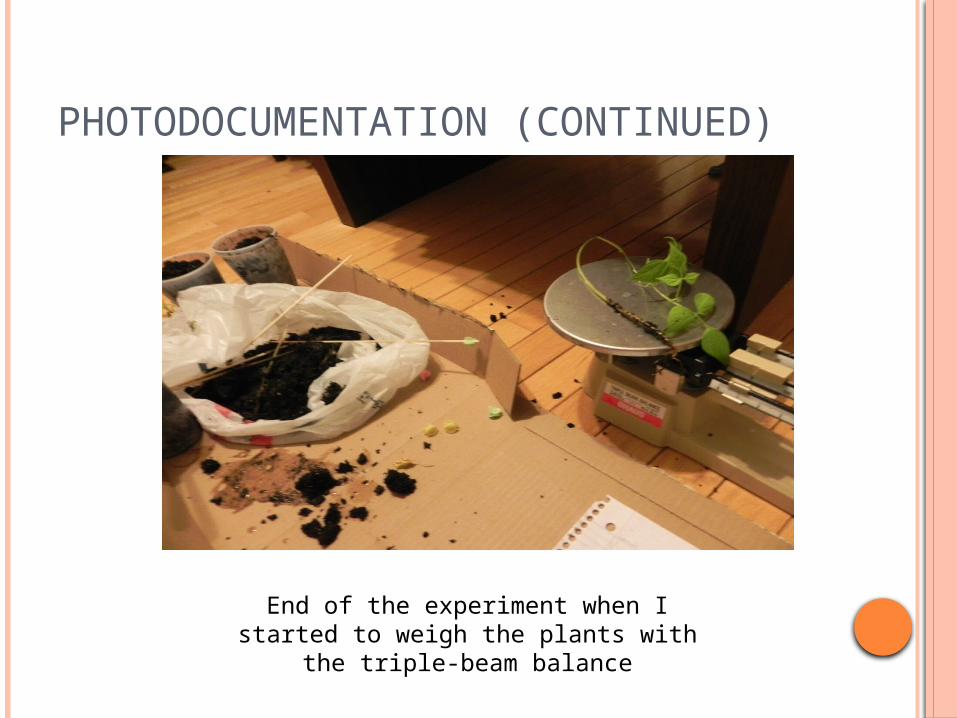
PHOTODOCUMENTATION (CONTIN-UED)
End of the experiment when I started to weigh the plants with the triple-beam bal-
ance
GRAPH OF AVERAGED DATA(XY SCATTER PLOT)
0 1 2 3 4 5 6 70
0.2
0.4
0.6
0.8
1
1.2
1.4
1.6
1.8
2
The Weight of Bean After Growth In Different Sugar Concentrations
Amount of Sugar in water ( g/100ml )
Mass o
f B
ean (
Gra
ms )
CONCLUSIONS
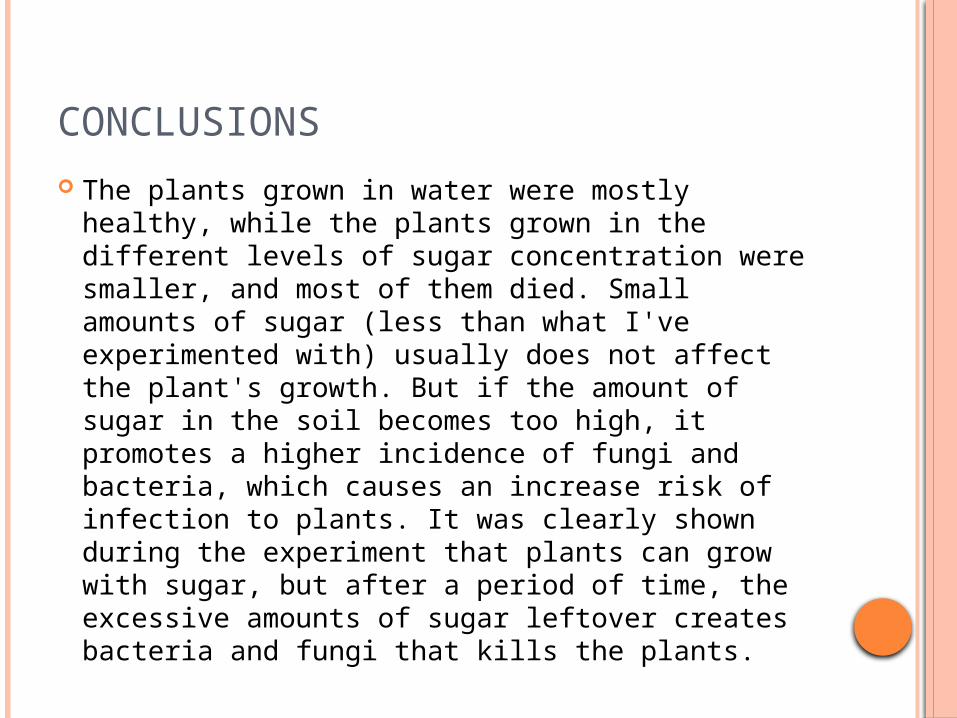
The plants grown in water were mostly healthy, while the plants grown in the different levels of sugar concentration were smaller, and most of them died. Small amounts of sugar (less than what I've experimented with) usually does not affect the plant's growth. But if the amount of sugar in the soil becomes too high, it promotes a higher incidence of fungi and bacteria, which causes an increase risk of infection to plants. It was clearly shown during the experiment that plants can grow with sugar, but after a period of time, the excessive amounts of sugar leftover creates bacteria and fungi that kills the plants.
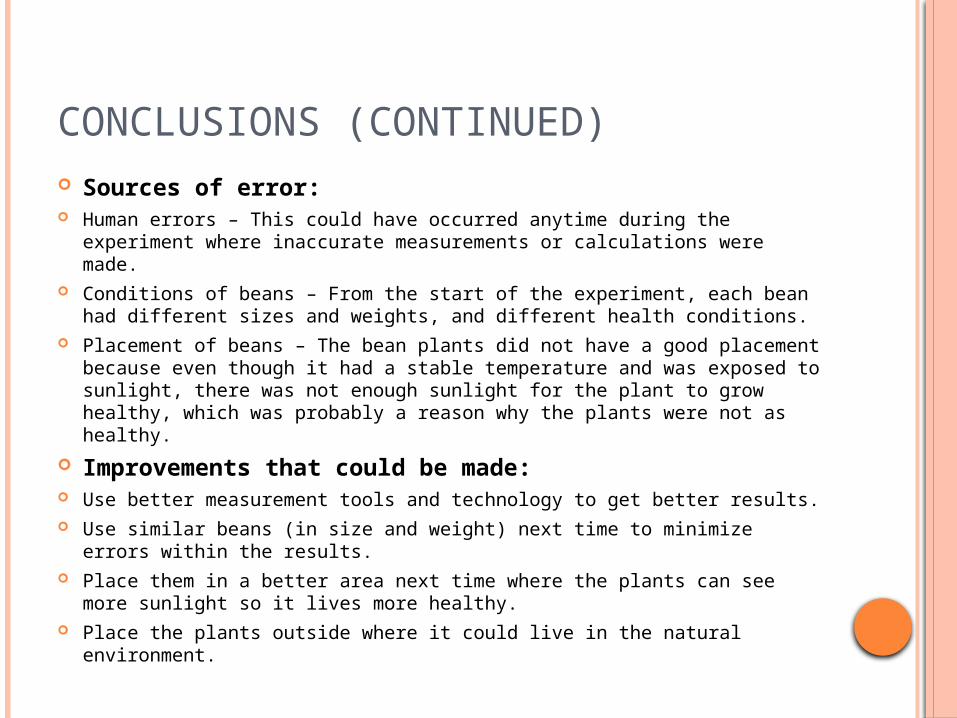
CONCLUSIONS (CONTINUED) Sources of error: Human errors – This could have occurred anytime during the experi-
ment where inaccurate measurements or calculations were made. Conditions of beans – From the start of the experiment, each bean had
different sizes and weights, and different health conditions. Placement of beans – The bean plants did not have a good placement
because even though it had a stable temperature and was exposed to sunlight, there was not enough sunlight for the plant to grow healthy, which was probably a reason why the plants were not as healthy.
Improvements that could be made: Use better measurement tools and technology to get better results. Use similar beans (in size and weight) next time to minimize errors
within the results. Place them in a better area next time where the plants can see more
sunlight so it lives more healthy. Place the plants outside where it could live in the natural environment.
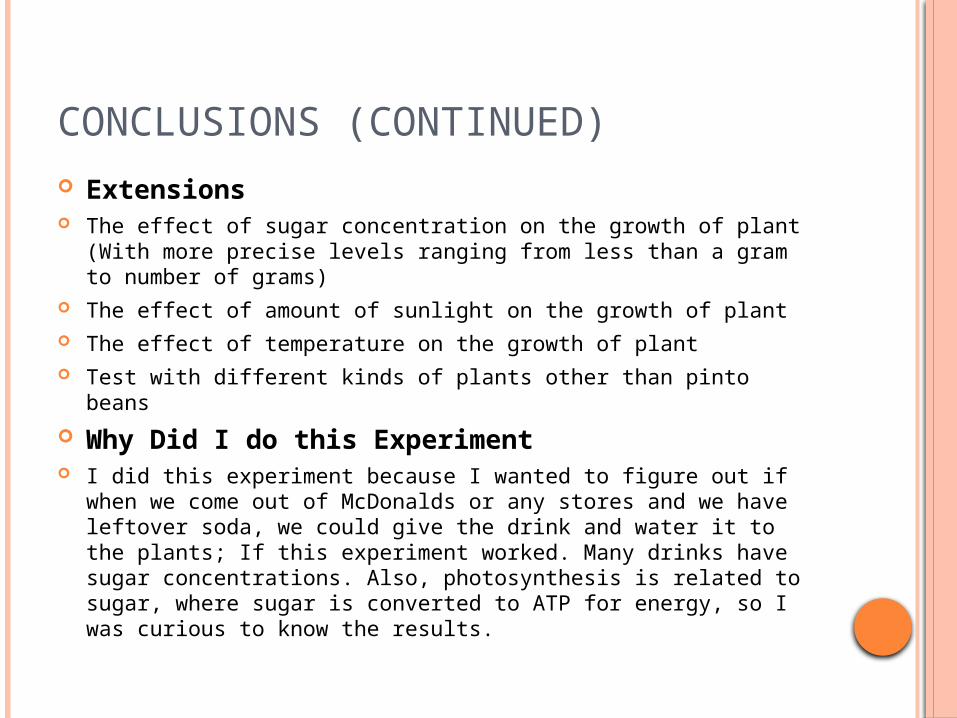
CONCLUSIONS (CONTINUED) Extensions The effect of sugar concentration on the growth of plant (With more
precise levels ranging from less than a gram to number of grams) The effect of amount of sunlight on the growth of plant The effect of temperature on the growth of plant Test with different kinds of plants other than pinto beans
Why Did I do this Experiment I did this experiment because I wanted to figure out if when we
come out of McDonalds or any stores and we have leftover soda, we could give the drink and water it to the plants; If this experiment worked. Many drinks have sugar concentrations. Also, photosynthe-sis is related to sugar, where sugar is converted to ATP for energy, so I was curious to know the results.

THANK YOU TO…
Me and my parents for following the project.
AudienceMrs. P for helping with the project
and the triple-beam balance


![Evaluation of aphrodisiac activity of tamilnadia ulignosa (retz.) bark. 5... · 2017-03-31 · [The Ugar Sugar Works Ltd. Ugar Khurd, Belgaum] REMI research centrifuge (R-24) Borosil](https://img.pdfslide.us/doc/110x75/5e6850ea2ebc9a6afc2aee8f/evaluation-of-aphrodisiac-activity-of-tamilnadia-ulignosa-retz-bark-5.jpg)