Embed Size (px)
Citation preview
Volume 25Issue No. 11Prepared 1/20
State of New JerseyPhilip D. Murphy, Governor
Department of Community AffairsLt. Governor Sheila Y. Oliver, Commissioner
Division of Codes and StandardsEdward M. Smith, Director
T h e N e w J e r s e y
CONSTRUCTIONREPORTER
Distributed by theNew Jersey Department of Community Affairs
Division of Codes and Standards101 South Broad Street • P.O. Box 802 • Trenton, New Jersey 08625-0802
www.nj.gov/dca/divisions/codes/reporter/
November 2019 Data
CommunityA�airsNJ DEPARTMENT OF
the NEW JERSEY CONSTRUCTION REPORTER
Contents
Contents Pages
Highlights i-vi
Background information 1 - 4
Municipal Summary Data MSD 1–10
i
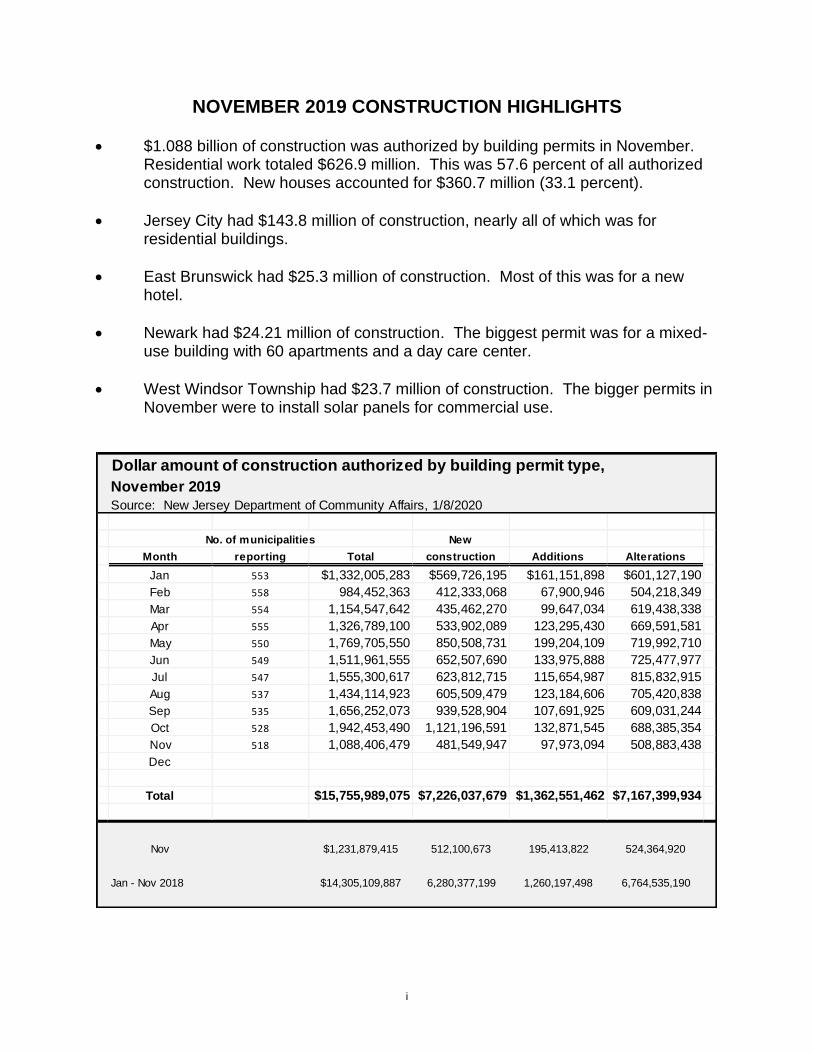
NOVEMBER 2019 CONSTRUCTION HIGHLIGHTS
• $1.088 billion of construction was authorized by building permits in November. Residential work totaled $626.9 million. This was 57.6 percent of all authorized construction. New houses accounted for $360.7 million (33.1 percent).
• Jersey City had $143.8 million of construction, nearly all of which was for residential buildings.
• East Brunswick had $25.3 million of construction. Most of this was for a new hotel.
• Newark had $24.21 million of construction. The biggest permit was for a mixed-use building with 60 apartments and a day care center.
• West Windsor Township had $23.7 million of construction. The bigger permits in November were to install solar panels for commercial use.
Dollar amount of construction authorized by building permit type,
November 2019
Source: New Jersey Department of Community Affairs, 1/8/2020
No. of municipalities New
Month reporting Total construction Additions Alterations
Jan 553 $1,332,005,283 $569,726,195 $161,151,898 $601,127,190
Feb 558 984,452,363 412,333,068 67,900,946 504,218,349
Mar 554 1,154,547,642 435,462,270 99,647,034 619,438,338
Apr 555 1,326,789,100 533,902,089 123,295,430 669,591,581
May 550 1,769,705,550 850,508,731 199,204,109 719,992,710
Jun 549 1,511,961,555 652,507,690 133,975,888 725,477,977
Jul 547 1,555,300,617 623,812,715 115,654,987 815,832,915
Aug 537 1,434,114,923 605,509,479 123,184,606 705,420,838
Sep 535 1,656,252,073 939,528,904 107,691,925 609,031,244
Oct 528 1,942,453,490 1,121,196,591 132,871,545 688,385,354
Nov 518 1,088,406,479 481,549,947 97,973,094 508,883,438
Dec
Total $15,755,989,075 $7,226,037,679 $1,362,551,462 $7,167,399,934
Nov $1,231,879,415 512,100,673 195,413,822 524,364,920
Jan - Nov 2018 $14,305,109,887 6,280,377,199 1,260,197,498 6,764,535,190
ii
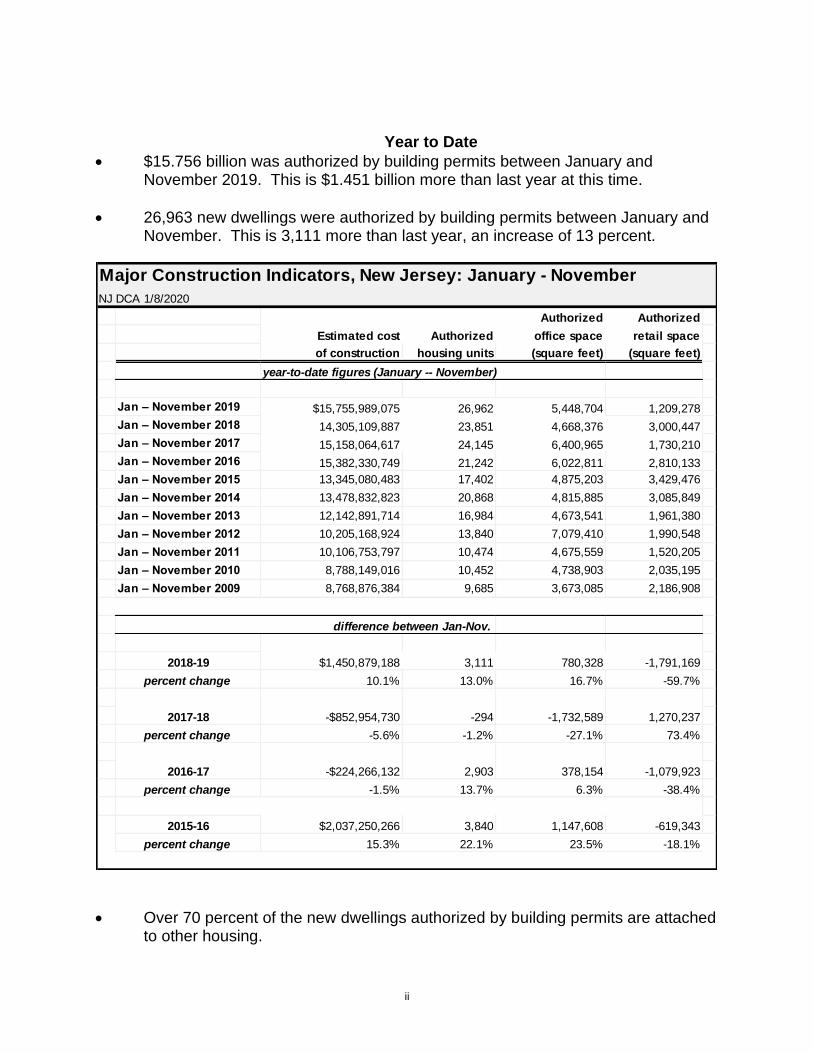
Year to Date
• $15.756 billion was authorized by building permits between January and November 2019. This is $1.451 billion more than last year at this time.
• 26,963 new dwellings were authorized by building permits between January and November. This is 3,111 more than last year, an increase of 13 percent.
Major Construction Indicators, New Jersey: January - November
NJ DCA 1/8/2020
Authorized Authorized
Estimated cost Authorized office space retail space
of construction housing units (square feet) (square feet)
year-to-date figures (January -- November)
Jan – November 2019 $15,755,989,075 26,962 5,448,704 1,209,278
Jan – November 2018 14,305,109,887 23,851 4,668,376 3,000,447
Jan – November 2017 15,158,064,617 24,145 6,400,965 1,730,210
Jan – November 2016 15,382,330,749 21,242 6,022,811 2,810,133
Jan – November 2015 13,345,080,483 17,402 4,875,203 3,429,476
Jan – November 2014 13,478,832,823 20,868 4,815,885 3,085,849
Jan – November 2013 12,142,891,714 16,984 4,673,541 1,961,380
Jan – November 2012 10,205,168,924 13,840 7,079,410 1,990,548
Jan – November 2011 10,106,753,797 10,474 4,675,559 1,520,205
Jan – November 2010 8,788,149,016 10,452 4,738,903 2,035,195
Jan – November 2009 8,768,876,384 9,685 3,673,085 2,186,908
difference between Jan-Nov.
2018-19 $1,450,879,188 3,111 780,328 -1,791,169
percent change 10.1% 13.0% 16.7% -59.7%
2017-18 -$852,954,730 -294 -1,732,589 1,270,237
percent change -5.6% -1.2% -27.1% 73.4%
2016-17 -$224,266,132 2,903 378,154 -1,079,923
percent change -1.5% 13.7% 6.3% -38.4%
2015-16 $2,037,250,266 3,840 1,147,608 -619,343
percent change 15.3% 22.1% 23.5% -18.1%
• Over 70 percent of the new dwellings authorized by building permits are attached to other housing.
iii
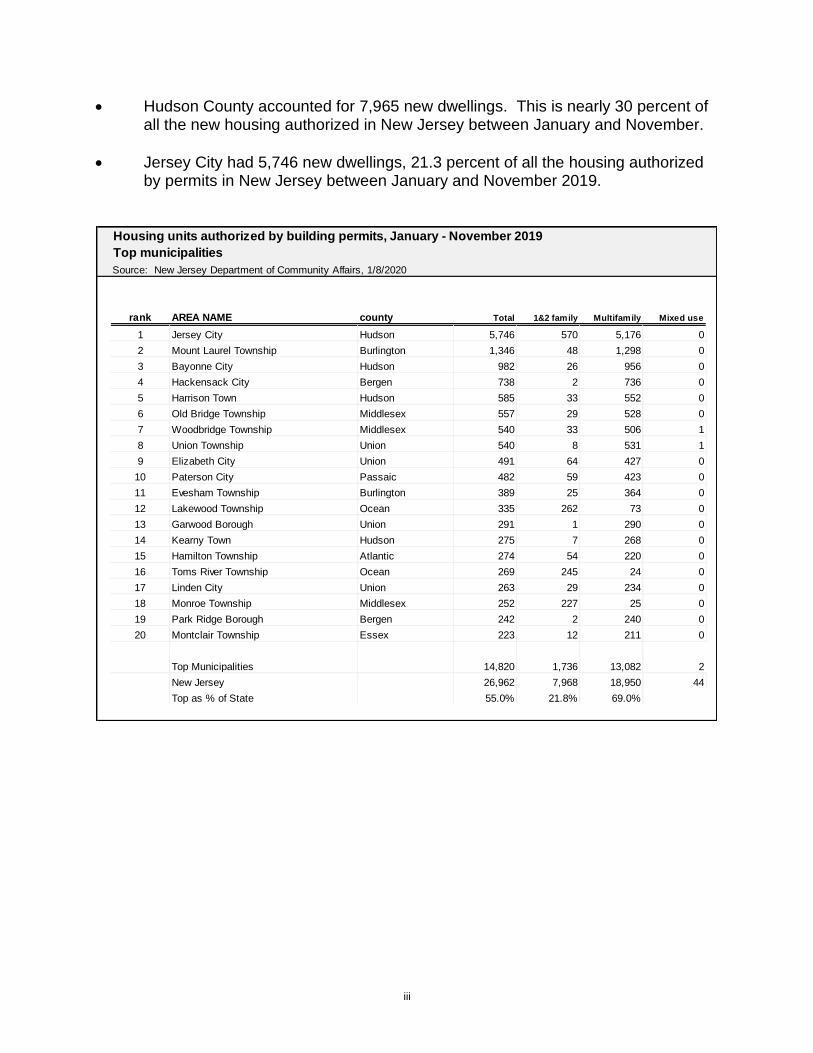
• Hudson County accounted for 7,965 new dwellings. This is nearly 30 percent of all the new housing authorized in New Jersey between January and November.
• Jersey City had 5,746 new dwellings, 21.3 percent of all the housing authorized by permits in New Jersey between January and November 2019.
Housing units authorized by building permits, January - November 2019
Top municipalities
Source: New Jersey Department of Community Affairs, 1/8/2020
rank AREA NAME county Total 1&2 family Multifamily Mixed use
1 Jersey City Hudson 5,746 570 5,176 0
2 Mount Laurel Township Burlington 1,346 48 1,298 0
3 Bayonne City Hudson 982 26 956 0
4 Hackensack City Bergen 738 2 736 0
5 Harrison Town Hudson 585 33 552 0
6 Old Bridge Township Middlesex 557 29 528 0
7 Woodbridge Township Middlesex 540 33 506 1
8 Union Township Union 540 8 531 1
9 Elizabeth City Union 491 64 427 0
10 Paterson City Passaic 482 59 423 0
11 Evesham Township Burlington 389 25 364 0
12 Lakewood Township Ocean 335 262 73 0
13 Garwood Borough Union 291 1 290 0
14 Kearny Town Hudson 275 7 268 0
15 Hamilton Township Atlantic 274 54 220 0
16 Toms River Township Ocean 269 245 24 0
17 Linden City Union 263 29 234 0
18 Monroe Township Middlesex 252 227 25 0
19 Park Ridge Borough Bergen 242 2 240 0
20 Montclair Township Essex 223 12 211 0
Top Municipalities 14,820 1,736 13,082 2
New Jersey 26,962 7,968 18,950 44
Top as % of State 55.0% 21.8% 69.0%
Big permits, 2019
Construction Reporter, 1/8/2020 dollar amt building permit
municpality county permit no. of construction month use type sf descripton
Jersey City Hudson 20193975 279,500,000 10 R-2 NEW 1,129,156 Paulus Hook development, 25 Columbus Dr; 750 apt units, 60 story
Jersey City Hudson 20184390+G 206,000,000 05 R-2 NEW 1 615 Pavonia Av, Journal Sq, 704 apt units broke ground 11/18
Jersey City Hudson 20192583 136,079,000 07 R-2 NEW 497,442 155 Marin Blvd, Liberty Harbor; 452 rentals; 45 stories
Guttenberg Hudson 19-236 130,163,000 10 R-2 NEW 16,930 148-50 70th St
Jersey City Hudson 20182635+A 117,000,000 09 R-2 NEW 576,353 Newport Centre, 700 Washington Blvd; 334 apt units broke ground 8/18
Clifton Passaic 191792 112,550,000 06 B NEW 0 Quest Diagnostics, office / lab; 1153 Bloomfield Av
Jersey City Hudson 20194728 112,262,565 12 R-2 NEW 460,148 155 Bay St, Toll Bros, 259 for-sale dwellings
Cherry Hill Camden 20190017 95,265,809 01 I-2 ADD 238,224 JFK Memorial Hospital addition
Passaic City Passaic 18-60055+I 86,902,400 12 E NEW 1 Dayton Av Educational campus; 39-71 Dayton Av
Jersey City Hudson 20194349 75,150,000 11 R-2 NEW 592,266 400 Claremont Av; 631 dwellings, mixed use
Hackensack Bergen 000020191236 63,800,000 09 R-2 NEW 826,822 2 Kinderkamack Rd; 6-story, 377 apts
Camden City Camden 19-60004+B 63,033,676 12 E NEW 1 public high school; Park and Baird Blvds
Jersey City Hudson 20191843 62,364,637 05 B ADD 93,564 20 Theordore Conrad Dr; Sysco Food Svcs warehouse
Harrington Park Bergen 2019/046 59,566,000 03 R-2 NEW 35,120 Allegro Senior Living includes 85 independent apts
Eatontown Monmouth 19-0293 58,906,000 05 I-2 NEW 36,777 Artis Senior Living; 147 Grant Av; assisted living
Hackensack Bergen 000020191101 55,000,000 08 I-2 NEW 526,750 Hackensack Univ Med Ctr; 2nd St pavilioan; 2nd & Atlantic Sts
Harrison Town Hudson 00020190213U 52,687,817 09 R-2 NEW 263,831 update, 55 1st St; 310 for sale units
Montvale Borough Bergen 000020190614 51,425,000 10 I-2 NEW 210,151 110 Summit Av; Thrive, assisted living & memory care facility
Newark Essex 19CP001970 50,800,000 08 S-1 ALT 0 Newark Airport; United Airlines messanine
Wayne Township Passaic 000020191792 50,685,712 09 I-4 NEW 200,959 1139-51 Hamburg Tpke; Brightview assisted living
Perth Amboy Middlesex 19-0719 45,066,795 10 S-1 NEW 921,085 Home Depot, 221 Riverview Dr
Hackensack Bergen 00020190093U 45,000,000 06 R-2 NEW 385,479 the Wolcott; 435 Main St,235 rental units; broke ground 1/19
Camden City Camden 000020190177 41,507,456 02 F-1 NEW 372,400 Resinpak recycling factory, NE Federal & 17th St; no fee--in transit zone
Raritan Borough Somerset 18-349+F 39,732,600 03 B ALT 0 office fit out, Ortho McNeil Pharmaceutical, 1000 US Rte 202, update 11/18
Elizabeth Unoin 000020191448 39,506,610 09 R-2 NEW 73,725 100-34 Price St; mixed-use, 267 apts
Newark Essex 19CP000796 38,254,500 04 S-2 NEW 239,025 47-63 Green St, Newark Parking Authority; mixed use; parking & retail
Montclair Essex 19-0937 37,442,448 05 R-2 NEW 215,133 Willow St & Bloomfield Av, mixed-use blg; 200 apts, retail, parking;
Paramus Bergen 000020191791 36,845,000 12 B ALT 0 UPS, 670 Winters Av
Hackensack Bergen 000020190029 35,950,000 01 F-1 NEW 43,328 Hackensack Univ Med Ctr; central utility plant; 2nd & Atlantic Sts
Wyckoff Bergen 19-0500 33,700,000 06 R-2 NEW 393,183 the Vista; 199 for-sale dwellings in retirement community; 301 Sicomac Av
Sayreville Middlesex 00020170175U 32,337,000 01 U ALT 0 pump station renovation; Middlesex Co Utility Authority; 56 Canal St
Piscataway Middlesex 20190210 31,880,300 01 A-3 NEW 83,310 community cultural arts center; 5241 Stockton St
Jersey City Hudson 20192070 31,817,541 05 R-2 NEW 161,214 Water St development; 145 apts
Mahwah Township Bergen 19-90222 31,550,000 10 A-3 ADD 79,503 Ramapo College addition & renovation
Lawrence Mercer 00020180513U 30,555,521 01 B NEW 0 permit update; Bristol Myers Squibb blgs M & N; broke ground 4/18
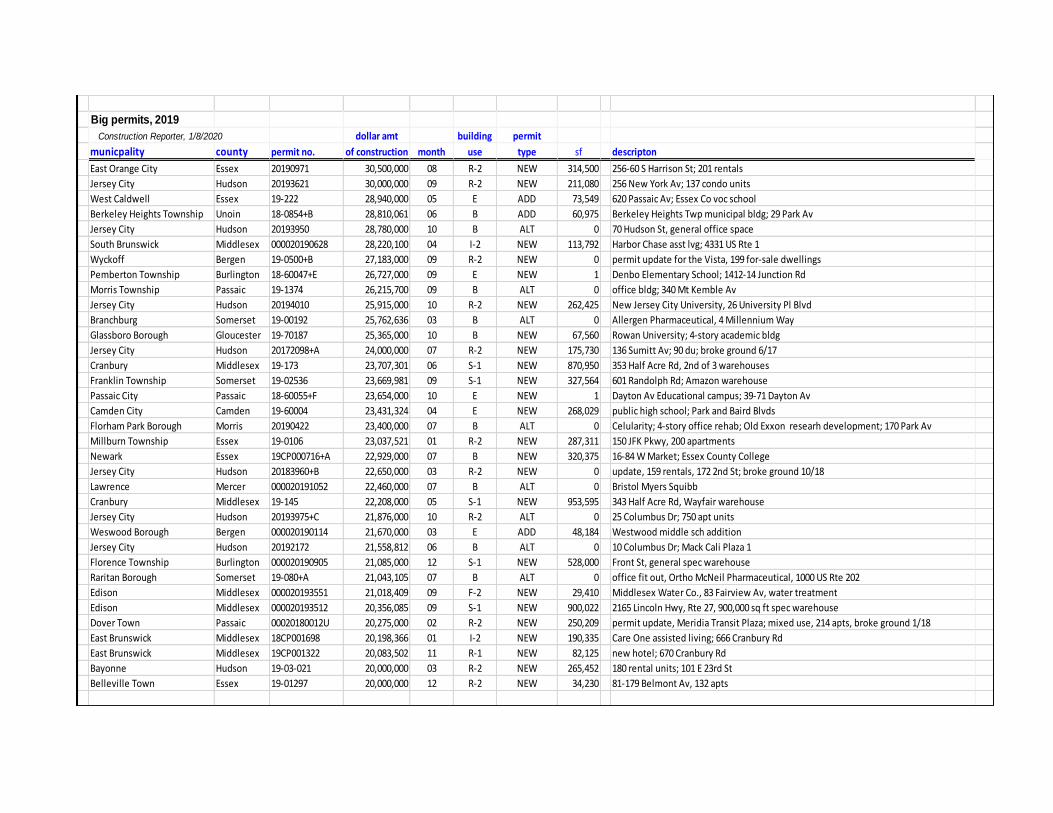
Big permits, 2019
Construction Reporter, 1/8/2020 dollar amt building permit
municpality county permit no. of construction month use type sf descripton
East Orange City Essex 20190971 30,500,000 08 R-2 NEW 314,500 256-60 S Harrison St; 201 rentals
Jersey City Hudson 20193621 30,000,000 09 R-2 NEW 211,080 256 New York Av; 137 condo units
West Caldwell Essex 19-222 28,940,000 05 E ADD 73,549 620 Passaic Av; Essex Co voc school
Berkeley Heights Township Unoin 18-0854+B 28,810,061 06 B ADD 60,975 Berkeley Heights Twp municipal bldg; 29 Park Av
Jersey City Hudson 20193950 28,780,000 10 B ALT 0 70 Hudson St, general office space
South Brunswick Middlesex 000020190628 28,220,100 04 I-2 NEW 113,792 Harbor Chase asst lvg; 4331 US Rte 1
Wyckoff Bergen 19-0500+B 27,183,000 09 R-2 NEW 0 permit update for the Vista, 199 for-sale dwellings
Pemberton Township Burlington 18-60047+E 26,727,000 09 E NEW 1 Denbo Elementary School; 1412-14 Junction Rd
Morris Township Passaic 19-1374 26,215,700 09 B ALT 0 office bldg; 340 Mt Kemble Av
Jersey City Hudson 20194010 25,915,000 10 R-2 NEW 262,425 New Jersey City University, 26 University Pl Blvd
Branchburg Somerset 19-00192 25,762,636 03 B ALT 0 Allergen Pharmaceutical, 4 Millennium Way
Glassboro Borough Gloucester 19-70187 25,365,000 10 B NEW 67,560 Rowan University; 4-story academic bldg
Jersey City Hudson 20172098+A 24,000,000 07 R-2 NEW 175,730 136 Sumitt Av; 90 du; broke ground 6/17
Cranbury Middlesex 19-173 23,707,301 06 S-1 NEW 870,950 353 Half Acre Rd, 2nd of 3 warehouses
Franklin Township Somerset 19-02536 23,669,981 09 S-1 NEW 327,564 601 Randolph Rd; Amazon warehouse
Passaic City Passaic 18-60055+F 23,654,000 10 E NEW 1 Dayton Av Educational campus; 39-71 Dayton Av
Camden City Camden 19-60004 23,431,324 04 E NEW 268,029 public high school; Park and Baird Blvds
Florham Park Borough Morris 20190422 23,400,000 07 B ALT 0 Celularity; 4-story office rehab; Old Exxon researh development; 170 Park Av
Millburn Township Essex 19-0106 23,037,521 01 R-2 NEW 287,311 150 JFK Pkwy, 200 apartments
Newark Essex 19CP000716+A 22,929,000 07 B NEW 320,375 16-84 W Market; Essex County College
Jersey City Hudson 20183960+B 22,650,000 03 R-2 NEW 0 update, 159 rentals, 172 2nd St; broke ground 10/18
Lawrence Mercer 000020191052 22,460,000 07 B ALT 0 Bristol Myers Squibb
Cranbury Middlesex 19-145 22,208,000 05 S-1 NEW 953,595 343 Half Acre Rd, Wayfair warehouse
Jersey City Hudson 20193975+C 21,876,000 10 R-2 ALT 0 25 Columbus Dr; 750 apt units
Weswood Borough Bergen 000020190114 21,670,000 03 E ADD 48,184 Westwood middle sch addition
Jersey City Hudson 20192172 21,558,812 06 B ALT 0 10 Columbus Dr; Mack Cali Plaza 1
Florence Township Burlington 000020190905 21,085,000 12 S-1 NEW 528,000 Front St, general spec warehouse
Raritan Borough Somerset 19-080+A 21,043,105 07 B ALT 0 office fit out, Ortho McNeil Pharmaceutical, 1000 US Rte 202
Edison Middlesex 000020193551 21,018,409 09 F-2 NEW 29,410 Middlesex Water Co., 83 Fairview Av, water treatment
Edison Middlesex 000020193512 20,356,085 09 S-1 NEW 900,022 2165 Lincoln Hwy, Rte 27, 900,000 sq ft spec warehouse
Dover Town Passaic 00020180012U 20,275,000 02 R-2 NEW 250,209 permit update, Meridia Transit Plaza; mixed use, 214 apts, broke ground 1/18
East Brunswick Middlesex 18CP001698 20,198,366 01 I-2 NEW 190,335 Care One assisted living; 666 Cranbury Rd
East Brunswick Middlesex 19CP001322 20,083,502 11 R-1 NEW 82,125 new hotel; 670 Cranbury Rd
Bayonne Hudson 19-03-021 20,000,000 03 R-2 NEW 265,452 180 rental units; 101 E 23rd St
Belleville Town Essex 19-01297 20,000,000 12 R-2 NEW 34,230 81-179 Belmont Av, 132 apts
1
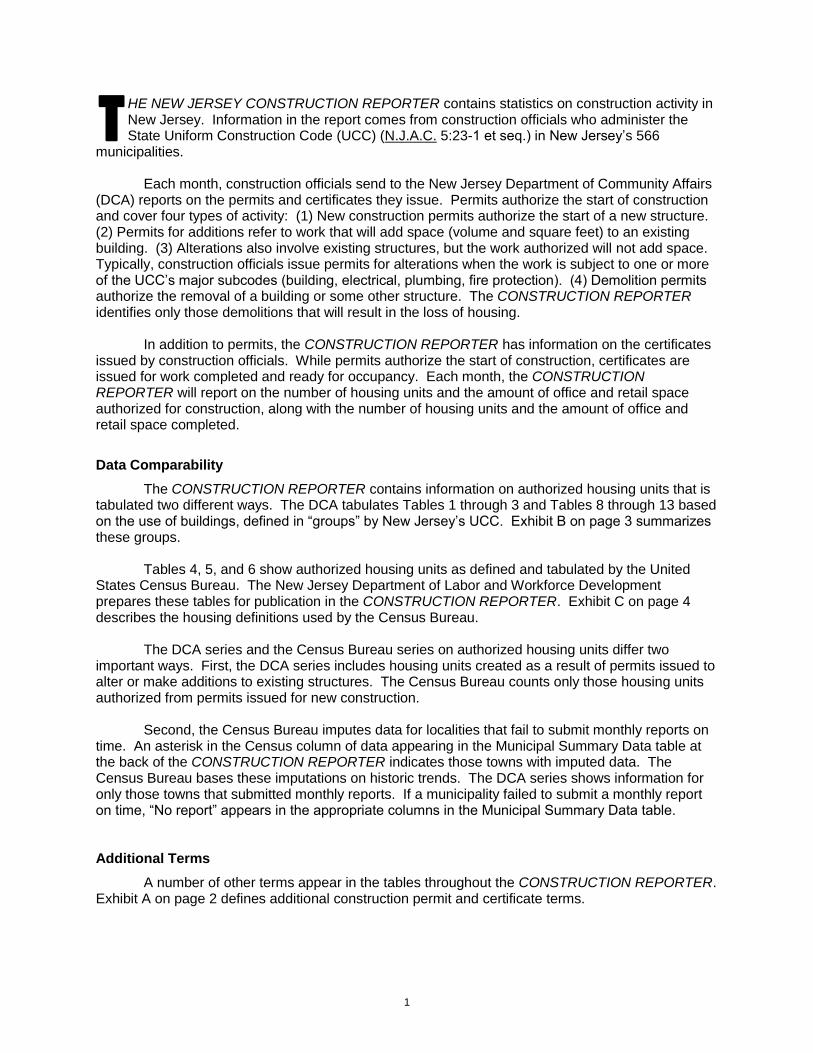
HE NEW JERSEY CONSTRUCTION REPORTER contains statistics on construction activity in New Jersey. Information in the report comes from construction officials who administer the State Uniform Construction Code (UCC) (N.J.A.C. 5:23-1 et seq.) in New Jersey’s 566
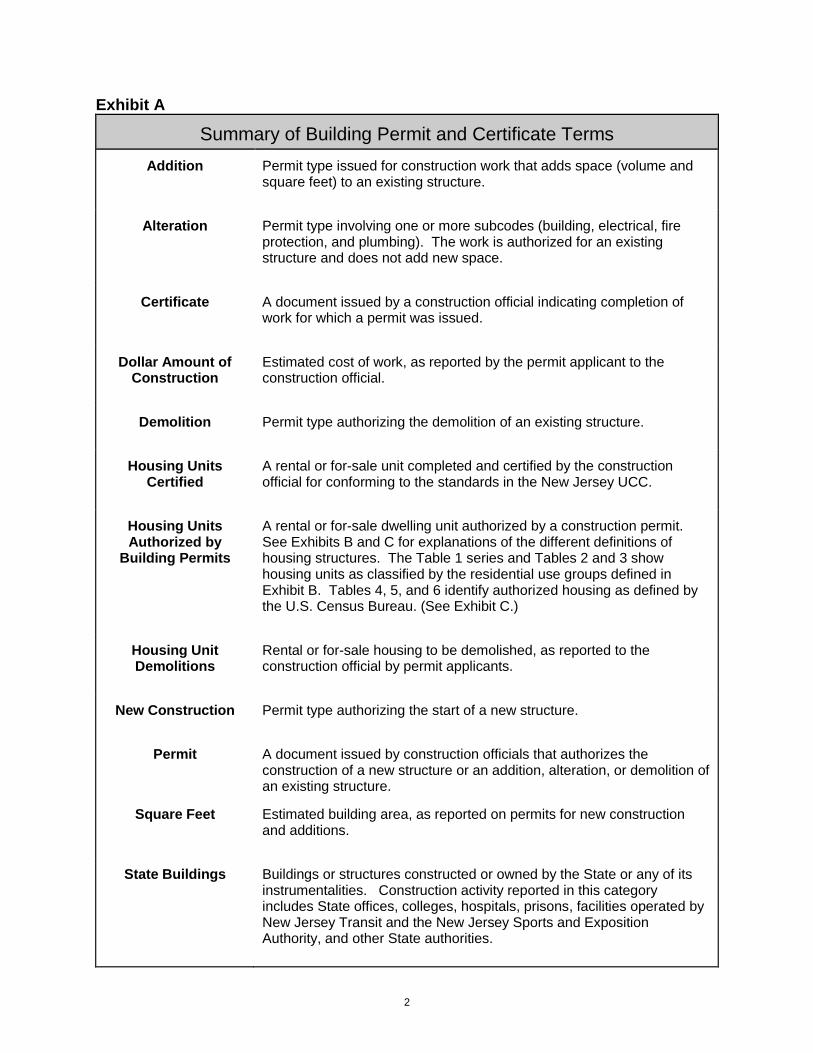
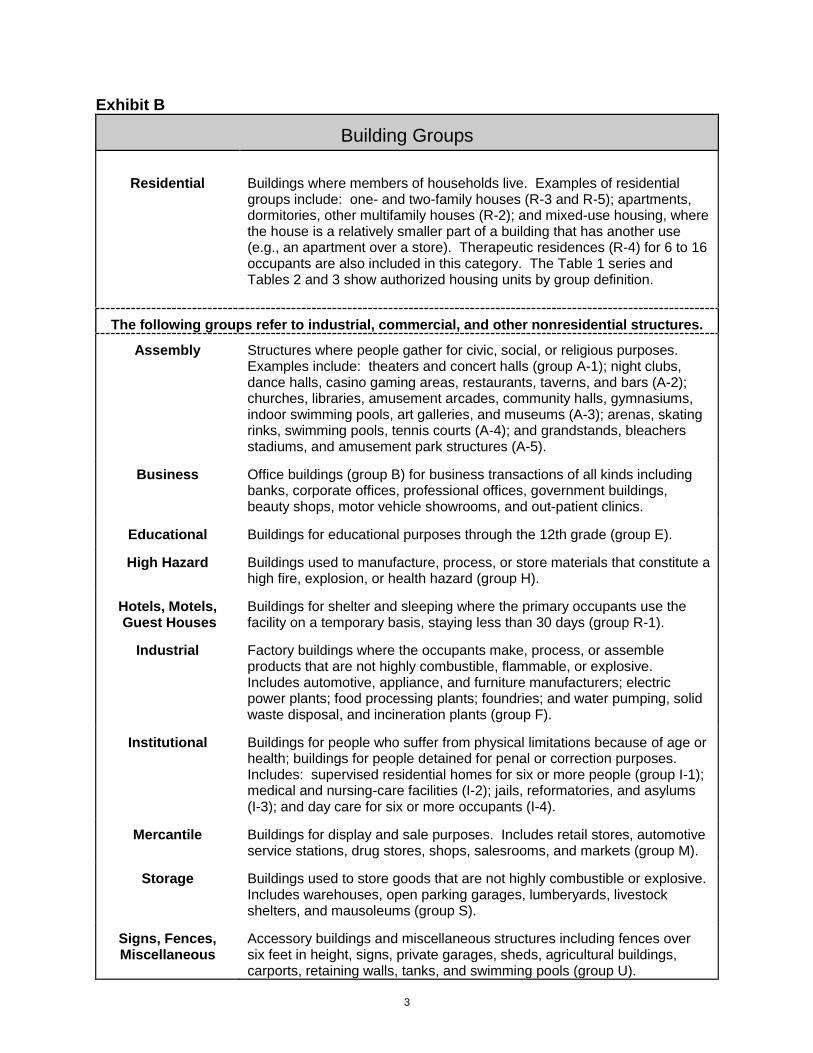
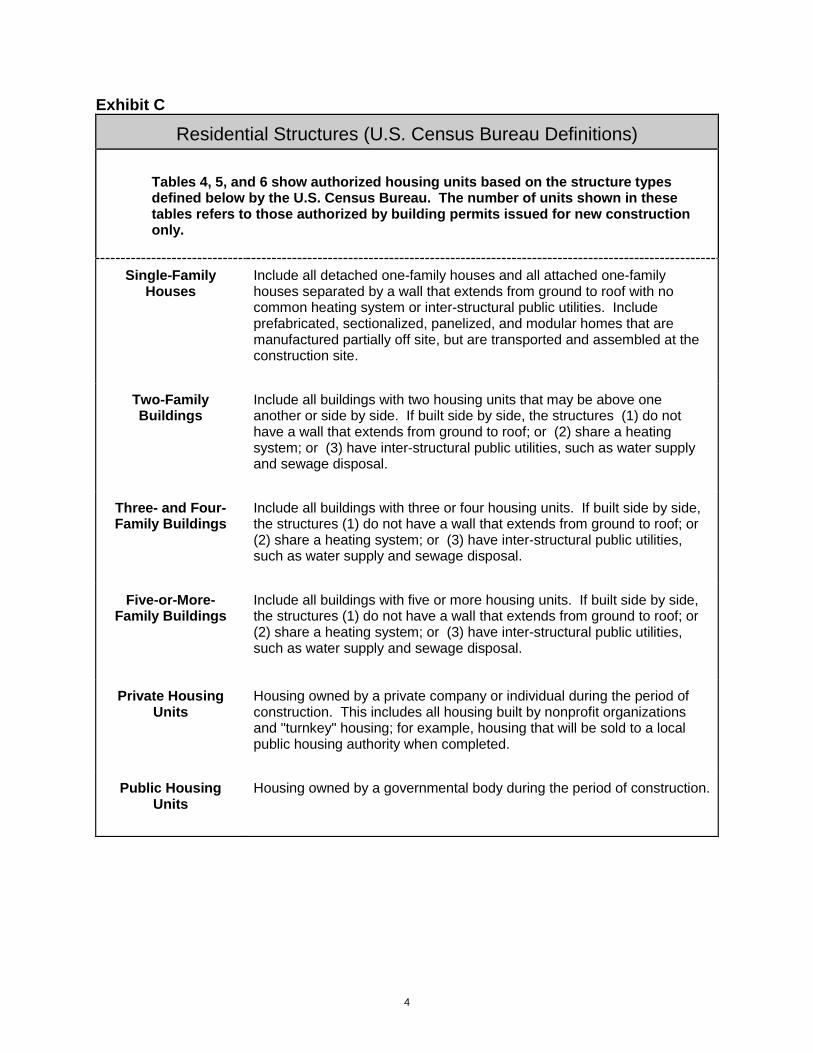
municipalities. Each month, construction officials send to the New Jersey Department of Community Affairs (DCA) reports on the permits and certificates they issue. Permits authorize the start of construction and cover four types of activity: (1) New construction permits authorize the start of a new structure. (2) Permits for additions refer to work that will add space (volume and square feet) to an existing building. (3) Alterations also involve existing structures, but the work authorized will not add space. Typically, construction officials issue permits for alterations when the work is subject to one or more of the UCC’s major subcodes (building, electrical, plumbing, fire protection). (4) Demolition permits authorize the removal of a building or some other structure. The CONSTRUCTION REPORTER identifies only those demolitions that will result in the loss of housing. In addition to permits, the CONSTRUCTION REPORTER has information on the certificates issued by construction officials. While permits authorize the start of construction, certificates are issued for work completed and ready for occupancy. Each month, the CONSTRUCTION REPORTER will report on the number of housing units and the amount of office and retail space authorized for construction, along with the number of housing units and the amount of office and retail space completed. Data Comparability The CONSTRUCTION REPORTER contains information on authorized housing units that is tabulated two different ways. The DCA tabulates Tables 1 through 3 and Tables 8 through 13 based on the use of buildings, defined in “groups” by New Jersey’s UCC. Exhibit B on page 3 summarizes these groups. Tables 4, 5, and 6 show authorized housing units as defined and tabulated by the United States Census Bureau. The New Jersey Department of Labor and Workforce Development prepares these tables for publication in the CONSTRUCTION REPORTER. Exhibit C on page 4 describes the housing definitions used by the Census Bureau. The DCA series and the Census Bureau series on authorized housing units differ two important ways. First, the DCA series includes housing units created as a result of permits issued to alter or make additions to existing structures. The Census Bureau counts only those housing units authorized from permits issued for new construction. Second, the Census Bureau imputes data for localities that fail to submit monthly reports on time. An asterisk in the Census column of data appearing in the Municipal Summary Data table at the back of the CONSTRUCTION REPORTER indicates those towns with imputed data. The Census Bureau bases these imputations on historic trends. The DCA series shows information for only those towns that submitted monthly reports. If a municipality failed to submit a monthly report on time, “No report” appears in the appropriate columns in the Municipal Summary Data table. Additional Terms A number of other terms appear in the tables throughout the CONSTRUCTION REPORTER. Exhibit A on page 2 defines additional construction permit and certificate terms.
T
2
Exhibit A
Summary of Building Permit and Certificate Terms
Addition Permit type issued for construction work that adds space (volume and square feet) to an existing structure.
Alteration
Permit type involving one or more subcodes (building, electrical, fire protection, and plumbing). The work is authorized for an existing structure and does not add new space.
Certificate
A document issued by a construction official indicating completion of work for which a permit was issued.
Dollar Amount of
Construction
Estimated cost of work, as reported by the permit applicant to the construction official.
Demolition
Permit type authorizing the demolition of an existing structure.
Housing Units
Certified
A rental or for-sale unit completed and certified by the construction official for conforming to the standards in the New Jersey UCC.
Housing Units Authorized by
Building Permits
A rental or for-sale dwelling unit authorized by a construction permit. See Exhibits B and C for explanations of the different definitions of housing structures. The Table 1 series and Tables 2 and 3 show housing units as classified by the residential use groups defined in Exhibit B. Tables 4, 5, and 6 identify authorized housing as defined by the U.S. Census Bureau. (See Exhibit C.)
Housing Unit Demolitions
Rental or for-sale housing to be demolished, as reported to the construction official by permit applicants.
New Construction
Permit type authorizing the start of a new structure.
Permit
A document issued by construction officials that authorizes the construction of a new structure or an addition, alteration, or demolition of an existing structure.
Square Feet
Estimated building area, as reported on permits for new construction and additions.
State Buildings
Buildings or structures constructed or owned by the State or any of its instrumentalities. Construction activity reported in this category includes State offices, colleges, hospitals, prisons, facilities operated by New Jersey Transit and the New Jersey Sports and Exposition Authority, and other State authorities.
3
Exhibit B
Building Groups
Residential
Buildings where members of households live. Examples of residential groups include: one- and two-family houses (R-3 and R-5); apartments, dormitories, other multifamily houses (R-2); and mixed-use housing, where the house is a relatively smaller part of a building that has another use (e.g., an apartment over a store). Therapeutic residences (R-4) for 6 to 16 occupants are also included in this category. The Table 1 series and Tables 2 and 3 show authorized housing units by group definition.
The following groups refer to industrial, commercial, and other nonresidential structures.
Assembly
Structures where people gather for civic, social, or religious purposes. Examples include: theaters and concert halls (group A-1); night clubs, dance halls, casino gaming areas, restaurants, taverns, and bars (A-2); churches, libraries, amusement arcades, community halls, gymnasiums, indoor swimming pools, art galleries, and museums (A-3); arenas, skating rinks, swimming pools, tennis courts (A-4); and grandstands, bleachers stadiums, and amusement park structures (A-5).
Business
Office buildings (group B) for business transactions of all kinds including banks, corporate offices, professional offices, government buildings, beauty shops, motor vehicle showrooms, and out-patient clinics.
Educational
Buildings for educational purposes through the 12th grade (group E).
High Hazard
Buildings used to manufacture, process, or store materials that constitute a high fire, explosion, or health hazard (group H).
Hotels, Motels, Guest Houses
Buildings for shelter and sleeping where the primary occupants use the facility on a temporary basis, staying less than 30 days (group R-1).
Industrial
Factory buildings where the occupants make, process, or assemble products that are not highly combustible, flammable, or explosive. Includes automotive, appliance, and furniture manufacturers; electric power plants; food processing plants; foundries; and water pumping, solid waste disposal, and incineration plants (group F).
Institutional
Buildings for people who suffer from physical limitations because of age or health; buildings for people detained for penal or correction purposes. Includes: supervised residential homes for six or more people (group I-1); medical and nursing-care facilities (I-2); jails, reformatories, and asylums (I-3); and day care for six or more occupants (I-4).
Mercantile
Buildings for display and sale purposes. Includes retail stores, automotive service stations, drug stores, shops, salesrooms, and markets (group M).
Storage
Buildings used to store goods that are not highly combustible or explosive. Includes warehouses, open parking garages, lumberyards, livestock shelters, and mausoleums (group S).
Signs, Fences, Miscellaneous
Accessory buildings and miscellaneous structures including fences over six feet in height, signs, private garages, sheds, agricultural buildings, carports, retaining walls, tanks, and swimming pools (group U).
4
Exhibit C
Residential Structures (U.S. Census Bureau Definitions)
Tables 4, 5, and 6 show authorized housing units based on the structure types defined below by the U.S. Census Bureau. The number of units shown in these tables refers to those authorized by building permits issued for new construction only.
Single-Family Houses
Include all detached one-family houses and all attached one-family houses separated by a wall that extends from ground to roof with no common heating system or inter-structural public utilities. Include prefabricated, sectionalized, panelized, and modular homes that are manufactured partially off site, but are transported and assembled at the construction site.
Two-Family Buildings
Include all buildings with two housing units that may be above one another or side by side. If built side by side, the structures (1) do not have a wall that extends from ground to roof; or (2) share a heating system; or (3) have inter-structural public utilities, such as water supply and sewage disposal.
Three- and Four-Family Buildings
Include all buildings with three or four housing units. If built side by side, the structures (1) do not have a wall that extends from ground to roof; or (2) share a heating system; or (3) have inter-structural public utilities, such as water supply and sewage disposal.
Five-or-More-
Family Buildings
Include all buildings with five or more housing units. If built side by side, the structures (1) do not have a wall that extends from ground to roof; or (2) share a heating system; or (3) have inter-structural public utilities, such as water supply and sewage disposal.
Private Housing Units
Housing owned by a private company or individual during the period of construction. This includes all housing built by nonprofit organizations and "turnkey" housing; for example, housing that will be sold to a local public housing authority when completed.
Public Housing
Units
Housing owned by a governmental body during the period of construction.
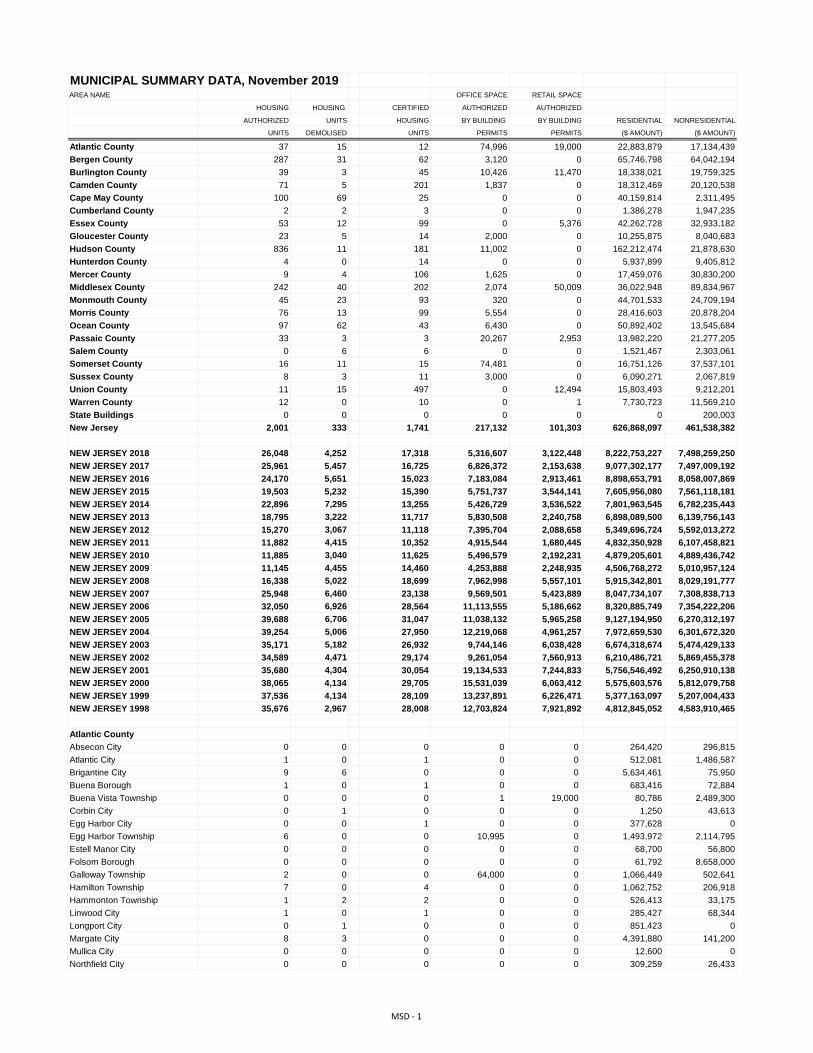
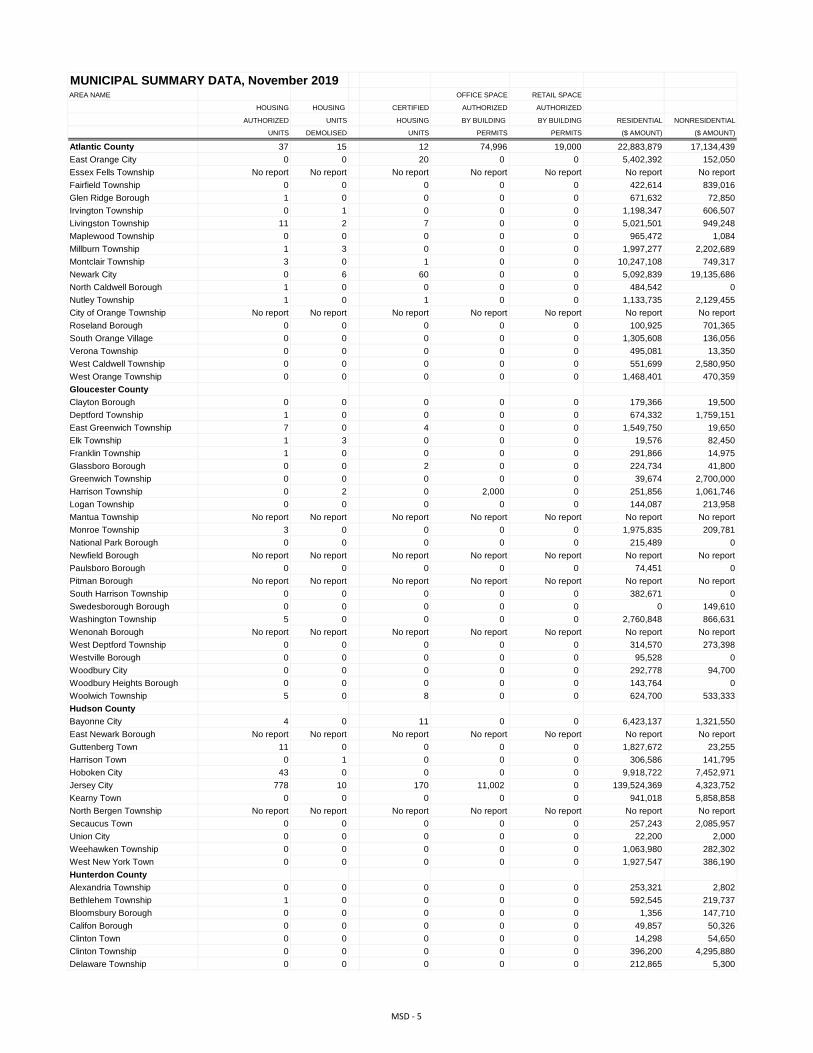
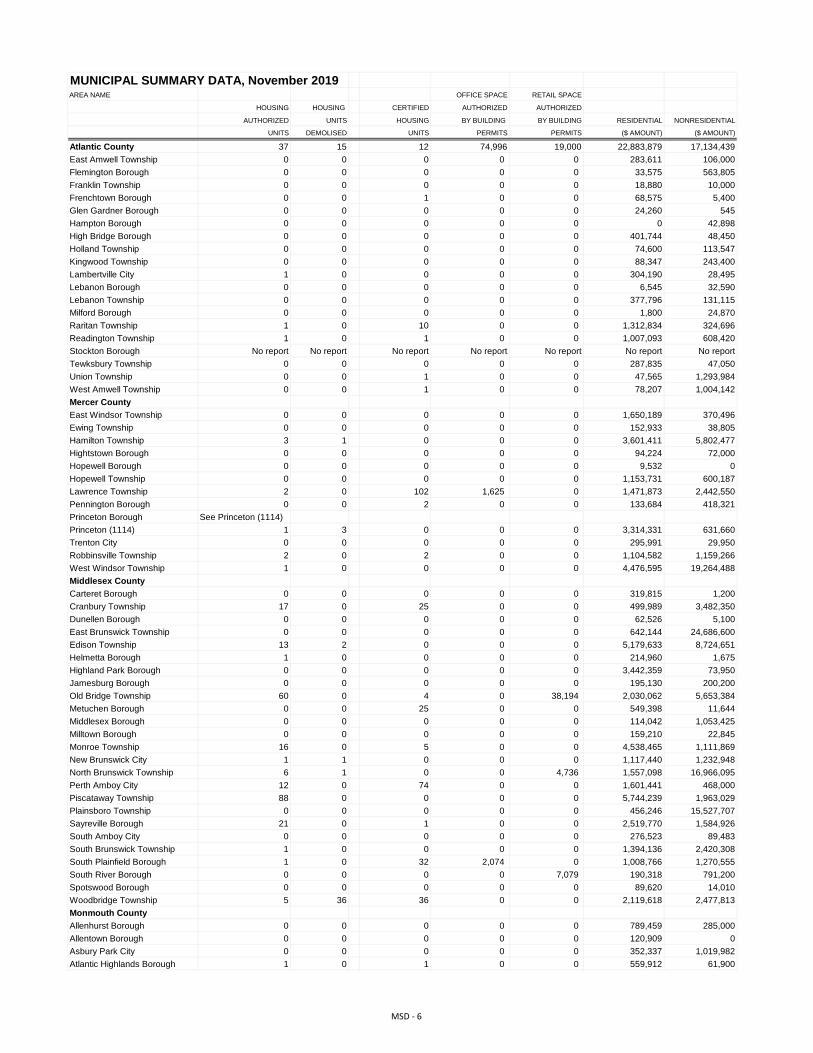
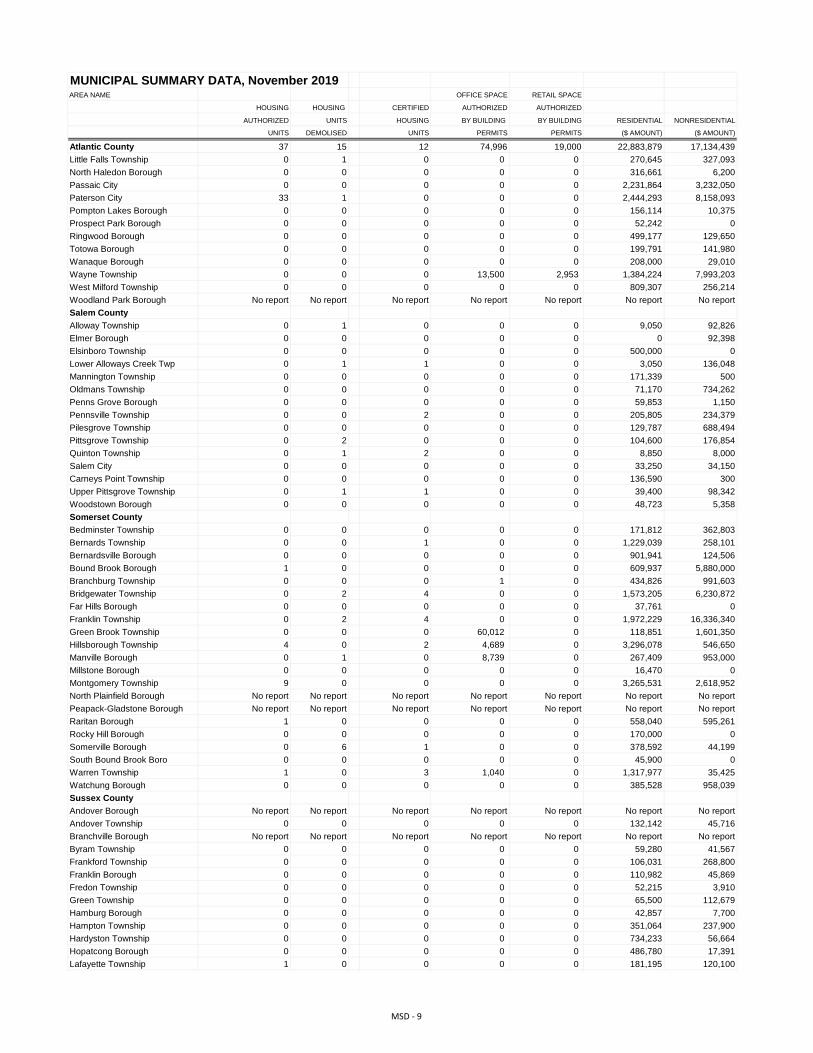
MUNICIPAL SUMMARY DATA, November 2019AREA NAME OFFICE SPACE RETAIL SPACE
HOUSING HOUSING CERTIFIED AUTHORIZED AUTHORIZED
AUTHORIZED UNITS HOUSING BY BUILDING BY BUILDING RESIDENTIAL NONRESIDENTIAL
UNITS DEMOLISED UNITS PERMITS PERMITS ($ AMOUNT) ($ AMOUNT)
Atlantic County 37 15 12 74,996 19,000 22,883,879 17,134,439
Bergen County 287 31 62 3,120 0 65,746,798 64,042,194
Burlington County 39 3 45 10,426 11,470 18,338,021 19,759,325
Camden County 71 5 201 1,837 0 18,312,469 20,120,538
Cape May County 100 69 25 0 0 40,159,814 2,311,495
Cumberland County 2 2 3 0 0 1,386,278 1,947,235
Essex County 53 12 99 0 5,376 42,262,728 32,933,182
Gloucester County 23 5 14 2,000 0 10,255,875 8,040,683
Hudson County 836 11 181 11,002 0 162,212,474 21,878,630
Hunterdon County 4 0 14 0 0 5,937,899 9,405,812
Mercer County 9 4 106 1,625 0 17,459,076 30,830,200
Middlesex County 242 40 202 2,074 50,009 36,022,948 89,834,967
Monmouth County 45 23 93 320 0 44,701,533 24,709,194
Morris County 76 13 99 5,554 0 28,416,603 20,878,204
Ocean County 97 62 43 6,430 0 50,892,402 13,545,684
Passaic County 33 3 3 20,267 2,953 13,982,220 21,277,205
Salem County 0 6 6 0 0 1,521,467 2,303,061
Somerset County 16 11 15 74,481 0 16,751,126 37,537,101
Sussex County 8 3 11 3,000 0 6,090,271 2,067,819
Union County 11 15 497 0 12,494 15,803,493 9,212,201
Warren County 12 0 10 0 1 7,730,723 11,569,210
State Buildings 0 0 0 0 0 0 200,003
New Jersey 2,001 333 1,741 217,132 101,303 626,868,097 461,538,382
NEW JERSEY 2018 26,048 4,252 17,318 5,316,607 3,122,448 8,222,753,227 7,498,259,250
NEW JERSEY 2017 25,961 5,457 16,725 6,826,372 2,153,638 9,077,302,177 7,497,009,192
NEW JERSEY 2016 24,170 5,651 15,023 7,183,084 2,913,461 8,898,653,791 8,058,007,869
NEW JERSEY 2015 19,503 5,232 15,390 5,751,737 3,544,141 7,605,956,080 7,561,118,181
NEW JERSEY 2014 22,896 7,295 13,255 5,426,729 3,536,522 7,801,963,545 6,782,235,443
NEW JERSEY 2013 18,795 3,222 11,717 5,830,508 2,240,758 6,898,089,500 6,139,756,143
NEW JERSEY 2012 15,270 3,067 11,118 7,395,704 2,088,658 5,349,696,724 5,592,013,272
NEW JERSEY 2011 11,882 4,415 10,352 4,915,544 1,680,445 4,832,350,928 6,107,458,821
NEW JERSEY 2010 11,885 3,040 11,625 5,496,579 2,192,231 4,879,205,601 4,889,436,742
NEW JERSEY 2009 11,145 4,455 14,460 4,253,888 2,248,935 4,506,768,272 5,010,957,124
NEW JERSEY 2008 16,338 5,022 18,699 7,962,998 5,557,101 5,915,342,801 8,029,191,777
NEW JERSEY 2007 25,948 6,460 23,138 9,569,501 5,423,889 8,047,734,107 7,308,838,713
NEW JERSEY 2006 32,050 6,926 28,564 11,113,555 5,186,662 8,320,885,749 7,354,222,206
NEW JERSEY 2005 39,688 6,706 31,047 11,038,132 5,965,258 9,127,194,950 6,270,312,197
NEW JERSEY 2004 39,254 5,006 27,950 12,219,068 4,961,257 7,972,659,530 6,301,672,320
NEW JERSEY 2003 35,171 5,182 26,932 9,744,146 6,038,428 6,674,318,674 5,474,429,133
NEW JERSEY 2002 34,589 4,471 29,174 9,261,054 7,560,913 6,210,486,721 5,869,455,378
NEW JERSEY 2001 35,680 4,304 30,054 19,134,533 7,244,833 5,756,546,492 6,250,910,138
NEW JERSEY 2000 38,065 4,134 29,705 15,531,039 6,063,412 5,575,603,576 5,812,079,758
NEW JERSEY 1999 37,536 4,134 28,109 13,237,891 6,226,471 5,377,163,097 5,207,004,433
NEW JERSEY 1998 35,676 2,967 28,008 12,703,824 7,921,892 4,812,845,052 4,583,910,465
Atlantic County
Absecon City 0 0 0 0 0 264,420 296,815
Atlantic City 1 0 1 0 0 512,081 1,486,587
Brigantine City 9 6 0 0 0 5,634,461 75,950
Buena Borough 1 0 1 0 0 683,416 72,884
Buena Vista Township 0 0 0 1 19,000 80,786 2,489,300
Corbin City 0 1 0 0 0 1,250 43,613
Egg Harbor City 0 0 1 0 0 377,628 0
Egg Harbor Township 6 0 0 10,995 0 1,493,972 2,114,795
Estell Manor City 0 0 0 0 0 68,700 56,800
Folsom Borough 0 0 0 0 0 61,792 8,658,000
Galloway Township 2 0 0 64,000 0 1,066,449 502,641
Hamilton Township 7 0 4 0 0 1,062,752 206,918
Hammonton Township 1 2 2 0 0 526,413 33,175
Linwood City 1 0 1 0 0 285,427 68,344
Longport City 0 1 0 0 0 851,423 0
Margate City 8 3 0 0 0 4,391,880 141,200
Mullica City 0 0 0 0 0 12,600 0
Northfield City 0 0 0 0 0 309,259 26,433
MSD - 1
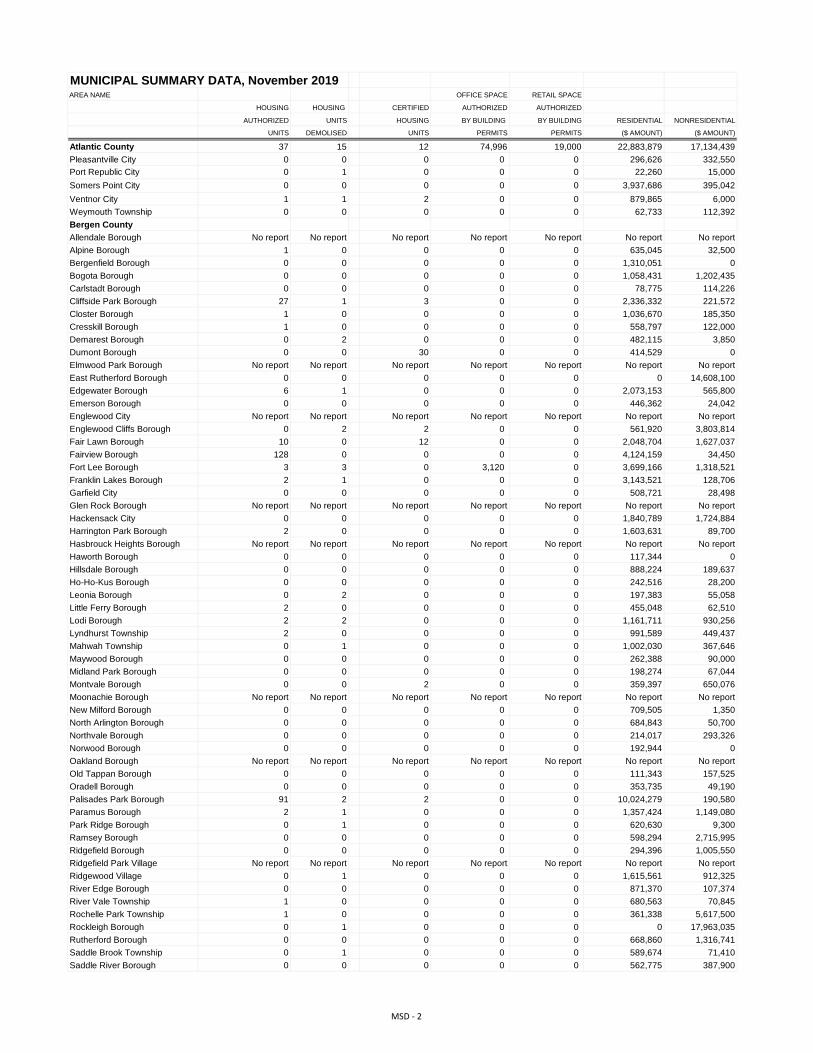
MUNICIPAL SUMMARY DATA, November 2019AREA NAME OFFICE SPACE RETAIL SPACE
HOUSING HOUSING CERTIFIED AUTHORIZED AUTHORIZED
AUTHORIZED UNITS HOUSING BY BUILDING BY BUILDING RESIDENTIAL NONRESIDENTIAL
UNITS DEMOLISED UNITS PERMITS PERMITS ($ AMOUNT) ($ AMOUNT)
Atlantic County 37 15 12 74,996 19,000 22,883,879 17,134,439
Pleasantville City 0 0 0 0 0 296,626 332,550
Port Republic City 0 1 0 0 0 22,260 15,000
Somers Point City 0 0 0 0 0 3,937,686 395,042
Ventnor City 1 1 2 0 0 879,865 6,000
Weymouth Township 0 0 0 0 0 62,733 112,392
Bergen County
Allendale Borough No report No report No report No report No report No report No report
Alpine Borough 1 0 0 0 0 635,045 32,500
Bergenfield Borough 0 0 0 0 0 1,310,051 0
Bogota Borough 0 0 0 0 0 1,058,431 1,202,435
Carlstadt Borough 0 0 0 0 0 78,775 114,226
Cliffside Park Borough 27 1 3 0 0 2,336,332 221,572
Closter Borough 1 0 0 0 0 1,036,670 185,350
Cresskill Borough 1 0 0 0 0 558,797 122,000
Demarest Borough 0 2 0 0 0 482,115 3,850
Dumont Borough 0 0 30 0 0 414,529 0
Elmwood Park Borough No report No report No report No report No report No report No report
East Rutherford Borough 0 0 0 0 0 0 14,608,100
Edgewater Borough 6 1 0 0 0 2,073,153 565,800
Emerson Borough 0 0 0 0 0 446,362 24,042
Englewood City No report No report No report No report No report No report No report
Englewood Cliffs Borough 0 2 2 0 0 561,920 3,803,814
Fair Lawn Borough 10 0 12 0 0 2,048,704 1,627,037
Fairview Borough 128 0 0 0 0 4,124,159 34,450
Fort Lee Borough 3 3 0 3,120 0 3,699,166 1,318,521
Franklin Lakes Borough 2 1 0 0 0 3,143,521 128,706
Garfield City 0 0 0 0 0 508,721 28,498
Glen Rock Borough No report No report No report No report No report No report No report
Hackensack City 0 0 0 0 0 1,840,789 1,724,884
Harrington Park Borough 2 0 0 0 0 1,603,631 89,700
Hasbrouck Heights Borough No report No report No report No report No report No report No report
Haworth Borough 0 0 0 0 0 117,344 0
Hillsdale Borough 0 0 0 0 0 888,224 189,637
Ho-Ho-Kus Borough 0 0 0 0 0 242,516 28,200
Leonia Borough 0 2 0 0 0 197,383 55,058
Little Ferry Borough 2 0 0 0 0 455,048 62,510
Lodi Borough 2 2 0 0 0 1,161,711 930,256
Lyndhurst Township 2 0 0 0 0 991,589 449,437
Mahwah Township 0 1 0 0 0 1,002,030 367,646
Maywood Borough 0 0 0 0 0 262,388 90,000
Midland Park Borough 0 0 0 0 0 198,274 67,044
Montvale Borough 0 0 2 0 0 359,397 650,076
Moonachie Borough No report No report No report No report No report No report No report
New Milford Borough 0 0 0 0 0 709,505 1,350
North Arlington Borough 0 0 0 0 0 684,843 50,700
Northvale Borough 0 0 0 0 0 214,017 293,326
Norwood Borough 0 0 0 0 0 192,944 0
Oakland Borough No report No report No report No report No report No report No report
Old Tappan Borough 0 0 0 0 0 111,343 157,525
Oradell Borough 0 0 0 0 0 353,735 49,190
Palisades Park Borough 91 2 2 0 0 10,024,279 190,580
Paramus Borough 2 1 0 0 0 1,357,424 1,149,080
Park Ridge Borough 0 1 0 0 0 620,630 9,300
Ramsey Borough 0 0 0 0 0 598,294 2,715,995
Ridgefield Borough 0 0 0 0 0 294,396 1,005,550
Ridgefield Park Village No report No report No report No report No report No report No report
Ridgewood Village 0 1 0 0 0 1,615,561 912,325
River Edge Borough 0 0 0 0 0 871,370 107,374
River Vale Township 1 0 0 0 0 680,563 70,845
Rochelle Park Township 1 0 0 0 0 361,338 5,617,500
Rockleigh Borough 0 1 0 0 0 0 17,963,035
Rutherford Borough 0 0 0 0 0 668,860 1,316,741
Saddle Brook Township 0 1 0 0 0 589,674 71,410
Saddle River Borough 0 0 0 0 0 562,775 387,900
MSD - 2
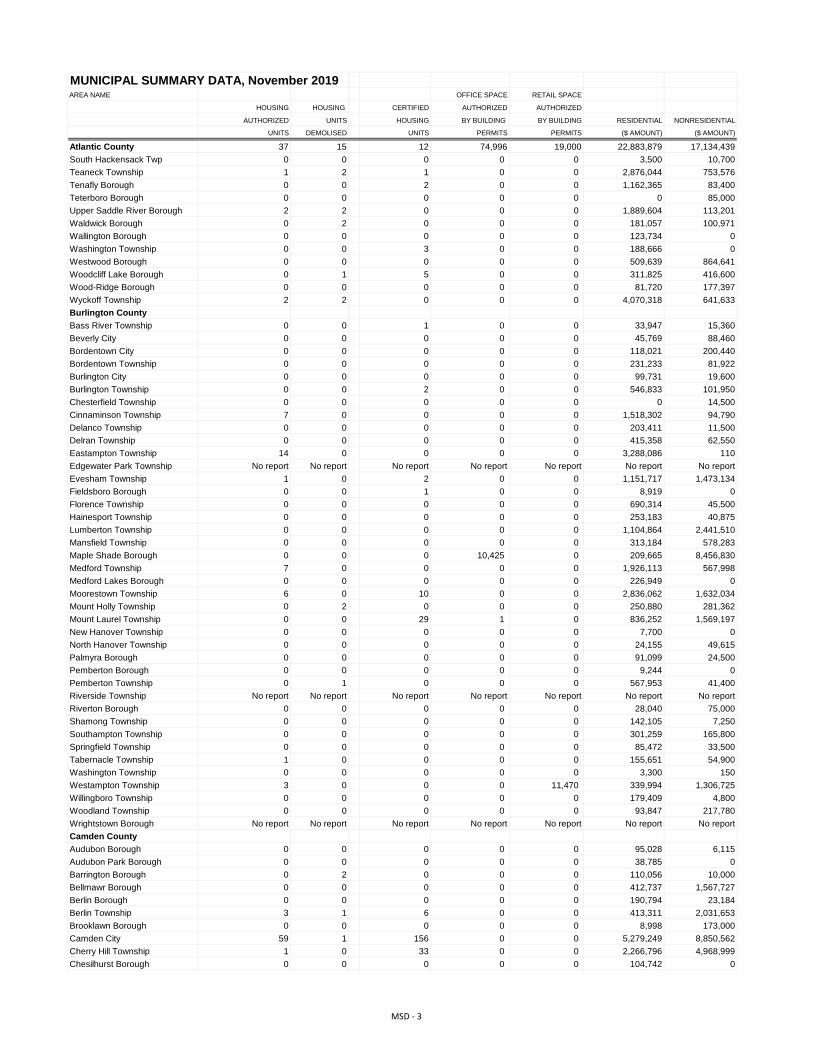
MUNICIPAL SUMMARY DATA, November 2019AREA NAME OFFICE SPACE RETAIL SPACE
HOUSING HOUSING CERTIFIED AUTHORIZED AUTHORIZED
AUTHORIZED UNITS HOUSING BY BUILDING BY BUILDING RESIDENTIAL NONRESIDENTIAL
UNITS DEMOLISED UNITS PERMITS PERMITS ($ AMOUNT) ($ AMOUNT)
Atlantic County 37 15 12 74,996 19,000 22,883,879 17,134,439
South Hackensack Twp 0 0 0 0 0 3,500 10,700
Teaneck Township 1 2 1 0 0 2,876,044 753,576
Tenafly Borough 0 0 2 0 0 1,162,365 83,400
Teterboro Borough 0 0 0 0 0 0 85,000
Upper Saddle River Borough 2 2 0 0 0 1,889,604 113,201
Waldwick Borough 0 2 0 0 0 181,057 100,971
Wallington Borough 0 0 0 0 0 123,734 0
Washington Township 0 0 3 0 0 188,666 0
Westwood Borough 0 0 0 0 0 509,639 864,641
Woodcliff Lake Borough 0 1 5 0 0 311,825 416,600
Wood-Ridge Borough 0 0 0 0 0 81,720 177,397
Wyckoff Township 2 2 0 0 0 4,070,318 641,633
Burlington County
Bass River Township 0 0 1 0 0 33,947 15,360
Beverly City 0 0 0 0 0 45,769 88,460
Bordentown City 0 0 0 0 0 118,021 200,440
Bordentown Township 0 0 0 0 0 231,233 81,922
Burlington City 0 0 0 0 0 99,731 19,600
Burlington Township 0 0 2 0 0 546,833 101,950
Chesterfield Township 0 0 0 0 0 0 14,500
Cinnaminson Township 7 0 0 0 0 1,518,302 94,790
Delanco Township 0 0 0 0 0 203,411 11,500
Delran Township 0 0 0 0 0 415,358 62,550
Eastampton Township 14 0 0 0 0 3,288,086 110
Edgewater Park Township No report No report No report No report No report No report No report
Evesham Township 1 0 2 0 0 1,151,717 1,473,134
Fieldsboro Borough 0 0 1 0 0 8,919 0
Florence Township 0 0 0 0 0 690,314 45,500
Hainesport Township 0 0 0 0 0 253,183 40,875
Lumberton Township 0 0 0 0 0 1,104,864 2,441,510
Mansfield Township 0 0 0 0 0 313,184 578,283
Maple Shade Borough 0 0 0 10,425 0 209,665 8,456,830
Medford Township 7 0 0 0 0 1,926,113 567,998
Medford Lakes Borough 0 0 0 0 0 226,949 0
Moorestown Township 6 0 10 0 0 2,836,062 1,632,034
Mount Holly Township 0 2 0 0 0 250,880 281,362
Mount Laurel Township 0 0 29 1 0 836,252 1,569,197
New Hanover Township 0 0 0 0 0 7,700 0
North Hanover Township 0 0 0 0 0 24,155 49,615
Palmyra Borough 0 0 0 0 0 91,099 24,500
Pemberton Borough 0 0 0 0 0 9,244 0
Pemberton Township 0 1 0 0 0 567,953 41,400
Riverside Township No report No report No report No report No report No report No report
Riverton Borough 0 0 0 0 0 28,040 75,000
Shamong Township 0 0 0 0 0 142,105 7,250
Southampton Township 0 0 0 0 0 301,259 165,800
Springfield Township 0 0 0 0 0 85,472 33,500
Tabernacle Township 1 0 0 0 0 155,651 54,900
Washington Township 0 0 0 0 0 3,300 150
Westampton Township 3 0 0 0 11,470 339,994 1,306,725
Willingboro Township 0 0 0 0 0 179,409 4,800
Woodland Township 0 0 0 0 0 93,847 217,780
Wrightstown Borough No report No report No report No report No report No report No report
Camden County
Audubon Borough 0 0 0 0 0 95,028 6,115
Audubon Park Borough 0 0 0 0 0 38,785 0
Barrington Borough 0 2 0 0 0 110,056 10,000
Bellmawr Borough 0 0 0 0 0 412,737 1,567,727
Berlin Borough 0 0 0 0 0 190,794 23,184
Berlin Township 3 1 6 0 0 413,311 2,031,653
Brooklawn Borough 0 0 0 0 0 8,998 173,000
Camden City 59 1 156 0 0 5,279,249 8,850,562
Cherry Hill Township 1 0 33 0 0 2,266,796 4,968,999
Chesilhurst Borough 0 0 0 0 0 104,742 0
MSD - 3
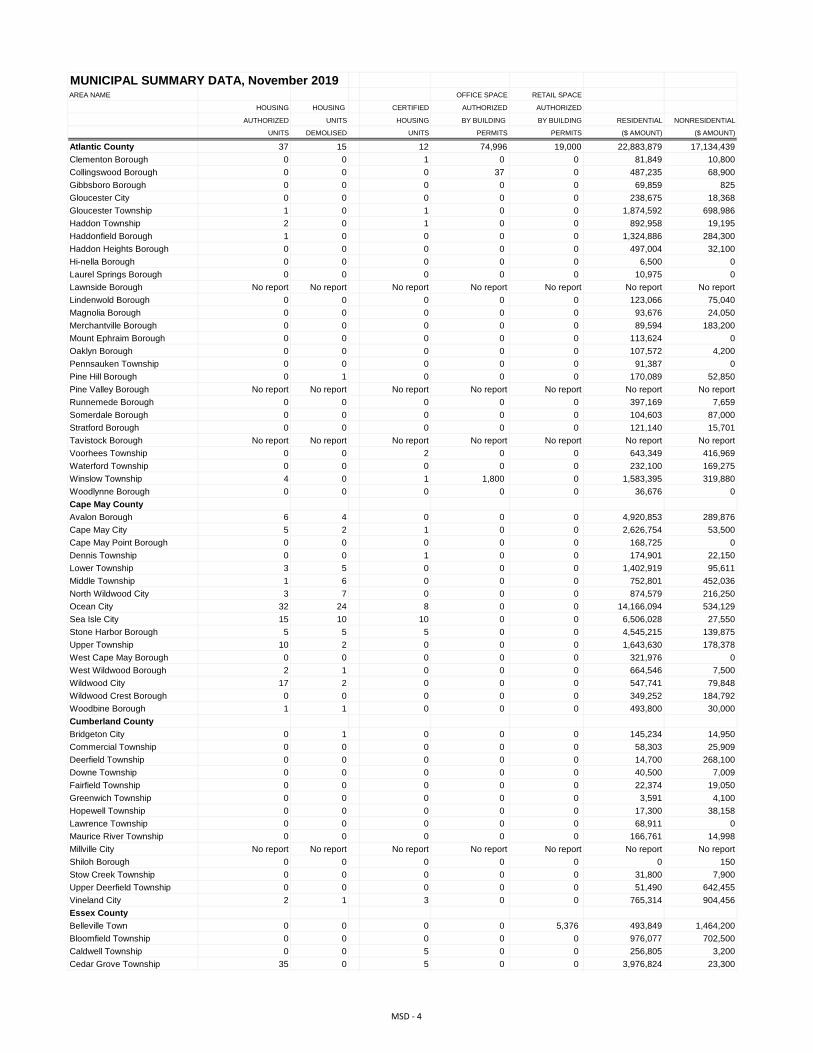
MUNICIPAL SUMMARY DATA, November 2019AREA NAME OFFICE SPACE RETAIL SPACE
HOUSING HOUSING CERTIFIED AUTHORIZED AUTHORIZED
AUTHORIZED UNITS HOUSING BY BUILDING BY BUILDING RESIDENTIAL NONRESIDENTIAL
UNITS DEMOLISED UNITS PERMITS PERMITS ($ AMOUNT) ($ AMOUNT)
Atlantic County 37 15 12 74,996 19,000 22,883,879 17,134,439
Clementon Borough 0 0 1 0 0 81,849 10,800
Collingswood Borough 0 0 0 37 0 487,235 68,900
Gibbsboro Borough 0 0 0 0 0 69,859 825
Gloucester City 0 0 0 0 0 238,675 18,368
Gloucester Township 1 0 1 0 0 1,874,592 698,986
Haddon Township 2 0 1 0 0 892,958 19,195
Haddonfield Borough 1 0 0 0 0 1,324,886 284,300
Haddon Heights Borough 0 0 0 0 0 497,004 32,100
Hi-nella Borough 0 0 0 0 0 6,500 0
Laurel Springs Borough 0 0 0 0 0 10,975 0
Lawnside Borough No report No report No report No report No report No report No report
Lindenwold Borough 0 0 0 0 0 123,066 75,040
Magnolia Borough 0 0 0 0 0 93,676 24,050
Merchantville Borough 0 0 0 0 0 89,594 183,200
Mount Ephraim Borough 0 0 0 0 0 113,624 0
Oaklyn Borough 0 0 0 0 0 107,572 4,200
Pennsauken Township 0 0 0 0 0 91,387 0
Pine Hill Borough 0 1 0 0 0 170,089 52,850
Pine Valley Borough No report No report No report No report No report No report No report
Runnemede Borough 0 0 0 0 0 397,169 7,659
Somerdale Borough 0 0 0 0 0 104,603 87,000
Stratford Borough 0 0 0 0 0 121,140 15,701
Tavistock Borough No report No report No report No report No report No report No report
Voorhees Township 0 0 2 0 0 643,349 416,969
Waterford Township 0 0 0 0 0 232,100 169,275
Winslow Township 4 0 1 1,800 0 1,583,395 319,880
Woodlynne Borough 0 0 0 0 0 36,676 0
Cape May County
Avalon Borough 6 4 0 0 0 4,920,853 289,876
Cape May City 5 2 1 0 0 2,626,754 53,500
Cape May Point Borough 0 0 0 0 0 168,725 0
Dennis Township 0 0 1 0 0 174,901 22,150
Lower Township 3 5 0 0 0 1,402,919 95,611
Middle Township 1 6 0 0 0 752,801 452,036
North Wildwood City 3 7 0 0 0 874,579 216,250
Ocean City 32 24 8 0 0 14,166,094 534,129
Sea Isle City 15 10 10 0 0 6,506,028 27,550
Stone Harbor Borough 5 5 5 0 0 4,545,215 139,875
Upper Township 10 2 0 0 0 1,643,630 178,378
West Cape May Borough 0 0 0 0 0 321,976 0
West Wildwood Borough 2 1 0 0 0 664,546 7,500
Wildwood City 17 2 0 0 0 547,741 79,848
Wildwood Crest Borough 0 0 0 0 0 349,252 184,792
Woodbine Borough 1 1 0 0 0 493,800 30,000
Cumberland County
Bridgeton City 0 1 0 0 0 145,234 14,950
Commercial Township 0 0 0 0 0 58,303 25,909
Deerfield Township 0 0 0 0 0 14,700 268,100
Downe Township 0 0 0 0 0 40,500 7,009
Fairfield Township 0 0 0 0 0 22,374 19,050
Greenwich Township 0 0 0 0 0 3,591 4,100
Hopewell Township 0 0 0 0 0 17,300 38,158
Lawrence Township 0 0 0 0 0 68,911 0
Maurice River Township 0 0 0 0 0 166,761 14,998
Millville City No report No report No report No report No report No report No report
Shiloh Borough 0 0 0 0 0 0 150
Stow Creek Township 0 0 0 0 0 31,800 7,900
Upper Deerfield Township 0 0 0 0 0 51,490 642,455
Vineland City 2 1 3 0 0 765,314 904,456
Essex County
Belleville Town 0 0 0 0 5,376 493,849 1,464,200
Bloomfield Township 0 0 0 0 0 976,077 702,500
Caldwell Township 0 0 5 0 0 256,805 3,200
Cedar Grove Township 35 0 5 0 0 3,976,824 23,300
MSD - 4
MUNICIPAL SUMMARY DATA, November 2019AREA NAME OFFICE SPACE RETAIL SPACE
HOUSING HOUSING CERTIFIED AUTHORIZED AUTHORIZED
AUTHORIZED UNITS HOUSING BY BUILDING BY BUILDING RESIDENTIAL NONRESIDENTIAL
UNITS DEMOLISED UNITS PERMITS PERMITS ($ AMOUNT) ($ AMOUNT)
Atlantic County 37 15 12 74,996 19,000 22,883,879 17,134,439
East Orange City 0 0 20 0 0 5,402,392 152,050
Essex Fells Township No report No report No report No report No report No report No report
Fairfield Township 0 0 0 0 0 422,614 839,016
Glen Ridge Borough 1 0 0 0 0 671,632 72,850
Irvington Township 0 1 0 0 0 1,198,347 606,507
Livingston Township 11 2 7 0 0 5,021,501 949,248
Maplewood Township 0 0 0 0 0 965,472 1,084
Millburn Township 1 3 0 0 0 1,997,277 2,202,689
Montclair Township 3 0 1 0 0 10,247,108 749,317
Newark City 0 6 60 0 0 5,092,839 19,135,686
North Caldwell Borough 1 0 0 0 0 484,542 0
Nutley Township 1 0 1 0 0 1,133,735 2,129,455
City of Orange Township No report No report No report No report No report No report No report
Roseland Borough 0 0 0 0 0 100,925 701,365
South Orange Village 0 0 0 0 0 1,305,608 136,056
Verona Township 0 0 0 0 0 495,081 13,350
West Caldwell Township 0 0 0 0 0 551,699 2,580,950
West Orange Township 0 0 0 0 0 1,468,401 470,359
Gloucester County
Clayton Borough 0 0 0 0 0 179,366 19,500
Deptford Township 1 0 0 0 0 674,332 1,759,151
East Greenwich Township 7 0 4 0 0 1,549,750 19,650
Elk Township 1 3 0 0 0 19,576 82,450
Franklin Township 1 0 0 0 0 291,866 14,975
Glassboro Borough 0 0 2 0 0 224,734 41,800
Greenwich Township 0 0 0 0 0 39,674 2,700,000
Harrison Township 0 2 0 2,000 0 251,856 1,061,746
Logan Township 0 0 0 0 0 144,087 213,958
Mantua Township No report No report No report No report No report No report No report
Monroe Township 3 0 0 0 0 1,975,835 209,781
National Park Borough 0 0 0 0 0 215,489 0
Newfield Borough No report No report No report No report No report No report No report
Paulsboro Borough 0 0 0 0 0 74,451 0
Pitman Borough No report No report No report No report No report No report No report
South Harrison Township 0 0 0 0 0 382,671 0
Swedesborough Borough 0 0 0 0 0 0 149,610
Washington Township 5 0 0 0 0 2,760,848 866,631
Wenonah Borough No report No report No report No report No report No report No report
West Deptford Township 0 0 0 0 0 314,570 273,398
Westville Borough 0 0 0 0 0 95,528 0
Woodbury City 0 0 0 0 0 292,778 94,700
Woodbury Heights Borough 0 0 0 0 0 143,764 0
Woolwich Township 5 0 8 0 0 624,700 533,333
Hudson County
Bayonne City 4 0 11 0 0 6,423,137 1,321,550
East Newark Borough No report No report No report No report No report No report No report
Guttenberg Town 11 0 0 0 0 1,827,672 23,255
Harrison Town 0 1 0 0 0 306,586 141,795
Hoboken City 43 0 0 0 0 9,918,722 7,452,971
Jersey City 778 10 170 11,002 0 139,524,369 4,323,752
Kearny Town 0 0 0 0 0 941,018 5,858,858
North Bergen Township No report No report No report No report No report No report No report
Secaucus Town 0 0 0 0 0 257,243 2,085,957
Union City 0 0 0 0 0 22,200 2,000
Weehawken Township 0 0 0 0 0 1,063,980 282,302
West New York Town 0 0 0 0 0 1,927,547 386,190
Hunterdon County
Alexandria Township 0 0 0 0 0 253,321 2,802
Bethlehem Township 1 0 0 0 0 592,545 219,737
Bloomsbury Borough 0 0 0 0 0 1,356 147,710
Califon Borough 0 0 0 0 0 49,857 50,326
Clinton Town 0 0 0 0 0 14,298 54,650
Clinton Township 0 0 0 0 0 396,200 4,295,880
Delaware Township 0 0 0 0 0 212,865 5,300
MSD - 5
MUNICIPAL SUMMARY DATA, November 2019AREA NAME OFFICE SPACE RETAIL SPACE
HOUSING HOUSING CERTIFIED AUTHORIZED AUTHORIZED
AUTHORIZED UNITS HOUSING BY BUILDING BY BUILDING RESIDENTIAL NONRESIDENTIAL
UNITS DEMOLISED UNITS PERMITS PERMITS ($ AMOUNT) ($ AMOUNT)
Atlantic County 37 15 12 74,996 19,000 22,883,879 17,134,439
East Amwell Township 0 0 0 0 0 283,611 106,000
Flemington Borough 0 0 0 0 0 33,575 563,805
Franklin Township 0 0 0 0 0 18,880 10,000
Frenchtown Borough 0 0 1 0 0 68,575 5,400
Glen Gardner Borough 0 0 0 0 0 24,260 545
Hampton Borough 0 0 0 0 0 0 42,898
High Bridge Borough 0 0 0 0 0 401,744 48,450
Holland Township 0 0 0 0 0 74,600 113,547
Kingwood Township 0 0 0 0 0 88,347 243,400
Lambertville City 1 0 0 0 0 304,190 28,495
Lebanon Borough 0 0 0 0 0 6,545 32,590
Lebanon Township 0 0 0 0 0 377,796 131,115
Milford Borough 0 0 0 0 0 1,800 24,870
Raritan Township 1 0 10 0 0 1,312,834 324,696
Readington Township 1 0 1 0 0 1,007,093 608,420
Stockton Borough No report No report No report No report No report No report No report
Tewksbury Township 0 0 0 0 0 287,835 47,050
Union Township 0 0 1 0 0 47,565 1,293,984
West Amwell Township 0 0 1 0 0 78,207 1,004,142
Mercer County
East Windsor Township 0 0 0 0 0 1,650,189 370,496
Ewing Township 0 0 0 0 0 152,933 38,805
Hamilton Township 3 1 0 0 0 3,601,411 5,802,477
Hightstown Borough 0 0 0 0 0 94,224 72,000
Hopewell Borough 0 0 0 0 0 9,532 0
Hopewell Township 0 0 0 0 0 1,153,731 600,187
Lawrence Township 2 0 102 1,625 0 1,471,873 2,442,550
Pennington Borough 0 0 2 0 0 133,684 418,321
Princeton Borough See Princeton (1114)
Princeton (1114) 1 3 0 0 0 3,314,331 631,660
Trenton City 0 0 0 0 0 295,991 29,950
Robbinsville Township 2 0 2 0 0 1,104,582 1,159,266
West Windsor Township 1 0 0 0 0 4,476,595 19,264,488
Middlesex County
Carteret Borough 0 0 0 0 0 319,815 1,200
Cranbury Township 17 0 25 0 0 499,989 3,482,350
Dunellen Borough 0 0 0 0 0 62,526 5,100
East Brunswick Township 0 0 0 0 0 642,144 24,686,600
Edison Township 13 2 0 0 0 5,179,633 8,724,651
Helmetta Borough 1 0 0 0 0 214,960 1,675
Highland Park Borough 0 0 0 0 0 3,442,359 73,950
Jamesburg Borough 0 0 0 0 0 195,130 200,200
Old Bridge Township 60 0 4 0 38,194 2,030,062 5,653,384
Metuchen Borough 0 0 25 0 0 549,398 11,644
Middlesex Borough 0 0 0 0 0 114,042 1,053,425
Milltown Borough 0 0 0 0 0 159,210 22,845
Monroe Township 16 0 5 0 0 4,538,465 1,111,869
New Brunswick City 1 1 0 0 0 1,117,440 1,232,948
North Brunswick Township 6 1 0 0 4,736 1,557,098 16,966,095
Perth Amboy City 12 0 74 0 0 1,601,441 468,000
Piscataway Township 88 0 0 0 0 5,744,239 1,963,029
Plainsboro Township 0 0 0 0 0 456,246 15,527,707
Sayreville Borough 21 0 1 0 0 2,519,770 1,584,926
South Amboy City 0 0 0 0 0 276,523 89,483
South Brunswick Township 1 0 0 0 0 1,394,136 2,420,308
South Plainfield Borough 1 0 32 2,074 0 1,008,766 1,270,555
South River Borough 0 0 0 0 7,079 190,318 791,200
Spotswood Borough 0 0 0 0 0 89,620 14,010
Woodbridge Township 5 36 36 0 0 2,119,618 2,477,813
Monmouth County
Allenhurst Borough 0 0 0 0 0 789,459 285,000
Allentown Borough 0 0 0 0 0 120,909 0
Asbury Park City 0 0 0 0 0 352,337 1,019,982
Atlantic Highlands Borough 1 0 1 0 0 559,912 61,900
MSD - 6
MUNICIPAL SUMMARY DATA, November 2019AREA NAME OFFICE SPACE RETAIL SPACE
HOUSING HOUSING CERTIFIED AUTHORIZED AUTHORIZED
AUTHORIZED UNITS HOUSING BY BUILDING BY BUILDING RESIDENTIAL NONRESIDENTIAL
UNITS DEMOLISED UNITS PERMITS PERMITS ($ AMOUNT) ($ AMOUNT)
Atlantic County 37 15 12 74,996 19,000 22,883,879 17,134,439
Avon-by-the-Sea Borough No report No report No report No report No report No report No report
Belmar Borough No report No report No report No report No report No report No report
Bradley Beach Borough 0 0 0 0 0 348,959 64,600
Brielle Borough 1 0 2 0 0 3,063,890 72,575
Colts Neck Township 2 0 1 0 0 2,739,084 2,221,525
Deal Borough 1 1 0 0 0 1,469,050 91,500
Eatontown Borough 0 0 0 0 0 331,163 3,981,280
Englishtown Borough 1 0 0 0 0 207,350 6,500
Fair Haven Borough 1 0 0 0 0 1,129,048 92,000
Farmingdale Borough 0 0 0 0 0 8,500 3,330
Freehold Borough 0 0 0 0 0 58,133 60,510
Freehold Township 3 0 0 0 0 2,190,322 971,959
Highlands Borough 0 1 0 0 0 122,854 0
Holmdel Township 0 0 0 0 0 1,568,728 1,837,168
Howell Township 2 1 1 0 0 1,241,668 1,053,243
Interlaken Borough 0 0 0 0 0 568,400 0
Keansburg Borough 0 0 0 0 0 525,190 850
Keyport Borough 6 0 0 0 0 254,370 45,500
Little Silver Borough 0 0 0 320 0 754,478 169,450
Loch Arbour Village 0 0 0 0 0 4,000 5,000
Long Branch City 3 3 0 0 0 3,515,840 1,217,813
Manalapan Township 0 2 1 0 0 1,559,881 221,855
Manasquan Borough 0 1 0 0 0 1,016,570 0
Marlboro Township 0 1 0 0 0 1,186,850 614,328
Matawan Borough 1 0 0 0 0 420,159 135,682
Aberdeen Township 5 1 1 0 0 1,013,392 18,485
Middletown Township 3 0 0 0 0 3,470,762 1,019,400
Millstone Township 1 0 0 0 0 620,309 255,799
Monmouth Beach Borough 0 0 3 0 0 273,623 0
Neptune Township No report No report No report No report No report No report No report
Neptune City Borough 0 0 0 0 0 389,037 0
Tinton Falls Borough 3 1 0 0 0 1,088,051 999,220
Ocean Township 6 1 78 0 0 4,343,014 685,501
Oceanport Borough No report No report No report No report No report No report No report
Hazlet Township 0 0 0 0 0 254,450 1,134,475
Red Bank Borough 0 0 0 0 0 304,510 503,816
Roosevelt Borough 0 0 0 0 0 14,300 0
Rumson Borough 2 0 0 0 0 1,452,065 39,855
Sea Bright Borough 1 3 0 0 0 652,261 800
Sea Girt Borough 0 0 4 0 0 289,640 3,078,376
Shrewsbury Borough 0 0 0 0 0 122,359 84,710
Shrewsbury Township 0 0 0 0 0 4,260 2,500
Lake Como Borough 0 0 0 0 0 266,758 0
Spring Lake Borough 1 2 0 0 0 1,553,069 284,150
Spring Lake Heights Boro 0 1 0 0 0 176,914 81,250
Union Beach Borough 1 0 0 0 0 480,893 76,849
Upper Freehold Township 0 0 0 0 0 224,023 242,010
Wall Township 0 3 1 0 0 1,311,433 1,708,053
West Long Branch Borough 0 1 0 0 0 289,306 260,395
Morris County
Boonton Town 0 0 0 0 0 206,713 28,702
Boonton Township No report No report No report No report No report No report No report
Butler Borough 0 0 1 0 0 273,947 1,500
Chatham Borough 0 0 1 0 0 462,423 38,864
Chatham Township 0 0 0 0 0 31,900 0
Chester Borough No report No report No report No report No report No report No report
Chester Township 0 0 0 0 0 471,330 117,864
Denville Township 2 1 0 0 0 1,469,181 293,710
Dover Town 0 0 0 0 0 19,892 0
East Hanover Township 0 0 1 0 0 546,871 2,006,131
Florham Park Borough 8 2 0 0 0 3,639,596 6,167,344
Hanover Township No report No report No report No report No report No report No report
Harding Township 0 2 0 0 0 379,253 71,700
Jefferson Township 0 0 0 0 0 570,083 218,000
MSD - 7
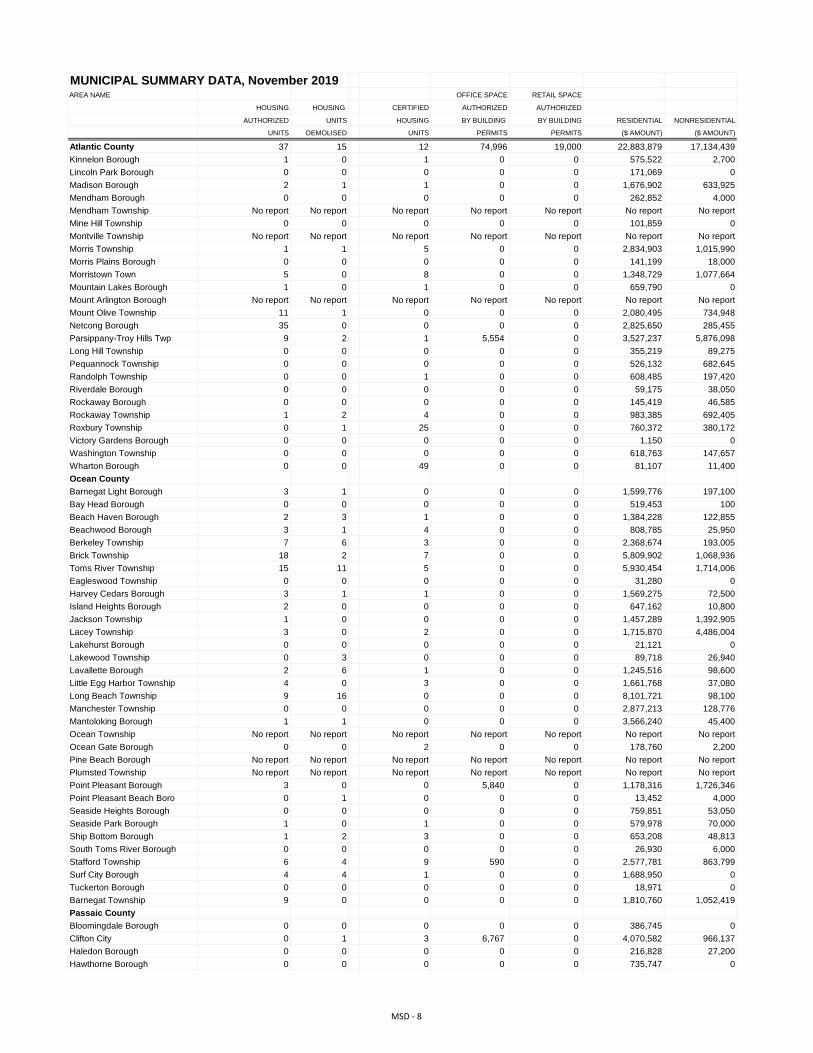
MUNICIPAL SUMMARY DATA, November 2019AREA NAME OFFICE SPACE RETAIL SPACE
HOUSING HOUSING CERTIFIED AUTHORIZED AUTHORIZED
AUTHORIZED UNITS HOUSING BY BUILDING BY BUILDING RESIDENTIAL NONRESIDENTIAL
UNITS DEMOLISED UNITS PERMITS PERMITS ($ AMOUNT) ($ AMOUNT)
Atlantic County 37 15 12 74,996 19,000 22,883,879 17,134,439
Kinnelon Borough 1 0 1 0 0 575,522 2,700
Lincoln Park Borough 0 0 0 0 0 171,069 0
Madison Borough 2 1 1 0 0 1,676,902 633,925
Mendham Borough 0 0 0 0 0 262,852 4,000
Mendham Township No report No report No report No report No report No report No report
Mine Hill Township 0 0 0 0 0 101,859 0
Montville Township No report No report No report No report No report No report No report
Morris Township 1 1 5 0 0 2,834,903 1,015,990
Morris Plains Borough 0 0 0 0 0 141,199 18,000
Morristown Town 5 0 8 0 0 1,348,729 1,077,664
Mountain Lakes Borough 1 0 1 0 0 659,790 0
Mount Arlington Borough No report No report No report No report No report No report No report
Mount Olive Township 11 1 0 0 0 2,080,495 734,948
Netcong Borough 35 0 0 0 0 2,825,650 285,455
Parsippany-Troy Hills Twp 9 2 1 5,554 0 3,527,237 5,876,098
Long Hill Township 0 0 0 0 0 355,219 89,275
Pequannock Township 0 0 0 0 0 526,132 682,645
Randolph Township 0 0 1 0 0 608,485 197,420
Riverdale Borough 0 0 0 0 0 59,175 38,050
Rockaway Borough 0 0 0 0 0 145,419 46,585
Rockaway Township 1 2 4 0 0 983,385 692,405
Roxbury Township 0 1 25 0 0 760,372 380,172
Victory Gardens Borough 0 0 0 0 0 1,150 0
Washington Township 0 0 0 0 0 618,763 147,657
Wharton Borough 0 0 49 0 0 81,107 11,400
Ocean County
Barnegat Light Borough 3 1 0 0 0 1,599,776 197,100
Bay Head Borough 0 0 0 0 0 519,453 100
Beach Haven Borough 2 3 1 0 0 1,384,228 122,855
Beachwood Borough 3 1 4 0 0 808,785 25,950
Berkeley Township 7 6 3 0 0 2,368,674 193,005
Brick Township 18 2 7 0 0 5,809,902 1,068,936
Toms River Township 15 11 5 0 0 5,930,454 1,714,006
Eagleswood Township 0 0 0 0 0 31,280 0
Harvey Cedars Borough 3 1 1 0 0 1,569,275 72,500
Island Heights Borough 2 0 0 0 0 647,162 10,800
Jackson Township 1 0 0 0 0 1,457,289 1,392,905
Lacey Township 3 0 2 0 0 1,715,870 4,486,004
Lakehurst Borough 0 0 0 0 0 21,121 0
Lakewood Township 0 3 0 0 0 89,718 26,940
Lavallette Borough 2 6 1 0 0 1,245,516 98,600
Little Egg Harbor Township 4 0 3 0 0 1,661,768 37,080
Long Beach Township 9 16 0 0 0 8,101,721 98,100
Manchester Township 0 0 0 0 0 2,877,213 128,776
Mantoloking Borough 1 1 0 0 0 3,566,240 45,400
Ocean Township No report No report No report No report No report No report No report
Ocean Gate Borough 0 0 2 0 0 178,760 2,200
Pine Beach Borough No report No report No report No report No report No report No report
Plumsted Township No report No report No report No report No report No report No report
Point Pleasant Borough 3 0 0 5,840 0 1,178,316 1,726,346
Point Pleasant Beach Boro 0 1 0 0 0 13,452 4,000
Seaside Heights Borough 0 0 0 0 0 759,851 53,050
Seaside Park Borough 1 0 1 0 0 579,978 70,000
Ship Bottom Borough 1 2 3 0 0 653,208 48,813
South Toms River Borough 0 0 0 0 0 26,930 6,000
Stafford Township 6 4 9 590 0 2,577,781 863,799
Surf City Borough 4 4 1 0 0 1,688,950 0
Tuckerton Borough 0 0 0 0 0 18,971 0
Barnegat Township 9 0 0 0 0 1,810,760 1,052,419
Passaic County
Bloomingdale Borough 0 0 0 0 0 386,745 0
Clifton City 0 1 3 6,767 0 4,070,582 966,137
Haledon Borough 0 0 0 0 0 216,828 27,200
Hawthorne Borough 0 0 0 0 0 735,747 0
MSD - 8
MUNICIPAL SUMMARY DATA, November 2019AREA NAME OFFICE SPACE RETAIL SPACE
HOUSING HOUSING CERTIFIED AUTHORIZED AUTHORIZED
AUTHORIZED UNITS HOUSING BY BUILDING BY BUILDING RESIDENTIAL NONRESIDENTIAL
UNITS DEMOLISED UNITS PERMITS PERMITS ($ AMOUNT) ($ AMOUNT)
Atlantic County 37 15 12 74,996 19,000 22,883,879 17,134,439
Little Falls Township 0 1 0 0 0 270,645 327,093
North Haledon Borough 0 0 0 0 0 316,661 6,200
Passaic City 0 0 0 0 0 2,231,864 3,232,050
Paterson City 33 1 0 0 0 2,444,293 8,158,093
Pompton Lakes Borough 0 0 0 0 0 156,114 10,375
Prospect Park Borough 0 0 0 0 0 52,242 0
Ringwood Borough 0 0 0 0 0 499,177 129,650
Totowa Borough 0 0 0 0 0 199,791 141,980
Wanaque Borough 0 0 0 0 0 208,000 29,010
Wayne Township 0 0 0 13,500 2,953 1,384,224 7,993,203
West Milford Township 0 0 0 0 0 809,307 256,214
Woodland Park Borough No report No report No report No report No report No report No report
Salem County
Alloway Township 0 1 0 0 0 9,050 92,826
Elmer Borough 0 0 0 0 0 0 92,398
Elsinboro Township 0 0 0 0 0 500,000 0
Lower Alloways Creek Twp 0 1 1 0 0 3,050 136,048
Mannington Township 0 0 0 0 0 171,339 500
Oldmans Township 0 0 0 0 0 71,170 734,262
Penns Grove Borough 0 0 0 0 0 59,853 1,150
Pennsville Township 0 0 2 0 0 205,805 234,379
Pilesgrove Township 0 0 0 0 0 129,787 688,494
Pittsgrove Township 0 2 0 0 0 104,600 176,854
Quinton Township 0 1 2 0 0 8,850 8,000
Salem City 0 0 0 0 0 33,250 34,150
Carneys Point Township 0 0 0 0 0 136,590 300
Upper Pittsgrove Township 0 1 1 0 0 39,400 98,342
Woodstown Borough 0 0 0 0 0 48,723 5,358
Somerset County
Bedminster Township 0 0 0 0 0 171,812 362,803
Bernards Township 0 0 1 0 0 1,229,039 258,101
Bernardsville Borough 0 0 0 0 0 901,941 124,506
Bound Brook Borough 1 0 0 0 0 609,937 5,880,000
Branchburg Township 0 0 0 1 0 434,826 991,603
Bridgewater Township 0 2 4 0 0 1,573,205 6,230,872
Far Hills Borough 0 0 0 0 0 37,761 0
Franklin Township 0 2 4 0 0 1,972,229 16,336,340
Green Brook Township 0 0 0 60,012 0 118,851 1,601,350
Hillsborough Township 4 0 2 4,689 0 3,296,078 546,650
Manville Borough 0 1 0 8,739 0 267,409 953,000
Millstone Borough 0 0 0 0 0 16,470 0
Montgomery Township 9 0 0 0 0 3,265,531 2,618,952
North Plainfield Borough No report No report No report No report No report No report No report
Peapack-Gladstone Borough No report No report No report No report No report No report No report
Raritan Borough 1 0 0 0 0 558,040 595,261
Rocky Hill Borough 0 0 0 0 0 170,000 0
Somerville Borough 0 6 1 0 0 378,592 44,199
South Bound Brook Boro 0 0 0 0 0 45,900 0
Warren Township 1 0 3 1,040 0 1,317,977 35,425
Watchung Borough 0 0 0 0 0 385,528 958,039
Sussex County
Andover Borough No report No report No report No report No report No report No report
Andover Township 0 0 0 0 0 132,142 45,716
Branchville Borough No report No report No report No report No report No report No report
Byram Township 0 0 0 0 0 59,280 41,567
Frankford Township 0 0 0 0 0 106,031 268,800
Franklin Borough 0 0 0 0 0 110,982 45,869
Fredon Township 0 0 0 0 0 52,215 3,910
Green Township 0 0 0 0 0 65,500 112,679
Hamburg Borough 0 0 0 0 0 42,857 7,700
Hampton Township 0 0 0 0 0 351,064 237,900
Hardyston Township 0 0 0 0 0 734,233 56,664
Hopatcong Borough 0 0 0 0 0 486,780 17,391
Lafayette Township 1 0 0 0 0 181,195 120,100
MSD - 9
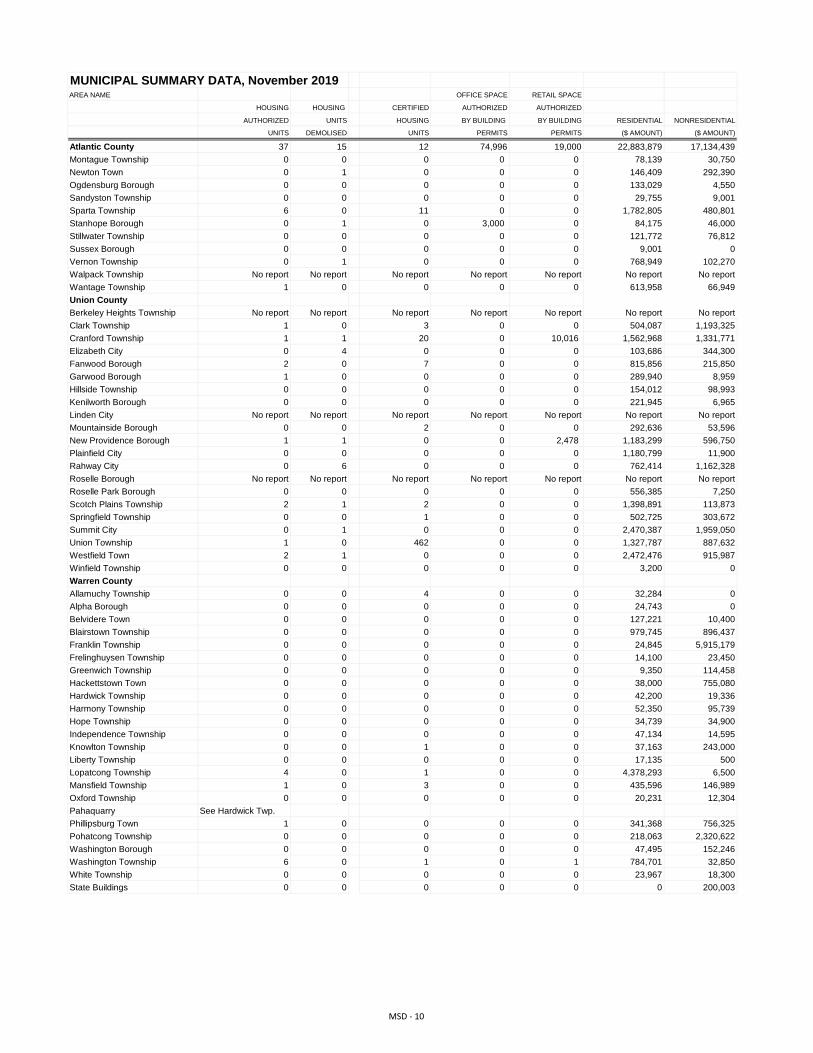
MUNICIPAL SUMMARY DATA, November 2019AREA NAME OFFICE SPACE RETAIL SPACE
HOUSING HOUSING CERTIFIED AUTHORIZED AUTHORIZED
AUTHORIZED UNITS HOUSING BY BUILDING BY BUILDING RESIDENTIAL NONRESIDENTIAL
UNITS DEMOLISED UNITS PERMITS PERMITS ($ AMOUNT) ($ AMOUNT)
Atlantic County 37 15 12 74,996 19,000 22,883,879 17,134,439
Montague Township 0 0 0 0 0 78,139 30,750
Newton Town 0 1 0 0 0 146,409 292,390
Ogdensburg Borough 0 0 0 0 0 133,029 4,550
Sandyston Township 0 0 0 0 0 29,755 9,001
Sparta Township 6 0 11 0 0 1,782,805 480,801
Stanhope Borough 0 1 0 3,000 0 84,175 46,000
Stillwater Township 0 0 0 0 0 121,772 76,812
Sussex Borough 0 0 0 0 0 9,001 0
Vernon Township 0 1 0 0 0 768,949 102,270
Walpack Township No report No report No report No report No report No report No report
Wantage Township 1 0 0 0 0 613,958 66,949
Union County
Berkeley Heights Township No report No report No report No report No report No report No report
Clark Township 1 0 3 0 0 504,087 1,193,325
Cranford Township 1 1 20 0 10,016 1,562,968 1,331,771
Elizabeth City 0 4 0 0 0 103,686 344,300
Fanwood Borough 2 0 7 0 0 815,856 215,850
Garwood Borough 1 0 0 0 0 289,940 8,959
Hillside Township 0 0 0 0 0 154,012 98,993
Kenilworth Borough 0 0 0 0 0 221,945 6,965
Linden City No report No report No report No report No report No report No report
Mountainside Borough 0 0 2 0 0 292,636 53,596
New Providence Borough 1 1 0 0 2,478 1,183,299 596,750
Plainfield City 0 0 0 0 0 1,180,799 11,900
Rahway City 0 6 0 0 0 762,414 1,162,328
Roselle Borough No report No report No report No report No report No report No report
Roselle Park Borough 0 0 0 0 0 556,385 7,250
Scotch Plains Township 2 1 2 0 0 1,398,891 113,873
Springfield Township 0 0 1 0 0 502,725 303,672
Summit City 0 1 0 0 0 2,470,387 1,959,050
Union Township 1 0 462 0 0 1,327,787 887,632
Westfield Town 2 1 0 0 0 2,472,476 915,987
Winfield Township 0 0 0 0 0 3,200 0
Warren County
Allamuchy Township 0 0 4 0 0 32,284 0
Alpha Borough 0 0 0 0 0 24,743 0
Belvidere Town 0 0 0 0 0 127,221 10,400
Blairstown Township 0 0 0 0 0 979,745 896,437
Franklin Township 0 0 0 0 0 24,845 5,915,179
Frelinghuysen Township 0 0 0 0 0 14,100 23,450
Greenwich Township 0 0 0 0 0 9,350 114,458
Hackettstown Town 0 0 0 0 0 38,000 755,080
Hardwick Township 0 0 0 0 0 42,200 19,336
Harmony Township 0 0 0 0 0 52,350 95,739
Hope Township 0 0 0 0 0 34,739 34,900
Independence Township 0 0 0 0 0 47,134 14,595
Knowlton Township 0 0 1 0 0 37,163 243,000
Liberty Township 0 0 0 0 0 17,135 500
Lopatcong Township 4 0 1 0 0 4,378,293 6,500
Mansfield Township 1 0 3 0 0 435,596 146,989
Oxford Township 0 0 0 0 0 20,231 12,304
Pahaquarry See Hardwick Twp.
Phillipsburg Town 1 0 0 0 0 341,368 756,325
Pohatcong Township 0 0 0 0 0 218,063 2,320,622
Washington Borough 0 0 0 0 0 47,495 152,246
Washington Township 6 0 1 0 1 784,701 32,850
White Township 0 0 0 0 0 23,967 18,300
State Buildings 0 0 0 0 0 0 200,003
MSD - 10
Prepared by the Division of Codes and Standards
New Jersey Department of Community Affairs 101 South Broad Street
Post Office Box 802 Trenton, New Jersey 08625
(609) 292-7898
www.nj.gov/dca/divisions/codes/reporter
in cooperation with the State Data Center of the
New Jersey Department of Labor and Workforce Development
Production and Distribution
Robert Austin Richard Byrne
Michael Covington Marie Daniels
Amy Heath John Lago
Samuel McKnight Tammori Petty Mark Schmitt Susan Woidill
2020


![[Construction E Book]](https://img.pdfslide.us/doc/110x75/58f9abde760da3da068b885f/construction-e-book-58f9abd2d9552.jpg)