Embed Size (px)
Citation preview

Strength in the StormHow Biopharmaceutical and Medical Technology
Companies Can Create Value in a Challenging Business Environment
T H C V C R
R

The Boston Consulting Group (BCG) is a global management consulting fi rm and the world’s leading advisor on business strategy. We partner with clients from the private, public, and not-for-profi t sectors in all regions to identify their highest-value opportunities, address their most critical challenges, and transform their enterprises. Our customized approach combines deep in sight into the dynamics of companies and markets with close collaboration at all levels of the client organization. This ensures that our clients achieve sustainable compet itive advantage, build more capable organizations, and secure lasting results. Founded in 1963, BCG is a private company with 74 offi ces in 42 countries. For more information, please visit bcg.com.

T H C V C R
STRENGTH IN THE STORM
HOW BIOPHARMACEUTICAL AND MEDICAL TECHNOLOGY COMPANIES CAN CREATE VALUE IN A CHALLENGING BUSINESS ENVIRONMENT
MICHAEL RINGEL
COLM FOLEY
OLIVIER WIERZBA
D | T B C G

| S S
CONTENTS
INTRODUCTION
HOW CAN HEALTH CARE COMPANIES CREATE MORE VALUE?
BIOPHARMACEUTICALSLarge-Cap Biopharma: Seeking ProductivityEmerging Biopharma: Driving InnovationGenerics: A Race to Scale
MEDICAL TECHNOLOGYMedical Devices: New Paths to Profi tMedical Supplies: Moving Up the Value ChainMedical Equipment: Pioneering the Next Growth FrontierIn Vitro Diagnostics: Moving Out of the Lab to Capture Value
THE SEARCH FOR SUSTAINABLE GROWTHExpanding Geographically: Capturing Value in Emerging MarketsExpanding Value: Embracing Value-Based Health CareExpanding into New Businesses: Spending Wisely for Growth
FIVE QUESTIONS THAT EVERY CEO SHOULD ADDRESS
APPENDIX
FOR FURTHER READING
NOTE TO THE READER
T B C G |
INTRODUCTION
S S: How Biopharmaceutical and Medical Technol-ogy Companies Can Create Value in a Challenging Business Environ-
ment builds on the thirteenth annual report in the Value Creators series published by The Boston Consulting Group (BCG). (See Risky Business: Value Creation in a Volatile Economy, September 2011.) Each year, we publish detailed empirical rankings of the stock market performance and total shareholder return (TSR) of the world’s top health-care companies and distill managerial lessons from the success of those companies. This report off ers a closer look at two sectors within the health care industry: biopharmaceuticals (biopharma) and medical technology (medtech). It analyzes the performance of 94 biopharma and medtech companies, highlights subsector-specifi c drivers of performance, and identifi es opportunities for companies to drive value creation.
Despite a global financial downturn, some companies far outperformed their peers during the five-year period 2006 through 2010 and achieved robust TSR. Shandong Wego, Novo Nordisk, Celgene, Edwards Life-sciences, and Intuitive Surgical were standouts among our 2011 value creators. What did these high performers do differently? They recog-nized and smartly deployed the drivers of value in their industries.
As discussed in this report, BCG’s smart-multiple methodology reveals the drivers of TSR performance in biopharma and medtech. Some of these drivers are important to all industries, and some are especially relevant to particular sectors and subsectors. Our analysis shows the mix of value drivers per sector and how companies can make the most of each driver.
Growth is one value driver that cuts across all sectors but also one that many companies find challenging to achieve. This report explores three major opportunities for revenue expansion when growth in the core stalls: emerging markets, value-based health care, and diversifica-tion. We conclude by posing the questions that CEOs must ask—and answer—in their pursuit of value creation.

| S S
HOW CAN HEALTH CARE COMPANIES CREATE MORE VALUE?
T (2006 through 2010) covered in this year’s Value Creators
report featured a historic global fi nancial downturn characterized by below-average growth and high market volatility. Average annual total shareholder return (TSR) across all industries was 6 percent, well below the historic annual average of 10 percent.1 In this time frame, the biopharmaceutical (biopharma) and medical technology (medtech) sectors were among the worst performers. (See Exhibit 1.) Of the 19 indus-tries analyzed, medtech ranked fi eenth with a 3.0 percent TSR, and biopharma ranked nineteenth with a 0.7 percent TSR. (See the appendix for an explanation of how we selected companies for inclusion in our Value Creators report and the rankings within biopharma and medtech.)
Nevertheless, even under the dark cloud of the general market downturn and inferior sector performance, many individual health-care companies shone during the study peri-od; some even achieved breakout success. The top five performers in each of the bio-pharma and medtech sectors exceeded 17 percent average annual TSR over the five-year period. In fact, the top medtech compa-ny, Shandong Wego, was the top-performing company in the entire Value Creators sample across all industries, with a spectacular 93 percent average annual TSR over the period. Simply put, each company is the master of its
own destiny, regardless of sector and market performance.
What levers can health care companies pull to outperform the market? We answer this question using BCG’s proprietary smart-multi-ple methodology, which empirically identifies the drivers of TSR performance. This meth-odology has strong explanatory power, typi-cally greater than 80 percent, and provides valuable insight for any company wishing to improve its performance. (See the sidebar “Total Shareholder Return and the Smart-Multiple Methodology.”)
The smart-multiple methodology also reveals that unique sets of variables drive valuation multiples in the different subsectors of the biopharma (large-cap, emerging, and gener-ics) and medtech (devices, supplies, equip-ment, and in vitro diagnostics) sectors. (Note that both health care IT and conglomerates are excluded from our analysis.) Later in this report, we elaborate on the drivers per sub-sector and the steps that companies in each subsector can take to maximize each driver, providing real-world examples.
Much of the commentary in news reports and the trade literature about the biopharma and medtech sectors has a distinctly gloomy tone, but our analysis clearly shows that paths to value creation exist. The companies that fol-lowed those paths were able to outperform

T B C G |
their peers and, indeed, the market as a whole, and they provide a lodestone to guide others seeking similar success in a stormy en-vironment.
Over the long term, strong TSR requires strong top-line growth. This maxim holds true across all industries: over the past ten years, revenue growth accounted for 77 percent of top-quartile performers’ TSR. And it is even more important for biopharma and medtech: in these sectors, over the same period, reve-nue growth drove 90 percent of top-quartile performers’ TSR. (See Exhibit 2.) Certainly, some companies have realized short-term gains by making one-time improvements in margin, financial structure, or other factors, but these gains have not driven long-term TSR performance.
However, while growth is essential, it shouldn’t be pursued at any cost. It is quite possible to grow yet destroy value by overpay-ing or pursuing unprofitable growth. Growth
in the core is often the most successful ap-proach, but this may not always be possible. As discussed in greater detail later in the re-port, three other avenues exist to reinvigorate performance when core growth stalls:
Expanding Geographically into Emerging •Markets. To sustain growth in today’s two-speed world (a world with faster growth in developing economies than in mature markets), companies should make certain that their strategies encompass the rapidly developing economies (RDEs). The trick is to ensure that the growth in target markets is matched with sensible margins and to customize approaches to address diff erent demographics, commercial and regulatory environments, and distribution networks.
Expanding Value by Embracing Value-Based •Health Care. Payers and governments are increasingly demanding real-world patient outcomes as a measure of whether a
69
51 54 56
3545
51 54
36
54
83
29
48
31
93
35
57
33 35
16 10 10 8 7 6 6 5 5 5 5 4 4 3 3 2 2 1 1
–10 –5 –5–15 –13 –14
–27–15 –21
–7–15 –19 –21
–14 –16 –12 –8–18
–49–60
–40
–20
0
20
40
60
80
100
120Average annual TSR, 2006–2010 (%)
High
Low
Industry-weighted average
ChemicalsMachinery
Mining Media andpublishing
Travel andtourism
UtilitiesRetail Pulp andpaper
Technology
Components Durablesand
apparels
Medicaltechnology
Biopharma-ceuticals
Telecom-munica-
tions
Transpor-tationand
logistics
Construc-tion andbuilding
materials
Multibusi-ness
Auto-motive
Non-durables
Sources: Thomson Reuters Datastream; BCG analysis.
E | Biopharma and Medtech Are Among the Weakest Sectors, but Strong TSR Is Possible in Any Industry
| S S
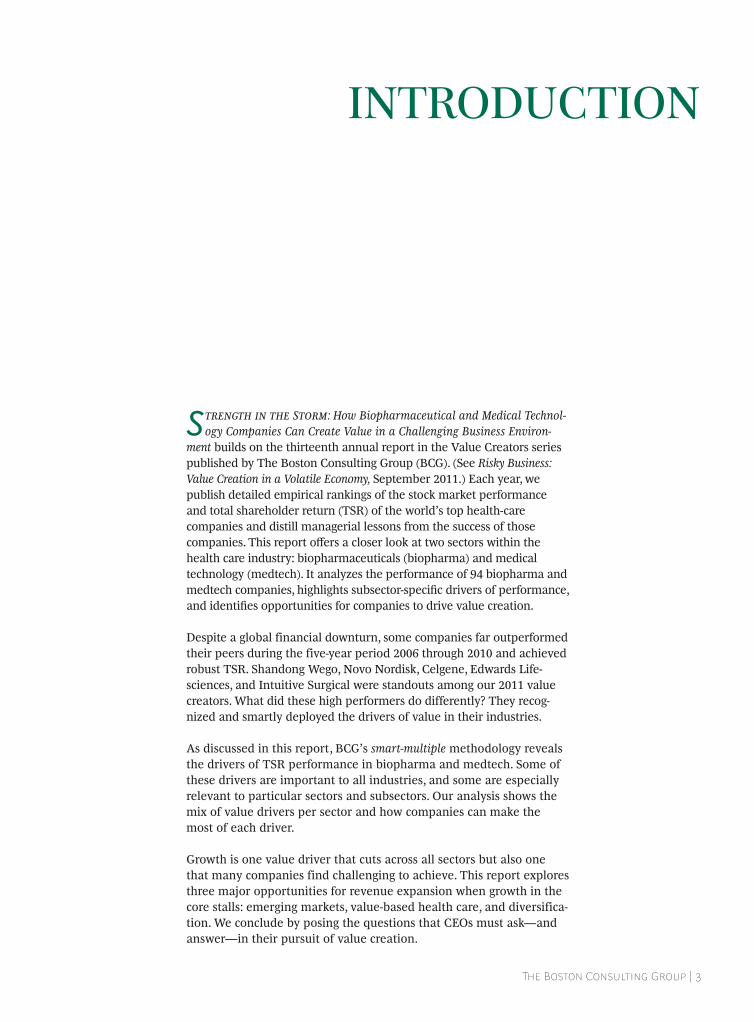
TSR is a comprehensive measure of the total annual increase in value given to a shareholder. It measures the change in a company’s market value (o en decom-posed into earnings and P/E multiple) plus its free-cash fl ow (dividend yield and changes in net debt and the number of outstanding shares).
BCG’s smart-multiple methodology analyzes more than 100 business metrics and ratios for their relationship to the valuation multiple. We then back-test these metrics to fi nd a set of determinants with consistent explanatory power for the performance observed in a sector. (See the exhibit below. For more information and an example of smart-multiple analysis, see The 2007 Value Creators Report: Avoiding the Cash Trap, BCG report, September 2007.) In the
case of biopharma and medtech, the identifi ed drivers fi t into six overall catego-ries: scale, margin, R&D productivity, near-term growth expectations, fi nancial policy, and year-specifi c eff ects related to fl uctuations in the capital markets during the period.
Example: driversfor medical devices
Smart-multiple methodology
accurately predicts expectations
Multiple (model)
Multiple (actual)
Overvalued
Variance explained by factor (%) 40 30 20 10 0
Other
Financialpolicy
Near-term
growth
R&Dproduc-
tivity
Margin
Scale
Size Cash gross margin Operating expenditure (% of revenue) Gross R&D spend (% of revenue) 3- to 5-year earnings-per-share growthDebt/assets
Intrinsic value
(change in earnings)
Cash returned
to investors(dividends
and change in shares/net debt)
TSR
Investor expectations
(change in multiple)
Capital gains
Free-cash-flow yield
TSRdecomposition
adj R2: 0.88
ƒ
Capital markets (2008)Capital markets (2009)
Under-valued
Sources: Compustat; BCG ValueScience Center.
TSR Decomposition and BCG’s Smart-Multiple Methodology Provide Valuable Insights
TOTAL SHAREHOLDER RETURN AND THE SMARTMULTIPLE METHODOLOGY

T B C G |
product is worth paying for. Companies that align their off erings to one simple metric—patient outcomes per dollar of total health-care spending—and take an integrated approach to patient care will be better positioned to benefi t.2 This ap-proach is called value-based health care. While it sounds simple, it has profound consequences for the products that biopharma and medtech companies sell, the way they conduct their trials, how they approach partnerships with payers and providers, and the on-market eff orts they make to contribute to better outcomes.3
Expanding into New Businesses—Spending •Wisely for Growth. M&A and diversifi cation o en appear attractive to health care companies, which tend to have large cash reserves, access to fi nancing, and slowing organic growth. However, markets can punish those that pursue such activities at any price. Companies should assess both their need and their ability to diversify, in order to determine whether doing so is viable for long-term value creation.
All the value drivers we discuss in this report may seem straightforward, but their applica-tion is certainly not. In BCG’s experience, su-perior performance starts with alignment be-
tween the management team and the board on the company’s value-creation aspiration, a deep understanding of the drivers that can turn that aspiration into reality, and a specific plan to pull those levers.
Each company must plot its own path to suc-cess on the basis of its starting position and its strategy. The value drivers revealed in this report provide useful guidance. However, only through an individually tailored approach can a company achieve its value creation goals.
NOTES1. TSR is a dynamic ratio that measures the total returns a shareholder achieves from owning a stock. It includes changes in stock price as well as free-cash flow generated through dividends, changes in the number of shares outstanding, and changes in net debt.2. Measures are often condition-specific, such as 30-day survival after acute myocardial infarction or post-opera-tive infection rate in cataract surgery.3. ”Improving Health Care Value: The Case for Disease Registries,” BCG Focus, December 2011.
Contribution to TSR (points of annual TSR) 35 30
25
20
15 10 5
0 –5
10 years
16
90%
–11%
7 years
18
66%
11%
5 years
19
71%
3 years
20
61%
16%
1 year
32
44%
46%
Revenue growth Margin change Multiple change Free cash flow
Rolling time span Rolling time span
Contribution to TSR (points of annual TSR) 35 30
25
20
15 10
5
0 –5
10 years
14
7 years
17
77% 65%
10%
5 years
19
59%
13%
3 years
20
53%
16%
1 year
31
30%
41%
Top-quartile biopharma and medtech performers, 1991–2010
Top-quartile performers, 1991–2010
Across industries... ...and especially in
biopharma and medtech
16%
13%
22%
11%
19%
9% 9% 4% 1% 16% 17%
4%
6% 2% 4%
7% 4% 6% 16% 22%
15% 17%
Sources: Compustat; BCG ValueScience Center.Note: The exhibit shows the average of S&P 500 performers in the sixty-fifth to eighty-fifth percentile to illustrate approximate performance at the cutoff point for the top quartile. Because of rounding, not all percentages add up to 100.
E | Revenue Growth Is Essential to Long-Term TSR

| S S
BIOPHARMACEUTICALS
T - in this report was a stormy time for the bio-
pharma sector. While sales growth remained strong, expectations for future growth de-clined signifi cantly. P/E ratios for large-cap biopharma, a formidable 35x in 2000, plunged to 11x by 2010.
The challenges underlying this decline are well known and include pricing and access pres-sures, higher scientific hurdles, more-stringent regulatory thresholds, and intensifying compe-tition. The average return on investment (ROI) in R&D for new products—the lifeblood of the sector—is now below the cost of capital, mak-ing average R&D value destroying.4 However, performance on this measure varied widely during our study period, and some companies consistently found ways to beat the average.5
We studied three subsectors of biopharmaceu-tical companies, differentiated on the basis of their business models, their risk profiles, and the factors driving their performance: large-cap biopharma (relatively diverse companies with market capitalization of $30 billion or more), emerging biopharma (relatively focused companies with market capitalization be-tween $5 billion and $30 billion), and generics (companies that derive more than 60 percent of their sales from generic drugs).
Despite their differences, all three subsectors shared the experience of severe contraction of their valuation multiple during the five-year period, offset by sales growth. (See Ex-hibit 3.) Near-term growth was weakest in large-cap biopharma, at 7 percent per year, and strongest in generics, at 21 percent per
Sources: Thomson Reuters Datastream; Thomson Reuters Worldscope; Bloomberg; annual reports; BCG analysis.1Contribution of each factor shown in percentage points of five-year average annual TSR; any apparent discrepancies in TSR totals are due to rounding.
E | All Biopharma Subsectors Saw Multiples Contract, but Sales Growth Off set This to Varying Degrees
Biopharma subsector performance, 2006–2010
Subsector(n=companies evaluated)
2006–2010TSR(%)1
Marketvalue
($billions)
Salesgrowth
(%)
Marginchange
(%)
Multiplechange
(%)
Dividendyield(%)
Sharechange
(%)
Net debtchange
(%) Biopharma (n=43) 1 1,495 8 1 –8 2 –1 –2
Large-cap biopharma (n=14) 0 1,117 7 1 –9 3 0 –2Emerging biopharma (n=19) 2 263 11 1 –7 2 –3 –2Generics (n=10) 6 114 21 3 –11 1 –6 –2
All industries (n=891) 6 5 1 –2 3 0 0

T B C G |
year. Nonetheless, some companies from each of the subsectors achieved better-than-aver-age performance, and we used smart-multiple analysis to determine the drivers of this ex-ceptional performance.
Among large-cap biopharma companies, the key drivers of the multiple are as follows: R&D productivity, operational efficiency/margin, financial policy, and the ability to maximize the sales value of the portfolio before and after loss of exclusivity (LOE)/growth. Investors look for both growth and stable value creation from these companies.
For emerging biopharma companies, the key drivers of the multiple are margin, R&D pro-ductivity, debt ratio, and sales growth. Inves-tors in these companies look for a credible story of profitable growth—the next revenue engine after early success.
For generics companies, the key drivers of the multiple are scale and financial stability, par-ticularly in debt/enterprise value ratio. From 2006 through 2010, as many innovative bio-pharma products lost patent protection, generics companies essentially competed in a “land grab.” Investors rewarded those play-ers that were able to rapidly gain market share without accumulating too much debt or overextending themselves financially. (See Exhibit 4 for a summary of drivers across each subsector.)
What can biopharma companies do to capi-talize on these drivers of value?
Large-Cap Biopharma: Seeking ProductivityThe large-cap biopharma subsector per-formed poorly on average, registering only a
Scale
Size
Leadership premium Capital expenditure (% of revenue)
MarginCash gross margin Operating expenditure (% of revenue)
R&Dproductivity
Gross R&D (% of revenue)
Pipeline1
Patent-protected revenue2
Near-termgrowth
expectation3- to 5-year earnings-per-sharegrowth (%)
Trailing revenue growth
Financialpolicy
Debt ratio3
Dividends/EBITDA
Cash (% of revenue)
Other Year-specific capitalmarket (total)
Biopharma Medtech
Large-cap Emerging Generics Devices Supplies EquipmentIn vitro
diagnostics
Relative percentage of variation in multiple explained by the variable
Sources: Compustat; BCG ValueScience Center.Note: Unexplained variability for each segment ranges from 9 percent to 13 percent. 1Expected pipeline replenishment is measured as the rate of decay of weighted patent-protected sales (WPPS); fast decay of WPPS by 2016 is scored as a 0, intermediate as 0.5, and slow as 1. 2Patent-protected sales, or WPPS, is a measure of estimated patent protection of the portfolio: the portion of sales coming from products with greater than five years’ remaining patent life, using EvaluatePharma’s projected revenues and patent lives.3For generics, this measure is normalized to enterprise value; for emerging biopharma, it is normalized to revenue; and for all other subsectors, it is normalized to assets squared.
E | Drivers of Valuation Multiple Vary for Each Subsector

| S S
flat 0 percent annual TSR over the five-year period, despite support from substantial divi-dend payments. But in the midst of this gen-erally poor performance, some individual companies performed remarkably well. (For an example, see the sidebar below.)
For companies in this subsector, four factors drove a better multiple: improving R&D pro-ductivity, maximizing the sales value of the portfolio before and after LOE, continuing to
improve the efficiency of operations, and adopting a sound financial policy.
Improving R&D Productivity. R&D productiv-ity can be defi ned as the value generated per dollar spent on R&D. It is an enterprise-wide metric, given that value generation depends on levers both within and beyond the control of the R&D function. That R&D productivity has been declining for decades is a well-docu-mented trend and one that, if uncorrected,
Novo Nordisk ranked highest among the large-cap biopharma companies that BCG reviewed, attaining fi ve-year TSR of 31 percent. The company achieved this strong performance by combining a variety of value drivers:
Revenue Growth. • As shown in Exhibit 2, page 7, growth is the most important driver of TSR. Novo signifi cantly out-paced the large-cap biopharma average growth rate, turning in 12 percent versus peers’ 7 percent.
Increased Multiple. • Novo was the only large-cap biopharma that expanded its multiple over the fi ve-year study period.
Financial Policies. • Unusual for a growth company, Novo returns considerable cash to shareholders. Novo raised its divi-dends in each year of the report period. Following a dividend increase of 25 percent in 2010, the company proposed a 33 percent increase in 2011. Novo also has an active share-repurchase program, funded partly by the sale of lower-priority interests such as ZymoGenetics during streamlining eff orts.
Increased Margin. • Novo reduced cost of goods sold from 25 percent in 2006 to 19 percent in 2010, a change that helped boost margins to 4 percent annually. By contrast, the company’s peers increased their margins by 1 percent annually on average during the fi ve-year period.
To achieve these gains, Novo pulled many of the levers identifi ed in this report. The company improved its margins and spurred growth by introducing diff erentiated products for the fast-growing diabetes market. In 2009, for instance, Novo launched Victoza, which is well on track to become a blockbuster and to overtake the fi rst-entrant GLP-1 (Byetta). Novo has launched multiple blockbusters despite a relatively low R&D investment, resulting in R&D productivity that is higher than that of most of the company’s peers.
Novo also took a strategic approach to geographic expansion. In 2003, the com-pany made U.S. markets a priority. As a result, North American contributions to sales increased from about 25 percent in 2003 to more than 40 percent today. Similarly, Novo’s focus on emerging markets has generated a signifi cant share of revenue from those countries, including 9 percent from China.
The company’s strong performance can also be attributed in part to eff ective life cycle management. In 2007, for instance, Novo moved entirely out of small mol-ecules to concentrate on therapeutic proteins. Because biologics are less subject to near-term competition from generics, Novo’s post-LOE portfolio should continue to contribute substantially to sales, in part by avoiding the drastic revenue declines that most patent expiries herald.
NOVO NORDISKPutting It All Together

T B C G |
threatens the very underpinnings of the biopharma sector.6 In fact, many analysts calculate that the average ROI for R&D spending is now negative.7 BCG’s analysis of the implicit value ascribed to R&D across large biopharma companies supports this view.8 (See Exhibit 5.) However, our analysis also reinforces the notion that performance varies widely. We have shown elsewhere that the stronger performers, including Bristol-Myers Squibb and Genentech, have been those that are the most successful in addressing the main challenge to R&D productivity: bureaucracy.9
Bureaucracy delivers a one-two punch to pro-ductivity. Given the high failure rates of R&D projects, strong R&D performance relies on great science (to maximize the number of winners) and great decision-making (to iden-tify and exit losing projects quickly).
But bureaucracy hinders the ability to con-duct great science because it makes the orga-nization less attractive to great scientists and introduces distractions that steal time from the dedicated pursuit of new drugs. And bu-reaucracy hinders great decision-making be-cause it disperses accountability and intro-duces procedures and performance metrics that are not always aligned with enterprise-wide value creation. Indeed, often there are
perverse incentives, especially against making good “kill” decisions about drug discovery projects that lack sufficient promise. For ex-ample, fixed staffing levels can be an incen-tive to invest in ROI-negative (but “best avail-able”) projects rather than to stop work and eliminate staff or leave staff idle.
Our assessment of the high-performing large-cap biopharma companies reveals that the following actions can help reduce bureaucra-cy and improve R&D productivity:
Aim for a process-light environment that •removes organizational layers that ultimately hinder decision making.
Create a culture that attracts the best •scientifi c talent and unleashes those individuals’ creative potential.
Align personal and functional-unit •incentives with corporate goals. Reward behaviors that drive the right decisions, made expeditiously, even when these decisions are not what the organization wants to hear.
Create an R&D strategy that focuses on •diff erentiated products—a strategy that appropriately mixes “pull” from markets
2010
2011
EliLilly
GlaxoSmithKlinePfizerMerckAstraZenecaGileadGenentechCelgene Bristol-MyersSquibb
Amgen
30%20%10%
0%–10%–20%–30%
Average
EliLilly
Celgene AstraZenecaGileadMerck GlaxoSmithKline Amgen Pfizer Bistol-MyersSquibb
30%
20%10%
0%–10%–20%
Average
Sources: “Can R&D Be Fixed? Lessons from Biopharma Outliers,” BCG Focus, September 2011; also published as Peter Tollman, et al., “Identifying R&D Outliers,” Nature Reviews Drug Discovery 10(653-654), August 2011; BCG analysis.
E | The Net Value of R&D Varies as a Percentage of Enterprise Value

| S S
that have unmet need with “push” from discoveries at the bench.
Foster a culture in which cooperation to •support overall company goals is valued as highly as expertise and individual functional performance.
The market’s response to Pfizer’s 2011 R&D restructuring illustrates the importance of these principles. In February 2011, Pfizer an-nounced that it was adopting a strong ROI-based approach to decision making in R&D investments, taking measures to improve its science, reduce bureaucracy, and cut costs. Investor reaction was extremely favorable.10 Whereas Pfizer’s R&D valuation was among the most negative in 2010, it emerged as one of the most positive in 2011. (See Exhibit 5.) Of course, to sustain this positive valuation, the company must deliver on its plans. That outcome remains to be seen, but the large positive shift in valuation stands as an exam-ple of what companies can do to address R&D productivity, one of the key drivers of the valuation multiple.
Maximizing the Sales Value of the Portfolio. The second factor aff ecting TSR performance among large-cap pharma companies is the ability to maximize product revenues throughout the product life cycle. Unfortu-nately, in a sector in which sales are strongly
driven by on-patent products, companies have paid little attention to life cycle manage-ment (LCM). When LCM has been applied, it has typically been used as a temporary fi x to a looming LOE rather than as a proactive strategy to maximize sales. Even today, most large-cap biopharma companies pay insuffi -cient attention to LCM opportunities, espe-cially in smaller geographic markets.
The companies that extract the most reve-nues from their portfolios are those that treat LCM as a part of development from the out-set, not as a reaction to an impending patent expiry. Strategies that maximize revenue pre-LOE and bolster revenues post-LOE deliver stronger and more stable revenue growth. Successful companies take action on four fronts: maximizing patent life through techni-cal, legal, and regulatory means; driving greater demand and scale immediately be-fore patent expiry; progressively lowering the cost base for the product; and limiting post-LOE revenue loss in a variety of ways, includ-ing preserving or replacing lost volume in some segments by lowering price, while maintaining a premium price in other seg-ments that support it. (See Exhibit 6.)
Effective LCM also takes account of geo-graphic-market considerations. For some blockbuster products, considerable post-LOE value exists beyond the U.S. and the top five
• Preserve volume or replace lost volume oen at lower price
Time
Profit
2
3
1 Increase volume Maximizepatent life
Limit revenue loss
Maintain volume Change segment pricingand sales model
Patent expiry
Typical product life cycle (illustrative)
4 Lower cost base
• Drive greater demand and scale pre-expiry
• Secure loyalty of some segments at a premium
• Quickly adjust cost base
• Leverage cost competitiveness
• Evaluate appropriate legal levers and patent extensions
Source: BCG analysis.
E | Life-Cycle-Management Strategies Can Maximize Portfolio Value

T B C G |
markets in the European Union. As much as 40 percent of blockbusters’ potential revenue maintenance can come from “the next 20” countries, demonstrating the impor-tance of the rest of the world market in LOE planning.
Dividends were much more effective than share buybacks at increasing valuation multiples.
Continuing to Improve the Effi ciency of Operations. Most companies in the large-cap biopharma subsector have been cutting costs for several years now, by reengineering processes and by exiting some diseases or therapeutic areas. Such actions are necessary and have produced some improvement in TSR, but on their own they are little more than table stakes and are insuffi cient for signifi cantly enhancing performance. Compa-nies should continue their eff orts to hone operational effi ciency in a way that deepens their focus on value creation: reviewing current activities and eliminating those that are not truly necessary, matching demand with available resources more eff ectively, making fi xed costs more variable, and sharing risk with other stakeholders.
Adopting a Sound Financial Policy. Sound fi nancial policy is based on two critical principles. The fi rst is alignment with overall strategy: determining how much cash to allocate to M&A, R&D, and capital expenses and how much to return to investors based on strategic objectives. The second is building trust among investors by being consistent and transparent in the implementation of the strategy. Application of these two principles enables a company to attract investors whose investment goals are aligned with the compa-ny’s characteristics. For example, value investors—those that target industries with lower-growth but consistent performance—seek higher dividends. Strong performance here is one of the diff erentiators that bol-stered the performance of some large-cap
biopharma companies during our study period. Dividend performance is likely to become even more important for this sector going forward, if the generally low growth economy continues.
An all-industry BCG study conducted between 2001 and 2005 compared two sets of compa-nies: those that initiated or increased dividend payouts, and those that increased ongoing share repurchases by a similar amount.11 We found that dividends were much more effec-tive than share buybacks at increasing valua-tion multiples over the ensuing three quarters (28 percent versus –5 percent, on average). Dividends have strong signaling power: they suggest that leaders have confidence in the fu-ture profitability of the company; this in turn generates interest from investors, particularly large investors such as pension and mutual funds. But share buybacks send no such signal, and because they reward only selling a compa-ny’s stock, not holding it, they don’t attract long-term investors.
Emerging Biopharma: Driving InnovationCompanies in the emerging-biopharma sub-sector tend to concentrate on select therapeu-tic areas, to have a specific and innovative platform, and to market few if any nonpre-scription drugs. They are often young, biolog-ics-focused companies, and they may be viewed as attractive takeover targets owing to their profitability and smaller size. Note that any analysis of companies with these traits is fraught with sample bias—the end-of-period sample excludes companies that were ac-quired, went bankrupt, or remained or be-came too small to meet the cutoff market cap to be included in our sample. Nevertheless, the themes for this subsector that emerge from smart-multiple analysis are consistent with what investors say about the subsector’s main drivers of value.
Smart-multiple analysis shows that the driv-ers of success in this subsector are a some-what simpler set of factors than those at work in the large-cap biopharma subsector: margin, R&D productivity, debt ratio, and sales growth. The key to success is making the transition from launching or licensing out

| S S
the company’s first drug to running a sus-tainable innovation engine. Essentially, the challenge facing companies in the emerging-biopharma subsector is finding the next blockbuster franchise to follow up their ini-tial success and convincing the market that they can succeed more than once. Those that have performed the best have a credible sto-ry for what their next compound will be. (For an example, see the sidebar below.)
Like large-cap biopharma companies, emerg-ing-biopharma companies should focus on R&D productivity and decision making. In par-ticular, the smaller companies within this sub-sector need to avoid the trap of investing in an ROI-negative project simply because it is the only asset in the portfolio in which to invest.
Generics: A Race to ScaleThe generics subsector experienced a boom during the study period, winning six of the top ten spots in the biopharma five-year TSR
rankings. Strong sales growth of 21 percent per year propelled generics during the peri-od, but some observers are beginning to question the sustainability of this growth: with a dearth of large patent expiries beyond the next few years, generics companies’ own pipelines are likely to shrink.
Unlike the other two biopharma subsectors, the generics subsector does not depend on
R&D productivity to drive valuation multi-ples. Instead, the critical factors are scale and financial stability, indicative of a “land grab” situation in which companies are building scale to win share but need to do so without becoming financially overextended.
Scale helps keep the cost of goods sold low and makes it easier to take advantage of short exclusivity windows (such as the 180-day exclusivity following a successful Para-graph IV patent challenge)—both of which provide a competitive advantage.
Celgene has earned a place among the top three companies in BCG’s combined biopharma and medtech rankings for four of the fi ve years in the report period, thanks to breakout growth in the oncology thera-peutic area and an average annual TSR of 12.8 percent.
In 1998, Celgene launched its fi rst block-buster, Thalomid. The company grew aggressively in the ensuing decade, both organically and through targeted acquisi-tions, to reinforce its core portfolio and increase global scale. In 2005, Celgene launched Revlimid, which rocketed to $2.5 billion in sales in 2010 and provided 70 percent of Celgene’s revenues for that year. In 2008, the company acquired Pharmion and has since worked to integrate the Pharmion assets, improving both cost of goods sold and sales, general, and admin-istrative expenses. The net result of these moves is that since 2003, when Celgene fi rst became profi table, it achieved top-line
growth of 48 percent and operating-profi t growth of nearly 70 percent per year over the seven years that followed.
Through 2015, Celgene anticipates top- and bottom-line growth of 15 percent and 20 percent, respectively. To achieve this growth, the company is pursuing label extensions for its existing drugs and is introducing new products. Most of Celgene’s development focuses on its core of innovative, high-value small molecules for oncology and immune/infl ammatory applications (two areas with signifi cant unmet needs); the company is also exploring adjacent applications for its oncology and hematology therapeutic areas through new platforms such as stem-cell technology and nanoparticle drug delivery.1
N1. “Celgene Corporation: PharmaVitae Report,” Datamonitor, July 2011; Celgene, annual report, 2010; BCG analysis.
CELGENERepeating Breakout Growth
T B C G |
The financial-stability metric that is most im-portant for generics companies is debt-to-en-terprise value ratio. This emphasis generally favors the larger, more established generics companies that have an existing engine to fund investments in new growth opportunities.
Either large-cap bio-pharma or large generics companies could win the biosimilars market.
As with the other biopharma subsectors, growth is critical for generics companies. Po-tential avenues for growth include penetrat-ing new regions (such as emerging markets) and investing in more sophisticated technolo-gies (such as small-molecule injectables). One area with considerable interest is biosimilars. Because biologics make up a large and grow-ing portion of biopharma revenues and are often specialty or niche products with higher margins than traditional small-molecule drugs, many generics companies hope to grow in this direction.
However, developing biosimilars requires ca-pabilities that differ from those needed for synthesizing a small molecule, and technical, clinical, commercial, and regulatory hurdles can complicate the development process. Reg-ulatory procedures for biosimilars are still be-ing developed, and exist only in draft form for certain classes of molecules, if at all, in some of the largest markets. Furthermore, there is no clear metric for “biosimilarity,” so successful commercialization could require large and lengthy trials to establish safety and equivalence, as well as a sizable sales force to
persuade physicians to switch to a biosimilar from a trusted, branded biologic.
Moreover, many of these requirements play to the strengths of large-cap biopharma compa-nies. This creates a competitive situation in which either large-cap biopharma or large ge-nerics companies could end up winning the biosimilars market. Victory will go to those companies that can rapidly acquire the need-ed capabilities of the other subsector, while drawing on their own traditional strengths.
NOTES4. “Below Zero and Falling Fast: R&D Productivity as an Enterprise-Wide Crisis,” Sector & Sovereign Research, October 11, 2011; “The Long View: Pharma R&D Productivity—When the Cures Fail It Makes Sense to Check the Diagnosis,” Bernstein Research, September 30, 2010.5. “Can R&D Be Fixed? Lessons from Biopharma Outliers,” BCG Focus, September 2011; also published as Peter Tollman, et al., “Identifying R&D Outliers,” Nature Reviews Drug Discovery 10(653-654), August 2011.6. “Drugs: Supply Running Low,” Financial Times, February 9, 2011; Bernard Munos, “Lessons from 60 Years of Pharmaceutical Innovation,” Nature Reviews Drug Discovery, 8(959-968), December 2009.7. “Below Zero and Falling Fast: R&D Productivity as an Enterprise-Wide Crisis,” Sector & Sovereign Research, October 11, 2011; “The Long View: Pharma R&D Productivity—When the Cures Fail It Makes Sense to Check the Diagnosis,” Bernstein Research, September 30, 2010.8. For each company, we compared future cash flows from existing products with the enterprise value of each company (market capitalization plus net debt), leaving a differential that is the net value of R&D.9. “Can R&D Be Fixed? Lessons from Biopharma Outliers,” BCG Focus, September 2011; also published as Peter Tollman, et al., “Identifying R&D Outliers,” Nature Reviews Drug Discovery 10(653-654), August 2011.10. “Americas Morning Summary: Pfizer Inc. (PFE); New CEO’s Focus Represents a Refreshing Break from the Status Quo,” Goldman Sachs, February 2, 2011.11. The 2008 Value Creators Report: Focusing Corporate Strategy on Value Creation, BCG report, September 2008.

| S S
MEDICAL TECHNOLOGY
T delivered strong fundamental performance, averag-
ing more than 11 percent revenue growth and 11 percent earnings before interest and taxes (EBIT) growth from 2001 through 2010. However, this performance on fundamentals is no longer refl ected in TSR: although the sector delivered 6 percent average annual TSR from 2001 through 2005, for the period 2006 through 2010, TSR slipped to 3 percent per year. The culprit was a strong decline in multiples, a trend that refl ects concern about the sustainability of the historically high gross margins and growth in the sector and the related underlying factors.
In the past, many medtech companies relied on selling high-margin products in developed markets. Importantly, revenue growth came as much from price increases (which were made possible mostly by improving the prod-uct mix) as from unit volume growth. In fact, the typical recipe for success in this sector has been to invest in high-cost sales models in or-der to push a steady flow of incremental in-novations into the market at ever-higher pric-es. This model, however, has been under threat in recent years:
The level of product innovation has been •declining.
Pricing pressure has been mounting in •developed markets.
Future unit-volume growth is skewed •more strongly to developing, versus developed, markets now than in the past, and prevailing prices in developing markets simply don’t support the margins achieved in developed markets.
We modeled the impact of these trends and predict that they will continue and, in fact, accelerate. Currently, many medtech product groups and regions deliver gross margins ex-ceeding 75 percent; indeed, 25 percent of the medtech sector’s gross profit comes from these groups and regions. But over the next ten years, according to our analysis, this will fall to about 10 percent. Gross margins across medtech will fall by two percentage points on average. Further, we believe, revenue growth over the next ten years will average just 4 to 5 percent per year, down from the historic av-erage of 10 percent.12 The heyday of the sec-tor is waning, and ten years from now the in-come statement of the typical successful medtech company will resemble that of a high-tech or even an industrial-goods compa-ny: lower gross margins and, by necessity, a more modest cost structure relative to the traditional medtech profile.
In turn, valuation multiples, which reflect in-vestor confidence in future fundamental per-formance, declined over the study period. It is important to note that investors place a par-ticularly strong emphasis on margins when
T B C G |
valuing medtech companies. In fact, cash gross margin and operating expenses together ac-count for between one-third and one-half of the variation in medtech company multiples. The companies that have not been able to convince investors that their margin structure is sustainable have been particularly severely penalized in terms of their multiples.
To fully understand the value creation trends in medtech, we looked at the performance of its four subsectors:
Medical Devices: • complex medical products that tend to stay in or on the body for extended periods
Medical Supplies: • disposable products, usually involving repeated use
Medical Equipment: • sophisticated durable products requiring capital investments
In Vitro Diagnostics (IVD): • instruments and reagents for analyzing patient blood and tissue samples
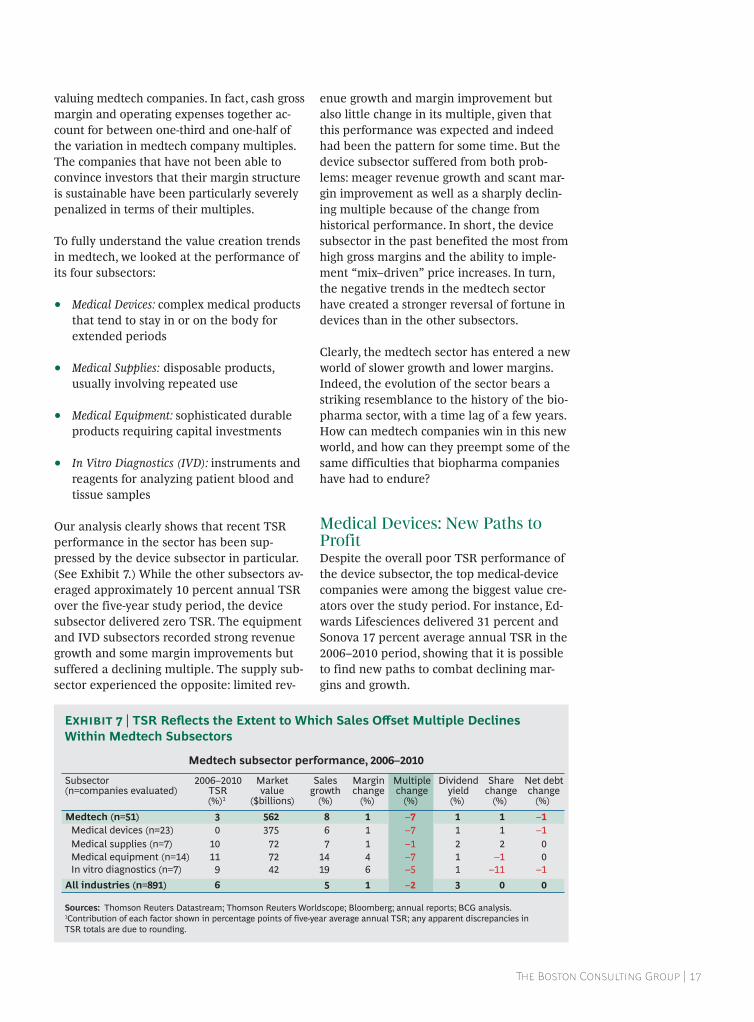
Our analysis clearly shows that recent TSR performance in the sector has been sup-pressed by the device subsector in particular. (See Exhibit 7.) While the other subsectors av-eraged approximately 10 percent annual TSR over the five-year study period, the device subsector delivered zero TSR. The equipment and IVD subsectors recorded strong revenue growth and some margin improvements but suffered a declining multiple. The supply sub-sector experienced the opposite: limited rev-
enue growth and margin improvement but also little change in its multiple, given that this performance was expected and indeed had been the pattern for some time. But the device subsector suffered from both prob-lems: meager revenue growth and scant mar-gin improvement as well as a sharply declin-ing multiple because of the change from historical performance. In short, the device subsector in the past benefited the most from high gross margins and the ability to imple-ment “mix–driven” price increases. In turn, the negative trends in the medtech sector have created a stronger reversal of fortune in devices than in the other subsectors.
Clearly, the medtech sector has entered a new world of slower growth and lower margins. Indeed, the evolution of the sector bears a striking resemblance to the history of the bio-pharma sector, with a time lag of a few years. How can medtech companies win in this new world, and how can they preempt some of the same difficulties that biopharma companies have had to endure?
Medical Devices: New Paths to ProfitDespite the overall poor TSR performance of the device subsector, the top medical-device companies were among the biggest value cre-ators over the study period. For instance, Ed-wards Lifesciences delivered 31 percent and Sonova 17 percent average annual TSR in the 2006–2010 period, showing that it is possible to find new paths to combat declining mar-gins and growth.
Medtech subsector performance, 2006–2010
Subsector(n=companies evaluated)
2006–2010TSR(%)1
Marketvalue
($billions)
Salesgrowth
(%)
Marginchange
(%)
Multiplechange
(%)
Dividendyield(%)
Sharechange
(%)
Net debtchange
(%) Medtech (n=51) 3 562 8 1 –7 1 1 –1
Medical devices (n=23) 0 375 6 1 –7 1 1 –1
Medical equipment (n=14) 11 72 14 4 –7 1 –1 0In vitro diagnostics (n=7) 9 42 19 6 –5 1 –11 –1
All industries (n=891) 6 5 1 –2 3 0 0
Medical supplies (n=7) 10 72 7 1 –1 2 2 0
Sources: Thomson Reuters Datastream; Thomson Reuters Worldscope; Bloomberg; annual reports; BCG analysis.1Contribution of each factor shown in percentage points of five-year average annual TSR; any apparent discrepancies in TSR totals are due to rounding.
E | TSR Refl ects the Extent to Which Sales Off set Multiple Declines Within Medtech Subsectors
| S S
For medical-device companies, four factors can improve TSR performance: rethinking the commercial model, refocusing the R&D engine, executing an emerging-markets strategy, and adopting a sound financial policy.
Rethinking the Commercial Model. Medical-device companies have historically relied on highly profi table Physician Preference Items (PPIs). More than any other subsector, the device subsector has benefi ted from the ability to generate growth and margin by delivering incremental innovations that physicians demand and whose cost payers and providers are willing to bear. The com-mercial model behind this was designed to be high-touch, deploying a large sales force focused on one-on-one selling to physicians. This approach resulted in high sales, general, and administrative expenses relative to other industries—twice those of high tech, for instance, and three times those of industrial goods.13
In some cases, device companies must devote substantially more attention to reaching payers.
Such a model is unsustainable in today’s changing environment. In the U.S., where the contrast between the past and the future is most stark, purchasing power is shifting from physicians to hospital administrators. Hospi-tals are becoming more sophisticated—set-ting price caps, courting physicians with gain-sharing approaches, and aligning the incentives of physician groups (which are in-creasingly owned by hospitals) with their own. U.S. hospitals are also merging: the rev-enue of the top ten hospital systems is now two-thirds greater than it was a decade ago. The result for device companies is a high-cost sales channel that is no longer optimally con-figured to drive the adoption of new products and acceptance of price increases.
Device companies must rethink their com-mercial model in three ways.
First, they must acknowledge and address the proliferation of purchase influencers. Calling on physicians and supporting them clinically is no longer enough. Companies must also reach other influencers, such as purchasing staff, senior administrators, value committees, chiefs of quality, nurses, and medical officers. And in some cases, device companies must devote substantially more attention to reach-ing payers.
Second, device companies must adjust their value propositions to address not only the needs of physicians but also the needs of pro-viders and payers. This requires a sharp focus on comparative quality and financial out-comes. With that in mind, some companies are looking beyond the product offerings them-selves and beginning to think in terms of the overall “solution,” including services that help deliver better or more cost-efficient results.
Third, device companies must address the cost of the current sales channel. Selling to physicians one-on-one and providing robust clinical support are expensive activities. The challenge in the short to medium term is for companies to add new call points within some hospitals to reflect the changing pur-chasing process while maintaining their high-touch physician model.
Refocusing the R&D Engine. In 2010, BCG surveyed 30 business units across 19 leading medtech companies to fi nd the steps to higher R&D productivity. (See Exhibit 8.) Our benchmarking eff ort showed that the win-ning business units—those that outperform the average in revenue growth, margin growth, and measures of productivity (pat-ents, new-product launches, and approvals per dollar spent)—are not increasing their R&D investments.
Instead, winning companies are taking a “high-science” approach to R&D. This means skewing resources to riskier, more innovative projects rather than smaller, incremental ones. Like high-performing biopharmas, these com-panies attract and retain the best talent, and they foster collaboration. Most important, they

T B C G |
have a higher tolerance for risk—and they ulti-mately claim a higher reward. This trend is particularly evident in the medical-device sub-sector. (See the sidebar below.)
Simply put, the bar has moved. The rewards for incremental innovation have evaporated. Device companies need fewer innovations, but with far higher impact to drive adoption and higher prices in the market.
Executing an Emerging-Markets Strategy. For device companies, creating an emerging-mar-kets strategy presents a conundrum. On the one hand, moving product development and manufacturing to lower-cost countries is a tempting option. On the other hand, doing so
poses the dangers of weak intellectual-proper-ty protection, loss of industrial know-how to future competitors, and potential quality slippage; all of these downsides can off set the cost-saving benefi ts. Yet given the rapid pace of demand growth in emerging markets, most device companies fear that they will miss the boat if they don’t invest heavily in a local commercial presence in those countries. At the same time, though, the dollar margins per unit are just a small fraction of what they are in the U.S., and in some countries the risks associated with the Foreign Corrupt Practices Act (FCPA) are still a daunting reality.
Regardless, device companies must tackle these issues today. A wave of product approv-
Investment in R&D
Utilize resources more efficiently to realize growth •Relatively equal spending (in percentage of revenue) •Slightly lower spending per full-time employee
Process, governance, and
organization platforms
Leverage stronger processes, governance, and organization platforms •More positive employee views and tighter alignment across tenures •Early and proactive engagement of regulatory issues •Stronger talent pool
Projectmetrics
Devote more resources to “innovative” products •Shi to bigger, riskier, longer projects to realize greater innovation versusquick, small, low-risk incremental designs •Approximately 25 percent higher average spending per project, with approximately 15 percent longer cycle times
External sourcingOpen to external innovation •More revenue derived from licensing and acquisitions • Increase in external sourcing
Emerging-markets activity
Focus emerging-market efforts commercially • Interviewees cite the need for a tight commercial/R&D interface • Interviewees anticipate spending more
Drivers of R&D performance
Sources: BCG industry interviews; BCG analysis.
E | “High-Science” Practices Drive Improved R&D Productivity in Medtech
In a subsector driven by incremental innovation, Edwards Lifesciences has introduced breakthrough products and become the undisputed leader in the heart valve market. When Edwards introduced its Sapien transcatheter aortic heart valve in Europe, in 2007, the company gained fi rst-to-market advantage in an area of unmet need and created a paradigm shi in the treatment of valvular heart disease. The valve targets high-risk patients—who
otherwise might not be able to undergo surgery—and improves outcomes, shortens hospital stays, and reduces recovery times.
From 2005 through 2010, Edwards’ revenue grew from $1 billion to $1.5 billion, and its operating margin improved from 18 percent to 20 percent. Edwards is now poised to take the lead in the U.S., where transcatheter valves are expected to become a $1 billion market.
EDWARDS LIFESCIENCESBreakthrough Innovation
| S S
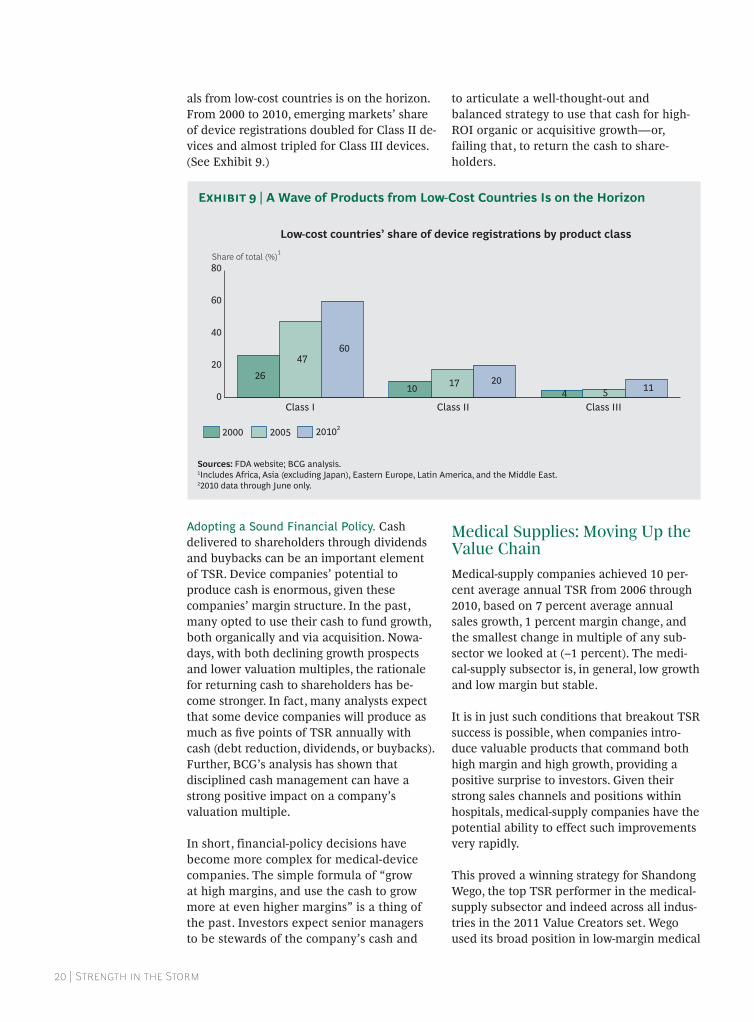
als from low-cost countries is on the horizon. From 2000 to 2010, emerging markets’ share of device registrations doubled for Class II de-vices and almost tripled for Class III devices. (See Exhibit 9.)
Adopting a Sound Financial Policy. Cash delivered to shareholders through dividends and buybacks can be an important element of TSR. Device companies’ potential to produce cash is enormous, given these companies’ margin structure. In the past, many opted to use their cash to fund growth, both organically and via acquisition. Nowa-days, with both declining growth prospects and lower valuation multiples, the rationale for returning cash to shareholders has be-come stronger. In fact, many analysts expect that some device companies will produce as much as fi ve points of TSR annually with cash (debt reduction, dividends, or buybacks). Further, BCG’s analysis has shown that disciplined cash management can have a strong positive impact on a company’s valuation multiple.
In short, financial-policy decisions have become more complex for medical-device companies. The simple formula of “grow at high margins, and use the cash to grow more at even higher margins” is a thing of the past. Investors expect senior managers to be stewards of the company’s cash and
to articulate a well-thought-out and balanced strategy to use that cash for high-ROI organic or acquisitive growth—or, failing that, to return the cash to share-holders.
Medical Supplies: Moving Up the Value ChainMedical-supply companies achieved 10 per-cent average annual TSR from 2006 through 2010, based on 7 percent average annual sales growth, 1 percent margin change, and the smallest change in multiple of any sub-sector we looked at (–1 percent). The medi-cal-supply subsector is, in general, low growth and low margin but stable.
It is in just such conditions that breakout TSR success is possible, when companies intro-duce valuable products that command both high margin and high growth, providing a positive surprise to investors. Given their strong sales channels and positions within hospitals, medical-supply companies have the potential ability to effect such improvements very rapidly.
This proved a winning strategy for Shandong Wego, the top TSR performer in the medical-supply subsector and indeed across all indus-tries in the 2011 Value Creators set. Wego used its broad position in low-margin medical
Share of total (%)1 80
60
40
20
0Class III
11 5 4 Class II
20 17 10
Class I
60 47
26
Low-cost countries’ share of device registrations by product class
201022005 2000
Sources: FDA website; BCG analysis. 1Includes Africa, Asia (excluding Japan), Eastern Europe, Latin America, and the Middle East. 22010 data through June only.
E | A Wave of Products from Low-Cost Countries Is on the Horizon

T B C G |
and surgical consumables to move into high-er-margin products such as prefilled syringes, tubing, and polyvinyl acetate products. In the process, Wego increased its sales of high-gross-margin products from less than 20 per-cent to 45 percent, and in the five years since 2004—when the company was first listed on the Hong Kong Stock Exchange—it increased its gross margin from 40 percent to nearly 55 percent.14
Medical Equipment: Pioneering the Next Growth Frontier The medical-equipment subsector includes a broad spectrum of companies: conglomerates such as GE Health, Siemens, and Philips that are major players in the diagnostic-imaging market and have major investments in emerging markets (especially China); more diversified players such as Johnson & John-son, Covidien, and Abbott; and pure-play companies that tend to specialize in a specific area and have a market capitalization in the $3 billion to $10 billion range.
Pure-play medical-equipment companies have performed well, with an average annual TSR of 11 percent over the 2006–2010 period. Solid sales growth (14 percent) and positive margin change (4 percent) helped to offset a negative multiple change (–7 percent). Meanwhile, margin accounted for about half of the varia-tion in the companies’ valuation multiples.
While the centralization of purchasing deci-sions presents challenges to medical-equip-ment companies, it also provides opportuni-ties. High-performing companies can leverage strong hospital relationships to expand into new, higher-margin complementary products and services. Elekta, for example, has generat-ed sizable sales by selling adjacent products, such as oncology management software, which improves treatment planning, work-flow, error rates, and efficiency—and appeals to value-conscious central purchasers. Compa-nies can also increase margins by providing services, which can be twice as profitable as equipment.
Intuitive Surgical’s five-year TSR is one of the highest in medtech, and the company achieved more than 40 percent average annual sales
growth from 2006 through 2010. Though a rela-tively new company with a narrow product line, Intuitive was able to succeed by developing a very compelling value proposition, a business model designed to fully capture the value creat-ed for buyers, and a selling model designed to support the business model. (See the sidebar “Intuitive Surgical: Engineering Growth.”)
In Vitro Diagnostics: Moving Out of the Lab to Capture Value Beginning in the mid-1990s, the IVD subsec-tor experienced a decade-long period of rev-olution. An emphasis on early testing, a much broader testing menu, greater test sen-sitivity and utility, expansion beyond diagno-sis (to, for example, therapy monitoring), and an aging population led to increased clinical utilization. At the same time, the industry in-troduced many equipment innovations to help labs drive down the cost per test and shorten turnaround times. The innovations included higher-volume instruments, multi-ple testing technologies on single instru-ments, automation of sample flow, and inte-grated electronic reporting. Select revolutionary technologies, such as molecu-lar testing and small-form-factor point-of-care devices, also began to create new pock-ets of high-margin growth.
The market share of the top five IVD players has grown because of consoli-dation of the largest seg-ments of the market.
The market has become more difficult in recent years, however. The market share of the top five players grew from about 50 per-cent in 2005 to more than 60 percent today, mostly because of consolidation of the larg-est segments of the market—the standard core-lab testing segments. For instance, Sie-mens acquired three such firms. The consoli-dation resulted in commoditization and pric-ing pressures: the top five companies all

| S S
offer relatively complete core-lab solutions, and labs now take bids from multiple com-panies.
As in our analysis of the medical-equipment subsector, many large companies (such as Roche, Siemens, Abbott, and Johnson & John-son) are not included in the Value Creators IVD calculations, because they are diversified across multiple health-care sectors. However, the pure-play companies included in the re-sults show that despite the commoditization in the core-lab segments, IVD offers strong opportunities for growth and value creation. During the 2006–2010 period, for example, Alere achieved 39 percent average annual sales growth through acquisitions that yield-ed an advantaged portfolio of products in the fast-growing point-of-care market.
To create value, IVD companies must do three things.
First, in their core-lab businesses, companies need to concentrate more on operational effi-ciency, improving cost structures in service
and manufacturing, and filling out testing menus more efficiently to maintain or in-crease cash gross margins.
Second, companies need to place careful R&D or M&A bets to reposition themselves in the higher-growth and higher-margin segments of the market. For example, in recent years, Ab-bott has moved aggressively to expand both its point-of-care and molecular-testing units (acquiring Ibis Biosciences in 2009, for in-stance), which now account for an increasing portion of its IVD business.
IVD companies need to move out of the lab and start addressing clinical demand.
Third, IVD companies need to move out of the lab and start addressing clinical demand,
In 2000, Intuitive Surgical introduced its da Vinci robot system, which radically changed the fi eld of minimally invasive surgical procedures such as prostatecto-mies and hysterectomies. The da Vinci robots provide better visualization and physician dexterity. Intuitive Surgical cites reduced complications and better patient outcomes as benefi ts.
Intuitive’s business model has several compelling aspects.
First is its convincing value proposition, evidenced by the da Vinci product’s rapid adoption; popularity among patients, surgeons, and hospitals; and fi nancial success. Hospitals are willing to pay $1 million to $2 million per robot because access to the system helps them attract high-volume, successful surgeons and compete with other institutions for the
growing number of patients who specifi -cally seek the da Vinci procedure.
Second, Intuitive has a comprehensive way of capturing the value that da Vinci creates for hospitals. Besides realizing about $1.6 million of revenue on average for each robot sold, the company earns nearly $140,000 in service revenue per year for each machine and more than $1,900 in instrument and accessory revenues for each procedure performed.
Third, Intuitive has an eff ective selling model. It uses clinical studies and a small sales force (75 representatives as of year-end 2010) to generate demand for new systems. The company also invests heavily in follow-up, using 465 support representa-tives to help customers use the system eff ectively.
INTUITIVE SURGICALEngineering Growth

T B C G |
communicating the value of their offerings to clinicians and other stakeholders in the health care system. Unlike medical-device companies, IVD companies have not tradi-tionally focused on the clinician or on the clinical or financial value of their products (outside of cost savings for the lab).
Genomic Health’s Oncotype Dx is an exam-ple of the potential value of diagnostic test-ing to the health care system: because Ge-nomic Health was able to show that its test reduces unnecessary and expensive chemo-therapy, the company earns more than $3,000 in revenue per test.
Another good example is that of Phadia. In November 2006, it was bought for $1.6 bil-lion by the private equity company Cinven, which subsequently sold it, in 2011, for $3.5 billion in cash. The secret behind this success
was a sales program designed to change clini-cal practices in the U.S. Phadia already had a high share of the IVD-testing-equipment vol-ume in the key large reference labs yet still managed to nearly double its U.S. revenues by changing its sales model. Over a three-year period, the company ramped up its U.S. sales force from 75 representatives to 185—most of whom call directly on physicians to change physician test-ordering patterns.
NOTES12. “Owning the Disease: A New Business Model for Medical Technology Companies,” In Vivo 29 (10), December 2011. 13. Indexed relative to cost of goods sold.14. Shandong Wego annual reports, 2004–2010; BCG analysis.

| S S
THE SEARCH FOR SUSTAINABLE GROWTH
O over the long term, strong TSR requires strong revenue
growth. (See Exhibit 2, page 7.) But while growth is a necessary condition, it is not suffi cient. It is all too easy to achieve growth in a value-destroying way, by overpaying for M&A or organically entering new areas where the return is below the cost of capital.
Growth in the core business is often the most successful strategy, but many biopharma and medtech companies are facing a shortage of opportunities for growth in the core. For these companies, growth beyond the core may be an option: expanding geographically, expand-ing the value of the offering, and (where ap-propriate) expanding into new businesses.
Expanding Geographically: Cap-turing Value in Emerging MarketsA two-speed world has emerged: in the next five years, mature markets will likely record slower growth of 2 to 3 percent per year, while the rapidly developing economies will record growth of 6 to 7 percent per year.15 A decade ago, the largest share of biopharma and medtech growth came from developed economies, particularly the U.S.; through 2015, up to 75 percent of growth will come from emerging markets. (See Exhibit 10.)
Clearly, emerging markets should be a central component of any global company’s growth
strategy. But these markets are also highly price constrained, and new approaches will be needed to succeed. Early-stage participa-tion, even if profitable, is no guarantee of winning the game. The trick is knowing what to do, and then doing it better and faster than the competition.
No single strategy fits every market. Different countries present different challenges: unfa-miliar regulatory hurdles, new competitors, demographic issues (socioeconomic and epi-demiological), and commercial challenges (such as how to enable the sales force to cover large areas). Each market has its own unique blend of channels, including over the counter, generics, tendering, government purchasing, private care, and hospital dispensaries. Com-panies need to tailor their business model to each market and even operate multiple mod-els within individual markets.
Companies that fail to adapt in this way will likely achieve less growth than they expect from emerging markets. Western business models will be less effective when attempted in a country characterized by smaller ac-counts, lower sales-rep productivity, less effi-cient logistics, and lower prices. One common failing is to overconcentrate on the main ur-ban areas at the expense of the lower demo-graphic tiers and secondary channels that characterize other parts of these emerging markets. For example, many multinationals

T B C G |
operating in China seek the bulk of their rev-enues from the country’s 30 largest cities, al-most as though they were unaware that more than 150 cities in China boast a population greater than 1 million. To build a serious, long-term presence in an emerging market, companies need to engage the next set of cit-ies. Only then can biotech and medtech com-panies hope to capture the full value of a mar-ket like China as the next billion customers work their way into the health care system.
In many emerging markets, companies will need to rely less on patent protection, scale, and marketing horsepower than they have in the developed markets. These familiar advan-tages, traditionally the source of differentia-tion for biopharma and medtech businesses in the West, may prove inadequate in some de-veloping economies, where the line between innovators and fast followers is often less dis-tinct and where cost-effectiveness is more crit-ical. To win in such markets, companies must develop new business models that allow them to keep in touch with physicians and influence preferences and prescribing behavior, but at a much lower cost than in the West. And the ap-proach cannot be one-size-fits-all; instead, it must be customized to each market.
In India, for example, this could mean having low-cost sales representatives make frequent calls to a physician-based market. In China, it could mean engaging groups of physicians through low-cost continuing medical educa-tion or reaching rural patients through mo-bile technology. In Russia, it could mean adopting two different approaches—one for wealthy consumers who pay out of pocket and another for patients dependent on state-funded health care.
Emerging markets are almost sure to be valu-able. But participation, even if profitable, is not the same as competitive leadership. The biggest rewards will go to those companies that devise and apply new business models that address multiple customer groups within each individual market.
Expanding Value: Embracing Value-Based Health Care Historically, patient outcomes have not shown a particularly close correlation with health care spending. This inefficiency is coming un-der intense pressure, given that health care spending is growing faster than GDP across the developed world.16
$billions
1,200
800
400
0
Establishedmarkets
Emergingmarkets1
2015E
1,065
Growthfrom
establishedmarkets
50
65%
2010
35% 856
Growthfrom
emergingmarkets1
159
75%
25%
~24%
Global biopharma sales, 2010–2015E
~76%$billions
1,200
800
400
0
Establishedmarkets
Emergingmarkets2
2015E
295
Growthfrom
establishedmarkets
25
70%
2010
30% 239 30
76%
24%
Global medtech sales, 2010–2015E
Growthfrom
emergingmarkets2
~45% ~55%
Sources: “The Global Use of Medicines: Outlook Through 2015,” IMS Health, May 2011; Espicom; BCG analysis.1.The emerging markets in the biopharma graph include tier 1 markets (China), tier 2 markets (Brazil, Russia, and India), tier 3 markets (Venezuela, Poland, Argentina, Turkey, Mexico, Vietnam, South Africa, Thailand, Indonesia, Romania, Egypt, Pakistan, and Ukraine), and the rest of world. 2The emerging markets in the medtech graph include all global markets exclusive of the U.S., Western Europe, and Japan.
E | Most Revenue Growth Over the Next Decade Will Come from Emerging Markets

| S S
Until recently, the problem was extremely dif-ficult to address, because assessing real-world patient outcomes objectively was not broadly possible. But things are changing, and fast. Data are becoming available to enable the as-sessment of outcomes and allow the optimi-zation of resource allocation. This approach is called value-based health care, and govern-ments and payers are increasingly gravitating toward it.
Many biopharma and medtech companies see this trend as yet another burden. But in truth, it also offers a tremendous opportunity for growth. Value-based health care opens the door to thinking about holistic solutions for patients. Companies that embrace this way of thinking and proactively expand the scope of their offerings for patient care have the po-tential to capture significant value.
One immediate way to embrace the value-based approach is to actively shape risk-shar-ing agreements (RSAs). Innovative drugs have unproven real-world outcomes, so payers are increasingly demanding RSAs, especially in higher-growth therapeutic areas such as oncol-ogy and immunology; RSAs are growing glob-
ally at 15 percent per year. (See Exhibit 11.) Being proactive when establishing an RSA can have benefits and confer a competitive advan-tage. For example, in 2009, Merck & Co. worked with Cigna to develop an RSA for Januvia and Janumet. The RSA established a program in which Merck offered a price dis-count in exchange for patient compliance, which contributes to better blood-sugar con-trol. The results were a win-win-win: Merck, Cigna, and, most important, patients all bene-fited. The 165,000 patients enrolled in the pro-gram achieved a significant 87 percent rate of compliance and better control on average (5 percent higher than unenrolled patients).17
Another strategy for success in value-based health care is to build relationships with pay-ers and providers in order to learn more about real-world outcomes. AstraZeneca, for exam-ple, is collaborating with WellPoint and with hospital chains to collect millions of lines of patient data in order to gain a better under-standing of clinical practice and use that knowledge to revise its product offerings to op-timize outcomes. Such enhanced understand-ing can lead to improvements in areas such as targeted medicine (by showing companies
Myfortic
MabThera
Champix
Tarceva
Iressa
Sutent
Zyprexa
Vectibix
Setting price to match current standards of care
Price increase based on index, or no increase
Price changes based on volume
Different price for drug by indication
Different price for drug by severity of disease
Single payment for access to product for a population
Limiting number of doses per patient
Limiting number of prescriptions per patient
Fixed price
Price-volumeagreement
Price bydiagnosis
Dose and quantitylimits
Examples
UK
UK
UK
AU
US
Capitation
Price reviewed periodically for cost-effectiveness
Payer rebates based on clinical outcomes
Patient refund based on clinical outcomes No cure, no pay
Initial free product, then reimbursed if efficacy shown
Reimbursement in a randomized controlled trial to gather additional evidence on the use of the product in a defined population
Reimbursement to patients involved in research,survey, or registry in sample
Multiple sclerosis drugs
SW
UK
IT
GE
UK
Pricing review
Try before youbuy
Coverage withstudy
participation (CSP) Coverage with
appropriatenessdetermination
(CAD)
Risk-sharingagreements
Perfor-mance
Evidencedevelop-
ment
Outcome-based
Financial-based
Tyverb
Sources: HIS; J.J. Carlson, et al., “Linking Payment to Health Outcomes: A Taxonomy and Examination of Performance-Based Reimbursement Schemes Between Healthcare Payers and Manufacturers,” Health Policy 96(3), 2010; National Institute for Health and Clinical Excellence; press releases; BCG analysis.
E | Payers Are Making Companies Accountable for Cost and Quality
T B C G |
where the highest unmet need is or which populations have the best results), clinical trial design (by proving superiority in a clinical-practice setting), and effectiveness (by suggest-ing where companies can sell additional ser-vices to enhance compliance and patient care). Eventually, biopharma and medtech compa-nies may even sell “guaranteed outcomes,” providing a customized solution underpinned by sound knowledge of the variables that af-fect real-world results and of how to influence those variables to secure superior outcomes.
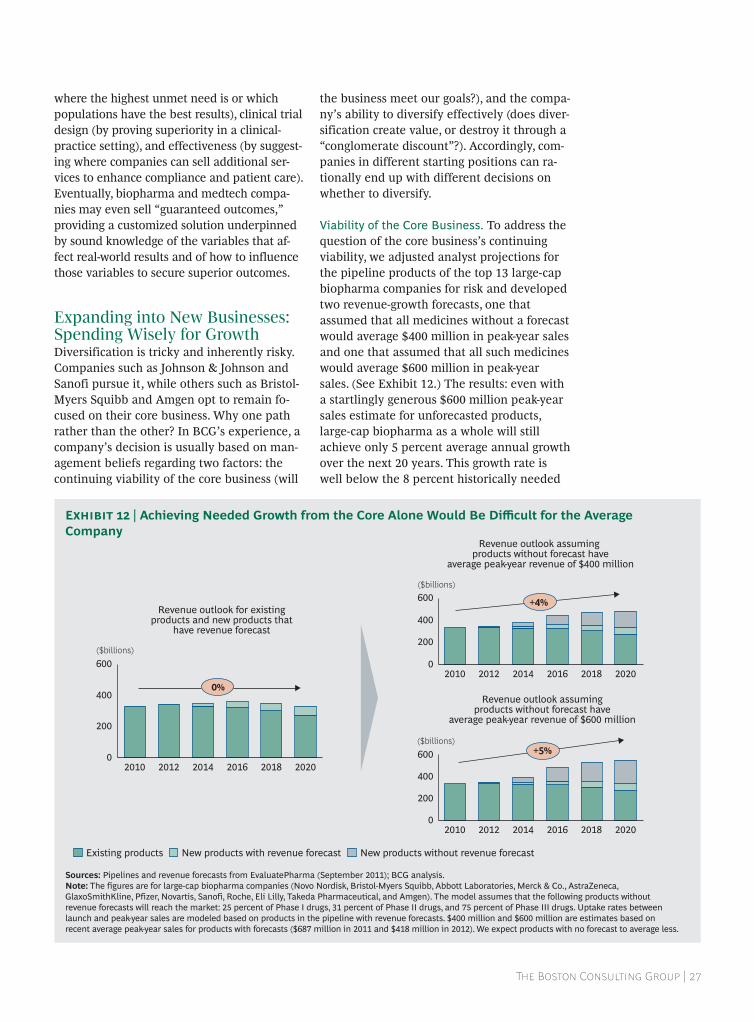
Expanding into New Businesses: Spending Wisely for GrowthDiversification is tricky and inherently risky. Companies such as Johnson & Johnson and Sanofi pursue it, while others such as Bristol-Myers Squibb and Amgen opt to remain fo-cused on their core business. Why one path rather than the other? In BCG’s experience, a company’s decision is usually based on man-agement beliefs regarding two factors: the continuing viability of the core business (will
the business meet our goals?), and the compa-ny’s ability to diversify effectively (does diver-sification create value, or destroy it through a “conglomerate discount”?). Accordingly, com-panies in different starting positions can ra-tionally end up with different decisions on whether to diversify.
Viability of the Core Business. To address the question of the core business’s continuing viability, we adjusted analyst projections for the pipeline products of the top 13 large-cap biopharma companies for risk and developed two revenue-growth forecasts, one that assumed that all medicines without a forecast would average $400 million in peak-year sales and one that assumed that all such medicines would average $600 million in peak-year sales. (See Exhibit 12.) The results: even with a startlingly generous $600 million peak-year sales estimate for unforecasted products, large-cap biopharma as a whole will still achieve only 5 percent average annual growth over the next 20 years. This growth rate is well below the 8 percent historically needed
Revenue outlook for existingproducts and new products that
have revenue forecast
Revenue outlook assuming products without forecast have
average peak-year revenue of $400 million
($billions) 600
400
200
0 2010
0%
2020 2018 2016 2014 2012
($billions) 600
400
200
0 2010
+5%
2020 2018 2016 2014 2012
($billions) 600
400
200
0 2010
+4%
2020 2018 2016 2014 2012
New products without revenue forecast Existing products New products with revenue forecast
Revenue outlook assumingproducts without forecast have
average peak-year revenue of $600 million
Sources: Pipelines and revenue forecasts from EvaluatePharma (September 2011); BCG analysis.Note: The figures are for large-cap biopharma companies (Novo Nordisk, Bristol-Myers Squibb, Abbott Laboratories, Merck & Co., AstraZeneca, GlaxoSmithKline, Pfizer, Novartis, Sanofi, Roche, Eli Lilly, Takeda Pharmaceutical, and Amgen). The model assumes that the following products without revenue forecasts will reach the market: 25 percent of Phase I drugs, 31 percent of Phase II drugs, and 75 percent of Phase III drugs. Uptake rates between launch and peak-year sales are modeled based on products in the pipeline with revenue forecasts. $400 million and $600 million are estimates based on recent average peak-year sales for products with forecasts ($687 million in 2011 and $418 million in 2012). We expect products with no forecast to average less.
E | Achieving Needed Growth from the Core Alone Would Be Diffi cult for the Average Company

| S S
to provide solid, long-term TSR. So achieving the necessary growth from the core business alone seems impossible for the average company. That said, individual companies may of course fi nd themselves in a much better position than the average.
No systematic, empirical evidence shows that diversification either cre-ates value or destroys it.
Ability to Diversify Eff ectively. How do compa-nies create value through diversifi cation? We reviewed the actions of large biopharma companies over the period 2001 to 2011 and found a surprising result: no systematic, empirical evidence shows that diversifi cation either creates value or destroys it.
During some time periods, the large-cap bio-pharma companies that undertook significant diversification did seem to outperform their peers with regard to TSR; however, during
other periods, the reverse was true. And in the case of companies without a previous his-tory of diversification, most such moves seemed to be penalized by the market and thus resulted in the destruction rather than the creation of value.
In sum, diversification can make sense, but not always. For a company that lacks suffi-cient growth from the core and that has pre-viously diversified to good effect, diversifica-tion may well be the right strategy.
NOTES15. Euromonitor International from International Monetary Fund (IMF), International Financial Statistics and World Economic Outlook/UN/national statistics.16. This section draws heavily on our publications “Improving Health Care Value: The Case for Disease Registries,” BCG Focus, December 2011, and “From Concept to Reality: Putting Value-Based Health Care into Practice in Sweden,” BCG White Paper, November 2010.17. Craig A. Hunter, et al., “A Literature Review of Risk-sharing Agreements,” Journal of the Korean Academy of Managed Care Pharmacy, 2(1), 2010; IHS; Evaluate-Pharma; Steve Davolt, “CIGNA-Merck Outcomes Contract Hailed as ‘First Step,’ but Some Want More Data,” AISHealth, December 17, 2010; BCG analysis.
T B C G |
FIVE QUESTIONS THAT EVERY CEO SHOULD
ADDRESS
I , five questions about value creation that every CEO
should know how to answer and that will help guide strategy in the challenging new environment.
Do you know your TSR aspiration, and 1. whether the current plan will achieve it? You should have a goal that is suffi cient to meet or exceed the expectations of investors. And management and the board should align on the target. Once the goal is clear, the current plan should be analyzed to determine the likelihood that it will achieve that goal. A gap is a call to action.
Do you understand what drives the valua-2. tion multiple for your company, and how to maximize the impact of each of the drivers discussed in this report? For large-cap biopharma, the best strategy is to protect revenue through proactive life-cycle management, to reinvigorate R&D by improving scientific acumen and removing barriers to good decision-making, to continue to improve the cost base, to optimize financial policy, and to seek new growth opportunities. For emerging biopharma companies, the best strategy is to show evidence of a sustain-able innovation model while maintaining high margins. For generics companies, the best strategy is to build scale while
preserving a stable financial position and finding the next source of growth. For medtech, the best strategy is to achieve strong pricing through differentiated products and to maximize the efficiency of operations.
What strategies will you use to achieve long-3. term profi table growth, the key driver of TSR? Strategies such as diversifi cation, M&A, more-productive R&D, and higher sales penetration can boost revenue growth over a range of time horizons. You need to assess the tradeoff s involved in pursuing each of these strategies. And as the world evolves toward value-based health care, the time is right to consider how to position your company’s off ering to take advantage of this long-term trend for sustainable sales growth.
How do your fi nancial policies aff ect your 4. valuation multiple, TSR, target investors, and strategy choices? Policies such as debt-to-capital ratio and dividend payout have implications for strategy and inves-tors. Segmenting the investors that own your stocks can provide insights into what investors value. And in markets where growth is slowing, companies should also consider debt reduction, share buybacks, and dividend payouts; these are better strategies than overpaying for growth.

| S S
For all of the above, do the management 5. team and the board share the same beliefs? The companies that are successful value creators have an eff ective strategy that pulls the right levers. If there is no clear agreement within and among your
management team and your board on your goal and the means to achieve it, getting that alignment should be a top priority. Doing so is a key enabler to navigating today’s stormy environment.

T B C G |
APPENDIX
Selection of the Value Creators Company SetTo create our Value Creators company set, we included all companies that were publicly list-ed for all five years of our study period (2006 through 2010), with at least 25 percent of their shares publicly traded. However, we set
a minimum market-capitalization floor for each sector ($5 billion for biopharma compa-nies and $1.2 billion for medtech companies). (See Exhibit 1.) We excluded health care IT and conglomerate companies that may partic-ipate in the biopharma and medtech sectors of the health care industry but whose TSR is
Abbott LaboratoriesActelion PharmaceuticalsAllerganAmgenAspen PharmacareAstellas PharmaAstraZenecaBiogen IdecBristol-Myers SquibbCelgeneChugai PharmaceuticalCiplaCSL Daiichi SankyoDr. Reddy’s LaboratoriesEisaiEli LillyForest LaboratoriesGilead SciencesGlaxoSmithKlineHospiraKyowa Hakko Kirin
Life TechnologiesMerck & Co.Merck KGaAMitsubishi Tanabe PharmaMylanNovartisNovo NordiskOno PharmaceuticalPerrigoPfizerRanbaxy LaboratoriesRoche HoldingSanofiShionogiSun Pharmaceutical IndustriesTaisho PharmaceuticalTakeda PharmaceuticalTeva Pharmaceutical IndustriesUCBValeant Pharmaceuticals InternationalWatson Pharmaceuticals
AlereBaxter InternationalBeckman CoulterBecton, Dickinson and CompanybioMérieuxBio-Rad LaboratoriesBoston ScientificBrukerC. R. BardCarl Zeiss MeditecCochlearColoplastCooper CompaniesDentsply InternationalDraegerwerkEdwards LifesciencesElektaEssilor InternationalFisher & Paykel HealthcareFreseniusGetingeGN Store NordHaemoneticsHill-Rom HoldingsHologicImmucor
Intuitive SurgicalJohnson & JohnsonKinetic ConceptsMedtronicNiproNobel Biocare HoldingOlympusPaul HartmannResMedShandong WegoSirona Dental SystemsSmith & NephewSonova HoldingSt. Jude MedicalSterisStraumann HoldingStrykerSynthes HoldingSysmexTerumo MedicalThermo Fisher ScientificThoratecVarian Medical SystemsWatersZimmer
43 biopharmaceutical companieswith market valuation greater than $5 billion
51 medical technology companieswith market valuation greater than $1.2 billion
Source: The 2011 Value Creators Report: Risky Business, BCG report, September 2011.Note: Illumina, Alexion, Dendreon, Vertex, and Shire were not included in the analysis because negative EBITDA in 2005 meant we were unable to calculate multiple or TSR decomposition; Genzyme was not included owing to its acquisition by Sanofi.
E | Ninety-Four Biopharma and Medtech Companies Were Included in the Value Creators Report

| S S
TSR Decomposition1
# Company LocationTSR2 (%)
Market value3
($billions)
Sales Growth
(%)
Margin change
(%)
Multiple change4
(%)
Dividend yield(%)
Share change5
(%)
Net debt change
(%)
2011TSR6
(%)
1 Perrigo United States 34.5 5.8 17 18 –6 1 0 4 43
2 Sun Pharmaceutical Industries India 31.8 11.1 27 0 5 1 –2 1 5
3 Novo Nordisk Denmark 30.9 66.9 12 4 8 2 3 0 –7
4 Dr. Reddy’s Laboratories India 28.5 6.2 31 21 –21 1 –2 –2 1
5 Aspen Pharmacare South Africa 24.0 5.8 29 7 –10 1 –2 –1 5 6 CSL Australia 22.6 21.3 11 13 –6 2 1 1 –19 7 Actelion Pharmaceuticals Switzerland 18.8 7.2 23 2 –7 0 –1 2 –35 8 Cipla India 16.7 6.6 20 0 13 1 –18 1 –20 9 Celgene United States 12.8 27.8 47 17 –45 0 –6 0 10 10 Ranbaxy Laboratories India 11.7 5.6 11 29 –29 1 –2 2 –16
Sources: Thomson Reuters Datastream; Thomson Reuters Worldscope; Bloomberg; annual reports; BCG analysis.Note: This exhibit lists the top ten out of 43 global companies with a market valuation greater than $5 billion.1Contribution of each factor shown in percentage points of five-year average annual TSR; any apparent discrepancies in TSR totals are due to rounding.2Average annual total shareholder return, 2006–2010.3As of December 31, 2010.4Change in EBITDA multiple.5“Share change” refers to the change in the number of shares outstanding, not to the change in stock price.6As of October 31, 2011.
E | The Biopharmaceuticals Top Ten, 2006–2010
2.6
1.1
2.0
1.2 1.2
1.5
0.7
2.3
1.7
1.1
1.6
1.2
’05 ’06 ’07 ’08 ’09 ’10’05 ’06 ’07 ’08 ’09 ’10’05 ’06 ’07 ’08 ’09 ’10
’05 ’06 ’07 ’08 ’09 ’10 ’05 ’06 ’07 ’08 ’09 ’10Salesgrowth
Marginchange
Multiplechange
Dividendyield
00
10
20
30
300
0
200
100
40
20
30
0
10
1
2
3
–10
–5
20
10
15
0
5
0
100
200
300
103
205
103 93
172
289
107
185
110
151
109 125
120
220
150
195
118
162 144
135
32.3
23.1 27.2
32.2
29.6
33.5 33.0
22.8
34.8 32.5
31.6 27.3
13.7
22.2
17.2 18.9 16.1
12.3 12.3
15.7
8.7 8.0 8.5 10.7
2 1
–8
–3
0
8 8
17
ƒ
Total sample, n = 43Pharmaceuticals top ten
Total shareholder return
Simplified five-year TSR decomposition2
Sales growth1
EBITDA multiple1 Dividend yield3
EBITDA margin1
TSR index (2005 = 100) Sales index (2005 = 100) EBITDA/revenue (%)
TSR contribution (%) Enterprise value/EBITDA (x) Dividend/stock price (%)
Sources: Thomson Reuters Datastream; Thomson Reuters Worldscope; Bloomberg; annual reports; BCG analysis.1Industry calculation based on aggregate of entire sample.2Share change and net debt change not shown.3Industry calculation based on sample average.
Value Creation at the Biopharmaceuticals Top Ten Versus Industry Sample, 2006–2010

T B C G |
TSR Decomposition1
# Company LocationTSR2 (%)
Market value3
($billions)
Sales Growth
(%)
Margin change
(%)
Multiple change4
(%)
Dividend yield(%)
Share change5
(%)
Net debt change
(%)
2011TSR6
(%)
1 Shandong Wego China 93.2 6.1 34 10 45 2 –2 4 –25 2 Edwards Lifesciences United States 31.1 9.3 8 0 20 0 1 2 –7 3 Bruker United States 27.7 2.7 29 15 –3 0 –9 –4 –13 4 Elekta Sweden 18.3 3.9 19 8 –10 2 0 0 3 5 Sonova Holding Switzerland 17.3 9.3 18 7 –8 1 0 –1 –21 6 Intuitive Surgical United States 17.0 10.0 44 7 –34 0 –1 1 68 7 Coloplast Denmark 15.8 6.6 9 5 –1 2 1 0 4 8 Waters United States 15.3 7.1 7 2 1 0 3 2 3 9 Cochlear Australia 14.6 4.8 15 1 –3 3 –1 0 –25 10 Fresenius Germany 13.6 14.9 15 4 –4 1 –1 –1 14
Sources: Thomson Reuters Datastream; Thomson Reuters Worldscope; Bloomberg; annual reports; BCG analysis.Note: This exhibit lists the top ten out of 51 global companies with a market valuation greater than $1.2 billion.1Contribution of each factor shown in percentage points of five-year average annual TSR; any apparent discrepancies in TSR totals are due to rounding.2Average annual total shareholder return, 2006–2010.3As of December 31, 2010.4Change in EBITDA multiple.5“Share change” refers to the change in the number of shares outstanding, not to the change in share price.6As of October 31, 2011.
E | The Medical Technology Top Ten, 2006–2010
9.5
11.7 12.0
10.0
9.4
9.0
14.3 13.8
12.7
13.0
13.0 12.8
’05 ’06 ’07 ’08 ’09 ’10’05 ’06 ’07 ’08 ’09 ’10’05 ’06 ’07 ’08 ’09 ’10
’05 ’06 ’07 ’08 ’09 ’10 ’05 ’06 ’07 ’08 ’09 ’10Salesgrowth
Marginchange
Multiplechange
Dividendyield
0.00
5
10
15
20
300
0
200
100
30
20
10
0
0.5
1.0
1.5
2.0
–10
–5
15
5
10
0
0
100
200
300
110
134
116
239
113
187
90
109
120
189 204
141
180
140
160
148 113
129
146 131
26.5
20.9
26.6 25.4
20.5
25.1
22.1 20.2
25.3
19.0 18.5
24.9
1.6
1.6
0.7 1.1
0.6
1.0
1.1
0.8
1.1
1.1
1.6
0.8 1 1
–7
–2
1
4
8
15
ƒ
Total sample, n = 51Medical technology top ten
Total shareholder return
Simplified five-year TSR decomposition2
Sales growth1
EBITDA multiple1 Dividend yield3
EBITDA margin1
TSR index (2005 = 100) Sales index (2005 = 100) EBITDA/revenue (%)
TSR contribution (%) Enterprise value/EBITDA (x) Dividend/stock price (%)
Sources: Thomson Reuters Datastream; Thomson Reuters Worldscope; Bloomberg; annual reports; BCG analysis.1Industry calculation based on aggregate of entire sample.2Share change and net debt change not shown.3Industry calculation based on sample average.
Value Creation at the Medical Technology Top Ten Versus Industry Sample, 2006–2010
| S S
a function of performance in multiple indus-tries. These companies are covered in our overall 2011 Value Creators report, Risky Busi-ness: Value Creation in a Volatile Economy. Some companies participate in both the bio-pharma and medtech sectors; we assigned such companies to the sector that generates the majority of their revenues.
The 2011 Value Creators RankingsThe rankings track performance from 2006 through 2010. (See Exhibits 2 and 3.) In addi-tion, we break down TSR into its component parts to show their relative contribution to stock returns and to assess how a company is creating value. (See the sidebar “Total Share-holder Return and the Smart-Multiple Meth-odology,” on page 6.)
In 2011, the average performance of the bio-pharma and medtech sectors was essentially unchanged from the 2006–2010 average, though some of the most innovation-driven subsectors—large-cap biopharma and medi-cal devices—recovered some value. Of course, considerable variation existed at the individu-al company level, with some companies expe-riencing significant reversals of fortune (for both better and worse) and others staying flat.

T B C G |
The Boston Consulting Group publish-es many reports and articles on health care and value creation that may be of interest to senior executives. Exam-ples include:
Improving Health Care Value: The Case for Disease RegistriesA Focus by The Boston Consulting Group, December 2011
Biopharma R&D in China: Making Bets Pay Off A Focus by The Boston Consulting Group, November 2011
Changing the Innovation Equation in India: Delivering Aff ordable Innovation Through Global PartnershipsAn article by The Boston Consulting Group, October 2011
Pharma FuturesAn article by The Boston Consulting Group in Pharmaceutical Executive, October 2011
Can R&D Be Fixed? Lessons from Biopharma OutliersA Focus by The Boston Consulting Group, September 2011
Risky Business: Value Creation in a Volatile EconomyThe 2011 BCG Value Creators Report, September 2011
Riding the Next Wave in M&A: Where Are the Opportunities to Create Value?A report by The Boston Consulting Group, June 2011
All That Cash: The BCG 2011 Investor SurveyAn article by The Boston Consulting Group, May 2011
The Art of PlanningA Focus by The Boston Consulting Group, April 2011
Competitiveness & Regulation: The FDA and the Future of America’s Biomedical Industry A report coauthored by The Boston Consulting Group and the California Healthcare Institute, March 2011
Driving Medtech Innovation in Turbulent Times: High Science 2010 An article by The Boston Consulting Group in In Vivo, December 2010
FOR FURTHER READING

| S S
About the AuthorsMichael Ringel is a partner and man-aging director in the Boston offi ce of The Boston Consulting Group. Colm Foley is a partner and managing di-rector in the fi rm’s Chicago offi ce. Olivier Wierzba is a partner and managing director in BCG’s Paris offi ce.
AcknowledgmentsThis report was sponsored by BCG’s Health Care practice.
The authors would like to acknowledge the Corporate Development practice and in particular Frank Plaschke, a partner and managing director in BCG’s Munich offi ce; Daniel Stelter, a senior partner and managing director in the fi rm’s Berlin offi ce; and Dirk Schilder, an analyst in BCG’s Munich offi ce, for their contributions.
The authors also acknowledge the con-tributions of Brett Schiedermayer, Joe Brilando, and Bridget Moede from the
BCG ValueScience Center in South San Francisco, California, a research center that develops leading-edge val-uation tools and techniques for M&A and corporate-strategy applications.
The authors would like to thank the project team of Anne Hoang, Michael DiMicco, Jake Segal, Jeanine Murphy, and Luca Gatti, as well as our Health Care colleagues Christoph Schweizer, Mark Lubkeman, Peter Tollman, Ste-fan Larsson, Ulrik Schulze, John Wong, Rachel Lee, Charles-André Brouwers, Paul Gordon, Peter Lawyer, Christophe Durand, Simon Goodall, Peter Golds-brough, Priya Chandran, Axel Heine-mann, and Sarwar Islam for their in-sights. The authors also acknowledge Martha Craumer for her contributions to the writing and editing of this re-port, as well as Katherine Andrews, Gary Callahan, Catherine Cuddihee, Angela DiBattista, Kirsten Leshko, and Kathryn Sasser for their contri-butions to its editing, design, and production.
For Further ContactFor further information about the re-port or to learn more about BCG’s ca-pabilities in health care and value management, you may contact one of the authors.
Michael RingelPartner and Managing DirectorBCG Boston+1 617 973 1200 [email protected]
Colm FoleyPartner and Managing DirectorBCG Chicago+1 312 993 [email protected]
Olivier WierzbaPartner and Managing DirectorBCG Paris+33 1 40 17 10 [email protected]
NOTE TO THE READER

T B C G |
© The Boston Consulting Group, Inc. 2011. All rights reserved.
For information or permission to reprint, please contact BCG at:E-mail: [email protected]: +1 617 850 3901, attention BCG/PermissionsMail: BCG/Permissions The Boston Consulting Group, Inc. One Beacon Street Boston, MA 02108 USA
To fi nd the latest BCG content and register to receive e-alerts on this topic or others, please visit bcgperspectives.com.
Follow bcg.perspectives on Facebook and Twitter.
12/11

Abu DhabiAmsterdamAthensAtlantaAucklandBangkokBarcelonaBeijingBerlinBostonBrusselsBudapestBuenos AiresCanberraCasablancaChicago
CologneCopenhagenDallasDetroitDubaiDüsseldorfFrankfurtGenevaHamburgHelsinkiHong KongHoustonIstanbulJakartaJohannesburgKiev
Kuala LumpurLisbonLondonLos AngelesMadridMelbourneMexico CityMiamiMilanMinneapolisMonterreyMoscowMumbaiMunichNagoyaNew Delhi
New JerseyNew YorkOsloParisPerthPhiladelphiaPragueRio de JaneiroRomeSan FranciscoSantiagoSão PauloSeoulShanghaiSingaporeStockholm
StuttgartSydneyTaipeiTel AvivTokyoTorontoViennaWarsawWashingtonZurich
bcg.com