Embed Size (px)
Citation preview
TEMPERATURE/PRECIPITATION OUTLOOK
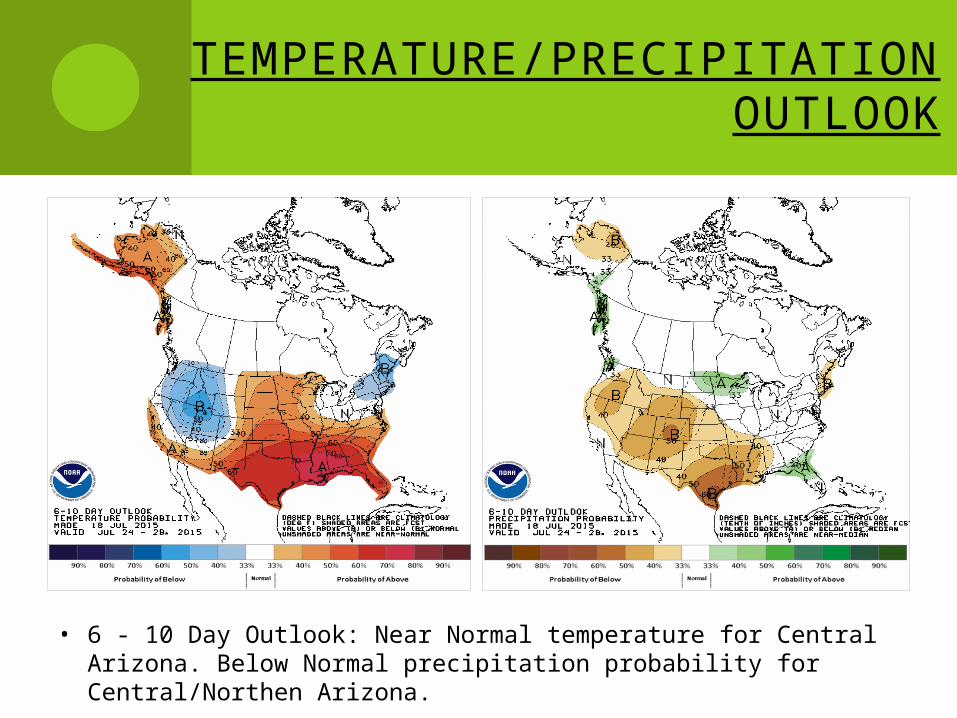
• 6 - 10 Day Outlook: Near Normal temperature for Central Arizona. Below Normal precipitation probability for Central/Northen Arizona.
TEMPERATURE/PRECIPITATION - 2015
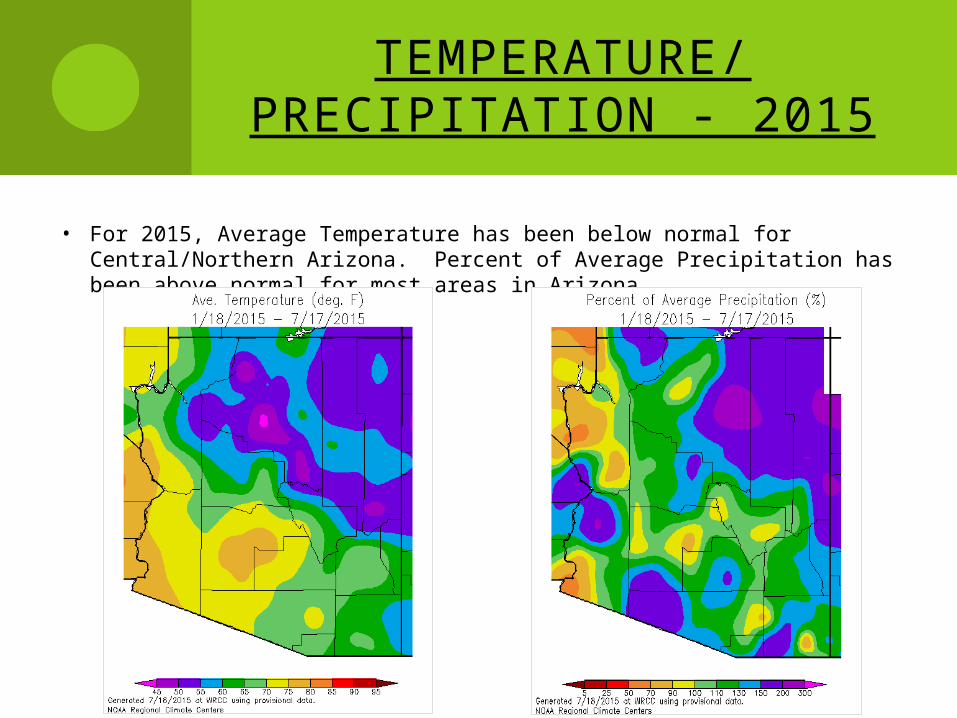
• For 2015, Average Temperature has been below normal for Central/Northern Arizona. Percent of Average Precipitation has been above normal for most areas in Arizona.
DROUGHT
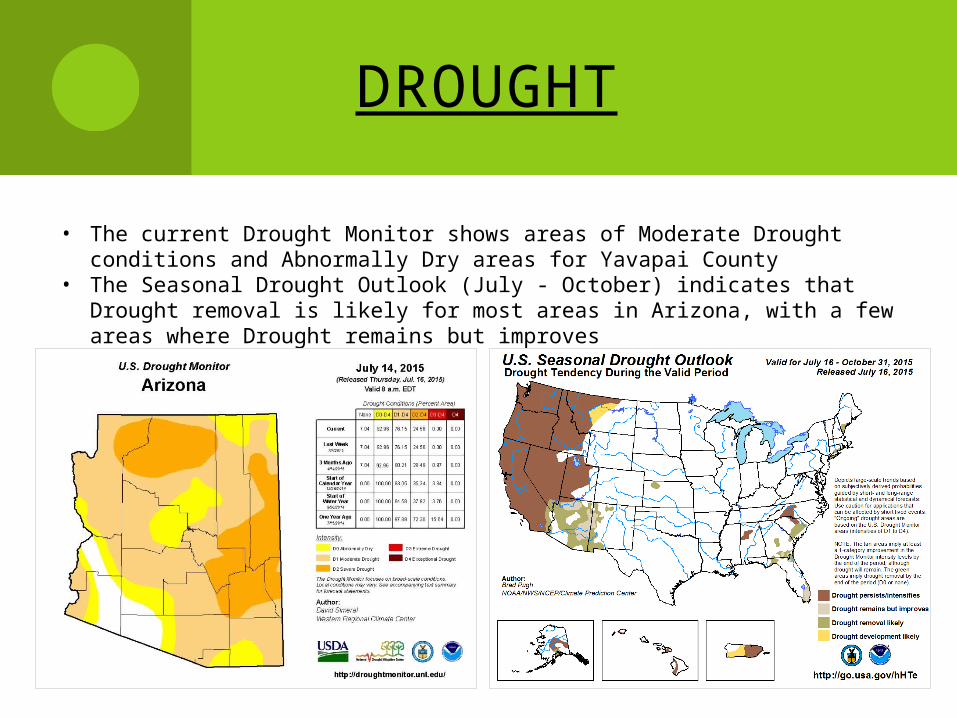
• The current Drought Monitor shows areas of Moderate Drought conditions and Abnormally Dry areas for Yavapai County
• The Seasonal Drought Outlook (July - October) indicates that Drought removal is likely for most areas in Arizona, with a few areas where Drought remains but improves
DEAD FUEL MOISTURE
Dead Fuel Moisture is the moisture content of dead organic fuels that is controlled entirely by exposure to environmental conditions. There are four fuel classes modeled within NFDRS.• 1-Hour Fuel Moisture - Dead fuels less than ¼” in diameter. Very responsive to
current conditions (temperature, humidity, precipitation). Value range: 1 - 80%• 10-Hour Fuel Moisture - Dead fuels ranging from ¼” to 1” in diameter. Responsive to
daily changes in weather. Value range: 1 - 60%• 100-Hour Fuel Moisture - Dead fuels ranging from 1” to 3” in diameter. As opposed to
1 & 10-Hour, these fuels are impacted by 24-hour trends (Max/Min Temp, Max/Min RH, precipitation duration). Value range: 1 - 50%
• 1000-Hour Fuel Moisture - Dead fuels ranging from 3” to 8” in diameter. Value is based on running 7-day average. Impacted by 24-hour Max/Min Temp, Max/Min RH and precipitation duration values for a 7-day period. Value range: 1 - 40%
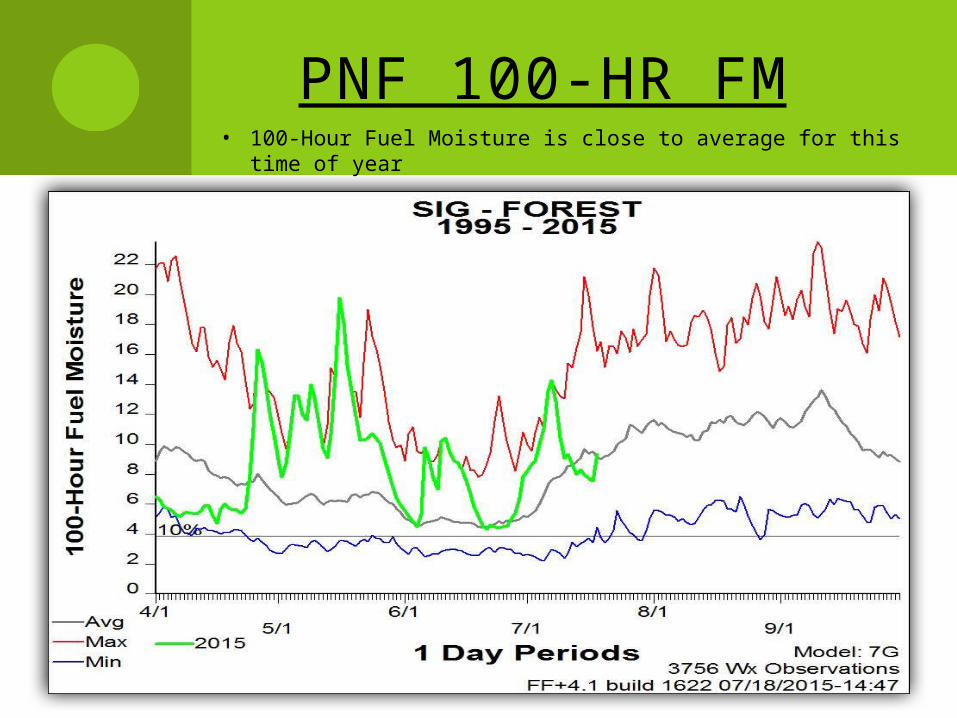
PNF 100-HR FM• 100-Hour Fuel Moisture is close to average for this time of year
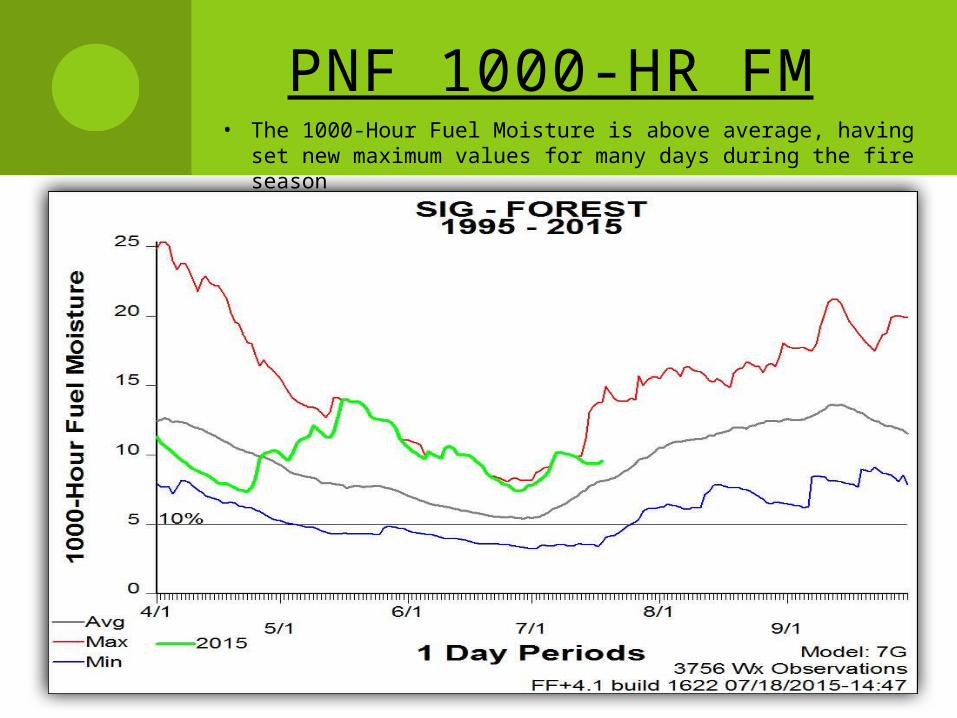
PNF 1000-HR FM• The 1000-Hour Fuel Moisture is above average, having set new maximum
values for many days during the fire season
ENERGY RELEASE COMPONENT
The Energy Release Component is a number related to the available energy within the flaming front at the head of a fire. Daily variations in ERC are due to changes in the moisture content of the fuels present, both live and dead. As live fuels cure and larger dead fuels dry, ERC values get higher.
The 1000-hr Fuel Moisture is one of the primary inputs into the ERC calculation and as such, 24-hour Max/Min Temperature, Max/Min RH and Precipitation Duration all affect the calculation. Since wind and fine fuel moisture do not affect the ERC calculation, the daily variation is relatively small.
The ERC scale is open-ended or unlimited and is heavily dependent on the fuel model that is being used. Historically on the Prescott NF, the highest ERC values in the G fuel model have been around 110, while the highest ERC values in the B fuel model have been around 150.
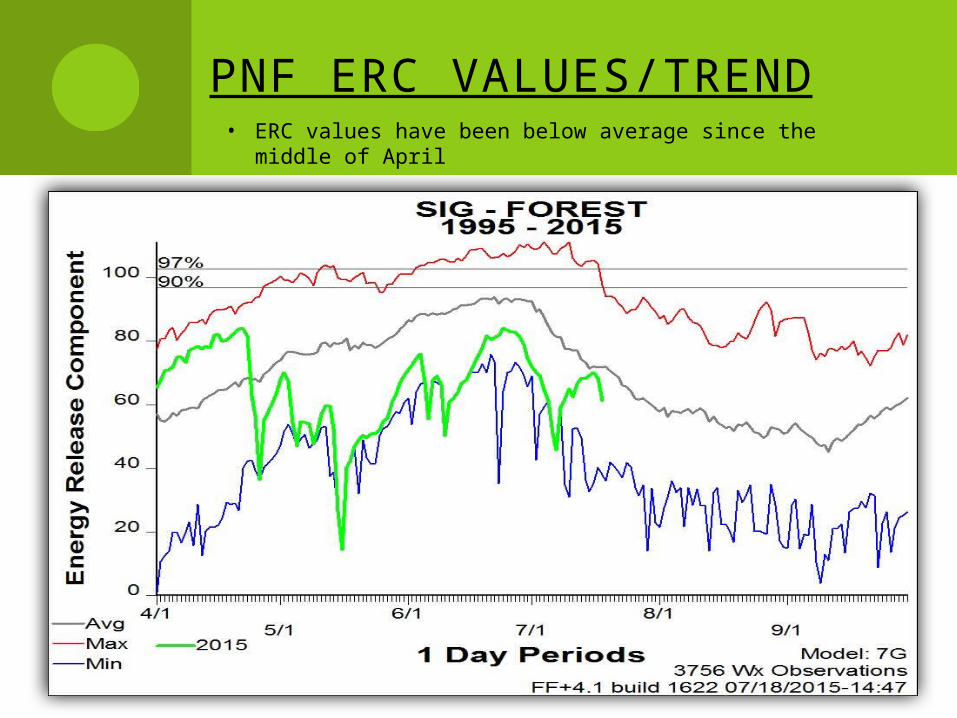
PNF ERC VALUES/TREND• ERC values have been below average since the middle of April
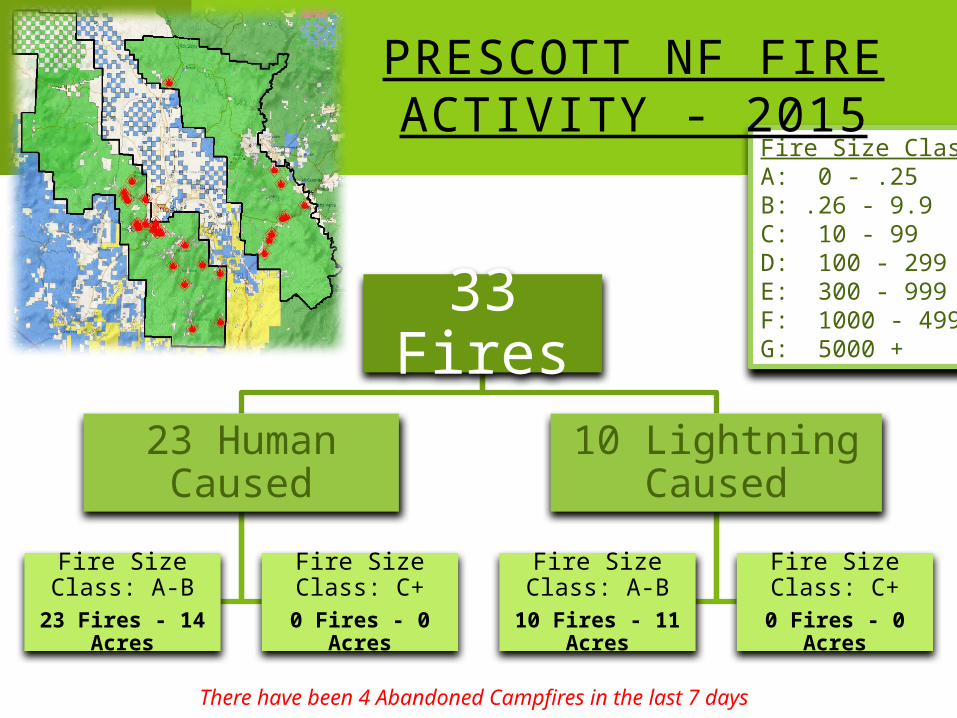
33 Fires
10 Lightning Caused
Fire Size Class: C+0 Fires - 0 Acres
Fire Size Class: A-B10 Fires - 11 Acres
23 Human Caused
Fire Size Class: C+0 Fires - 0 Acres
Fire Size Class: A-B23 Fires - 14 Acres
Fire Size ClassA: 0 - .25B: .26 - 9.9C: 10 - 99D: 100 - 299E: 300 - 999F: 1000 - 4999G: 5000 +
PRESCOTT NF FIRE ACTIVITY - 2015
There have been 4 Abandoned Campfires in the last 7 days
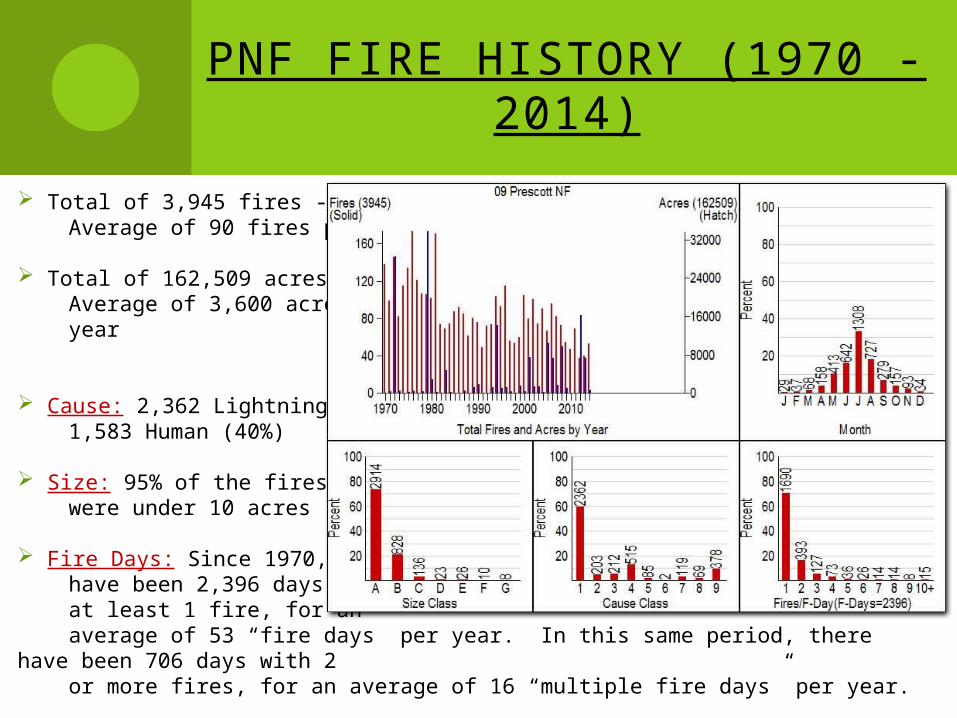
PNF FIRE HISTORY (1970 -2014)
Total of 3,945 fires - Average of 90 fires per year
Total of 162,509 acres – Average of 3,600 acres per year
Cause: 2,362 Lightning (60%) 1,583 Human (40%)
Size: 95% of the fires were under 10 acres
Fire Days: Since 1970, there have been 2,396 days with at least 1 fire, for an average of 53 “fire days” per year. In this same period, there have been 706 days with 2 or more fires, for an average of 16 “multiple fire days” per year.
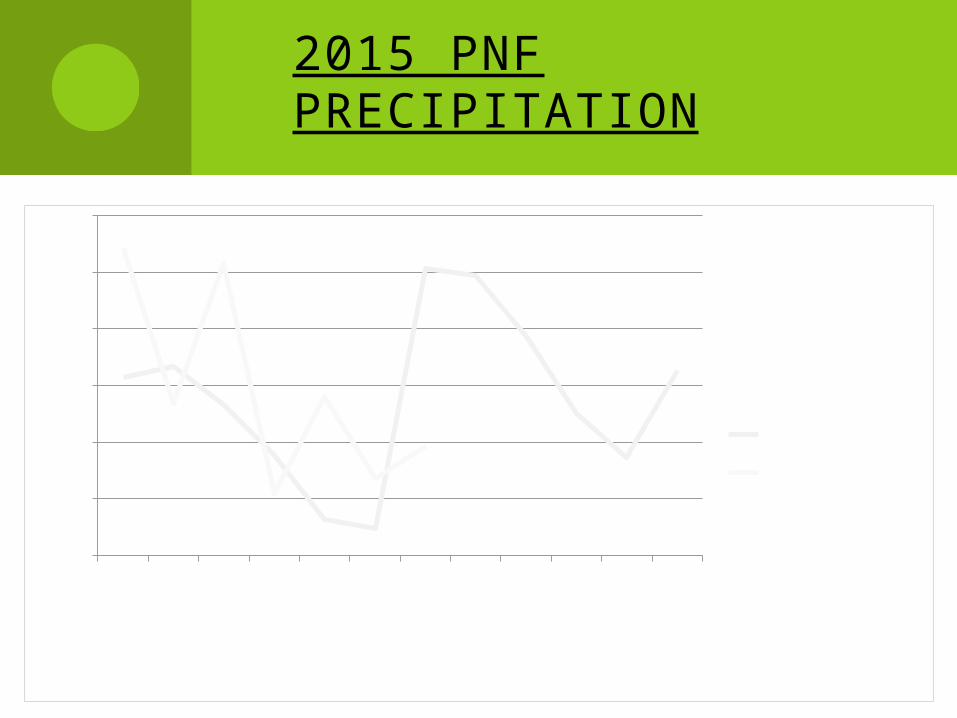
2015 PNF PRECIPITATION
January
Febru
ary
Marc
hApril
May
June
July
August
September
October
November
December
0
0.5
1
1.5
2
2.5
3
PNF Average2015
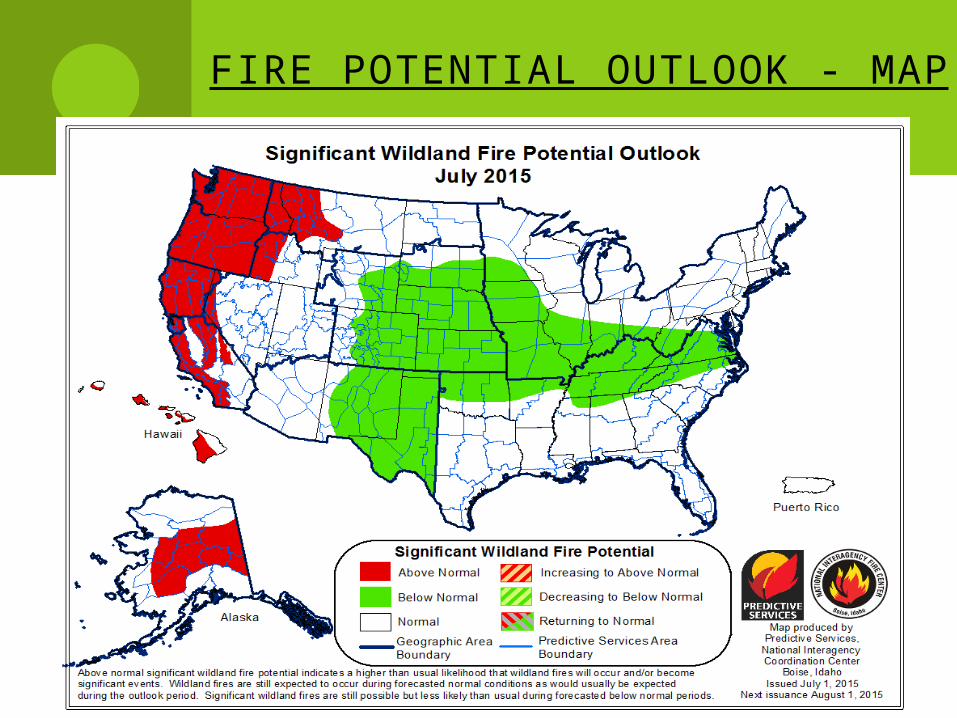
FIRE POTENTIAL OUTLOOK - MAP