Embed Size (px)
Citation preview

SUSTAINING COMPETITIVE ADVANTAGE: TEMPORALDYNAMICS AND THE RARITY OF PERSISTENT
SUPERIOR ECONOMIC PERFORMANCE
by
ROBERT R. WIGGINSA.B. Freeman School of Business
Tulane University7 McAlister Drive
New Orleans, LA 70118-5669(504) 865-5423
(505) 865-6751 [email protected]
Version presented at the Academy of Management 1997 Annual MeetingBPS DivisionAugust, 1997

2
(44)
SUSTAINING COMPETITIVE ADVANTAGE: TEMPORALDYNAMICS AND THE RARITY OF PERSISTENT
SUPERIOR ECONOMIC PERFORMANCE
ABSTRACT
In this research longitudinal data from two contrasting industries were stratified by levels
of performance using a new methodology. Findings: (1) while some firms do exhibit superior
economic performance, (2) only a small minority do so and (3) the phenomenon very rarely
persists for long time frames.
Keywords: Competitive Advantage, Firm Performance

1
INTRODUCTION
One of the fundamental missions of strategic management research is to investigate and
explain differences in performance among firms. The reigning incumbent explanation for the
heterogeneity of firm performance is based on the concept of competitive advantage. This concept
appeared in the strategic management literature in the early work of Ansoff (1965), but is
probably most associated with the Harvard Business School and popularized by the work of
Michael Porter in the early 1980s (Porter, 1979; 1980). More recently, in a special issue of the
Strategic Management Journal on the search for new paradigms in strategy, the editor-in-chief
wrote: “Competitive advantage has become for the field a central matter to understand and
explain in terms of causality. It has not proven a simple task” (Schendel, 1994: 3). More recent
work by Porter and others (Amit & Schoemaker, 1993; Barney, 1991; Conner, 1991; Ghemawat,
1986; Porter, 1985) has focused on the expanded concept of sustained competitive advantage,
which, simply put, is the idea that some forms of competitive advantage are very difficult to
imitate and can therefore lead to persistent superior economic performance (hence the subtitle of
Porter (1985): Creating and Sustaining Superior Performance).
While there have been numerous theories and empirical studies of competitive advantage
and its effect on firm performance, most of them have examined only limited time frames and
almost none have addressed the important issue of the dynamics of the sustainability of the
rewards of competitive advantage over long time frames. In other words, if it is in fact feasible to
achieve a sustained competitive advantage, then one should observe persistence in superior
economic performance over time. This research begins the effort to determine if this persistence is
observed, and, if so, its incidence. Popular extant theories in strategic management, based on
industrial organization economics (Porter, 1985; Porter, 1980) and the resource-based view of the
firm (Barney, 1991; Conner, 1991) predict that factors that sustain competitive advantages
generate superior economic performance that persists over time. On the other hand, historical
economic theories such as neoclassical economics and the work of the Austrian school of
economics (Jacobson, 1992; Schumpeter, 1934) as well as the hypercompetitive model (D'Aveni,
1994) of strategic management predict (for widely varying reasons) the opposite: that temporal
dynamics, resulting from factors such as imitation, entry, and the introduction of substitutes, will
erode almost all competitive advantages, thus preventing superior economic performance from
persisting.

2
Whatever the theoretical underpinning, a common link in most of the research on
competitive advantage is a focus on firm performance as the dependent variable. As a result of
this focus, there has been considerable study of the nature of a wide range of independent
variables that affect performance but little attention paid to the “topography” of performance itself
(with a few notable exceptions, described below). This is akin to an epidemiologist studying the
various factors that might affect a medical condition--without determining the incidence and
prevalence of the condition in the population. This research attempts to shed additional light on
the dynamics of the behavior over time of the primary dependent variable of strategic management
research, economic performance, and in so doing reflect on the implications of those findings for
strategic management theories.
While there have been few prior investigations into the topography of performance, there
have been some worthy of note. Mueller (1986), in a time-series regression-based study of ROA
(operationalized as variation from the mean ROA of the sample) for 600 large industrial firms
over the period 1950-1972 utilizing COMPUSTAT and FTC databases, found that profit levels
tended to converge toward the mean, but that the highest-performing firms converged the most
slowly, and some of the high-performing firms’ profitability actually continued to increase over
time. Jacobsen (1988), in a time-series regression-based study of ROI over the period 1970-1983
utilizing the PIMS SBU-level database, also found that profit levels converged over time, and
concluded that “the conditions under which market forces do not drive return back to its
competitive rate seem remote, if present at all” (Jacobsen, 1988: 415). Since both studies found
that there was, in fact, some persistence of superior economic performance, the questions this
research addresses as to the incidence and prevalence of such performance form a natural
continuation of this line of research. By using a new methodology better suited to the
identification of outliers, the present research avoids the use of autoregressive time series
methodologies. Further, the time frame of this research, 1974-1993, complements the time period
(1950-1972) studied by Mueller (1986). The present research also supplements the accounting
measures of performance used in these prior studies with a market-based performance measure.
THE RESEARCH QUESTIONS
The primary empirical research question addressed in this research is: does superior
economic performance persist over time, in a manner consistent with sustained competitive

3
advantage? If such persistence is found to exist (even if it is found to be rare), a set of derivative
questions can also be investigated. How long does such performance persist? What fraction of
firms in an industry exhibit persistent superior economic performance? If groups of firms exhibit
this behavior, do the groups remain stable over time?
These questions are important both managerially and theoretically. From a managerial
perspective, much of the published thinking on sustained competitive advantage implies that
managers need to invest (perhaps considerable) resources in a search for an advantage and, if the
search is successful, the firm can then reap consequent rewards, possibly over a long period of
time. If, in fact, such rewards are difficult or impossible to sustain over time, then managers
cannot condone extensive expenditures in the search for singular advantages, and must instead
continually work to find new sources of temporary advantages in a sequence of short run
circumstances (D'Aveni, 1994: 14-15).
From a theoretical perspective, there are competing disciplinary worldviews that address
the idea of sustained competitive advantage. If, for example, competitive advantage can be
demonstrated to be sustainable in the long run, then, in the extreme, economic theory needs to be
adapted to encompass the idea. On the other hand, if competitive advantage is not sustainable, or
only sustainable in the short run or the medium run, then strategic management theories need to
be changed to reflect this reality. If competitive advantage is sustainable in the long run but is
found to be very rare, this research would add to the growing impetus behind the resource-based
view of the firm in strategic management research.
KEY CONCEPTS
The concept of competitive advantage has a long tradition in the strategic management
literature. Ansoff (1965: 110) defined it thusly:
… (To) isolate characteristics of unique opportunities within the field defined bythe product-market scope and the growth vector. This is the competitiveadvantage. It seeks to identify particular properties of individual product marketswhich will give the firm a strong competitive position.
South (1981: 15), drawing on the work of the McKinsey & Co. consulting firm in the late
1970s, defined competitive advantage as the “philosophy of choosing only those competitive
arenas where victories are clearly achievable.” Much of the recent focus has been on sources of

4
competitive advantage; Porter (1985) states that there are, in general, only two possible
competitive advantages a firm may possess, a cost advantage or a differentiation advantage.
Others, particularly proponents of the resource-based view of the firm (Barney, 1991; Conner,
1991), have extended the definition to include a wider range of possible advantages such as
physical capital (Williamson, 1975), human capital (Becker, 1964), technological opportunities
and learning (Teece, 1980; 1983; 1986), and organizational capital (Tomer, 1987). For the
purpose of this research, we will adopt the wider definition of competitive advantage as a
capability (or set of capabilities) or resource (or set of resources) that gives a firm an advantage
over its competitors which ceteris paribus leads to higher relative performance. This follows the
definition offered by Besanko, Dranove, & Shanley (1996: 441) of competitive advantage as a
firm outperforming its industry.
Received economic theory views superior economic performance as abnormal profits or
rents, where rents are profits in excess of those predicted by equilibrium models (Bain, 1959;
Klein, Crawford & Alchian, 1978; Ricardo, 1817; Schumpeter, 1934). This definition, however,
assumes the existence of “normal” profits, which in turn assumes that the equilibrium model is
valid. Rather than make any such assumption, this research will start with the less restrictive
strategic management definition of statistically significantly above average performance relative to
a reference set of comparable firms (typically an industry).
Of particular interest to strategists is the notion that advantages can be sustained for long
periods of time yielding sustained superior performance. One of the more interesting aspects of
conceptual discussions of this phenomenon is that they are fairly vague about what exactly is
meant by “sustained.” Porter is the least ambiguous, and uses the phrases “long-term profitability”
(Porter, 1985: 1) and “above-average performance in the long run” (Porter, 1985: 11) when
describing the consequences of sustained competitive advantage, clearly implying that “sustained”
in his usage is a long-term concept. Barney (1991), on the other hand, argues against the use of
calendar time as a referent, and instead defines a sustained competitive advantage as a competitive
advantage that “continues to exist after efforts to duplicate that advantage have ceased” (Barney,
1991: 102). While this latter definition is theoretically more precise, it is virtually impossible to
meaningfully operationalize.
For the purpose of this research, we will adopt Porter’s approach, and use calendar time
to determine if superior performance can be called “sustained.” Thus, persistent superior

5
economic performance is defined here as statistically significant above average performance
relative to a reference set (such as an industry) that persists over a long-term period of calendar
time (say, ten to twenty years). The time frame that determines the persistence of superior
economic performance may vary from industry to industry depending on such exogenous
variables as product life cycles, patent protections, copyrights, or other variables specific to an
industry. For example, computer products generally have a product life cycle of only a few years,
while auto parts and accessories have much longer product life cycles.
It is important to note that this research focuses primarily on the outcomes, superior
economic performance and persistent superior economic performance, rather than the
antecedents, competitive advantage and sustained competitive advantage. By studying the
temporal dynamics of the outcomes associated with competitive advantage, however, we study
the raison d’être of the construct.
THEORY DEVELOPMENT
Since almost all economic perspectives allow for at least temporary superior economic
performance, they are all compatible with the concept of competitive advantage in the short run--
where disagreements are possible is in the medium to long term. Neoclassical economics views
superior economic performance as an aberration that goes away when equilibrium is achieved
(Arrow & Hahn, 1970; Debreu, 1959). Both the structure-conduct-performance (SCP) industrial
organization (IO) perspective (Bain, 1959; Mason, 1939; Mason, 1949) as well as the price
theory industrial organization perspective (Stigler, 1968) allow for superior economic
performance in the medium to long term as either the result of differing levels of industry
profitability with entry barriers as the mechanism for protecting these abnormal profits (which is
why price theory makes the distinction for contestable markets (Baumol, 1982), where entry
barriers are not present) or within industries, due to the structure of the industry with
concentration, particularly monopoly and oligopoly, and market share as primary determinants
(Schmalensee, 1985). Evolutionary economics (Nelson & Winter, 1982) as well as the Austrian
school of economics (see Jacobson (1992) for an excellent summary of the Austrian school) from
which it draws, deem superior economic performance to be the result of cycles of innovation and
entrepreneurial activity which will both create and then erode any advantages. Strategic
management theories have adopted most of the potential explanations of the economic theories as

6
well as the resource-based view’s concept of inimitable resources. The majority of the theories
posit that the fundamental objective of the firm is profit maximization, which implies that all firms
will seek a competitive advantage wherever possible in order to help achieve maximum profits.
The resource-based view goes even farther, making the fundamental objective of the firm “above-
normal returns” (Conner, 1991: 132).
Selecting neoclassical economics a the base case leads to the following proposition:
P1: No firm will achieve persistent superior economic performance over other
firms in an industry (or reference set).
Should Proposition P1 be supported, as Jacobsen (1988) found, and no firm achieves
persistent superior economic performance, that would be evidence favoring either the zero-profit
equilibrium of neoclassical economics or very short cycles of competitive advantage and decline
of Austrian and evolutionary economics. This research would be unable to continue as outlined,
and additional research would be indicated to determine which of these theories offers the better
explanation for the lack of persistence. Should at least one firm achieve persistent superior
economic performance, as Mueller (1986) found, that would be additional evidence in favor of
industrial organization economics, organizational economics, and strategic management theories.
However, these theories predict different avenues for achieving such performance, and further
proposition tests are necessary to determine which set of theories has the most support.
Both the SCP IO paradigm and evolutionary economics predict that sustained competitive
advantage will be associated with industry concentration, so that a few large firms will be the
beneficiaries of sustained competitive advantage. Strategic group theory (Hunt, 1972; Newman,
1973; Porter, 1973) predicts that a group or groups of firms following the same or similar
strategies could be able to achieve sustained competitive advantage. The resource-based view of
strategic management relates sustained competitive advantage to rare resources, which implies
that persistent superior economic performance should also be rare. These four sets of theories all
lead to the following proposition:
P2: Small numbers of firms will achieve persistent superior economic performance
over other firms in an industry.

7
If proposition P2 is supported, the firms that achieve persistent superior economic
performance must be examined relative to the industry or reference set to determine if industry
concentration, the prediction of SCP IO and evolutionary economics, is associated with the
performance. This will be examined as a sub-proposition P2b. In the absence of such
concentration, an additional test can be performed to determine if strategic group theory from
SCP IO economics (Hunt, 1972; Newman, 1973; Porter, 1973) is supported as the mechanism.
One of the assumptions of strategic group theory is that the strategic groups have
predictive validity, i.e. firms in a strategic group have equivalent performance. If the firms
demonstrating persistent superior economic performance, which form a group with equivalent
performance, are in fact a strategic group, then the presence of mobility barriers (Caves & Porter,
1977) should make this group relatively stable, since other firms cannot readily change their
strategies in order to enter the strategic group (Barney & Hoskisson, 1990). This leads to the
following proposition:
P3: Groups of firms exhibiting persistent superior economic performance will
remain stable in membership over time.
Both evolutionary economics (Nelson & Winter, 1982) and the Austrian school
(Schumpeter, 1934) predict cycles of innovation followed by imitation and competition. Under
these theories, different firms will experience various cycles of competitive advantage and decline,
leading to turnover in the membership of the groups of firms exhibiting persistent superior
economic performance.
If proposition P3 is supported, and industry concentration is not associated with the
outcome from the test of proposition P2, then strategic group theory is supported. If industry
concentration was found to be associated with sustained superior economic performance, then
support for proposition P3 could be construed as only additional evidence of industry
concentration. If proposition P3 is not supported, and industry concentration is not associated
with the outcome from the test of proposition P2, then only the resource-based view of the firm
offers a theory that explains all of the observed outcomes, and the argument that it is the rarity of
resources that lead to sustained competitive advantage is supported. If industry concentration was

8
associated with the test of proposition P2, then contradictory evidence for proposition P3 offers
additional support for Austrian and evolutionary economics.
METHODS
Data Sources. Data were collected from the COMPUSTAT PC-Plus data base for the
twenty year period from 1974 to 1993 inclusive. The COMPUSTAT data bases have been widely
used in both economics and strategic management inquiry because they are among the most
comprehensive collections of financial data available. COMPUSTAT is limited to information on
publicly held firms, and only limited line-of-business data are available. The former limitation is
not severe, as most large companies in the U.S. are publicly held. The latter limitation has been
viewed as a major drawback, but is accommodated in this research via sample selection and a
methodological step to test the effects of the inclusion of diversified firms.
While a number of two, three and four-digit SIC industries, as well as non-industry
samples (e.g., the Fortune 500) were examined, for purposes of explication two contrasting
samples were extracted from the COMPUSTAT data base and are described below.
Variables. Economic performance was operationalized with two measures, an accounting
measure, return on assets (ROA), and an economic measure, Tobin’s q, the ratio of firm market
value to the replacement cost of its assets. ROA, net income divided by total assets, was selected
because much prior strategic management research has employed a measure of accounting
returns, often ROA. Tobin’s q was selected because some studies have found results to vary
between accounting and economic measures (Hoskisson, Hitt, Johnson & Moesel, 1993). Tobin’s
q was operationalized as the ratio of market to book value. This ratio has been shown to be
theoretically equivalent to Tobin’s q (Varaiya, Kerin & Weeks, 1987) as well as empirically
equivalent, with a correlation greater than 0.92 with all alternative operationalizations (Perfect &
Wiles, 1992), and has been used previously in management research (Nayyar, 1993).
Superior economic performance was operationalized as statistically significant above
average (relative to the industry or reference set) economic performance over a five year period,
determined using the Iterative Kolmogorov-Smirnov stratification technique technique (Ruefli &
Wiggins, 1994; Ruefli & Wiggins, 1996) described later in this section. A rolling five-year
window window (Cool & Schendel, 1988; Fiegenbaum & Thomas, 1988) was used to create up
to 16 distributions of returns for each firm for each of the two performance measures, which in

9
effect created 32 subsamples in both of the samples. Firms that did not have all five years of data
in a period were excluded from the analysis for that period.
Industry Selection. Because some of the theories upon which this research is based focus
on industry effects, selection of which industries to study is problematic. There are two main
problems, (1) the general selection problem and (2) the diversified firm problem. The general
selection problem was solved by selecting two contrasting samples. First, the Office Equipment
and Computing Machines industry (SIC code 357) was chosen because it has been used in
previous research into some of the effects to be studied, because it is known to be volatile and
rapidly changing, and for reasons relating to the diversified firm problem, as explained below. The
Auto Parts and Accessories industry (SIC 3714) was selected because it is stable and changes
slowly, and could provide a contrast, as well as consisting of predominantly relatively non-
diversified firms.
The second-mentioned problem is that the presence of diversified firms in a sample could
potentially have an effect on the results. Since the primary statistical method to be employed
focuses on mean and variances of returns, the diversification literature was searched to estimate
the nature of the expected effects. With respect to the effect of diversified firms on the
performance means, Hoskisson & Hitt (1990), summarizing some of both the theoretical and
empirical literature, concluded that “a notable body of the research generally concluded that no
relationship existed between firm diversification and performance” (Hoskisson & Hitt, 1990: 469),
and our independent review of the literature reached the same conclusion. Thus mean returns
should not be significantly biased in either direction by the inclusion of diversified firms. In terms
of the variances of returns, Milgrom & Roberts (1992), following a long tradition, noted that firm
diversification is designed to reduce risk (1992: 461), and defined risk as variance (1992: 461). In
an empirical examination of diversification and risk (defined as variance) Amit & Livnat (1988)
found, indeed, that diversification led to lower variances of returns. Thus the variances of returns
should be biased toward stability (lower variances) by the inclusion of diversified firms. Further,
the two industries selected contain a large number of single business or at least dominant-related
firms in the sense of Rumelt (1974). However, to ensure that diversification was not an issue, an
additional empirical test (described below) was conducted to test the effect of the inclusion of
diversified firms and, as reported in the next section, no effect was found.

10
Proposition Testing. This research focuses on what is essentially an outlier or frontier
phenomenon (Starbuck, 1993), superior economic performance. The fundamental problem faced
in this research is the identification of the firms which exhibit this superior performance. All of the
propositions developed depend on this identification. However, most statistical techniques are
based on measures of central tendency, and focus instead on means and averages. In order to
identify superior performers over time, a new methodology, based on an iterative application of
the Kolmogorov-Smirnov two-sample test, will be used (Ruefli & Wiggins, 1994; Ruefli &
Wiggins, 1996; Wiggins, 1995).
To initialize the Iterative Kolmogorov-Smirnov stratification (IKS) technique, proposition
P1 will initially be assumed to be true, i.e., it will be assumed that there is a single distribution of
performance for the entire industry or reference set and that no firm has statistically significant
superior performance. Each firm’s distribution of performance levels for a period will then be
iteratively tested against the group distribution of performance levels for that period using the
nonparametric Kolmogorov-Smirnov two-sample test.
Firms which are found to have performance distributions that are different in a statistically
significant (α = 0.05) fashion from the group distribution will be set aside, and the process will be
repeated until the stratum of firms sharing the main distribution stabilizes. The firms excluded
from the main performance stratum will then be used as the basis for forming a second stratum,
and the process will be repeated. This iterative process will continue until no further inclusions or
exclusions can be made.
Note that, unlike cluster analysis, the IKS method does not predetermine the number of
strata of performance distributions for an industry; strata emerge based on the characteristics of
the data and the significance level established to discriminate between distributions. Further, the
IKS methodology is, in Ketchen and Shook’s (1996) terms, a polythetic divisive multiple-pass
technique and, as such, mitigates against both the subjective involvement of the researcher and
incompleteness of single-pass algorithms characteristic of traditional clustering techniques.
Strata Supersets and Category Validation with Discriminant Function Analysis.
While the performance strata developed by the Iterative Kolmogorov-Smirnov analysis
form naturally ordered categories (Argresti, 1984) from high performance to poor performance
that are statistically significantly different from each other, the possibility of varying numbers of
11
performance strata over time exists, making longitudinal comparisons difficult. Since we are only
interested in the firms whose performance is above the industry or reference set average, as a
form of a fortiori analysis (since it is conservative with respect to the propositions being tested),
in each time period the number of performance strata will be compressed by to three by creating
two supersets of strata: those above the modal stratum and those below the modal stratum. These
two supersets, along with the modal stratum will form the basis for the analysis.
Because the performance strata are formed by distributions of firm returns which are not
statistically distinguishable within the stratum, there is a potential for Type II error. While the
overall probability of a Type II error is reduced due to the iterative testing in the process of the
performance stratum formation, an additional statistical test is required to verify that no such error
occurred. To validate the strata, discriminant function analysis (DFA) was used in a confirmatory
mode with the Kolmogorov-Smirnov-derived supersets of performance strata as the grouping
variable and the first moment of the distributions, mean, as the independent variable. Note that
this differs from reports in the literature where DFA was employed to confirm groups generated
by cluster analysis (e.g., Venkatraman & Prescott (1990)) in that both DFA and cluster analysis
are parametric techniques that assume a multivariate normal distribution (Tatsuoka, 1988),
whereas the Kolmogorov-Smirnov test is nonparametric and distribution-free.
The test of the propositions P1, that no firms will exhibit persistent superior economic
performance will then be completed by examining the membership of the above-modal
performance stratum over time to determine if any firms remain in this stratum for multiple
overlapping time periods. Proposition 2, that small numbers of firms will achieve persistent
superior economic performance, will be tested by examining the size of the above-modal
performance stratum relative to the size of the industry or reference set. Proposition 2b will be
tested by computing the market shares of any firms with sustained superior performance.
To test the propositions P3, that the stratum of firms exhibiting persistent superior
economic performance will remain stable over time, ordinal time series analysis (OTSA), will be
employed. OTSA is a technique based on state determined systems instead of measures of central
tendency that is able to deal with the problem of missing observations such as firms coming into
and going out of business (Collins & Ruefli, 1992; Ruefli & Wilson, 1990). OTSA information
statistics (Collins & Ruefli, 1992) will be employed to evaluate transition rates between strata.
Transition matrices and total weighted uncertainty statistics will be computed.

12
RESULTS
As the first step toward testing the propositions developed previously, the two sets of samples,
the computing industry (SIC 357) and the automotive parts industry (SIC 3714) were stratified
with the iterative Kolmogorov-Smirnov method. For each sample this method formed strata of
0 %
2 0 %
4 0 %
6 0 %
8 0 %
1 0 0 %
74-7
8
75-7
9
76-8
0
77-8
1
78-8
2
79-8
3
80-8
4
81-8
5
82-8
6
83-8
7
84-8
8
85-8
9
86-9
0
87-9
1
88-9
2
89-9
3
M - 4 M -3 M -2 M -1 M o d e M + 1 M + 2 M + 3 M + 4
Figure 1 — Percentage of Firms in Strata Across Time SIC 357
statistically significantly different performance levels. The strata for SIC 357 ROA statistics
which were derived are shown graphically across time in Figure 1. As can be seen from the figure,
the number of strata varied, but within limits, across time; this was true for both measures, for
both samples. For each of the samples examined, by each measure, in each period a significant
fraction of the firms (roughly 60%) were categorized by the iterative Kolmogorov-Smirnov
technique in the modal stratum. This figure agrees with the 63.6 % of firms in the modal stratum
when 6541 firms in 56 industries were examined (Ruefli & Wiggins, 1994).
To generate the superset strata, those strata above the modal stratum were combined into
the superior performance stratum, while those strata below the modal stratum were combined to
form the inferior performance stratum. The superset strata are shown in the Appendix in Tables
A1 through A4, which include the strata sizes, means, and standard deviations. The strata sizes
are consistent between the two measures of performance. To validate the stratification supersets,
DFA was employed in a confirmatory mode. For the computing samples, all of the discriminant
functions were significant (p<0.05) for both variables in all 5-year windows. In all four samples,

13
the fact that the superset strata discriminant functions were statistically significant demonstrates
the validity of the superset performance strata.
The Effects of Diversification. Because the industry samples were based upon primary
SIC code, some diversified firms that also conducted business in other SIC codes were included in
these samples. To determine if the inclusion of the diversified firms materially affected the results
for the non-diversified firms, the latter1 were subsampled from the computing industry (SIC 357)
ROA sample and the entire analysis described above was repeated on just those firms. Once again,
all of the discriminant functions were statistically significant at least at the p<0.05 level, and the
average classification rate of over 60% was over two and one half times that expected by chance.
To compare the classifications of the non-diversified subsample with those from the complete
sample, each set of the observations was pooled and Cohen’s kappa for interrater agreement was
calculated. The two sets of analyses agreed on over 88% of the classifications with a value of
kappa of 0.756 (with a standard error of 0.023 for an approximate z-score of 31.972, significant
at the p < 0.001 level). Cohen’s kappa was also computed for each 5-year window, and the results
are shown in table A5 in the Appendix. In one period, the number of groups was unbalanced and
kappa could not be computed, but in all the other periods kappa was significant at the p<0.001
level, and in two periods the two analyses agreed on 100% of the classifications. With such high
levels of agreement between the two sets of analyses, the inclusion of the diversified firms does
not appear to materially affect the outcomes of the analyses, which is consistent with the
conclusions of Hoskisson & Hitt (1990).
PROPOSITION ONE: PERSISTENT SUPERIOR ECONOMIC PERFORMANCE
To test proposition P1, the superset strata described above were examined to determine if
any firms remained in either of the above average strata for multiple 5-year windows. In three of
the samples, at least one firm remained in the above average strata for all 16 windows covering all
20 years of data. In the SIC 357 ROA sample, Hewlett-Packard alone achieved such truly
1To remain consistent with prior diversification research, the coding was done strictly on SIC code classifications,even though this meant that many firms that would not be considered diversified by industry experts were in factcoded as diversified. For example, PC clone computer manufacturers such as Dell, Gateway 2000, Zeos, and othersall report SIC codes for software, communications devices, and other add-ons which are ancillary to their mainbusiness.

14
persistent superior economic performance, as shown by the dark cells in Figure 2. Diebold and
IBM each managed 15 years of superior performance.
Company7478
7579
7680
7781
7882
7983
8084
8185
8286
8387
8488
8589
8690
8791
8892
8993
Apple ComputerCray ResearchDCADiebold, Inc.Emulex CorpHewlett-PackardIBM CorporationIIS Intelligent InfoIntergraph CorpIntermec CorpNCR CorpSBE, Inc.Stratus CorpTandem ComputersTseng LabsRevenue Share % 36 33 34 33 34 35 37 41 41 38 37 9 10 8 7 6
without IBM 2 2 3 3 4 5 5 9 9 9 9 9 10 8 7 6
Figure 2 — Office Equipment and Computing Machinery (SIC 357) ROA Sample Periods ofPersistent Superior Economic Performance for 10 Years or more
Company7478
7579
7680
7781
7882
7983
8084
8185
8286
8387
8488
8589
8690
8791
8892
8993
Augat IncClarcor IncModine Mfg CoUniversal Mfg CoRevenue Share % 1 1 1 1 1 1 2 1 1 2 2 2 2 3 3 3
Figure 3 — Auto Parts and Accessories (SIC 3714) ROA Sample Periods of Persistent SuperiorEconomic Performance for 10 Years or more
Company7478
7579
7680
7781
7882
7983
8084
8185
8286
8387
8488
8589
8690
8791
8892
8993
Augat IncClarcor IncEchlin IncGentex CorpSimpson IndustriesTRW IncRevenue Share % 2 2 2 21 24 24 26 23 27 26 1 1 1 1 1 1
without TRW 2 2 2 3 3 3 4 2 4 4 1 1 1 1 1 1
Figure 4 — Auto Parts and Accessories (SIC 3714) Tobin’s q Sample Periods of PersistentSuperior Economic Performance for 10 Years or more

15
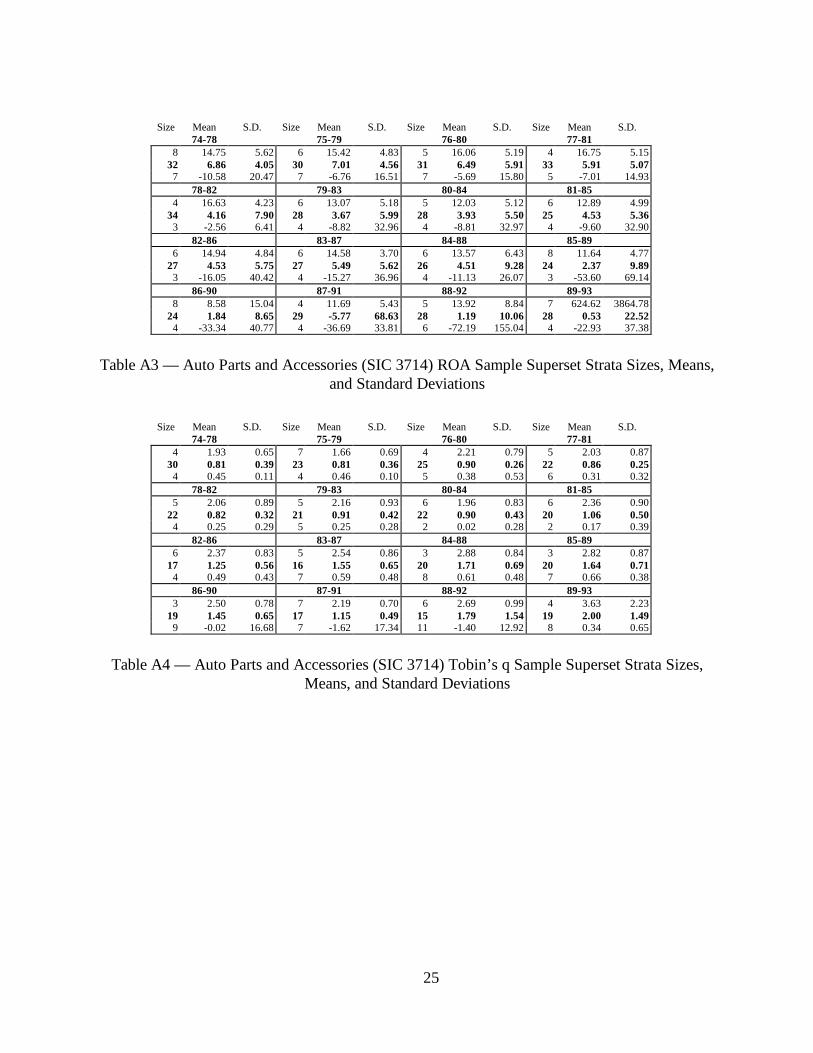
In the auto parts industry ROA sample, only Universal and Clarcor persisted in their
superior performance (see Figure 3), and only Clarcor also achieved this result in the Tobin’s q
sample (Figure 4). In percentages, 0.35% of the SIC 357 ROA firms, 2.9% of the SIC 3714 ROA
firms, and 1.72% of the SIC 3714 Tobin’s q firms achieved 20 years of persistent superior
economic performance.
Company7478
7579
7680
7781
7882
7983
8084
8185
8286
8387
8488
8589
8690
8791
8892
8993
Codenoll TechCray ResearchFingermatrixIntl. TotalizatorMylex CorpNEC CorpPitney BowesPSC IncStratus CorpSymbol TechThresholdVoice ControlRevenue Share % 0 0 0 5 5 5 6 6 6 8 9 11 11 10 11 1
without NEC 0 0 0 0 0 0 0 0 0 0 0 1 1 1 1 1
Figure 5 — Office Equipment and Computing Machinery (SIC 357) Tobin’s q Sample Periods ofPersistent Superior Economic Performance for 10 Years or more
Only in the computing industry Tobin’s q sample (Figure 5) did no firm achieve 20 years
of persistent superior economic performance, although NEC remained in the above-average strata
for 10 windows spanning 14 years. So in all 4 samples, clearly Proposition P1 is rejected. These
results differ from the regression-based findings of Jacobsen (1988), who found, using ROI, that
all abnormal profits decay over time, but concur with Mueller (1986), who found that some firms
sustained profitability over the period 1950-1972.
PROPOSITION TWO: CONCENTRATION AND PERSISTENCE
Proposition P2 posits that small numbers of firms will achieve persistent superior
economic performance. Figure 6 shows the numbers of firms achieving superior economic
performance for multiple overlapping 5-year windows. As can be seen, between 20% and 25% of
the firms in the four industry samples achieve statistically significant superior economic
performance in at least two overlapping 5-year windows (i.e., 6 years) sometime between 1974

16
and 1993. As the number of periods increases, however, the proportion of firms who maintain
such performance decreases rapidly.
2 3 4 5 6 7 8 9 10 11 12 13 14 15 16
SIC 357 ROA
SIC 357 Tobin's q
SIC 3714 ROA
SIC 3714 Tobin's q
0%
5%
10%
15%
20%
25%
Number of Periods of Superior Performance
Figure 6 — Percentage of Firms Exhibiting Superior Economic Performance Over Multiple TimePeriods
Two of the theories, SCP industrial organization and evolutionary economics, that predict
the observed small numbers of firms exhibiting persistent superior economic performance in the
industry samples do so on the basis of industry concentration (P2b). To examine whether this is in
fact the mechanism that leads to the small numbers observed, the share of industry revenue for
firms achieving 10 years or more of persistent superior economic performance was calculated and
is displayed at the bottom of Figures 2 through 5. This revenue share was determined by summing
the total revenues of all of the firms in the sample for each period and determining the proportion
accounted for by the firms displayed in the charts. Because of the small numbers involved
inspection alone was sufficient to test P2b.
For SIC 357, there does appear to be the predicted concentration effect in the ROA
sample for the majority of the periods and also, to a much lesser degree, in the Tobin’s q sample.
However, in the ROA sample it is one company, International Business Machines, which
accounts for virtually all of the apparent concentration, and in the Tobin’s q sample, NEC
Corporation does likewise to a much lesser degree. In the former case, the dominance of IBM
17
(but for only tow-thirds of the periods), by itself, is support of the concentration proposition. In
the latter case, however, the effect is much weaker, because NEC is one of the most highly
diversified firms in the sample with substantial revenues from other industries.
In the SIC 3714 ROA sample (Figure 3), there is no evidence at all of industry
concentration among the firms exhibiting persistent superior economic performance. The
combined revenue share of the firms achieving persistent superior economic performance is never
greater than 3%. The results for the Tobin’s q sample (Figure 4) are similar those for the SIC 357
industry Tobin’s q sample. Again one firm, TRW Inc., by itself provides all of the evidence of
concentration (but for only seven periods), and again TRW is one of the most highly diversified
firms in the sample. Given these results, the only support for the industry concentration
proposition is in the SIC 357 ROA sample (Figure 2). These results are consonant with the
regression-based work of Jacobsen (1988), who found no effect of concentration on the
persistence of abnormal profits measured using ROI, as well as with the regression-based work of
Mueller (1986), who found the effect of concentration in only a few industries.
PROPOSITION THREE: STABILITY AND PERSISTENCE
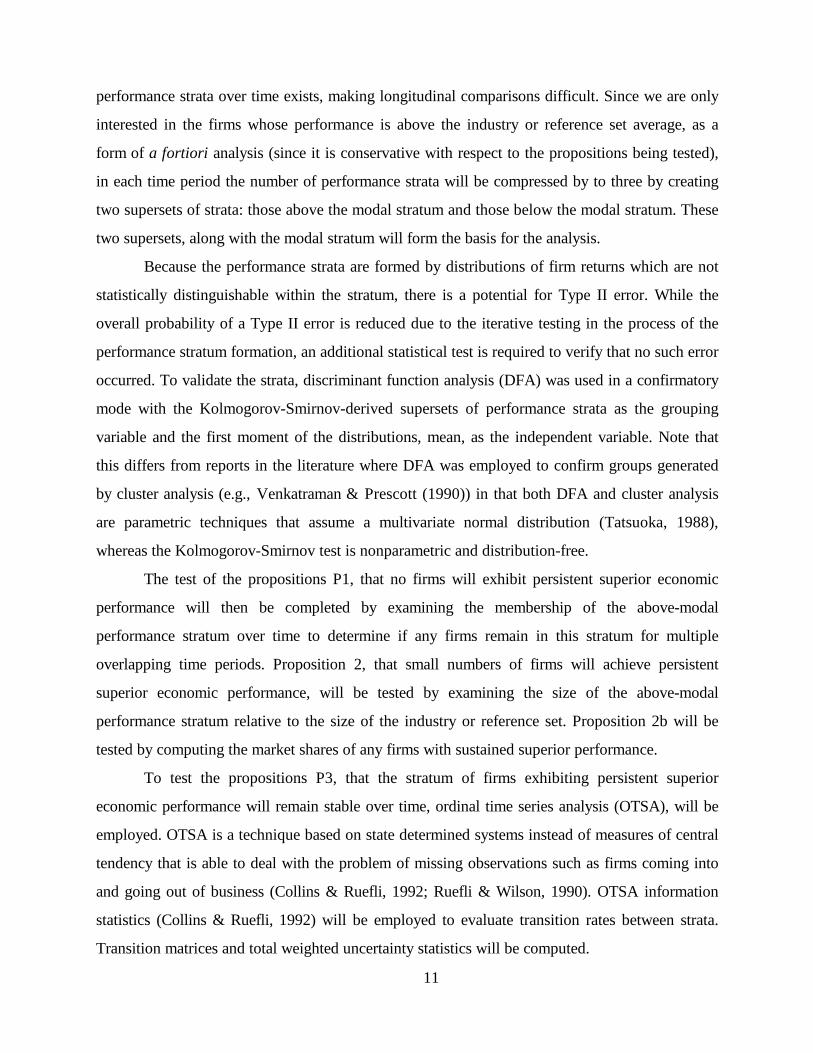
Proposition 3 was tested using ordinal time series analysis. In the state transition rate
tables in this section that present the results of the ordinal time series analyses, the rows represent
the prior period state (in this case, stratum), and the columns represent the subsequent period
state (or stratum). The matrix elements therefore represent the probability of a firm moving from
the row stratum in the prior period to the column stratum in the subsequent period. For example,
in Table 1, the probability of a firm in the above average stratum (state or row 1) to the average
stratum (state or column 2) is 0.246, as shown in the cell at row 1 column 2.
To — > 1 2 3From
1 0.714 0.246 0.0172 0.035 0.847 0.0413 0.012 0.198 0.643
Table 1 — State Transition Rates for the Office Machinery and Computing Equipment (SIC 357)ROA Sample
18
Proposition P3 argued for stability in the membership of the performance strata over time.
For the computing industry ROA sample, the only stratum that is close to stable is the average
stratum, as shown in Table 1, with a probability of 0.847 that firms will remain in that stratum
from period to period.
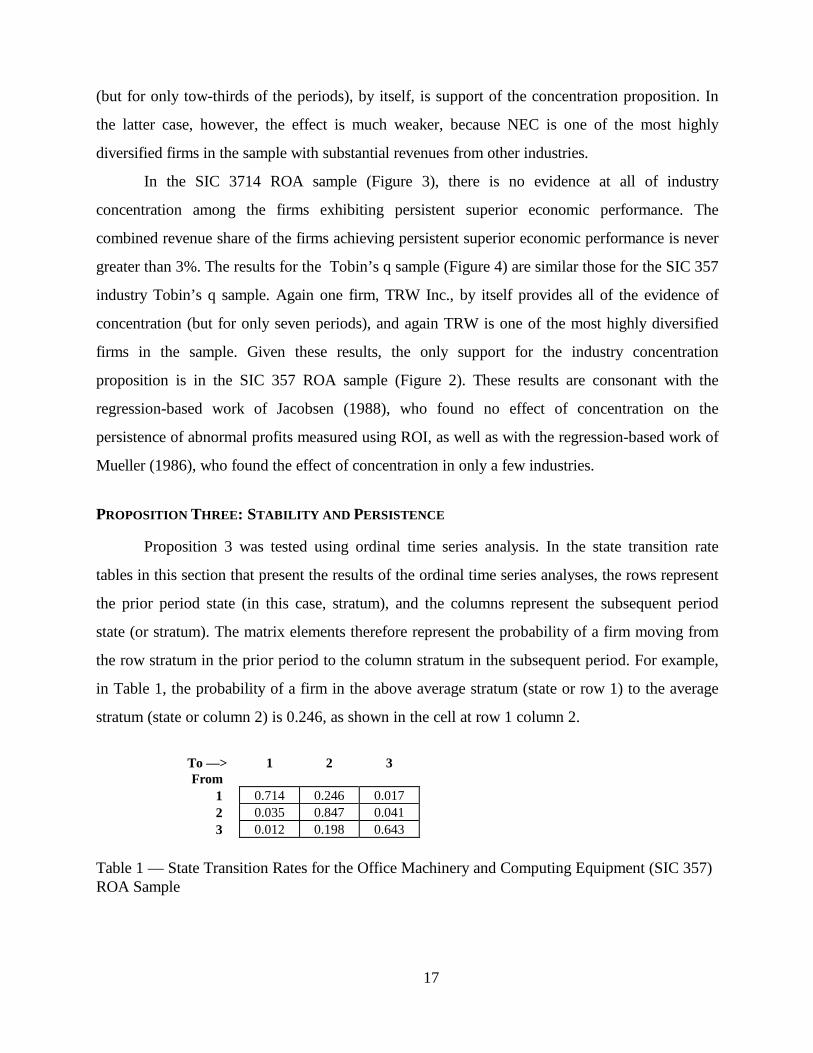
The results for the computing industry Tobin’s q sample, shown in Table 2, are very
similar. Again, the only stratum that is at all stable is the average stratum with a probability of
0.828 that firms will remain in that stratum from period to period.
To — > 1 2 3From
1 0.688 0.212 0.0272 0.035 0.828 0.0453 0.064 0.225 0.642
Table 2 — State Transition Rates for the Office Machinery and Computing Equipment (SIC 357)Tobin’s q Sample
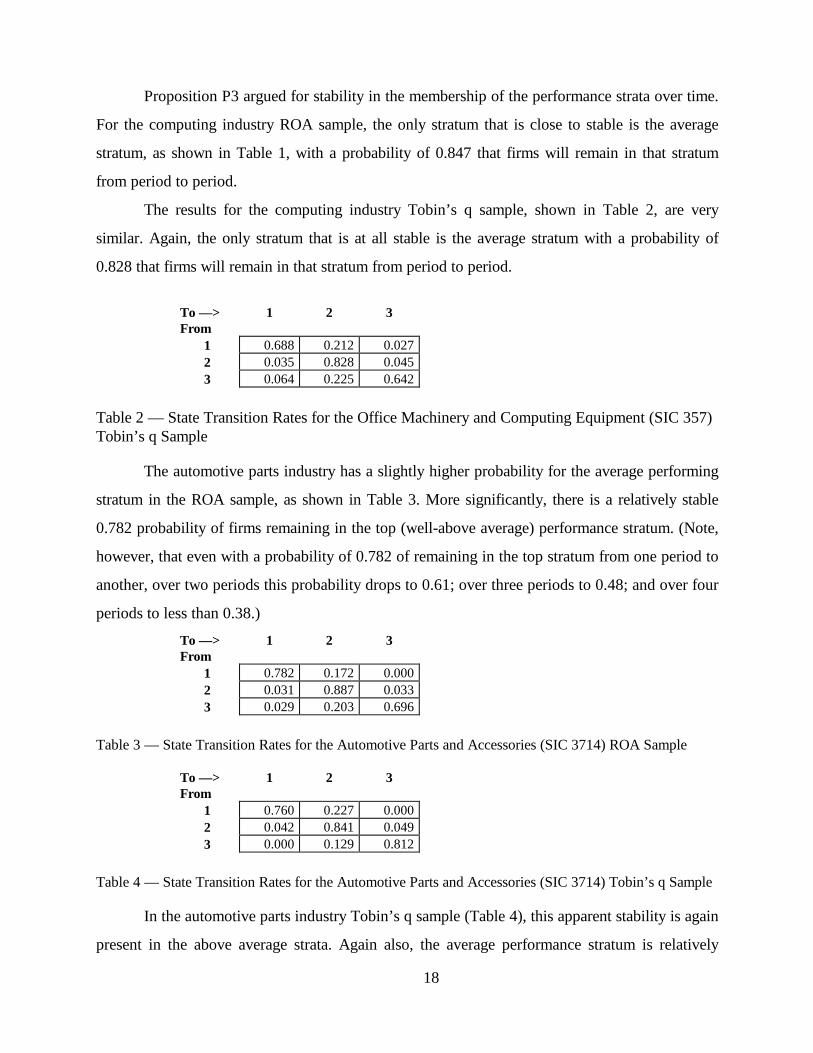
The automotive parts industry has a slightly higher probability for the average performing
stratum in the ROA sample, as shown in Table 3. More significantly, there is a relatively stable
0.782 probability of firms remaining in the top (well-above average) performance stratum. (Note,
however, that even with a probability of 0.782 of remaining in the top stratum from one period to
another, over two periods this probability drops to 0.61; over three periods to 0.48; and over four
periods to less than 0.38.)
To — > 1 2 3From
1 0.782 0.172 0.0002 0.031 0.887 0.0333 0.029 0.203 0.696
Table 3 — State Transition Rates for the Automotive Parts and Accessories (SIC 3714) ROA Sample
To — > 1 2 3From
1 0.760 0.227 0.0002 0.042 0.841 0.0493 0.000 0.129 0.812
Table 4 — State Transition Rates for the Automotive Parts and Accessories (SIC 3714) Tobin’s q Sample
In the automotive parts industry Tobin’s q sample (Table 4), this apparent stability is again
present in the above average strata. Again also, the average performance stratum is relatively

19
stable. Note also that the probability of remaining in the below average stratum is a relatively high
0.812.
In all of the samples the converse of proposition P3 (~P3) is supported, and the above
average performing strata are not stable over time, with multiple firms entering and leaving the
strata.
DISCUSSION AND IMPLICATIONS
The results of the proposition tests have interesting implications for both economics and
strategic management perspectives on superior economic performance, as summarized in Table 5.
The sustained competitive advantage notion of the SCP paradigm of industrial organization,
which is also the foundation for much research in strategic management such as the work of
Porter, receives almost no support from the results of this research. While the existence of
persistent superior economic performance (~P1) and the small number of firms achieving it (P2) is
in accord with SCP industrial organization and Porter’s sustained competitive advantage, the
mechanism by which SCP IO and Porter argue that this will occur, industry concentration, is only
supported (P2b) in one of the industry samples, and there the concentration is due to the
dominance of a single company. Porter’s theory of strategic groups with mobility barriers and
predictive validity is also not supported in these samples (~P3 and see also Wiggins & Ruefli,
(1995)).
The prediction of neoclassical economics, the baseline model for many of the economic
theories, is also not supported. The existence of long-term (20 years) persistent superior
economic performance (~P1) in three out of the four samples is an indication that an equilibrium
condition is not achieved.
Evolutionary economics and the Austrian school of economics fare somewhat better. The
existence of very long-term (20 years) persistent superior economic performance (~P1)
contradicts their long-term predictions, although the changing membership of the top two
performance strata (~P3) are consistent with their predictions of cycles of innovation leading to
periods of persistent superior economic performance. The small numbers of firms achieving
persistent superior economic performance (P2), while consistent with evolutionary economics,
does not directly support the theory because it is not associated with the predicted industry
concentration (~P2b).

20
Theoretical Perspective Supported By Not Supported ByEconomics1. Neoclassical economics ~P12a. SCP paradigm IO ~P1 P2, ~P2b, ~P32b. Price theory IO ~P13. Organizational economics ~P14. Evolutionary economics ~P3 ~P1, P25. Austrian economics ~P3 ~P1Strategic Management6a. Porter ~P1 P2, ~P2b, ~P36b. Resource-based view ~P1, P2, ~P3
Table 5 — Implications of Results for Theoretical Perspectives
The most favorable outcome for the theoretical perspectives is for the strategic
management resource-based view of the firm, which is supported by the results of three of the
proposition tests and which is not contradicted by the others. Persistent superior economic
performance, which is the fundamental objective of the firm in the resource-based view, is found
to exist (~P1), but is also found to be rare (P2), which is consistent with the concept of rare and
valuable resources which lead to sustained competitive advantages. None of the supported
propositions contradict the resource-based view of the firm.
Not surprisingly, the other perspectives which fare the best are price theory industrial
organization economics and organizational economics, which both draw upon some of the same
antecedents, e.g., transaction cost economics, as the strategic management resource-based view
of the firm. These perspectives are also supported by the existence of persistent superior
economic performance (~P1).
The findings of this research also have implications for strategy process research as well as
the practice of management by firms. The fact that persistent superior economic performance is
indeed rare, and that therefore the search for a single structural advantage such as proposed by
Porter is unlikely to be successful, implies that the search for multiple small incremental
advantages may be a fruitful alternative for managers to pursue and for strategy researchers to
investigate. For example, Hewlett-Packard, the firm that achieved 20 years of persistent superior
economic performance in the computer industry, is recognized for its multiple successive
successful product innovations. It may be that the strategy process at Hewlett-Packard that has
21
led to such a series of successes is, in fact, their sustained competitive advantage (Adler, Riggs &
Wheelwright, 1989; Bowen, Clark, Holloway & Wheelwright, 1994).
An aspect of this research which does not directly address any of the propositions but
which points the way for some future examination is the large preponderance of firms in all time
periods and in all samples that fell into the average or modal performance stratum. Over 60% of
firms in all samples were statistically indistinguishable from the average. This large number of
average firms, coupled with the relative symmetry of the sizes of the above average and below
average strata, may offer an explanation for why previous research in economics using measures
of central tendency (primarily regression analysis) found support for so many of the theories for
which the present research failed to find support.
The temporal dynamics observed in this research also suggests that revisions to extant
theories may be able to explain the observed behavior. As noted, well over half of all firms fall
into the average stratum. The behavior of these firms is consistent with the neoclassical
equilibrium model, although instead of converging on a point (where price equals marginal cost),
they converge on a distribution. The variations around the mean of the average stratum, rather
than representing simple random variation, could be explained by the more relaxed assumptions of
organizational economics (Chandler, 1990; Cyert & March, 1963; Teece, 1983), with bounded
rationality and complex preference functions accounting for the fluctuations. The few firms that
achieve persistent superior economic performance are consistent with the predictions of the
resource-based view of the firm. The entire system could be viewed as a homeostasis, with the
average stratum representing the base state.
In such a homeostatic model, a few firms achieve superior economic performance, but the
regulating mechanisms of Austrian and evolutionary economics, imitation and competition,
constantly put pressure on these firms to return to the main group. A few firms also fail to achieve
the performance levels of the homeostatic group, and end up in the below average strata, where
most (if not all) firms are losing money. These firms must either return to the main group by
becoming more efficient, or they continue the downward spiral and fail, becoming data points in
ecological studies of firm non-survival. Some of the below average performers are firms investing
heavily in attempting to achieve a competitive advantage (such as computer industry firms seeking
technological advances), and if it is achieved they can make the transition directly to the above
22
average strata. The behaviors observed in this research are all consistent with such a complex
homeostatic model of performance.
Limitations of the Research. The primary limitation of this research is its reliance on the
corporate level data available in the COMPUSTAT data base, which is further exacerbated by
potential industry identification problems caused by using SIC codes. On the other hand, the
problem of diversified firms has been shown empirically to be not significant. Finally, while the
results here have been replicated in studies of other industries and samples (e.g., the Fortune 500)
during the same time period, there is no guarantee they will generalize to all industries or samples
in all time periods.
Another limitation of this research is in the minimum time frame, five years, selected to
represent superior economic performance. It may be that the appropriate time frames are shorter
varying by industry or by competitive arena, and future research to examine this would be of
interest. If, however, the appropriate time frames are longer than five years, the use of the rolling
five year windows controls for this limitation. An associated limitation is that the data employed
are both right and left-censored. However, they do cover two decades, and precisely the two
decades in which the concept of sustained competitive advantage rose to prominence in strategic
management.
Directions for Future Research. Although research by the authors has examined a
number of industries with results very similar to those reported here, the most obvious direction
for future research is to extend the methods used in this research to other industries, other
samples, and other time periods. For example, since the analysis demonstrated that diversification
did not materially affect the results, industries containing a large number of diversified firms could
be studied. Examination of regulated industries would also be of interest. For example, a
longitudinal study of the airline industry that spanned the periods before and after deregulation
might be revealing. Also, replication over a longer time frame such as 30 or 40 years would be of
great interest, particularly since this time frame would encompass the periods most heavily studied
by the early empirical work in strategic management and would enhance the comparability of this
research with prior investigations.
Because sustained competitive advantage was found to be limited to a handful of firms,
and even for those firms further limited in temporal extent, future theoretical development will be
23
required to adapt theories of the firm to reflect this reality. Of all the theoretical perspectives
examined in this research, only the resource-based view of the firm is consistent with all of the
findings. It may be possible to construct a theoretical economic model, such as the homeostatic
model proposed in the discussion section above, based on the richer and more relaxed
assumptions of organizational and evolutionary economics that can account for the behaviors
observed in the current research. Such a model might be able to integrate many of the theoretical
perspectives that this research draws upon to develop a much more complex model of firm
behavior that could predict the kinds of results found in this research.
In conclusion, by examining the topography of economic performance via a new data-
driven technique that identifies superior economic performance, this research offers some
important insights into the temporal dynamics of sustained competitive advantage. The avoidance
of measures of central tendency allowed relationships which might have been obscured by
averages to be highlighted, and the stratification technique employed resolved the problem of
distinguishing superior economic performance. Implications for theories of strategic management
are significant in that the revealed topography reveals an environment quite different in some
aspects than that envisioned in several extant theories.

24
APPENDIX
Size Mean S.D. Size Mean S.D. Size Mean S.D. Size Mean S.D.74-78 75-79 76-80 77-81
16 10.62 4.72 19 12.27 4.69 15 12.49 4.30 10 12.76 3.7757 1.64 15.53 51 -0.19 22.50 56 2.05 21.25 54 5.48 13.9612 -25.25 44.88 14 -12.47 37.12 17 -15.44 37.36 22 -17.64 37.27
78-82 79-83 80-84 81-8515 11.49 4.16 13 11.86 2.80 8 13.84 3.19 19 11.46 6.3459 2.93 16.28 63 3.83 13.17 77 2.15 17.91 84 -1.61 29.2814 -34.22 51.84 16 -45.37 62.05 20 -28.84 63.52 9 -56.12 55.78
82-86 83-87 84-88 85-8928 11.36 4.05 31 11.14 7.40 26 11.86 6.20 23 12.06 7.9397 -3.79 34.12 102 -2.93 30.31 112 -2.98 26.12 116 -4.19 30.3411 -57.35 61.12 15 -72.73 140.26 14 -62.15 56.21 21 -88.19 141.16
86-90 87-91 88-92 89-9323 12.63 5.75 23 12.51 9.71 28 13.33 6.76 21 14.14 7.88
117 -3.81 27.32 115 -2.72 19.67 119 -7.47 28.23 106 -4.64 25.3025 -56.79 78.28 26 -64.02 152.72 16 -96.98 195.78 19 -70.00 167.60
Table A1 — Office Machinery and Computing Equipment (SIC 357) ROA Sample SupersetStrata Sizes, Means, and Standard Deviations
Size Mean S.D. Size Mean S.D. Size Mean S.D. Size Mean S.D.74-78 75-79 76-80 77-81
6 6.00 7.21 1 19.55 9.04 9 13.11 34.29 11 13.83 34.5033 2.11 2.73 38 1.93 4.68 36 1.94 4.75 39 1.88 3.8414 0.58 2.35 12 0.82 0.29 12 1.02 1.53 9 0.82 0.31
78-82 79-83 80-84 81-859 8.62 17.42 22 7.19 13.00 18 7.53 9.08 20 6.80 12.49
53 3.49 15.09 49 1.93 15.21 56 2.73 7.65 66 2.29 2.406 0.76 0.30 10 0.62 1.75 12 0.66 1.69 13 0.28 1.85
82-86 83-87 84-88 85-8919 9.52 27.40 14 8.49 14.98 17 6.84 8.33 22 6.26 37.2371 2.49 2.80 99 2.68 11.65 94 2.68 12.62 98 2.31 12.4913 0.97 0.57 15 0.38 2.31 20 -2.24 17.45 14 -4.86 21.89
86-90 87-91 88-92 89-9323 7.24 37.42 25 6.68 12.39 40 4.88 10.08 30 8.26 23.1497 1.99 11.81 99 1.69 9.14 98 -3.98 117.98 78 1.69 4.1217 -3.21 18.22 19 0.04 2.71 1 -7.09 6.50 11 0.32 1.83
Table A2 — Office Machinery and Computing Equipment (SIC 357) Tobin’s q Sample SupersetStrata Sizes, Means, and Standard Deviations
25
Size Mean S.D. Size Mean S.D. Size Mean S.D. Size Mean S.D.74-78 75-79 76-80 77-81
8 14.75 5.62 6 15.42 4.83 5 16.06 5.19 4 16.75 5.1532 6.86 4.05 30 7.01 4.56 31 6.49 5.91 33 5.91 5.07
7 -10.58 20.47 7 -6.76 16.51 7 -5.69 15.80 5 -7.01 14.9378-82 79-83 80-84 81-85
4 16.63 4.23 6 13.07 5.18 5 12.03 5.12 6 12.89 4.9934 4.16 7.90 28 3.67 5.99 28 3.93 5.50 25 4.53 5.36
3 -2.56 6.41 4 -8.82 32.96 4 -8.81 32.97 4 -9.60 32.9082-86 83-87 84-88 85-89
6 14.94 4.84 6 14.58 3.70 6 13.57 6.43 8 11.64 4.7727 4.53 5.75 27 5.49 5.62 26 4.51 9.28 24 2.37 9.89
3 -16.05 40.42 4 -15.27 36.96 4 -11.13 26.07 3 -53.60 69.1486-90 87-91 88-92 89-93
8 8.58 15.04 4 11.69 5.43 5 13.92 8.84 7 624.62 3864.7824 1.84 8.65 29 -5.77 68.63 28 1.19 10.06 28 0.53 22.52
4 -33.34 40.77 4 -36.69 33.81 6 -72.19 155.04 4 -22.93 37.38
Table A3 — Auto Parts and Accessories (SIC 3714) ROA Sample Superset Strata Sizes, Means,and Standard Deviations
Size Mean S.D. Size Mean S.D. Size Mean S.D. Size Mean S.D.74-78 75-79 76-80 77-81
4 1.93 0.65 7 1.66 0.69 4 2.21 0.79 5 2.03 0.8730 0.81 0.39 23 0.81 0.36 25 0.90 0.26 22 0.86 0.25
4 0.45 0.11 4 0.46 0.10 5 0.38 0.53 6 0.31 0.3278-82 79-83 80-84 81-85
5 2.06 0.89 5 2.16 0.93 6 1.96 0.83 6 2.36 0.9022 0.82 0.32 21 0.91 0.42 22 0.90 0.43 20 1.06 0.50
4 0.25 0.29 5 0.25 0.28 2 0.02 0.28 2 0.17 0.3982-86 83-87 84-88 85-89
6 2.37 0.83 5 2.54 0.86 3 2.88 0.84 3 2.82 0.8717 1.25 0.56 16 1.55 0.65 20 1.71 0.69 20 1.64 0.71
4 0.49 0.43 7 0.59 0.48 8 0.61 0.48 7 0.66 0.3886-90 87-91 88-92 89-93
3 2.50 0.78 7 2.19 0.70 6 2.69 0.99 4 3.63 2.2319 1.45 0.65 17 1.15 0.49 15 1.79 1.54 19 2.00 1.49
9 -0.02 16.68 7 -1.62 17.34 11 -1.40 12.92 8 0.34 0.65
Table A4 — Auto Parts and Accessories (SIC 3714) Tobin’s q Sample Superset Strata Sizes,Means, and Standard Deviations

26
Years N % Agreed Cohen’s kappa
S.E. Approximatez-score
74-78 53 92.45% 0.84132 0.07000 9.90961lll75-79 48 85.42% 0.70186 0.10156 6.54569lll76-80 50 80.00% 0.59217 0.10013 7.23418lll77-81 46 95.65% 0.92434 0.05237 8.28698lll78-82 47 100.00% 1.00000 0.00000 9.07530lll79-83 45 93.33% 0.86540 0.06860 9.12686lll80-84 50 (1) (1)81-85 48 100.00% 1.00000 0.00000 9.00464lll82-86 56 92.86% 0.81488 0.08797 8.22906lll83-87 60 95.00% 0.89853 0.05704 9.39579lll84-88 55 92.73% 0.82315 0.08437 7.98806lll85-89 49 95.92% 0.90180 0.06814 7.70481lll86-90 46 95.65% 0.91418 0.05958 8.03164lll87-91 33 93.93% 0.85806 0.09343 7.50128lll88-92 25 92.00% 0.77273 0.15250 6.38899lll89-93 21 95.24% 0.86538 0.13116 4.80048lllPooled 732 88.80% 0.75617 0.02316 31.97211lll
l p < .05 ll p < .01lll p < .001 (1) Groupings not comparable
Table A5 — Office Machinery and Computing Equipment (SIC 357) ROA Sample StrataCompared to Non-diversified Firms Subsample Strata

27
REFERENCES
Adler, P. S., Riggs, H. E., & Wheelwright, S. C. (1989). Product development know-how: Trading tacticsfor strategy. Sloan Management Review, 31(1), 7-17.
Amit, R., & Livnat, J. (1988). Diversification and the Risk-Return Trade-Off. Academy of ManagementJournal, 31(1), 154-166.
Amit, R., & Schoemaker, P. J. H. (1993). Strategic assets and organizational rent. Strategic ManagementJournal, 14(1), 33-46.
Ansoff, H. I. (1965). Corporate Strategy. New York: McGraw-Hill.
Argresti, A. (1984). Analysis of Ordinal Categorical Data. New York: John Wiley & Sons.
Arrow, K., & Hahn, F. (1970). General Competitive Analysis. San Francisco: Holden Day.
Bain, J. S. (1959). Industrial Organization. New York: Wiley.
Barney, J. B. (1991). Firm resources and sustained competitive advantage. Journal of Management, 17,99-120.
Barney, J. B., & Hoskisson, R. E. (1990). Strategic Groups: Untested Assertions and Research Proposals.Managerial and Decision Economics, 11, 187-198.
Baumol, W. J. (1982). Contestable Markets: An Uprising in the Theory of Industry Structure. AmericanEconomic Review, 72(1), 1-15.
Becker, G. S. (1964). Human capital. New York: Columbia.
Besanko, D., Dranove, D., & Shanley, M. (1996). The economics of strategy. New York: John Wiley &Sons, Inc.
Bowen, H. K., Clark, K. B., Holloway, C. A., & Wheelwright, S. C. (1994). Development projects: Theengine of renewal. Harvard Business Review, 72(5), 110-120.
Caves, R. E., & Porter, M. E. (1977). From Entry Barriers to Mobility Barriers: Conjectural Decisions andContrived Deterrence to New Competition. Quarterly Journal of Economics, 91, 421-441.
Chandler, A. D. (1990). Scale and Scope: The Dynamics of Industrial Capitalism. Cambridge: HarvardUniversity Press.
Collins, J. M., & Ruefli, T. W. (1992). Strategic risk: An ordinal approach. Management Science, 38(12),1707-1731.
Conner, K. R. (1991). A historical comparison of resource-based theory and five schools of thought withinindustrial organization economics: Do we have a new theory of the firm? Journal of Management, 17, 121-154.
28
Cool, K., & Schendel, D. (1988). Performance Differences Among Strategic Group Members. StrategicManagement Journal, 9(3), 207-223.
Cyert, R. M., & March, J. G. (1963). A Behavioral Theory of the Firm. Englewood Cliffs, NJ: Prentice-Hall.
D'Aveni, R. A. (1994). Hypercompetition: Managing the Dynamics of Strategic Maneuvering. New York:The Free Press.
Debreu, G. (1959). The Theory of Value. New York: Wiley.
Fiegenbaum, A., & Thomas, H. (1988). Attitudes Toward Risk and the Risk-Return Paradox: ProspectTheory Explanations. Academy of Management Journal, 31(1), 85-106.
Ghemawat, P. (1986). Sustainable advantage. In C. A. Montgomery & M. E. Porter (Eds.), Strategy:Seeking and Securing Competitive Advantage (pp. 27-38). Cambridge, Mass.: Harvard Business Review.
Hoskisson, R. E., & Hitt, M. A. (1990). Antecedents and performance outcomes of diversification: Areview and critique of theoretical perspectives. Journal of Management, 16(2), 461-509.
Hoskisson, R. E., Hitt, M. A., Johnson, R. A., & Moesel, D. D. (1993). Construct validity of an objective(entropy) categorical measure of diversification strategy. Strategic Management Journal, 14(3), 215-235.
Hunt, M. S. (1972). Competition in the Major Home Appliance Industry 1960-1970. Unpublisheddoctoral dissertation, Harvard University.
Jacobsen, R. (1988). The persistence of abnormal returns. Strategic Management Journal, 9, 415-430.
Jacobson, R. (1992). The 'Austrian' school of strategy. Academy of Management Review, 17(4), 782-807.
Ketchen, D. J., Jr., & Shook, C. L. (1996). The Application of Cluster Analysis in Strategic ManagementResearch: An Analysis and Critique. Strategic Management Journal, 17(6), 441-458.
Klein, B., Crawford, R. G., & Alchian, A. A. (1978). Vertical integration, appropriable rents and thecompetitive contracting process. Journal of Law and Economics, 21, 297-326.
Mason, E. S. (1939). Price and production policies of large-scale enterprise. American Economic Review,29, 61-74.
Mason, E. S. (1949). The current state of the monopoly problem in the United States. Harvard LawReview, 62, 1265-85.
Milgrom, P., & Roberts, J. (1992). Economics, Organization and Management. Englewood Cliffs, NJ:Prentice Hall.
Mueller, D. C. (1986). Profits in the long run. Cambridge: Cambridge University Press.
Nayyar, P. R. (1993). Performance effects of information asymmetry and economies of scope in diversifiedservice firms. Academy of Management Journal, 36(1), 28-57.

29
Nelson, R. R., & Winter, S. G. (1982). An Evolutionary Theory of Economic Change. Cambridge, Mass.:Belknap Press.
Newman, H. H. (1973). Strategic Groups and the Structure/Performance Relationship: A Study withRespect to the Chemical Process Industries. Unpublished doctoral dissertation, Harvard University.
Perfect, S. B., & Wiles, K. W. (1992). Alternative constructions of Tobin's q: An empirical comparison.Unpublished Working Paper, Florida State University.
Porter, M. (1985). Competitive Advantage: Creating and Sustaining Superior Performance. New York:The Free Press.
Porter, M. E. (1973). Consumer Behavior, Retailer Power, and Manufacturer Strategy in ConsumerGoods Industries. Unpublished doctoral dissertation, Harvard University.
Porter, M. E. (1979). The Structure Within Industries and Companies' Performance. Review of Economicsand Statistics, 61(2), 214-227.
Porter, M. E. (1980). Competitive Strategy: Techniques for Analyzing Industries and Competitors. NewYork: The Free Press.
Ricardo, D. (1817). Principles of Political Economy and Taxation. London: J. Murray.
Ruefli, T. W., & Wiggins, R. R. (1994). When mean square error becomes variance: A comment on'Business risk and return: A test of simultaneous relationships'. Management Science, 40(6), 750-759.
Ruefli, T. W., & Wiggins, R. R. (1996). Longitudinal Performance Stratification: An IterativeKolmogorov-Smirnov Approach. Working Paper, IC2 Institute, Austin, TX.
Ruefli, T. W., & Wilson, C. L. (1990). Data considerations and rank statistics. In T. W. Ruefli (Ed.),Ordinal Time Series Analysis (pp. 13-32). New York: Quorum Books.
Rumelt, R. P. (1974). Strategy, Structure, and Economic Performance. Boston: Harvard Business SchoolPress.
Schendel, D. (1994). Introduction to the summer 1994 special issue— ‘Strategy: Search for NewParadigms’. Strategic Management Journal, 15(Summer Special Issue), 1-4.
Schmalensee, R. (1985). Do Markets Differ Much? American Economic Review, 75(3), 341-351.
Schumpeter, J. A. (1934). The Theory of Economic Development. New York: Oxford University Press.
South. (1981). Competitive advantage: The cornerstone of strategic thinking. Journal of Business Strategy,12.
Starbuck, W. H. (1993). Strategizing in the real world. International Journal of Technology Management,8, 77-86.
Stigler, G. J. (1968). The Organization of Industry. Homewood, Ill.: Richard D. Irwin.
Tatsuoka, M. M. (1988). Multivariate Analysis. New York: Macmillan Publishing Company.

30
Teece, D. (1983). Toward an Economic Theory of the Multiproduct Firm. Journal of Economic Behaviorand Organization, 3(1), 38-63.
Teece, D. J. (1980). Economics of scope and the scope of an enterprise. Journal of Economic Behaviorand Organization, 1, 223-247.
Teece, D. J. (1986). Profiting from technological innovation: Implications for Integration, collaboration,licensing, and public policy. Research Policy, 15, 285-305.
Tomer, J. F. (1987). Organizational capital: The path to higher productivity and well-being. New York:Praeger.
Varaiya, N., Kerin, R. A., & Weeks, D. (1987). The relationship between growth, profitability, and firmvalue. Strategic Management Journal, 8, 487-497.
Venkatraman, N., & Prescott, J. E. (1990). Environment-Strategy Coalignment: An Empirical Test of ItsPerformance Implications. Strategic Management Journal, 11(1), 1-23.
Wiggins, R. R. (1995). Sustained Competitive Advantage: Temporal Dynamics and the Myth of SuperiorEconomic Performance. Unpublished Dissertation, University of Texas, Austin.
Wiggins, R. R., & Ruefli, T. W. (1995). Necessary conditions for the predictive validity of strategicgroups: Analysis without reliance on clustering techniques. Academy of Management Journal, 38(6).
Williamson, O. E. (1975). Markets and Hierarchies: Analysis and Antitrust Implications. New York: TheFree Press.