Embed Size (px)
Citation preview

International Symposium on Underground Excavation and Tunnelling 2-4 February 2006, Bangkok, Thailand
Ground Movement Prediction and Building Damage Risk-Assessment for the Deep Excavations and Tunneling Works in Bangkok Subsoil Zaw Zaw Aye1 , Dhiraj Karki2 and Christian Schulz3
1 SEAFCO Public Company, Limited, Bangkok, Thailand, (former employee of JV BCKT) 2 CPG Consultants Pte. Ltd., Singapore, (former employee of JV BCKT) 3 Bilfinger Berger AG , Bangkok Thailand, (former employee of JV BCKT) ABSTRACT This paper presents the methods adopted in prediction of excavation and tunneling induced ground movement and building damage risk-assessment carried out for the Contract No. 1 of the M.R.T Chaloem Ratchamongkhon Line, the first underground mass transit system project of Bangkok. The measured ground and associated movement of the buildings and structures were within predicted values. All deep excavation works and tunneling were successfully completed without any significant damages to the adjacent buildings and structures. 1. PROJECT OVERVIEW The M.R.T Chaloem Ratchamongkhon Line is the first underground mass transit system project in Bangkok developed by the Mass Rapid Transit Authority (MRTA) of Thailand. Total length of the underground structure is 21.5km, comprises of 16 km of twin single-track bored-tunnel, a total of 4 km long18 cut- and-cover stations, a twin 1.5km long cut-and-cover approach tunnel to Depot and other associated structures. The project was commenced in late 1996 and opened for the public in 2004. The Contract No. 1, Underground Structure South - southern portion of this initial system comprising 9 km of twin 6m outside diameter bored tunnels, nine underground stations and cut-and-cover depot approach tunnel, was awarded to the Joint Venture BCKT consisting of Bilfinger + Berger Bauaktiengesellschaft, Ch Karnchang Public Company Limited, Kumagai Gumi Company Limited and Tokyu Construction Company Limited. Figure 1 shows the full length of the Contract No. 1 in simple schematic layout.
One of the major challenges of the Contract No. 1was the need of stacked-alignment for a major portion of twin bored-tunnel underneath Rama IV road, one of the busiest roads of Bangkok, which called for a stacked configuration at 3 stations, Lumpini, Si Lom and Sam Yan. This requirement led the contractor to design and construct the deepest underground structures of Bangkok at Si Lom Station - four-floor stacked-station of 32m deep right under the existing flyover and adjacent to a number of sensitive structures. Deep excavation and bored tunneling works in congested urban environment of Metropolitan Bangkok requires a systematic process of ground movement prediction, building risk damage assessment and protection. This paper presents the methods adopted in prediction of excavation and tunneling induced ground movement and building damage risk-assessment carried out for the Contract No. 1.
281

2. SUBSOIL CONDITIONS Similar to other localities in Bangkok, a typical subsoil profile along the tunnel alignment is characterized by the alternating layers of clay and sand deposits as shown in Figure 1. Weathered crust of 2 m thick is commonly found as the top layer. In urban areas of Bangkok, this layer is covered by fill material. Soft to very soft, highly compressible dark gray marine clay lies beneath weathered crust or fill. Depending on the location, this layer extends up to 12-16 m. About 2 m thick medium clay layer can be observed between soft clay and underlying stiff clay. Generally stiff Clay layer occurs directly underneath medium clay and its depth goes up to 22 m. Below stiff clay layer, first sand layer of 5-8 m thickness can be found. This first sand layer, however, is absent in some areas. Stiff to hard clay layer underlies first sand and it is found to be about 5 m thick. Second sand layer generally occurs at depths between 45 to 65 m. Figure 1. Generalized soil profile along the tunnel alignment and stations 3. OVERVIEW OF GROUND MOVEMENT PREDICTION AND BUILDING DAMAGE
ASSESSMENT PROCESS APPLIED IN THE PROJECT Staged Assessment for each station and tunnel sections was carried out according to the requirement stipulated in the Outline Contract Design Specification (OCDS). Specified references were used as basic literatures in ground movement prediction and building damage assessment. For cut-and-cover excavation zone, the work of Peck (1969) and Clough and O’Rourke (1990) were used whereas published papers of Burland et. al. (1977) and Boscardin & Cording (1989) were applied for bored tunnels. Building damage assessment was carried out in 3 stages; Stage 1 Assessment, Stage 2 Assessment, and Stage 3 Assessment. “Greenfield Site” assumption was adopted in Stage 1 and 2
282

Assessment ignoring any influence of the stiffness of the structure and type of supporting foundation. Stage 2 Assessment was further extended by Additional Stage 2 Assessment. In Additional Stage 2 assessment, the variation of settlement trough shape and magnitude with depth were considered in identifying the risk of building damage. In Stage 3 assessment, a detailed qualitative assessment of structure and vulnerability of each building or structure to damage were taken into account, coupled with detailed structural analysis in assessing the buildings falling in risk category 3 classified by Mair et. al. (1996). Table 1. Building Damage Classification (after Burland et. al., 1977 and Boscarding and Cording, 1989)
Risk Category
Degree of Damage
Description of Typical Damage Approximate Crack Width
(mm)
Max. Tensile
Strain % 0 Negligible Hairline cracks
Less than
0.05 1
Very Slight Fine cracks easily treated during normal decoration
0.1 to 1 0.05 to 0.075
2
Slight
Cracks easily filled. Several slight fractures inside building. Exterior cracks visible.
1 to 5 0.075 to 0.15
3
Moderate Cracks may require cutting out and patching. Door and windows sticking.
5 to 15 or a number of cracks greater than 3
0.15 to 0.3
4
Severe Extensive repair involving removal and replacement of walls, especially over doors and windows. Windows and door frames distorted. Floor slopes noticeably.
15 to 25 but also depends on number of cracks
Greater than 0.3
5
Very Severe
Major repair required involving partial or complete reconstruction. Danger of instability.
Greater than 25 but depends on number of cracks
4. SUMMARY OF GEOTECHNICAL INSTRUMENTATIONS Instrumentation played a major role in the construction of this first underground mass transit system project in congestive urban area with difficult soil condition. The primary objective of the instrumentation program was to monitor the performance of the deep excavation and tunneling operation to ensure safe execution of the construction works and that adjacent structures were not adversely affected. Furthermore, the instrumentation program was established to provide feedback in application of the observational method. Extensive sets of instrumentation were installed around the predefined influence zones of station box excavation, tunneling and associated building, structures and utilities. In addition to other geotechnical instruments, inclinometers, extensometers, various types of settlement points, tile-meter, crack meter and crack gauge were installed to monitor the ground and associated building and structures movement. 5. BUILDING CONDITION SURVEY Prior to commencement of the major works, all the existing buildings and structures within the predefined influence zone were systematically surveyed. The primary objectives of the surveys were;
• To record pre-construction status of all buildings and structures within the influence zone. The records included were age of building, building type, storey height, expected foundation types, visible defects supported by sketches and photographs as appropriate
283

• To utilize the information collected from the building / structure condition survey in the assessment of the buildings and evaluate sensitive structures with respect to construction aspects and monitoring
• To establish a benchmark to monitor the possible effect of construction. Expected foundation types of different buildings were classified based on the height, number of floors and age of the buildings. Building survey information was also used to identify the types of instrumentation required.
6. PREDICTION OF GROUND MOVEMENT INDUCED BY STATION EXCAVATION WORKS AND BUILDING DAMAGE ASSESSMENT 6.1 Prediction of ground movement induced by station excavation Surface settlement induced by station excavation was predicted based on the dimensionless design settlement profile behind the earth-retaining structures. The dimensionless design settlement profile was developed from the results of various prediction methods such as numerical analysis carried out by CRISP program, method proposed by Bowels (1990) and Clough & O’Rourke (1990). 6.2 Stage 1Assessment Based on the calculated surface settlement described above, contours of settlement around the station and associated underground structures were plotted in the topographic plan with buildings and other structures. Figure 2 depicts the surface settlement contours prepared for one of the stations.
ENTRANCE C
ENTRANCE A ENTRANCE B
10
30
20
40
STATION
Figure 2. Settlement contour in station excavation zone prepared for stage 1 assessment
Buildings falling outside 10mm settlement contour were eliminated from further assessment. Remaining buildings with settlement greater than 10mm were short-listed for Stage 2 Assessment.
284

6.3 Stage 2 Assessment The dimensionless settlement profile for the station box construction were fitted using a polynomial curve to identify the point of inflexion and divide the settlement profile into sagging and hogging zone and calculated the tensile strain induced in the buildings from excavation works using the method proposed by Mair et. al. (1996). The results were then used to identify the category of risk to damage according to the classification of Building Damage Classification presented in Table 1. Buildings classified within “Slight” risk category of damage were eliminated from further assessment. Buildings falling into “Moderate” or higher risk category of damage were further evaluated. 6.4 Additional Stage 2 Assessment The settlement estimated in Second Stage Assessment presented above was based on surface movement. For the buildings located in close proximity to the excavation founded on piles, it was considered that subsurface settlement may be more critical. Stage 2 Assessment was then further extended by Additional Stage 2 Assessment in which the variation of settlement trough shape and magnitude with depth were considered in identifying the risk of building damage. Settlement of the buildings due to the excavation works were predicted assuming the “green filed” condition. Neglecting restraints from foundation and structure, it was assumed that buildings follow the ground settlement trough at foundation level (estimated pile tip level).
Available methods were further reviewed for predicting the surface settlement with the consideration of two main factors; (1) simple and practical in application (2) enable to correlate with the predicted and measured diaphragm wall deflection. The method proposed by Bowels (1988) was selected as it meets the required criteria mentioned above. Bowels suggested the ground settlement induced by excavation as a function of ground loss due to the deflection of the retaining wall. Bowel demonstrated the calculation of settlements at specified distance by assuming parabolic variations of settlement within the influence distance. Using predicted diaphragm wall deflection, surface settlement behind the wall was computed by empirical formulas proposed by Bowels. 6.4.1 Prediction of vertical sub-surface settlement A simplified prediction of subsurface settlement was carried out based on the calculated surface settlement described above. First, subsurface settlement influence line was constructed. As shown in Figure 3, settlement influence zone is assumed to decrease with depth from “Do” at the surface and zero at the wall toe. With the assumption of linear relationship between the volume of deflected wall shape and the volume of settlement trough at any depth within settlement influence zone, subsurface settlement at different depths were calculated.
XD = H + WO W
D-wall
HEHW
Y
Total deflectedshape volume, V O
SWO Sio
SiySwy
Surface settlement troughvolume, V To
Sub-surface settlementtrough volume, VTy
deflected volumn V at depth (H - Y)Settlementinfluence zone
y w
W
Dy
O
TOYTY V
VVV *=
W
OY H
DYD *=
2
* ⎟⎟⎠
⎞⎜⎜⎝
⎛=
OWOio D
xSS
O
OWO D
VS 4=
Do = 2.5 HE
Figure 3. Demonstration of subsurface settlement prediction from diaphragm wall deflection values
285

Based on the polynomial curve developed in Stage 2 Assessment, subsurface settlement can be
predicted by the similar approach described above. 6.4.2 Prediction of subsurface horizontal ground movement Assuming a simple linear distribution of horizontal ground movement with distance, prediction method for sub-surface horizontal ground movement was developed. The influence distance of horizontal displacement behind the diaphragm wall was assumed to be 2.5 Hg at ground level as shown in Figure 4. The influence depth of horizontal displacement is a depth at zero diaphragm wall deflection, Hw, which can be obtained by extrapolating the diaphragm wall deflection profile. Horizontal ground movement influence zone was constructed by connecting the end points of Do and Hw as shown in the figure. Horizontal displacement is assumed to decrease linearly with distance, maximum at wall face and zero at end of influence zone.
WiW
OOi H
HDD *=
iWWi ZHH −=
Oi
iOihwihi D
XDSS −= *
Shi Shwi
Limit of influence zone
Zi z
Hg
Hw
Hw
i
y
Doi
Shi Shwi
Do = 2.5 Hg
DoiXi
D-wall
Deflection curve extrapolated to zero
Figure 4 Demonstration of subsurface horizontal movement prediction from diaphragm wall deflection values 6.4.2.1 Risk of damage based on maximum tensile strain Based on the polynomial curve developed in Stage 2 Assessment and predicted subsurface ground movement using method described in section 6.3.1, maximum tensile strain of the building was predicted applying the method proposed by Mair et. al. (1996). Risk category of to the building was then classified according to Table 1. 6.4.2.2 Risk of damage specified by angular distortion and horizontal strain The chart proposed by Boscarding and Cording (1989), was used to determine the potential damage of the building. The chart is a simple tow-dimensional plot of horizontal strains versus angular distortion in which zones of potential damage to buildings are mapped. Angular distortion (β) was calculated based on the difference between predicted settlement of building one edge to another or two adjacent foundation supports. Subsurface settlement at pile toe level was used in determining angular distortion.
β = (SV1 – SV2) / L
SV1 = vertical displacement at one end of the building SV2 = vertical displacement at other end of the building L = building length
286

Horizontal strain induced by excavation was predicted assuming horizontal ground movements at surface level decrease linearly with distance, maximum at excavation wall and zero at end of influence zone. Average horizontal strain of the building can be computed by ;
∈h = (Sh1 – Sh2) / L
where, ∈h = average horizontal strain of building Sh1 = horizontal displacement at surface at one end of the building Sh2 = horizontal displacement at surface at other end of the building L = building length
Table 2 shows the summarized results of risk category obtained from two different methods
described above and assumed foundation types (without and with pile). Table 2. Summary of risk category obtained from two different methods and foundation type
Risk category by maximum tensile
strain
Risk category by chart of Boscarding and Cording (1989)
Building Block
No. of stories
Building Type
Estimated Pile Length
Distance to edge of wall
Without pile
With pile
Without pile
With pile
A 2 Masonry / Concrete
7-14m 18m 0 0 1 2
B 2 Masonry / Concrete
7-14m 17.5m 0 0 1 2
C 2 Masonry / Concrete
7-14m 32m 0 1 1 2
D 1 Masonry / Concrete
< 6m 2m 1 1 1 2
E 37 RC 50m 8m - 0 - 0
The predicted degree of damage of the buildings using simplified chart is more critical than that of maximum tensile strain method as can be seen in above table. According to the results obtained from of simplified chart, predicted degree of damage was higher if buildings were assumed to be with piled foundation rather than without piled foundation. 6.5 Third Stage Assessment Examples of the buildings and structures that required the stage 3 assessment as a result of Stage 2 assessment are listed below. Table 3. The buildings required Stage 3 Assessment in station excavation zones
No. of Storey / Building Type
Preliminary Estimated Pile Length
Stage 2 Calculated Total Tensile Strain (%)
Risk Category / Degree of Damage
4 / RC* 8m 0.121 % 2 / Slight 22 / RC >22m 0.159 % 3 / Moderate 4 / RC 7-14m 0.197 % 3 / Moderate
2 / Steel Frame 15-22m 0.288 % 3 / Moderate 5 / RC, Masonry 15-22m 0.166 % 3 / Moderate 2 / RC, Masonry <6m 0.29 % 3 / Moderate 3 / RC, Masonry 7-14m 0.242 % 3 / Moderate 1 / RC, Masonry ≤ 6m 0.191 % 3 / Moderate
* Stage 3 Assessment of this building was required due to the pre-existing damage of the building.
287

A process of Stage 3 Damage Assessment involved;
• Collection of the record of pre-construction defects/damages of the building from Building Condition Survey Reports
• Conducting detailed structural Survey and assessing the current state of the building • Condcuting damage assessment 6.5.1 Collection of building condition survey The building condition survey records were collected and primary review of the state of the building prior to commencement of construction works. 6.5.2 Detailed Structure Survey In order to understand the building response to the ground movement and to carry out the qualitative damage assessment of the building, details of the structure should be known in advance. A structural survey was carried out by experienced structural engineer to obtain the detailed information of structural members. 6.5.3 Damage Assessment Structural survey information was the key factor in the selection of methodology for the Stage 3 Assessment. Based on the pre-construction state building condition survey and detailed structural survery, the method for damage assessment was selected. Two main approaches were applied.
• Conservative approach, mainly applied in additional stage 2 assessment with some refinements
• Frame analysis using FEM structural software 6.5.3.1 Stage 3 Assessment by conservative approach Conservative approach applied in Stage 3 Assessment involved consideration of two separate criteria, namely ; • The risk of damage to the building specified by angular distortion and horizontal strain. • The risk of damage to the building in terms of magnitude of building slope with reference to the
limiting values specified by various researchers. The following assumptions were made in the conservative approach of Stage 3 assessment.
• Buidling movement is influence by excavation induced settlement of both main station box and associated underground structures (e.g. Entrance Building)
• Building settlement was casued by subsurface settlement at foundation level as buildings are supported by piled foundation.
• No allowance was made for structural stiffness of the building. • No allowance was made for possible effects of soil-structure interaction.
A summary of risk category determination in Stage 3 Assessment based on the predicted and monitored settlement of the building adjacent to station excavation work is shown in the Table 4 below.
288
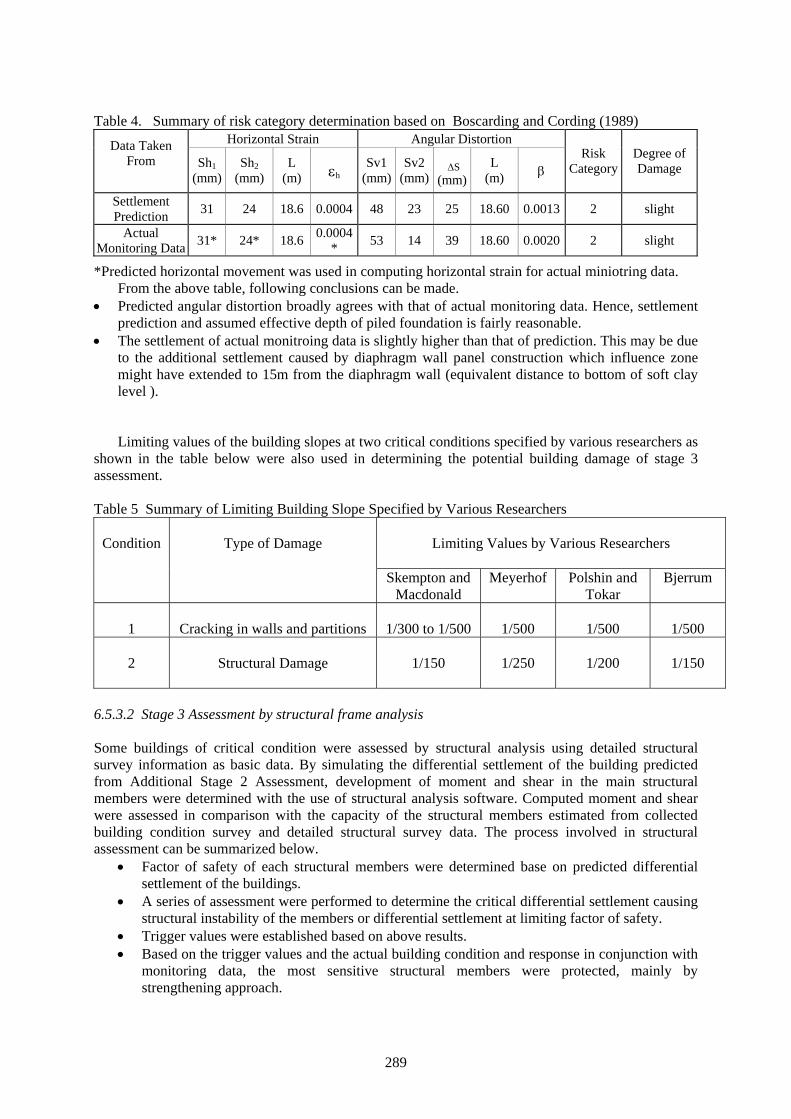
Table 4. Summary of risk category determination based on Boscarding and Cording (1989) Horizontal Strain Angular Distortion Data Taken
From
Sh1(mm)
Sh2(mm)
L (m) εh
Sv1 (mm)
Sv2 (mm)
∆S(mm)
L (m) β
Risk Category
Degree of Damage
Settlement Prediction 31 24 18.6 0.0004 48 23 25 18.60 0.0013 2 slight
Actual Monitoring Data 31* 24* 18.6 0.0004
* 53 14 39 18.60 0.0020 2 slight
*Predicted horizontal movement was used in computing horizontal strain for actual miniotring data. From the above table, following conclusions can be made.
• Predicted angular distortion broadly agrees with that of actual monitoring data. Hence, settlement prediction and assumed effective depth of piled foundation is fairly reasonable.
• The settlement of actual monitroing data is slightly higher than that of prediction. This may be due to the additional settlement caused by diaphragm wall panel construction which influence zone might have extended to 15m from the diaphragm wall (equivalent distance to bottom of soft clay level ).
Limiting values of the building slopes at two critical conditions specified by various researchers as shown in the table below were also used in determining the potential building damage of stage 3 assessment. Table 5 Summary of Limiting Building Slope Specified by Various Researchers
Limiting Values by Various Researchers
Condition
Type of Damage
Skempton and Macdonald
Meyerhof Polshin and Tokar
Bjerrum
1
Cracking in walls and partitions
1/300 to 1/500
1/500
1/500
1/500
2
Structural Damage
1/150
1/250
1/200
1/150
6.5.3.2 Stage 3 Assessment by structural frame analysis Some buildings of critical condition were assessed by structural analysis using detailed structural survey information as basic data. By simulating the differential settlement of the building predicted from Additional Stage 2 Assessment, development of moment and shear in the main structural members were determined with the use of structural analysis software. Computed moment and shear were assessed in comparison with the capacity of the structural members estimated from collected building condition survey and detailed structural survey data. The process involved in structural assessment can be summarized below.
• Factor of safety of each structural members were determined base on predicted differential settlement of the buildings.
• A series of assessment were performed to determine the critical differential settlement causing structural instability of the members or differential settlement at limiting factor of safety.
• Trigger values were established based on above results. • Based on the trigger values and the actual building condition and response in conjunction with
monitoring data, the most sensitive structural members were protected, mainly by strengthening approach.
289

6.5.4 Requirement of Stage 3 Assessment for bridge structures Due to the close proximity to the adjacent station, the predicted maximum settlement in the Stage 1 Assessment of the flyover and elevated expressway structures was greater than 10mm. Therefore, further assessment using Stage 2 approach was required. However, since flyovers and elevated expressways are bridge structure with piled foundations, the approach of strain calculations used in Stage 2 Assessment was considered inappropriate and they were placed under the requirement of the Stage 3 Assessment as listed in Table 6.
Table 6. List of Flyovers / Bridges required for Stage 3 Assessment
Location Name of the Bridge / Flyover
Type of bridge Foundation Type
Hua Lamphong Second Stage Expressway Steel Deep-seated bored pile
Sam Yan Thai-Japan Flyover Steel Deep-seated bored pile
Si Lom Thai-Japan Flyover Steel Deep-seated bored pile
Lumphini Thai-Belgium Flyover Steel Deep-seated bored pile
Phetchaburi Asok Flyover Steel Pre-cast pile
Stage 3 Assessments of above listed bridges were carried out by soil-structure interaction analysis using finite element method. FEM Analyses were mainly carried out by in-house design team consisted of experience geotechnical engineers of Tokyu Construction Company Limited. Two-dimensional non-linear soil model applying Duncan-Chang parameters was employed. The process involved in soil-structure analysis is presented in diagram as shown in Figure 5.
Non-linear Elastic Analysis Pile Assessment
Applied response displacement method
Superstructure assessment
Structures Ground Properties Construction Sequence
Assign Data and Conditions for Analysis
Finite Element Analysis
Distribution of movement of the ground surface
Distribution of horizontal ground movement along piles
Calculation of vertical and horizontal movement of the piers Structural analysis
Assessment based on
differential Settlement criteria
Assessment based on
horizontal movement criteria
Verification of RC section of pile
Figure 5. Diagram showing process of stage 3 assessment for bridge structure
290

Among the bridges listed in Table 6, impact of excavation work on the structure of Petchaburi flyover was considered the most critical due to its close proximity to the diaphragm wall and having relatively less rigid and shallower foundation of pre-cast piles. Detailed structural assessment of the existing pre-cast piles of the flyover was performed using results of FEM and verified with structural capacities of the piles calculated from the available as-built drawings. Predicted differential settlement of two adjacent piers (pier close to diaphragm wall and pier away from diaphragm wall) caused by subsurface settlement at pile toe level was used to calculate the angular distortion of the flyover superstructure and compared with the tolerable angular distortion specified by for simple span bridge. Predicted angular distortion (0.0003) was much lower than specified tolerable value of ASSHTO (0.005). Predicted horizontal movement of flyover piers were 10mm and 12mm for left and right pier (of Figure 6) respectively. Tolerable horizontal movement of flyover structure based on the observations of actual bridge performance from the works of various researchers (extracted from Xanthakos, 1995) are shown in Table 7. Table 7. Tolerable horizontal movement of bridge recommended by various researchers
Horizontal Movement (mm)
Recommendation Recommended by
25 Not harmful Bozozuk (1978) 38 Tolerable in most cases Moulton et. al. (1985) 51 Harmful but tolerable Bozozuk (1978)
Extensive sets of instrumentation were installed including tilt meter, settlement points and
inclinometers. Monitoring was carried out in high frequency during critical stage of excavation and compared with established trigger values. Figure 6. Cross-section of Petchaburi Station diaphragm wall showing the position of adjacent flyover foundations 7. PREDICTION OF GROUND MOVEMENT INDUCED BY TUNNELING AND RISK ASSESSMENT 7. 1 Prediction of surface settlement The Gaussian normal distribution curve developed by Peck (1969), O’Reilly and New (1982) was used to estimate the ground settlement induced by a single tunnel.
291

7.2 Stage 1 Assessment First stage assessment of the risk of damage to buildings and structures in tunneling zones involved preparation of settlement profile induced by tunnel excavation. Settlement was computed at every 100m interval along tunnel alignment using the method based on Gaussian normal distribution curve presented above. Settlement induced by each tunnel (north and south bound) was predicted independently and then superimposed to determine the total settlement induced by the twin tunnels. 10mm and 25mm settlement contours were plotted in the topographic plan with buildings and other structures including flyover and khlong bridges in the tunnel alignment. Buildings falling outside 10mm settlement contours were eliminated from further assessment. Remaining buildings with settlement greater than 10mm were short-listed for stage 2 assessment. 7. 3 Stage 2 Assessment The buildings and structures short-listed in stage 1 were assessed in this stage. Stage 2 assessment involves calculation of maximum tensile strain induced in the building and structures due to tunnel boring and classification of risk category. Risk category of the buildings was determined applying the method proposed by Mair et. al. (1996), similar to the building damage assessment made for excavation induced settlement presented in earlier sections. 7. 4 Additional Stage 2 Assessment in tunnel zones As most of the buildings and structures in Bangkok along tunnel alignment are supported by piled foundations, it was considered that Stage 2 Assessment using surface settlement profile might be insufficient. Hence, Additional Stage 2 Assessment considering the variation of settlement trough shape and magnitude with depth (subsurface settlement) was carried out for the critical buildings. In general, subsurface settlement trough will be narrower and steeper than those of the surface as shown in the sketch below. A simple approach was used in predicting the subsurface settlement profile with following assumptions.
(1) The shape of the subsurface settlement profile caused by the tunnel construction is characterized by a Gaussian distribution similar to surface settlement profile.
(2) The ground settlement influence line for tunnel in clay is the same for subsurface as shown in the figure below:
Figure 7. Distribution of surface and subsurface settlement induced by tunnel boring
292

Therefore, substituting the distance above the tunnel axis Z0-Z for Z0, equations derived from Gaussian normal distribution curve subsurface settlement profile was determined. In addition to this method following equation can also be used to predict the subsurface settlement. K’ = [0.14+0.26(1-z/z0)] / (1-z/z0) By substituting K’ values for K in equation derived from Gaussian normal distribution curve the subsurface settlement at required depth can be calculated. 7. 5 Stage 3 Assessment 7.5.1 Stage 3 Assessment for the buildings The method used in Stage 3 Assessment of the buildings in tunnel zone was similar to that of station excavation zone based on the superimposed predicted subsurface settlement trough induced by twin tunnels. 7.5.2 Structures Required for Stage 3 Assessment The most critical structure required for Stage 3 Assessment were MWA main water tunnel as tunnel alignment crosses the water tunnels at two critical locations – the first near Rama IV and Rachadaphisek road intersection and the second at Rama IV and Siphraya road intersection near Sam Yan station. The position of water tunnels in relation to MRT tunnels drawn in the subsoil profile at relevant locations are presented in Figure 8 and 9. Figure 8. Position of MWA water tunnel in relation to MRT tunnels (clear distance are 3.38m and 3.18m for North and South bound respectively) at the first crossing
According to the available information, MWA tunnel at the first crossing is of 2.5m internal diameter steel lining with 150mm segmental ring and at the second crossing MWA tunnel is of 2.5m diameter segmental ring with lightly reinforced concrete lining.
In preliminary stage 3 assessment, based on the predicted subsurface profile using the method described in earlier section, structural assessment of water main was carried out and results were compared with structural capacity of water tunnel calculated from the material properties indicated in the construction drawings provided by MWA. As bending moment induced in the water tunnel was considered critical parameter in assessing the damage which is governed by both maximum settlement and curvature of the water tunnel further assessment was proposed.
293
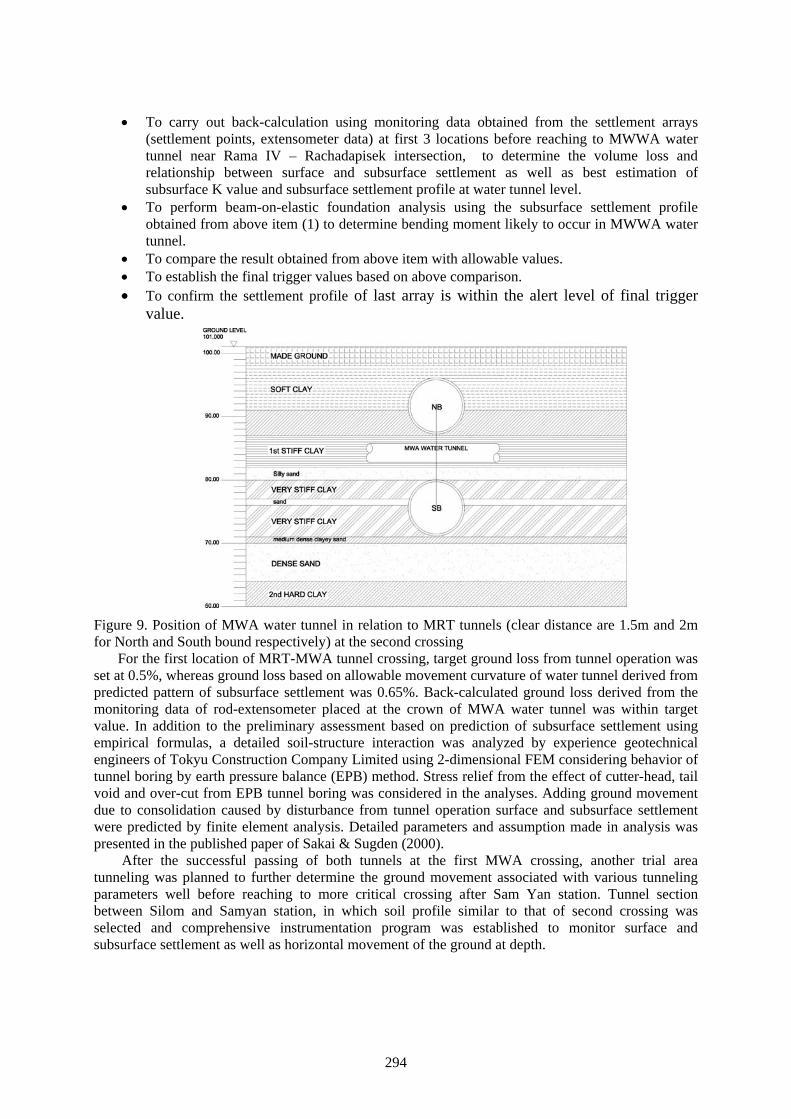
• To carry out back-calculation using monitoring data obtained from the settlement arrays (settlement points, extensometer data) at first 3 locations before reaching to MWWA water tunnel near Rama IV – Rachadapisek intersection, to determine the volume loss and relationship between surface and subsurface settlement as well as best estimation of subsurface K value and subsurface settlement profile at water tunnel level.
• To perform beam-on-elastic foundation analysis using the subsurface settlement profile obtained from above item (1) to determine bending moment likely to occur in MWWA water tunnel.
• To compare the result obtained from above item with allowable values. • To establish the final trigger values based on above comparison. • To confirm the settlement profile of last array is within the alert level of final trigger
value. Figure 9. Position of MWA water tunnel in relation to MRT tunnels (clear distance are 1.5m and 2m for North and South bound respectively) at the second crossing
For the first location of MRT-MWA tunnel crossing, target ground loss from tunnel operation was set at 0.5%, whereas ground loss based on allowable movement curvature of water tunnel derived from predicted pattern of subsurface settlement was 0.65%. Back-calculated ground loss derived from the monitoring data of rod-extensometer placed at the crown of MWA water tunnel was within target value. In addition to the preliminary assessment based on prediction of subsurface settlement using empirical formulas, a detailed soil-structure interaction was analyzed by experience geotechnical engineers of Tokyu Construction Company Limited using 2-dimensional FEM considering behavior of tunnel boring by earth pressure balance (EPB) method. Stress relief from the effect of cutter-head, tail void and over-cut from EPB tunnel boring was considered in the analyses. Adding ground movement due to consolidation caused by disturbance from tunnel operation surface and subsurface settlement were predicted by finite element analysis. Detailed parameters and assumption made in analysis was presented in the published paper of Sakai & Sugden (2000).
After the successful passing of both tunnels at the first MWA crossing, another trial area tunneling was planned to further determine the ground movement associated with various tunneling parameters well before reaching to more critical crossing after Sam Yan station. Tunnel section between Silom and Samyan station, in which soil profile similar to that of second crossing was selected and comprehensive instrumentation program was established to monitor surface and subsurface settlement as well as horizontal movement of the ground at depth.
294
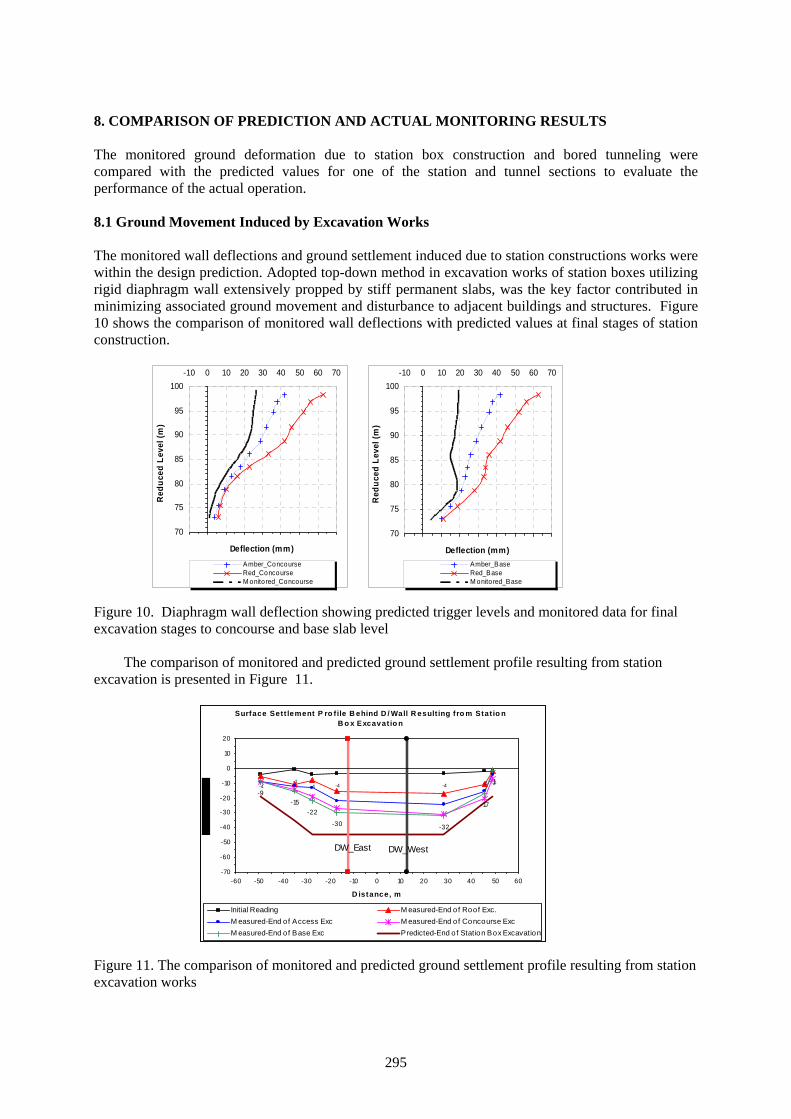
8. COMPARISON OF PREDICTION AND ACTUAL MONITORING RESULTS The monitored ground deformation due to station box construction and bored tunneling were compared with the predicted values for one of the station and tunnel sections to evaluate the performance of the actual operation. 8.1 Ground Movement Induced by Excavation Works The monitored wall deflections and ground settlement induced due to station constructions works were within the design prediction. Adopted top-down method in excavation works of station boxes utilizing rigid diaphragm wall extensively propped by stiff permanent slabs, was the key factor contributed in minimizing associated ground movement and disturbance to adjacent buildings and structures. Figure 10 shows the comparison of monitored wall deflections with predicted values at final stages of station construction.
70
75
80
85
90
95
100-10 0 10 20 30 40 50 60 70
Deflection (mm)
Red
uced
Lev
el (m
)
Amber_BaseRed_BaseM onitored_Base
70
75
80
85
90
95
100-10 0 10 20 30 40 50 60 70
Deflection (mm)
Red
uced
Lev
el (m
)
Amber_ConcourseRed_ConcourseM onitored_Concourse
Figure 10. Diaphragm wall deflection showing predicted trigger levels and monitored data for final excavation stages to concourse and base slab level
The comparison of monitored and predicted ground settlement profile resulting from station excavation is presented in Figure 11. Surface Sett lement P ro file B ehind D / Wall R esult ing f ro m Stat io n
B o x Excavat io n
-4-1
-4 -4 -4 -2 -2
-9-15
-22
-30 -32
-17
-1
DW_East DW_West
-70
-60
-50
-40
-30
-20
-10
0
10
20
-60 -50 -40 -30 -20 -10 0 10 20 30 40 50 60
D istance, m
Initial Reading M easured-End o f Roof Exc.M easured-End of Access Exc M easured-End o f Concourse ExcM easured-End of Base Exc Predicted-End o f Station Box Excavation
Figure 11. The comparison of monitored and predicted ground settlement profile resulting from station excavation works
295

8.2 Ground Movement Induced by Tunneling Works The observed ground movement induced by tunneling works were within predicted values. Well organized plan, systematic approach of observational method to achieve control values backup by extensive instrumentation and close co-operation among relevant personnel were the key factors contributed to successful completion of EPB tunneling particularly in the most sensitive points at MWA water tunnel crossings. The monitored ground settlement profile in the most critical section of parallel twin tunnel between Petchaburi and Sukhumvit station is presented in Figure 12. As can be seen in the figure monitored settlement profile was within that of prediction. The volume loss due to tunneling works in this tunnel zone was back calculated using the monitored profile and found less than 2% and is typically in the range of 1.1% to 1.7%. T ransverse Sett lement T ro ugh due to
T unnel B o ring, P etchaburi-Sukhumvit T unnel
NB SB-70
-60
-50
-40
-30
-20
-10
0
10
20
-25 -20 -15 -10 -5 0 5 10 15 20 25
D istance, m
MonitoredPredicted
Figure 12. Predicted and observed ground settlement profile due to tunnel boring
-50
-30
-10
0 10 20 30 40 50 60 70 80 90
Distance (m)
Settlement _ NB Tunnel
Settlement_SB Tunnel
Total SettlementSubs
urfa
ce S
ettle
men
t (m
m)
Figure 13. Predicted subsurface settlement trough of assumed ground loss 1% calculated from empirical formula and actual subsurface settlement (indicated by dark-circle) observed from rod extensometer
296

9. CONCLUSION The M.R.T Chaloem Ratchamongkhon Line, one of the most modern underground mass transit systems in the region was successfully completed and has been in operation for over 1 year. Ground movement prediction and the detailed stage assessment carried out in the M.R.T Chaloem Ratchamongkhon Line are presented. The measured ground and associated movement of the buildings and structures were within predicted values. All deep excavation works and tunneling were successfully completed without any significant damages to the adjacent buildings and structures. Well organized plan, systematic approach of observational method to achieve control values backup by extensive instrumentation and close co-operation among relevant personnel were the key factors contributed to successful completion of the project. The purpose of this paper however is not to extol success but to provide a set of technical guidelines for ground movement prediction and building damage risk assessment of deep excavation and tunneling works in Bangkok subsoil which may partly serve as a reference for the future underground mass transit system projects in urban area of Bangkok. Successful completion of the first MRT project in Bangkok marked the practicality of well-executed deep excavation works and tunneling by EPB method in protecting the sensitive urban environment. ACKNOWLEDGEMENT The authors wish to express their appreciation to Mass Rapid Transit Authority (MRTA) for permission to publish this paper. The authors would like to thank Construction Supervision Consultants (CSC 1 Consortium) and Project Management Consultant (MPMC) for their cooperation. Valuable advice and support given by Dr. D. J. Maconochie (CSC Consortium) and Mr. A. J. Polley (former geotechnical advisor, Sindhu Maunsell Consultants) are gratefully acknowledge. REFERENCES Boscarding, M.D. and Cording, E.G. (1989), Building Response to Excavation-Induced Settlement.
Journal of Geotechnical Engineering, ASCE, 115;1;1-21. Bowels J.E (1988) Foundation Analysis and Design, 4th Edition, McGRAW-Hill International Book
Company, Singapore, 1988. Burland, J.B., and Wroth, C.P. (1974), Settlement of Buildings and Associated Damage. SOA
Review, Conference on Settlement of Structures, Cambridge, Pentech Press. London, pp. 611-654.
Burland J.B., Broms J.B. and de Mello VFB (1977), Behavior of Foundations and Structures, SOA Report Session 2, Proceedings of 9th International Conference, SMFE, Tokyo, 2:495-546.
Clough, G.W., and O’Rourke, T.D., (1990), Construction Induced Movements of In-situ Walls, ASCE Geotechnical Special Publication No. 25, pp. 439-470.
Clough C.W. and T.D. O’Rourke (1990), Deep Excavation and Tunneling, 7th ICSME, Mexico City JV BCKT, (1997) Geotechnical Interpretation Report (GIR) for MRTA Initial System - UGS,
Bangkok. Mair, R.J., Taylor, R.N., and Burland, J.B., (1996), Prediction of Ground Movements and
Assessment of Risk of Building Damage. Geotechnical Aspects of Underground Construction in Soft Ground, pp. 712-718, Balkema, Rotterdam.
O’Reilly M.P and New B.M (1982), Settlements above tunnels in United Kingdom – their magnitude and prediction, Tunneling ’82, pp. 173-181, London, IMM.
Peck R.B. , (1969) Deep Excavation and Tunneling in Soft Ground, 7th ICSME, Mexico City, State of the Art 3, 225-290.
Petros P. Xanthakos (1995) Bridge Substructure and Foundation Design, Prentice Hall PTR, USA, 1995.
297


![D]Q)### D]Q*### D]Q2### · 2020. 1. 10. · õ õ T T T T T T T T T4 #P$) Ú s j n # ¯ õ õ T T T T T T T T $*#P$, Ú m 3 q n 3 c [ ¯ õ õ T T T T T T T T T T T $. Ú s ÷ Æ](https://img.pdfslide.us/doc/110x75/60ccfb0c192ea8696a7b5b30/dq-dq-dq2-2020-1-10-t-t-t-t-t-t-t-t-t4-p-s-j-n-.jpg)