Embed Size (px)
Citation preview
HP Operations Smart Plug-in for Systems Infrastructure
for HP Operations Manager for Windows®, HP-UX, Linux, and Solaris operating systems
Software Version: 1.60
User Guide
Beta Document Release Date: May 2010Beta Software Release Date: May 2010
Legal Notices
Warranty
The only warranties for HP products and services are set forth in the express warranty statements accompanying such products and services. Nothing herein should be construed as constituting an additional warranty. HP shall not be liable for technical or editorial errors or omissions contained herein.
The information contained herein is subject to change without notice.
Restricted Rights Legend
Confidential computer software. Valid license from HP required for possession, use or copying. Consistent with FAR 12.211 and 12.212, Commercial Computer Software, Computer Software Documentation, and Technical Data for Commercial Items are licensed to the U.S. Government under vendor's standard commercial license.
Copyright Notices
© Copyright 2009- 2010 Hewlett-Packard Development Company, L.P.
Trademark Notices
Microsoft® and Windows® are U.S. registered trademarks of Microsoft Corporation.
UNIX® is a registered trademark of The Open Group.
Adobe®, Acrobat® and PostScript® are trademarks of Adobe Systems Incorporated.
Java™ and all Java based trademarks and logos are trademarks or registered trademarks of Sun.
2
Documentation Updates
The title page of this document contains the following identifying information:
• Software Version number, which indicates the software version.
• Document Release Date, which changes each time the document is updated.
• Software Release Date, which indicates the release date of this version of the software.
To check for recent updates or to verify that you are using the most recent edition of a document, go to:
http://h20230.www2.hp.com/selfsolve/manuals
This site requires that you register for an HP Passport and sign in. To register for an HP Passport ID, go to:
http://h20229.www2.hp.com/passport-registration.html
Or click the New users - please register link on the HP Passport login page.
You will also receive updated or new editions if you subscribe to the appropriate product support service. Contact your HP sales representative for details.
3
Support
Visit the HP Software Support Online web site at:
www.hp.com/go/hpsoftwaresupport
This web site provides contact information and details about the products, services, and support that HP Software offers.
HP Software online support provides customer self-solve capabilities. It provides a fast and efficient way to access interactive technical support tools needed to manage your business. As a valued support customer, you can benefit by using the support web site to:
• Search for knowledge documents of interest
• Submit and track support cases and enhancement requests
• Download software patches
• Manage support contracts
• Look up HP support contacts
• Review information about available services
• Enter into discussions with other software customers
• Research and register for software training
Most of the support areas require that you register as an HP Passport user and sign in. Many also require a support contract. To register for an HP Passport ID, go to:
http://h20229.www2.hp.com/passport-registration.html
To find more information about access levels, go to:
http://h20230.www2.hp.com/new_access_levels.jsp
4
Contents
1 Conventions Used in this Document . . . . . . . . . . . . . . . . . . . . . . . . . . . . . . . . . . . . . . . . . . . . . . . . . . . . . . 7
2 Introduction . . . . . . . . . . . . . . . . . . . . . . . . . . . . . . . . . . . . . . . . . . . . . . . . . . . . . . . . . . . . . . . . . . . . . . . . . . . 9
3 Systems Infrastructure SPI Components . . . . . . . . . . . . . . . . . . . . . . . . . . . . . . . . . . . . . . . . . . . . . . . . . . 11
Map View on HPOM for Windows. . . . . . . . . . . . . . . . . . . . . . . . . . . . . . . . . . . . . . . . . . . . . . . . . . . . . . . . . 11Map View on HPOM for UNIX . . . . . . . . . . . . . . . . . . . . . . . . . . . . . . . . . . . . . . . . . . . . . . . . . . . . . . . . . . . 12Tools . . . . . . . . . . . . . . . . . . . . . . . . . . . . . . . . . . . . . . . . . . . . . . . . . . . . . . . . . . . . . . . . . . . . . . . . . . . . . . . . 14Policies . . . . . . . . . . . . . . . . . . . . . . . . . . . . . . . . . . . . . . . . . . . . . . . . . . . . . . . . . . . . . . . . . . . . . . . . . . . . . . 14Graphs . . . . . . . . . . . . . . . . . . . . . . . . . . . . . . . . . . . . . . . . . . . . . . . . . . . . . . . . . . . . . . . . . . . . . . . . . . . . . . 15Reports . . . . . . . . . . . . . . . . . . . . . . . . . . . . . . . . . . . . . . . . . . . . . . . . . . . . . . . . . . . . . . . . . . . . . . . . . . . . . . 15
4 Systems Infrastructure SPI Policies and Tools . . . . . . . . . . . . . . . . . . . . . . . . . . . . . . . . . . . . . . . . . . . . . 17
Systems Infrastructure SPI Policies . . . . . . . . . . . . . . . . . . . . . . . . . . . . . . . . . . . . . . . . . . . . . . . . . . . . . . . 17Tracing . . . . . . . . . . . . . . . . . . . . . . . . . . . . . . . . . . . . . . . . . . . . . . . . . . . . . . . . . . . . . . . . . . . . . . . . . 17
Discovery Policy . . . . . . . . . . . . . . . . . . . . . . . . . . . . . . . . . . . . . . . . . . . . . . . . . . . . . . . . . . . . . . . . . . . . 17Availability Policies . . . . . . . . . . . . . . . . . . . . . . . . . . . . . . . . . . . . . . . . . . . . . . . . . . . . . . . . . . . . . . . . . 18
Policies Monitoring Process and Service . . . . . . . . . . . . . . . . . . . . . . . . . . . . . . . . . . . . . . . . . . . . . . 20Capacity Policies . . . . . . . . . . . . . . . . . . . . . . . . . . . . . . . . . . . . . . . . . . . . . . . . . . . . . . . . . . . . . . . . . . . . 22Log Policies . . . . . . . . . . . . . . . . . . . . . . . . . . . . . . . . . . . . . . . . . . . . . . . . . . . . . . . . . . . . . . . . . . . . . . . . 36
Linux System Services Logfile Policies . . . . . . . . . . . . . . . . . . . . . . . . . . . . . . . . . . . . . . . . . . . . . . . 36Windows System Services Logfile Policies . . . . . . . . . . . . . . . . . . . . . . . . . . . . . . . . . . . . . . . . . . . . . 37AIX System Logfile Monitoring Policies. . . . . . . . . . . . . . . . . . . . . . . . . . . . . . . . . . . . . . . . . . . . . . . 39
Performance Policies. . . . . . . . . . . . . . . . . . . . . . . . . . . . . . . . . . . . . . . . . . . . . . . . . . . . . . . . . . . . . . . . . 40Security Policies . . . . . . . . . . . . . . . . . . . . . . . . . . . . . . . . . . . . . . . . . . . . . . . . . . . . . . . . . . . . . . . . . . . . 64
Systems Infrastructure SPI Tool. . . . . . . . . . . . . . . . . . . . . . . . . . . . . . . . . . . . . . . . . . . . . . . . . . . . . . . . . . 66Users Last Login Tool . . . . . . . . . . . . . . . . . . . . . . . . . . . . . . . . . . . . . . . . . . . . . . . . . . . . . . . . . . . . . . . . 66
5 Systems Infrastructure SPI Reports and Graphs . . . . . . . . . . . . . . . . . . . . . . . . . . . . . . . . . . . . . . . . . . . 67
Systems Infrastructure SPI Reports. . . . . . . . . . . . . . . . . . . . . . . . . . . . . . . . . . . . . . . . . . . . . . . . . . . . . . . 67Systems Infrastructure SPI Graphs . . . . . . . . . . . . . . . . . . . . . . . . . . . . . . . . . . . . . . . . . . . . . . . . . . . . . . . 69
6 Troubleshooting . . . . . . . . . . . . . . . . . . . . . . . . . . . . . . . . . . . . . . . . . . . . . . . . . . . . . . . . . . . . . . . . . . . . . . 73
A Appendix: Policies and Tools . . . . . . . . . . . . . . . . . . . . . . . . . . . . . . . . . . . . . . . . . . . . . . . . . . . . . . . . . . 77Deploying Policies from HPOM for Windows Server . . . . . . . . . . . . . . . . . . . . . . . . . . . . . . . . . . . . . . . 77Deploying Policies from HPOM for UNIX Server . . . . . . . . . . . . . . . . . . . . . . . . . . . . . . . . . . . . . . . . . . 78Launching Tools from HPOM for Windows server . . . . . . . . . . . . . . . . . . . . . . . . . . . . . . . . . . . . . . . . . 78Launching Tools on HPOM for UNIX . . . . . . . . . . . . . . . . . . . . . . . . . . . . . . . . . . . . . . . . . . . . . . . . . . . 79
5

6
1 Conventions Used in this Document
The following conventions are used in this document.
Convention Description
HPOM for UNIX HPOM for UNIX is used in the document to imply HPOM on HP-UX, Linux, and Solaris. Wherever required, distinction is made for a specific operating system as:• HPOM on HP-UX• HPOM on Linux • HPOM on Solaris
Infrastructure SPIs HP Operations Smart Plug-ins for Infrastructure. The software suite includes three Smart Plug-ins:• HP Operations Smart Plug-in for Systems Infrastructure • HP Operations Smart Plug-in for Virtualization Infrastructure• HP Operations Smart Plug-in for Cluster Infrastructure
SI SPI HP Operations Smart Plug-in for Systems Infrastructure
VI SPI HP Operations Smart Plug-in for Virtualization Infrastructure
CI SPI HP Operations Smart Plug-in for Cluster Infrastructure
7

8 Chapter 1
2 Introduction
This guide includes information to help you use the HP Operations Smart Plug-in for Systems Infrastructure.
Systems infrastructure is the foundation or base infrastructure that is integral to an enterprise. It includes CPU, operating system, disk, memory, and network resource that need to be continuously monitored to ensure availability, performance, security, and smooth functioning of underlying physical systems. Monitoring systems infrastructure enables you to achieve greater efficiency and productivity. It also helps to correlate, identify, and correct root cause of infrastructure faults and performance degradations.
The Smart Plug-in for Systems Infrastructure (SI SPI) version 1.60 monitors the system infrastructure for the Microsoft Windows, Linux, Sun Solaris, IBM AIX, and HP-UX systems. The SPI helps to analyze the system performance based on monitoring aspects such as capacity, availability, and utilization.
The SI SPI is a part of the HP Operations Smart Plug-ins for Infrastructure suite (Infrastructure SPIs). The other components in the suite include the Virtualization Infrastructure SPI (VI SPI), the Cluster Infrastructure SPI (CI SPI), the Report pack, Graph pack, and OMi Content Pack. Installation of SI SPI is mandatory while installing other components from the Infrastructure SPIs media.
Figure 1 Components of the Infrastructure SPIs media
The SI SPI integrates with other HP software products such as the HP Operations Manager (HPOM), HP Performance Manager, HP Performance Agent, and Embedded Performance Component (EPC) of HP Operations Agent. The integration provides policies, tools, and the additional perspective of Service Views.
For information about the operating system versions supported by the Systems Infrastructure SPI, see the HP Operations Smart Plug-in for Systems Infrastructure Release Notes.
9

10 Chapter 2
3 Systems Infrastructure SPI Components
The Systems Infrastructure SPI provides preconfigured policies and tools for monitoring the operations, availability, and performance of the managed nodes. These policies and tools, along with discovery, enable you to quickly gain control of the essential elements of your IT infrastructure.
Map View on HPOM for Windows
After you add a node to the HPOM console, the Systems Infrastructure SPI service discovery policy is automatically deployed to the nodes and adds discovered information to the HPOM Services area. This information is used to populate the Systems Infrastructure SPI map view for nodes and services.
The map view displays the real-time status of your infrastructure environment. To view, select Services from the HPOM console, and click Systems Infrastructure. Map view graphically represents the structural view of your entire service or node hierarchy in the infrastructure environment including any subsystems or subservices.
11
Figure 2 Map view on HPOM for Windows
The icons and lines in your map are color-coded to indicate the severity levels of items in the map and to show status propagation. Use the map view to drill down to the level in your node or service hierarchy where a problem is occurring.
To help you determine the root cause of a problem, HPOM provides root cause analysis to take you quickly to the service or node that is not performing. Root cause analysis starts at the level of your selected node or service, stops at the level where the cause of the problem lies, and draws a map that shows the source of the problem and the nodes or services affected.
Map View on HPOM for UNIX
The map view displays the real-time status of your infrastructure environment. To ensure that the operator can view the service map in the HPOM for HP-UX, Solaris, and Linux Operational UI, run the following commands on the management server:
opcservice -assign <operator name> SystemServices
12 Chapter 3
where operator name is the operator (for example, opc_adm or opc_op) to which you want to
assign the service.
The Systems Infrastructure SPI service discovery policy does not automatically deploy policies to the nodes. You can manually deploy these.
To view the map view:
1 Launch the HPOM Operational UI.
2 Log on using your user name and password.
3 Select Services → Systems Infrastructure → Show Graph, to view the map view.
Figure 3 Map view on HPOM for UNIX/ Linux/ Solaris
The map view graphically represents the structural view of your entire service or node hierarchy in the infrastructure environment including any subsystems or subservices.
Systems Infrastructure SPI Components 13
Tools
The Systems Infrastructure SPI tools display data collected for a particular managed node. For more information about the tools provided by System Infrastructure SPI, see Systems Infrastructure SPI Tool.
Policies
In case of HPOM for Windows, several default policies are automatically deployed on the supported managed nodes during installation. These can be used as-is to begin receiving system infrastructure related data and messages from the environment. You can choose to turn off automatic deployment of policies when services are discovered. In addition, you can modify and save preconfigured policies with new names to create custom policies for your own specialized purposes.
In case of HPOM for UNIX/ Linux/ Solaris, the Systems Infrastructure SPI service discovery policy does not automatically deploy policies to the nodes. You can manually deploy them.
For information on how to deploy policies from HPOM for Windows, UNIX, Linux, and Solaris, refer to the Appendix A.
The Systems Infrastructure SPI policies begin with SI for easy identification and modification. The policy types are as follows:
• Service/Process Monitoring policies provide a means for monitoring system services and processes.
• Logfile Entry policies capture status/error messages generated by the system nodes.
• Measurement Threshold policies define conditions for each metric so that the collected metric values can be interpreted and alerts/messages can be displayed in the message browser. Each measurement threshold policy compares the actual metric value against the specified/auto threshold. A mismatch between the threshold and the actual metric value generates a message and instruction text that help you resolve a situation.
• Scheduled Task policies determine what metric values to collect and when to start collecting metric. The policies define the collection interval. The collection interval indicates how often data is collected for a specific group. The scheduled task policy has two functions: to run the collector/analyzer at each collection interval on a node and to collect data for all metrics listed within the polices’ Command text box.
• Service Discovery policy discovers individual system nodes instances and builds a map view for all Systems Infrastructure SPI discovered instances.
For more information about the policies provided by Systems Infrastructure SPI, see Systems Infrastructure SPI Policies.
14 Chapter 3
Graphs
The Systems Infrastructure SPI enables you to view and trace out the root cause of any discrepancy in the normal behavior of an element being monitored. HPOM is integrated with HP Performance Manager, a web-based analysis tool that helps you evaluate system performance, look at usage trends, and compare performance between systems. Using HP Performance Manager you can see any of the following:
• Graphs such as line, bar, or area
• Tables for data such as process details
• Baseline graphs
• Dynamic graphs in Java format that allow you to turn off display of individual metrics or hover over a point on a graph and see the values displayed
You can view the data represented graphically for quick and easy analysis of a serious or critical error message reported. For more information about the graphs provided by Systems Infrastructure SPI, see Systems Infrastructure SPI Graphs.
Reports
You can integrate the Systems Infrastructure SPI by installing the HP Reporter to generate web-based reports on metric data.
If HP Reporter is installed on the HPOM management server for Windows, you can view reports from the console. To view a report, expand Reports in the console tree, and then double-click individual reports.
If HP Reporter is installed on a separate system connected to the HPOM management server (for Windows, UNIX, Linux, or Solaris operating system), you can view the reports on HP Reporter system. For more information on integration of HP Reporter with HPOM, see HP Reporter Installation and Special Configuration Guide.
For information about the reports provided by Systems Infrastructure SPI, see Systems
Infrastructure SPI Reports.
Systems Infrastructure SPI Components 15

16 Chapter 3
4 Systems Infrastructure SPI Policies and Tools
The Systems Infrastructure SPI provides a wide range of policies and tools to help manage your infrastructure. The policies help you monitor systems and the tools display data collected for these systems.
Systems Infrastructure SPI Policies
A policy is a rule or set of rules that help you automate monitoring. The SI SPI policies help you monitor systems in Windows, Linux, Solaris, AIX, and HP-UX environments. Most policies are common to all environments, but there are some policies that are relevant only to a particular environment and must be deployed only on the relevant platform. Deployment of policy to an unsupported platform may lead to unexpected behavior or cause the policy to fail.
The folder Infrastructure Management group contains a subgroup arranged according to language. For example, the subgroup for English policies is en, for Japanese language is ja, and for Simplified Chinese language is zh.
To access the policies on HPOM for Windows, select the following:
Policy management → Policy groups → Infrastructure Management → v1.60 → <language> → Systems Infrastructure
To access the policies on console/ Administration UI for HPOM for UNIX/ Linux/ Solaris, select the following:
Policy Bank → Infrastructure Management → v1.60 → <language> → Systems Infrastructure
Tracing
The policies for monitoring capacity and performance contain a script parameter for tracing: Debug or DebugLevel. Using this parameter you can enable tracing. The parameter can be assigned any of the following values:
• Debug=0, no trace messages will be sent.
• Debug=1, trace messages will be sent to the console.
• Debug=2, trace messages will be logged in a trace file on the managed node. The trace file location on managed node is <OV_DATA_DIR>\<log>
Discovery Policy
The SI-SystemDiscovery policy gathers service information from the managed nodes such as hardware resources, operating system attributes, and applications.
17
Whenever a node is added to the HPOM console, the discovery modules deployed along with the SI-SystemDiscovery policy run service discovery on the node. These service discovery modules gather and send back the information to HPOM in the form of XML snippets. These snippets generate a service tree that provides a snapshot of services deployed on managed nodes at the time the Systems Infrastructure SPI discovery process runs. After the first deployment, the autodiscovery policy is set to run periodically. Each time the discovery agent runs, it compares the service information retrieved with the results of the previous run. If the discovery agent finds any changes or additions to the services running on the managed node since the previous run, it sends a message to the HPOM management server, which updates the service view with the changes. The default policy group for this policy is:
Infrastructure Management → v1.60 → <language> → Systems Infrastructure → AutoDiscovery
Availability Policies
Availability monitoring helps to ensure adequate availability of resources. It is important to identify unacceptable resource availability levels. The current load on IT infrastructure is computed and compared with threshold levels to see if there is any shortfall in resource availability.
As the usage of IT resources changes, and functionality evolves, the amount of disk space, processing power, memory, and other parameters also change. It is essential to understand the current demands, and how they change over time. Monitoring these aspects over a period of time is beneficial in understanding the impact on IT resource utilization.
A server role describes the primary function of the server such as fax server, email server, and so on. A system can have one single server role or multiple server roles installed. Each server role can include one or more role services described as sub-elements of a role. The availability policies monitor the availability of role services on the managed nodes.
The preconfigured availability policies are automatically installed if the role services managed by these policies are discovered on the selected node by the Systems Infrastructure SPI. The default policy group for these policies is:
Infrastructure Management → v1.60 → <language> → Systems Infrastructure → Availability
The availability policies monitor the availability of the processes and services on the Linux, Windows, Solaris, AIX, and HP-UX managed nodes. The policies send a message to HPOM when the process is unavailable or when the status of the service changes (for example, from running to stopped or disabled). You can define the status to monitor and the action to take if the status changes.
18 Chapter 4

Figure 4 Availability policy grouping
The availability policies are grouped based on the server roles and sub grouped based on the operating system. You can select the required policy according to the operating system on the managed node.
Systems Infrastructure SPI Policies and Tools 19
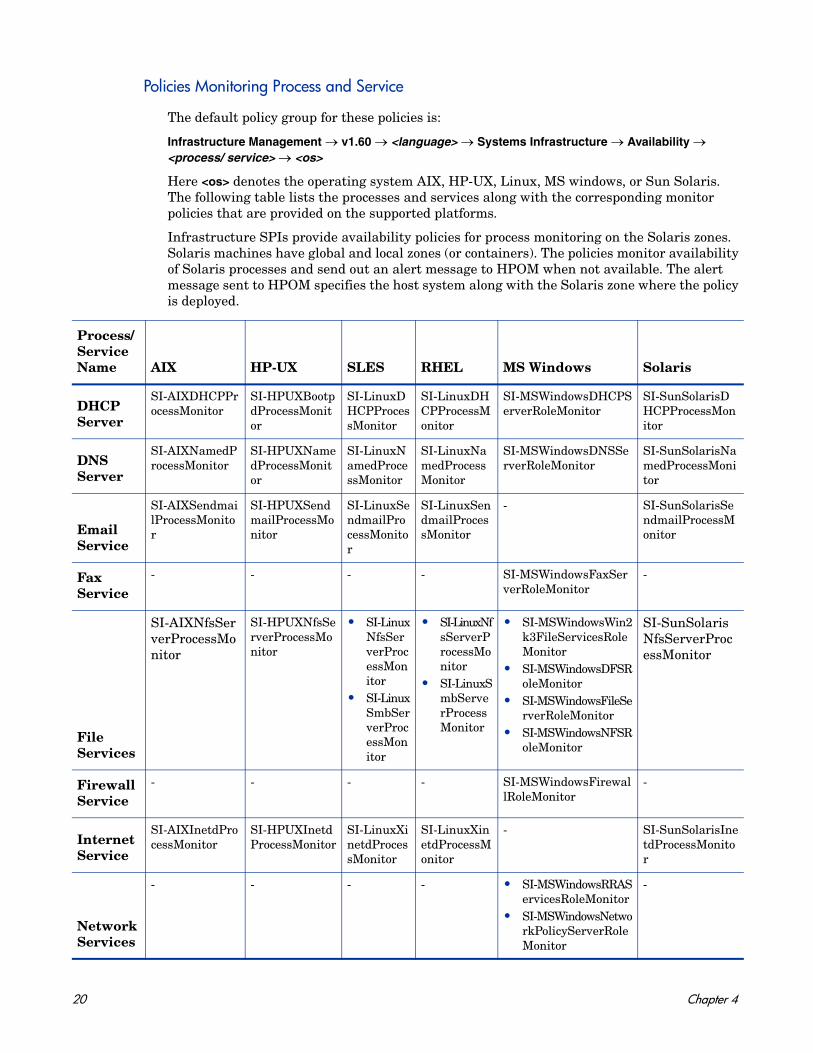
Policies Monitoring Process and Service
The default policy group for these policies is:
Infrastructure Management → v1.60 → <language> → Systems Infrastructure → Availability → <process/ service> → <os>
Here <os> denotes the operating system AIX, HP-UX, Linux, MS windows, or Sun Solaris. The following table lists the processes and services along with the corresponding monitor policies that are provided on the supported platforms.
Infrastructure SPIs provide availability policies for process monitoring on the Solaris zones. Solaris machines have global and local zones (or containers). The policies monitor availability of Solaris processes and send out an alert message to HPOM when not available. The alert message sent to HPOM specifies the host system along with the Solaris zone where the policy is deployed.
Process/ Service Name AIX HP-UX SLES RHEL MS Windows Solaris
DHCP Server
SI-AIXDHCPProcessMonitor
SI-HPUXBootpdProcessMonitor
SI-LinuxDHCPProcessMonitor
SI-LinuxDHCPProcessMonitor
SI-MSWindowsDHCPServerRoleMonitor
SI-SunSolarisDHCPProcessMonitor
DNS Server
SI-AIXNamedProcessMonitor
SI-HPUXNamedProcessMonitor
SI-LinuxNamedProcessMonitor
SI-LinuxNamedProcessMonitor
SI-MSWindowsDNSServerRoleMonitor
SI-SunSolarisNamedProcessMonitor
Email Service
SI-AIXSendmailProcessMonitor
SI-HPUXSendmailProcessMonitor
SI-LinuxSendmailProcessMonitor
SI-LinuxSendmailProcessMonitor
- SI-SunSolarisSendmailProcessMonitor
Fax Service
- - - - SI-MSWindowsFaxServerRoleMonitor
-
File Services
SI-AIXNfsServerProcessMonitor
SI-HPUXNfsServerProcessMonitor
• SI-LinuxNfsServerProcessMonitor
• SI-LinuxSmbServerProcessMonitor
• SI-LinuxNfsServerProcessMonitor
• SI-LinuxSmbServerProcessMonitor
• SI-MSWindowsWin2k3FileServicesRoleMonitor
• SI-MSWindowsDFSRoleMonitor
• SI-MSWindowsFileServerRoleMonitor
• SI-MSWindowsNFSRoleMonitor
SI-SunSolarisNfsServerProcessMonitor
Firewall Service
- - - - SI-MSWindowsFirewallRoleMonitor
-
Internet Service
SI-AIXInetdProcessMonitor
SI-HPUXInetdProcessMonitor
SI-LinuxXinetdProcessMonitor
SI-LinuxXinetdProcessMonitor
- SI-SunSolarisInetdProcessMonitor
Network Services
- - - - • SI-MSWindowsRRAServicesRoleMonitor
• SI-MSWindowsNetworkPolicyServerRoleMonitor
-
20 Chapter 4
Print Service
• SI-AIXQdaemonProcessMonitor
• SI-AIXLpdProcessMonitor
SI-HPUXLpschedProcessMonitor
SI-LinuxCupsProcessMonitor
SI-LinuxCupsProcessMonitor
SI-MSWindowsPrintServiceRoleMonitor
SI-SunSolarisLpdProcessMonitor
RPC Service
SI-AIXPortmapProcessMonitor
- - - SI-MSWindowsRpcRoleMonitor
-
Scheduled Job Service
SI-AIXCronProcessMonitor
SI-HPUXCronProcessMonitor
SI-SLESCronProcessMonitor
SI-RHELCronProcessMonitor
SI-MSWindowsTaskSchedulerRoleMonitor
SI-SunSolarisCronProcessMonitor
Secure Login Service
SI-OpenSshdProcessMonitor1
• SI-HPUXSshdProcessMonitor
• SI-OpenSshdProcessMonitor1
• SI-LinuxSshdProcessMonitor
• SI-OpenSshdProcessMonitor1
• SI-LinuxSshdProcessMonitor
• SI-OpenSshdProcessMonitor1
SI-OpenSshdProcessMonitor1
• SI-SunSolarisSshdProcessMonitor
• SI-OpenSshdProcessMonitor1
SNMP Service
SI-UnixSnmpdProcessMonitor
SI-UnixSnmpdProcessMonitor
SI-UnixSnmpdProcessMonitor
SI-UnixSnmpdProcessMonitor
SI-MSWindowsSnmpProcessMonitor
SI-UnixSnmpdProcessMonitor
System Logger
SI-AIXSyslogProcessMonitor
SI-HPUXSyslogProcessMonitor
SI-SLESSyslogProcessMonitor
SI-RHELSyslogProcessMonitor
SI-MSWindowsEventLogRoleMonitor
SI-SunSolarisSyslogProcessMonitor
Terminal Services
- - - - • SI-MSWindowsTSWebAccessRoleMonitor
• SI-MSWindowsTSGatewayRoleMonitor
• SI-MSWindowsTerminalServerRoleMonitor
• SI-MSWindowsTSLicensingRoleMonitor
-
Web Server
SI-AIXWebserverProcessMonitor
SI-HPUXWebserverProcessMonitor
SI-LinuxWebserverProcessMonitor
SI-LinuxWebserverProcessMonitor
SI-MSWindowsWebServerRoleMonitor
SI-SunSolarisWebserverProcessMonitor
Process/ Service Name AIX HP-UX SLES RHEL MS Windows Solaris
Systems Infrastructure SPI Policies and Tools 21
1The policy is supported on AIX, HP-UX, Linux, MS windows, and SunSolaris operating systems. Make sure you install openssh packages before deploying this policy on any of the supported platforms.
Policies not supported on non-global zones
• SI-CPUSpikeCheck
• SI-PerNetIFInbyteBaseline-AT
• SI-PerNetIfoutbyteBAseline-AT
• Si-PerDiskAvgServiceTime-AT
• SI-PerDiskUtilization-AT
Capacity Policies
Capacity monitoring helps to deliver performance at the required service level and cost. It ensures that the capacity of the IT infrastructure corresponds to the evolving demands of the business. It helps identify the under utilized and over utilized resources. Monitoring these aspects over a period of time is beneficial in understanding the impact on IT resource utilization. You can analyze current and historical performance of systems resources to accurately predict future capacity needs. The default policy group for these policies is:
Infrastructure Management → v1.60 → <language> → Systems Infrastructure → Capacity
Disk Capacity Monitor Policy
SI-DiskCapacityMonitor
The current process monitoring policy for Solaris, when deployed on a non-global zone, will display accurate information about the number of processes runnning at that time. But, when the policy is deployed on a global zone, all processes running on global zone and non-global zone are displayed. Hence, to monitor processes running on global zone, the threshold level must be set to include the non-global processes too. Impact: With the current implementation, even if you want to monitor only the global zone processes, you will also get alerts from processes on non-global zones.
22 Chapter 4
This policy monitors capacity parameters of the disks (also referred to as logical file systems) on the managed node. For each disk, the policy checks for space utilization and free space available. It also checks for inode utilization on the Linux nodes. In case the free space availability, space utilization, or inode utilization exceeds the threshold values specified, the policy sends out an alert to the HPOM console.
Metrics Used FS_MAX_SIZE FS_SPACE_USED FS_SPACE_UTIL FS_DIRNAMEFS_INODE_UTIL (not applicable on Windows)
Supported Platforms Microsoft Windows
Red Hat Enterprise Linux
Suse Linux Enterprise ServerHP-UXIBM AIX
Sun Solaris
Script-Parameter Description
SpaceUtilCriticalThreshold The threshold is expressed as the space utilized on the disk. Set the threshold value at which you want to receive a critical message.
SpaceUtilMajorThreshold Set the threshold value at which you want to receive a major message.
SpaceUtilMinorThreshold Set the threshold value at which you want to receive a minor message.
SpaceUtilWarningThreshold Set the threshold value at which you want to receive a warning message.
InodeUtilCriticalThreshold The threshold is expressed as the percentage (0 to 100%) of inode utilization on the Linux systems. Set the threshold value at which you want to receive a critical message.
InodeUtilMajorThreshold Set the threshold value for minimum space utilized on the node at which you want to receive a major message.
InodeUtilMinorThreshold Set the threshold value at which you want to receive a minor message.
InodeUtilWarningThreshold Set the threshold value at which you want to receive a warning message.
FreeSpaceCriticalThreshold The threshold is expressed as the free space (in MBs) available on the disk/filesystem. Set the threshold value for minimum free space on the disk, below which you want to receive a critical message.
FreeSpaceMajorThreshold Set the threshold value for minimum free space on the disk, below which you want to receive a major message.
Systems Infrastructure SPI Policies and Tools 23
You can set different thresholds for the drives/ filesystems on the managed node. The policy parameters can take multiple comma separated values for setting these thresholds. These are described in the following examples:
• FreeSpaceMinorThreshold 45
In this example, the threshold value is set at 45 MB for all disks/filesystems on the managed node. If the free space available on disks/filesystems falls below the threshold value, the policy sends a minor severity alert.
• SpaceUtilCriticalThreshold /=65,95,c:=65
In this example, the threshold values are set at 65% for the '/' and 'C:' drives, and 95% for all other drives/filesystems on the managed node. If the system utilization for these drives/filesystems exceeds the threshold values, the policy sends out a critical alert.
• InodeUtilCriticalThreshold /opt=85,/=88
In this example, the threshold values are set at 85% for '/opt' drive and 88% for '/' drive. If the inodes utilization exceeds the threshold values, the policy sends out a critical alert. The policy will not monitor the remaining drives/ filesystems on the managed node.
• FreeSpaceMajorThreshold E:=200,256,F:=512,c:=1024,/=1024
In this example, the threshold values are set at 200 for 'E:' drive, 512 for 'F:' drive, 1024 for 'C:' drive, 1024 for '/' drive, and 256 for the remaining drives on the managed node. If the free space available falls below the threshold values, the policy sends a major alert.
• InodeUtilCriticalThreshold <null>
InodeUtilMajorThreshold <null>
InodeUtilMinorThreshold <null>
InodeUtilWarningThreshold <null>
In this example, there are no threshold values set for the drives/ filesystems. The policy will not monitor any of the drives/ filesystems for inode utilization.
Swap Capacity Monitor Policy
SI-SwapCapacityMonitor
FreeSpaceMinorThreshold Set the threshold value for minimum free space on the disk, below which you want to receive a minor message.
FreeSpaceWarningThreshold Set the threshold value for minimum free space on the disk, below which you want to receive a warning message.
MessageGroup Message group for outgoing messages.
Debug Set the value as 0 to disable trace messages, as 1 to receive trace messages on the console, and as 2 to log the messages in the trace file on the managed node. For details, see Tracing.
24 Chapter 4
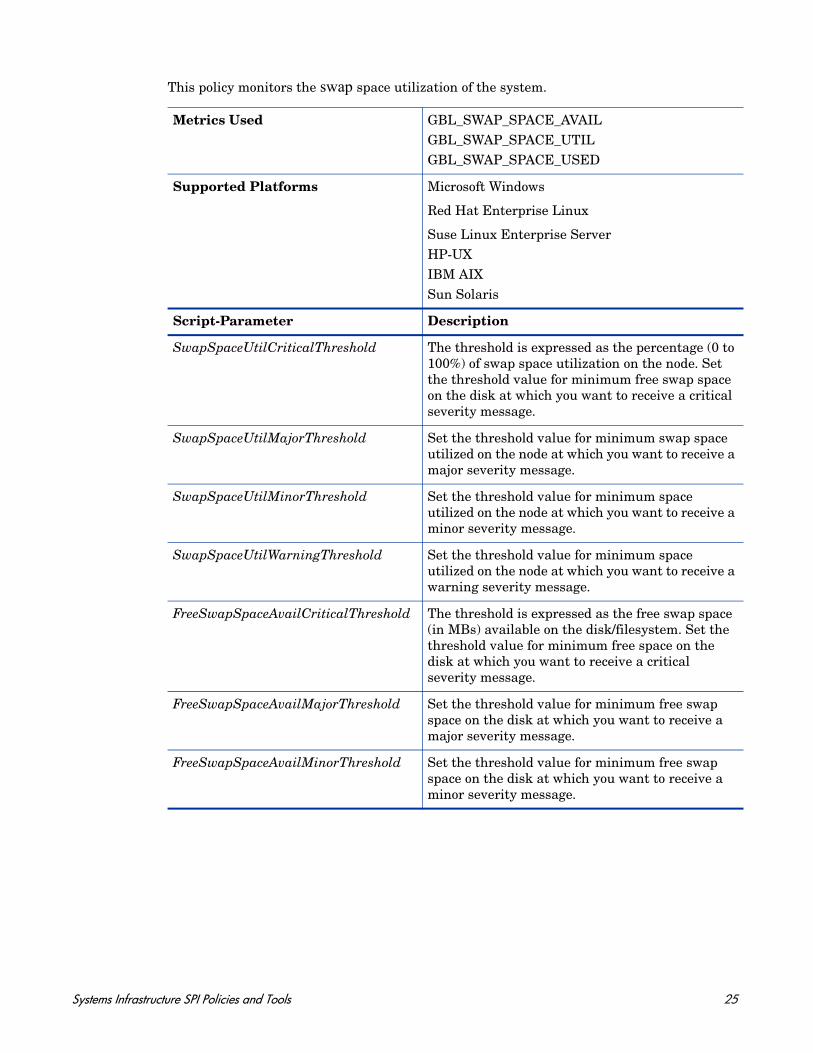
This policy monitors the swap space utilization of the system.
Metrics Used GBL_SWAP_SPACE_AVAILGBL_SWAP_SPACE_UTILGBL_SWAP_SPACE_USED
Supported Platforms Microsoft Windows
Red Hat Enterprise Linux
Suse Linux Enterprise ServerHP-UXIBM AIXSun Solaris
Script-Parameter Description
SwapSpaceUtilCriticalThreshold The threshold is expressed as the percentage (0 to 100%) of swap space utilization on the node. Set the threshold value for minimum free swap space on the disk at which you want to receive a critical severity message.
SwapSpaceUtilMajorThreshold Set the threshold value for minimum swap space utilized on the node at which you want to receive a major severity message.
SwapSpaceUtilMinorThreshold Set the threshold value for minimum space utilized on the node at which you want to receive a minor severity message.
SwapSpaceUtilWarningThreshold Set the threshold value for minimum space utilized on the node at which you want to receive a warning severity message.
FreeSwapSpaceAvailCriticalThreshold The threshold is expressed as the free swap space (in MBs) available on the disk/filesystem. Set the threshold value for minimum free space on the disk at which you want to receive a critical severity message.
FreeSwapSpaceAvailMajorThreshold Set the threshold value for minimum free swap space on the disk at which you want to receive a major severity message.
FreeSwapSpaceAvailMinorThreshold Set the threshold value for minimum free swap space on the disk at which you want to receive a minor severity message.
Systems Infrastructure SPI Policies and Tools 25
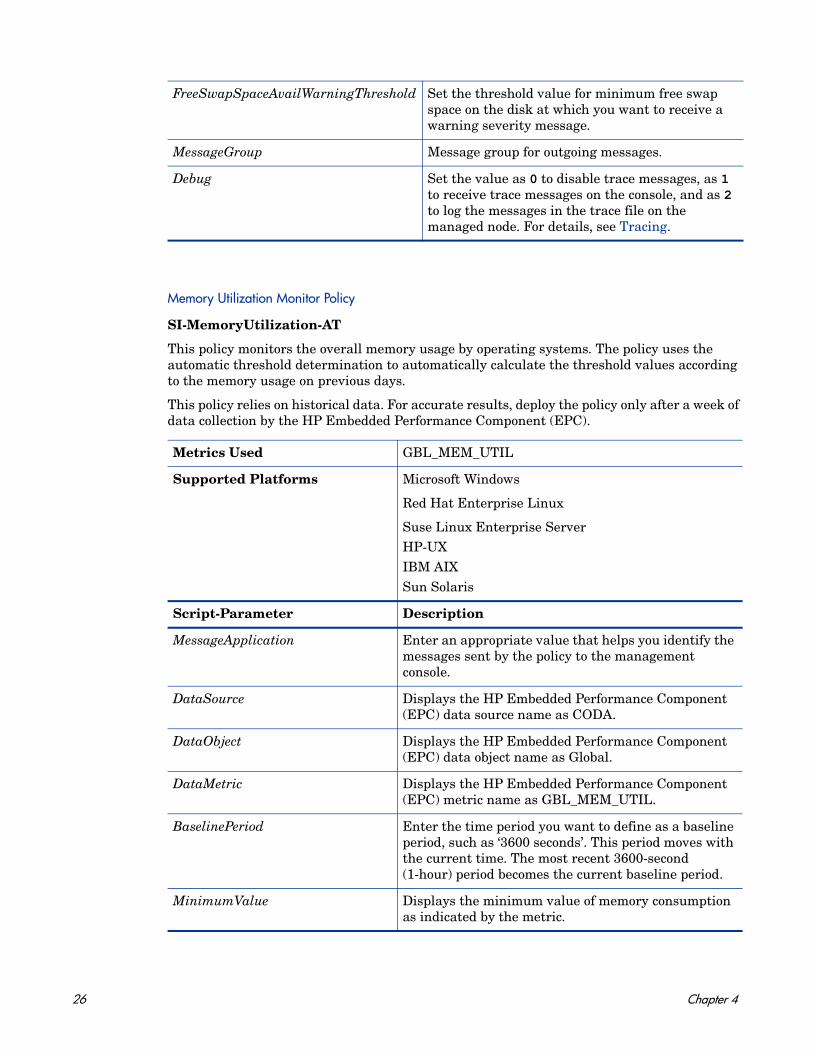
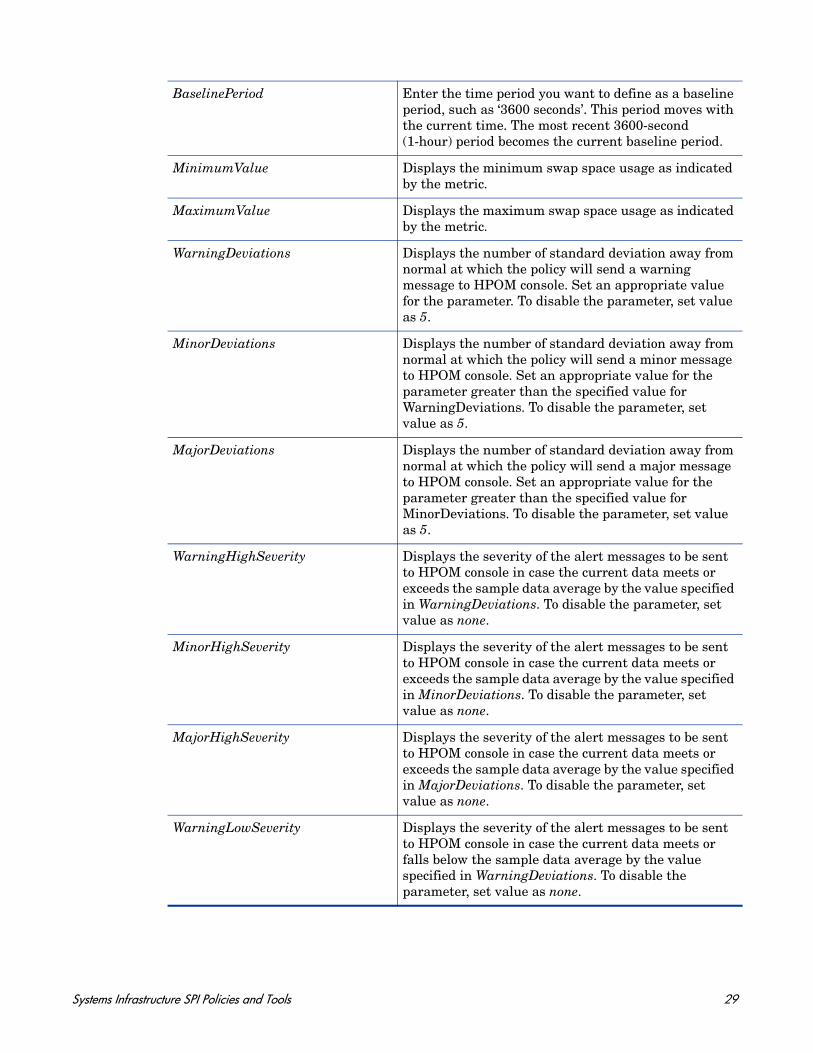
Memory Utilization Monitor Policy
SI-MemoryUtilization-AT
This policy monitors the overall memory usage by operating systems. The policy uses the automatic threshold determination to automatically calculate the threshold values according to the memory usage on previous days.
This policy relies on historical data. For accurate results, deploy the policy only after a week of data collection by the HP Embedded Performance Component (EPC).
FreeSwapSpaceAvailWarningThreshold Set the threshold value for minimum free swap space on the disk at which you want to receive a warning severity message.
MessageGroup Message group for outgoing messages.
Debug Set the value as 0 to disable trace messages, as 1 to receive trace messages on the console, and as 2 to log the messages in the trace file on the managed node. For details, see Tracing.
Metrics Used GBL_MEM_UTIL
Supported Platforms Microsoft Windows
Red Hat Enterprise Linux
Suse Linux Enterprise ServerHP-UXIBM AIXSun Solaris
Script-Parameter Description
MessageApplication Enter an appropriate value that helps you identify the messages sent by the policy to the management console.
DataSource Displays the HP Embedded Performance Component (EPC) data source name as CODA.
DataObject Displays the HP Embedded Performance Component (EPC) data object name as Global.
DataMetric Displays the HP Embedded Performance Component (EPC) metric name as GBL_MEM_UTIL.
BaselinePeriod Enter the time period you want to define as a baseline period, such as ‘3600 seconds’. This period moves with the current time. The most recent 3600-second (1-hour) period becomes the current baseline period.
MinimumValue Displays the minimum value of memory consumption as indicated by the metric.
26 Chapter 4
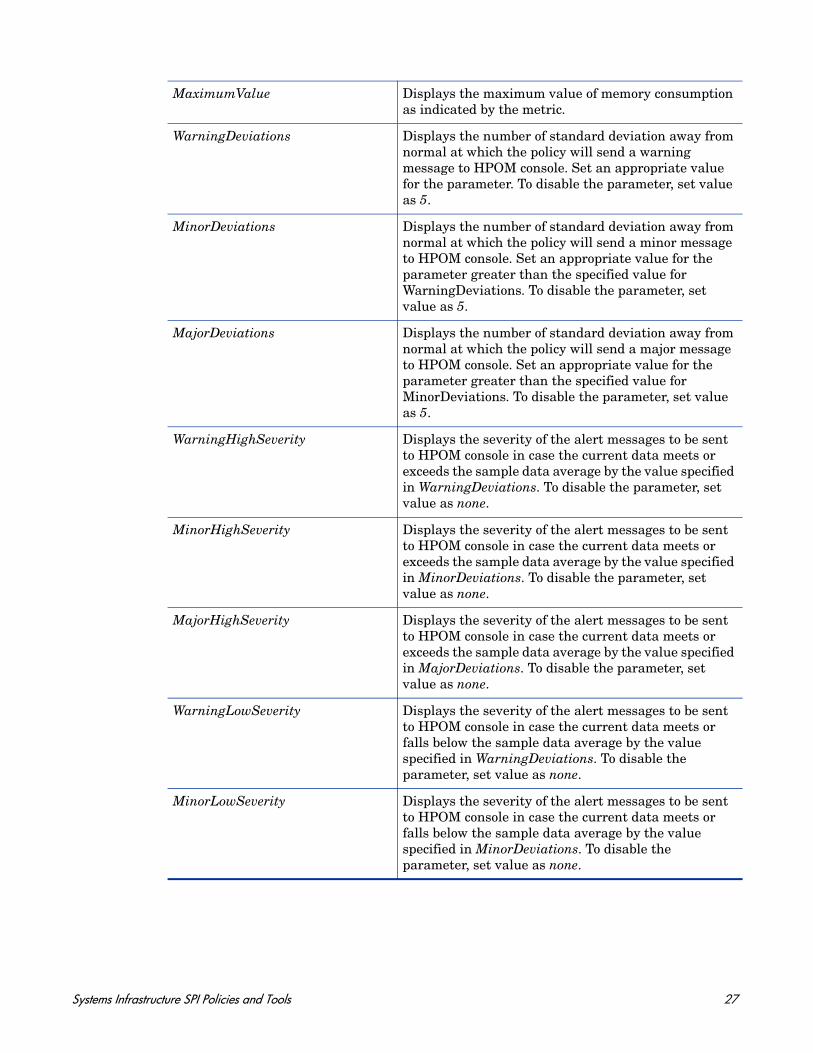
MaximumValue Displays the maximum value of memory consumption as indicated by the metric.
WarningDeviations Displays the number of standard deviation away from normal at which the policy will send a warning message to HPOM console. Set an appropriate value for the parameter. To disable the parameter, set value as 5.
MinorDeviations Displays the number of standard deviation away from normal at which the policy will send a minor message to HPOM console. Set an appropriate value for the parameter greater than the specified value for WarningDeviations. To disable the parameter, set value as 5.
MajorDeviations Displays the number of standard deviation away from normal at which the policy will send a major message to HPOM console. Set an appropriate value for the parameter greater than the specified value for MinorDeviations. To disable the parameter, set value as 5.
WarningHighSeverity Displays the severity of the alert messages to be sent to HPOM console in case the current data meets or exceeds the sample data average by the value specified in WarningDeviations. To disable the parameter, set value as none.
MinorHighSeverity Displays the severity of the alert messages to be sent to HPOM console in case the current data meets or exceeds the sample data average by the value specified in MinorDeviations. To disable the parameter, set value as none.
MajorHighSeverity Displays the severity of the alert messages to be sent to HPOM console in case the current data meets or exceeds the sample data average by the value specified in MajorDeviations. To disable the parameter, set value as none.
WarningLowSeverity Displays the severity of the alert messages to be sent to HPOM console in case the current data meets or falls below the sample data average by the value specified in WarningDeviations. To disable the parameter, set value as none.
MinorLowSeverity Displays the severity of the alert messages to be sent to HPOM console in case the current data meets or falls below the sample data average by the value specified in MinorDeviations. To disable the parameter, set value as none.
Systems Infrastructure SPI Policies and Tools 27
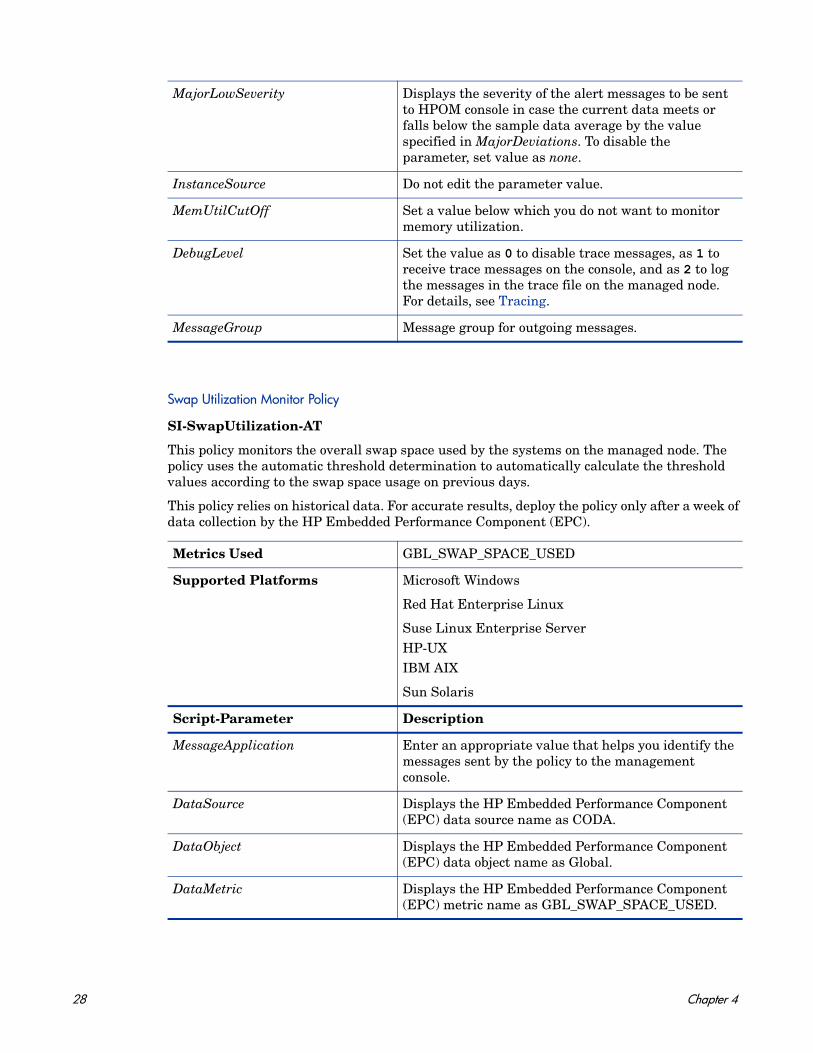
Swap Utilization Monitor Policy
SI-SwapUtilization-AT
This policy monitors the overall swap space used by the systems on the managed node. The policy uses the automatic threshold determination to automatically calculate the threshold values according to the swap space usage on previous days.
This policy relies on historical data. For accurate results, deploy the policy only after a week of data collection by the HP Embedded Performance Component (EPC).
MajorLowSeverity Displays the severity of the alert messages to be sent to HPOM console in case the current data meets or falls below the sample data average by the value specified in MajorDeviations. To disable the parameter, set value as none.
InstanceSource Do not edit the parameter value.
MemUtilCutOff Set a value below which you do not want to monitor memory utilization.
DebugLevel Set the value as 0 to disable trace messages, as 1 to receive trace messages on the console, and as 2 to log the messages in the trace file on the managed node. For details, see Tracing.
MessageGroup Message group for outgoing messages.
Metrics Used GBL_SWAP_SPACE_USED
Supported Platforms Microsoft Windows
Red Hat Enterprise Linux
Suse Linux Enterprise ServerHP-UXIBM AIX
Sun Solaris
Script-Parameter Description
MessageApplication Enter an appropriate value that helps you identify the messages sent by the policy to the management console.
DataSource Displays the HP Embedded Performance Component (EPC) data source name as CODA.
DataObject Displays the HP Embedded Performance Component (EPC) data object name as Global.
DataMetric Displays the HP Embedded Performance Component (EPC) metric name as GBL_SWAP_SPACE_USED.
28 Chapter 4
BaselinePeriod Enter the time period you want to define as a baseline period, such as ‘3600 seconds’. This period moves with the current time. The most recent 3600-second (1-hour) period becomes the current baseline period.
MinimumValue Displays the minimum swap space usage as indicated by the metric.
MaximumValue Displays the maximum swap space usage as indicated by the metric.
WarningDeviations Displays the number of standard deviation away from normal at which the policy will send a warning message to HPOM console. Set an appropriate value for the parameter. To disable the parameter, set value as 5.
MinorDeviations Displays the number of standard deviation away from normal at which the policy will send a minor message to HPOM console. Set an appropriate value for the parameter greater than the specified value for WarningDeviations. To disable the parameter, set value as 5.
MajorDeviations Displays the number of standard deviation away from normal at which the policy will send a major message to HPOM console. Set an appropriate value for the parameter greater than the specified value for MinorDeviations. To disable the parameter, set value as 5.
WarningHighSeverity Displays the severity of the alert messages to be sent to HPOM console in case the current data meets or exceeds the sample data average by the value specified in WarningDeviations. To disable the parameter, set value as none.
MinorHighSeverity Displays the severity of the alert messages to be sent to HPOM console in case the current data meets or exceeds the sample data average by the value specified in MinorDeviations. To disable the parameter, set value as none.
MajorHighSeverity Displays the severity of the alert messages to be sent to HPOM console in case the current data meets or exceeds the sample data average by the value specified in MajorDeviations. To disable the parameter, set value as none.
WarningLowSeverity Displays the severity of the alert messages to be sent to HPOM console in case the current data meets or falls below the sample data average by the value specified in WarningDeviations. To disable the parameter, set value as none.
Systems Infrastructure SPI Policies and Tools 29
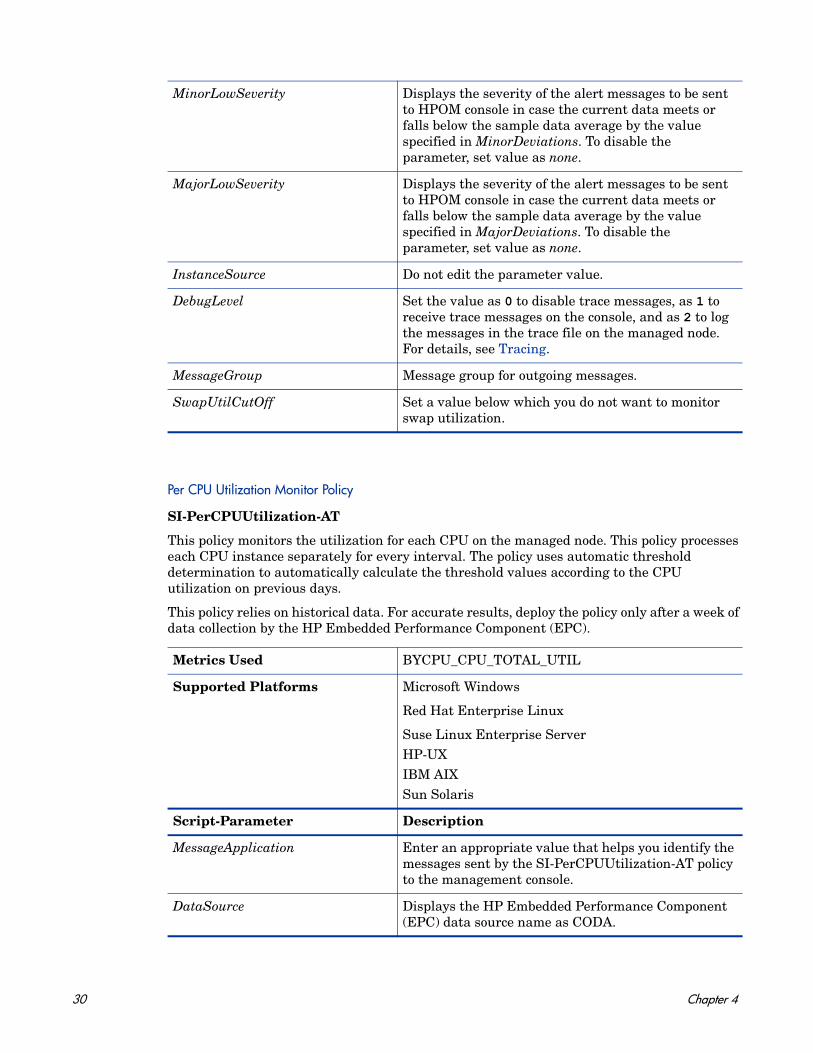
Per CPU Utilization Monitor Policy
SI-PerCPUUtilization-AT
This policy monitors the utilization for each CPU on the managed node. This policy processes each CPU instance separately for every interval. The policy uses automatic threshold determination to automatically calculate the threshold values according to the CPU utilization on previous days.
This policy relies on historical data. For accurate results, deploy the policy only after a week of data collection by the HP Embedded Performance Component (EPC).
MinorLowSeverity Displays the severity of the alert messages to be sent to HPOM console in case the current data meets or falls below the sample data average by the value specified in MinorDeviations. To disable the parameter, set value as none.
MajorLowSeverity Displays the severity of the alert messages to be sent to HPOM console in case the current data meets or falls below the sample data average by the value specified in MajorDeviations. To disable the parameter, set value as none.
InstanceSource Do not edit the parameter value.
DebugLevel Set the value as 0 to disable trace messages, as 1 to receive trace messages on the console, and as 2 to log the messages in the trace file on the managed node. For details, see Tracing.
MessageGroup Message group for outgoing messages.
SwapUtilCutOff Set a value below which you do not want to monitor swap utilization.
Metrics Used BYCPU_CPU_TOTAL_UTIL
Supported Platforms Microsoft Windows
Red Hat Enterprise Linux
Suse Linux Enterprise ServerHP-UXIBM AIXSun Solaris
Script-Parameter Description
MessageApplication Enter an appropriate value that helps you identify the messages sent by the SI-PerCPUUtilization-AT policy to the management console.
DataSource Displays the HP Embedded Performance Component (EPC) data source name as CODA.
30 Chapter 4
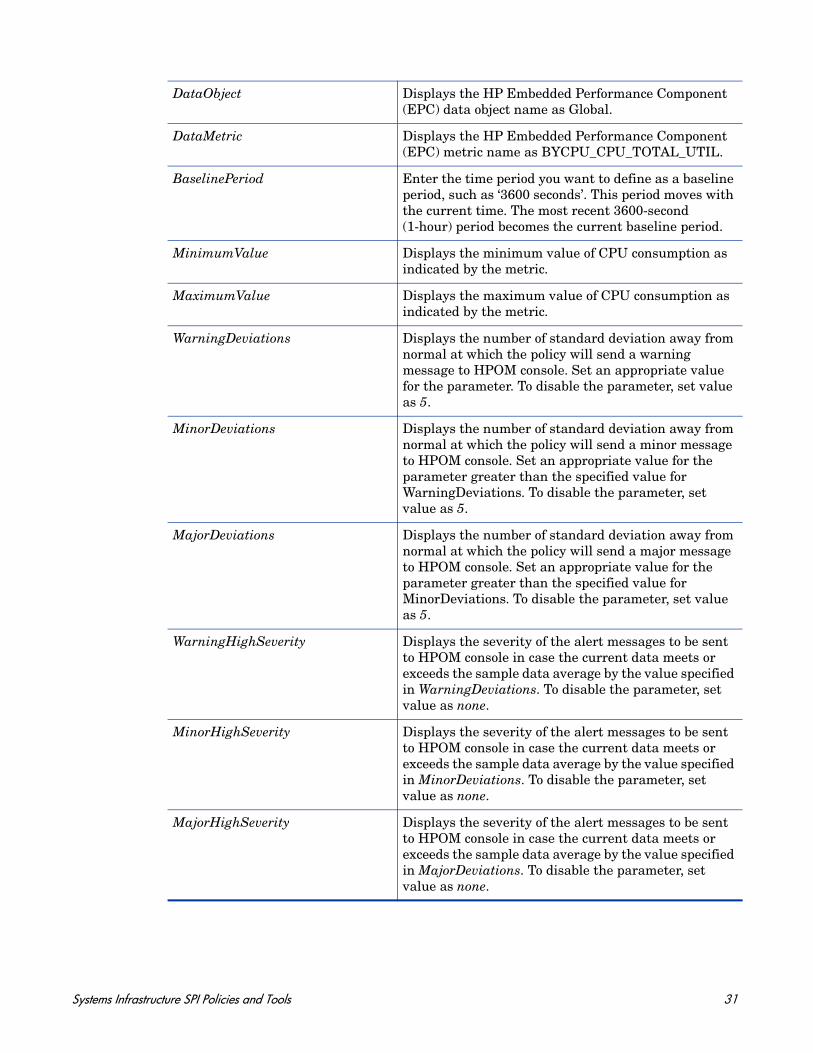
DataObject Displays the HP Embedded Performance Component (EPC) data object name as Global.
DataMetric Displays the HP Embedded Performance Component (EPC) metric name as BYCPU_CPU_TOTAL_UTIL.
BaselinePeriod Enter the time period you want to define as a baseline period, such as ‘3600 seconds’. This period moves with the current time. The most recent 3600-second (1-hour) period becomes the current baseline period.
MinimumValue Displays the minimum value of CPU consumption as indicated by the metric.
MaximumValue Displays the maximum value of CPU consumption as indicated by the metric.
WarningDeviations Displays the number of standard deviation away from normal at which the policy will send a warning message to HPOM console. Set an appropriate value for the parameter. To disable the parameter, set value as 5.
MinorDeviations Displays the number of standard deviation away from normal at which the policy will send a minor message to HPOM console. Set an appropriate value for the parameter greater than the specified value for WarningDeviations. To disable the parameter, set value as 5.
MajorDeviations Displays the number of standard deviation away from normal at which the policy will send a major message to HPOM console. Set an appropriate value for the parameter greater than the specified value for MinorDeviations. To disable the parameter, set value as 5.
WarningHighSeverity Displays the severity of the alert messages to be sent to HPOM console in case the current data meets or exceeds the sample data average by the value specified in WarningDeviations. To disable the parameter, set value as none.
MinorHighSeverity Displays the severity of the alert messages to be sent to HPOM console in case the current data meets or exceeds the sample data average by the value specified in MinorDeviations. To disable the parameter, set value as none.
MajorHighSeverity Displays the severity of the alert messages to be sent to HPOM console in case the current data meets or exceeds the sample data average by the value specified in MajorDeviations. To disable the parameter, set value as none.
Systems Infrastructure SPI Policies and Tools 31
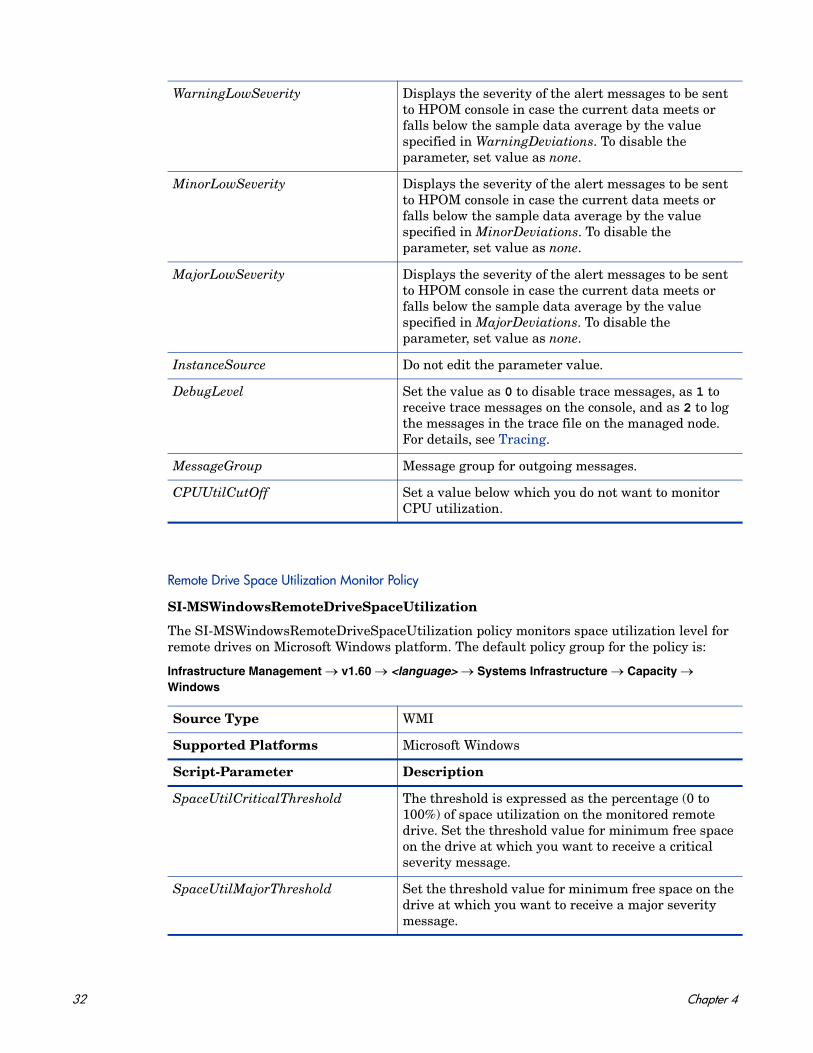
Remote Drive Space Utilization Monitor Policy
SI-MSWindowsRemoteDriveSpaceUtilization
The SI-MSWindowsRemoteDriveSpaceUtilization policy monitors space utilization level for remote drives on Microsoft Windows platform. The default policy group for the policy is:
Infrastructure Management → v1.60 → <language> → Systems Infrastructure → Capacity → Windows
WarningLowSeverity Displays the severity of the alert messages to be sent to HPOM console in case the current data meets or falls below the sample data average by the value specified in WarningDeviations. To disable the parameter, set value as none.
MinorLowSeverity Displays the severity of the alert messages to be sent to HPOM console in case the current data meets or falls below the sample data average by the value specified in MinorDeviations. To disable the parameter, set value as none.
MajorLowSeverity Displays the severity of the alert messages to be sent to HPOM console in case the current data meets or falls below the sample data average by the value specified in MajorDeviations. To disable the parameter, set value as none.
InstanceSource Do not edit the parameter value.
DebugLevel Set the value as 0 to disable trace messages, as 1 to receive trace messages on the console, and as 2 to log the messages in the trace file on the managed node. For details, see Tracing.
MessageGroup Message group for outgoing messages.
CPUUtilCutOff Set a value below which you do not want to monitor CPU utilization.
Source Type WMI
Supported Platforms Microsoft Windows
Script-Parameter Description
SpaceUtilCriticalThreshold The threshold is expressed as the percentage (0 to 100%) of space utilization on the monitored remote drive. Set the threshold value for minimum free space on the drive at which you want to receive a critical severity message.
SpaceUtilMajorThreshold Set the threshold value for minimum free space on the drive at which you want to receive a major severity message.
32 Chapter 4
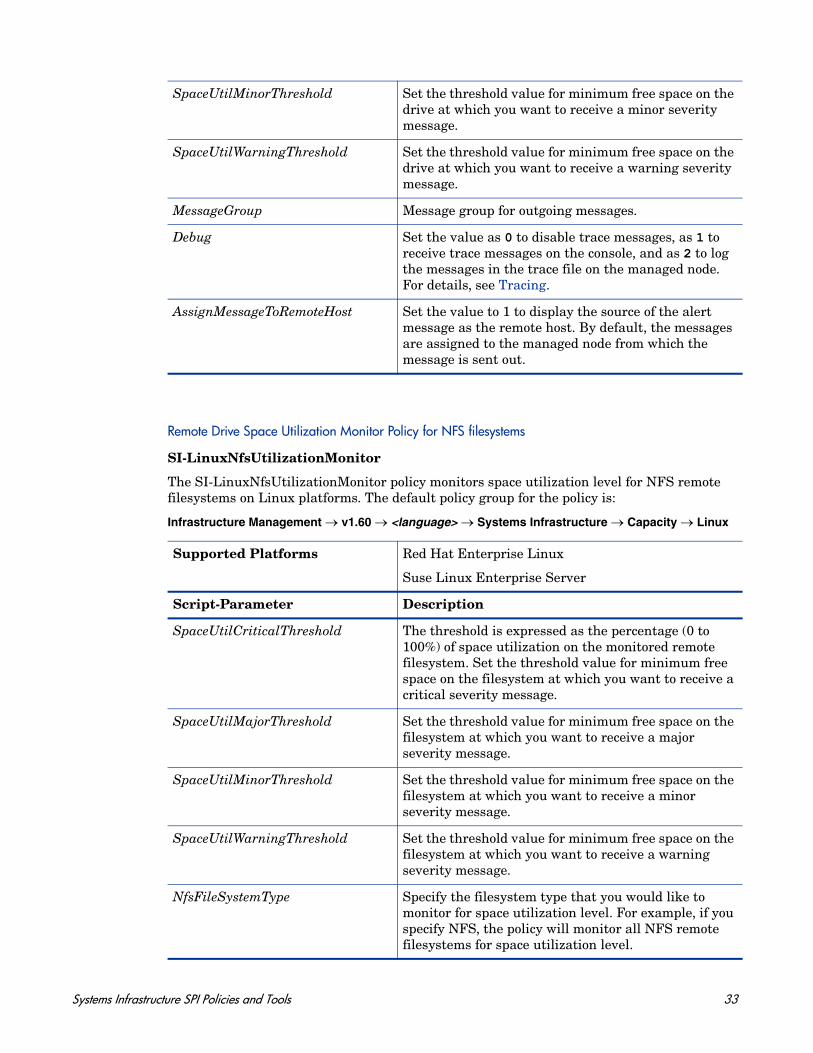
Remote Drive Space Utilization Monitor Policy for NFS filesystems
SI-LinuxNfsUtilizationMonitor
The SI-LinuxNfsUtilizationMonitor policy monitors space utilization level for NFS remote filesystems on Linux platforms. The default policy group for the policy is:
Infrastructure Management → v1.60 → <language> → Systems Infrastructure → Capacity → Linux
SpaceUtilMinorThreshold Set the threshold value for minimum free space on the drive at which you want to receive a minor severity message.
SpaceUtilWarningThreshold Set the threshold value for minimum free space on the drive at which you want to receive a warning severity message.
MessageGroup Message group for outgoing messages.
Debug Set the value as 0 to disable trace messages, as 1 to receive trace messages on the console, and as 2 to log the messages in the trace file on the managed node. For details, see Tracing.
AssignMessageToRemoteHost Set the value to 1 to display the source of the alert message as the remote host. By default, the messages are assigned to the managed node from which the message is sent out.
Supported Platforms Red Hat Enterprise Linux
Suse Linux Enterprise Server
Script-Parameter Description
SpaceUtilCriticalThreshold The threshold is expressed as the percentage (0 to 100%) of space utilization on the monitored remote filesystem. Set the threshold value for minimum free space on the filesystem at which you want to receive a critical severity message.
SpaceUtilMajorThreshold Set the threshold value for minimum free space on the filesystem at which you want to receive a major severity message.
SpaceUtilMinorThreshold Set the threshold value for minimum free space on the filesystem at which you want to receive a minor severity message.
SpaceUtilWarningThreshold Set the threshold value for minimum free space on the filesystem at which you want to receive a warning severity message.
NfsFileSystemType Specify the filesystem type that you would like to monitor for space utilization level. For example, if you specify NFS, the policy will monitor all NFS remote filesystems for space utilization level.
Systems Infrastructure SPI Policies and Tools 33
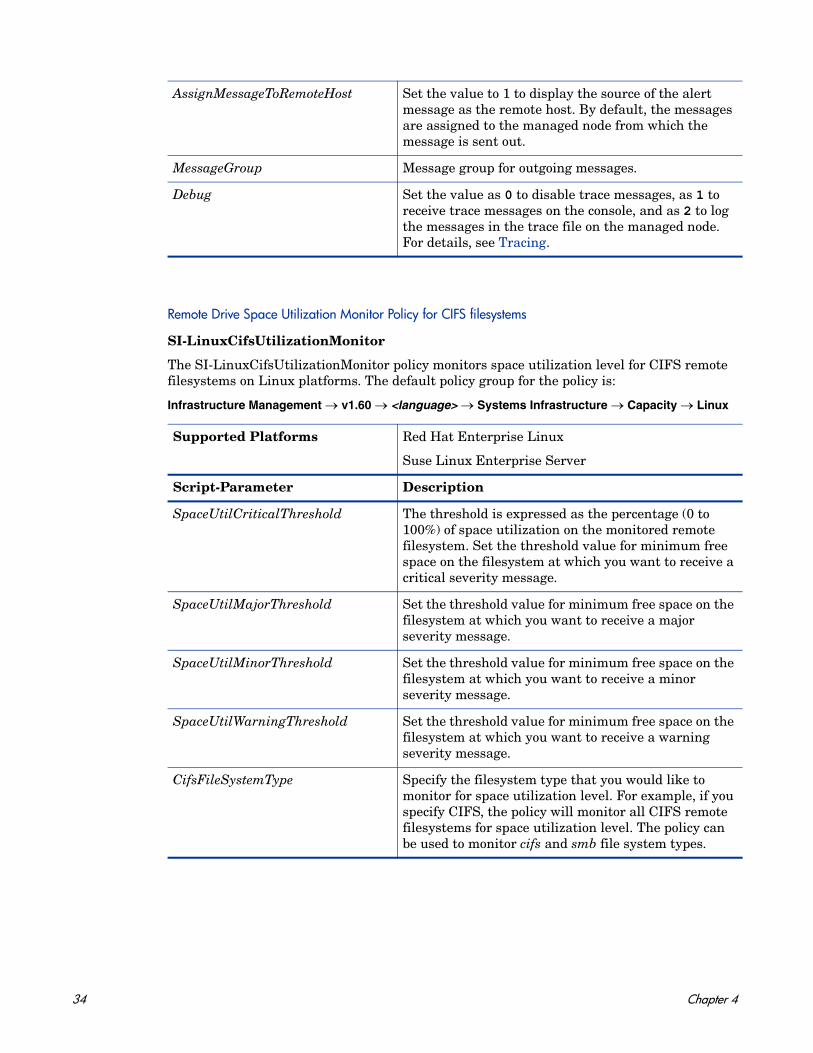
Remote Drive Space Utilization Monitor Policy for CIFS filesystems
SI-LinuxCifsUtilizationMonitor
The SI-LinuxCifsUtilizationMonitor policy monitors space utilization level for CIFS remote filesystems on Linux platforms. The default policy group for the policy is:
Infrastructure Management → v1.60 → <language> → Systems Infrastructure → Capacity → Linux
AssignMessageToRemoteHost Set the value to 1 to display the source of the alert message as the remote host. By default, the messages are assigned to the managed node from which the message is sent out.
MessageGroup Message group for outgoing messages.
Debug Set the value as 0 to disable trace messages, as 1 to receive trace messages on the console, and as 2 to log the messages in the trace file on the managed node. For details, see Tracing.
Supported Platforms Red Hat Enterprise Linux
Suse Linux Enterprise Server
Script-Parameter Description
SpaceUtilCriticalThreshold The threshold is expressed as the percentage (0 to 100%) of space utilization on the monitored remote filesystem. Set the threshold value for minimum free space on the filesystem at which you want to receive a critical severity message.
SpaceUtilMajorThreshold Set the threshold value for minimum free space on the filesystem at which you want to receive a major severity message.
SpaceUtilMinorThreshold Set the threshold value for minimum free space on the filesystem at which you want to receive a minor severity message.
SpaceUtilWarningThreshold Set the threshold value for minimum free space on the filesystem at which you want to receive a warning severity message.
CifsFileSystemType Specify the filesystem type that you would like to monitor for space utilization level. For example, if you specify CIFS, the policy will monitor all CIFS remote filesystems for space utilization level. The policy can be used to monitor cifs and smb file system types.
34 Chapter 4
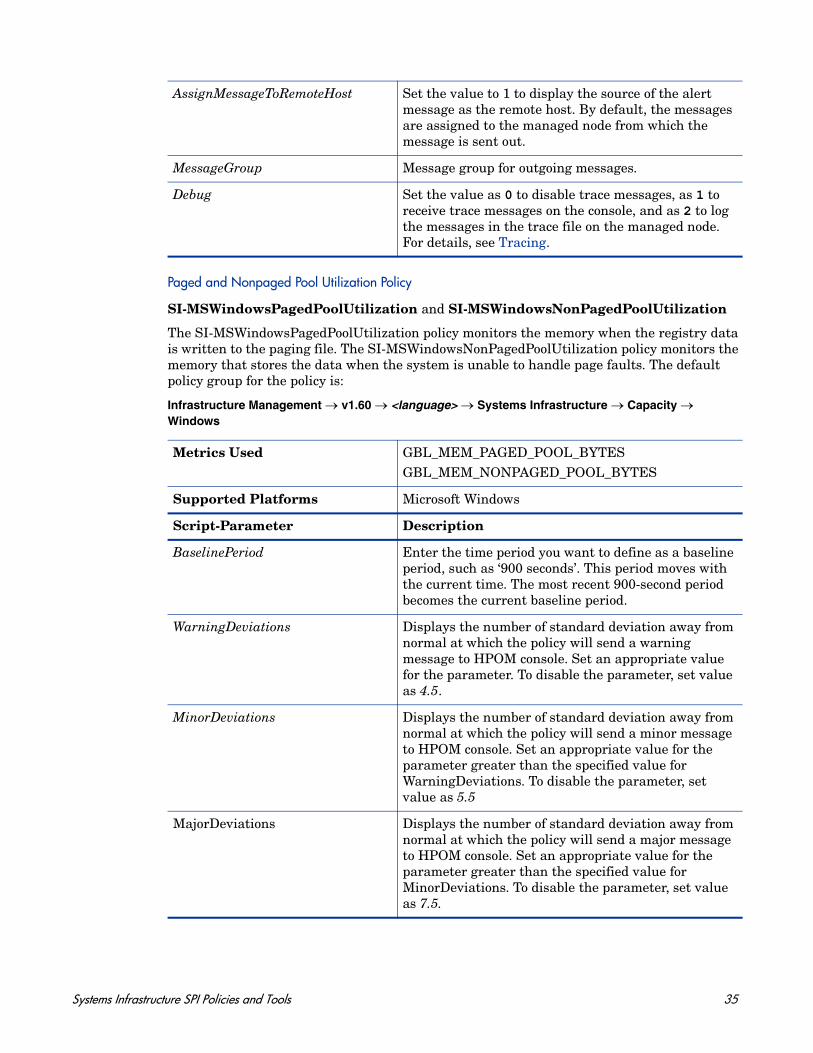
Paged and Nonpaged Pool Utilization Policy
SI-MSWindowsPagedPoolUtilization and SI-MSWindowsNonPagedPoolUtilization
The SI-MSWindowsPagedPoolUtilization policy monitors the memory when the registry data is written to the paging file. The SI-MSWindowsNonPagedPoolUtilization policy monitors the memory that stores the data when the system is unable to handle page faults. The default policy group for the policy is:
Infrastructure Management → v1.60 → <language> → Systems Infrastructure → Capacity → Windows
AssignMessageToRemoteHost Set the value to 1 to display the source of the alert message as the remote host. By default, the messages are assigned to the managed node from which the message is sent out.
MessageGroup Message group for outgoing messages.
Debug Set the value as 0 to disable trace messages, as 1 to receive trace messages on the console, and as 2 to log the messages in the trace file on the managed node. For details, see Tracing.
Metrics Used GBL_MEM_PAGED_POOL_BYTESGBL_MEM_NONPAGED_POOL_BYTES
Supported Platforms Microsoft Windows
Script-Parameter Description
BaselinePeriod Enter the time period you want to define as a baseline period, such as ‘900 seconds’. This period moves with the current time. The most recent 900-second period becomes the current baseline period.
WarningDeviations Displays the number of standard deviation away from normal at which the policy will send a warning message to HPOM console. Set an appropriate value for the parameter. To disable the parameter, set value as 4.5.
MinorDeviations Displays the number of standard deviation away from normal at which the policy will send a minor message to HPOM console. Set an appropriate value for the parameter greater than the specified value for WarningDeviations. To disable the parameter, set value as 5.5
MajorDeviations Displays the number of standard deviation away from normal at which the policy will send a major message to HPOM console. Set an appropriate value for the parameter greater than the specified value for MinorDeviations. To disable the parameter, set value as 7.5.
Systems Infrastructure SPI Policies and Tools 35
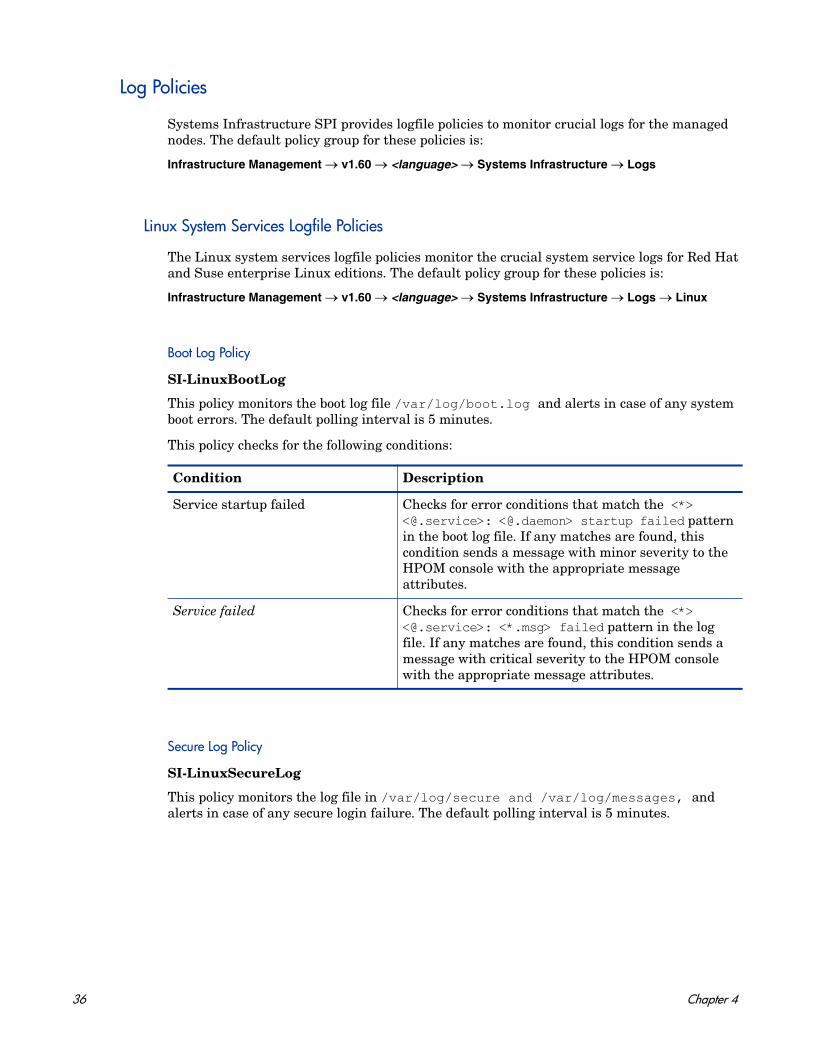
Log Policies
Systems Infrastructure SPI provides logfile policies to monitor crucial logs for the managed nodes. The default policy group for these policies is:
Infrastructure Management → v1.60 → <language> → Systems Infrastructure → Logs
Linux System Services Logfile Policies
The Linux system services logfile policies monitor the crucial system service logs for Red Hat and Suse enterprise Linux editions. The default policy group for these policies is:
Infrastructure Management → v1.60 → <language> → Systems Infrastructure → Logs → Linux
Boot Log Policy
SI-LinuxBootLog
This policy monitors the boot log file /var/log/boot.log and alerts in case of any system boot errors. The default polling interval is 5 minutes.
This policy checks for the following conditions:
Secure Log Policy
SI-LinuxSecureLog
This policy monitors the log file in /var/log/secure and /var/log/messages, and alerts in case of any secure login failure. The default polling interval is 5 minutes.
Condition Description
Service startup failed Checks for error conditions that match the <*> <@.service>: <@.daemon> startup failed pattern in the boot log file. If any matches are found, this condition sends a message with minor severity to the HPOM console with the appropriate message attributes.
Service failed Checks for error conditions that match the <*> <@.service>: <*.msg> failed pattern in the log file. If any matches are found, this condition sends a message with critical severity to the HPOM console with the appropriate message attributes.
36 Chapter 4
This policy checks for the following condition:
Kernel Log Policy
SI-LinuxKernelLog
This policy monitors the kernel log file /var/log/messages and alerts in case of any kernel service failure. The default polling interval is 5 minutes.
This policy checks for the following condition:
Windows System Services Logfile Policies
The Windows Server logfile policies monitor the crucial system service logs for Microsoft Windows 2008 or later versions. The default policy group for these policies is:
Infrastructure Management → v1.60 → <language> → Systems Infrastructure → Logs → MS Windows Server
NFS Log Policy
SI-MSWindowsServer_NFSWarnError
This policy monitors the NFS log file for the NFS server processes and forwards the errors to the HPOM console with a severity level of warning or error. The default polling interval is 1 minute. The policy looks for the following errors recorded in the NFS log file:
• The NFS server detected a low disk space condition and has stopped recording audits.
• The audit log has reached its maximum file size.
• The NFS server could not register with RPC Port Mapper.
• The NFS driver failed during phase 2 initialization.
Condition Description
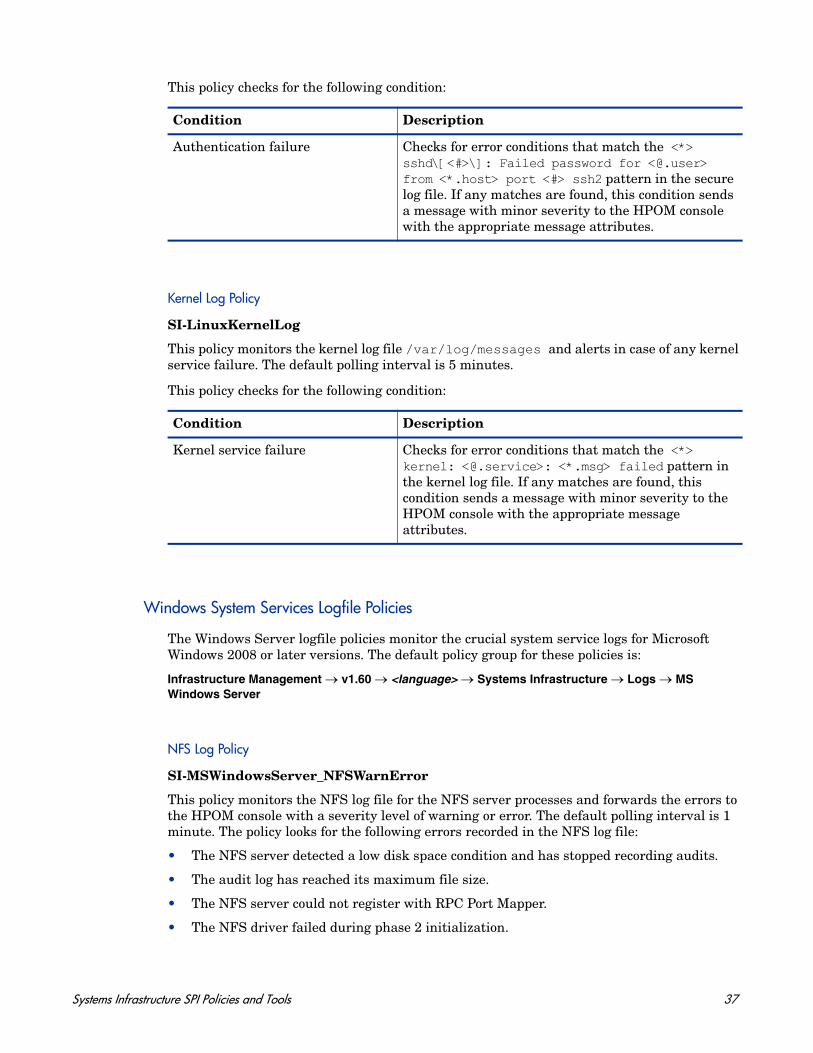
Authentication failure Checks for error conditions that match the <*> sshd\[<#>\]: Failed password for <@.user> from <*.host> port <#> ssh2 pattern in the secure log file. If any matches are found, this condition sends a message with minor severity to the HPOM console with the appropriate message attributes.
Condition Description
Kernel service failure Checks for error conditions that match the <*> kernel: <@.service>: <*.msg> failed pattern in the kernel log file. If any matches are found, this condition sends a message with minor severity to the HPOM console with the appropriate message attributes.
Systems Infrastructure SPI Policies and Tools 37
DNS Log Policy
SI-MSWindowsServer_DNSWarnError
This policy monitors the log file for the Microsoft DNS server service and its corresponding process and forwards the error log entries to the HPOM console with a severity level of warning or error. The default polling interval is 1 minute. The policy looks for the following errors recorded in the DNS log file:
• The DNS server could not allocate memory for the resource record.
• The DNS server was unable to service a client request due a shortage of available memory.
• The DNS server could not create a zone transfer thread.
• The DNS server encountered an error while writing to a file.
• The DNS server could not initialize the remote procedure call (RPC) service.
Windows Logon Policy
SI-MSWindowsServer_WindowsLogonWarnError
This policy monitors the Windows logon and initialization event logs and forwards the error log entries to the HPOM console with a severity level of warning or error. The default polling interval is 1 minute. The policy looks for the following errors recorded in the Windows log file:
• Windows license is invalid
• Windows license activation failed
• The Windows logon process has failed to switch the desktop
• The Windows logon process has unexpectedly terminated
• The Windows logon process has failed to spawn a user application
• The Windows logon process has failed to terminate currently logged on user's processes
• The Windows logon process has failed to disconnect the user session
Terminal Service Log Policy
SI-MSWindowsServer_TerminalServiceWarnError
This policy monitors the log file for Windows Terminal service and its corresponding process and forwards the error log entries to the HPOM console with a severity level of warning or error. The default polling interval is 1 minute. The policy looks for the following errors recorded in the Windows Terminal service log file:
• A connection request was denied because the terminal server is currently configured to not accept connections
• Auto-reconnect failed to reconnect the user to the session because authentication failed
• Terminal service failed to start
• The terminal server received large number of incomplete connections
38 Chapter 4
Windows Server DHCP Error
SI-MSWindowsServer_DHCPWarnError
This policy monitors the log file for DHCP server and client services and their corresponding processes, and forwards the error log entries to the HPOM console with a severity level of warning or error. The default polling interval is 1 minute. The policy looks for the following errors recorded in the Windows Terminal service log file:
• Iashlpr cannot contact the NPS service
• There are no IP addresses available for BOOTP clients in the scope or superscope
• The DHCP server is unable to reach the NPS server for determining the client's NAP access state
• There are no IP addresses available for lease in the scope or superscope
• The DHCP/BINL service on the local computer has determined that it is not authorized to start
• The DHCP service failed to initialize the audit log
• The DHCP/BINL service on this workgroup server has encountered another server with IP Address
• The DHCP service failed to restore the DHCP registry configuration
• The DHCP service was unable to read the global BOOTP file name from the registry
• The DHCP service is not servicing any clients because there are no active interfaces.
• There is no static IP address bound to the DHCP server
• The DHCP server service failed to register with Service Controller
• The DHCP server service failed to initialize its registry parameters
AIX System Logfile Monitoring Policies
The AIX system logfile monitoring policies monitors the crucial system faults. The default policy group for these policies is:
Infrastructure Management → v1.60 → <language> → Systems Infrastructure → Logs → AIX
ERRPT Log Monitoring Policy
SI-AIXErrptLog
The output of ‘errpt’ command is stored as system errors in a file called errpt.log. These messages are displayed as warning alerts. The alert must contain error codes, classes, and outages.
Systems Infrastructure SPI Policies and Tools 39
Performance Policies
Performance monitoring helps to preempt performance disruption and identify when the infrastructure issues can threaten service quality. You can use the collected performance data to correlate events across the entire infrastructure of servers, operating systems, network devices, and applications in order to prevent or identify the root cause of a developing performance issue.
The default policy group for these policies is:
Infrastructure Management → v1.60 → <language> → Systems Infrastructure → Performance
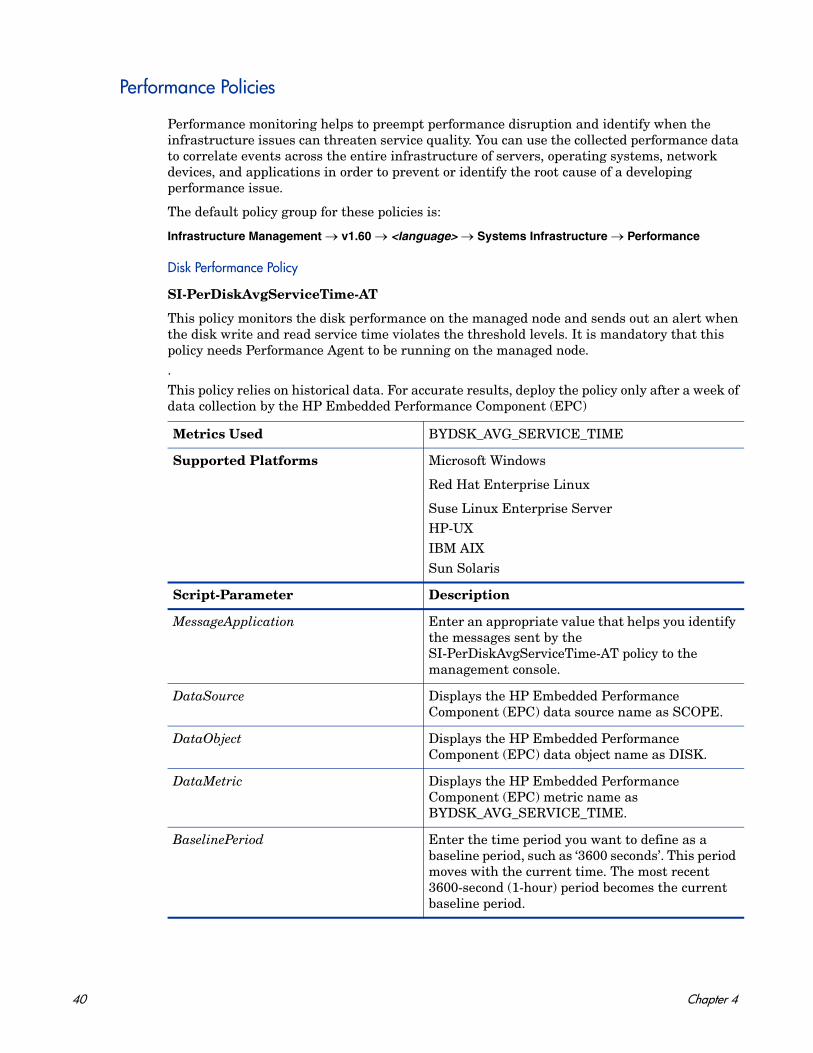
Disk Performance Policy
SI-PerDiskAvgServiceTime-AT
This policy monitors the disk performance on the managed node and sends out an alert when the disk write and read service time violates the threshold levels. It is mandatory that this policy needs Performance Agent to be running on the managed node..This policy relies on historical data. For accurate results, deploy the policy only after a week of data collection by the HP Embedded Performance Component (EPC)
Metrics Used BYDSK_AVG_SERVICE_TIME
Supported Platforms Microsoft Windows
Red Hat Enterprise Linux
Suse Linux Enterprise ServerHP-UXIBM AIXSun Solaris
Script-Parameter Description
MessageApplication Enter an appropriate value that helps you identify the messages sent by the SI-PerDiskAvgServiceTime-AT policy to the management console.
DataSource Displays the HP Embedded Performance Component (EPC) data source name as SCOPE.
DataObject Displays the HP Embedded Performance Component (EPC) data object name as DISK.
DataMetric Displays the HP Embedded Performance Component (EPC) metric name as BYDSK_AVG_SERVICE_TIME.
BaselinePeriod Enter the time period you want to define as a baseline period, such as ‘3600 seconds’. This period moves with the current time. The most recent 3600-second (1-hour) period becomes the current baseline period.
40 Chapter 4
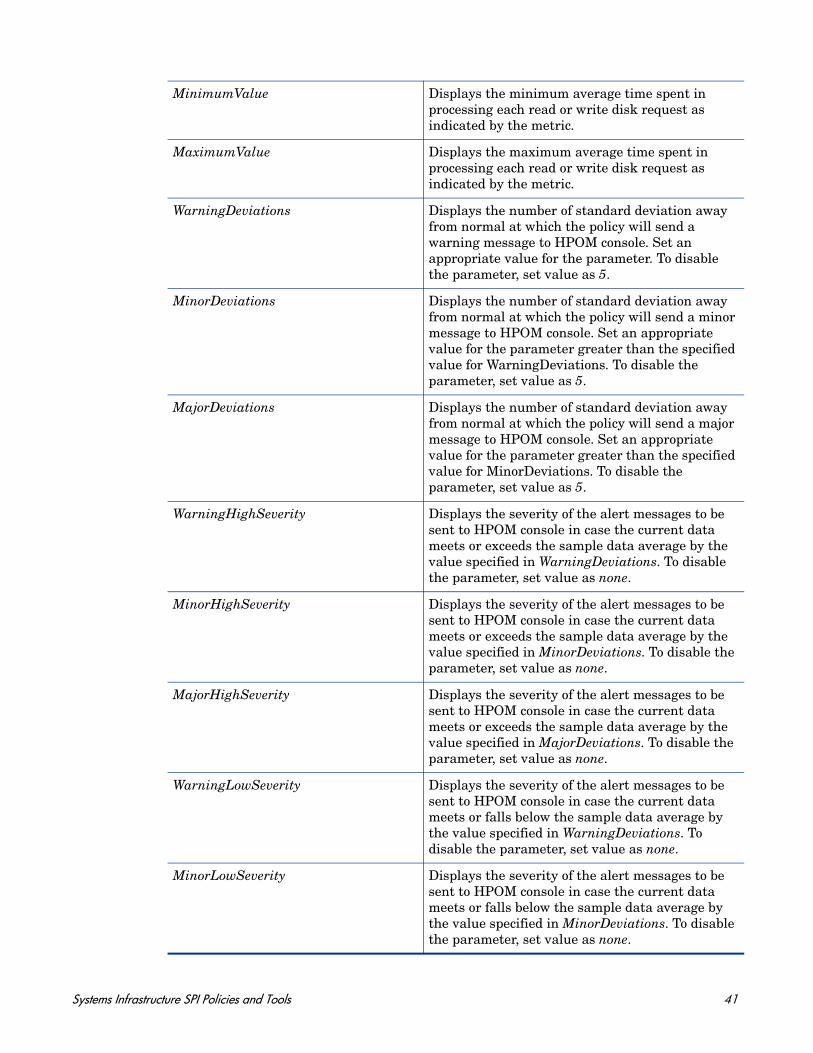
MinimumValue Displays the minimum average time spent in processing each read or write disk request as indicated by the metric.
MaximumValue Displays the maximum average time spent in processing each read or write disk request as indicated by the metric.
WarningDeviations Displays the number of standard deviation away from normal at which the policy will send a warning message to HPOM console. Set an appropriate value for the parameter. To disable the parameter, set value as 5.
MinorDeviations Displays the number of standard deviation away from normal at which the policy will send a minor message to HPOM console. Set an appropriate value for the parameter greater than the specified value for WarningDeviations. To disable the parameter, set value as 5.
MajorDeviations Displays the number of standard deviation away from normal at which the policy will send a major message to HPOM console. Set an appropriate value for the parameter greater than the specified value for MinorDeviations. To disable the parameter, set value as 5.
WarningHighSeverity Displays the severity of the alert messages to be sent to HPOM console in case the current data meets or exceeds the sample data average by the value specified in WarningDeviations. To disable the parameter, set value as none.
MinorHighSeverity Displays the severity of the alert messages to be sent to HPOM console in case the current data meets or exceeds the sample data average by the value specified in MinorDeviations. To disable the parameter, set value as none.
MajorHighSeverity Displays the severity of the alert messages to be sent to HPOM console in case the current data meets or exceeds the sample data average by the value specified in MajorDeviations. To disable the parameter, set value as none.
WarningLowSeverity Displays the severity of the alert messages to be sent to HPOM console in case the current data meets or falls below the sample data average by the value specified in WarningDeviations. To disable the parameter, set value as none.
MinorLowSeverity Displays the severity of the alert messages to be sent to HPOM console in case the current data meets or falls below the sample data average by the value specified in MinorDeviations. To disable the parameter, set value as none.
Systems Infrastructure SPI Policies and Tools 41
Global CPU Utilization Monitor Policy
SI-GlobalCPUUtilization-AT
This policy monitors the performance of the CPUs on the managed node and sends out an alert when the utilization across all CPUs violates the threshold levels.
This policy relies on historical data. For accurate results, deploy the policy only after a week of data collection by the HP Embedded Performance Component (EPC)
MajorLowSeverity Displays the severity of the alert messages to be sent to HPOM console in case the current data meets or falls below the sample data average by the value specified in MajorDeviations. To disable the parameter, set value as none.
InstanceSource Do not edit the parameter value.
DebugLevel Set the value as 0 to disable trace messages, as 1 to receive trace messages on the console, and as 2 to log the messages in the trace file on the managed node. For details, see Tracing.
MessageGroup Message group for outgoing messages.
DiskIOCutOff Set a value below which you do not want to monitor the disk write and reads service time.
Metrics Used GBL_CPU_TOTAL_UTIL
Supported Platforms Microsoft Windows
Red Hat Enterprise Linux
Suse Linux Enterprise ServerHP-UXIBM AIXSun Solaris
Script-Parameter Description
MessageApplication Enter an appropriate value that helps you identify the messages sent by the SI-GlobalCPUUtilization-AT policy to the management console.
DataSource Displays the HP Embedded Performance Component (EPC) data source name as CODA.
DataObject Displays the HP Embedded Performance Component (EPC) data object name as GLOBAL.
DataMetric Displays the HP Embedded Performance Component (EPC) metric name as GBL_CPU_TOTAL_UTIL.
42 Chapter 4
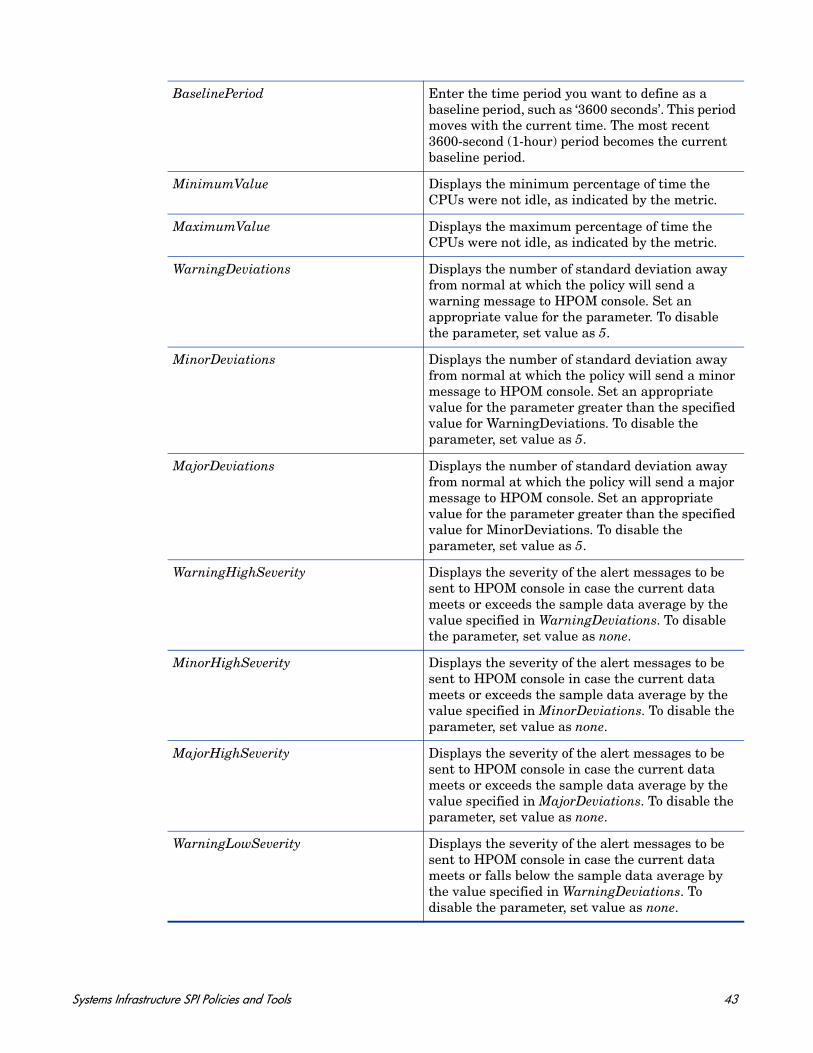
BaselinePeriod Enter the time period you want to define as a baseline period, such as ‘3600 seconds’. This period moves with the current time. The most recent 3600-second (1-hour) period becomes the current baseline period.
MinimumValue Displays the minimum percentage of time the CPUs were not idle, as indicated by the metric.
MaximumValue Displays the maximum percentage of time the CPUs were not idle, as indicated by the metric.
WarningDeviations Displays the number of standard deviation away from normal at which the policy will send a warning message to HPOM console. Set an appropriate value for the parameter. To disable the parameter, set value as 5.
MinorDeviations Displays the number of standard deviation away from normal at which the policy will send a minor message to HPOM console. Set an appropriate value for the parameter greater than the specified value for WarningDeviations. To disable the parameter, set value as 5.
MajorDeviations Displays the number of standard deviation away from normal at which the policy will send a major message to HPOM console. Set an appropriate value for the parameter greater than the specified value for MinorDeviations. To disable the parameter, set value as 5.
WarningHighSeverity Displays the severity of the alert messages to be sent to HPOM console in case the current data meets or exceeds the sample data average by the value specified in WarningDeviations. To disable the parameter, set value as none.
MinorHighSeverity Displays the severity of the alert messages to be sent to HPOM console in case the current data meets or exceeds the sample data average by the value specified in MinorDeviations. To disable the parameter, set value as none.
MajorHighSeverity Displays the severity of the alert messages to be sent to HPOM console in case the current data meets or exceeds the sample data average by the value specified in MajorDeviations. To disable the parameter, set value as none.
WarningLowSeverity Displays the severity of the alert messages to be sent to HPOM console in case the current data meets or falls below the sample data average by the value specified in WarningDeviations. To disable the parameter, set value as none.
Systems Infrastructure SPI Policies and Tools 43
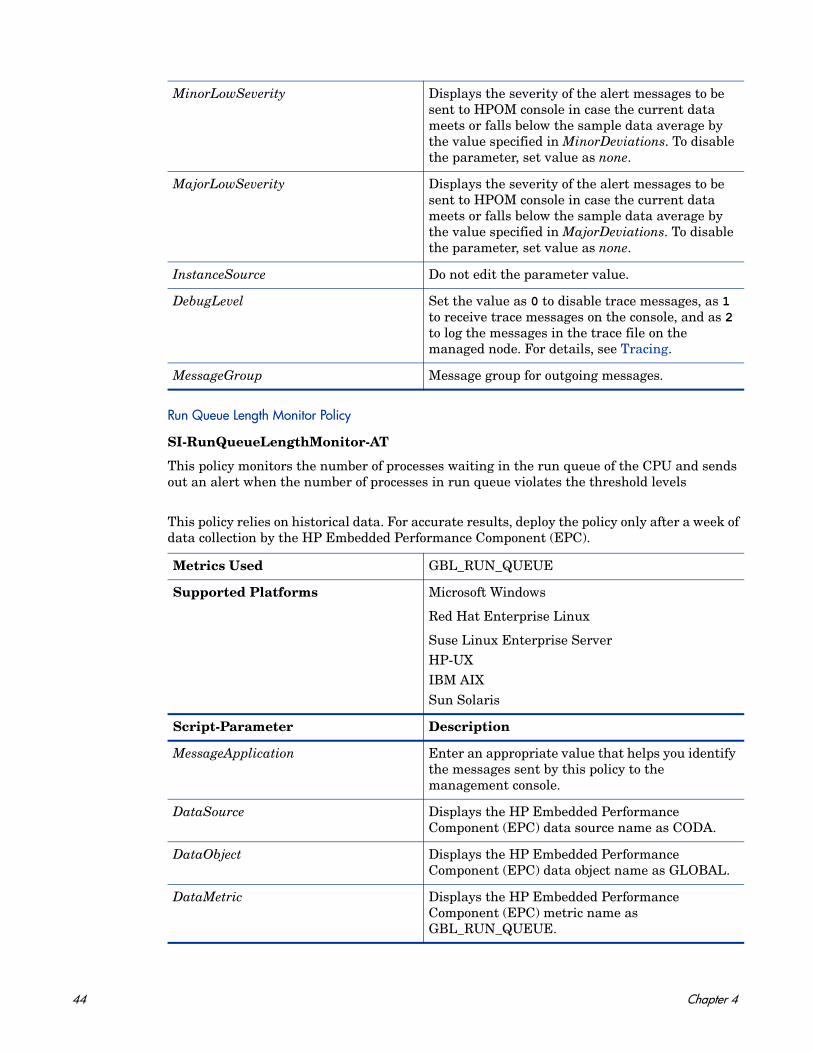
Run Queue Length Monitor Policy
SI-RunQueueLengthMonitor-AT
This policy monitors the number of processes waiting in the run queue of the CPU and sends out an alert when the number of processes in run queue violates the threshold levels
This policy relies on historical data. For accurate results, deploy the policy only after a week of data collection by the HP Embedded Performance Component (EPC).
MinorLowSeverity Displays the severity of the alert messages to be sent to HPOM console in case the current data meets or falls below the sample data average by the value specified in MinorDeviations. To disable the parameter, set value as none.
MajorLowSeverity Displays the severity of the alert messages to be sent to HPOM console in case the current data meets or falls below the sample data average by the value specified in MajorDeviations. To disable the parameter, set value as none.
InstanceSource Do not edit the parameter value.
DebugLevel Set the value as 0 to disable trace messages, as 1 to receive trace messages on the console, and as 2 to log the messages in the trace file on the managed node. For details, see Tracing.
MessageGroup Message group for outgoing messages.
Metrics Used GBL_RUN_QUEUE
Supported Platforms Microsoft Windows
Red Hat Enterprise Linux
Suse Linux Enterprise ServerHP-UXIBM AIXSun Solaris
Script-Parameter Description
MessageApplication Enter an appropriate value that helps you identify the messages sent by this policy to the management console.
DataSource Displays the HP Embedded Performance Component (EPC) data source name as CODA.
DataObject Displays the HP Embedded Performance Component (EPC) data object name as GLOBAL.
DataMetric Displays the HP Embedded Performance Component (EPC) metric name as GBL_RUN_QUEUE.
44 Chapter 4
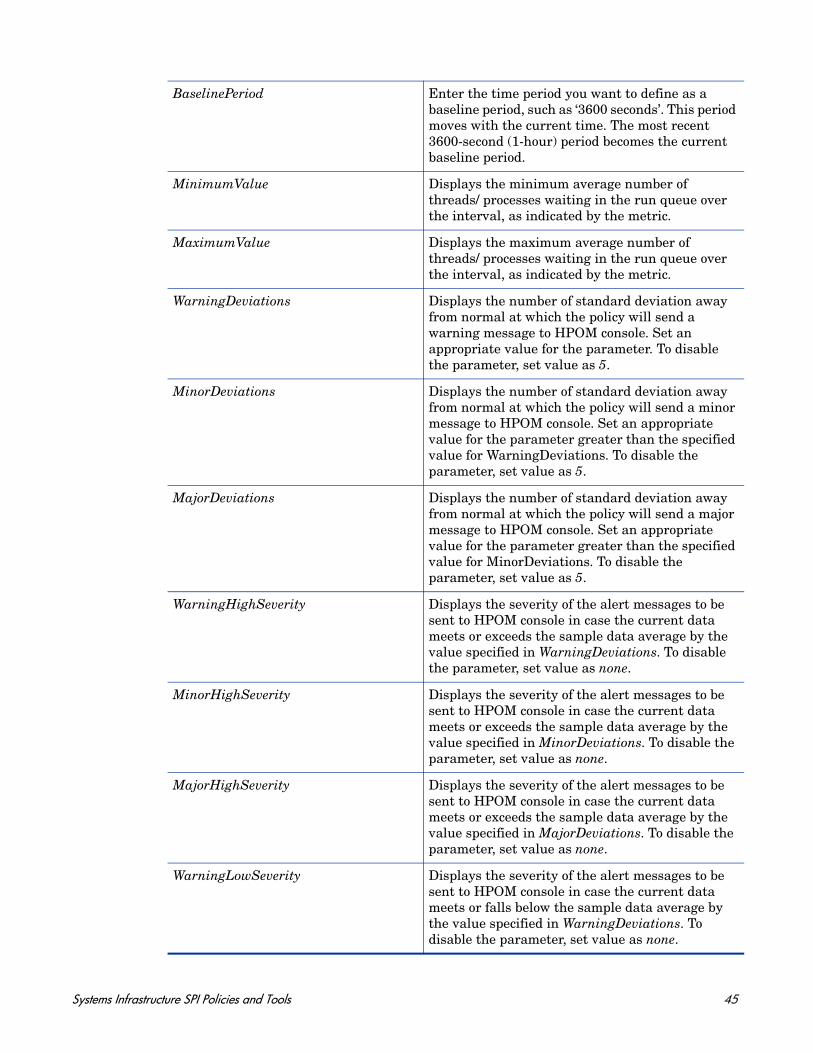
BaselinePeriod Enter the time period you want to define as a baseline period, such as ‘3600 seconds’. This period moves with the current time. The most recent 3600-second (1-hour) period becomes the current baseline period.
MinimumValue Displays the minimum average number of threads/ processes waiting in the run queue over the interval, as indicated by the metric.
MaximumValue Displays the maximum average number of threads/ processes waiting in the run queue over the interval, as indicated by the metric.
WarningDeviations Displays the number of standard deviation away from normal at which the policy will send a warning message to HPOM console. Set an appropriate value for the parameter. To disable the parameter, set value as 5.
MinorDeviations Displays the number of standard deviation away from normal at which the policy will send a minor message to HPOM console. Set an appropriate value for the parameter greater than the specified value for WarningDeviations. To disable the parameter, set value as 5.
MajorDeviations Displays the number of standard deviation away from normal at which the policy will send a major message to HPOM console. Set an appropriate value for the parameter greater than the specified value for MinorDeviations. To disable the parameter, set value as 5.
WarningHighSeverity Displays the severity of the alert messages to be sent to HPOM console in case the current data meets or exceeds the sample data average by the value specified in WarningDeviations. To disable the parameter, set value as none.
MinorHighSeverity Displays the severity of the alert messages to be sent to HPOM console in case the current data meets or exceeds the sample data average by the value specified in MinorDeviations. To disable the parameter, set value as none.
MajorHighSeverity Displays the severity of the alert messages to be sent to HPOM console in case the current data meets or exceeds the sample data average by the value specified in MajorDeviations. To disable the parameter, set value as none.
WarningLowSeverity Displays the severity of the alert messages to be sent to HPOM console in case the current data meets or falls below the sample data average by the value specified in WarningDeviations. To disable the parameter, set value as none.
Systems Infrastructure SPI Policies and Tools 45
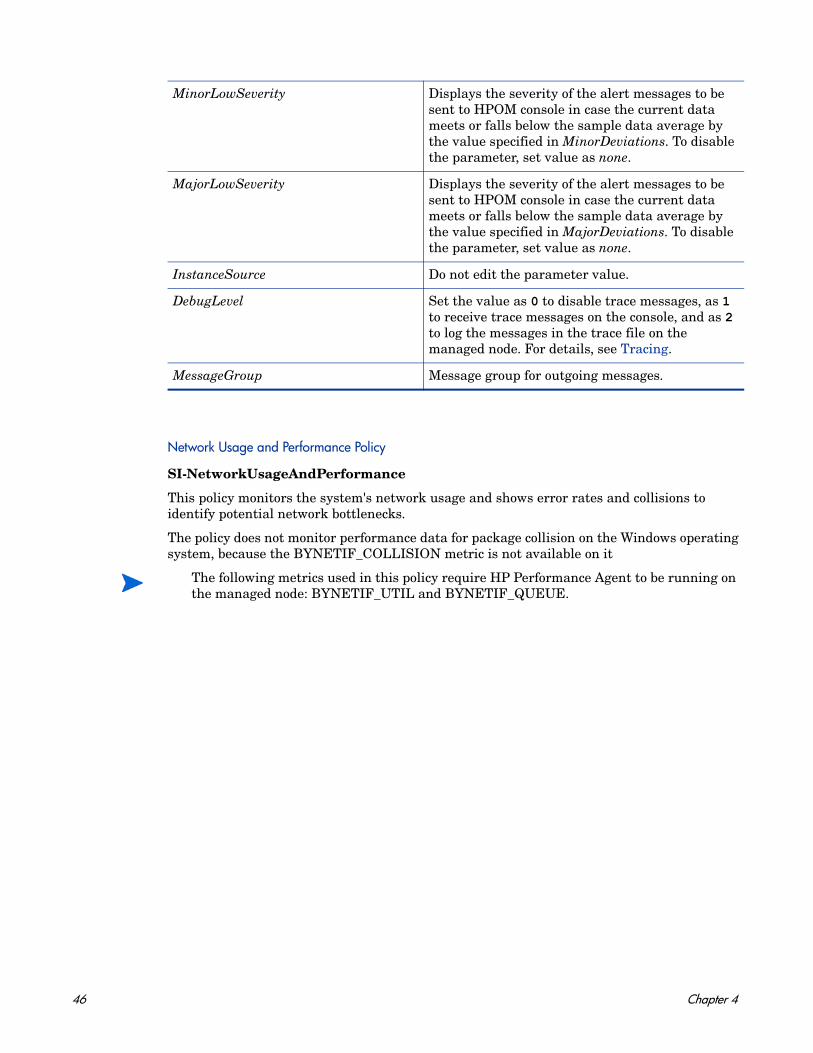
Network Usage and Performance Policy
SI-NetworkUsageAndPerformance
This policy monitors the system's network usage and shows error rates and collisions to identify potential network bottlenecks.
The policy does not monitor performance data for package collision on the Windows operating system, because the BYNETIF_COLLISION metric is not available on it
MinorLowSeverity Displays the severity of the alert messages to be sent to HPOM console in case the current data meets or falls below the sample data average by the value specified in MinorDeviations. To disable the parameter, set value as none.
MajorLowSeverity Displays the severity of the alert messages to be sent to HPOM console in case the current data meets or falls below the sample data average by the value specified in MajorDeviations. To disable the parameter, set value as none.
InstanceSource Do not edit the parameter value.
DebugLevel Set the value as 0 to disable trace messages, as 1 to receive trace messages on the console, and as 2 to log the messages in the trace file on the managed node. For details, see Tracing.
MessageGroup Message group for outgoing messages.
The following metrics used in this policy require HP Performance Agent to be running on the managed node: BYNETIF_UTIL and BYNETIF_QUEUE.
46 Chapter 4
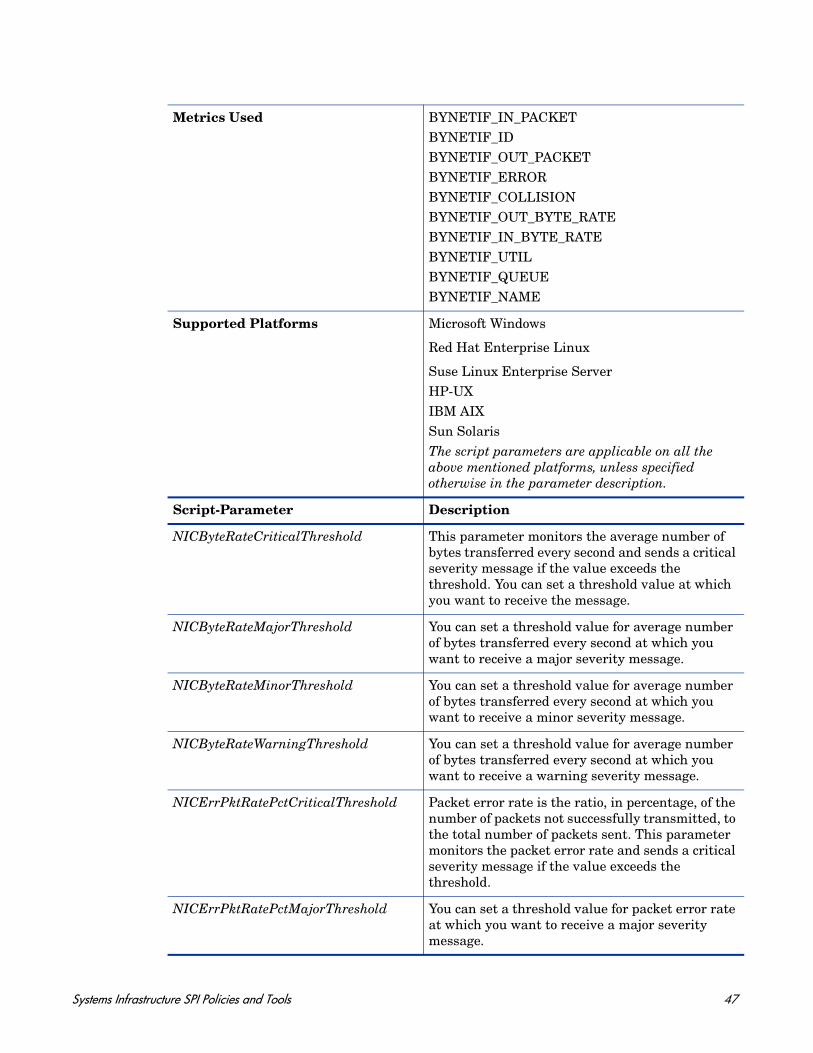
Metrics Used BYNETIF_IN_PACKETBYNETIF_IDBYNETIF_OUT_PACKETBYNETIF_ERRORBYNETIF_COLLISIONBYNETIF_OUT_BYTE_RATEBYNETIF_IN_BYTE_RATEBYNETIF_UTILBYNETIF_QUEUEBYNETIF_NAME
Supported Platforms Microsoft Windows
Red Hat Enterprise Linux
Suse Linux Enterprise ServerHP-UXIBM AIXSun SolarisThe script parameters are applicable on all the above mentioned platforms, unless specified otherwise in the parameter description.
Script-Parameter Description
NICByteRateCriticalThreshold This parameter monitors the average number of bytes transferred every second and sends a critical severity message if the value exceeds the threshold. You can set a threshold value at which you want to receive the message.
NICByteRateMajorThreshold You can set a threshold value for average number of bytes transferred every second at which you want to receive a major severity message.
NICByteRateMinorThreshold You can set a threshold value for average number of bytes transferred every second at which you want to receive a minor severity message.
NICByteRateWarningThreshold You can set a threshold value for average number of bytes transferred every second at which you want to receive a warning severity message.
NICErrPktRatePctCriticalThreshold Packet error rate is the ratio, in percentage, of the number of packets not successfully transmitted, to the total number of packets sent. This parameter monitors the packet error rate and sends a critical severity message if the value exceeds the threshold.
NICErrPktRatePctMajorThreshold You can set a threshold value for packet error rate at which you want to receive a major severity message.
Systems Infrastructure SPI Policies and Tools 47
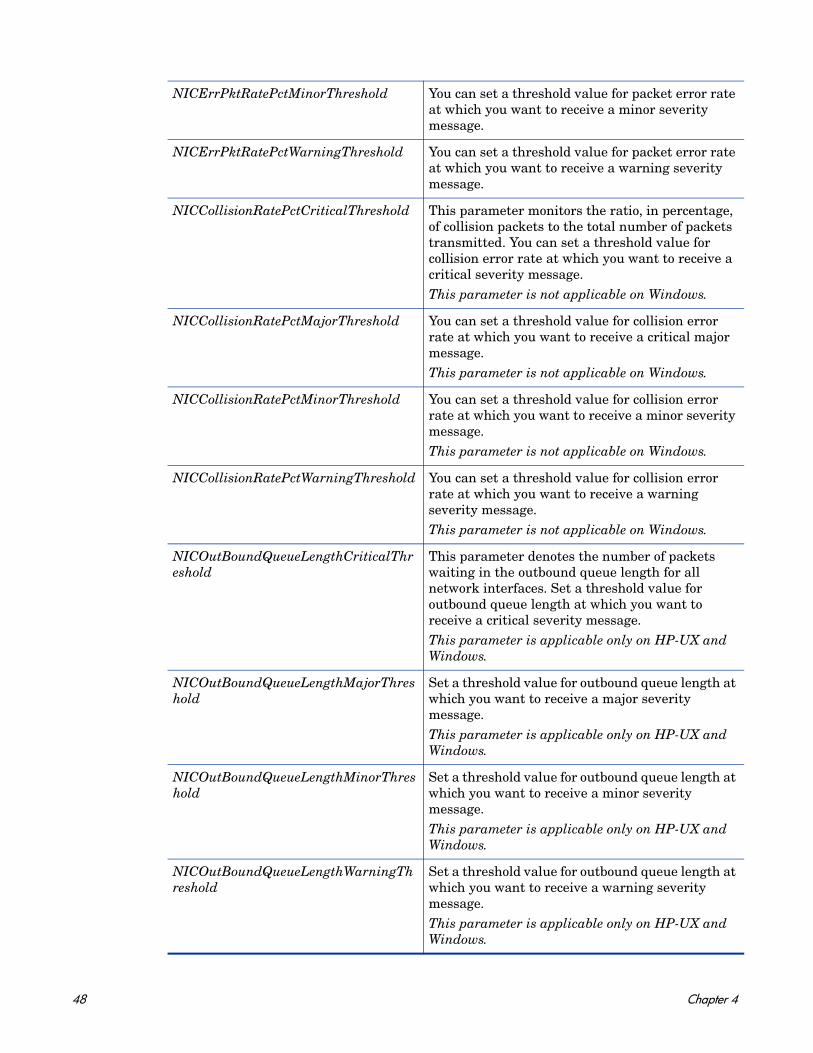
NICErrPktRatePctMinorThreshold You can set a threshold value for packet error rate at which you want to receive a minor severity message.
NICErrPktRatePctWarningThreshold You can set a threshold value for packet error rate at which you want to receive a warning severity message.
NICCollisionRatePctCriticalThreshold This parameter monitors the ratio, in percentage, of collision packets to the total number of packets transmitted. You can set a threshold value for collision error rate at which you want to receive a critical severity message. This parameter is not applicable on Windows.
NICCollisionRatePctMajorThreshold You can set a threshold value for collision error rate at which you want to receive a critical major message.This parameter is not applicable on Windows.
NICCollisionRatePctMinorThreshold You can set a threshold value for collision error rate at which you want to receive a minor severity message.This parameter is not applicable on Windows.
NICCollisionRatePctWarningThreshold You can set a threshold value for collision error rate at which you want to receive a warning severity message.This parameter is not applicable on Windows.
NICOutBoundQueueLengthCriticalThreshold
This parameter denotes the number of packets waiting in the outbound queue length for all network interfaces. Set a threshold value for outbound queue length at which you want to receive a critical severity message.This parameter is applicable only on HP-UX and Windows.
NICOutBoundQueueLengthMajorThreshold
Set a threshold value for outbound queue length at which you want to receive a major severity message.This parameter is applicable only on HP-UX and Windows.
NICOutBoundQueueLengthMinorThreshold
Set a threshold value for outbound queue length at which you want to receive a minor severity message.This parameter is applicable only on HP-UX and Windows.
NICOutBoundQueueLengthWarningThreshold
Set a threshold value for outbound queue length at which you want to receive a warning severity message.This parameter is applicable only on HP-UX and Windows.
48 Chapter 4
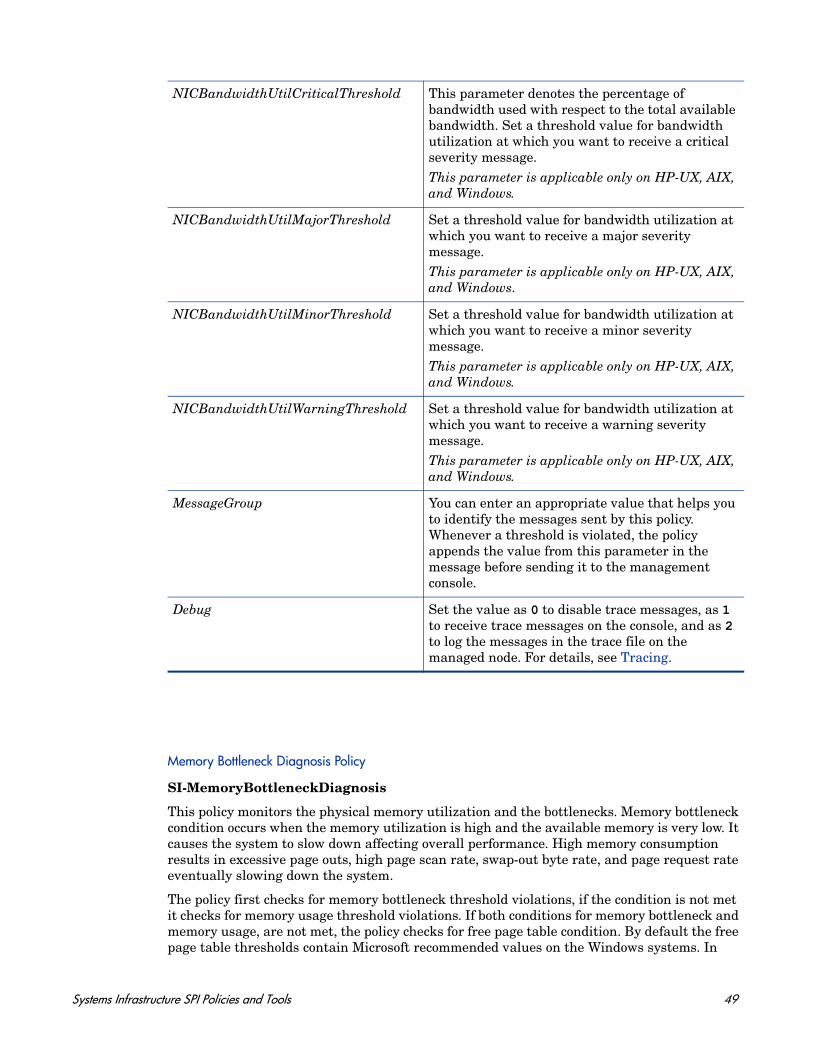
Memory Bottleneck Diagnosis Policy
SI-MemoryBottleneckDiagnosis
This policy monitors the physical memory utilization and the bottlenecks. Memory bottleneck condition occurs when the memory utilization is high and the available memory is very low. It causes the system to slow down affecting overall performance. High memory consumption results in excessive page outs, high page scan rate, swap-out byte rate, and page request rate eventually slowing down the system.
The policy first checks for memory bottleneck threshold violations, if the condition is not met it checks for memory usage threshold violations. If both conditions for memory bottleneck and memory usage, are not met, the policy checks for free page table condition. By default the free page table thresholds contain Microsoft recommended values on the Windows systems. In
NICBandwidthUtilCriticalThreshold This parameter denotes the percentage of bandwidth used with respect to the total available bandwidth. Set a threshold value for bandwidth utilization at which you want to receive a critical severity message.This parameter is applicable only on HP-UX, AIX, and Windows.
NICBandwidthUtilMajorThreshold Set a threshold value for bandwidth utilization at which you want to receive a major severity message.This parameter is applicable only on HP-UX, AIX, and Windows.
NICBandwidthUtilMinorThreshold Set a threshold value for bandwidth utilization at which you want to receive a minor severity message.This parameter is applicable only on HP-UX, AIX, and Windows.
NICBandwidthUtilWarningThreshold Set a threshold value for bandwidth utilization at which you want to receive a warning severity message.This parameter is applicable only on HP-UX, AIX, and Windows.
MessageGroup You can enter an appropriate value that helps you to identify the messages sent by this policy. Whenever a threshold is violated, the policy appends the value from this parameter in the message before sending it to the management console.
Debug Set the value as 0 to disable trace messages, as 1 to receive trace messages on the console, and as 2 to log the messages in the trace file on the managed node. For details, see Tracing.
Systems Infrastructure SPI Policies and Tools 49
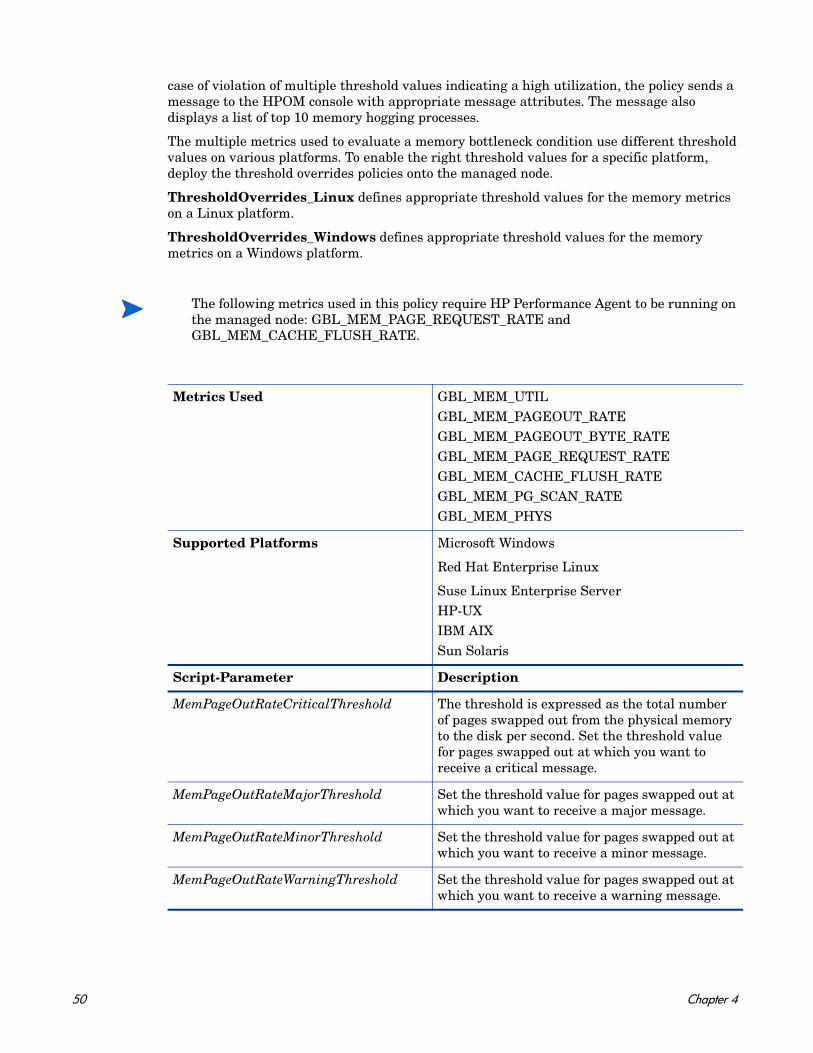
case of violation of multiple threshold values indicating a high utilization, the policy sends a message to the HPOM console with appropriate message attributes. The message also displays a list of top 10 memory hogging processes.
The multiple metrics used to evaluate a memory bottleneck condition use different threshold values on various platforms. To enable the right threshold values for a specific platform, deploy the threshold overrides policies onto the managed node.
ThresholdOverrides_Linux defines appropriate threshold values for the memory metrics on a Linux platform.
ThresholdOverrides_Windows defines appropriate threshold values for the memory metrics on a Windows platform.
The following metrics used in this policy require HP Performance Agent to be running on the managed node: GBL_MEM_PAGE_REQUEST_RATE and GBL_MEM_CACHE_FLUSH_RATE.
Metrics Used GBL_MEM_UTILGBL_MEM_PAGEOUT_RATE GBL_MEM_PAGEOUT_BYTE_RATE GBL_MEM_PAGE_REQUEST_RATE GBL_MEM_CACHE_FLUSH_RATE GBL_MEM_PG_SCAN_RATE GBL_MEM_PHYS
Supported Platforms Microsoft Windows
Red Hat Enterprise Linux
Suse Linux Enterprise ServerHP-UXIBM AIXSun Solaris
Script-Parameter Description
MemPageOutRateCriticalThreshold The threshold is expressed as the total number of pages swapped out from the physical memory to the disk per second. Set the threshold value for pages swapped out at which you want to receive a critical message.
MemPageOutRateMajorThreshold Set the threshold value for pages swapped out at which you want to receive a major message.
MemPageOutRateMinorThreshold Set the threshold value for pages swapped out at which you want to receive a minor message.
MemPageOutRateWarningThreshold Set the threshold value for pages swapped out at which you want to receive a warning message.
50 Chapter 4
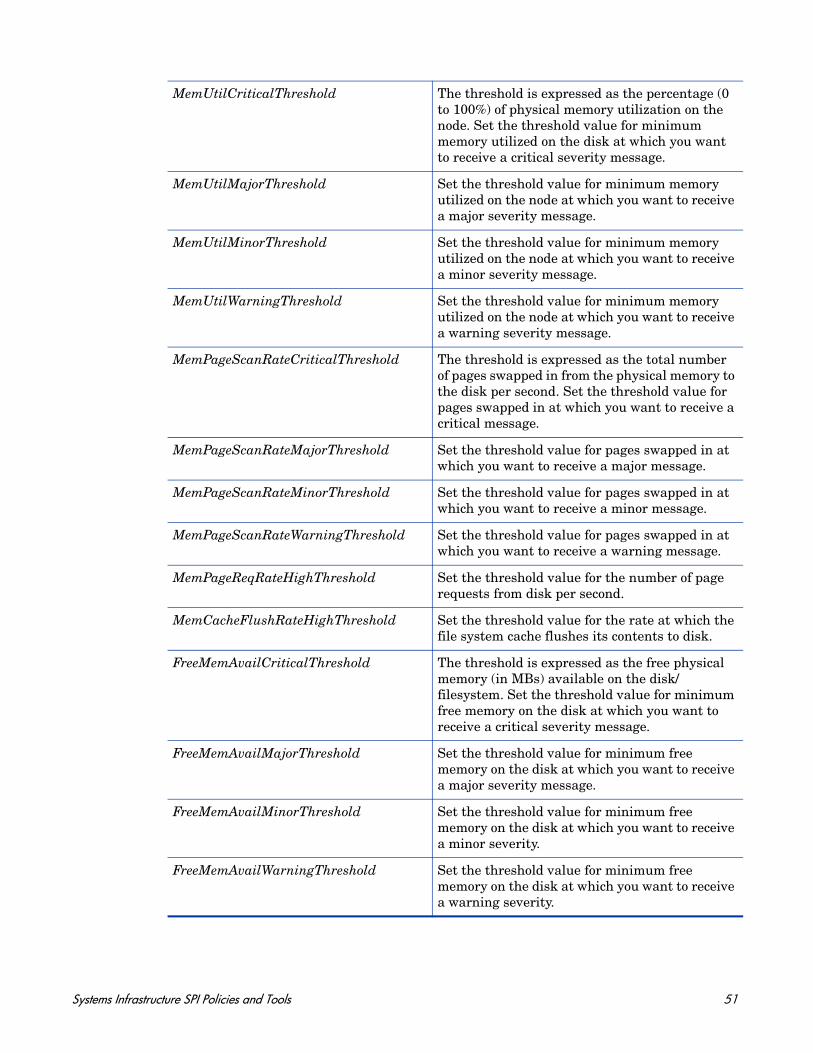
MemUtilCriticalThreshold The threshold is expressed as the percentage (0 to 100%) of physical memory utilization on the node. Set the threshold value for minimum memory utilized on the disk at which you want to receive a critical severity message.
MemUtilMajorThreshold Set the threshold value for minimum memory utilized on the node at which you want to receive a major severity message.
MemUtilMinorThreshold Set the threshold value for minimum memory utilized on the node at which you want to receive a minor severity message.
MemUtilWarningThreshold Set the threshold value for minimum memory utilized on the node at which you want to receive a warning severity message.
MemPageScanRateCriticalThreshold The threshold is expressed as the total number of pages swapped in from the physical memory to the disk per second. Set the threshold value for pages swapped in at which you want to receive a critical message.
MemPageScanRateMajorThreshold Set the threshold value for pages swapped in at which you want to receive a major message.
MemPageScanRateMinorThreshold Set the threshold value for pages swapped in at which you want to receive a minor message.
MemPageScanRateWarningThreshold Set the threshold value for pages swapped in at which you want to receive a warning message.
MemPageReqRateHighThreshold Set the threshold value for the number of page requests from disk per second.
MemCacheFlushRateHighThreshold Set the threshold value for the rate at which the file system cache flushes its contents to disk.
FreeMemAvailCriticalThreshold The threshold is expressed as the free physical memory (in MBs) available on the disk/ filesystem. Set the threshold value for minimum free memory on the disk at which you want to receive a critical severity message.
FreeMemAvailMajorThreshold Set the threshold value for minimum free memory on the disk at which you want to receive a major severity message.
FreeMemAvailMinorThreshold Set the threshold value for minimum free memory on the disk at which you want to receive a minor severity.
FreeMemAvailWarningThreshold Set the threshold value for minimum free memory on the disk at which you want to receive a warning severity.
Systems Infrastructure SPI Policies and Tools 51
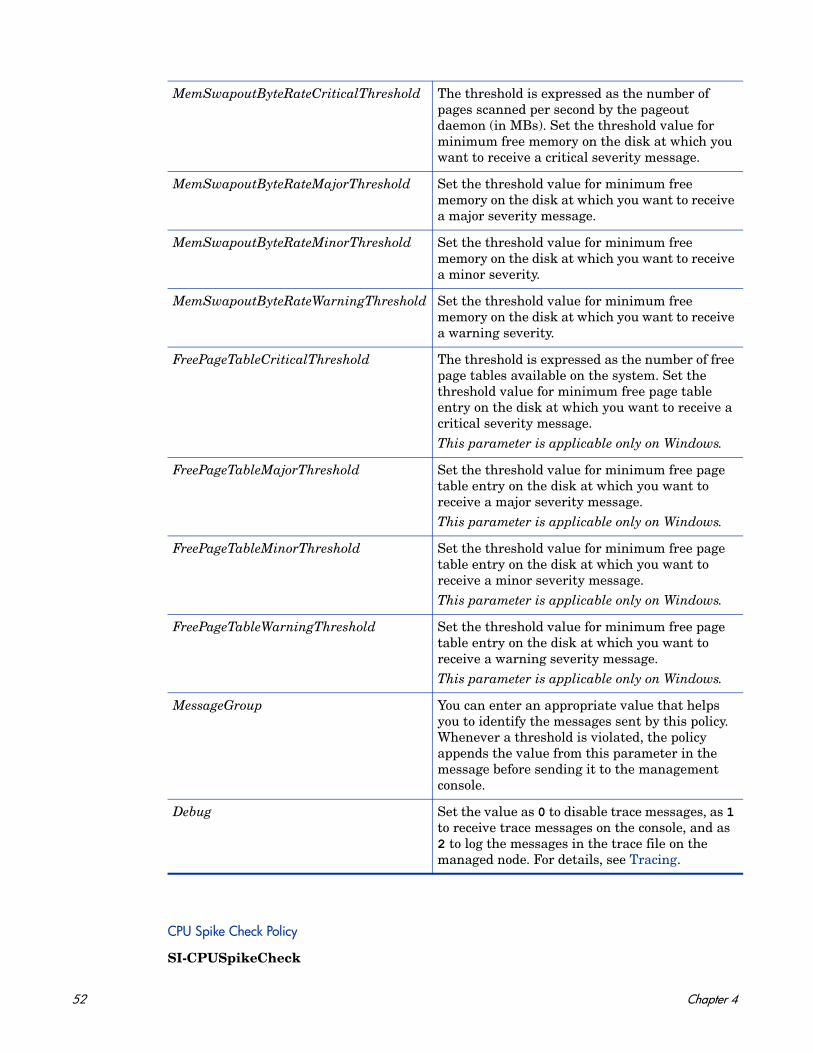
CPU Spike Check Policy
SI-CPUSpikeCheck
MemSwapoutByteRateCriticalThreshold The threshold is expressed as the number of pages scanned per second by the pageout daemon (in MBs). Set the threshold value for minimum free memory on the disk at which you want to receive a critical severity message.
MemSwapoutByteRateMajorThreshold Set the threshold value for minimum free memory on the disk at which you want to receive a major severity message.
MemSwapoutByteRateMinorThreshold Set the threshold value for minimum free memory on the disk at which you want to receive a minor severity.
MemSwapoutByteRateWarningThreshold Set the threshold value for minimum free memory on the disk at which you want to receive a warning severity.
FreePageTableCriticalThreshold The threshold is expressed as the number of free page tables available on the system. Set the threshold value for minimum free page table entry on the disk at which you want to receive a critical severity message.This parameter is applicable only on Windows.
FreePageTableMajorThreshold Set the threshold value for minimum free page table entry on the disk at which you want to receive a major severity message.This parameter is applicable only on Windows.
FreePageTableMinorThreshold Set the threshold value for minimum free page table entry on the disk at which you want to receive a minor severity message.This parameter is applicable only on Windows.
FreePageTableWarningThreshold Set the threshold value for minimum free page table entry on the disk at which you want to receive a warning severity message.This parameter is applicable only on Windows.
MessageGroup You can enter an appropriate value that helps you to identify the messages sent by this policy. Whenever a threshold is violated, the policy appends the value from this parameter in the message before sending it to the management console.
Debug Set the value as 0 to disable trace messages, as 1 to receive trace messages on the console, and as 2 to log the messages in the trace file on the managed node. For details, see Tracing.
52 Chapter 4
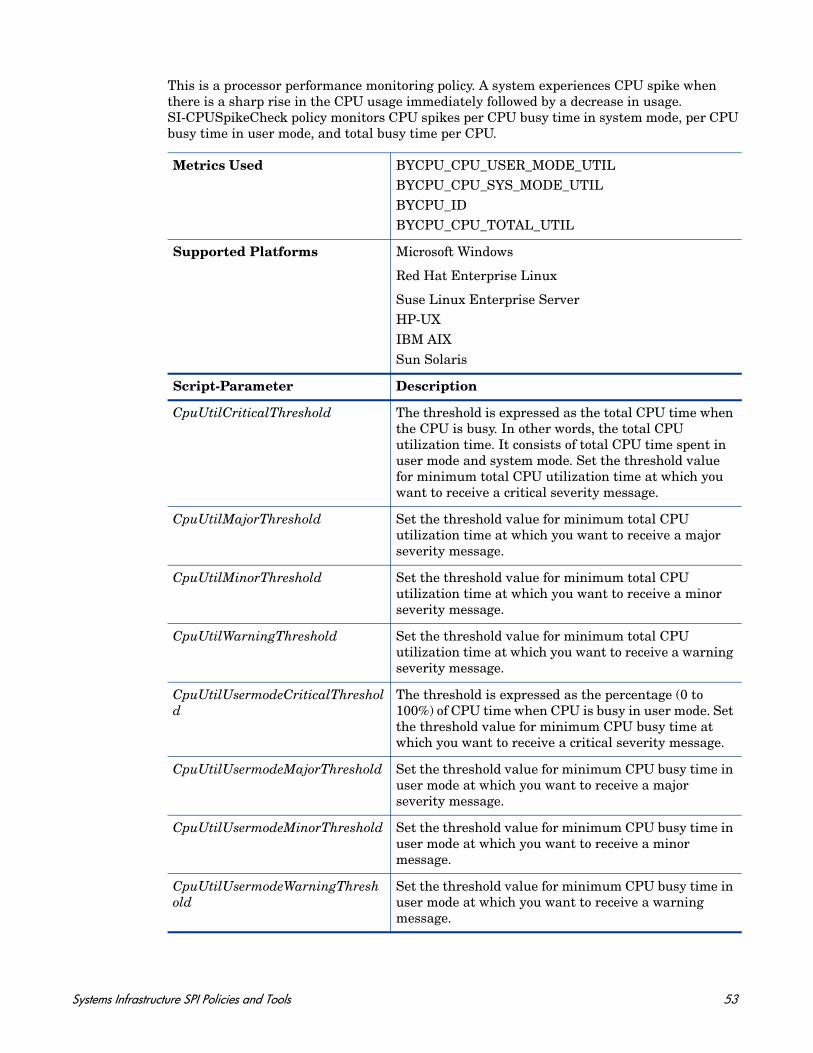
This is a processor performance monitoring policy. A system experiences CPU spike when there is a sharp rise in the CPU usage immediately followed by a decrease in usage. SI-CPUSpikeCheck policy monitors CPU spikes per CPU busy time in system mode, per CPU busy time in user mode, and total busy time per CPU.
Metrics Used BYCPU_CPU_USER_MODE_UTILBYCPU_CPU_SYS_MODE_UTILBYCPU_IDBYCPU_CPU_TOTAL_UTIL
Supported Platforms Microsoft Windows
Red Hat Enterprise Linux
Suse Linux Enterprise ServerHP-UXIBM AIXSun Solaris
Script-Parameter Description
CpuUtilCriticalThreshold The threshold is expressed as the total CPU time when the CPU is busy. In other words, the total CPU utilization time. It consists of total CPU time spent in user mode and system mode. Set the threshold value for minimum total CPU utilization time at which you want to receive a critical severity message.
CpuUtilMajorThreshold Set the threshold value for minimum total CPU utilization time at which you want to receive a major severity message.
CpuUtilMinorThreshold Set the threshold value for minimum total CPU utilization time at which you want to receive a minor severity message.
CpuUtilWarningThreshold Set the threshold value for minimum total CPU utilization time at which you want to receive a warning severity message.
CpuUtilUsermodeCriticalThreshold
The threshold is expressed as the percentage (0 to 100%) of CPU time when CPU is busy in user mode. Set the threshold value for minimum CPU busy time at which you want to receive a critical severity message.
CpuUtilUsermodeMajorThreshold Set the threshold value for minimum CPU busy time in user mode at which you want to receive a major severity message.
CpuUtilUsermodeMinorThreshold Set the threshold value for minimum CPU busy time in user mode at which you want to receive a minor message.
CpuUtilUsermodeWarningThreshold
Set the threshold value for minimum CPU busy time in user mode at which you want to receive a warning message.
Systems Infrastructure SPI Policies and Tools 53
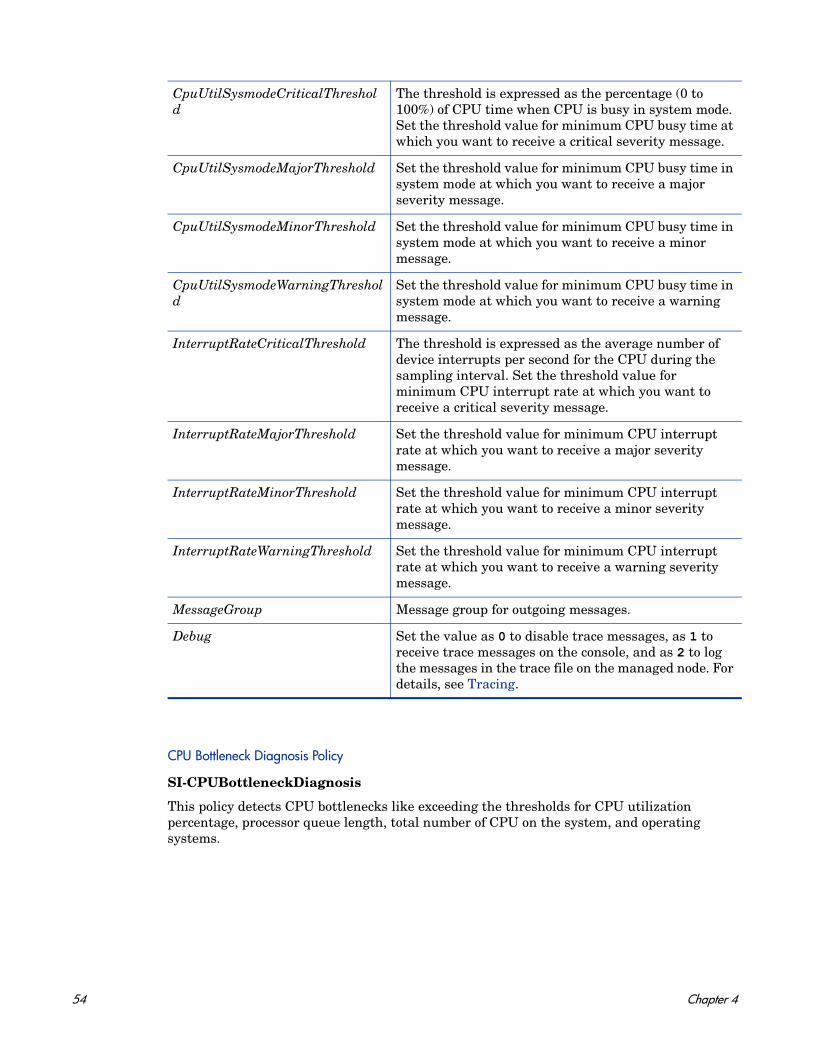
CPU Bottleneck Diagnosis Policy
SI-CPUBottleneckDiagnosis
This policy detects CPU bottlenecks like exceeding the thresholds for CPU utilization percentage, processor queue length, total number of CPU on the system, and operating systems.
CpuUtilSysmodeCriticalThreshold
The threshold is expressed as the percentage (0 to 100%) of CPU time when CPU is busy in system mode. Set the threshold value for minimum CPU busy time at which you want to receive a critical severity message.
CpuUtilSysmodeMajorThreshold Set the threshold value for minimum CPU busy time in system mode at which you want to receive a major severity message.
CpuUtilSysmodeMinorThreshold Set the threshold value for minimum CPU busy time in system mode at which you want to receive a minor message.
CpuUtilSysmodeWarningThreshold
Set the threshold value for minimum CPU busy time in system mode at which you want to receive a warning message.
InterruptRateCriticalThreshold The threshold is expressed as the average number of device interrupts per second for the CPU during the sampling interval. Set the threshold value for minimum CPU interrupt rate at which you want to receive a critical severity message.
InterruptRateMajorThreshold Set the threshold value for minimum CPU interrupt rate at which you want to receive a major severity message.
InterruptRateMinorThreshold Set the threshold value for minimum CPU interrupt rate at which you want to receive a minor severity message.
InterruptRateWarningThreshold Set the threshold value for minimum CPU interrupt rate at which you want to receive a warning severity message.
MessageGroup Message group for outgoing messages.
Debug Set the value as 0 to disable trace messages, as 1 to receive trace messages on the console, and as 2 to log the messages in the trace file on the managed node. For details, see Tracing.
54 Chapter 4
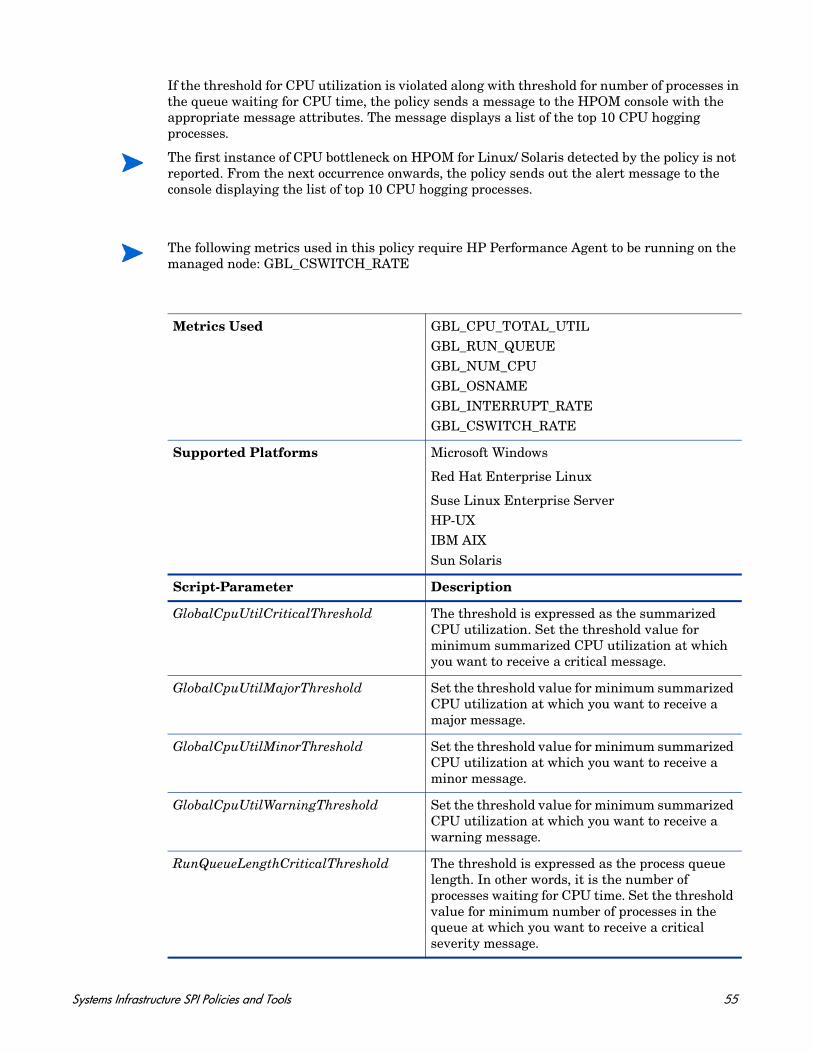
If the threshold for CPU utilization is violated along with threshold for number of processes in the queue waiting for CPU time, the policy sends a message to the HPOM console with the appropriate message attributes. The message displays a list of the top 10 CPU hogging processes.
The first instance of CPU bottleneck on HPOM for Linux/ Solaris detected by the policy is not reported. From the next occurrence onwards, the policy sends out the alert message to the console displaying the list of top 10 CPU hogging processes.
The following metrics used in this policy require HP Performance Agent to be running on the managed node: GBL_CSWITCH_RATE
Metrics Used GBL_CPU_TOTAL_UTIL GBL_RUN_QUEUE GBL_NUM_CPU GBL_OSNAMEGBL_INTERRUPT_RATE GBL_CSWITCH_RATE
Supported Platforms Microsoft Windows
Red Hat Enterprise Linux
Suse Linux Enterprise ServerHP-UXIBM AIXSun Solaris
Script-Parameter Description
GlobalCpuUtilCriticalThreshold The threshold is expressed as the summarized CPU utilization. Set the threshold value for minimum summarized CPU utilization at which you want to receive a critical message.
GlobalCpuUtilMajorThreshold Set the threshold value for minimum summarized CPU utilization at which you want to receive a major message.
GlobalCpuUtilMinorThreshold Set the threshold value for minimum summarized CPU utilization at which you want to receive a minor message.
GlobalCpuUtilWarningThreshold Set the threshold value for minimum summarized CPU utilization at which you want to receive a warning message.
RunQueueLengthCriticalThreshold The threshold is expressed as the process queue length. In other words, it is the number of processes waiting for CPU time. Set the threshold value for minimum number of processes in the queue at which you want to receive a critical severity message.
Systems Infrastructure SPI Policies and Tools 55
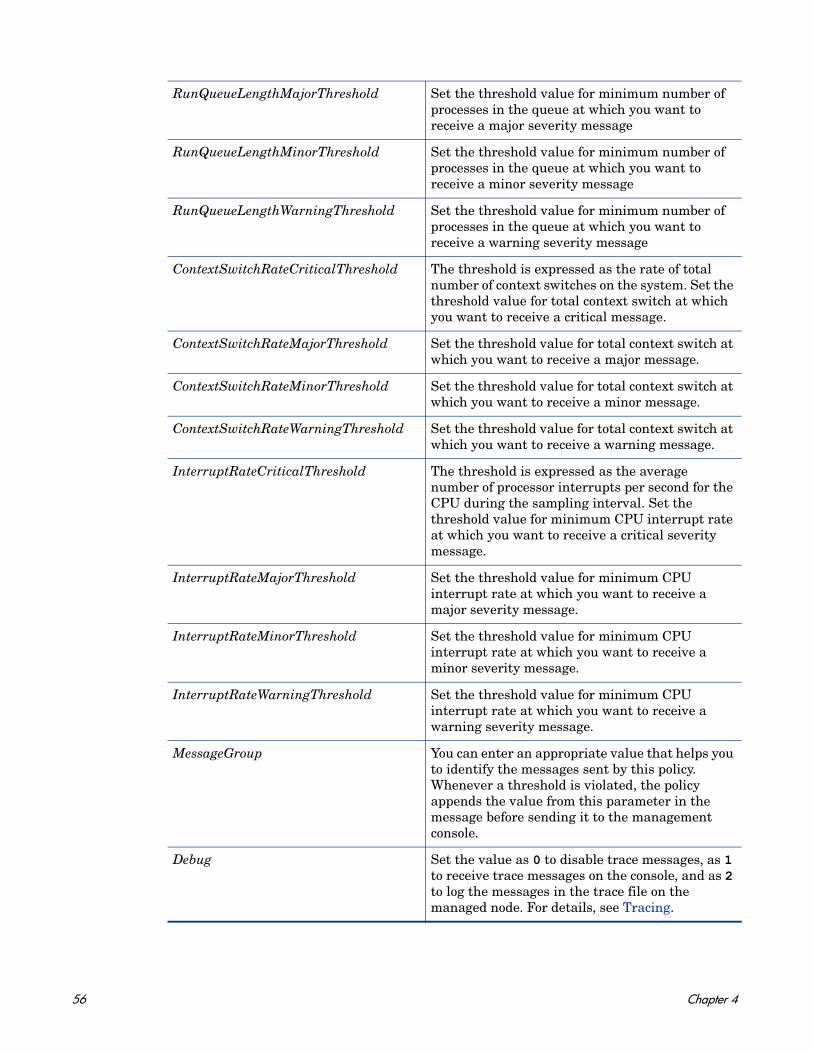
RunQueueLengthMajorThreshold Set the threshold value for minimum number of processes in the queue at which you want to receive a major severity message
RunQueueLengthMinorThreshold Set the threshold value for minimum number of processes in the queue at which you want to receive a minor severity message
RunQueueLengthWarningThreshold Set the threshold value for minimum number of processes in the queue at which you want to receive a warning severity message
ContextSwitchRateCriticalThreshold The threshold is expressed as the rate of total number of context switches on the system. Set the threshold value for total context switch at which you want to receive a critical message.
ContextSwitchRateMajorThreshold Set the threshold value for total context switch at which you want to receive a major message.
ContextSwitchRateMinorThreshold Set the threshold value for total context switch at which you want to receive a minor message.
ContextSwitchRateWarningThreshold Set the threshold value for total context switch at which you want to receive a warning message.
InterruptRateCriticalThreshold The threshold is expressed as the average number of processor interrupts per second for the CPU during the sampling interval. Set the threshold value for minimum CPU interrupt rate at which you want to receive a critical severity message.
InterruptRateMajorThreshold Set the threshold value for minimum CPU interrupt rate at which you want to receive a major severity message.
InterruptRateMinorThreshold Set the threshold value for minimum CPU interrupt rate at which you want to receive a minor severity message.
InterruptRateWarningThreshold Set the threshold value for minimum CPU interrupt rate at which you want to receive a warning severity message.
MessageGroup You can enter an appropriate value that helps you to identify the messages sent by this policy. Whenever a threshold is violated, the policy appends the value from this parameter in the message before sending it to the management console.
Debug Set the value as 0 to disable trace messages, as 1 to receive trace messages on the console, and as 2 to log the messages in the trace file on the managed node. For details, see Tracing.
56 Chapter 4
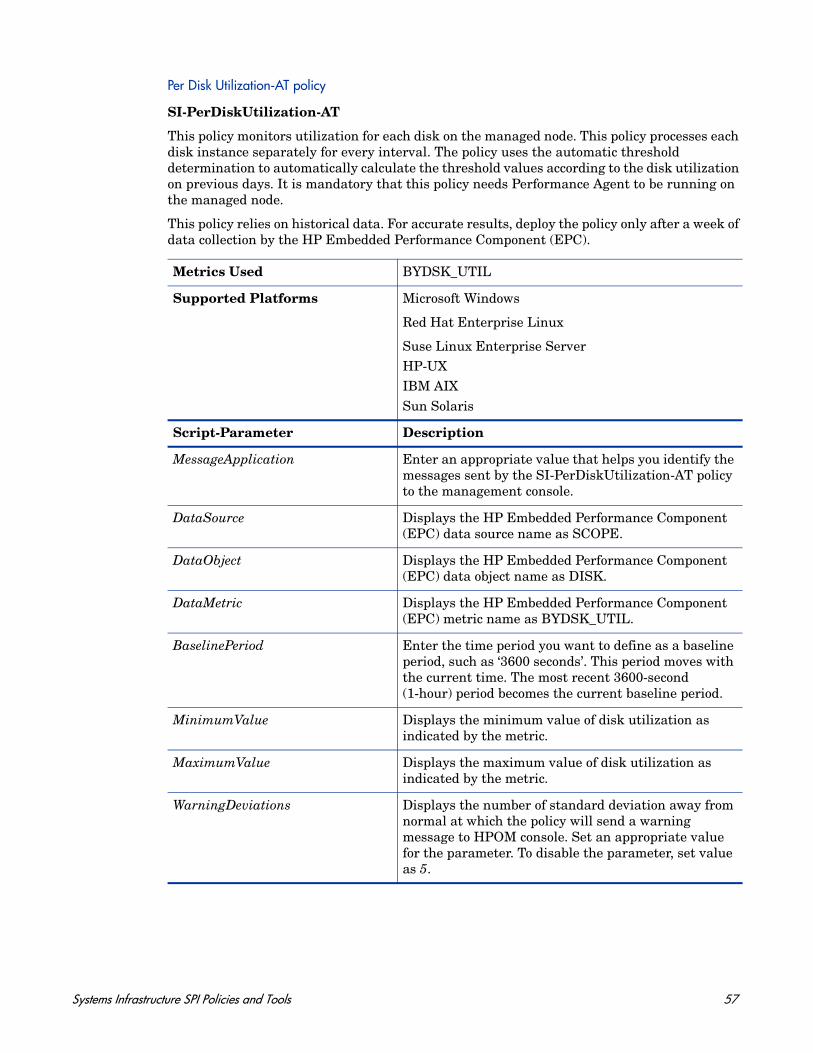
Per Disk Utilization-AT policy
SI-PerDiskUtilization-AT
This policy monitors utilization for each disk on the managed node. This policy processes each disk instance separately for every interval. The policy uses the automatic threshold determination to automatically calculate the threshold values according to the disk utilization on previous days. It is mandatory that this policy needs Performance Agent to be running on the managed node.
This policy relies on historical data. For accurate results, deploy the policy only after a week of data collection by the HP Embedded Performance Component (EPC).
Metrics Used BYDSK_UTIL
Supported Platforms Microsoft Windows
Red Hat Enterprise Linux
Suse Linux Enterprise ServerHP-UXIBM AIXSun Solaris
Script-Parameter Description
MessageApplication Enter an appropriate value that helps you identify the messages sent by the SI-PerDiskUtilization-AT policy to the management console.
DataSource Displays the HP Embedded Performance Component (EPC) data source name as SCOPE.
DataObject Displays the HP Embedded Performance Component (EPC) data object name as DISK.
DataMetric Displays the HP Embedded Performance Component (EPC) metric name as BYDSK_UTIL.
BaselinePeriod Enter the time period you want to define as a baseline period, such as ‘3600 seconds’. This period moves with the current time. The most recent 3600-second (1-hour) period becomes the current baseline period.
MinimumValue Displays the minimum value of disk utilization as indicated by the metric.
MaximumValue Displays the maximum value of disk utilization as indicated by the metric.
WarningDeviations Displays the number of standard deviation away from normal at which the policy will send a warning message to HPOM console. Set an appropriate value for the parameter. To disable the parameter, set value as 5.
Systems Infrastructure SPI Policies and Tools 57
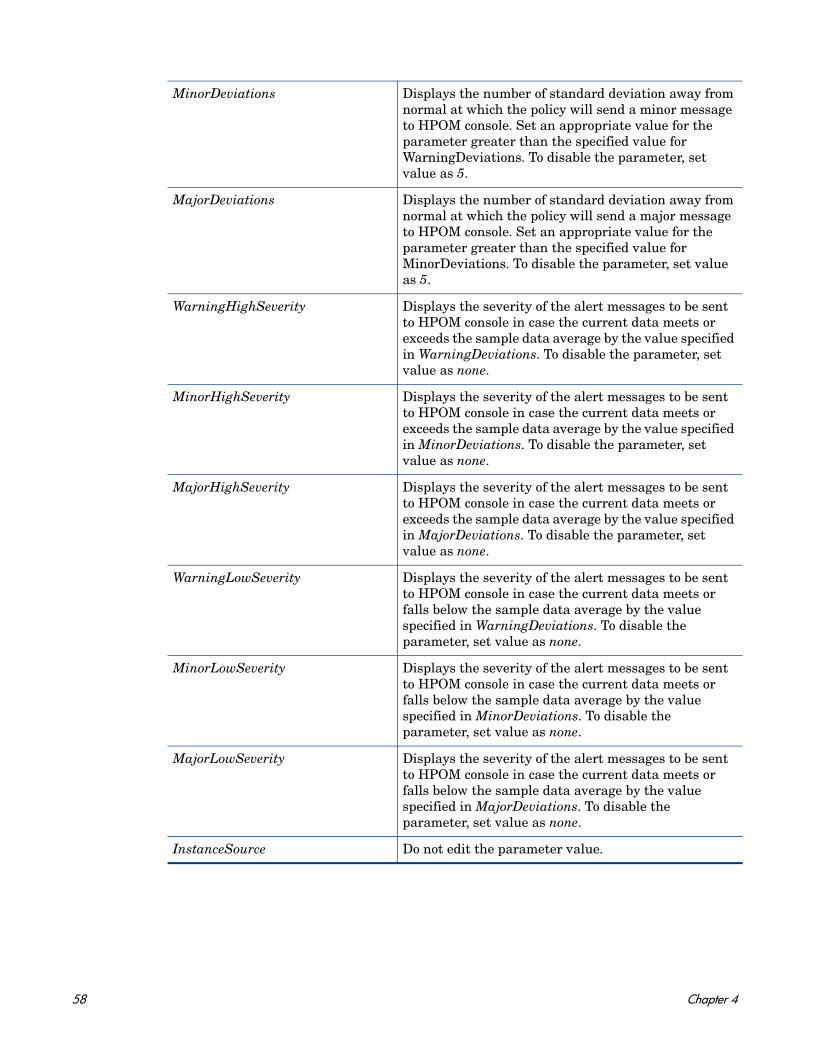
MinorDeviations Displays the number of standard deviation away from normal at which the policy will send a minor message to HPOM console. Set an appropriate value for the parameter greater than the specified value for WarningDeviations. To disable the parameter, set value as 5.
MajorDeviations Displays the number of standard deviation away from normal at which the policy will send a major message to HPOM console. Set an appropriate value for the parameter greater than the specified value for MinorDeviations. To disable the parameter, set value as 5.
WarningHighSeverity Displays the severity of the alert messages to be sent to HPOM console in case the current data meets or exceeds the sample data average by the value specified in WarningDeviations. To disable the parameter, set value as none.
MinorHighSeverity Displays the severity of the alert messages to be sent to HPOM console in case the current data meets or exceeds the sample data average by the value specified in MinorDeviations. To disable the parameter, set value as none.
MajorHighSeverity Displays the severity of the alert messages to be sent to HPOM console in case the current data meets or exceeds the sample data average by the value specified in MajorDeviations. To disable the parameter, set value as none.
WarningLowSeverity Displays the severity of the alert messages to be sent to HPOM console in case the current data meets or falls below the sample data average by the value specified in WarningDeviations. To disable the parameter, set value as none.
MinorLowSeverity Displays the severity of the alert messages to be sent to HPOM console in case the current data meets or falls below the sample data average by the value specified in MinorDeviations. To disable the parameter, set value as none.
MajorLowSeverity Displays the severity of the alert messages to be sent to HPOM console in case the current data meets or falls below the sample data average by the value specified in MajorDeviations. To disable the parameter, set value as none.
InstanceSource Do not edit the parameter value.
58 Chapter 4
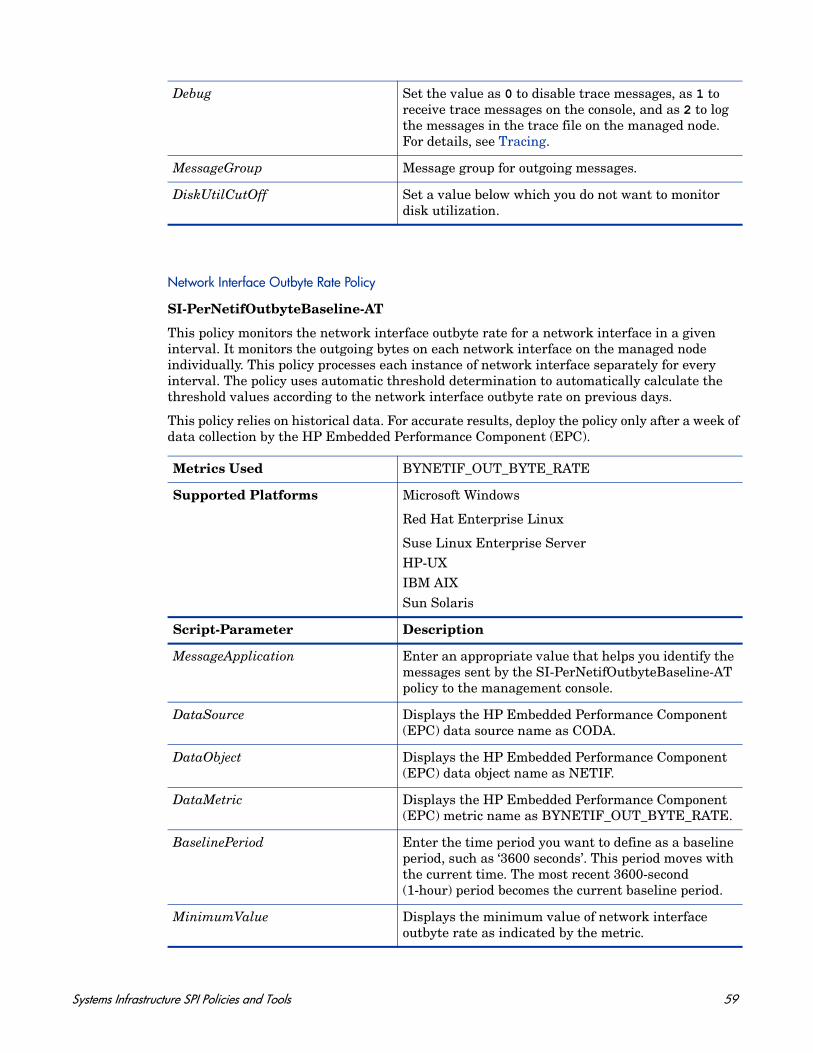
Network Interface Outbyte Rate Policy
SI-PerNetifOutbyteBaseline-AT
This policy monitors the network interface outbyte rate for a network interface in a given interval. It monitors the outgoing bytes on each network interface on the managed node individually. This policy processes each instance of network interface separately for every interval. The policy uses automatic threshold determination to automatically calculate the threshold values according to the network interface outbyte rate on previous days.
This policy relies on historical data. For accurate results, deploy the policy only after a week of data collection by the HP Embedded Performance Component (EPC).
Debug Set the value as 0 to disable trace messages, as 1 to receive trace messages on the console, and as 2 to log the messages in the trace file on the managed node. For details, see Tracing.
MessageGroup Message group for outgoing messages.
DiskUtilCutOff Set a value below which you do not want to monitor disk utilization.
Metrics Used BYNETIF_OUT_BYTE_RATE
Supported Platforms Microsoft Windows
Red Hat Enterprise Linux
Suse Linux Enterprise ServerHP-UXIBM AIXSun Solaris
Script-Parameter Description
MessageApplication Enter an appropriate value that helps you identify the messages sent by the SI-PerNetifOutbyteBaseline-AT policy to the management console.
DataSource Displays the HP Embedded Performance Component (EPC) data source name as CODA.
DataObject Displays the HP Embedded Performance Component (EPC) data object name as NETIF.
DataMetric Displays the HP Embedded Performance Component (EPC) metric name as BYNETIF_OUT_BYTE_RATE.
BaselinePeriod Enter the time period you want to define as a baseline period, such as ‘3600 seconds’. This period moves with the current time. The most recent 3600-second (1-hour) period becomes the current baseline period.
MinimumValue Displays the minimum value of network interface outbyte rate as indicated by the metric.
Systems Infrastructure SPI Policies and Tools 59
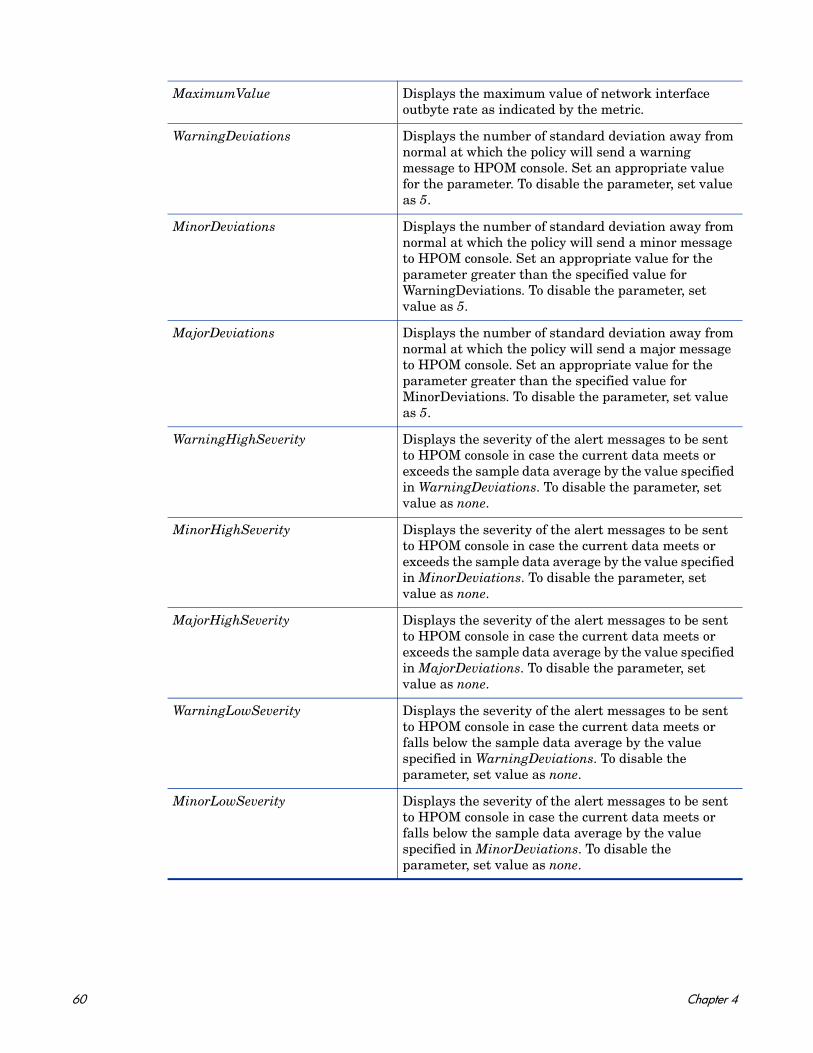
MaximumValue Displays the maximum value of network interface outbyte rate as indicated by the metric.
WarningDeviations Displays the number of standard deviation away from normal at which the policy will send a warning message to HPOM console. Set an appropriate value for the parameter. To disable the parameter, set value as 5.
MinorDeviations Displays the number of standard deviation away from normal at which the policy will send a minor message to HPOM console. Set an appropriate value for the parameter greater than the specified value for WarningDeviations. To disable the parameter, set value as 5.
MajorDeviations Displays the number of standard deviation away from normal at which the policy will send a major message to HPOM console. Set an appropriate value for the parameter greater than the specified value for MinorDeviations. To disable the parameter, set value as 5.
WarningHighSeverity Displays the severity of the alert messages to be sent to HPOM console in case the current data meets or exceeds the sample data average by the value specified in WarningDeviations. To disable the parameter, set value as none.
MinorHighSeverity Displays the severity of the alert messages to be sent to HPOM console in case the current data meets or exceeds the sample data average by the value specified in MinorDeviations. To disable the parameter, set value as none.
MajorHighSeverity Displays the severity of the alert messages to be sent to HPOM console in case the current data meets or exceeds the sample data average by the value specified in MajorDeviations. To disable the parameter, set value as none.
WarningLowSeverity Displays the severity of the alert messages to be sent to HPOM console in case the current data meets or falls below the sample data average by the value specified in WarningDeviations. To disable the parameter, set value as none.
MinorLowSeverity Displays the severity of the alert messages to be sent to HPOM console in case the current data meets or falls below the sample data average by the value specified in MinorDeviations. To disable the parameter, set value as none.
60 Chapter 4
Network Interface Inbyte Rate Policy
SI-PerNetifInbyteBaseline-AT
This policy monitors the inbyte rate for a network interface in a given interval. It monitors the incoming bytes on each network interface on the managed node individually. This policy processes each instance of network interface separately for every interval. The policy uses the automatic threshold determination to automatically calculate the threshold values according to the network interface inbyte rate on previous days.
This policy relies on historical data. For accurate results, deploy the policy only after a week of data collection by the HP Embedded Performance Component (EPC).
MajorLowSeverity Displays the severity of the alert messages to be sent to HPOM console in case the current data meets or falls below the sample data average by the value specified in MajorDeviations. To disable the parameter, set value as none.
Debug Set the value as 0 to disable trace messages, as 1 to receive trace messages on the console, and as 2 to log the messages in the trace file on the managed node. For details, see Tracing.
MessageGroup Message group for outgoing messages.
ByNetifOutByteCutOff Set a value below which you do not want to monitor the outbyte rate.
Metrics Used BYNETIF_IN_BYTE_RATE
Supported Platforms Microsoft Windows
Red Hat Enterprise Linux
Suse Linux Enterprise ServerHP-UXIBM AIXSun Solaris
Script-Parameter Description
MessageApplication Enter an appropriate value that helps you identify the messages sent by the policy to the management console.
DataSource Displays the HP Embedded Performance Component (EPC) data source name as CODA.
DataObject Displays the HP Embedded Performance Component (EPC) data object name as NETIF.
DataMetric Displays the HP Embedded Performance Component (EPC) metric name as BYNETIF_IN_BYTE_RATE.
Systems Infrastructure SPI Policies and Tools 61
BaselinePeriod Enter the time period you want to define as a baseline period, such as ‘3600 seconds’. This period moves with the current time. The most recent 3600-second (1-hour) period becomes the current baseline period.
MinimumValue Displays the minimum value of network interface inbyte rate as indicated by the metric.
MaximumValue Displays the maximum value of network interface inbyte rate as indicated by the metric.
WarningDeviations Displays the number of standard deviation away from normal at which the policy will send a warning message to HPOM console. Set an appropriate value for the parameter. To disable the parameter, set value as 5.
MinorDeviations Displays the number of standard deviation away from normal at which the policy will send a minor message to HPOM console. Set an appropriate value for the parameter greater than the specified value for WarningDeviations. To disable the parameter, set value as 5.
MajorDeviations Displays the number of standard deviation away from normal at which the policy will send a major message to HPOM console. Set an appropriate value for the parameter greater than the specified value for MinorDeviations. To disable the parameter, set value as 5.
WarningHighSeverity Displays the severity of the alert messages to be sent to HPOM console in case the current data meets or exceeds the sample data average by the value specified in WarningDeviations. To disable the parameter, set value as none.
MinorHighSeverity Displays the severity of the alert messages to be sent to HPOM console in case the current data meets or exceeds the sample data average by the value specified in MinorDeviations. To disable the parameter, set value as none.
MajorHighSeverity Displays the severity of the alert messages to be sent to HPOM console in case the current data meets or exceeds the sample data average by the value specified in MajorDeviations. To disable the parameter, set value as none.
WarningLowSeverity Displays the severity of the alert messages to be sent to HPOM console in case the current data meets or falls below the sample data average by the value specified in WarningDeviations. To disable the parameter, set value as none.
62 Chapter 4
Sample Performance Policies
Systems Infrastructure SPI provides sample performance policies that can be used to monitor the performance of processes running on a system. You can use these policies as template to create copies and modify them as per your requirements.
The sample policies provided are:
• SI-JavaProcessMemoryUsageTracker policy monitors memory usage for Java process running on your system. The default policy group for the policy is:
Infrastructure Management → v1.60 → <language> → Systems Infrastructure → Performance → Process Resource Usage Monitor Samples
• SI-JavaProcessCPUUsageTracker policy monitors the CPU usage for the Java process running on your system. The default policy group for the policy is:
Infrastructure Management → v1.60 → <language> → Systems Infrastructure → Performance → Process Resource Usage Monitor Samples
MinorLowSeverity Displays the severity of the alert messages to be sent to HPOM console in case the current data meets or falls below the sample data average by the value specified in MinorDeviations. To disable the parameter, set value as none.
MajorLowSeverity Displays the severity of the alert messages to be sent to HPOM console in case the current data meets or falls below the sample data average by the value specified in MajorDeviations. To disable the parameter, set value as none.
Debug Set the value as 0 to disable trace messages, as 1 to receive trace messages on the console, and as 2 to log the messages in the trace file on the managed node. For details, see Tracing.
MessageGroup Message group for outgoing messages.
ByNetifInByteCutOff Set a value below which you do not want to monitor the inbyte rate.
Script-Parameter Description
ProcessName Enter the name of the process that you want to monitor.
ProcessArguments Enter the process arguments, if any.
MessageGroup Message group for outgoing messages.
CPUUsageHighWaterMark or
MemoryUsageHighWaterMark
Enter a threshold value for process CPU or memory usage above which you want to receive an alert.
Debug Set the value as 0 to disable trace messages, as 1 to receive trace messages on the console, and as 2 to log the messages in the trace file on the managed node. For details, see Tracing.
Systems Infrastructure SPI Policies and Tools 63
• SI-MSWindowsSvchostCPUUsageTracker policy monitors the CPU usage for the svchost processes running on your system. The default policy group for the policy is:
Infrastructure Management → v1.60 → <language> → Systems Infrastructure → Performance → Process Resource Usage Monitor Samples → Windows
• SI-MSWindowsSvchostMemoryUsageTracker policy monitors the memory usage for the svchost processes running on your system. The default policy group for the policy is:
Infrastructure Management → v1.60 → <language> → Systems Infrastructure → Performance → Process Resource Usage Monitor Samples → Windows
Security Policies
Suppose an unauthorized user tried to break into your system by entering different combinations of username and password, or by deploying an automated script to do this. Such attempts may result in too many login failures. To identify and preempt such a risk, you can deploy the System Infrastructure security policies to periodically check the number of failed logins on your system. For instance, these policies collect failed login data and send alerts in case of too many attempts.
Failed Login Collector Policy for Windows
SI-MSWindowsFailedLoginsCollector
This is a scheduled task policy that checks for the number of failed login attempts on Microsoft Windows. It check for invalid logins, either due to unknown username or incorrect password on the managed node. The policy logs individual instances of failed login into the GBL_NUM_FAILED_LOGINS metric in Embedded Performance Component (EPC) at definite time intervals. By default, the time interval is 1 hour. The recorded information stored in EPC can be used to send an alert to the console or generate reports for the number of invalid logins over a period of time. The default policy group for the policy is:
Infrastructure Management → v1.60 → <language> → Systems Infrastructure → Security → Windows
Last Logon Collector Policy for Windows
SI-MSWindowsLastLogonsCollector
This is a scheduled task policy that checks for the logon details of all the active local user accounts on Microsoft Windows. The policy logs individual instances of user logon into the SECONDS_SINCE_LASTLOGIN metric in Embedded Performance Component (EPC) at definite time intervals. By default, the time interval is 1 hour. The recorded information stored in EPC can be used to send an alert to the console or generate reports for the number of user logons over a period of time. The default policy group for the policy is:
Infrastructure Management → v1.60 → <language> → Systems Infrastructure → Security → Windows
After deploying the security collector policies, make sure that you let the policies run for at least 5 minutes to collect the required data.
64 Chapter 4
Failed Login Collector Policy for Linux
SI-UNIXFailedLoginsCollector
This is a scheduled task policy that checks for the number of failed login attempts on RHEL and SLES Linux systems, HP-UX, AIX and Solaris. The policy checks for invalid logins, either due to unknown username or incorrect password on the managed node. The policies log individual instances of failed login into the GBL_NUM_FAILED_LOGINS metric in Embedded Performance Component (EPC) at definite time intervals. By default, the time interval is 1 hour. The recorded information stored in EPC can be used to send an alert to the console or generate reports for the number of invalid logins over a period of time. The default policy group for the policy is:
Infrastructure Management → v1.60 → <language> → Systems Infrastructure → Security → Linux
Last Logon Collector Policy for Linux
SI-LinuxLastLogonsCollector
This is a scheduled task policy that checks for the logon details of all the active local user accounts on RHEL and SLES Linux systems. The policy logs individual instances of user logon into the SECONDS_SINCE_LASTLOGIN metric in Embedded Performance Component (EPC) at definite time intervals. By default, the time interval is 1 hour. The recorded information stored in EPC can be used to send an alert to the console or generate reports for the number of user logons over a period of time. The default policy group for the policy is:
Infrastructure Management → v1.60 → <language> → Systems Infrastructure → Security → Linux
The pre-requisites for SI-UNIXFailedLoginsCollector policy to function correctly when deployed on a solaris node are:
• The file /etc/default/login on solaris node must have the following settings:
SYSLOG=YES
SYSLOG_FAILED_LOGINS=1
• Remove the comment from the following line in /etc/syslog.conf file or add the line if it is not present.
auth.notice ifdef(`LOGHOST', /var/log/authlog, @loghost)
• Refresh syslogd using the following command:
svcadm refresh system/system-log
Systems Infrastructure SPI Policies and Tools 65
Systems Infrastructure SPI Tool
Tools enable you to manage services on managed nodes and view a list of data collected for a particular managed node.
To access the Systems Infrastructure tool on HPOM for Windows, select the following:
Tools → Systems Infrastructure
To access the tool on console/ Administration UI for HPOM for UNIX/ Linux, select the following:
Tool Bank → Systems Infrastructure
During the Upgrade scenario, a new tool, Cleanup 1.0 Node Groups is provided on the
HPOM Java GUI to remove the Infrastructure SPIs 1.0 node groups from HPOM for
UNIX (Linux, HP-UX and Solaris)
Users Last Login Tool
When launched on a managed node, the Users Last Login tool displays a list of all active users along with their last login details. Before launching the tool, make sure you have deployed the corresponding last logon collector policy. To know more about the last logon collector policies, see Last Logon Collector Policy for Windows and Last Logon Collector Policy for Linux.
66 Chapter 4
5 Systems Infrastructure SPI Reports and Graphs
You can integrate the Systems Infrastructure SPI with HP Reporter to generate reports based on collected metric data from the managed nodes. The reports provide a picture of system resources. You can also generate graphs to analyze the metric data collected. To generate and view reports and graphs from data collected by the Systems Infrastructure SPI, use HP Reporter and HP Performance Manager with HPOM.
Systems Infrastructure SPI Reports
You can access Systems Infrastructure SPI reports from the HPOM for Windows console. To install HP Reporter package for Systems Infrastructure SPI, see HP Operations Smart Plug-in for Infrastructure Installation Guide.
To view reports for Systems Infrastructure SPI from HPOM for Windows, expand Reports → Systems Infrastructure in the console tree. To display a report, select the desired report, right-click, and then select Show report.
If HP Reporter is installed on the HPOM management server, you can view the reports on the management server directly. If HP Reporter is installed on a separate system connected to the HPOM management server, you can view the reports on HP Reporter system. For more information on integration of HP Reporter with HPOM, see HP Reporter Installation and Special Configuration Guide. The following is an example report.
67

Figure 5 Example report for Systems Infrastructure SPI
68 Chapter 5
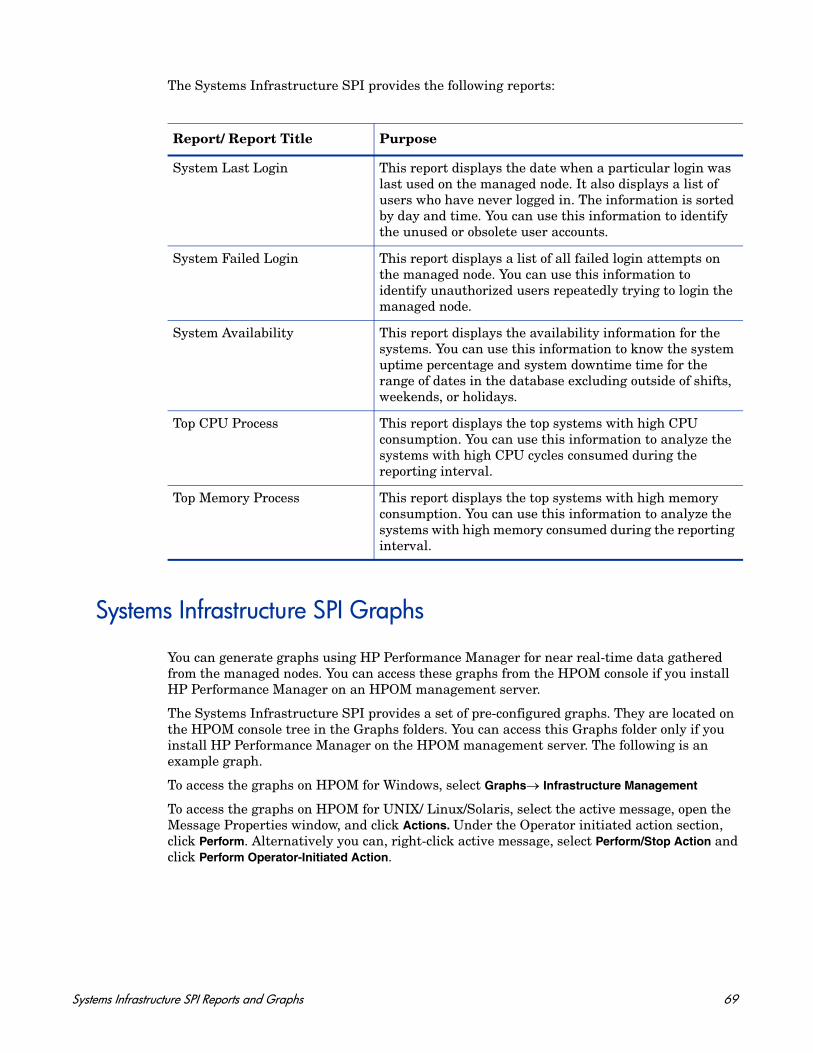
The Systems Infrastructure SPI provides the following reports:
Systems Infrastructure SPI Graphs
You can generate graphs using HP Performance Manager for near real-time data gathered from the managed nodes. You can access these graphs from the HPOM console if you install HP Performance Manager on an HPOM management server.
The Systems Infrastructure SPI provides a set of pre-configured graphs. They are located on the HPOM console tree in the Graphs folders. You can access this Graphs folder only if you install HP Performance Manager on the HPOM management server. The following is an example graph.
To access the graphs on HPOM for Windows, select Graphs→ Infrastructure Management
To access the graphs on HPOM for UNIX/ Linux/Solaris, select the active message, open the Message Properties window, and click Actions. Under the Operator initiated action section, click Perform. Alternatively you can, right-click active message, select Perform/Stop Action and click Perform Operator-Initiated Action.
Report/ Report Title Purpose
System Last Login This report displays the date when a particular login was last used on the managed node. It also displays a list of users who have never logged in. The information is sorted by day and time. You can use this information to identify the unused or obsolete user accounts.
System Failed Login This report displays a list of all failed login attempts on the managed node. You can use this information to identify unauthorized users repeatedly trying to login the managed node.
System Availability This report displays the availability information for the systems. You can use this information to know the system uptime percentage and system downtime time for the range of dates in the database excluding outside of shifts, weekends, or holidays.
Top CPU Process This report displays the top systems with high CPU consumption. You can use this information to analyze the systems with high CPU cycles consumed during the reporting interval.
Top Memory Process This report displays the top systems with high memory consumption. You can use this information to analyze the systems with high memory consumed during the reporting interval.
Systems Infrastructure SPI Reports and Graphs 69

Figure 6 Example graph for Systems Infrastructure SPI
70 Chapter 5
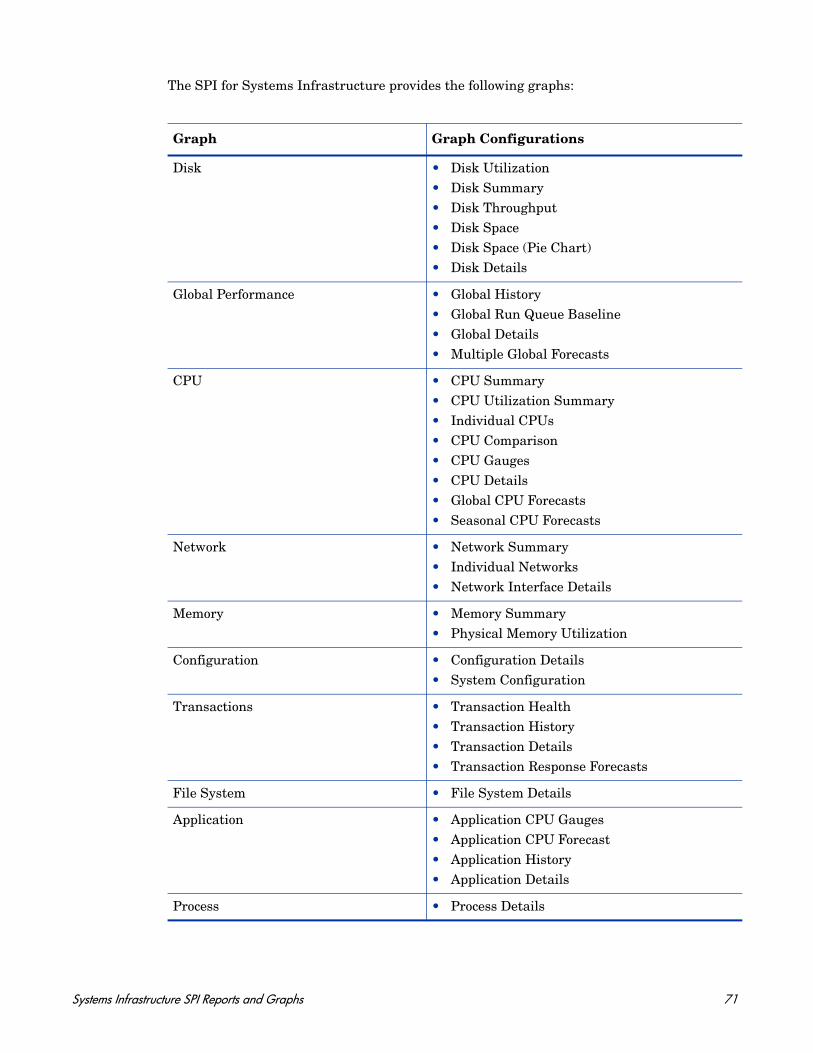
The SPI for Systems Infrastructure provides the following graphs:
Graph Graph Configurations
Disk • Disk Utilization• Disk Summary• Disk Throughput• Disk Space• Disk Space (Pie Chart)• Disk Details
Global Performance • Global History• Global Run Queue Baseline• Global Details• Multiple Global Forecasts
CPU • CPU Summary • CPU Utilization Summary• Individual CPUs• CPU Comparison• CPU Gauges• CPU Details• Global CPU Forecasts• Seasonal CPU Forecasts
Network • Network Summary• Individual Networks• Network Interface Details
Memory • Memory Summary• Physical Memory Utilization
Configuration • Configuration Details• System Configuration
Transactions • Transaction Health• Transaction History• Transaction Details• Transaction Response Forecasts
File System • File System Details
Application • Application CPU Gauges• Application CPU Forecast• Application History• Application Details
Process • Process Details
Systems Infrastructure SPI Reports and Graphs 71

72 Chapter 5
6 Troubleshooting
This chapter provides an overview of the Systems Infrastructure SPI limitations and issues and covers basic troubleshooting scenarios.
Auto-addition of guest virtual machines fails
Cause: The AutoAdd_Guests parameter in InfraSPI-ServerSettings policy is set to false by default. This is to prevent a lot of guest virtual machines from getting added automatically causing the console GUI to freeze.
Solution: You can set the parameter AutoAdd_Guests=true in InfraSPI-ServerSettings policy and then re-deploy the policy. To access the policy, select Infrastructure Management → Settings and Thresholds → Server Settings.
Advanced Monitoring policies modified in HPOM for UNIX Administrator GUI fail to run after deployment to managed nodes.
Cause: When advanced monitoring policies are edited in GUI mode in HPOM for UNIX policy editor, syntax errors are induced into the Perl code module. This causes the policy to fail to execute. Errors such as the following appear:
An error occurred in the processing of the policy 'SI-LinuxSshdProcessMonitor'. Please check the following errors and take corrective actions. (OpC30-797)
Error during evaluation of threshold level "Processes - Fill Instance list" (OpC30-728)
Execution of instance filter script failed. (OpC30-714)
Perl Script execution failed: syntax error at PerlScript line 11, near "1
#BEGIN_PROCESSES_LIST
#ProcName=/usr/sbin/sshd
#Params=
#Params=
#MonMode=>=
#ProcNum=1
#END_PROCESSES_LIST
@ProcNames"
Missing right curly or square bracket at PerlScript line 17, within string
syntax error at PerlScript line 17, at EOF
. (OpC30-750)
73
The un-edited advanced monitoring policies (Measurement Threshold type) work fine when deployed from HPOM for UNIX.
Solution: To edit the settings in the Measurement Threshold policy, use ‘Edit in Raw mode’ feature of the HPOM for UNIX Administrator GUI to change the policy contents. This requires you to know the syntax of the policy data file.
Discovery procedures and data collection gives error with non-English names.
Cause: Although the Systems Infrastructure SPI can be deployed successfully on a non-English HP Operations Manager, using non-English names for a system results in error. This happens because non-English names are not recognized by the store collection PERL APIs in the HP Operations Agent.
Solution: Make sure that the names for clusters and resource groups are in English.
Alert Messages while System Discovery automatically adds nodes.
Cause: While automatically adding nodes for cluster and virtualized environments, the system discovery policy generates alert messages with normal severity. These messages take a while to get acknowledged as the auto-addition feature of the policy takes time to populate the node bank.
Solution: Disable the Auto-addition feature by changing the following default values in the XPL configuration parameters:
Warning/error messages on the HPOM console:
An error occurred in the processing of the policy 'SI-PerDiskUtilization-AT'. Please check the following errors and take corrective actions. (OpC30-797)
Initialization of collection source "DoNotRename" failed. (OpC30-724)
Cannot find object 'DISK' in Coda object list. (OpC30-761)
Searching for 'data source: SCOPE' in the DataSourceList failed. (OpC30-766))
Cause: This error occurs when the SI-PerDiskUtilization-AT policy is deployed to a node that does not have the HP Performance Agent installed on the node. The SI-PerDiskUtilization-AT policy uses metrics provided by SCOPE for the calculations, and requires HP Performance Agent for proper functioning.
Solution: Install the HP Performance Agent on the managed node for the policy to function properly.
Configuration Parameters Default Value Value to disable auto addition
AutoAdd_ClusterNode true false
AutoAdd_Cluster_RG_IP true false
AutoAdd_HypervisorNode true false
AutoAdd_Guests false true
74 Chapter 6

Failure of operator initiated commands for launching the Systems Infrastructure SPI graphs from HPOM for UNIX (version 9.00) operator console
Solution: Run the following command on the HPOM server:
/opt/OV/contrib/OpC/OVPM/install_OVPM.sh <OMUServerName>:8081
Troubleshooting 75

76 Chapter 6
A Appendix: Policies and Tools
Deploying Policies from HPOM for Windows Server
To manually deploy policies from HPOM for Windows, follow these steps:
1 Right-click the policy you want to deploy.
2 From the menu, select All Tasks.
3 Select Deploy on. The Deploy policies on dialog box opens.
4 Select the option Select nodes from the tree. From the list of managed nodes, select the nodes where you want to deploy the policy.
5 Click OK.
Figure 7 Deploy policies on dialog box
77
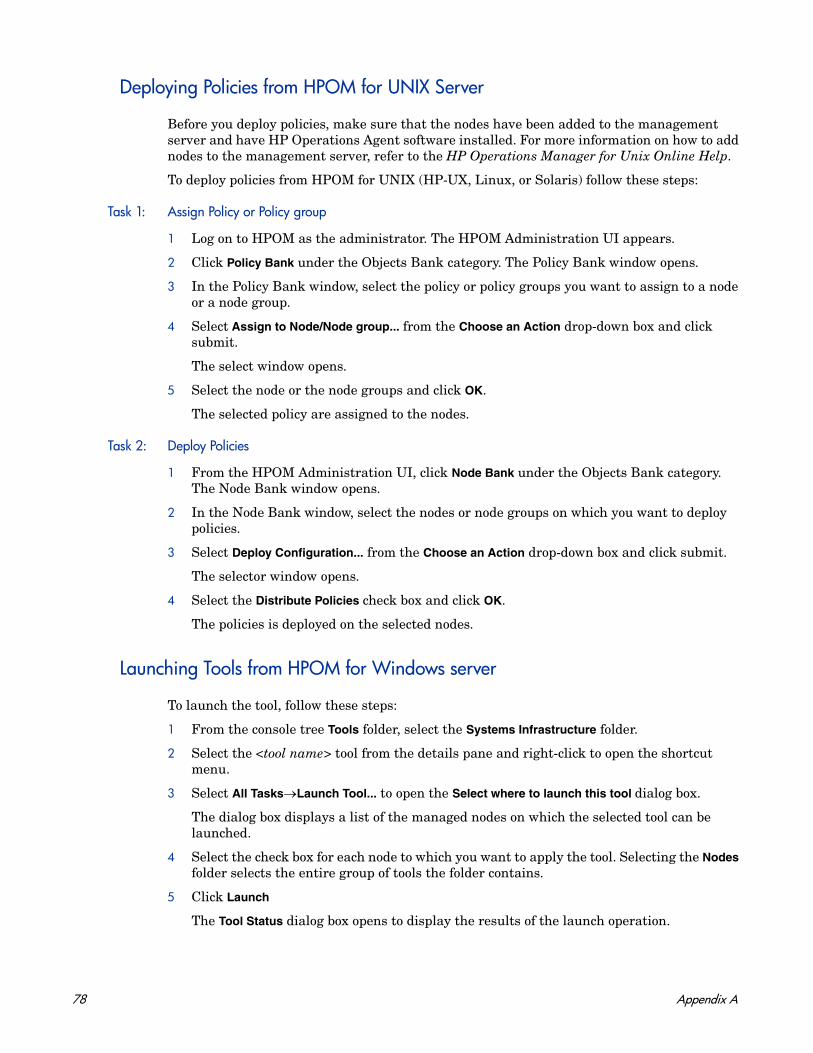
Deploying Policies from HPOM for UNIX Server
Before you deploy policies, make sure that the nodes have been added to the management server and have HP Operations Agent software installed. For more information on how to add nodes to the management server, refer to the HP Operations Manager for Unix Online Help.
To deploy policies from HPOM for UNIX (HP-UX, Linux, or Solaris) follow these steps:
Task 1: Assign Policy or Policy group
1 Log on to HPOM as the administrator. The HPOM Administration UI appears.
2 Click Policy Bank under the Objects Bank category. The Policy Bank window opens.
3 In the Policy Bank window, select the policy or policy groups you want to assign to a node or a node group.
4 Select Assign to Node/Node group... from the Choose an Action drop-down box and click submit.
The select window opens.
5 Select the node or the node groups and click OK.
The selected policy are assigned to the nodes.
Task 2: Deploy Policies
1 From the HPOM Administration UI, click Node Bank under the Objects Bank category. The Node Bank window opens.
2 In the Node Bank window, select the nodes or node groups on which you want to deploy policies.
3 Select Deploy Configuration... from the Choose an Action drop-down box and click submit.
The selector window opens.
4 Select the Distribute Policies check box and click OK.
The policies is deployed on the selected nodes.
Launching Tools from HPOM for Windows server
To launch the tool, follow these steps:
1 From the console tree Tools folder, select the Systems Infrastructure folder.
2 Select the <tool name> tool from the details pane and right-click to open the shortcut menu.
3 Select All Tasks→Launch Tool... to open the Select where to launch this tool dialog box.
The dialog box displays a list of the managed nodes on which the selected tool can be launched.
4 Select the check box for each node to which you want to apply the tool. Selecting the Nodes folder selects the entire group of tools the folder contains.
5 Click Launch
The Tool Status dialog box opens to display the results of the launch operation.
78 Appendix A
You can save the results of the apply tool operations. Select one or more lines in the Launched Tools box and click Save. The output is saved in text format.
Launching Tools on HPOM for UNIX
To launch the tool on HPOM for UNIX (HP-UX, Linux, or Solaris) follow these steps:
1 Select Tools → Systems Infrastructure in the Java UI.
2 Right-click the <tool name> tool, select Start Customized.
Start Tool - Customized Wizard window opens.
3 Under the nodes list, select the node to launch the tool.
4 On the wizard, click Get Selections.
The node is added to the Selected Nodes list.
5 Click Next.
6 On the page specify additional information needed to run the tool, you can specify the additional information or leave the fields blank.
7 Click Finish.
The tool output is displayed.
Appendix: Policies and Tools 79

80 Appendix A