Embed Size (px)
Citation preview

ddaataa acqquisiiittiiooon aaannnddd annalysis for life scieennccee rresseeearche resseeearch
ssssssssssssssssssssssssssssssssssssssssssssssssssssssssssssssssssssssssssssssssssssssssssssssssssssssssssssssssssssssssssssssssssooooooooooooooooooooooooooooffffffffffffffffffffffffffffffffffffffffffffffttttttwwwwwwwwwwwwwwwwwwwwwwwwwwwwwwwwwwwwwwwwwwwwwwwwwwwwwwwwwwaaaaaaaaaaaaaaaaaaaaaaaaaaaaaaaaaaaaaaaaaaaaarrrrrrrrrrrrrrrrrrrrrrrrrrrrrrrrrrrrrrrrrrrrrrrrrrrrrrrrrrrrrrrrreeeeeeeeeeeeeeeeeeeeeeeeeeeeeeeeee
Data acquisition and analysis for life science researchSoftware
making science easierADINSTRUMENTS
fssssssssssssssssssssssssssssssssooooooooooooooooooooooooooooooooooooooooooooooooooooooooooooooooooooooooooooooooooooooooofftwwwaaarrrrrrrrrrrreee
‘The intuitive interface makes life easy. I like to change gains and display settings on the fl y,
something the competitor’s system does not allow’. Dr. Jerrel L. Wilkens, University of Calgary, Canada
‘The split screen feature [of the software], which allows data to be reviewed while it is still
being collected, makes comparisons possible and rapid’. Dr Edward Zuperku, Zablocki VA Medical Center, USA
‘In my opinion ADInstruments’s PowerLab system has the best laboratory software. Its user
friendliness and value-for-money are unbeatable. Using the software is easy, even for those
who use it infrequently. This is what sets it apart from the competition. For me, PowerLab is
always the fi rst choice’. Dr. Martin van Eickels, sanofi-aventis
‘We have been thrilled with the straightforward hardware set up, and the intuitive features
of the software. Because the system is easy to use, I have found that we are able to focus
on conducting our experiments and analyzing our data rather than spending an inordinate
amount of time fussing with technical issues‘. Dr. Carolynn Patten, VA Palo Alto Health Care System, USA
‘The ADInstruments software is much more user friendly than other systems we have used
in the past. This makes the system more versatile because you can adapt the software for
multiple applications’. Mr. Terry Beltz, University of Iowa, USA
‘ADInstruments PowerLab is a very safe and robust research system that is versatile and easy
to use. We are now able to perform our measurements and analyses with high accuracy’.
Dr. Laura Calvillo, PhD, Istituto Auxologico Italiano, Milan, Italy
‘We use PowerLab primarily for pharmacology experiments such as tissue baths, whole
animal hemodynamics (ECG, heart rate and blood pressure), and also isolated heart
ECG measurements. It collects concurrent data and computed inputs simultaneously, and
allows for easy post-run analysis. PowerLab is an easy to use and versatile solution for our
data collection needs’. Dr Michael Watson, Enhance Biotech
‘I am using PowerLab for recording cardiovascular parameters and for isolated tissue
experiments in the organ bath assembly. I found the hardware and software versatile
and easy to operate. The online and offl ine data computation feature is very useful
in measurement and analysis. Finally, a system built from a scientist’s point of view’.
Professor Mohammad Fahim, University of Delhi, India
‘PowerLab provides high fl exibility and allows us to easily modify experimental settings
according to constantly changing needs. In addition, the intuitive user interface of Chart
software provides tools and options for recording, analysis, documentation and archiving of
data from various experimental settings’. Dr Eckhard Weber, Novartis
‘Calibration is straightforward… I can trust the data collection process solely to the
technicians... It is very important to be able to just plug something in and run it’.
Dr. Michael Brands, Medical College of Georgia, USA
‘I am very happy with Chart. Firstly it is easy to operate compared with other applications;
secondly it has many powerful calculation and display functions. In addition ADInstruments
provides excellent post-purchase support. That’s why I prefer the PowerLab system with
Chart’. Dr. Yasuhiro Tsukimi, Pharmaceutical Research Division, Takeda Chemical Industries, Ltd.
What customers say about
ADInstruments PowerLab Systems with
LabChart (formerly Chart) software.

ADINSTRUMENTS.com
1
so
ftw
are
About ADInstrumentsADInstruments provides complete data acquisition and analysis solutions to academic
institutions, government organizations and private industry. At the core of our product
line is the world-renowned PowerLab® system with LabChart® and Scope™ software.
Together they offer comprehensive signal processing, data recording, display and
analysis features for a wide variety of research applications.
In conjunction with a computer, the systems provide the functionality of a multi-
channel, real-time chart recorder, polygraph, XY plotter and digital oscilloscope. You
can take advantage of variable sampling rates and remarkable resolution with the
benefits of powerful, computer-based data handling and analysis.
Sample applications:
Atrial and Ventricular Pressure
Blood Pressure – Invasive
Blood Pressure – Non Invasive
Blood Flow
Cardiac Output
Cardiac Function
CO2 and NH3
Dissolved O2
Dose Response
ECG, EKG
EEG and ECoG
EMG
Evoked Potentials
Extracellular Recordings
Gas Analysis
Gastrointestinal Motility
Hemodynamics
Intracellular Recordings
Ionic Concentrations
Isometric Tension
Isotonic Contraction
Langendorff Heart
Membrane Potential
Microvascular Tension
Mouse Applications
Muscle Tissue Contraction
Neurophysiology
Nitric Oxide
Oocyte Voltage Clamping
Organ Bath Experiments
Patch and Voltage Clamping
Perfused Organs
Pulse Oximetry
Respiratory Airflow
Sleep
Sympathetic Nerve Activity
Telemetry
Temperature
Ussing Chamber
Ventricular Pressure
Ventricular Pressure-Volume
Wire Myography
Working Heart
The ADInstruments Advantage: Experience you can trust. ADInstruments systems have been installed in thousands
of research institutes, universities, hospital and commercial laboratories worldwide.
With more than 25 000 systems installed worldwide and over 7000 published
scientific research papers featuring our products, you can be assured that the
decision to purchase an ADInstruments data acquisition system is the right one.
Power and flexibility. The flexibility of LabChart allows it to be used in a wide
variety of life science applications, maximizing the returns of your investment in
time and capital.
Intuitive and powerful software. Our software allows researchers to concentrate
on the science. Powerful data extraction and analysis features speed up the
research process.
Data integrity. PowerLab systems are calibrated and tested to deliver data you
can trust. The software incorporates data integrity features such as multiple block
recording with individual settings and calculations stored within a single file,
preservation of raw data, and date stamping.
GLP and 21 CFR Part 11 compliance. LabChart and our GLP software
provide the required user interface, audit trail and signing components for non-
repudiation of data under GLP and 21 CFR Part 11 compliance.
Quality and reliability. ADInstruments products are manufactured under a
quality system certified by an accredited body as complying with ISO 9001:2000
Excellence in customer training and support. Our international graduate and
postgraduate support staff are dedicated to making sure our customers are satisfied.

2
software
ADInstruments Research Software — An Overview
With over 20 years of development history, ADInstruments software continually sets
innovation and usability standards for data acquisition and analysis in life science applications.
Software PurposeMore
Details
LabChart LabChart software offers the functionality of a multi-channel chart recorder, virtual oscilloscope, XY plotter, polygraph and digital voltmeter. It allows the recording, display and analysis of up to 32 channels of data in real time, including real-time averaging on multiple channels.
Page 6
LabChart Extensions LabChart Extensions are available free of charge to all LabChart users. They provide additional data formatting, filtering, visualization, measurement calculations and other utility features.
Page 18
LabChart Reader LabChart Reader allows scientists that do not own a PowerLab to view and analyze (to a limited extent) LabChart data files. Scientists using PowerLab are able to share data files with their colleagues.
Page 20
LabChart Modules LabChart Modules are application-specific acquisition and analysis add-on programs for LabChart Software. Available separately or as a collection in LabChart Pro.
Page 22
LabChart Pro Software package that includes LabChart, all LabChart Modules and Scope. See list below for individual LabChart Module descriptions.
Page 22
n Blood Pressure Module
The Blood Pressure Module detects, analyzes, displays and reports a set of cardiovascular parameters from arterial or ventricular pressure signals. It can be used online or offline.
Page 22
n ECG Analysis Module
The ECG Analysis Module detects and examines ECG components online or offline providing statistical and graphical analysis. It features ECG averaging and is suitable for human and animal recordings.
Page 24
n HRV Module The HRV Module analyzes variability in ECG or arterial pulse recordings. A number of heart rate
variability parameters, graphs and a report can be generated online or offline.Page 26
n Cardiac Output Module
The Cardiac Output Module allows for cardiac output calculations to be derived from a LabChart recording of a thermodilution curve.
Page 27
LabChart Spike Histogram Blood Pressure
Scope View HRVSpirometry

ADINSTRUMENTS.com
3
so
ftw
are
Software PurposeMore
Details
n Metabolic Module The Metabolic Module enables real-time acquisition and online or offline analysis of human metabolic
parameters such as RER, V̇CO2, V̇O2 and V̇EPage 28
n Dose Response Module
The Dose Response Module generates dose response curves and calculated values such as EC50 and Hill slopes within LabChart. It can be used in online or offline modes.
Page 29
n Peak Analysis Module
The Peak Analysis Module provides automatic detection and analysis of multiple signal peaks in acquired waveforms. The module can be used in online or offline modes.
Page 30
n Spike Histogram Module
The Spike Histogram Module allows the detection, discrimination and analysis of extracellular neural spike activity online or offline.
Page 31
n Video Capture Module
The Video Capture Module is used to record and synchronize a video movie with a LabChart data file. This allows simultaneous playback and correlation between data and video recorded events.
Page 32
n DMT Normalization Module
The DMT Normalization Module calculates the optimal pretension conditions for microvessels prior to commencing experiments using DMT wire myographs.
Page 33
n Circadian Analysis Module
The Circadian Analysis Module analyzes data with a daily pattern. It generates graphical and tabular views of the daily and averaged circadian data.
Page 34
Scope Scope software provides the functionality of a virtual oscilloscope or XY plotter (one or two channels displayed versus time or as XY plot). It is ideal for fast transient signals that are time-locked to a stimulus.
Page 36
GLP Client and GLP Server
In conjunction with LabChart software, GLP Client and GLP Server provide PowerLab users with an easy and reliable data acquisition solution for a GLP and 21 CFR Part 11 compliant environment.
Page 38
Education Software Software ideal for a wide range of disciplines in both the community college and higher education institutions.
Page 40
PowerLab data acquisition systems are supplied with
both the Windows and Macintosh versions of LabChart software.
LabChart works with Windows Vista and XP and
Mac OS X (Universal Binary).
Dose Response Scope ECG Analysis
Video Capture MetabolicCardiac Output
4
software
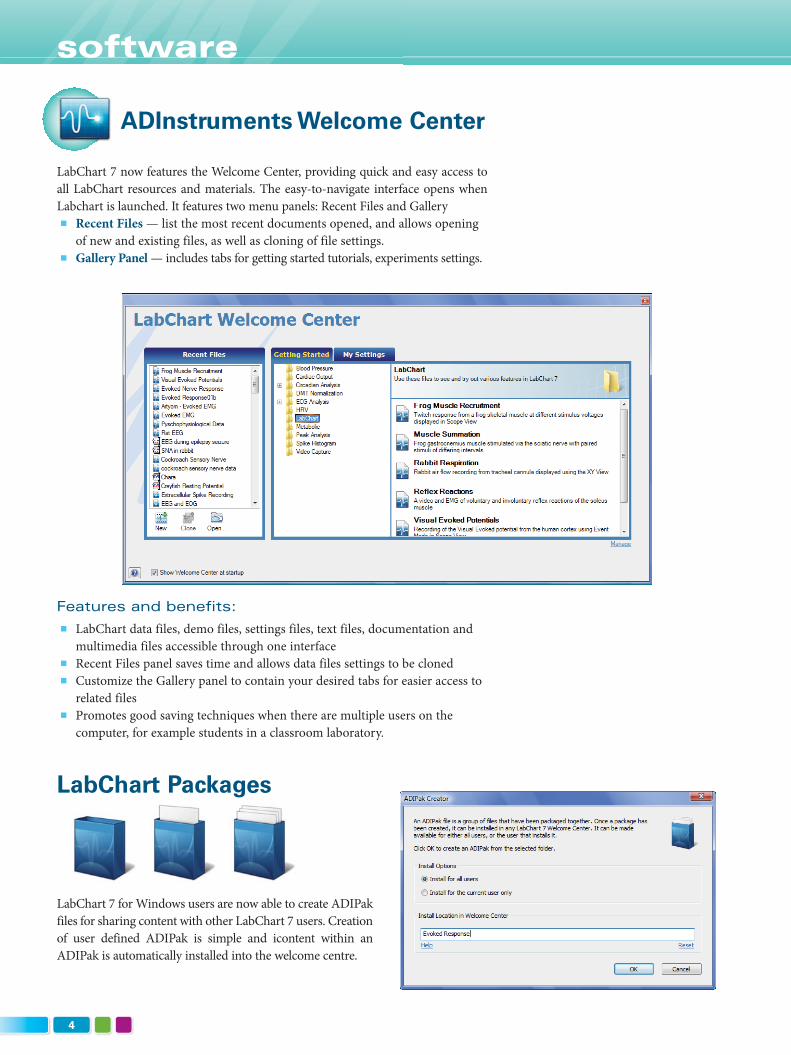
ADInstruments Welcome Center
LabChart 7 now features the Welcome Center, providing quick and easy access to
all LabChart resources and materials. The easy-to-navigate interface opens when
Labchart is launched. It features two menu panels: Recent Files and Gallery
n Recent Files — list the most recent documents opened, and allows opening
of new and existing files, as well as cloning of file settings.
n Gallery Panel — includes tabs for getting started tutorials, experiments settings.
Features and benefi ts:
n LabChart data files, demo files, settings files, text files, documentation and
multimedia files accessible through one interface
n Recent Files panel saves time and allows data files settings to be cloned
n Customize the Gallery panel to contain your desired tabs for easier access to
related files
n Promotes good saving techniques when there are multiple users on the
computer, for example students in a classroom laboratory.
LabChart Packages
LabChart 7 for Windows users are now able to create ADIPak
files for sharing content with other LabChart 7 users. Creation
of user defined ADIPak is simple and icontent within an
ADIPak is automatically installed into the welcome centre.

ADINSTRUMENTS.com
5
so
ftw
are
ADInstruments Feature Manager
Feature Manager allows you to browse and obtain any ADInstruments software
using one interface. The entire list of available ADInstruments software including
Modules and Extensions are now categorized in groups making it easier to find a
product that suits your application. You can also look for relevant software using
key terms in the search facility.
Feature Manager allows users to quickly turn LabChart extensions and modules
on or off. This makes the program only load those features that are required.
Manual or automatic software update checks can be performed to ensure you have
the most up-to-date version of LabChart software and products.
Feature Manager allows you to:
n Browse the entire catalogue of LabChart software including modules and
extensions according to scientific application categories and functions
n Search for suitable LabChart software using keywords
n Download and install any LabChart software
n Schedule or check for updates to get the latest software
n Register to gain free access ADInstruments software updates, teaching
experiments, application notes and other resources
6
software
12 LabChart Modules & Extensions
9 Customizable Comments
10 Channel Calculations
7 Scope View
11 DVM
4 Software-Controlled Settings
6 32 Channels with Variable Sampling Rates
2 Multiple Block Sampling
8 Split Bar
5 Input Amplifier
3
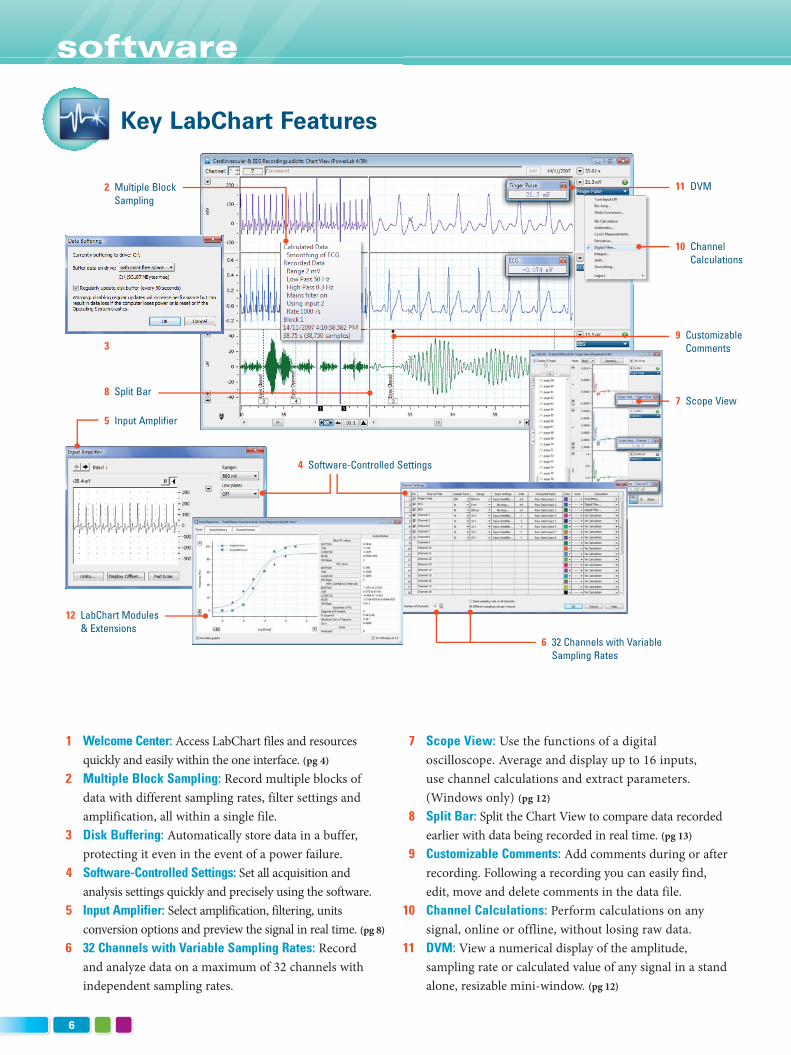
1 Welcome Center: Access LabChart files and resources
quickly and easily within the one interface. (pg 4)
2 Multiple Block Sampling: Record multiple blocks of
data with different sampling rates, filter settings and
amplification, all within a single file.
3 Disk Buffering: Automatically store data in a buffer,
protecting it even in the event of a power failure.
4 Software-Controlled Settings: Set all acquisition and
analysis settings quickly and precisely using the software.
5 Input Amplifier: Select amplification, filtering, units
conversion options and preview the signal in real time. (pg 8)
6 32 Channels with Variable Sampling Rates: Record
and analyze data on a maximum of 32 channels with
independent sampling rates.
7 Scope View: Use the functions of a digital
oscilloscope. Average and display up to 16 inputs,
use channel calculations and extract parameters.
(Windows only) (pg 12)
8 Split Bar: Split the Chart View to compare data recorded
earlier with data being recorded in real time. (pg 13)
9 Customizable Comments: Add comments during or after
recording. Following a recording you can easily find,
edit, move and delete comments in the data file.
10 Channel Calculations: Perform calculations on any
signal, online or offline, without losing raw data.
11 DVM: View a numerical display of the amplitude,
sampling rate or calculated value of any signal in a stand
alone, resizable mini-window. (pg 12)
Key LabChart Features
ADINSTRUMENTS.com
7
so
ftw
are
21 Marker Tool
20 Zoom View
19 XY Plot
18 Data Pad
16 Right Click
17 Find and Select
15 Tool Bar
14 Cyclic Measurements
13 Edit Macros
23 Save as Menu
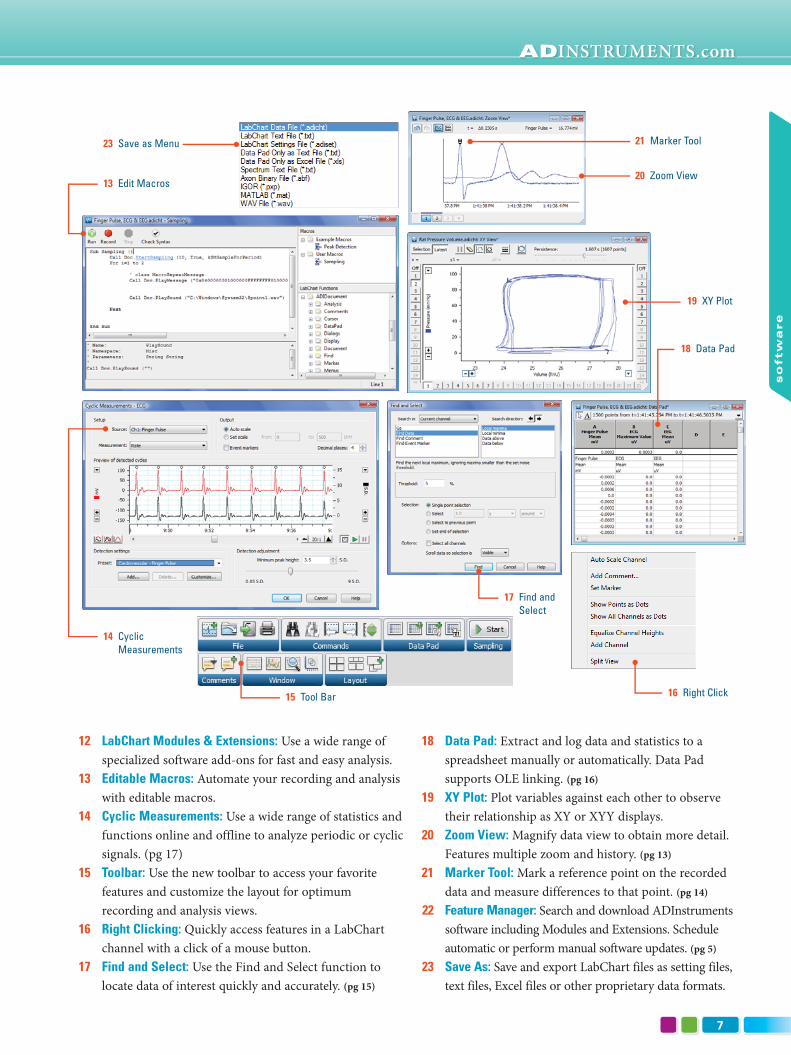
12 LabChart Modules & Extensions: Use a wide range of
specialized software add-ons for fast and easy analysis.
13 Editable Macros: Automate your recording and analysis
with editable macros.
14 Cyclic Measurements: Use a wide range of statistics and
functions online and offline to analyze periodic or cyclic
signals. (pg 17)
15 Toolbar: Use the new toolbar to access your favorite
features and customize the layout for optimum
recording and analysis views.
16 Right Clicking: Quickly access features in a LabChart
channel with a click of a mouse button.
17 Find and Select: Use the Find and Select function to
locate data of interest quickly and accurately. (pg 15)
18 Data Pad: Extract and log data and statistics to a
spreadsheet manually or automatically. Data Pad
supports OLE linking. (pg 16)
19 XY Plot: Plot variables against each other to observe
their relationship as XY or XYY displays.
20 Zoom View: Magnify data view to obtain more detail.
Features multiple zoom and history. (pg 13)
21 Marker Tool: Mark a reference point on the recorded
data and measure differences to that point. (pg 14)
22 Feature Manager: Search and download ADInstruments
software including Modules and Extensions. Schedule
automatic or perform manual software updates. (pg 5)
23 Save As: Save and export LabChart files as setting files,
text files, Excel files or other proprietary data formats.
8
software
LabChartLabChart software provides a range of powerful features
that transcend the limitations of pen-and-ink recorders and
‘do-it-yourself ’ data acquisition systems. It transforms your
computer into a digital chart recorder with analysis features
such as data extractions, arithmetic calculations, statistical
analyses, data display and graphing options.
LabChart is supplied with all PowerLab systems for
the latest Windows (Vista and XP) and Mac OS X
computer operating systems.
LabChart can:
n continuously record and display up to 32 channels of
data (up to 16 raw and up to 32 calculated signals)
n perform online or offline analysis
n display a range of specialized View windows including
Scope View, Zoom View and XY View
n automatically recognize PowerLab models, amplifiers
and smart transducers
n automatically export recorded values to other graphical
or statistical packages
n ensure compliance with Good Laboratory Practice
guidelines and FDA 21 CFR Part 11 regulations when
used with GLP Client and GLP Server software (see
page 34 for more details)
LabChart is continuously being developed and kept
up to date with the latest operating systems and
hardware technology, all catering to our customers’
research needs.
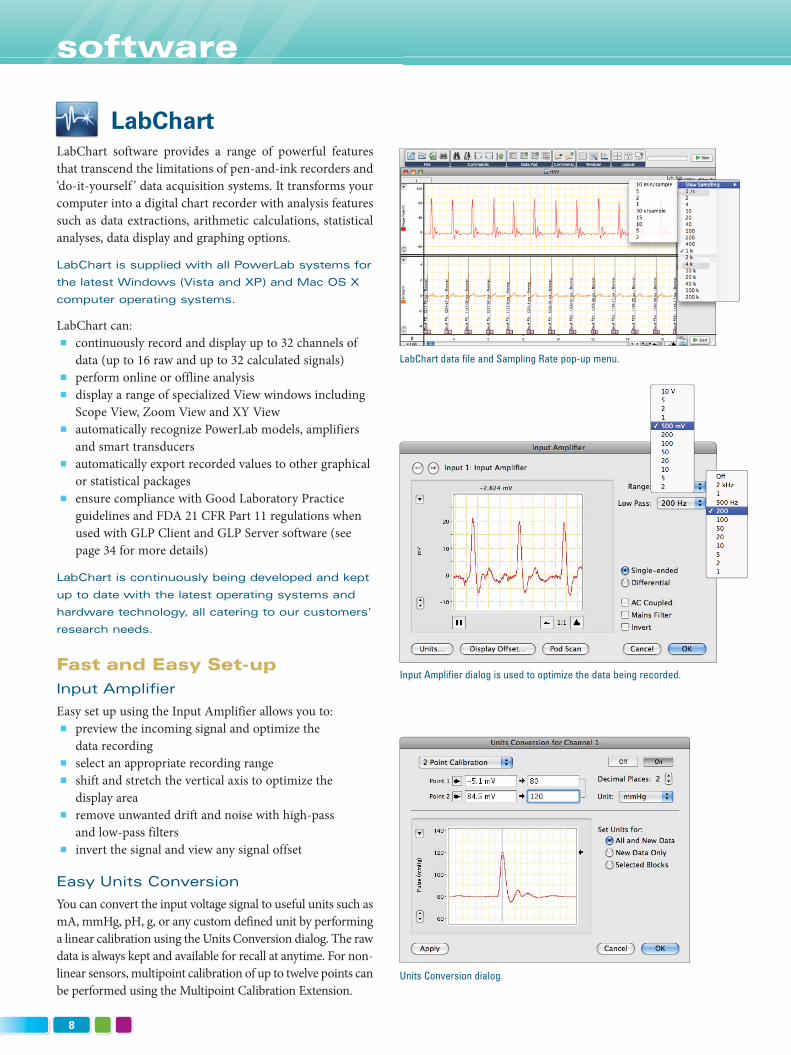
Fast and Easy Set-up
Input Amplifi er
Easy set up using the Input Amplifier allows you to:
n preview the incoming signal and optimize the
data recording
n select an appropriate recording range
n shift and stretch the vertical axis to optimize the
display area
n remove unwanted drift and noise with high-pass
and low-pass filters
n invert the signal and view any signal offset
Easy Units Conversion
You can convert the input voltage signal to useful units such as
mA, mmHg, pH, g, or any custom defined unit by performing
a linear calibration using the Units Conversion dialog. The raw
data is always kept and available for recall at anytime. For non-
linear sensors, multipoint calibration of up to twelve points can
be performed using the Multipoint Calibration Extension.
LabChart data file and Sampling Rate pop-up menu.
Input Amplifier dialog is used to optimize the data being recorded.
Units Conversion dialog.
ADINSTRUMENTS.com
9
so
ftw
are
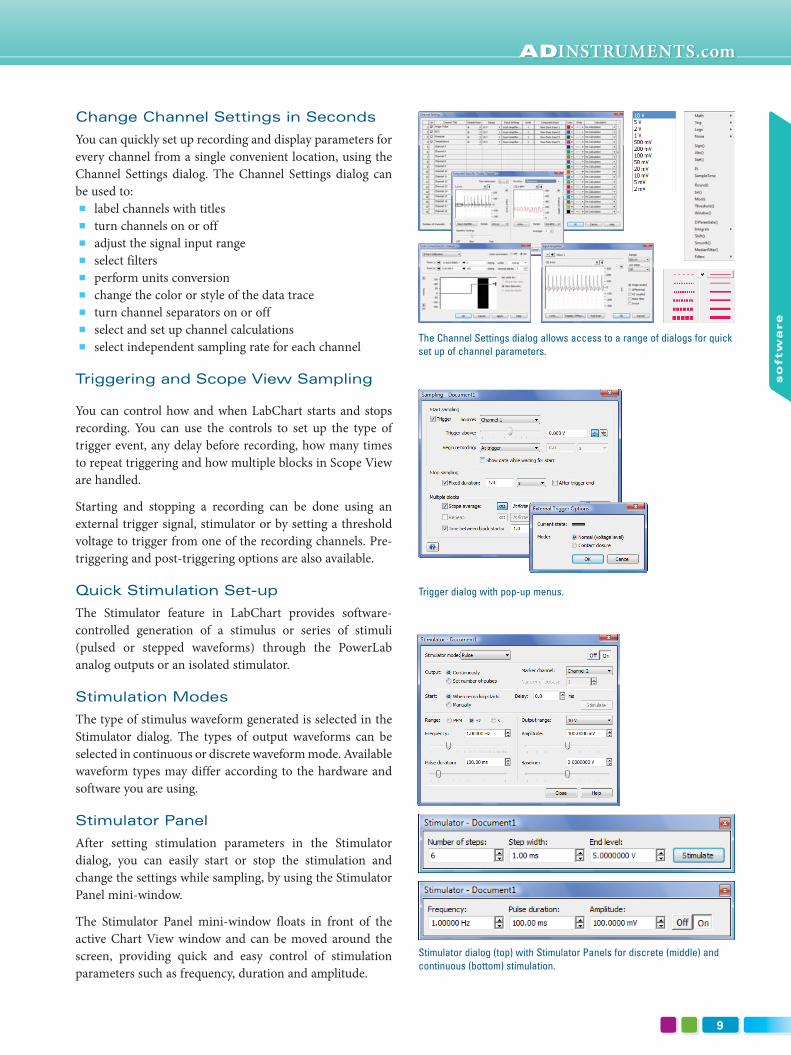
Change Channel Settings in Seconds
You can quickly set up recording and display parameters for
every channel from a single convenient location, using the
Channel Settings dialog. The Channel Settings dialog can
be used to:
n label channels with titles
n turn channels on or off
n adjust the signal input range
n select filters
n perform units conversion
n change the color or style of the data trace
n turn channel separators on or off
n select and set up channel calculations
n select independent sampling rate for each channel
Triggering and Scope View Sampling
You can control how and when LabChart starts and stops
recording. You can use the controls to set up the type of
trigger event, any delay before recording, how many times
to repeat triggering and how multiple blocks in Scope View
are handled.
Starting and stopping a recording can be done using an
external trigger signal, stimulator or by setting a threshold
voltage to trigger from one of the recording channels. Pre-
triggering and post-triggering options are also available.
Quick Stimulation Set-up
The Stimulator feature in LabChart provides software-
controlled generation of a stimulus or series of stimuli
(pulsed or stepped waveforms) through the PowerLab
analog outputs or an isolated stimulator.
Stimulation Modes
The type of stimulus waveform generated is selected in the
Stimulator dialog. The types of output waveforms can be
selected in continuous or discrete waveform mode. Available
waveform types may differ according to the hardware and
software you are using.
Stimulator Panel
After setting stimulation parameters in the Stimulator
dialog, you can easily start or stop the stimulation and
change the settings while sampling, by using the Stimulator
Panel mini-window.
The Stimulator Panel mini-window floats in front of the
active Chart View window and can be moved around the
screen, providing quick and easy control of stimulation
parameters such as frequency, duration and amplitude.
The Channel Settings dialog allows access to a range of dialogs for quick set up of channel parameters.
Trigger dialog with pop-up menus.
Stimulator dialog (top) with Stimulator Panels for discrete (middle) and continuous (bottom) stimulation.

10
software
Recording Features
Data File Structure
The LabChart data file structure makes it easy to work with
the file during and after recording. It also includes a number
of data integrity features, providing you with a recording
that you and your peers can trust. Benefits include:
n experimental settings automatically stored within the
one data file
n a single file can contain multiple recordings of
experimental data (Data Blocks) with different settings
n analysis settings, computations and comments are also
stored within the file
n raw data is retained at all times
n data files can be appended
n disk buffering to protect your data even if power fails
during recording
Adding Comments While Recording
Simply type in a comment and press ‘Enter/Return’ to
add a quick note during or after the recording. You can
also assign relevant phrases to particular Function keys
to note when certain conditions are introduced to an
experiment during recording.
Customizing Comments
You can Edit, Delete or Move comments in the Chart View.
In addition, the Comment & Exclusions feature provides
the list of all the comments made during the recording. It
allows you to:
n search for comments using a word filter
n display the date and time of the comment
n modify or delete comments
n go to the location of a particular comment in
the recording
Using Timed Events
The Timed Events (Mac only) feature allows you to create a
list of actions to be performed at stages during a recording.
LabChart will perform the actions at the times you have
specified. This is useful in long recordings with repetitive
events. There are three types of events that can be chosen:
n setting a PowerLab output voltage
n adding a comment
n applying a digital output configuration which can turn
switches (e.g. auto-injectors) on or off
This feature can be replicated in LabChart for Windows
using the Event Manager Extension.
Single data file with several data blocks.
The Automatic Comments dialog (right inset) allows pre-setting of comments with function keys. The Comments & Exclusions dialog (left inset and below) lists and finds comments in the data file.
Comments & Exclusions.
Timed Events dialog showing a list of selected actions.
ADINSTRUMENTS.com
11
so
ftw
are
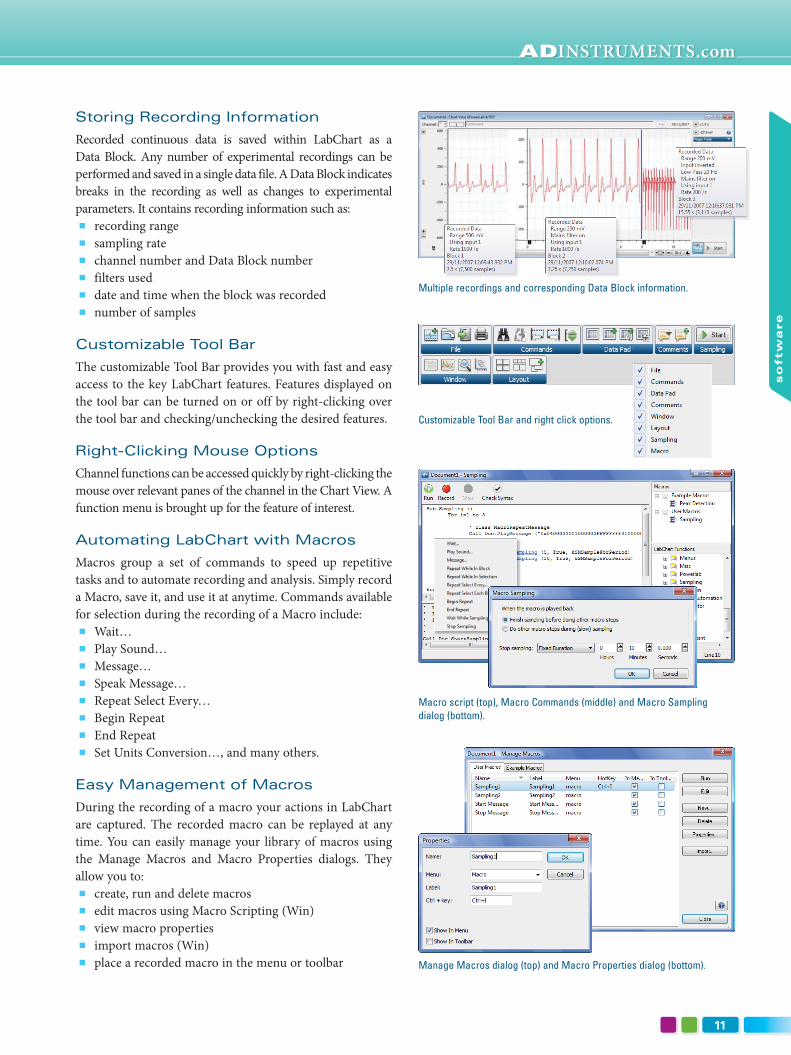
Storing Recording Information
Recorded continuous data is saved within LabChart as a
Data Block. Any number of experimental recordings can be
performed and saved in a single data file. A Data Block indicates
breaks in the recording as well as changes to experimental
parameters. It contains recording information such as:
n recording range
n sampling rate
n channel number and Data Block number
n filters used
n date and time when the block was recorded
n number of samples
Customizable Tool Bar
The customizable Tool Bar provides you with fast and easy
access to the key LabChart features. Features displayed on
the tool bar can be turned on or off by right-clicking over
the tool bar and checking/unchecking the desired features.
Right-Clicking Mouse Options
Channel functions can be accessed quickly by right-clicking the
mouse over relevant panes of the channel in the Chart View. A
function menu is brought up for the feature of interest.
Automating LabChart with Macros
Macros group a set of commands to speed up repetitive
tasks and to automate recording and analysis. Simply record
a Macro, save it, and use it at anytime. Commands available
for selection during the recording of a Macro include:
n Wait…
n Play Sound…
n Message…
n Speak Message…
n Repeat Select Every…
n Begin Repeat
n End Repeat
n Set Units Conversion…, and many others.
Easy Management of Macros
During the recording of a macro your actions in LabChart
are captured. The recorded macro can be replayed at any
time. You can easily manage your library of macros using
the Manage Macros and Macro Properties dialogs. They
allow you to:
n create, run and delete macros
n edit macros using Macro Scripting (Win)
n view macro properties
n import macros (Win)
n place a recorded macro in the menu or toolbar
Multiple recordings and corresponding Data Block information.
Customizable Tool Bar and right click options.
Macro script (top), Macro Commands (middle) and Macro Sampling dialog (bottom).
Manage Macros dialog (top) and Macro Properties dialog (bottom).

12
software
Data Display Options
Scope View for Signal Averaging
Scope View allows your computer to function as a digital
oscilloscope. Scope View provides multichannel averaging
of signals in real time. You can perform simultaneous
recording on Chart View and Scope View.
Features and benefits of Scope View include:
n Multi-channel signal averaging
n Unlimited sample and page numbers
n Recording of each sweep to a different page that can be
averaged and overlaid for analysis
n Data extraction from Scope View using Data Pad
n Advanced, editable scripting to automate repetitive tasks
n Channel calculations support
n Configuration of sampling settings and data recording
start/stop
Record data using either data blocks or events
n Block Mode: Pages are generated according to blocks
created for each signals. A new block is created each
time recording is started. The timing and triggering of
blocks is controlled using the Sampling dialog
n Event Mode: Pages are generated based on the location
of the event marker to generate a virtual sweep. Useful
for analyzing and comparing elements of a periodic
waveform
Channel Height Customization
The height of the channel (display area) can be quickly and
easily reduced or enlarged by clicking and dragging the
horizontal channel separators.
Amplitude Axis Adjustment
You can also use the Set Scale option to select the bottom and
top range values of the scale, then fine tune the appearance
of the signal by dragging or stretching the scale to make the
most of the available display space. Axis options include:
n Auto scale
n Auto scale all channels
n Unipolar
n Bipolar
n Invert scale and data (Windows)
Display Signal Values in Real Time
The DVM window displays signal values in units calibrated
for that channel. Values appear in a resizable window which
can be placed anywhere on the screen.
LabChart with DVM windows for easy viewing of numerical data.
Chart View (left) and Scope View (right).
Channel separators and scaling options.
Horizontal channel separators
ADINSTRUMENTS.com
13
so
ftw
are
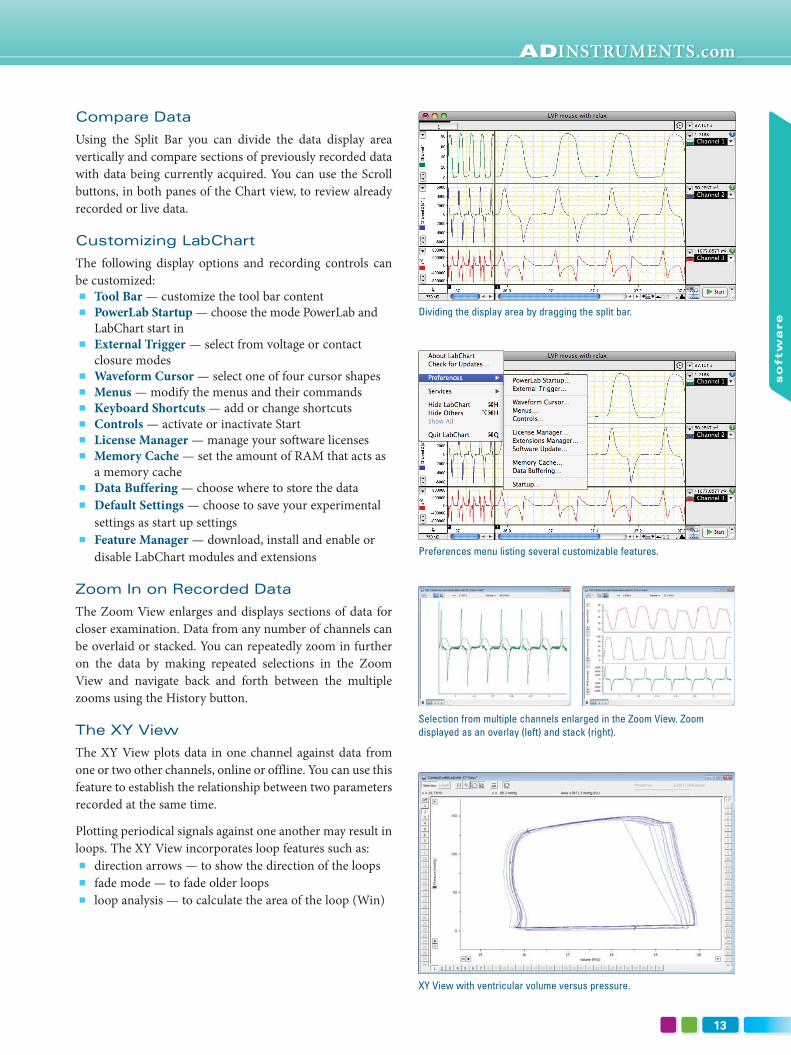
Compare Data
Using the Split Bar you can divide the data display area
vertically and compare sections of previously recorded data
with data being currently acquired. You can use the Scroll
buttons, in both panes of the Chart view, to review already
recorded or live data.
Customizing LabChart
The following display options and recording controls can
be customized:
n Tool Bar — customize the tool bar content
n PowerLab Startup — choose the mode PowerLab and
LabChart start in
n External Trigger — select from voltage or contact
closure modes
n Waveform Cursor — select one of four cursor shapes
n Menus — modify the menus and their commands
n Keyboard Shortcuts — add or change shortcuts
n Controls — activate or inactivate Start
n License Manager — manage your software licenses
n Memory Cache — set the amount of RAM that acts as
a memory cache
n Data Buffering — choose where to store the data
n Default Settings — choose to save your experimental
settings as start up settings
n Feature Manager — download, install and enable or
disable LabChart modules and extensions
Zoom In on Recorded Data
The Zoom View enlarges and displays sections of data for
closer examination. Data from any number of channels can
be overlaid or stacked. You can repeatedly zoom in further
on the data by making repeated selections in the Zoom
View and navigate back and forth between the multiple
zooms using the History button.
The XY View
The XY View plots data in one channel against data from
one or two other channels, online or offline. You can use this
feature to establish the relationship between two parameters
recorded at the same time.
Plotting periodical signals against one another may result in
loops. The XY View incorporates loop features such as:
n direction arrows — to show the direction of the loops
n fade mode — to fade older loops
n loop analysis — to calculate the area of the loop (Win)
Selection from multiple channels enlarged in the Zoom View. Zoom displayed as an overlay (left) and stack (right).
XY View with ventricular volume versus pressure.
Preferences menu listing several customizable features.
Dividing the display area by dragging the split bar.

14
software
Spectrum
Spectrum uses discrete Fast Fourier Transform to convert
data from the time domain to the frequency domain. You
can use it to:
n observe and differentiate the frequency components
of the signal
n estimate the main frequency component of your signal
n help set up filtering to remove any unwanted signal
frequencies
Notebook
The Notebook feature allows you to type in notes
before, during or after your experimental recording. The
Notebook:
n keeps all your notes in the one data file
n can be recalled at any time
n unlike pieces of paper, is impossible to misplace
Movie View
The Movie View allows you to view video associated with
LabChart data file captured using the Video Capture Module.
You can control video play/pause option, watch synchronized
view of movie with data file and use the Movie Marker to
center the Chart View corresponding to the movie.
Organizing Layouts
The Layout feature allows you to customize and save your
display in preferred layout option. These include:
n Cascade
n Smart Tile
n Tile
n Arrange Icons
n Tile Mini Windows
n Close All Data Analysis Features
Waveform Cursor
You can make instant discrete measurements by placing
the Waveform Cursor over the data display area. The Rate/
Time display shows the time at the cursor location, and
the Range/Amplitude display for each channel shows the
amplitude of the waveform.
Using the Marker Tool
The Marker can be dragged and locked onto a waveform at a
point of interest to make relative measurements with respect
to its position. By moving the cursor along the waveform, on
either side of the Marker, you can measure and display the
relative time and amplitude difference to the cursor position. The Marker can be used for making relative measurements in Chart (top) as well as Zoom Views (bottom).
Spectrum (left) and Notebook (right) features.
Customizable layouts to suit your needs.
ADINSTRUMENTS.com
15
so
ftw
are
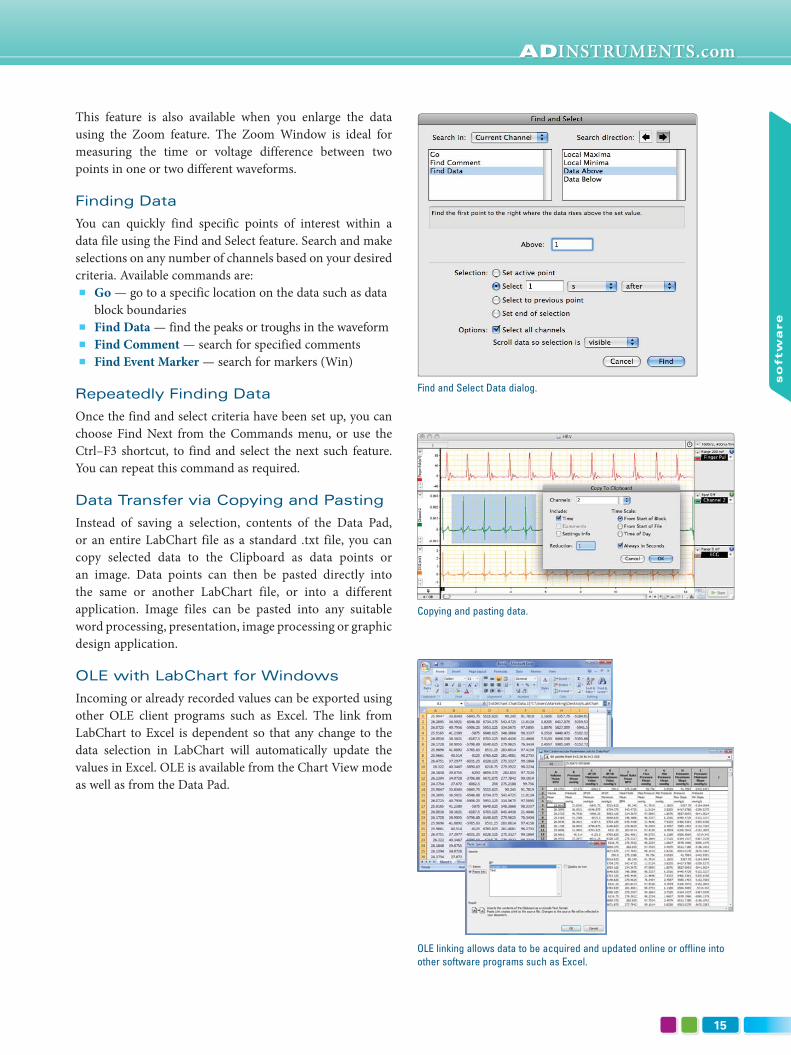
OLE linking allows data to be acquired and updated online or offline into other software programs such as Excel.
This feature is also available when you enlarge the data
using the Zoom feature. The Zoom Window is ideal for
measuring the time or voltage difference between two
points in one or two different waveforms.
Finding Data
You can quickly find specific points of interest within a
data file using the Find and Select feature. Search and make
selections on any number of channels based on your desired
criteria. Available commands are:
n Go — go to a specific location on the data such as data
block boundaries
n Find Data — find the peaks or troughs in the waveform
n Find Comment — search for specified comments
n Find Event Marker — search for markers (Win)
Repeatedly Finding Data
Once the find and select criteria have been set up, you can
choose Find Next from the Commands menu, or use the
Ctrl–F3 shortcut, to find and select the next such feature.
You can repeat this command as required.
Data Transfer via Copying and Pasting
Instead of saving a selection, contents of the Data Pad,
or an entire LabChart file as a standard .txt file, you can
copy selected data to the Clipboard as data points or
an image. Data points can then be pasted directly into
the same or another LabChart file, or into a different
application. Image files can be pasted into any suitable
word processing, presentation, image processing or graphic
design application.
OLE with LabChart for Windows
Incoming or already recorded values can be exported using
other OLE client programs such as Excel. The link from
LabChart to Excel is dependent so that any change to the
data selection in LabChart will automatically update the
values in Excel. OLE is available from the Chart View mode
as well as from the Data Pad.
Find and Select Data dialog.
Copying and pasting data.

16
software
Data Pad with extracted and calculated blood pressure parameters.
LabChart Window with floating Data Pad mini-windows.
LabChart Help dialogs.
Analyzing Data with Data Pad
The Data Pad allows you to log raw signal points or
calculated values from any channel into a table. You can
automate the addition of values prior to recording using the
‘Timed Add to Data Pad’ feature which periodically logs
data to the Data Pad as it is recorded. ‘Timed Add to Data
Pad’ in conjunction with LabChart OLE linking allows real
time plotting of X-Y curves in Excel to allow qualitative
linear regression analysis. Alternatively you can select the
data of interest after it has been recorded and simply choose
the ‘Add to Data Pad’ command. The ‘Multiple Add to Data
Pad’ command is another feature that can repeatedly extract
values from recorded data.
Data Pad contents can be saved as a text file or be copied to
other programs. Using OLE you can also export incoming
values to Excel in real time.
Analysis options include:
n Statistics — calculate the mean, SD, RMS, max and min
value, time at max and min values and number of points
n Selection & Active Point — obtain the start time, end
time, duration and number of points
n Comments — list time or value of active points,
comments and comment numbers or times
n Slope — get the average slope value, max and min
slope or time at max and min slopes
n Integral — calculate time integrals online or offline
n Block Information — obtain the range, sample
interval, block number, block duration, samples in
block, start time, start date and sampling rate
n Cyclic Measurements — extract periodic parameters
from waveforms including frequency, rate, mean, min
and max, 1/3 max + 2/3 min, height, integral, variance,
min and max derivatives
n XY Loop Calculations — calculate the area inside the
XY loop, x or y value and slope at the reference point in
XY loop, minimum and maximum x or y value, time at
minimum and maximum x or y value, and mean of x
or y value in XY loop in the XY View
n Scope — obtain page number, page duration and page
start time containing the active point or selection from
Scope View
Quick Help Features
LabChart’s Help Center, accessed through the main Menu,
provides you with Online Help (Windows only) topics cover
LabChart as well as all Extensions and Modules. LabChart
Modules feature step-by-step tutorials. There are also links
to our website and contacts for our worldwide distribution
and support network.
ADINSTRUMENTS.com
17
so
ftw
are
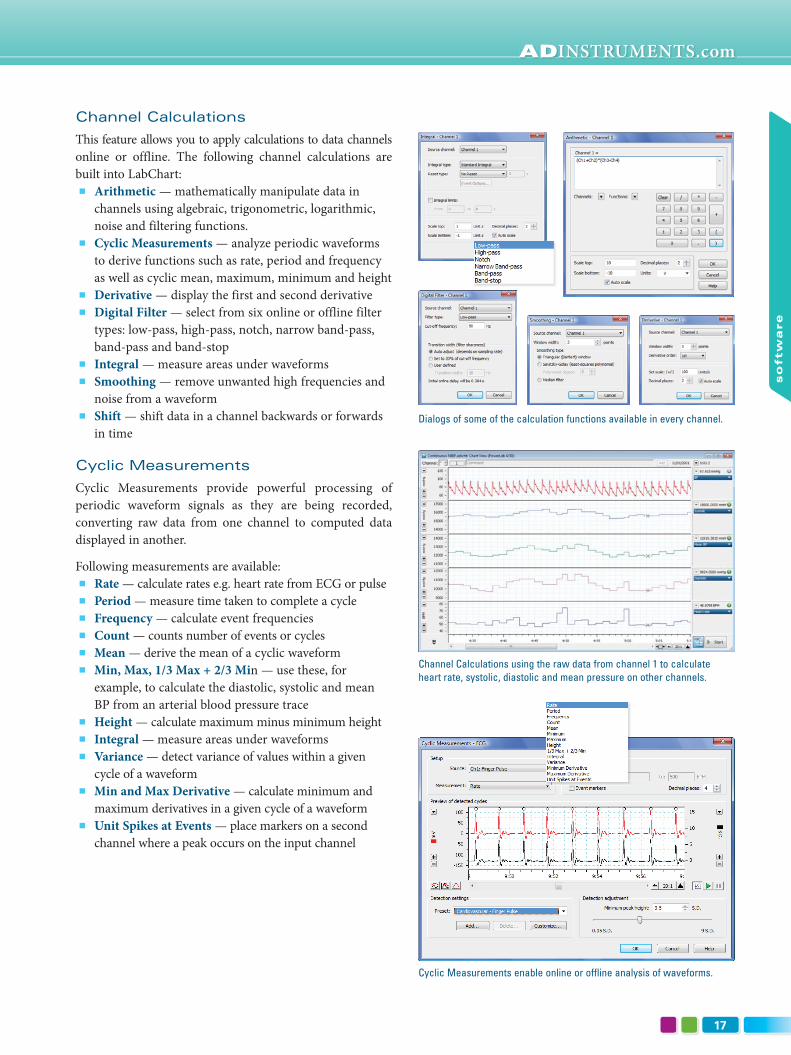
Channel Calculations using the raw data from channel 1 to calculate heart rate, systolic, diastolic and mean pressure on other channels.
Dialogs of some of the calculation functions available in every channel.
Cyclic Measurements enable online or offline analysis of waveforms.
Channel Calculations
This feature allows you to apply calculations to data channels
online or offline. The following channel calculations are
built into LabChart:
n Arithmetic — mathematically manipulate data in
channels using algebraic, trigonometric, logarithmic,
noise and filtering functions.
n Cyclic Measurements — analyze periodic waveforms
to derive functions such as rate, period and frequency
as well as cyclic mean, maximum, minimum and height
n Derivative — display the first and second derivative
n Digital Filter — select from six online or offline filter
types: low-pass, high-pass, notch, narrow band-pass,
band-pass and band-stop
n Integral — measure areas under waveforms
n Smoothing — remove unwanted high frequencies and
noise from a waveform
n Shift — shift data in a channel backwards or forwards
in time
Cyclic Measurements
Cyclic Measurements provide powerful processing of
periodic waveform signals as they are being recorded,
converting raw data from one channel to computed data
displayed in another.
Following measurements are available:
n Rate — calculate rates e.g. heart rate from ECG or pulse
n Period — measure time taken to complete a cycle
n Frequency — calculate event frequencies
n Count — counts number of events or cycles
n Mean — derive the mean of a cyclic waveform
n Min, Max, 1/3 Max + 2/3 Min — use these, for
example, to calculate the diastolic, systolic and mean
BP from an arterial blood pressure trace
n Height — calculate maximum minus minimum height
n Integral — measure areas under waveforms
n Variance — detect variance of values within a given
cycle of a waveform
n Min and Max Derivative — calculate minimum and
maximum derivatives in a given cycle of a waveform
n Unit Spikes at Events — place markers on a second
channel where a peak occurs on the input channel

18
software
LabChart ExtensionsLabChart Extensions add specific features and functionality to LabChart software
and are available free of charge to all LabChart users. LabChart Extensions are
available to download from the Software Updates section of our website.
LabChart Extensions
File Translation:
Export MATLAB
Export Axon
Export QuickTime
Export Igor
Export WAV
PVAN
Read Acqknowledge
Translate Binary
Translate EDF
Neurophysiology:
RMS & Noise
Evoked Response
Fast Response Output
Template
Telegraph
Filtering:
RMS & Noise
Savitzky-Golay
Signal Averaged ECG (SAECG)
Cardio-respiratory:
Spirometry
Signal Averaged ECG (SAECG)
Cardiac Axis
Ventricular Pressure
XY Plot
n Absorbance — convert spectrophotometer outputs from Transmittance
to Absorbance
n Amplitude Histogram — display and analyze the amplitude distribution of
a signal (allows for definition of bin width and additional analysis such as
mean, standard deviation and standard error)
n BioHarness — allows the recording of comprehensive physiological data
using ADInstruments Zephyr Technology Ltd BioHarness hardware in real
time and data logging mode
n Cardiac Axis — automate the calculation of frontal plane ECGs and vector
cardiograms and display of the instantaneous cardiac vector
n Curve Fit — perform non-linear, least squares fitting of built-in and user-
defined equations to data that has been recorded as a function of time
n Digital Output — allows the simple management of the digital output bits
for PowerLab models that provide a digital output (26T, /30 series, 4/SP, 8/SP,
16/SP and 4/ST)
n Evoked Response — analyze physiological responses to a stimulus;
parameters include value, latency, peak height, half-width, latency to peak
n Event Manager — monitor user defined events online using numerous
criteria and perform a variety of user defined actions
n Export Axon — save LabChart files in the ABF (Axon binary format) which
can be read by pClamp
n Export IGOR — export LabChart data files in a form that can be directly
read by the graphing analysis package IGOR Pro
n Export MATLAB — save LabChart data files in a format that can be opened
and read by the MATLAB® analysis package
n Export QuickTime — save LabChart data files as QuickTime® movies for
viewing using any QuickTime supported platform. Or for use in multimedia
presentations
n Export WAV — export LabChart for Windows files as uncompressed audio
WAV files (Audio WAV files can be played by a number of industry-standard
applications)
n Fast Response Output — control the digital outputs on 30 series PowerLab
units and analog outputs on 20, 25 and 30 series PowerLab units for
generation of rapid responses from within the PowerLab
n Function Generator — create data by using mathematical functions
n Multipoint Calibration — perform linear and non-linear multipoint
calibration of transducers, sensors, and other devices
n Peak Parameters — determines a number of parameters including peak height,
width and slope for an individual peak. Useful for determining parameters of
action potentials such as cardiac potentials, EPSP and IPSP

ADINSTRUMENTS.com
19
so
ftw
are
LabChart Extensions
Utility:
Audio Output
Digital Output
Event Manager
Export QuickTime
Fast Response Output
Play Sound
Scheduler
Shift
Telegraph
Template
Data Visualization:
Amplitude Histogram
Spectral Temporal Mapping (STM)
Telegraph
Peak Parameters
Measurements & Calibrations:
Multipoint Calibration
Absorbance
Evoked Response
Spirometry
Ventricular Pressure
Template
Chemistry:
Absorbance
Multipoint Calibration
Curve Fit
pH Measurement
Analysis Windows:
Amplitude Histogram
Curve Fit
Spectral Temporal Mapping (STM)
XY Plot
Please note that not all extensions are available for both Windows and Mac
operating systems and that some extension features may differ between computer
platforms. See our website for a current list and any new extensions.
n pH Measurement — allows calibration of pH and ion selective electrodes using
single or double point methods
n Play Sound — allows selected LabChart data to be played as sound
n PVAN — export LabChart Pressure and Volume data directly into the
Millar® Instruments PVAN application
n Audio Output — play back recorded LabChart data as sound
n RMS & Noise — determine the power content of a signal (the RMS gives
total power content, including the DC component; Noise gives the AC
component only)
n Read AcqKnowledge — provides easy means to import BIOPAC®
AcqKnowledge® (.acq) files into LabChart
n Savitzky-Golay — perform offline least-squares smoothing especially suited
to removing noise from data such as ECG and differential calculations
n Scheduler — allows the scheduling of recordings across one or more
LabChart data files. Can also be used with external scheduling devices such
as the TR Scheduler Pod
n Signal Averaged ECG — use SAECG to analyze ECG signals and display an
averaged cycle, hence removing noise and unwanted signal components
n Shift — shift data backwards or forwards in time
n Spirometry — process signals from pneumotachometers and display
respiratory parameters such as V·
E, VT, Frequency, PIF, PEF, FVC and FEV1,
as well as generating flow volume plots and spirometry reports
n STM — display the amplitude of the frequency components of a signal as
a function of time (a spectral-temporal map), allowing you to determine
regions where a particular frequency is dominant and to correlate this with
other signals, (applications include heart or lung sounds, sleep apnea, voice
studies, EEG and electric motor resonance frequencies)
n Telegraph — use of the gain-telegraph output from an electrophysiological
amplifier to display data at the correct scale after a gain change
n Template — match a data template with similar occurrences in a larger data
set, (Template provides a choice of three different algorithms – RMS Error,
Correlation or Convolution)
n Translate Binary — save and export LabChart for Windows data files in
a simple binary format or import binary documents that have either been
exported from LabChart or generated by another application
n Translate EDF — save LabChart data as an EDF (European Data Format)
file and read EDF files
n Ventricular Pressure — analyze recordings of cardiac ventricular pressure
n XY Plot — display a real-time XY window that plots one channel of data
against another while sampling
20
software
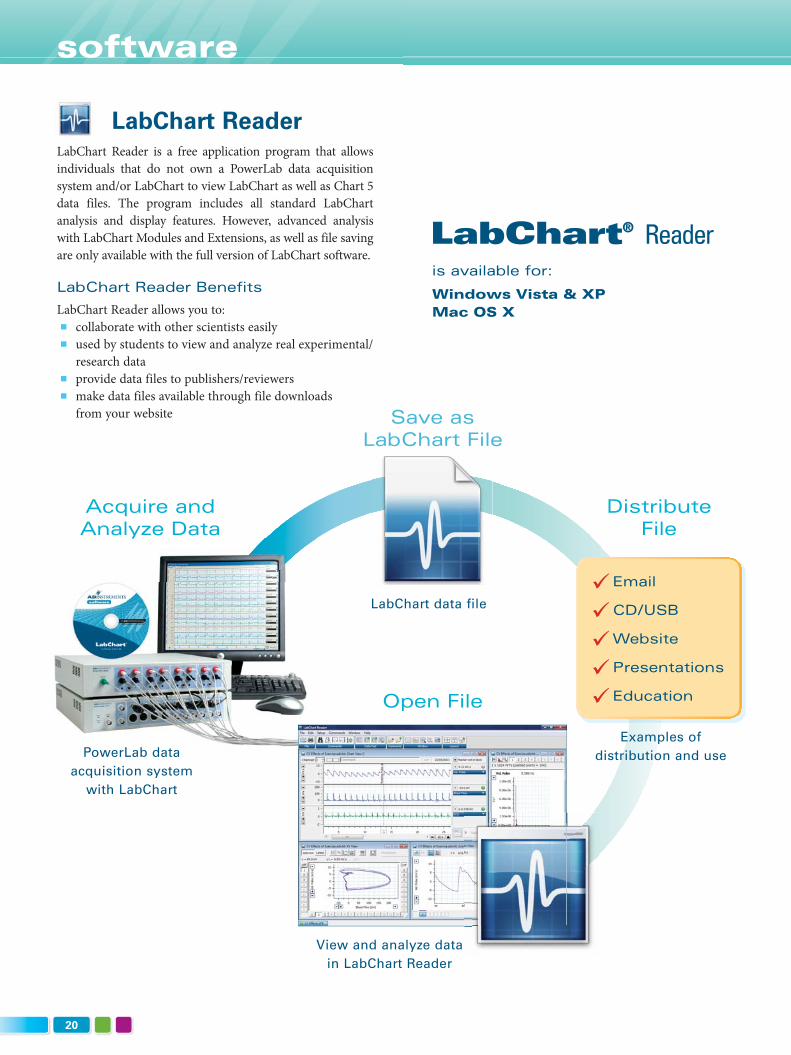
LabChart ReaderLabChart Reader is a free application program that allows
individuals that do not own a PowerLab data acquisition
system and/or LabChart to view LabChart as well as Chart 5
data files. The program includes all standard LabChart
analysis and display features. However, advanced analysis
with LabChart Modules and Extensions, as well as file saving
are only available with the full version of LabChart software.
LabChart Reader Benefi ts
LabChart Reader allows you to:
n collaborate with other scientists easily
n used by students to view and analyze real experimental/
research data
n provide data files to publishers/reviewers
n make data files available through file downloads
from your website
is available for:
Windows Vista & XP
Mac OS X
CD/USB
Website
Presentations
Education
Acquire and Analyze Data
PowerLab data
acquisition system
with LabChart
Distribute File
Save asLabChart File
LabChart data file
Examples of
distribution and use
Open File
View and analyze data
in LabChart Reader

ADINSTRUMENTS.com
21
so
ftw
are
LabChart Reader Features
Zoom Window — an example of a display feature
Recording button disabled — does not allow data acquisition
Cyclic Measurements — an example of performing calculations and analysis on recorded data
With LabChart Reader you can:
n Open LabChart data files and view recorded data
n Perform calculations and analyses
n Analyze data
n Print data
A full version of LabChart is required to:
n Record new data
n Open other file formats
n Save data
n Use our advanced analysis extensions and modules
Same display and analysis features as LabChart
Data Pad — an example of data extraction and analysis

22
software
Chart View of a ventricular pressure recording. Note Cycle Markers above the trace and cycle information pop-up.
Blood Pressure Settings dialog.
Blood PressureThe Blood Pressure Module allows you to identify and
analyze various parameters of arterial and ventricular
pressure online or offline.
Analysis settings can be set prior to (for online analysis) or
after recording (for offline analysis). The Blood Pressure
Settings dialog allows the selection of:
n the pressure signal to be analyzed (arterial or ventricular)
n cycle detection parameters
n cycle averaging options
n end of diastole and tau fitting options (ventricular
pressure only)
For ventricular pressure signals, the end of diastole can
be identified using either the pressure signal, or an ECG
signal that is synchronized with the pressure signal. The
time constant (Tau) provides a measure of the of isovolumic
relaxation of the heart.
Once the detection and analysis settings are selected:
n pressure cycles are automatically identified and marked
in the pressure trace
n marked cycles contain information such as cycle time,
number, duration and height
LabChart modules provide highly specialized data acquisition and analysis features for specific
applications. Examples include Blood Pressure, ECG Analysis, Dose Response and Video Capture.
The modules are available for purchase as a complete set in LabChart Pro or individually. LabChart Pro
users are entitled to free software updates for five (5) years.
Windows
LabChart and Scope Software
Blood Pressure
HRV
Cardiac Output
ECG Analysis
Metabolic
Dose Response
Peak Analysis
Spike Histogram
Video Capture
DMT Normalization
Circadian Analysis
LabChart Pro and LabChart Modules
ADINSTRUMENTS.com
23
so
ftw
are
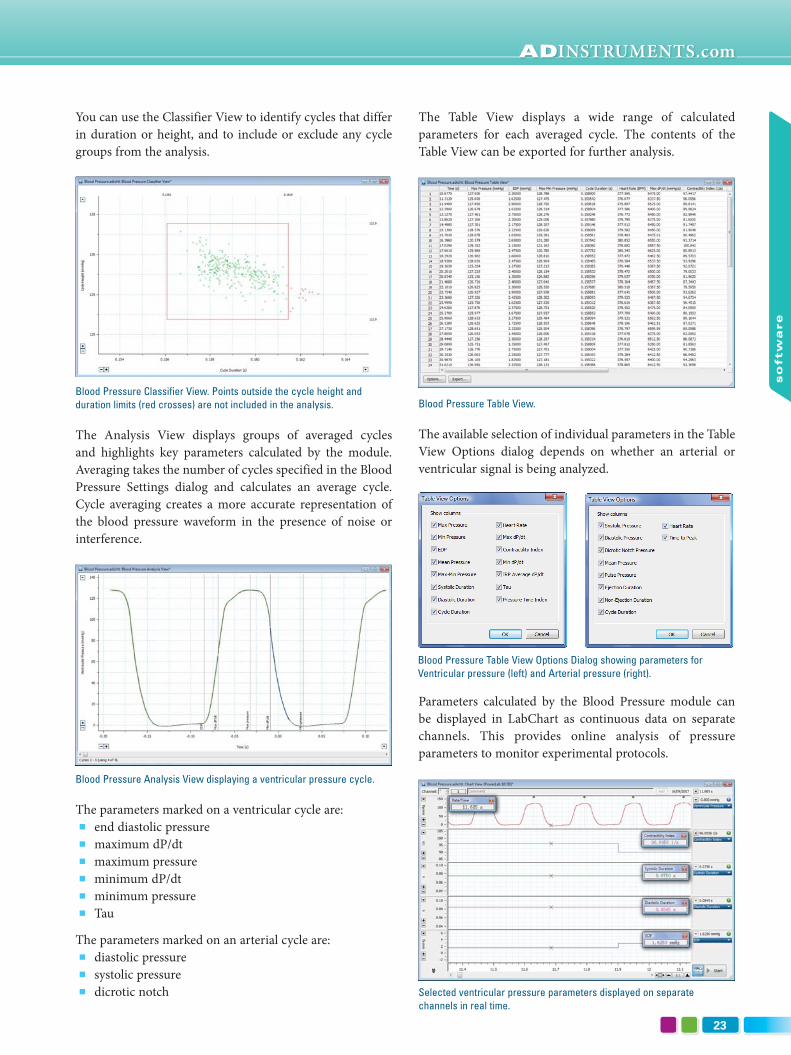
You can use the Classifier View to identify cycles that differ
in duration or height, and to include or exclude any cycle
groups from the analysis.
Blood Pressure Classifier View. Points outside the cycle height and duration limits (red crosses) are not included in the analysis.
The Analysis View displays groups of averaged cycles
and highlights key parameters calculated by the module.
Averaging takes the number of cycles specified in the Blood
Pressure Settings dialog and calculates an average cycle.
Cycle averaging creates a more accurate representation of
the blood pressure waveform in the presence of noise or
interference.
Blood Pressure Analysis View displaying a ventricular pressure cycle.
The parameters marked on a ventricular cycle are:
n end diastolic pressure
n maximum dP/dt
n maximum pressure
n minimum dP/dt
n minimum pressure
n Tau
The parameters marked on an arterial cycle are:
n diastolic pressure
n systolic pressure
n dicrotic notch
The Table View displays a wide range of calculated
parameters for each averaged cycle. The contents of the
Table View can be exported for further analysis.
Blood Pressure Table View.
The available selection of individual parameters in the Table
View Options dialog depends on whether an arterial or
ventricular signal is being analyzed.
Parameters calculated by the Blood Pressure module can
be displayed in LabChart as continuous data on separate
channels. This provides online analysis of pressure
parameters to monitor experimental protocols.
Blood Pressure Table View Options Dialog showing parameters for Ventricular pressure (left) and Arterial pressure (right).
Selected ventricular pressure parameters displayed on separate channels in real time.

24
software
ECG Analysis The ECG Analysis Module for Windows provides automatic
detection and analysis of recorded ECG signals in LabChart.
As the raw data is unaltered by calculations, the ECG can
be re-analyzed at any time. The module is suited for ECG
analysis from any species and features preset detection
parameters for humans, pigs, dogs, rabbits, guinea pigs, rats
and mice.
The ECG Analysis Module advantages include:
n online/offline ECG analysis and extraction of parameters
n automated detection and averaging of ECG cycles
n automated tabulation of ECG parameters
n automated online or offline ECG Analysis Plots
n linking between the LabChart, ECG Analysis and Table
Views for quick navigation to points of interest
The Settings dialog allows the user to select settings for a
particular species, or manually configure detection settings
for optimal identification of waveforms in the recorded
ECG. These settings include:
n presets
n detection settings
n calculation formula of QTc
n averaging options of ECG beats
n analysis interval
Beat markers appear above the data trace in the Chart View
when beats within the recorded ECG are identified. Left-
clicking on these markers provides the beat number and the
RR interval from the previous beat.
The Classifier View feature enables the detection and removal
of unwanted individual or groups of beats from the analysis.
The left panel allows exclusion of beats with excessive ‘noise’
such as muscle activity, while the right panel identifies beats
with different RR intervals or altered QRS shape.
The Averaging View displays each beat along with the
average as set in the ECG Settings dialog. The module
automatically identifies and labels the ECG parameters.
These can be manually adjusted or deactivated by right-
clicking in the ECG Averaging View.
ECG Averaging View. The average waveform is shown in black, with identified parameters labeled.
The ECG parameters for each average are automatically
logged in the Table View and include values of:
n P, Q, R, S, T amplitudes
n time intervals such as RR, PR, JT, QT and QTc
Windows
ECG Beat Classifier View.
Chart View with Beat Markers showing included beats (green) and excluded beats (red) from analysis.
ECG Settings dialog showing Presets (top) and QTc formulas (bottom).

ADINSTRUMENTS.com
25
so
ftw
are
This table is divided into two sections. In the upper section,
each data row corresponds to the averaged values calculated
from multiple cycles, while the lower section provides a
statistical summary of all the rows. ECG parameters and
summary information can be selected individually for display
using the Table View options dialog. ECG parameters from
the Table View may be exported to other applications for
further analysis, or added directly to the LabChart Data Pad.
The ECG Module provides several Analysis Plots to allow
quick qualitative analysis of the ECG recording. These
Analysis Plots are automatically generated either online or
offline and include:
n QT/RR Plot (QT Interval versus RR Interval)
n QT/Time Plot
n RR/Time Plot
n Waterfall Plot
In addition, each ECG parameter calculated by the ECG
Analysis Module can be displayed in a separate channel in
Chart View by selecting ECG Analysis… in the Channel
Calculation pop-up menu.
ECG Table View (above) and the ECG Table View Options dialog (right).
Analysis Plots such as QT interval versus Time are ideal to illustrate effect of dofetilide on the QT prolongation of the ECG signal.
The ECG Waterfall Plot displays a 3D plot of averaged beats.
RR Interval and QT Interval calculated using the ECG Analysis Module and displayed in two separate channels in Chart View.
26
software
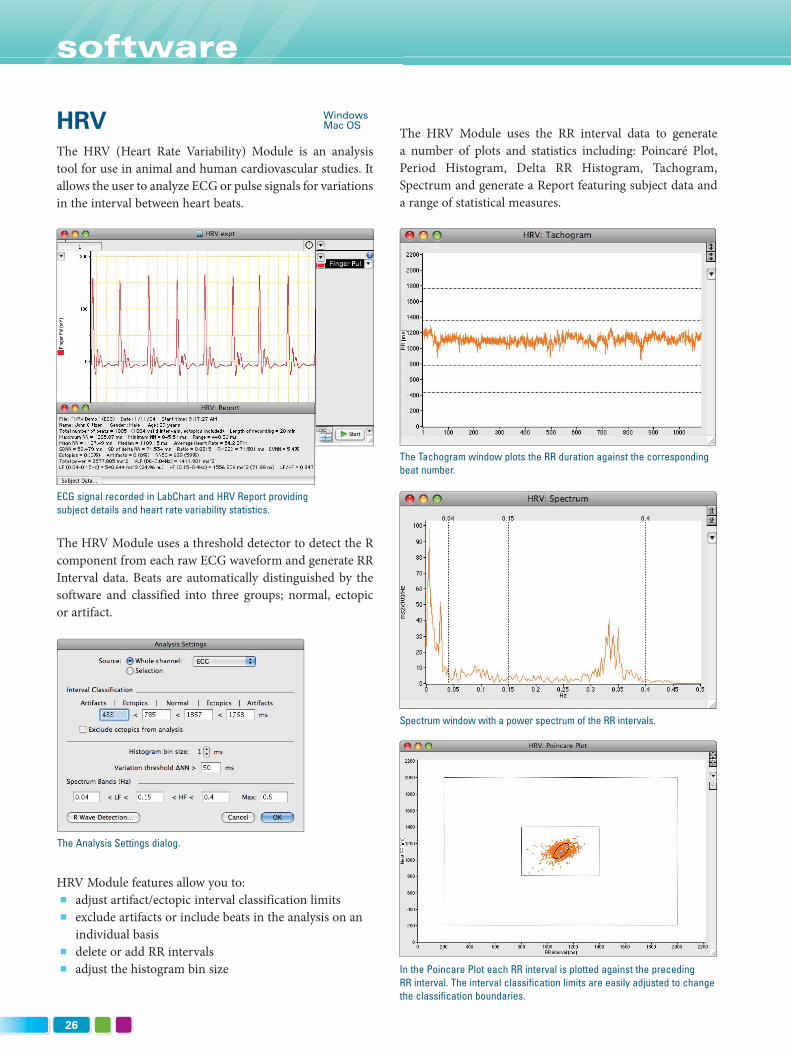
HRVThe HRV (Heart Rate Variability) Module is an analysis
tool for use in animal and human cardiovascular studies. It
allows the user to analyze ECG or pulse signals for variations
in the interval between heart beats.
WindowsMac OS
The HRV Module uses the RR interval data to generate
a number of plots and statistics including: Poincaré Plot,
Period Histogram, Delta RR Histogram, Tachogram,
Spectrum and generate a Report featuring subject data and
a range of statistical measures.
The HRV Module uses a threshold detector to detect the R
component from each raw ECG waveform and generate RR
Interval data. Beats are automatically distinguished by the
software and classified into three groups; normal, ectopic
or artifact.
HRV Module features allow you to:
n adjust artifact/ectopic interval classification limits
n exclude artifacts or include beats in the analysis on an
individual basis
n delete or add RR intervals
n adjust the histogram bin size
ECG signal recorded in LabChart and HRV Report providing subject details and heart rate variability statistics.
The Analysis Settings dialog.
In the Poincare Plot each RR interval is plotted against the preceding RR interval. The interval classification limits are easily adjusted to change the classification boundaries.
The Tachogram window plots the RR duration against the corresponding beat number.
Spectrum window with a power spectrum of the RR intervals.
ADINSTRUMENTS.com
27
so
ftw
are
Cardiac Output Settings dialog allows the user to define the parameters used in the calculation of cardiac output.
Cardiac OutputThe Cardiac Output Module for Windows provides an
analysis tool to easily determine the cardiac output from a
recorded thermodilution curve measured in small animals.
The module features allow the user to:
n set up experiment and calculation parameters
n automatically calculate and display cardiac output from
recorded thermodilution curves
n extract and export cardiac output values to other
programs for further statistical analysis
The cardiac output calculation is based on the area under
the thermodilution curve and takes account of baseline drift
and prolongation of the decay curve, due to recirculation of
the injectate.
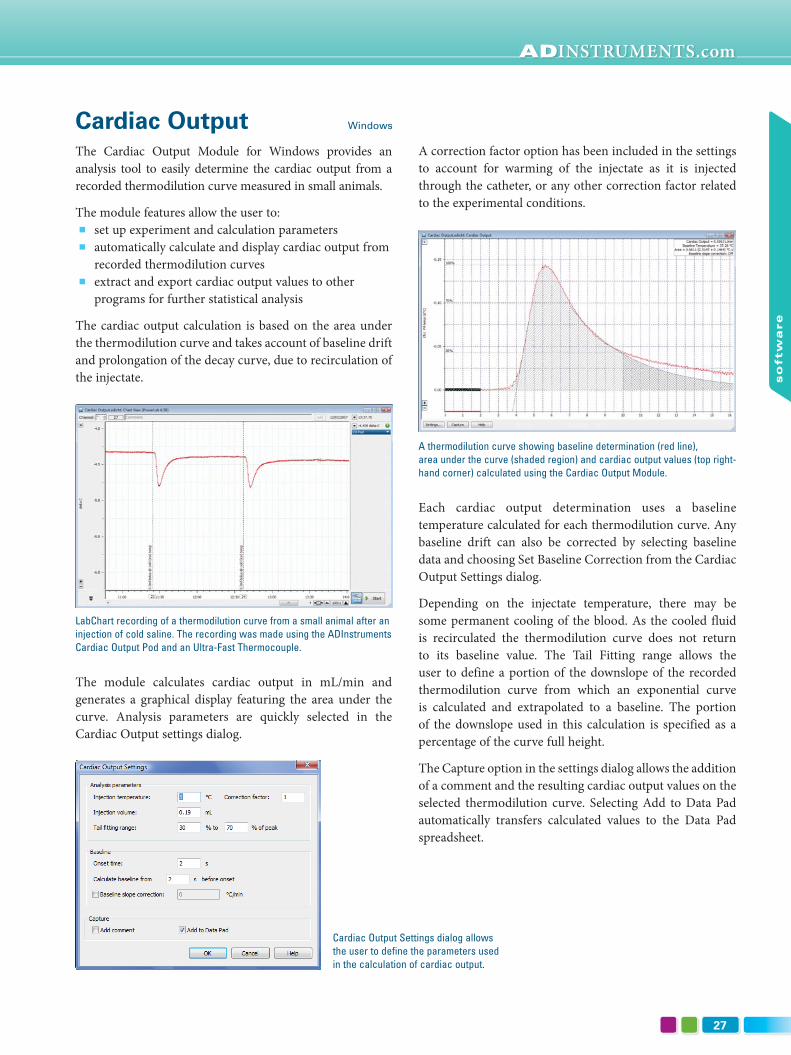
LabChart recording of a thermodilution curve from a small animal after an injection of cold saline. The recording was made using the ADInstruments Cardiac Output Pod and an Ultra-Fast Thermocouple.
The module calculates cardiac output in mL/min and
generates a graphical display featuring the area under the
curve. Analysis parameters are quickly selected in the
Cardiac Output settings dialog.
Windows
A correction factor option has been included in the settings
to account for warming of the injectate as it is injected
through the catheter, or any other correction factor related
to the experimental conditions.
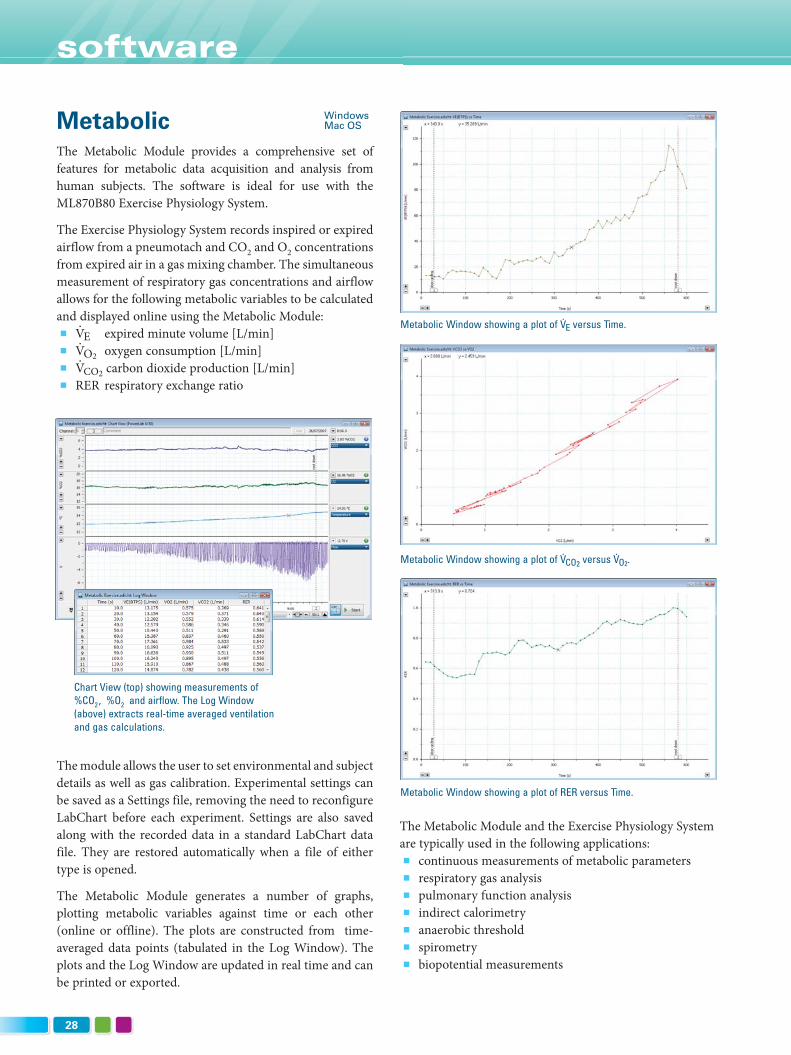
A thermodilution curve showing baseline determination (red line), area under the curve (shaded region) and cardiac output values (top right-hand corner) calculated using the Cardiac Output Module.
Each cardiac output determination uses a baseline
temperature calculated for each thermodilution curve. Any
baseline drift can also be corrected by selecting baseline
data and choosing Set Baseline Correction from the Cardiac
Output Settings dialog.
Depending on the injectate temperature, there may be
some permanent cooling of the blood. As the cooled fluid
is recirculated the thermodilution curve does not return
to its baseline value. The Tail Fitting range allows the
user to define a portion of the downslope of the recorded
thermodilution curve from which an exponential curve
is calculated and extrapolated to a baseline. The portion
of the downslope used in this calculation is specified as a
percentage of the curve full height.
The Capture option in the settings dialog allows the addition
of a comment and the resulting cardiac output values on the
selected thermodilution curve. Selecting Add to Data Pad
automatically transfers calculated values to the Data Pad
spreadsheet.
28
software
MetabolicThe Metabolic Module provides a comprehensive set of
features for metabolic data acquisition and analysis from
human subjects. The software is ideal for use with the
ML870B80 Exercise Physiology System.
The Exercise Physiology System records inspired or expired
airflow from a pneumotach and CO2 and O2 concentrations
from expired air in a gas mixing chamber. The simultaneous
measurement of respiratory gas concentrations and airflow
allows for the following metabolic variables to be calculated
and displayed online using the Metabolic Module:
n V.E expired minute volume [L/min]
n V.O2 oxygen consumption [L/min]
n V.
CO2 carbon dioxide production [L/min]
n RER respiratory exchange ratio
WindowsMac OS
The Metabolic Module and the Exercise Physiology System
are typically used in the following applications:
n continuous measurements of metabolic parameters
n respiratory gas analysis
n pulmonary function analysis
n indirect calorimetry
n anaerobic threshold
n spirometry
n biopotential measurements
The module allows the user to set environmental and subject
details as well as gas calibration. Experimental settings can
be saved as a Settings file, removing the need to reconfigure
LabChart before each experiment. Settings are also saved
along with the recorded data in a standard LabChart data
file. They are restored automatically when a file of either
type is opened.
The Metabolic Module generates a number of graphs,
plotting metabolic variables against time or each other
(online or offline). The plots are constructed from time-
averaged data points (tabulated in the Log Window). The
plots and the Log Window are updated in real time and can
be printed or exported.
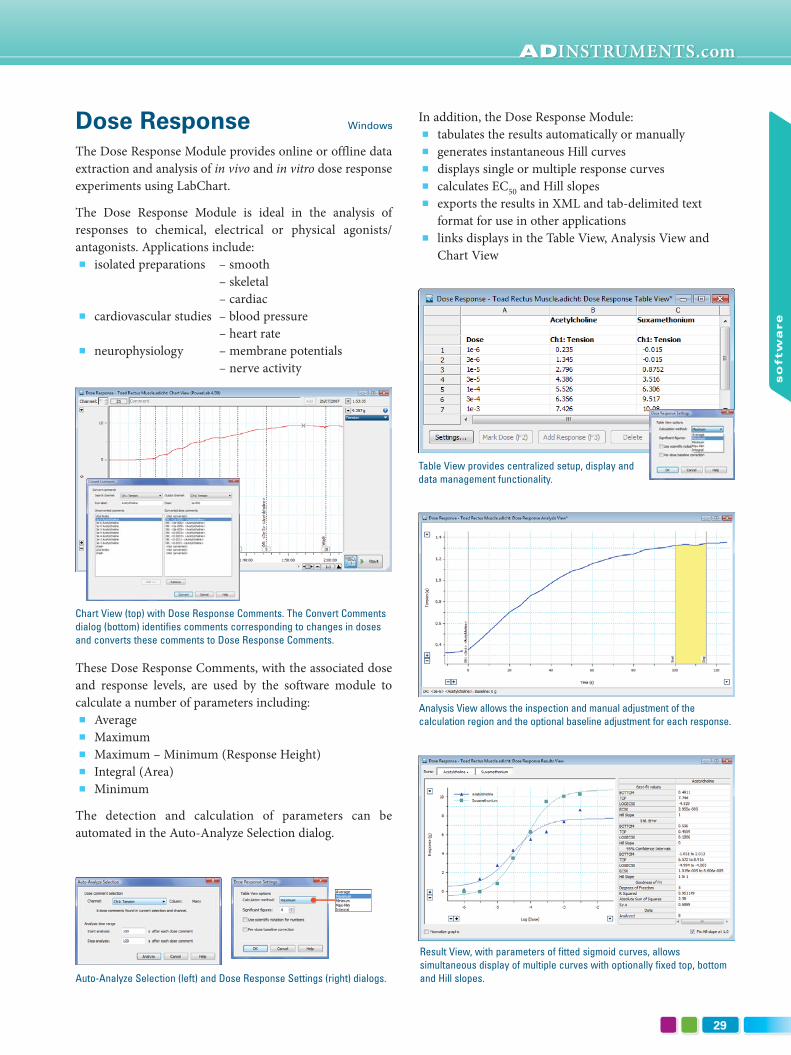
Chart View (top) showing measurements of %CO2 , %O2 and airflow. The Log Window (above) extracts real-time averaged ventilation and gas calculations.
Metabolic Window showing a plot of RER versus Time.
Metabolic Window showing a plot of V·CO2 versus V
·O2.
Metabolic Window showing a plot of V·E versus Time.
ADINSTRUMENTS.com
29
so
ftw
are
Dose ResponseThe Dose Response Module provides online or offline data
extraction and analysis of in vivo and in vitro dose response
experiments using LabChart.
The Dose Response Module is ideal in the analysis of
responses to chemical, electrical or physical agonists/
antagonists. Applications include:
n isolated preparations – smooth
– skeletal
– cardiac
n cardiovascular studies – blood pressure
– heart rate
n neurophysiology – membrane potentials
– nerve activity
In addition, the Dose Response Module:
n tabulates the results automatically or manually
n generates instantaneous Hill curves
n displays single or multiple response curves
n calculates EC50 and Hill slopes
n exports the results in XML and tab-delimited text
format for use in other applications
n links displays in the Table View, Analysis View and
Chart View
Auto-Analyze Selection (left) and Dose Response Settings (right) dialogs.
These Dose Response Comments, with the associated dose
and response levels, are used by the software module to
calculate a number of parameters including:
n Average
n Maximum
n Maximum – Minimum (Response Height)
n Integral (Area)
n Minimum
The detection and calculation of parameters can be
automated in the Auto-Analyze Selection dialog.
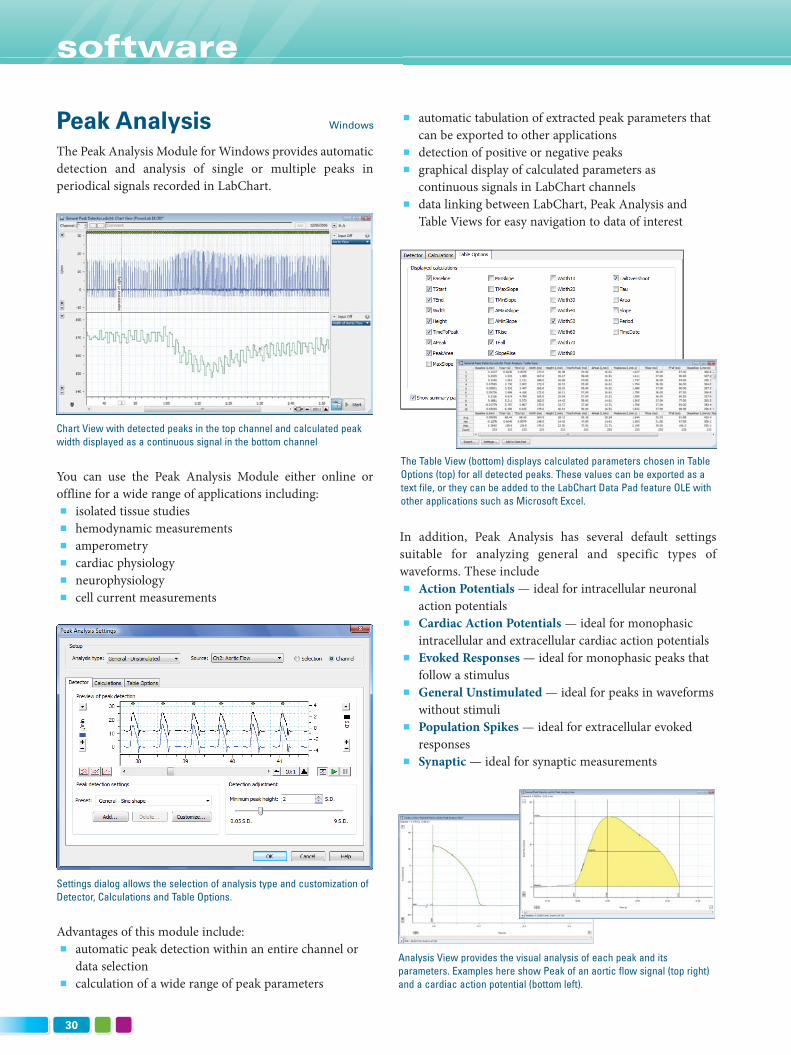
Table View provides centralized setup, display and data management functionality.
Analysis View allows the inspection and manual adjustment of the calculation region and the optional baseline adjustment for each response.
Result View, with parameters of fitted sigmoid curves, allows simultaneous display of multiple curves with optionally fixed top, bottom and Hill slopes.
Chart View (top) with Dose Response Comments. The Convert Comments dialog (bottom) identifies comments corresponding to changes in doses and converts these comments to Dose Response Comments.
Windows
30
software
Peak AnalysisThe Peak Analysis Module for Windows provides automatic
detection and analysis of single or multiple peaks in
periodical signals recorded in LabChart.
Chart View with detected peaks in the top channel and calculated peak width displayed as a continuous signal in the bottom channel
You can use the Peak Analysis Module either online or
offline for a wide range of applications including:
n isolated tissue studies
n hemodynamic measurements
n amperometry
n cardiac physiology
n neurophysiology
n cell current measurements
Settings dialog allows the selection of analysis type and customization of Detector, Calculations and Table Options.
Advantages of this module include:
n automatic peak detection within an entire channel or
data selection
n calculation of a wide range of peak parameters
Windows n automatic tabulation of extracted peak parameters that
can be exported to other applications
n detection of positive or negative peaks
n graphical display of calculated parameters as
continuous signals in LabChart channels
n data linking between LabChart, Peak Analysis and
Table Views for easy navigation to data of interest
In addition, Peak Analysis has several default settings
suitable for analyzing general and specific types of
waveforms. These include
n Action Potentials — ideal for intracellular neuronal
action potentials
n Cardiac Action Potentials — ideal for monophasic
intracellular and extracellular cardiac action potentials
n Evoked Responses — ideal for monophasic peaks that
follow a stimulus
n General Unstimulated — ideal for peaks in waveforms
without stimuli
n Population Spikes — ideal for extracellular evoked
responses
n Synaptic — ideal for synaptic measurements
Analysis View provides the visual analysis of each peak and its parameters. Examples here show Peak of an aortic flow signal (top right) and a cardiac action potential (bottom left).
The Table View (bottom) displays calculated parameters chosen in Table Options (top) for all detected peaks. These values can be exported as a text file, or they can be added to the LabChart Data Pad feature OLE with other applications such as Microsoft Excel.
ADINSTRUMENTS.com
31
so
ftw
are
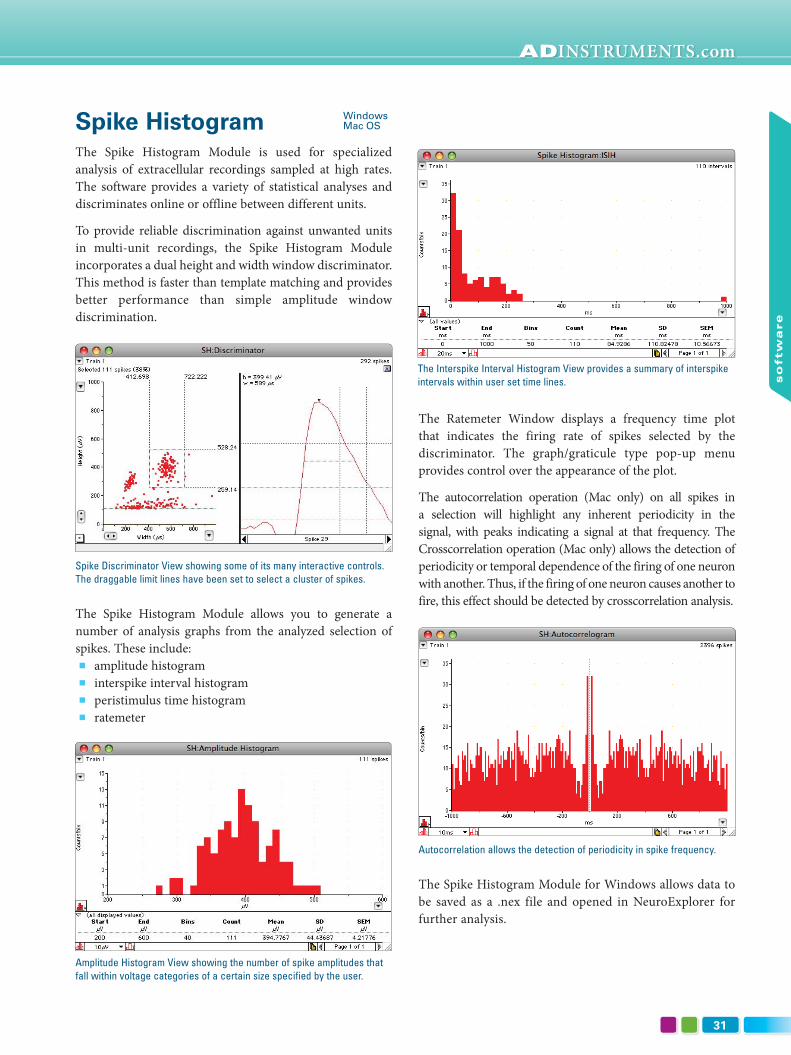
Spike HistogramThe Spike Histogram Module is used for specialized
analysis of extracellular recordings sampled at high rates.
The software provides a variety of statistical analyses and
discriminates online or offline between different units.
To provide reliable discrimination against unwanted units
in multi-unit recordings, the Spike Histogram Module
incorporates a dual height and width window discriminator.
This method is faster than template matching and provides
better performance than simple amplitude window
discrimination.
Spike Discriminator View showing some of its many interactive controls. The draggable limit lines have been set to select a cluster of spikes.
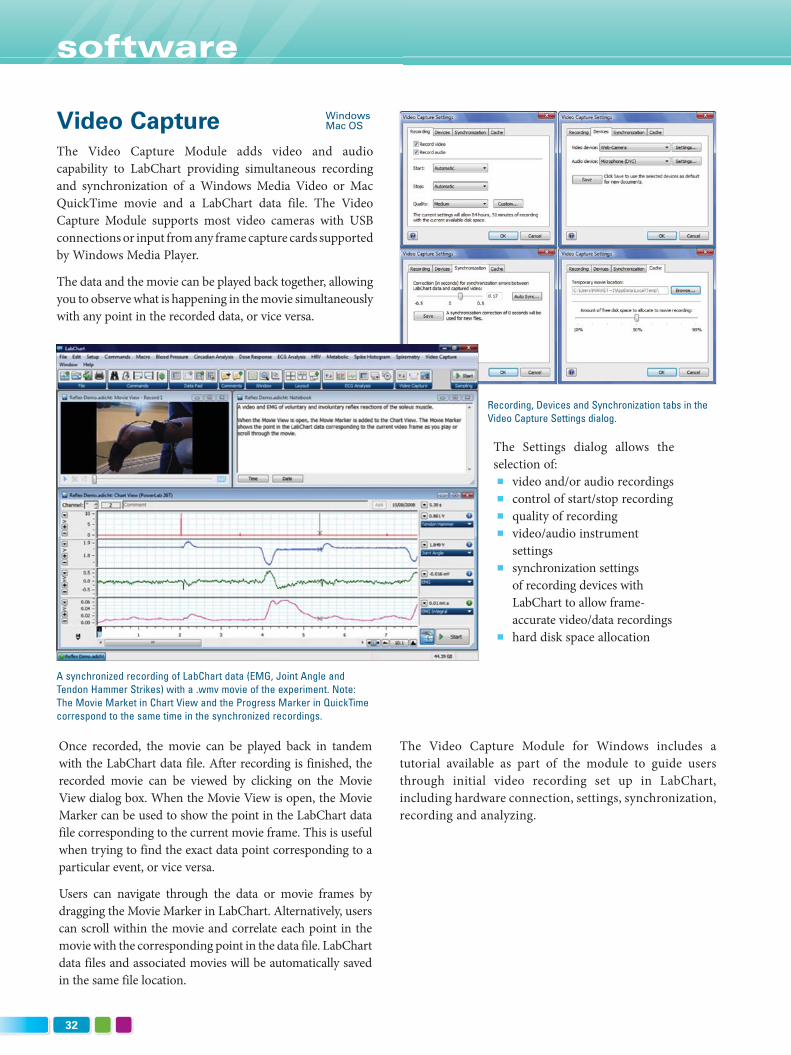
The Spike Histogram Module allows you to generate a
number of analysis graphs from the analyzed selection of
spikes. These include:
n amplitude histogram
n interspike interval histogram
n peristimulus time histogram
n ratemeter
The Ratemeter Window displays a frequency time plot
that indicates the firing rate of spikes selected by the
discriminator. The graph/graticule type pop-up menu
provides control over the appearance of the plot.
The autocorrelation operation (Mac only) on all spikes in
a selection will highlight any inherent periodicity in the
signal, with peaks indicating a signal at that frequency. The
Crosscorrelation operation (Mac only) allows the detection of
periodicity or temporal dependence of the firing of one neuron
with another. Thus, if the firing of one neuron causes another to
fire, this effect should be detected by crosscorrelation analysis.
Autocorrelation allows the detection of periodicity in spike frequency.
The Spike Histogram Module for Windows allows data to
be saved as a .nex file and opened in NeuroExplorer for
further analysis.
WindowsMac OS
Amplitude Histogram View showing the number of spike amplitudes that fall within voltage categories of a certain size specified by the user.
The Interspike Interval Histogram View provides a summary of interspike intervals within user set time lines.
32
software
WindowsMac OSVideo Capture
The Video Capture Module adds video and audio
capability to LabChart providing simultaneous recording
and synchronization of a Windows Media Video or Mac
QuickTime movie and a LabChart data file. The Video
Capture Module supports most video cameras with USB
connections or input from any frame capture cards supported
by Windows Media Player.
The data and the movie can be played back together, allowing
you to observe what is happening in the movie simultaneously
with any point in the recorded data, or vice versa.
The Settings dialog allows the
selection of:
n video and/or audio recordings
n control of start/stop recording
n quality of recording
n video/audio instrument
settings
n synchronization settings
of recording devices with
LabChart to allow frame-
accurate video/data recordings
n hard disk space allocation
The Video Capture Module for Windows includes a
tutorial available as part of the module to guide users
through initial video recording set up in LabChart,
including hardware connection, settings, synchronization,
recording and analyzing.
Recording, Devices and Synchronization tabs in the Video Capture Settings dialog.
Once recorded, the movie can be played back in tandem
with the LabChart data file. After recording is finished, the
recorded movie can be viewed by clicking on the Movie
View dialog box. When the Movie View is open, the Movie
Marker can be used to show the point in the LabChart data
file corresponding to the current movie frame. This is useful
when trying to find the exact data point corresponding to a
particular event, or vice versa.
Users can navigate through the data or movie frames by
dragging the Movie Marker in LabChart. Alternatively, users
can scroll within the movie and correlate each point in the
movie with the corresponding point in the data file. LabChart
data files and associated movies will be automatically saved
in the same file location.
A synchronized recording of LabChart data (EMG, Joint Angle and Tendon Hammer Strikes) with a .wmv movie of the experiment. Note: The Movie Market in Chart View and the Progress Marker in QuickTime correspond to the same time in the synchronized recordings.

ADINSTRUMENTS.com
33
so
ftw
are
DMT NormalizationThe DMT Normalization Module provides a fast, easy,
standardized and validated method for the calculation
of optimal pre-tension conditions for microvascular or
other small tubular tissue experiments. The module is
configured for use with PowerLab, LabChart and DMT
Wire Myographs.
WindowsMac OS
The DMT Normalization Module:
n automatically calculates tissue length
n provides online and offline determination of tissue
effective pressure
n calculates the optimal pre-tension (micrometer setting)
for each piece of tissue prior to experimentation
As pre-tension can affect the function of smooth muscle, it
is important to standardize the tension placed on individual
tissues. The normalization procedure determines the
optimal internal circumference at which each tissue would
be relaxed under a transmural pressure of 100 mmHg. This
index is denoted as IC100 and is calculated for each tissue
mounted on the wire myograph, taking into account the size
and amount of contractile components of the tissue.
The Normalization Settings dialog allows the selection of:
n microscope calibration
n target pressure
n IC1/IC100 ratio
n online averaging time
n force reading delay when using the automated feature
Each LabChart channel has a separate Normalization
window in which the tissue end points (for determination
of tissue length) and wire diameter can be entered.
Micrometer values and force measurements are entered in
this window either online (while recording) or offline. A
graph of the measured internal circumference versus resting
wall tension of the vessel is created from which the IC100
and IC1 are calculated.
From these values the module easily calculates the final
micrometer setting for achieving uniform and accurate
pre-tension conditions for each tissue being studied. This
means their normalizing data is collected at the time of
experimentation.
LabChart file (left) showing stepwise distension and force measurement of the tissue, and the Normalization Settings dialog (below).
DMT Normalization window with stepwise distension of the tissue using the micrometer and the developed force measured. The graph on the right is automatically generated from the calculated internal circumference and resting wall tension.

34
software
Circadian Analysis
The Circadian Analysis Module for Windows analyzes data
with a daily pattern and generates graphical and tabular views
of the daily and averaged circadian data. Each day’s recording
is split into a user-determined number of intervals. Interval
data are averaged, plotted, displayed numerically and analyzed
to reveal parameters including the minimum, maximum and
mean value for each day, as well as the average day.
Circadian Analysis can be used for a wide range of
applications including:
n hormonal studies
n sleep studies
n telemetry studies
n long-term studies of physiological variables.
Feature and benefits include:
n day-by-day analysis of data over multiple channels
n analysis of continuous, intermittent or calculated data
n customizable circadian period start time and length
n optional data exclusion filter
n ability to export derived numerical parameters as a tab-
delimited file
The Circadian Analysis
Settings dialog allows you to:
n select the number of
channels to be included
in the analysis
n choose to analyze the
whole channel or a
selection
n adjust time settings
including the circadian
period (day length), day
start time and averaging interval
Windows n enable and configure data exclusion filter to ignore data
outside preset limits for calculating averages
n adjust the light on/off shading feature to represent day
and night in the Averaging View
The Circadian Analysis Table View automatically calculates
and displays the following parameters for each day, as well
as determining an average day:
n maximum
n minimum
n maximum – minimum
n time at maximum
n time at minimum
n mean
The Circadian Analysis Averaging View displays and plots
the averaged interval data for single or multiple channels.
Users can select to either:
n view the automatically calculated average day
n show all days as an overlay on top of the average day
n select a specific day from the highlight drop-down list
or by clicking on its trace
n view the values for any specific point in time obtained
by hovering over the trace
n view each channel’s data separately, or show multiple
channels in the same view using the buttons along the
top of the view
Table View data is exportable as a tab delimited file into
other programs (such as Microsoft Excel). The Averaging
View can be copied into LabChart’s Data Pad or other
applications with plot image and text showing the values of
all copied data points.
The Circadian Analysis Module for Windows has a tutorial
available as part of the module to guide users through each
feature using either their own data file or supplied sample
data file.
LabChart Window displaying Chart View (top left), Circadian Analysis Averaging View (top right) and Circadian Analysis Table View (bottom).
Circadian Analysis Settings Dialog
Table View
Averaging View
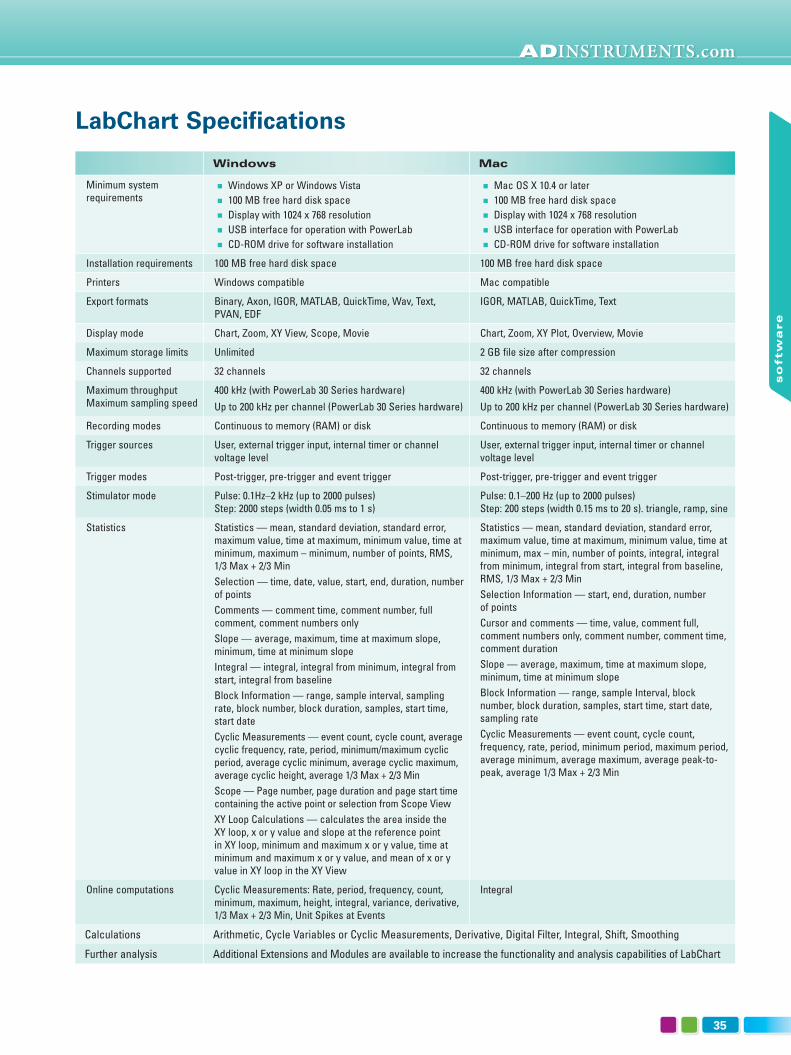
ADINSTRUMENTS.com
35
so
ftw
are
LabChart Specifications
Windows Mac
Minimum system requirements
n Windows XP or Windows Vista
n 100 MB free hard disk space
n Display with 1024 x 768 resolution
n USB interface for operation with PowerLab
n CD-ROM drive for software installation
n Mac OS X 10.4 or later
n 100 MB free hard disk space
n Display with 1024 x 768 resolution
n USB interface for operation with PowerLab
n CD-ROM drive for software installation
Installation requirements 100 MB free hard disk space 100 MB free hard disk space
Printers Windows compatible Mac compatible
Export formats Binary, Axon, IGOR, MATLAB, QuickTime, Wav, Text, PVAN, EDF
IGOR, MATLAB, QuickTime, Text
Display mode Chart, Zoom, XY View, Scope, Movie Chart, Zoom, XY Plot, Overview, Movie
Maximum storage limits Unlimited 2 GB file size after compression
Channels supported 32 channels 32 channels
Maximum throughputMaximum sampling speed
400 kHz (with PowerLab 30 Series hardware)
Up to 200 kHz per channel (PowerLab 30 Series hardware)
400 kHz (with PowerLab 30 Series hardware)
Up to 200 kHz per channel (PowerLab 30 Series hardware)
Recording modes Continuous to memory (RAM) or disk Continuous to memory (RAM) or disk
Trigger sources User, external trigger input, internal timer or channel voltage level
User, external trigger input, internal timer or channel voltage level
Trigger modes Post-trigger, pre-trigger and event trigger Post-trigger, pre-trigger and event trigger
Stimulator mode Pulse: 0.1Hz–2 kHz (up to 2000 pulses)Step: 2000 steps (width 0.05 ms to 1 s)
Pulse: 0.1–200 Hz (up to 2000 pulses)Step: 200 steps (width 0.15 ms to 20 s). triangle, ramp, sine
Statistics Statistics — mean, standard deviation, standard error, maximum value, time at maximum, minimum value, time at minimum, maximum – minimum, number of points, RMS, 1/3 Max + 2/3 Min
Selection — time, date, value, start, end, duration, number of points
Comments — comment time, comment number, full comment, comment numbers only
Slope — average, maximum, time at maximum slope, minimum, time at minimum slope
Integral — integral, integral from minimum, integral from start, integral from baseline
Block Information — range, sample interval, sampling rate, block number, block duration, samples, start time, start date
Cyclic Measurements — event count, cycle count, average cyclic frequency, rate, period, minimum/maximum cyclic period, average cyclic minimum, average cyclic maximum, average cyclic height, average 1/3 Max + 2/3 Min
Scope — Page number, page duration and page start time containing the active point or selection from Scope View
XY Loop Calculations — calculates the area inside the XY loop, x or y value and slope at the reference point in XY loop, minimum and maximum x or y value, time at minimum and maximum x or y value, and mean of x or y value in XY loop in the XY View
Statistics — mean, standard deviation, standard error, maximum value, time at maximum, minimum value, time at minimum, max – min, number of points, integral, integral from minimum, integral from start, integral from baseline, RMS, 1/3 Max + 2/3 Min
Selection Information — start, end, duration, number of points
Cursor and comments — time, value, comment full, comment numbers only, comment number, comment time, comment duration
Slope — average, maximum, time at maximum slope, minimum, time at minimum slope
Block Information — range, sample Interval, block number, block duration, samples, start time, start date, sampling rate
Cyclic Measurements — event count, cycle count, frequency, rate, period, minimum period, maximum period, average minimum, average maximum, average peak-to-peak, average 1/3 Max + 2/3 Min
Online computations Cyclic Measurements: Rate, period, frequency, count, minimum, maximum, height, integral, variance, derivative, 1/3 Max + 2/3 Min, Unit Spikes at Events
Integral
Calculations Arithmetic, Cycle Variables or Cyclic Measurements, Derivative, Digital Filter, Integral, Shift, Smoothing
Further analysis Additional Extensions and Modules are available to increase the functionality and analysis capabilities of LabChart
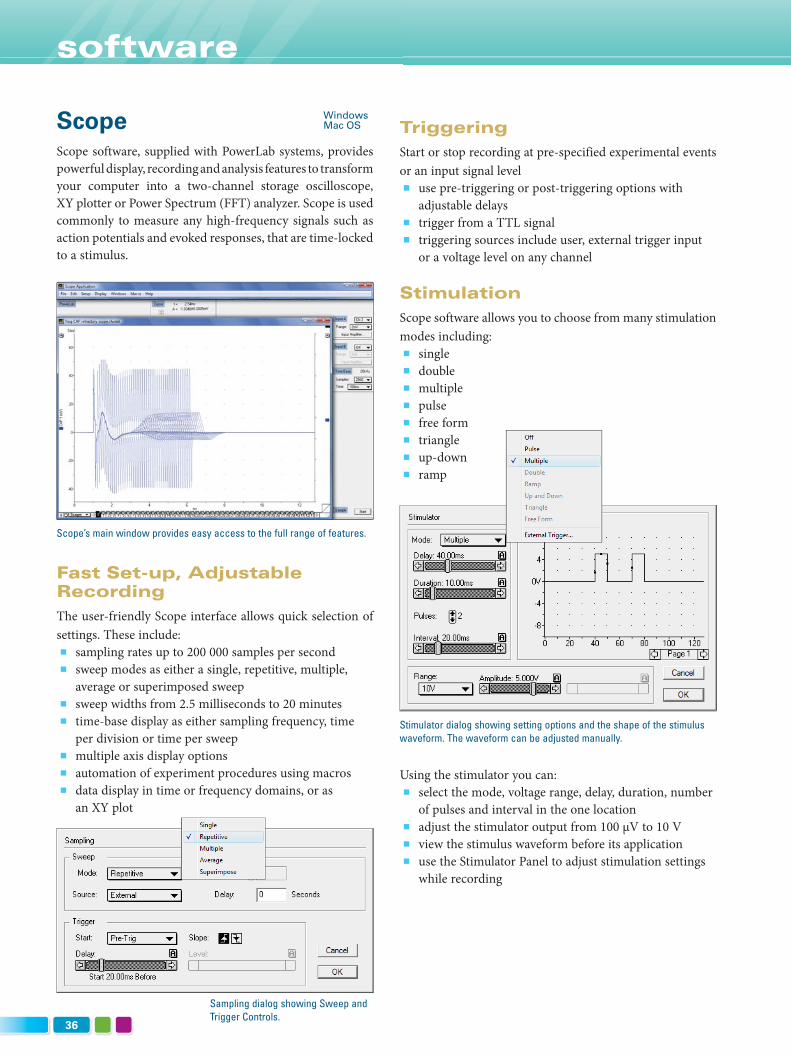
36
software
ScopeScope software, supplied with PowerLab systems, provides
powerful display, recording and analysis features to transform
your computer into a two-channel storage oscilloscope,
XY plotter or Power Spectrum (FFT) analyzer. Scope is used
commonly to measure any high-frequency signals such as
action potentials and evoked responses, that are time-locked
to a stimulus.
Scope’s main window provides easy access to the full range of features.
Fast Set-up, Adjustable Recording
The user-friendly Scope interface allows quick selection of
settings. These include:
n sampling rates up to 200 000 samples per second
n sweep modes as either a single, repetitive, multiple,
average or superimposed sweep
n sweep widths from 2.5 milliseconds to 20 minutes
n time-base display as either sampling frequency, time
per division or time per sweep
n multiple axis display options
n automation of experiment procedures using macros
n data display in time or frequency domains, or as
an XY plot
Sampling dialog showing Sweep and Trigger Controls.
Triggering
Start or stop recording at pre-specified experimental events
or an input signal level
n use pre-triggering or post-triggering options with
adjustable delays
n trigger from a TTL signal
n triggering sources include user, external trigger input
or a voltage level on any channel
Stimulation
Scope software allows you to choose from many stimulation
modes including:
n single
n double
n multiple
n pulse
n free form
n triangle
n up-down
n ramp
Stimulator dialog showing setting options and the shape of the stimulus waveform. The waveform can be adjusted manually.
Using the stimulator you can:
n select the mode, voltage range, delay, duration, number
of pulses and interval in the one location
n adjust the stimulator output from 100 μV to 10 V
n view the stimulus waveform before its application
n use the Stimulator Panel to adjust stimulation settings
while recording
WindowsMac OS
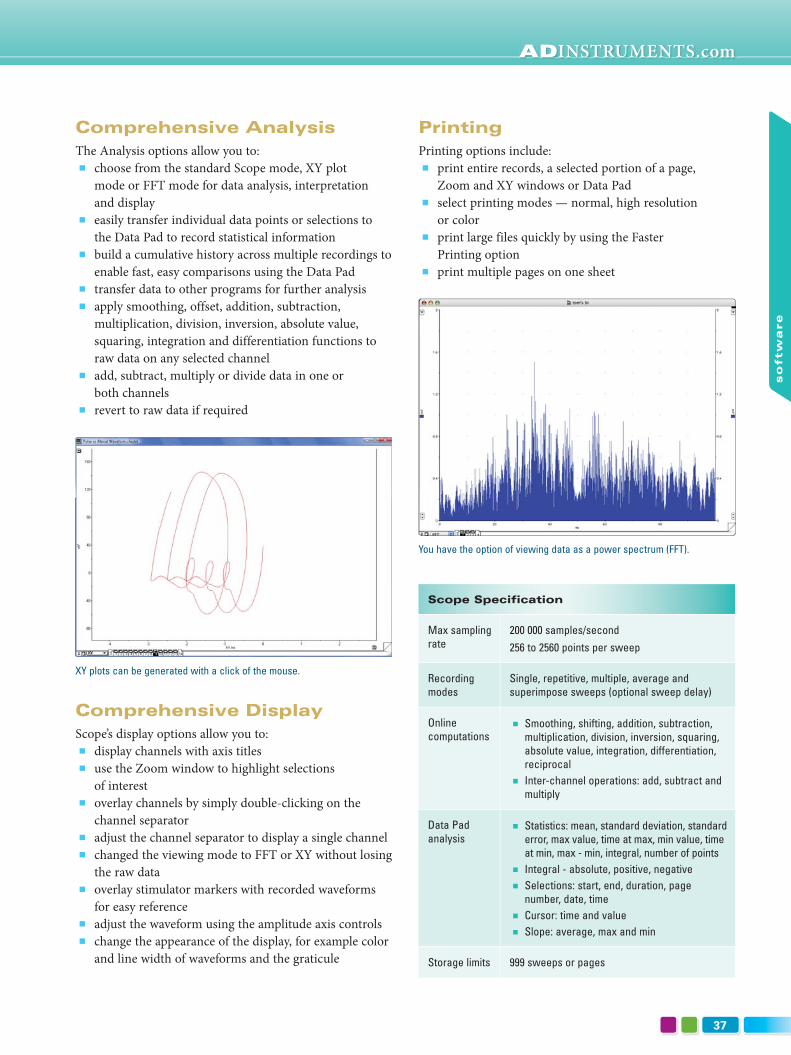
ADINSTRUMENTS.com
37
so
ftw
are
Comprehensive AnalysisThe Analysis options allow you to:
n choose from the standard Scope mode, XY plot
mode or FFT mode for data analysis, interpretation
and display
n easily transfer individual data points or selections to
the Data Pad to record statistical information
n build a cumulative history across multiple recordings to
enable fast, easy comparisons using the Data Pad
n transfer data to other programs for further analysis
n apply smoothing, offset, addition, subtraction,
multiplication, division, inversion, absolute value,
squaring, integration and differentiation functions to
raw data on any selected channel
n add, subtract, multiply or divide data in one or
both channels
n revert to raw data if required
XY plots can be generated with a click of the mouse.
Comprehensive DisplayScope’s display options allow you to:
n display channels with axis titles
n use the Zoom window to highlight selections
of interest
n overlay channels by simply double-clicking on the
channel separator
n adjust the channel separator to display a single channel
n changed the viewing mode to FFT or XY without losing
the raw data
n overlay stimulator markers with recorded waveforms
for easy reference
n adjust the waveform using the amplitude axis controls
n change the appearance of the display, for example color
and line width of waveforms and the graticule
PrintingPrinting options include:
n print entire records, a selected portion of a page,
Zoom and XY windows or Data Pad
n select printing modes — normal, high resolution
or color
n print large files quickly by using the Faster
Printing option
n print multiple pages on one sheet
You have the option of viewing data as a power spectrum (FFT).
Scope Specification
Max sampling rate
200 000 samples/second
256 to 2560 points per sweep
Recording modes
Single, repetitive, multiple, average and superimpose sweeps (optional sweep delay)
Online computations
n Smoothing, shifting, addition, subtraction, multiplication, division, inversion, squaring, absolute value, integration, differentiation, reciprocal
n Inter-channel operations: add, subtract and multiply
Data Pad analysis
n Statistics: mean, standard deviation, standard error, max value, time at max, min value, time at min, max - min, integral, number of points
n Integral - absolute, positive, negative
n Selections: start, end, duration, page number, date, time
n Cursor: time and value
n Slope: average, max and min
Storage limits 999 sweeps or pages
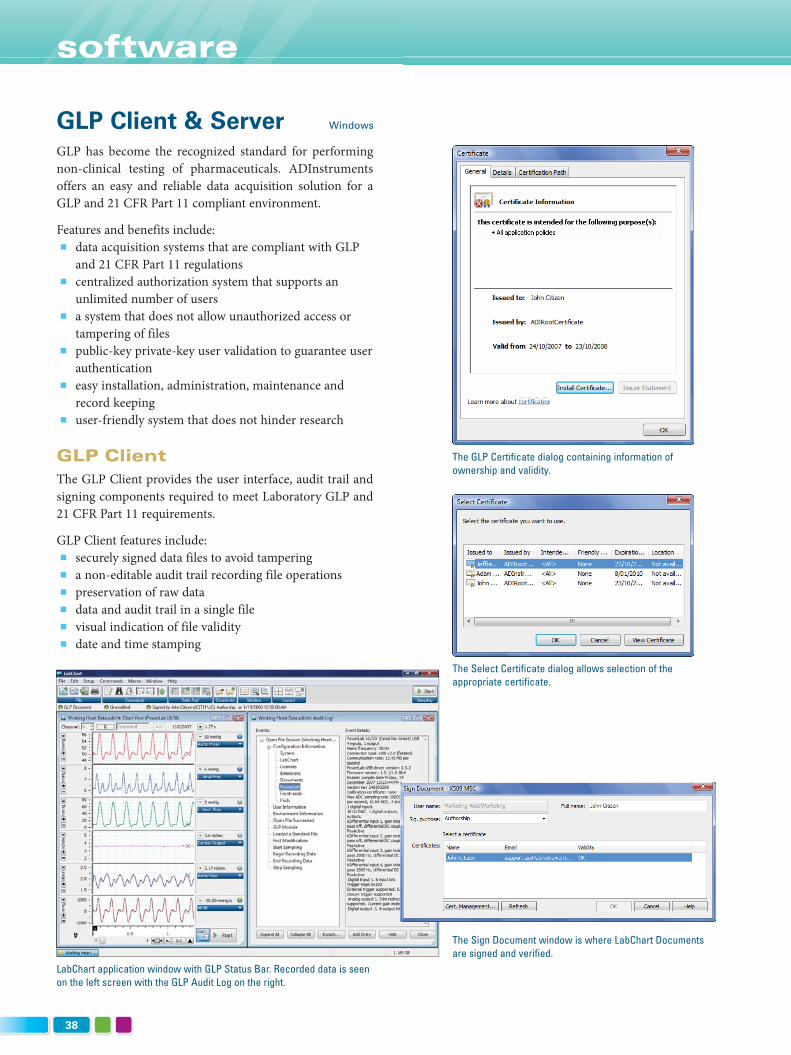
38
software
GLP Client & ServerGLP has become the recognized standard for performing
non-clinical testing of pharmaceuticals. ADInstruments
offers an easy and reliable data acquisition solution for a
GLP and 21 CFR Part 11 compliant environment.
Features and benefits include:
n data acquisition systems that are compliant with GLP
and 21 CFR Part 11 regulations
n centralized authorization system that supports an
unlimited number of users
n a system that does not allow unauthorized access or
tampering of files
n public-key private-key user validation to guarantee user
authentication
n easy installation, administration, maintenance and
record keeping
n user-friendly system that does not hinder research
GLP ClientThe GLP Client provides the user interface, audit trail and
signing components required to meet Laboratory GLP and
21 CFR Part 11 requirements.
GLP Client features include:
n securely signed data files to avoid tampering
n a non-editable audit trail recording file operations
n preservation of raw data
n data and audit trail in a single file
n visual indication of file validity
n date and time stamping
The Select Certificate dialog allows selection of the appropriate certificate.
The GLP Certificate dialog containing information of ownership and validity.
The Sign Document window is where LabChart Documents are signed and verified.
LabChart application window with GLP Status Bar. Recorded data is seen on the left screen with the GLP Audit Log on the right.
Windows

ADINSTRUMENTS.com
39
so
ftw
are
GLP ServerThe GLP Server works together with the GLP Client. It allows
centralized authorization for signing LabChart files as well as
a means to check validity of signatures. At the administration
level, it determines which users are permitted to create,
modify or sign GLP documents.
Adding a new user, the specified GLP certificate and the active period of the certificate.
The Certificate Management dialog allows you to import and manage installed certificates.
Training and Certifi cationADInstruments understands that introducing a GLP system
can present challenges. With this in mind we provide on-site
installation, training and user certification services.
Calibration ServiceADInstruments can provide periodic calibration for your
PowerLab hardware to confirm the system is working within
specifications. Calibration can be organized within your
GLP time frame and includes a calibration certificate. Ask
your ADInstruments representative for more information
or see the support section of our website.
GLP Validation UnitTo make sure your data stands up to the scrutiny of GLP and
21CFR Part 11, the Validation Unit is available for purchase.
It allows for in-house, periodic validation of ADInstruments
data acquisition hardware and software.
GLP Server provides:
n verification of signature validity when files are opened
n users with authority to sign files upon saving
n access to remote configuration
n license for an unlimited number of users
n extensive and customizable loggingThe GLP Configuration Utility allows the system administrator to add, delete or change user privileges.
The configuration Checklist provides a quick way to check the server and user status.
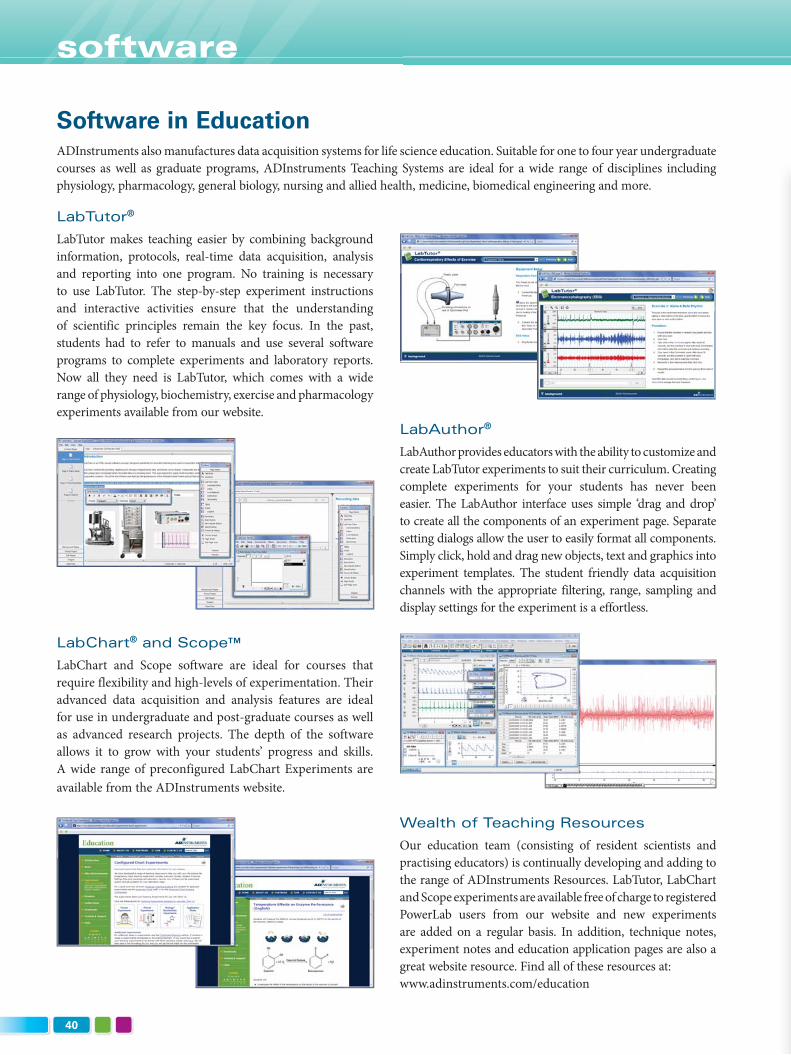
40
software
LabTutor®
LabTutor makes teaching easier by combining background
information, protocols, real-time data acquisition, analysis
and reporting into one program. No training is necessary
to use LabTutor. The step-by-step experiment instructions
and interactive activities ensure that the understanding
of scientific principles remain the key focus. In the past,
students had to refer to manuals and use several software
programs to complete experiments and laboratory reports.
Now all they need is LabTutor, which comes with a wide
range of physiology, biochemistry, exercise and pharmacology
experiments available from our website.
Software in EducationADInstruments also manufactures data acquisition systems for life science education. Suitable for one to four year undergraduate
courses as well as graduate programs, ADInstruments Teaching Systems are ideal for a wide range of disciplines including
physiology, pharmacology, general biology, nursing and allied health, medicine, biomedical engineering and more.
LabAuthor®
LabAuthor provides educators with the ability to customize and
create LabTutor experiments to suit their curriculum. Creating
complete experiments for your students has never been
easier. The LabAuthor interface uses simple ‘drag and drop’
to create all the components of an experiment page. Separate
setting dialogs allow the user to easily format all components.
Simply click, hold and drag new objects, text and graphics into
experiment templates. The student friendly data acquisition
channels with the appropriate filtering, range, sampling and
display settings for the experiment is a effortless.
LabChart® and Scope™
LabChart and Scope software are ideal for courses that
require flexibility and high-levels of experimentation. Their
advanced data acquisition and analysis features are ideal
for use in undergraduate and post-graduate courses as well
as advanced research projects. The depth of the software
allows it to grow with your students’ progress and skills.
A wide range of preconfigured LabChart Experiments are
available from the ADInstruments website.
Wealth of Teaching Resources
Our education team (consisting of resident scientists and
practising educators) is continually developing and adding to
the range of ADInstruments Resources. LabTutor, LabChart
and Scope experiments are available free of charge to registered
PowerLab users from our website and new experiments
are added on a regular basis. In addition, technique notes,
experiment notes and education application pages are also a
great website resource. Find all of these resources at:
www.adinstruments.com/education

Ablation Frontiers, Inc., AccuSync Medical Research Corporation, AgaMatrix, Albany Medical Center, Albert Einstein College of Medicine, Albertson College of Idaho, Albright College, Alkermes, Allegheny General Hospital, Allegheny Singer Research Institute, Allied Signal Inc., ALZA Corporation, Amgen Inc., Andrews University, Arena Pharmaceuticals, Arizona State University, Arkansas Children’s Hospital, Arkansas State University, Arrow International, ATS Medical, Inc., Auburn University, Audio Prototypes, Baby Beats, Inc., BAE Systems, BASF Corp., Bates College, Baylor, College of Medicine, BC Center for Sexual Medicine, BC Institute for Children’s & Women’s Health, Beth Israel Deaconess Medical Center, Bethel College and Seminary, Biomedical Research Foundation of Northwest Louisiana, Blanchette Rockefeller Neurosciences Institute, Bloomsburg University, Bloorview MacMillan Children’s Centre, Blue Torch Medical Technologies Inc., Boston Biomedical Research Institute, Boston College, Boston Medical Center, Boston University Medical Center, Bowling Green State University, Boys Town National Research Hospital, Brandeis University, Brigham & Women’s Hospital, Brigham Young University, Brock University, Brown University, Bryn Mawr College, Burnham Institute, California Institute of Technology, California State University, Canadian Blood Services, Cancer Care Ontario, Cardinal Glennon Children’s Hospital, Cardio Technologies, Carleton University, Carnegie Mellon University, Carpenter Special Products Corp., Case Western Reserve University, Center for Addiction and Mental Health, Centre hospitalier de L’Universite de Montréal, Chapman University, Charles River Laboratories, Chicago Medical School, Children’s Hospital & Regional Medical Center Seattle, Children’s Hospital of Boston, Children’s Hospital of Philadelphia, Children’s Hospital of Pittsburgh, Children’s Medical Center of Dallas, Children’s Memorial Hospital Chicago, Cincinnati Children’s Hospital Medical Center, City College of New York, Colby College, College of William & Mary, Colorado State University, Columbia University, Columbus Children’s Hospital, Columbus Children’s Research Institute, Concordia University, Converge Medical, Inc., Cornell University, Cornell University Medical College, Creighton University, CryoCor, Inc., Cypress Systems, Inc., Cytori Therapeutics, Inc., Dalhousie University, Dartmouth College, Dartmouth Medical School, Department of Veteran Affairs Medical Center, Dickinson College, Dow Chemical Co., Dowling College, Drake University, Drexel University, Duke University, Duke University Medical Center, Earlham College, East Carolina University, East Stroudsburg University, East Tennessee State University, East Tennessee State University VA Medical Center, Eastern Washington University, Edwards Lifesciences, Eisenhower Army Medical Center, Emory University, Emory University VA Hospital, EndoVx, Inc., EPIX Medical, Inc., Erie County Medical Center, Ethicon, Fallon Ultrasonics, Inc., FibroGen, Inc., Florida A&M University, Florida Atlantic University, Florida Institute of Technology, Florida State University, Fluid Power Products, Inc., FMC Corporation, Forsyth Institute, Fox Chase Cancer Center, Gene Logic, Genentech, Inc., Genetronics, Inc., Genzyme Corporation, George Washington University, Georgetown University, Georgetown University Medical Center, Georgia Institute of Technology, Gettysburg College, Good Samaritan Hospital Los Angeles, Grinnell College, Guidant Corporation, Hamilton Regional Cancer Centre, Harvard Medical School, Harvard University, Haskins Laboratories, Inc., Hebrew Rehabilitation Center for the Aged, Hemedix, Inc., Henry Ford Health System, Henry M. Jackson Foundation, Hines VA Hospital, Hopital de l’Enfant-Jesus, Hopkins Marine Station, Hospital for Sick Children, Howard Hughes Medical Institute, Howard University, HV Technologies, Inc., Idaho State University, Indiana University, Indiana University – Purdue University Indianapolis, Indiana University of Pennsylvania, Indiana University School of Medicine, Institut de recherches cliniques de Montréal, Institute of Paper Science & Technology, Instrumentation Laboratory, Insulet Corporation, Intellicardia, Inc., Interventional Rhythm Management, Inc., Immunex Corporation, Iowa State University, John B. Pierce Laboratory, Johns Hopkins Bayview Medical Center, Johns Hopkins Hospital, Johns Hopkins University, Joseph Stokes Jr. Research Institute, Joslin Diabetes Center, Kansas State University College of Veterinary Medicine, Kent State University, Kosan Biosciences Inc., Kumetrix, Inc., Laboratory Testing, Inc., Lake Erie College of Osteopathic Medicine, Laurentian University, Lehman College CUNY, Lockheed Martin, Loma Linda University, Loma Linda University Medical Center, London Health Sciences Centre, Los Angeles Biomedical Research Institute, Louisiana State University, Louisiana State University College of Veterinary Medicine, Louisiana State University Medical Center, Lovelace Respiratory Research Institute, Loyola University Medical Center, LSUHSC New Orleans, LSUHSC Shreveport, Luther College, Magee-Women’s Hospital, Maine Medical Center, Malaspina University College, MariCal, Inc., Marquette University, Massachusetts Eye & Ear Infi rmary, Massachusetts General Hospital, Massachusetts Institute of Technology, Mayo Clinic, McGill University, McLean Hospital, McMaster University, MD Anderson Cancer Center, Medical College of Georgia, Medical College of Ohio, Medical College of Virginia, Medical College of Wisconsin, Medical University of South Carolina, Medstar Research Institute, Medtronic Physio-Control, Medtronic, Inc., Memorial University of Newfoundland, Miami Children’s Hospital, Miami University, Michigan State University, Midwestern University, Milton S. Hershey Medical Center, MIND Institute, Minneapolis Medical Research Foundation, Mission Research Corporation, Mississippi State University, Monmouth College, Montefi ore Hospital, Montreal Children’s Hospital, Montreal General Hospital Research Institute, Morehouse School of Medicine, Mount Sinai Hospital, Mount Sinai Medical Center, Mount Sinai School of Medicine, NASA AMES Research Center, National Institutes of Health, National Oceanic & Atmospheric Administration, National Research Council Canada, Naval Medical Research Center, Naval Research Laboratory, Nephros Therapeutics, Inc., Neural Intervention Technologies, Inc., Neurology & Neurodiagnostics Ltd., New England College of Optometry, New England Medical Center, New England Medical Research Institute, New Mexico State University, New York Department of Health, New York Eye & Ear Infi rmary, New York Institute of Technology, New York Medical College, New York Presbyterian Hospital, New York University, NIH-National Heart Lung and Blood Institute, NIH-National Institute of Aging, NIH-National Institute of Environmental Health Sciences, NIH-National Institute of Neurological Disorders and Stroke, Nipissing University, Nitinol Devices & Components, North Carolina Central University, North Carolina State University, North Carolina State University College of Veterinary Medicine, Northeastern Ohio University College of Medicine, Northeastern University, Northern Arizona University, Northwestern University, Northwestern University Medical School, Norwich University, NYU Medical Center, Ohio Northern University, Ohio State University, Ohio State University School of Medicine, Ohio State University School of Veterinary Medicine, Ohio University, Oklahoma State University, Order of St. Benedict, Oregon Eye Surgery Center, Oregon Health Sciences University, Oregon Regional Primate Research Center, Oregon State University, Ottawa Hospital, Pacifi c Northwest National Laboratory, Pacifi c University, Pacifi cSport, Canadian Sport Center Vancouver, Pacifi cSport Victoria, Palomar College, Pennsylvania State College of Medicine, Pennsylvania State University, Pepperdine University, Peterson Neurology, Phase-One Medical LLP, Philadelphia College of Osteopathic Medicine, Portland State University, Portland VA Research Foundation, Presbyterian Hospital of Dallas, Princeton University, Protiva Biotherapeutics, Inc., Purdue University, Queen Elizabeth II Health Science Center, Queen’s University, Randolph-Macon College, Recherche Hopital Maisonneuve-Rosem, Rees-Stealy Research Foundation, Rhode Island Hospital, Rice University, Rinat Neuroscience Corp., Robarts Research Institute, Rockefeller University, Rosalind Franklin University, Rush Presbyterian St. Luke’s Medical Center, Saint Louis University, Salem State College, San Diego State University, Sarcos Research, Savannah State University, Scott & White Memorial Hospital, Scripps Research Institute, Seattle Institute for Biomedical and Clinical Research, Seattle Pacifi c University, Shanti Yoga & Meditation Center, Shippensburg University, Shriner’s Hospital for Children, Simon Fraser University, Skidmore College, Smith-Kettlewell Eye Research Institute, Southern Arkansas University, Southern Illinois University – Carbondale, Southern Illinois University School of Medicine, Southern Methodist University, Southwestern University, SRI International, St. Elizabeth’s Medical Center of Boston, St. John’s University, St. Jude’s Children’s Research Hospital, St. Lawrence College, St. Lawrence University, St. Luke’s Roosevelt Hospital, St. Michael’s Hospital, St. Paul’s Hospital, Stanford University, Stanford University Medical Center, State University of New York at Stony Brook, Streck Laboratories, Inc., SUNY New Paltz, SUNY Upstate Medical University, Swarthmore College, Synecor LLC, TAMU Health Science Center, Tarleton State University, Temple University, Temple University School of Medicine, Texas A&M University, Texas A&M University School of Veterinary Medicine, Texas Tech University, The Cleveland Clinic, The Jackson Laboratory, The University of Health Sciences, Thomas Jefferson University, TIAX LLC, Towson University, TransMedics, Inc., Tripler Army Medical Center, Troy State University, Tufts University, Tulane University Health Science Center, Uniformed Services University of the Health Sciences, Universidad Catolica de Costa Rica, Universite de Montréal, Universite de Sherbrooke, Universite du Quebec, Universite du Quebec en Abitibi-Temiscamingue, Universite Laval, University at Buffalo, University Health Associates, University of Akron, University of Alabama, University of Alaska, University of Alberta, University of Arizona, University of Arizona School of Medicine, University of Arkansas, University of Arkansas for Medical Sciences, University of British Columbia, University of British Columbia School of Medicine, University of Calgary, University of California, University of Central Arkansas, University of Central Florida, University of Chicago, University of Cincinnati, University of Cincinnati School of Medicine, University of Colorado, University of Colorado School of Medicine, University of Connecticut, University of Connecticut Health Center, University of Delaware, University of Florida, University of Florida College of Medicine, University of Georgia, University of Hawaii, University of Houston, University of Idaho, University of Illinois, University of Illinois School of Veterinary Medicine, University of Iowa, University of Iowa College of Medicine, University of Iowa Hospitals & Clinics, University of Kansas, University of Kansas Medical Center, University of Kentucky, University of Kentucky Medical Center, University of Louisville, University of Louisville School of Medicine, University of Manitoba, University of Maryland, University of Maryland College of Medicine, University of Massachusetts Medical School, University of Massachusetts, University of Medicine & Dentistry of New Jersey, University of Miami, University of Miami School of Medicine, University of Michigan, University of Michigan School of Medicine, University of Minnesota, University of Minnesota School of Medicine, University of Minnesota School of Veterinary Medicine, University of Mississippi, University of Mississippi Medical Center, University of Missouri, University of Missouri Columbia School of Medicine, University of Missouri Columbia College of Veterinary Medicine, University of Montana, University of Montreal, University of Nebraska, University of Nebraska Medical Center, University of Nevada, University of North Carolina, University of North Carolina School of Medicine, University of North Dakota, University of North Dakota School of Medicine, University of North Florida, University of North Texas, University of North Texas Health Science Center, University of Northern Colorado, University of Oklahoma, University of Oklahoma Health Sciences Center, University of Oregon, University of Ottawa, University of Ottawa Heart Institute, University of Pennsylvania, University of Pennsylvania School of Medicine, University of Pittsburgh, University of Pittsburgh Medical Center, University of Puerto Rico, University of Rhode Island, University of Rochester, University of Rochester Medical Center, University of San Francisco, University of Saskatchewan, University of Scranton, University of South Alabama, University of South Carolina, University of South Dakota, University of South Florida, University of Southern California, University of Southern Maine, University of St. Thomas, University of Tennessee, University of Texas, University of Texas Health Science Center Houston, University of Texas Health Science Center San Antonio, University of Texas Medical Branch Galveston, University of the Pacifi c, University of the Virgin Islands, University of Toledo, University of Toronto, University of Utah, University of Vermont, University of Victoria, University of Virginia, University of Virginia Health System, University of Washington, University of Washington Medical Center, University of Waterloo, University of Western Ontario, University of Windsor, University of Wisconsin, University of Wyoming, University System of New Hampshire, Ursinus College, US Army Medical Research Institute of Chemical Defense, US Army Medical Research Institute of Infectious Diseases, US Department of Agriculture, US Department of Energy, US Environmental Protection Agency, USDA Agricultural Research Service, VA Boston Healthcare System, VA Medical Center Augusta, Vanderbilt University, Varian, Veteran’s Medical Research Foundation, Virginia Commonwealth University, Wake Forest University, Wake Forest University School of Medicine, Walter Reed Army Institute of Research, Washington and Lee University, Washington Hospital Center, Washington State University, Waters Corp., Wayne State University, Wellesley College, Wesleyan University, West Allegheny General Hospital, West Side Institute for Science & Education, West Virginia University, Western Maryland College, Western Michigan University, Western Wyoming Community College, Westmont College, Whitman College, Wilfrid Laurier University, William Beaumont Hospital, Winona State University, Winthrop University Hospital, Xavier University, Xenoport, Inc., Yale University, Yale University School f Medicine, Yeshiva University, York University, ZymoGenetics, Abant Izzet Baysal University, Abo Akademi University, Addenbrookes Hospital, AEA Technology PLC, Aeroform Ltd, Aeronautical Research Institute of Sweden, Albert Szent-Gyorgyi Medical University, Alfred Wegener Institut, Amtec Medical Limited, AquaChem, AstraZeneca, Athlone Regional Technical College, August Krogh Institute, Ben Gurion University, Bispebjerg Hospital, Blease Medical, Boot’s Healthcare England, Bowman Research UK, BPS International PLC, Bristol Royal Infi rmary, Bristol University, Broadgreen Hospital, Bufalini Hospital, Cambridge University, Cardiff School of Biosciences, Cardiff University, Caserta Medical Center, CEA Laboratoire Jean Metz, Celal Bayar University, Celltech R&D Ltd, Centre for Human Science DERA, Centro Residenziale Clinica S. Lucia, Chaim Sheba Medical Center, Charles University, Chelsea and Westminster Hospital, Chiesi Farmaceutici s.p.a., Chirurgische Klinik Großhadern München, CMRC, Center for Clinical & Basic Research, Copenhagen Institute of Life Sciences, Copenhagen Muscle Research Centre, Copenhagen University, Danish Institute of Agricultural Sciences, Daresbury Laboratory, Defence Evaluation Research Agency, Dokuz Eylul University, Dryburn Hospital England, Ebrahim M. Almana & Bros. Co., ECSS Trinity College, Ege University, Erasmus University Rotterdam, Erciyes University, Faculdade de Farmacia da Universidade do Porto, Federico II University, Forschungsgruppe für Osteoporose des UKBF Berlin, Forschungszentrum Karlsruhe, Frauenklinik der Universität Gießen, Gardiner Institute, Gazi University, Gaziantep University Medical School, Gilson Medical Electronics, GKSS Forschungsinstitut Geesthacht, Glasgow Royal Infi rmary, Glenfi eld Hospital England, Global Information Solutions, Glostrup Hospital, GSF (Gesellschaft für Strahlenforschung) München, Guy’s Hospital, H Lundbeck A/S, Hacettepe University, Hadassah-Hebrew University Medical Center, Harefi eld Hospital, Hatter Institute University College Hospital, Haukleland Sykehus, Hebrew University, Herzzentrum Leipzig, HIB Institute, Hope Hospital, Hopital Cochin, Hopital Erasme, Hopital Grenoble, Hopital Tenon, Huddinge Hospital, Huddinge University Hospital, Huntingdon Research Centre Limited, ICSM Hammersmith, Imperial College, INRA, INSERM U171 & URA 1195, INSERM U390, INSERM U533, Institut Francois Magendie, Institut für anorganische Chemie der Universität Essen, Institut für experimentelle Anaesthesiologie der Universität Düsseldorf, Institut für Experimentelle Anaesthesiologie der Universität Essen, Institut für Geologie der Universität Mainz, Institut für Peptidforschung Hannover, Institut für Pharmakologie der Universität Mainz, Institut für Pharmakologie der Universität Würzburg, Institut für Pharmazeutsche Technologie Saarbrücken, Institut für Pharmazie der Universität Regensburg, Institut für Physiologie der LM Universität München, Institut für Physiologie der LM Universität München, Institut für Physiologie der Universität Freiburg, Institut für Physiologie der Universität Giessen, Institut für Physiologie der Universität Regensburg, Institut für Physiologie der Universität Tübingen, Institut für Physiologie/Kardiologie der Universität Düsseldorf, Institut für Tierphysiologie der Universität Giessen, Institut für Veterinärmedizin der FU Berlin, Institut für Zoologie der Universität Mainz, Institut National De La Recherche Agronomique, Institute of Child Health London, Intersurgical Ltd, Istanbul University, Jagiellonian University Kraków, James Black Institute, Janssen Pharmaceutica N.V., Kadir Has University, Kardiologische Klinik der Universität Münster, Kardiologische Klinik Eppendorf Universität Hamburg, Kardiologische Klinik Giessen, Karolinska Institute, Kent & Canterbury Hospitals NHS Trust, Kielanowski Institute of Animal Physiology & Nutrition, Killingbeck Hospital, Kinderklinik der LMU München, Kinderklinik der Universität Würzburg, King’s College Hospital, Kirikkale University, Klinik für Augenheilkunde der Universität Würzburg, Klinik für Neurochirurgie der Universität Würzburg, Kobenhavens Amts Sygehus, Kobenhavns Universitet, Kraków Medical College, Lily Research Centre Ltd, Limburgs University Centre, LSB College, Malmo University, Manchester Royal Infi rmary, Marmara University School of Medicine, Marty Technologie, Maternite Regionale A Pinard, Max-Planck-Institut für Experimentelle Kardiologie Bad Nauheim, Max-Planck-Institut für Experimentelle Medizin Göttingen, Max-Planck-Institut für Medizische Forschung Bad Nauheim, Max-Planck-Institut für Psychiatrie München, Max-Planck-Institut für Terrestrische Mikrobiologie, Medical University of Copenhagen, Medizinische Klinik der Universität Heidelberg, Medizinische Klinik der Universität Kiel, Medizinische Klinik der Universität Münster, Micro-Informatique Conseil, Minerva Institute, Mordiglia Service, Moscow State University, MRC Collaborative Centre, MRC Human Genetics Unit, MRC Reproductive Biology Unit, Mugla University, National Defence Research Establishment, National Heart and Lung Institute, National University of Ireland, Neurosearch, Newcastle General Hospital, Ninewells Hospital, Nokia Research Centre, Norrbacka Huset, Norwegian University of Science & Technology, Novartis, NTNU, Odense University, Onassis Cardiac Surgery Centre, Ondokuz Mayis University, Onkologische Forschungsgruppe der Universität Düsseldorf, Pacesetter AB, Pamukkale University, Panum Institute, Pharmagene Laboratories Ltd, Pharmakologisches Institut der Humbold Universität Berlin, Pharmakologisches Institut der Med. Universität Lübeck, Pharmakologisches Institut der TU Dresden, Pharmakologisches Institut der Universität des Saarlandes, Pharmakologisches Institut der Universität Düsseldorf, Pharmakologisches Institut der Universität Graz, Physiologie Intestinale Uer Pharmaceutiques Paris, Physiologisches Institut der Universität Zürich, Porteia & Co. S.A., Prague Institute for Clinical and Experimental Medicine, Princess Anne Hospital, Queen Elizabeth Hospital, Queens Medical Centre, Rayne Institute St. Thomas’ Hospital, Rhone Poulenc Rorer, Roussel UCLAF, Royal Airforce Institute of Aviation Medicine, Royal College of Surgeons in Ireland, Royal Danish School of Pharmacy, Royal Edinburgh Hospital, Royal Hallamshire Hospital, Royal Veterinary and Agricultural University Denmark, Royal Victoria Hospital, Russian State Medical University, RWTH Aachen, Sahlgrenska University Hospital, Scanmed Medical, Schering-Plough, Sintef Unimed, Sligo Institute of Technology, St. George’s Hospital Medical School, St. James’ Hospital, St. Thomas’ Hospital Medical School, Stockholm University, Sussex Centre for Neuroscience, Swiss Cancer Institute for Experimental Research, Syntex Research Centre, Thomas Swann & Co Ltd, Tierarztpraxis Dr. Brandes Northeim, Tierklinik Abt. Andrologie der LMU München, Trondheim University Hospital, UMIST, Umweltforschungszentrum Magdeburg, Universidad de Granada, Universidad de La Laguna, Universidad de Malaga, Universidad de Valencia, Universidad Politecnica, Universita di Milano, Universitätsaugenklinik der Universität Tübingen, Universitätsaugenklinik Freiburg, Universite Blaise Pascal, Universite Catholique De Louvain, Universite de Caen, Universite de Nancy, Universite de Rouen, Universite Joseph Fourier, Universite Paris Val de Marne, University College Hospital Galway, University Hospital Malmø, University Hospital of Glostrup, University of Aarhus, University of Alicante, University of Amsterdam, University of Barcelona, University of Bergen, University of Bordeaux, University of Bradford, University of Brighton, University of Bristol, University of Caen, University of Cambridge, University of Central England, University of Copenhagen, University of Dublin, University of Durham, University of Essex, University of Galway, University of Gothenburg, University of Groningen, University of Hertfordshire, University of Iceland, University of Limerick, University of London, University of Loughborough, University of Lund, University of Luton, University of Maastricht, University of Murcia, University of Oslo, University of Oviedo, University of Oxford, University of Pavia, University of Salamanca, University of Sheffi eld, University of Southern Denmark, University of Split, University of Stockholm, University of Sussex, University of Tampere, University of Trondheim, University of Turku, University of Uppsala, University of Westminster, University of Zagreb, Unizyme Labs, Urologische Klinik der Medizinischen Hochschule Hannover, Urologische Klinik der Universität Mainz, Vrije University, Warsaw Agricultural University, Warsaw Medical University, Wellcome/CRC Institute, Westf. Institut für Sauerstofftherapie, William Harvey Research Institute, Yamanouchi Europe B.V., Zentrum für Molekularbiologie der Universität Heidelberg, Zentrum für Physiologie der Universität Göttingen, Zoologisches Institut der TH Darmstadt, Zoologisches Institut der Universität Graz, Zoologisches Institut der Universität Leipzig, Escola Paulista de Medicina, Instituto Butantã, Pontifi cia Universidad Católica de Chile, Universidad Andrés Bello, Universidad Católica de Pelotas, Universidad César Vallejos, Universidad de Chile, Universidad de Concepción, Universidad de Los Llanos, Universidad de Santiago de Chile, Universidad del Bosque, Universidad del Rosario, Universidad Javeriana, Universidad Libre de Barranquilla, Universidad Nacional de Colombia, Universidad Nacional de la Plata, Universidad Nacional Mayor de San Marcos, Universidad SEK, Universidad Tecnológica de Pereira, Universidade de São Paulo, Universidade Estadual de São Paulo, Universidade Estadual do Ceará, Universidade Estadual Paulista, Universidade Federal de Ceará, Universidade Federal de Minas Gerais, Universidade Federal do Estado de São Paulo, Universidade Federal do Paraná, Universidade Federal do Rio de Janeiro, Universidade Federal d’Ouro Preto, University of Suriname, Academia Sinica, Acupuncture Institute of China, Ajou University Hospital, Animal Technology Institute Taiwan, Beijing Xiyuan Hospital, Capital Medical University, Chi Mei Hospital, China Medical University, Chinese Culture University, Chio Yi Chang Gung Hospital, Chongqing Daping Hospital, Chung Gung Hospital, Chung Gung University, Chung Shan Medical University, Chung Yuan Christian University, Chungbuk National University, Chung-Shan Institute of Science and Technology, CJ Corporation Institute of Technology, Da-Yeh University, Development Center for Biotechnology, DMERI Defence Science Organisation, Ewha Women’s University Mokdong Hospital, Far Eastern Memorial Hospital, Food Industry Research and Development Institute, Fu Jen Catholic University, Fujian TCM University, Guangxi Medical University, Gumma University, Gyeongsang National University Hospital, Haerbin Medical University, Hallym University, Hamamatsu University School of Medicine, Harbin Medical University, Hiroshima University, Hong Kong Baptist University, Hong Kong Polytechnic University, Hua Fan University, Hunan XiangYa Medical College of ZhongNan University, Hwasung Bio Pharm, I Shou University, International Islamic University of Malaysia, Jiangxi TCM Academy, Jichi Medical University, Jiling TCM Academy, Kaohsiung Chung Gung Hospital, KeeLung Chang Gung Hospital, Kitazawa University, KK Hopsital, Kogakkan University, Korea Advanced Institute of Science & Technology, Korea Institute of Oriental Medicine, Korea Institute of Science and Technology, Korea National Sport University, Korea University Ansun Hospital, Kunming Zoology Institute, Kyunghee University, LG Chem Research Center, MARA University of Technology, MDIS, Medical College of Peking University, Medical College of Xi’an JiaoTong University, Medical College of Zhejiang University, Military Medical University, Monash University Campus Malaysia, Nagoya City University, Nan Kai College, Nanjing TCM University, Nanjing University, Nanyang Polytechnic, National Central University, National Cheng Kung University Hospital, National Chiao Tung University, National Chung Hsin University, National Defence Medical Center, National Dong Hwa University, National Kaohsiung First University, National Neuroscience Institute, National Ping-Tung Teacher’s College, National Research Institute of Chinese Medicine, National Taipei College of Nursing, National Taiwan Normal University, National Taiwan Ocean University, National Tsing Hua University, National University of Singapore, Ngee Ann Polytechnic, North SiChuan Medical University, Pacifi c Corporation R&D Center, Perak College of Medicine, Pohang University of Science and Technology, Providence University, Pusan National University Hospital, Qinghai Tibet Medicine Academy, Republic Polytechnic, Samsung Medical Center, Seoul National University Hospital, Seoul National University, Seoul National University Hospital Medical Center, Shandong TCM University, Shanghai Institute of Materia Medica, Shanghai No. 2 Medical University, Shanghai TCM University, ShanXi Medical University, Singapore General Hospital Clinical Research Lab, Singapore University of Traditional Chinese Medicine, SK Corporation Institute of Technology, Soochow University, Soonchunhyang University Hospital, Standards & Industrial Research Institute of Malaysia, Suzuka University of Medical Science, TaiChung VGH Hospital, Taipei Medical University Hospital, Taiwan University, Taiwan University Hospital, Temasek Polytechnic, The Chinese University of Hong Kong, The University of Hong Kong, Tianjin Medical University, Tianjin TCM College, Tokyo Medical University, Tokyo University, Tongji Medical University, Tri-Service General Hospital, TungHai University, Tzu Chi University, Tzu Chi University Hospital, University Kebangsaan Malaysia, University Malaysia Sarawak, University of Malaya, University of Shizuoka, University of St. Tomas, University of the Philippines in Manila, University Putra Malaysia, University Science Malaysia, Wang Fang Hospital, Women’s and Children’s Hospital, WonKwang University, Wuhan Tongji Hospital, Yamagata University, Yang Ming University, Yonsei University, Yonsei University Medical Center, Yuanpei Institute of Science and Technology, American University of Beirut, Arabian Gulf University, Baba Atomic Research Centre, Birjand University, Defence Institute of Physiology & Allied Sciences India, Delhi University, Gujarat State Research & Development Centre, Indian Institute of Technology, Indian Veterinary Research Institute, Isfahan University, Isra University, King Edward Medical College, King Faisal Specialist Hospital, King Saud University, Kuwait University, National Centre for Cell Sciences in India, National Institute of Mental Health & Neurosciences in India, National Institute of Pharmaceutical Education & Research in India, National Institute of Technology in India, Neurosynaptic Communications, NIPER, PCSIR Laboratories, Ranbaxy Research Laboratories, Sahand University of Technology, Sharif University of Technology, Shiraz University, Shri Chitra Tirunal Institute of Medical Sciences and Technology, Tata Institute of Fundamental Research, Torrent Research Centre, Suven Life Sciences Ltd, United Arab Emirates University, University of Al Ain Medical School, University of Botswana, University of Durban Westville, University of Karachi, University of Khartoum, University of Malakand, University of Potchefstroom, University of Punjab, University of Sindh, University of the North, Urmia University, Vallabhbhai Patel Chest Institute, Yasooj Medical School University, Ziauddin Medical College, ANSTO, Austin Health, Austin Hospital, Australian Defence Force Academy, Australian Institute of Marine Science, Australian National University, Baker Medical Research Institute, Ballarat University, BHP Research, Brain Imaging Research Centre, Charles Sturt University, Concord Hospital, CSIRO Division of Chemicals and Polymers, CSIRO Livestock Industries, Curtin University of Technology, Deakin University, Edith Cowan University, Flinders Medical Centre, Flinders University, Garvan Institute of Medical Research, GM Laboratories, Griffi th University, Heart Research Institute, Howard Florey Research Institute, James Cook University, John Hunter Hospital, La Trobe University, Macquarie University, Massey University, Mater Children’s Hospital, Monash Medical Centre, Monash University, Murdoch University, Nepean Hospital, Newcastle Mater Misericordiae Hospital, Northern Territory University, Polartechnics, Prince Henry Institute of Medical Research, Prince of Wales Medical Research Institute, Princess Alexandra Hospital, Queen Elizabeth Hospital, Queen Elizabeth II Medical Centre, Queensland University of Technology, RMIT University, Royal Adelaide Hospital, Royal Brisbane Hospital, Royal Melbourne Hospital, Royal North Shore Hospital, Royal Perth Hospital, Royal Prince Alfred Hospital, Sir Charles Gairdner Hospital, Southern Cross University, St. Vincent’s Hospital, Sunshine Coast University, The Alfred Hospital, University of Adelaide, University of Auckland, University of Canterbury, University of Central Queensland, University of Melbourne, University of New England, University of New South Wales, University of Newcastle, University of Otago, University of Queensland, University of South Australia, University of Southern Queensland, University of Sydney, University of Tasmania, University of Technology Sydney, University of Waikato, University of Western Australia, University of Western Sydney, University of Wollongong, Victoria University, Victoria University of Wellington, Victorian College of Pharmacy, Wellington School of Medicine, Westmead Hospital.
ADInstruments Research Systems are used in prestigious institutes, universities, colleges and commercial laboratories around the world. Here’s a selection: