Embed Size (px)
Citation preview
Systems Engineering & Technical Management Techniques
AE3-S01 v1: 2005-2006v2: 2006-2007
R.J. Hamann M.J.L. van ToorenSystems Integration / Spacecraft Systems Integration / Aircraft
Aerospace Engineering
The Systems Engineering Survival kit
AE3-S01 The Systems Engineering Survival kit-2
2Read the survival kit twice before you start your project !
Systems engineering is about controlling product development. As every control tool it uses feed forward and feedback. Therefore you need to go twice through the kit to get the whole picture and have all cross-references solved
Important

AE3-S01 The Systems Engineering Survival kit-3
Index
Intro1. Version Control and Templating2. Project objective statement3. Work Flow Diagrams +
Design and Development Logic4. Work Breakdown Structure5. Gantt ChartIntermezzo6. Functional Flow Diagram & Functional Breakdown Structure7. Requirements discovery tree / List of Requirements8. N2 charts9. Technical budgetting / Risk management10. Design Option Tree11. Design verification and certification / the compliance check list12. Trade-off methods and tools13. Design recording (including hardware diagrams)14. Market analysisSome extra SE-tools that could be of useX1. Design for XX2. Qualitative Function Deployment (House of Quality)X3. Quantitative SE (Quantifying qualitative design parameters)
Tools focussing on the generic project management process
Tools focussing on the product design specific items in project planning
AE3-S01 The Systems Engineering Survival kit-4
Intro
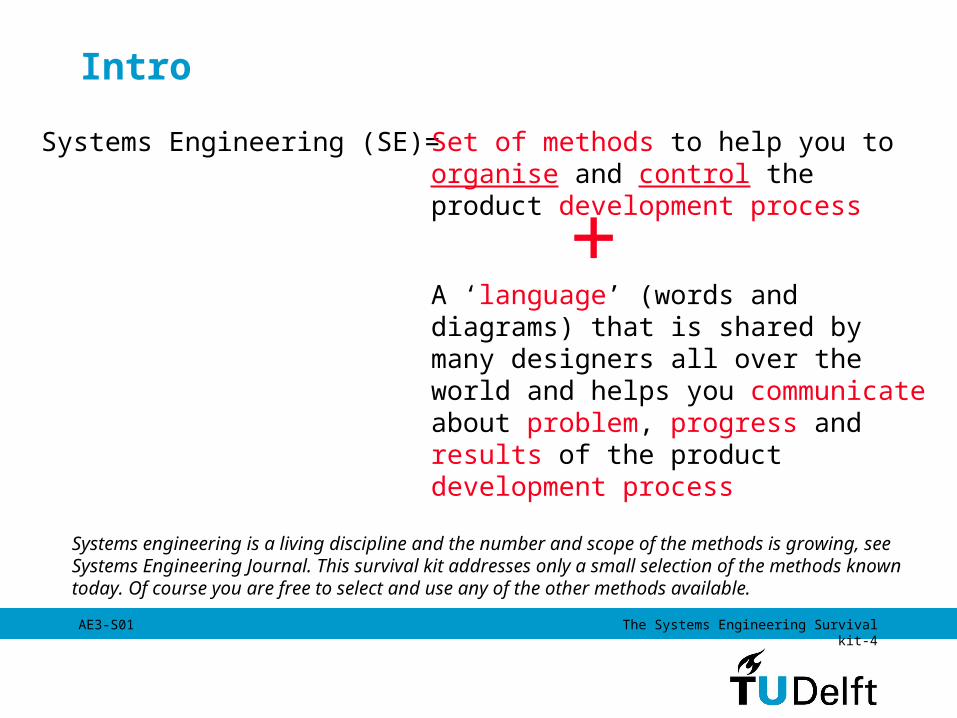
Systems Engineering (SE)= Set of methods to help you to organise and control the product development process
A ‘language’ (words and diagrams) that is shared by many designers all over the world and helps you communicate about problem, progress and results of the product development process
+
Systems engineering is a living discipline and the number and scope of the methods is growing, see Systems Engineering Journal. This survival kit addresses only a small selection of the methods known today. Of course you are free to select and use any of the other methods available.

AE3-S01 The Systems Engineering Survival kit-5
IntroSE assumptions• Each complex product can be seen as a system• Each system has a life cycle consisting of different phases:
• it is conceived (starting with a need (market) or a seed (invention))• it grows (design & engineering)• it is born and raised (production)• it has a professional life (operation) • it needs care (support and maintenance) • it dies (phase out + re-use/re-cycling)
• Each life cycle phase generates requirements that have to be taken into account during the design and engineering phase of the complex product.
• Each of the life cycle phases can require the development of related systems like a production system (e.g. a new production plant), operational systems (like a ground system for a UAV), support and maintenance systems (like new tools and equipment for maintenance), recycling systems (e.g. if you design a new bottle for beer)
AE3-S01 The Systems Engineering Survival kit-6
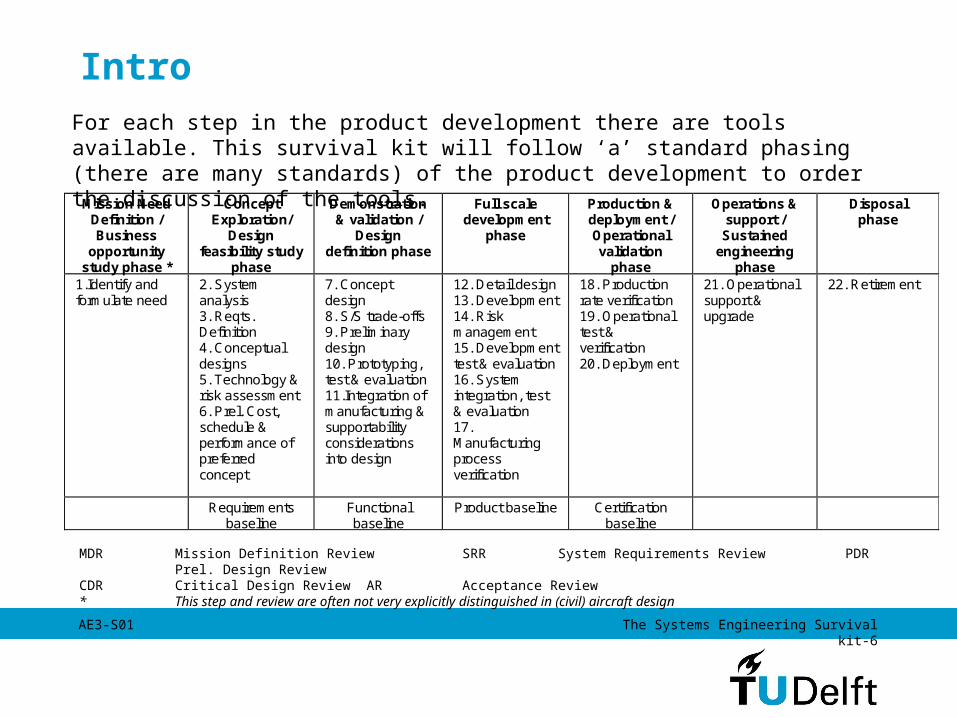
IntroFor each step in the product development there are tools available. This survival kit will follow ‘a’ standard phasing (there are many standards) of the product development to order the discussion of the tools.
Mission Need Definition / Business
opportunity study phase *
Concept Exploration/
Design feasibility study
phase
Demonstration & validation /
Design definition phase
Full scale development
phase
Production & deployment / Operational validation
phase
Operations & support / Sustained
engineering phase
Disposal phase
1.Identify and formulate need
2. System analysis 3. Reqts. Definition 4. Conceptual designs 5. Technology & risk assessment 6. Prel. Cost, schedule & performance of preferred concept
7. Concept design 8. S/S trade-offs 9. Preliminary design 10. Prototyping, test & evaluation 11.Integration of manufacturing & supportability considerations into design
12. Detail design 13. Development 14. Risk management 15. Development test & evaluation 16. System integration, test & evaluation 17. Manufacturing process verification
18. Production rate verification 19. Operational test & verification 20. Deployment
21. Operational support & upgrade
22. Retirement
Requirements baseline
Functional baseline
Product baseline Certification baseline
MDR Mission Definition Review SRR System Requirements Review PDR Prel. Design ReviewCDR Critical Design Review AR Acceptance Review* This step and review are often not very explicitly distinguished in (civil) aircraft design
AE3-S01 The Systems Engineering Survival kit-7
Intro
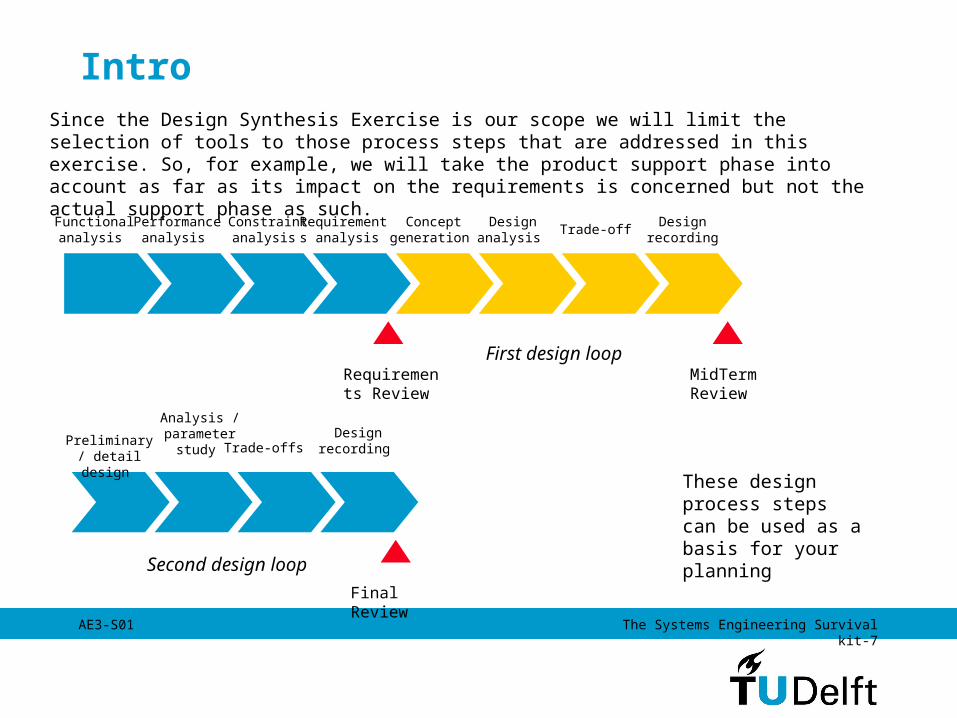
These design process steps can be used as a basis for your planning
Since the Design Synthesis Exercise is our scope we will limit the selection of tools to those process steps that are addressed in this exercise. So, for example, we will take the product support phase into account as far as its impact on the requirements is concerned but not the actual support phase as such.
Functional analysis
Performance analysis
Constraint analysis
Requirements Review
Requirements analysis
Concept generation
Design analysis
Trade-off Design recording
MidTerm Review
Final Review
First design loop
Second design loop
Preliminary / detail design
Analysis / parameter
study Trade-offs Design
recording

AE3-S01 The Systems Engineering Survival kit-8
Intro
The tools in the survival kit will be demonstrated using their application in the DSE 2005 Delfly project: ‘Design of a flapping wing vision-based Micro-UAV’. The Assignment was:
Design a Micro-UAV to impress the jury of the first US-European Micro UAV Competition using flapping wings and the vision-based navigation as enabling technologies.
Applications of various tools within other projects in the DSE over the past years have been added.

AE3-S01 The Systems Engineering Survival kit-9
Tool 1. Version Control and TemplatingReasons to do this: T3
• Traceability• Traceability and• Traceability!
Track your contributions and validations(is this part checked and by whom?)
Track your status (is this document released? Who is responsible?)
Track your amendments/changes (do I have the right version, or is anything changed during the meantime?)
AE3-S01 The Systems Engineering Survival kit-10
Tool 2a The Project Objective Statement Sheet 1 of 3
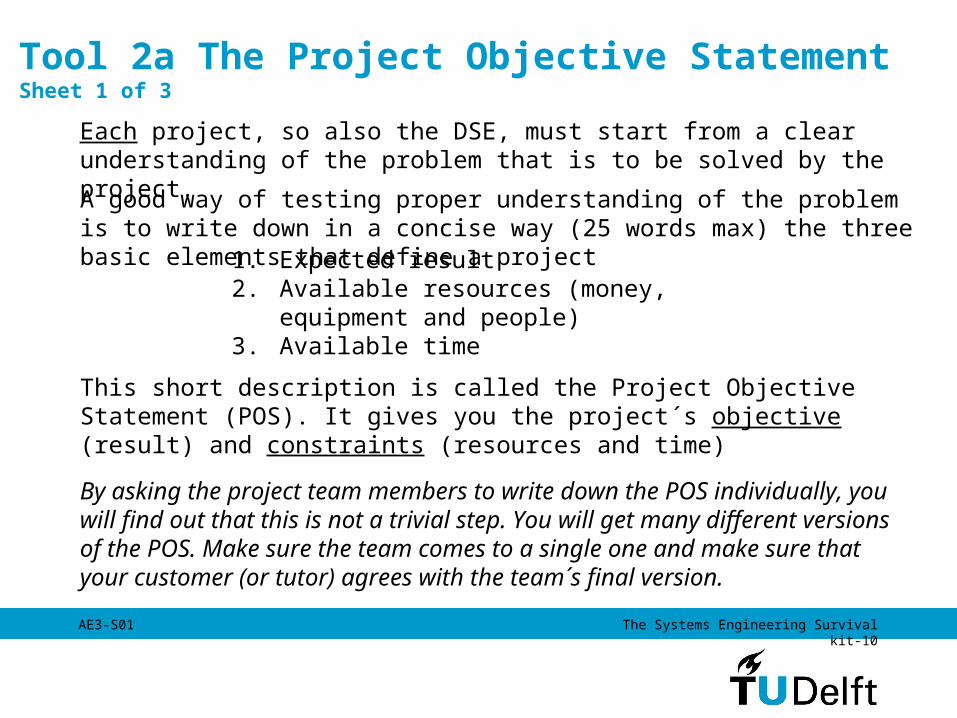
Each project, so also the DSE, must start from a clear understanding of the problem that is to be solved by the project.
A good way of testing proper understanding of the problem is to write down in a concise way (25 words max) the three basic elements that define a project
This short description is called the Project Objective Statement (POS). It gives you the project´s objective (result) and constraints (resources and time)
1. Expected result2. Available resources (money,
equipment and people)3. Available time
By asking the project team members to write down the POS individually, you will find out that this is not a trivial step. You will get many different versions of the POS. Make sure the team comes to a single one and make sure that your customer (or tutor) agrees with the team´s final version.

AE3-S01 The Systems Engineering Survival kit-11
If you have trouble defining clearly what the project is all about you can also improve the definition by specifying what the project is NOT. Below and example for the Delfly project.
This project IS: This project IS NOT:
focused on impressing the jury by using new, enabling technologies.
focused on designing a MAV that will win the competition by strictly addressing the competition’s requirements and excelling in the “race-element” of the competition.
involved in the prudent use of COTS hardware to furnish the MAV with its vital functions
a development of electronic devices e.g. antenna, camera actuators within the project
an extension of present software to develop filters for the vision-based control specific to the mission
a complete development of vision-based software to recognize and detect patterns
focusing on the design of a single purpose single built MAV
concerned with designing a product based on a market analysis and fit for mass production. (Thorough production process design)
Tool 2a The Project Objective Statement Sheet 2 of 3

AE3-S01 The Systems Engineering Survival kit-12
Example from Delfly (2005)
Impress the jury of the first US-European Micro UAV Competition by designing a flapping wing, vision based MAV, using commercially off the shelf products within a budget of 5000€, by 11 students in 10 weeks time.
Tool 2a The Project Objective Statement Sheet 3 of 3

AE3-S01 The Systems Engineering Survival kit-13
Tool 2b The Mission Need Statement Sheet 1 of 2
This is the most basic ‘statement of use’ that can be made about the product to be developed.
To verify if your Mission Need Statement is correct you should ask your customer to look at it and answer the question: If the end product satisfies this Mission Need Statement have we made you a happy person?So the Mission Need Statement is:- The basis for a check if you understood the design objective
properly- The basis for the subsequent requirement discovery: all the
requirements in the end flow down from the mission need statement.Don’t take this part of the project lightly, it is only a small part
expressed in time but it influences all further work in the project.

AE3-S01 The Systems Engineering Survival kit-14
Tool 2b The Mission Need Statement Sheet 2 of 2
Fly with a high level of autonomy through a window and fly slowly around in a room without collisions
Example from Delfly
Note: • the Project Objective Statement summarizes the
deliverables and the constraints of the project • The Mission Need Statement summarizes the required
performance and specifies the constraints for the product to be designed
AE3-S01 The Systems Engineering Survival kit-15
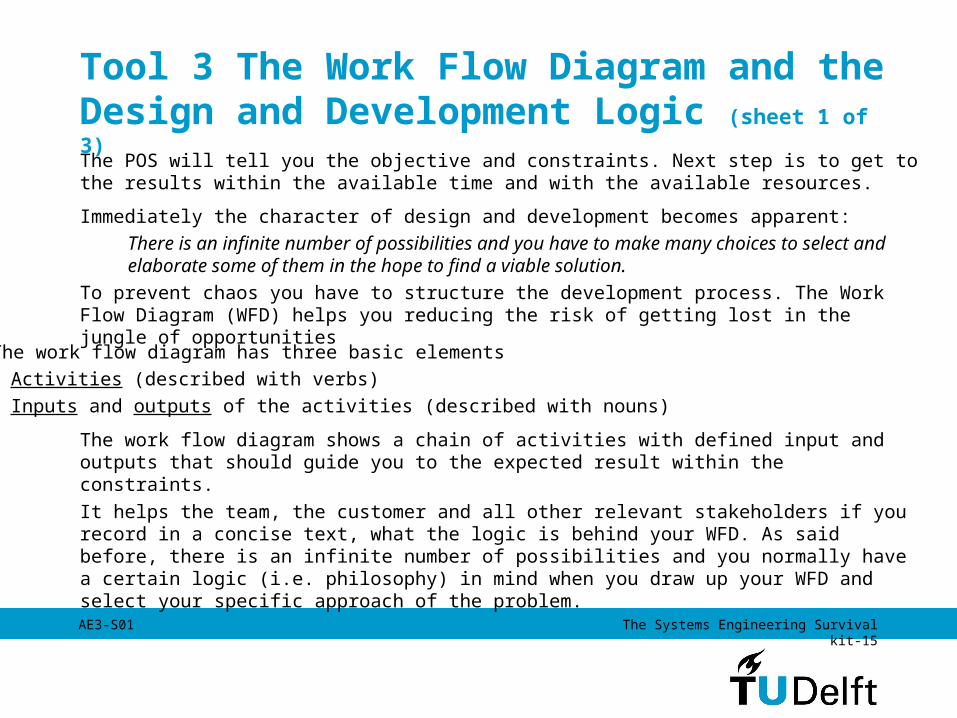
Tool 3 The Work Flow Diagram and the Design and Development Logic (sheet 1 of 3)The POS will tell you the objective and constraints. Next step is to get to the results within the available time and with the available resources.
Immediately the character of design and development becomes apparent:There is an infinite number of possibilities and you have to make many choices to select and elaborate some of them in the hope to find a viable solution.
To prevent chaos you have to structure the development process. The Work Flow Diagram (WFD) helps you reducing the risk of getting lost in the jungle of opportunities
The work flow diagram has three basic elements• Activities (described with verbs)• Inputs and outputs of the activities (described with nouns)
The work flow diagram shows a chain of activities with defined input and outputs that should guide you to the expected result within the constraints.
It helps the team, the customer and all other relevant stakeholders if you record in a concise text, what the logic is behind your WFD. As said before, there is an infinite number of possibilities and you normally have a certain logic (i.e. philosophy) in mind when you draw up your WFD and select your specific approach of the problem.

AE3-S01 The Systems Engineering Survival kit-16
Tool 3 The Work Flow Diagram and the Design and Development Logic (sheet 2 of 3)
Input 1
Input 2
Input 3
Process draftoutput 1
Perform subtask3
Review draftoutput 1
Perform subtask1
Perform subtask2
Draftoutput 1
Prepare finaloutput 1
Sign & issueoutput 1 Output 1
A
AA AAB
C
206040
40
1020
50
A 10
responsible hours throughput time
Example WFD
= input or output (Described with a noun)
= activity (Described with a verb)
If you like you can add some useful information to the activity and input/output boxes.
Note: it is often handy to build the WFD using ´stickies´ (PostIts’ that you can stick to a white board or a large sheet of paper (flip chart).

AE3-S01 The Systems Engineering Survival kit-17
Organise Team
ProjectManagement
FormulateMission Need
Statement
DataInventarisation
ComparisonBetween
RequirementsOS/Competition
COTSComponent Data
Establish MissionScenarios
Establish MissionRequirements
EstablishTechnicalFeasibility
Risk Analysis
Perform MissionTrade-off
MissionDefinition
RequirementAnalysis/Discovery
Find DesignOptions
Establish FinalDesign Option
FunctionalAnalysis
(Functional FlowDiagram)
Work out FinalDesign Concept
Base-lineReview Report
Mission
Mid-termReport
Final Report
Final Requirements Design Option Tree
Requirement Flow Down
TechnicalPerformance
Measurement &Technical Risk
Mangement
Presentation
Mid-Term Review
OS &CompetitionDocuments
Baseline Review
Final Review
Project Plan
Cost Estimate
Combine ideasinto concepts
that could work
Identify trade-offdrivers
First trade-off process
Checkfeasibility
Checkcompliance
withrequirements
Risk analysis
Time analysis
Cost analysis
Establish 3Design Options
EliminateObvious losers
Work out goodconcepts
Second trade-off process
Testing of scaledmodels
Measurementsanalysis
Building ofscaled models
Final concept
Sketchstrawmanconcepts
Scaling of themeasured
parameters
Tool 3 The Work Flow Diagram (sheet 3 of 3)
Delfly example

AE3-S01 The Systems Engineering Survival kit-18
Tool 4 The Work Breakdown Structure Sheet 1 of 2Next step is to structure all the activities from your WFD in a tree, the so-called Work Breakdown Structure (WBS).
If necessary you can combine activities from the WFD in workpackages. But remember that all the activities from the WFD should become part of the WBS.
The inputs and outputs from the WFD will be used together with the WBS in the next tool: the Gantt chart
The tree can also be made in Excell. It is important to show the hierarchy in the tree, so put all equivalent levels in the same column and put lower level in columns further to the right.

AE3-S01 The Systems Engineering Survival kit-19
Tool 4 The Work Breakdown StructureSheet 2 of 2
Delfly Example
Project Start-Up Project Definition ConceptualDesigns
Micro-UAV Project
Detailed Designs Project Close-Out
Project Planning
Formulate MissionNeed Statement
TeamOrganisation
Data Inventarisation
Project Plan Report
Risk Planning
Design Option Tree
Functional Analysis
FinalRequirement Tree
Mission Trade-Off
Mission Analysis
Base-line Report
Gantt Chart
Work Flow Diagram
Work Break-down
Organogram
Statement Of Work Mission OR Tree
Establish Mission Scenarios
Establish TechnicalFeasibilty
Establish MissionRequirements
Functional Breakdown
Risk Planning
Design ConceptTrade-Off
Concept Analysis
Concept Generation(3 concepts)
Risk Planning
Requirement FlowDown
Mid-Term Report
Allocation Of ResourceBudget
Basic Performance Analysis
Risk Identification
Risk Assessment
Risk Analysis
Risk Handling
Trade-Off Methods
Trade-Off Criteria
PropertiesValuesAssignment
Weight Factor Criteria
Choose Final Concept
Trade-Off Summary Table
Verification
Detailed DesignAnalysis
Evaluation
Final Presentation
Final Report
Performance Analysis
Risk Identification
Risk Assessment
Risk Analysis
Risk Handling
Review Of Design Analysis
Cost Estimation
SWOT analysis
Maintenance
TPM
Testing
Building
Evaluating
Testing

AE3-S01 The Systems Engineering Survival kit-20
Tool 5 The Gantt chart sheet 1 of 5
The chart gives an overview of - the WBS (the tasks), - the order in the tasks (defined in the WFD), - the duration of the tasks (estimates from the team), The duration of a task is not
necessarily equal to the time spent on that task. It only specifies begin and end date. The time necessary to complete each task is called ‘work’ and is estimated by the team. The duration is a result of the resources (people) assigned to that task. E.g.: if the work related to a task is 200 hrs and you assign 4 full time people to it, the duration will be 50 hrs.
- the resources assigned to the tasks (which team member does what) and - the deliverables (the outputs of the tasks). Make sure you define these deliverables as clear as possible. E.g. instead of just specifying ‘report’ as deliverable try to define the rough contents of that report .
In the DSE Microsoft Project is used to draw up and update the Gantt chart.
A Gantt chart is a standardized diagram that is useful to record and control the planning of your project. A Gantt chart needs to be updated regularly based on measured project progress.

AE3-S01 The Systems Engineering Survival kit-21
Tool 5 The Gantt chart sheet 2 of 5
A column with activities (called tasks) This information in this column is identical to the WBS. Indentation is used to show hierarchy in activities (tasks) To finish a task you have to complete all tasks indented below that task (the subtasks), or the task itself if no subtasks are defined)
Task bars: for each entry in the Task column a task bar is created. This task bar shows the planned duration of the task, the so-called lead time. The duration is not necessarily equal to the time spent on that task. It only specified begin and end date. The time necessary to complete a task is called work.
A sample Gantt chart in Microsoft Project
Deliverables: use a column with so-called ‘notes’ to write down the deliverables for each task. Create this column by using the insert column option and select a column with ID type ‘notes’ or ‘text’ ( not shown in the example). It is very useful to add a precise description of the expected resultt of each task.
Dependency of tasks (from the WFD). In this case each number specifies which task nr should be finished before this task can start.
Task ATask A
Task A
Task B
Task B
Task B
Finish-to-start (FS)
Start-to-start (SS)
Lags
To each task you can assign one or more resources. The resources are defined first in the resource sheet and then allocated to the task by going into the task information sheet (double click the task) and specifying the resources
AE3-S01 The Systems Engineering Survival kit-22
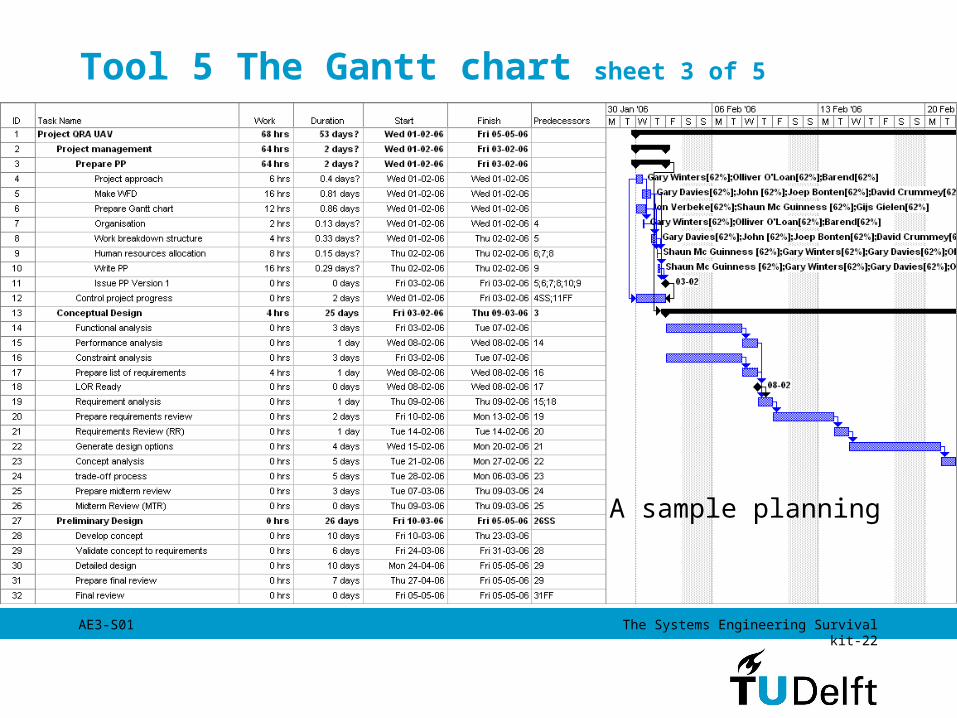
Tool 5 The Gantt chart sheet 3 of 5
A sample planning

AE3-S01 The Systems Engineering Survival kit-23
Tool 5 The Gantt chart sheet 4 of 5
Part of the Delfly project Gantt chart
ID WBS Task Name % Complete28 3.4 Design Concept Trade-off 100%
29 3.5 Requirement Flow-down 100%
30 3.6 Mid-term Report 100%
31 4 Detailed Design 87%
32 4.1 Risk Management Planning 85%
33 4.2 Detailed Design Analys is 90%
34 4.3 Design Verification 95%
35 4.4 Final Review/Report 45%
36 5 Close-Out 0%
37 5.1 Symposium Preparation 0%
38 5.2 Final Presentation 0%
39 5.3 Evaluation 0%
40 6 Building phase 0%
41 6.1 Order components 0%
42 6.2 Vis ion Software 0%
43 6.3 Hardware/Software configuration 0%
44 6.4 Build subasemblies 0%
45 6.5 Test subassemblies 0%
46 6.6 Integrate subassemblies 0%
47 6.8 Updating logbook and general documentation of the process0%
60 6.7 BUFFER 0%
61 7 Test Phase 0%
62 7.1 Perform ground test 0%
63 7.2 Make modifications 0%
64 7.3 Perform Flight test 0%
65 7.4 Make modifications 0%
66 7.5 BUFFER 0%
67 8 Flight Phase 0%
68 8.1 Performance testing 0%
69 8.2 Pilot training 0%
70 8.3 Fine adjustments v is ion 0%
71 8.4 Practice autonomous fl ight 0%
72 8.5 Window spotting 0%
73 9 Pre-competition 0%
74 9.1 Spare parts 0%
75 9.2 Prepare MAV for transport 0%
76 9.3 Logis tics 0%
77 9.3.1 Transport 0%
78 9.3.2 Hotel 0%
79 10 ELMAU 0%
80 10.1 Prepare MAV for competition 0%
81 10.2 Impress the jury 0%
20-05 20-05
23-05 26-05
23-05
27-05 30-05
31-05 10-06
13-06 15-06
16-06
17-06 23-06
24-06
28-06
20-06 23-06
27-06 06-07
04-07 09-09
04-07 08-07
04-07 08-07
11-07 15-07
18-07 29-07
01-08 05-08
01-08 05-08
08-08 12-08
08-08 12-08
15-08 19-08
29-08 09-09
29-08 09-09
12-09 13-09
12-09 18-09
12-09 16-09
29-08 16-09
15-09 16-09
15-08 16-09
15-08 16-09
19-09 19-09
20-09 20-09
02 09 16 23 30 06 13 20 27 04 11 18 25 01 08 15 22 29 05 12 19 26 03May '05 Jun '05 Jul '05 Aug '05 Sep '05 Oct '05

AE3-S01 The Systems Engineering Survival kit-24
Tool 5 The Gantt chart sheet 5 of 5
Additional tips and hints
Before starting to assign resources: Go to the task information window (double click on the task), select the advanced options and specify the task type as being ‘fixed units’. In this way the program will use the assigned percentage of the working hours of each resource as fixed. When changing the number of hours in the work column the duration is then automatically updated.
To track progress you can go to the task information window and put in the % of the work completed. Your Gantt chart will show a roll up bar indicating the completed part of the task.
You can adjust the number of working hours in a working week if necessary. Default value is 40 hrs a week.

AE3-S01 The Systems Engineering Survival kit-25
Intermezzo
Tools 1 to 5 help you to define the process part of the project.Next we will discuss tools 6 to 14. They are closer related to the system being designed.
However, you will find out that tools 6 to 14 can be used to define better what you should do or deliver in each of the steps of the product development process and therefore they help to improve the results of tool 2 to 5.
Therefore we repeat:
read the survival kit twice before you start your project

AE3-S01 The Systems Engineering Survival kit-26
Tool 6 The Functional Flow Diagram and the Functional Breakdown Structure (sheet 1 of 3)Before you start thinking in solutions for your system make sure you understand the functions you have to design into your system to satisfy your customer.
If you find it difficult to think in functions try to describe everything your design should do as: ‘perform xxx’ instead of in ‘have (sub-)system
E.g.: • ‘perform load transfer’ instead of ‘have stiffeners’• ‘perform communication’ instead of ‘have radio’
Remember: each function defines part of the problem to be solved and not the solution itself. Finding solutions will be the subsequent step. First focus on a proper definition of the design problem.
To reduce the risk of forgetting fucntions, you can get into the skin of your system and follow it in its functioning. Similar to the WFD (showing all functions of the team) you now get a flow diagram showing the flow of functions required to satisfy the customer.

AE3-S01 The Systems Engineering Survival kit-27
Tool 6 FFD and FBS (sheet 2 of 3)
Part of the FFD of the Delfly project
Set level of autonomy
Manual in line of sight
Manual on screen
Target mode
Observation mode
Pre-operational inspection
Turn systems on
Check battery level
Check actuators
Check downlink &
uplink
Recharge battery
Repair
Set level of autonomy to
manual
Pointing of MAV
Estimate required
initial velocity
Set flapping speed
Throw
Check the structural integrity
Fly
Launch
Pre-operational inspection
Launch Fly Land Maintenance
Use of camera
Make pictures
Observation image
downlinkProces data
Store data
Check powerNavigate on
sight
Mechanical input control
signal
Send control signal
Receive & process
control signal
Deflect control
surfaces
Control flight speed
LandBallistic landing
Turn off flight systems
Collect
Check powerNavigate on
sight
Mechanical input control
signal
Send control signal
Receive & process
control signal
Deflect control
surfaces
Control flight speed
Send redirect camera signal
Manoevre camera
Choose to redirect camera
Check power Make pictureImage
downlinkProcess data
Store data
Show on screen
Navigate by screen
Mechanical input control
signal
Send control signal
Receive & process
control signal
Deflect control
surfaces
Control flight speed
Check power Make pictureImage
downlink
Calculate window
geometry
Store data
Show on screen
locate obstacles (collision
avoidance)Recognise
patterns
Process dataDetermine necessary maneouvre
Send control signal
Receive & process
control signal
Deflect control
surfaces
Control flight speed
Check power Make pictureImage
downlink
Store data
Show on screen
locate obstacles (collision
avoidance)
Recognise patterns
Process dataDetermine necessary maneouvre
Send control signal
Receive & process
control signal
Deflect control
surfaces
Control flight speed
Maintenance Clean lensCheck for damage
Clean structure
Repair
g
g g g
g g
Show
Receive redirect camera signal
g
g
Repair
Turn off all systems
1.0 2.0 3.0 4.0 5.0
1.0 1.1 1.2 1.3 1.4
1.4.11.1.1 1.3.1
1.5
2.0 2.1 2.2
2.0
2.3 2.4 2.5
3.0 3.1 3.2
3.3
3.3.1
3.4 3.4.1
3.5 3.5.33.5.4
3.5.10
4.0 4.1.1 4.1.4
5.0 5.1 5.2 5.3
5.1.1
3.2.1.1 3.2.1.2 3.2.1.3
3.2.1.4
3.2.1.5
3.2.1.6 3.2.1.7 3.2.1.8 3.2.1.9
3.2.2.1 3.2.2.2 3.2.2.3 3.2.2.4
AND
AND
AND
AND
AND
AND
AND
AND
AND
AND
3.2.2.5
3.2.2.6
3.2.2.7
3.2.3.1 3.2.3.2 3.2.3.3 3.2.3.4 3.2.3.5
3.2.3.6
3.2.3.7
OR
3.3.2 3.3.3 3.3.4
3.3.5
3.3.6
3.3.7 3.3.8 3.3.9 3.3.10
3.3.11
3.3.12
3.4.2 3.4.3 3.4.4
3.4.5
3.4.6
3.4.7
3.4.8
3.4.9
3.4.10 3.4.11 3.4.12
3.4.13
3.4.14
3.5.1 3.5.2
3.5.5
3.5.6
3.5.7
3.5.8 3.5.9 3.5.11
3.5.12
3.5.13
4.1.2 4.1.3
AND

AE3-S01 The Systems Engineering Survival kit-28
This FBS shows all the functions of the FFD. Of course the aggregation level can be adjusted.
You can report all the functions in an and tree, just like the WBS
Tool 6 The Functional Breakdown Structure (sheet 3 of 3)
Delfly example
Perform Mission
Provide Power
Perform Flight
Provide Guidance & Navigation
Provide Electrical Power
Provide Control & Stability
Provide Lift
Regulate Electrical Power
Provide Mechanical Power to Flapping
Wings
Receive Images
Generate Control Commands
Process Images
Transmit Control Commands
Provide Pictures
Make Images
Transmit or send Images
Store ImagesDistribute Power to all (Sub-) Systems
Flap Wings
Receive Control Commands
Deflect Control Surfaces
Adjust Power Settings
Recognize Image Patterns
Estimate Relative Position & Attitude
Provide Manual Control Commands
Provide Automatic Control Commands
Non-flapping Aerodynamic Surfaces
Provide Propulsion
Flap Wings

AE3-S01 The Systems Engineering Survival kit-29
Tool 7 Requirements Discovery Tree and List of Requirements Sheet 1 of 2
Tool 5 was used to find all functions you have design into your system. The functions form an important part of the requirements, namely the functional requirements. However, there are other important types of requirements.
The second important class of requirements taken into account in the DSE are the constraints. Constraints can come from the customer, the authorities (laws and regulations) or from your company. Make sure you find out all the relevant constraints.Functional requirements and constraints together form the list of requirements (LOR). This LOR forms the definition of your design problem.
AE3-S01 The Systems Engineering Survival kit-30
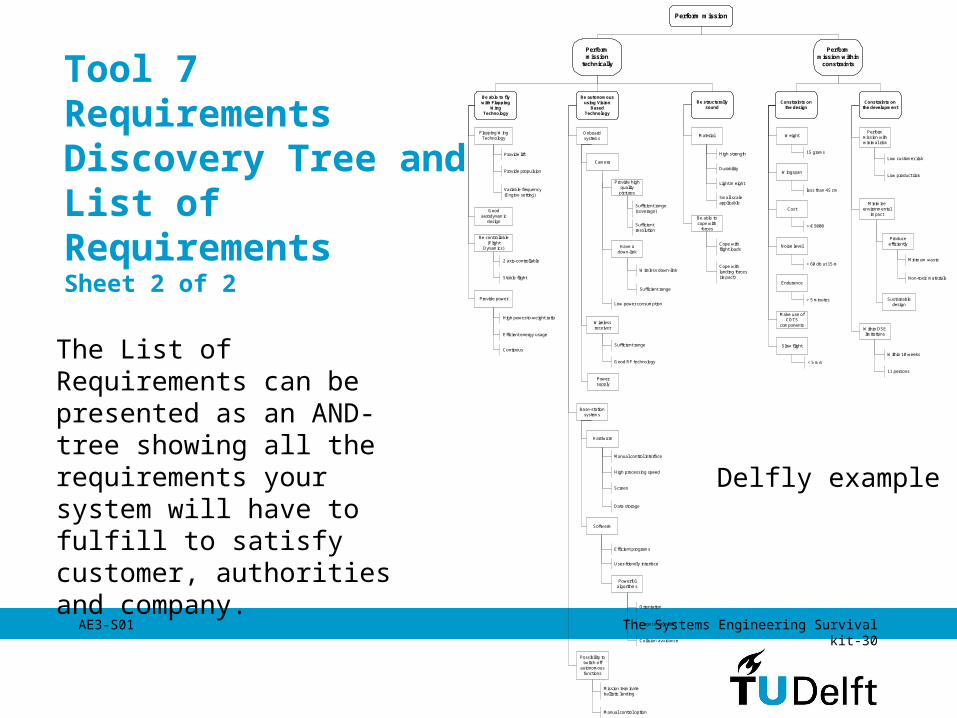
Tool 7 Requirements Discovery Tree and List of Requirements Sheet 2 of 2
The List of Requirements can be presented as an AND-tree showing all the requirements your system will have to fulfill to satisfy customer, authorities and company.
Delfly exampleHigh processing speed
Be able to flywith Flapping
WingTechnology
Be autonomoususing Vision
BasedTechnology
Be structurallysound
Perform mission
Constraints onthe design
Flapping WingTechnology
Cost
Camera
Wingspan
WeightMaterialOnboardsystems
Noise level
Produceefficiently
Within DSElimitations
Provide lift
Provide propulsion
15 grams
less than 45 cm
High strength
Durability
Wireless down-link
> 5 minutes
High power-to-weight ratio
Efficient programs
< 60 db at 15 mMinimum waste
Non-toxic materials
< € 5000
11 persons
Make use ofCOTS
components
User-friendly interface
Base-stationsystems
Manual control interface
Low power consumption
Be controllable(Flight
Dynamics)
2 axis-controllable
Stable flight
Sufficient range
Sufficient rangeEndurance
Provide power
Efficient energy usage
Collision avoidance
Wirelessreceiver
Hardware
Software
Within 10 weeks
Low customer risk
Low product risk
Performmission
technically
Sustainabledesign
Minimizeenvironmental
impact
Performmission withminimal risk
Constraints onthe development
Performmission within
constraints
Be able tocope with
forces
Cope withflight loads
Cope withlanding forces(impact)
Light Weight
Small scaleapplicable
Possibility toswitch off
autonomousfunctions
Mission terminateballistic landing
Manual control option
Target recognition
Good RF technology
Screen
Data storage
Orientation
Slow flight
Variable frequency(Engine setting)
Goodaerodynamic
design
Powerfulalgorithms
< 5 m/s
Continous
Provide highquality
pictures
Have adown-link
Sufficient range(coverage)
Sufficientresolution
Powersupply

AE3-S01 The Systems Engineering Survival kit-31
Tool 8 The use of N2 diagrams Sheet 1 of 3
Systems can be decomposed in subsystems, components and parts*. It is important to be aware of the fact that more than just the physical entities are split in smaller entities. Everytime you cut a system in pieces you also have to discover and describe the relations between these pieces that need to be there to make pieces and relations equal to the original system.
* These are all relative words. Normally the word system is used for the complete solution to the top level requirements. The words subsystems, components and parts are used to zoom in with increasing level of detail on the decomposed system.
but =
System System elements(subsystems, components, parts)
System System elements + relations

AE3-S01 The Systems Engineering Survival kit-32
Tool 8 The use of N2 diagrams Sheet 2 of 3
This decomposition in elements and relations can be used for systems, functional breakdowns and work structure breakdowns*. The general template for the decomposition in elements and relations is a matrix with the elements on the diagonal and the relations in the other matrix elements
* In the case of work structure breakdowns a useful special case of the N2 diagram is the Design Structure Matrix (DSM): a rearrangement of the tasks in a Gantt chart to create blocks of tasks such that the interaction between the blocks is minimized.
el 1
el 2
el 3
el 4
el n
This entry in the matrix shows a relation between element 4 and 2 that is originating from element 4
This entry in the matrix shows a relation between element 2 and 4 that is originating from element 2

AE3-S01 The Systems Engineering Survival kit-33
Tool 8 The use of N2 diagrams Sheet 3 of 3
Below some examples are listed where the use of N2 diagrams can be useful in the design
* In the case of work structure breakdowns a useful special case of the N2 diagram is the Design Structure Matrix (DSM).
Electric cable: cut it and find out that the two geometric parts need an additional element to regain the original functionality
Lightning protection of an aircraft: make a division between to parts and you will need special features to restore the orginal protection (the so-called ‘electrical bonding’ problem)
+

AE3-S01 The Systems Engineering Survival kit-34
Tool 9 Technical budgetting / Risk management sheet 1 of 3
Technical budgetting is a way to control performance risks of the system being designed.Just like using time and resource budgets in your project planning, you can use technical budgets to constraint the solution domain.
Technical parameters that can be budgetted are, for example:• Weight• Drag• Energy consumption• Tolerances on dimensions• Volume
These budgets tell the designer of each subsystem: whatever solution you come up with: it should not exceed this or that value for this or that parameter.
If all designers stick to their budget the total system will not violate the overall system performance requirements. However, in performance driven design, the budgets are often tight and not all subsystems can be designed within the allocated budget. The budgetting system works then as a signalling system for problems. Reallocation of budgets or redefinition of requirements will have to take place in these cases.

AE3-S01 The Systems Engineering Survival kit-35
Tool 9 Technical budgetting / Risk management sheet 2 of 3
In addition to the budgetting principle, the application of risk maps to help tracking and mitigating risks is standard practice in industry.
1. technical/performance risk
2. schedule risk
3. cost risk
These risks are not independent:
technical/performance risk schedule risk cost risk
In these maps three types of risk are tracked:
Risk related to an event is defined as: probability of occurrence times impact )or consequence’. The risk map has these two elements on its axes.
The segmentation of the axes in the map should be done in a way that fits best the specific project. An example is shown on the next sheet.

AE3-S01 The Systems Engineering Survival kit-36
Tool 9 Technical budgetting / Risk management sheet 3 of 3
Feasible in Theory 4, 8 1, 2 10
Working Laboratory Model
5 7 3, 9
Based on Existing Non-flight Engineering
6
Extrapolated from Existing Flight Design
1 Man-Machine Interface
2 Compliant Motion Control
3 Open Loop Control
4 Proximity Sensing
5 Manipulator Joints
6 Manipulator Limbs
7 EVA/ORU Mechanisms
8 End Effector 9 Retention
Mechanism 10 Long Space
Exposure
Proven Flight Design
Pro
ba
bil
ity
Negligible Marginal Critical Catastrophic Performance Consequence
Put scarce resources on these items!

AE3-S01 The Systems Engineering Survival kit-37
Tool 9 Risk Analysis and Contingencies Sheet 1 of 2
1. analysis2. quantification
AE3-S01 The Systems Engineering Survival kit-38
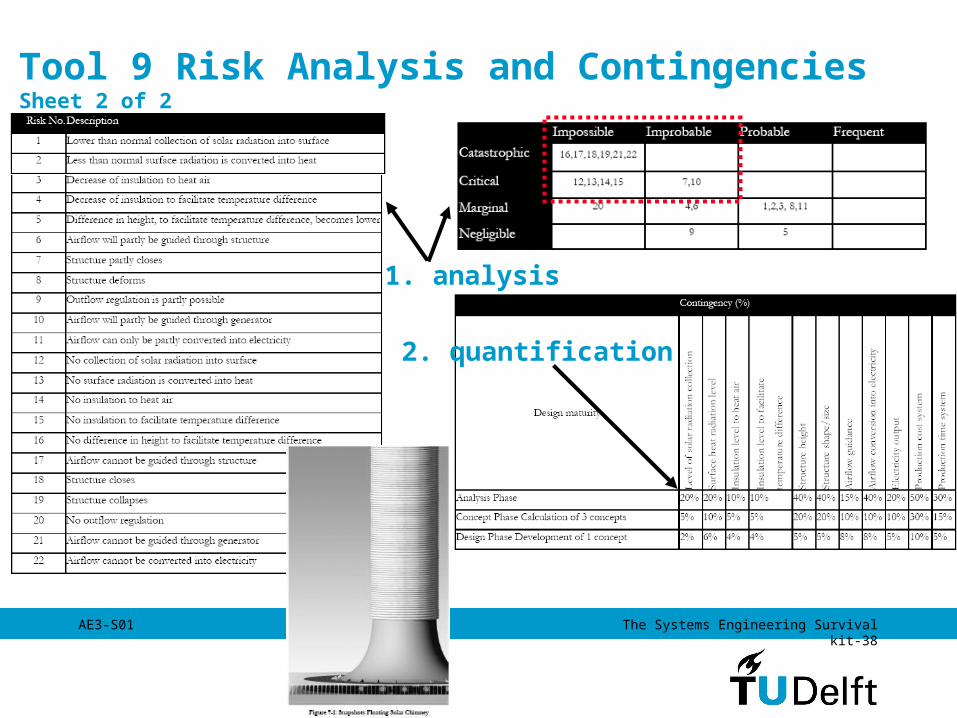
Tool 9 Risk Analysis and Contingencies Sheet 2 of 2
1. analysis
2. quantification

AE3-S01 The Systems Engineering Survival kit-39
Tool 10 The Design Option Tree Sheet 1 of 2Based on the FBS, the designer can start her\his search for potential solutions. This is the heart of the design process. In principle the solution domain as such is unbound, but due to the constraints on budget and time (on project planning level) and the constraints on technology level (the constraints in the List of Requirements), a limited number of potential solutions will result from the search. Normally more than one potential solution will result that deserves further attention. A simple tool to report the different potential solutions to your customer and team members is the Design Option Tree. It is an OR-tree thus at each node all branches show an option.
It is often useful to make a separate Design Option Tree for each function to prevent the tree to become unnecessary large.

AE3-S01 The Systems Engineering Survival kit-40
Tool 10 The Design Option Tree Sheet 2 of 2
Examples from the Delfly project
Vehicleconfigurations
Canard
MonoplaneBiplane
Standard Canard Standard
Tandem
Pt1 – Vehicle Configurations
Actuators
Electromechanical
MagneticCoilsMuscle Wire
Pt8 - Actuators

AE3-S01 The Systems Engineering Survival kit-41
Tool 11 Design verification and certificationThe Design Option Tree contains potential solutions to the design problem but how do you verify if they are real solutions with properties that meet all the relevant requirements? This is the problem of design verification.
There are different ways to verify a design. Depending on risks related to the operation of the system, experience with the technology used and verification requirements from customer/company/government, a verification method will be selected for the different properties and the different subsystems.
Most important verification methods:• Tests• Analysis• Simulation• Design review• Statement
It can be helpful to draw up a so-called compliance checklist to trace how the compliance with each requirement is checked for all relevant system elements
No Means of Compliance Associated Compliance Document
0 Compliance statement Type design documents, recorded statements
1 Design review Description, drawing
( could also be AFM or Maintenance manual etc.)
2 Calculation/Analysis Substantiation reports
3 Safety Assessment Safety Analysis
4 Laboratory test Test programs, test reports, test interpretations
5 Ground test on related product Test programs, test reports, test interpretations
6 Flight test Test programs, test reports, test interpretations
7 Inspections Inspection reports
8 Simulation Test programs, test reports, test interpretations
9 Equipment qualifications May include all previous means of compliance

AE3-S01 The Systems Engineering Survival kit-42
Tool 12 Trade-off methods and tools Sheet 1 of 2 Primary objective of a well defined trade-off method is to convince your customer, your team and yourself of the correct choice between the different design options
It is impossible to do so if these parties do not agree on
•The trade-off criteria, i.e.:
•Killer requirements identified in initial requirements analysis
•Other system-level requirements in which the design options differ significantly
•The trade-off logic, i.e.:
•Relative weights of selection criteria
•Definitions of terms, performance classifications
•Anything else needed to accurately represent the logic you are usingTo make the best choice try to compare all candidates on the same basis:
• Use computed numbers (power, weight, etc.) where significant and possible• Use coarse scoring (e.g. excellent, good, etc.) to compare dissimilar traits

AE3-S01 The Systems Engineering Survival kit-43
Tool 12 Trade-off methods and tools Sheet 2 of 2
Try to report the results of your trade-off in a trade-off table. The table shows the design options in the left column and the trade-off criteria in the top row. The other cells in the table show the score for each of the options with respect to the criteria. Using a color scheme for the cells helps in getting a fast impression of the overall score of the design option.
Flight speed
Power consumptio
n
Camera platform stability
Mass (w.r.t. 15 grams)
Risk Noise level Complexity Structure loading
Weight factor
25 % 20 % 10 % 10 % 10 % 5 % 10 % 10%
Biplane Very low Nominal Stable A bit higher Low Low Slightly higher
Low loading
Monoplane Medium Nominal Vertical excitation
Slightly higher
Low Low Low Moderate loading
Tandem Very low Higher Longitudinal oscillation
Higher High Low Higher Low loading

AE3-S01 The Systems Engineering Survival kit-44
Tool 13 Design Recording (including hardware diagrams) Sheet 1 of 6
A proper recording of your design can include:- Product drawings- Hardware diagrams showing schematically how a
(sub-)system work. They are used to explain the design of fuel systems, hydraulic systems, electronic systems, electrical systems etc.). They focus on function more than on a precise representation of the physical appearance of the system.
- Reports. These are very important to record the design verification.
- Models. A model of your product (made with rapid prototyping, or with any other appropriate means). Can be very helpful to illustrate your design to different stakeholders.
- Animation

AE3-S01 The Systems Engineering Survival kit-45
Tool 13 Design Recording (including hardware diagrams) Sheet 2 of 6 Delfly example Monoplane Biplane Tandem
Dimensions (l w h)
0.36 x 0.45 x 0.06 0.43 x 0.45 x 0.06 0.47 x 0.45 x 0.05
Mass 16.48 g 17.48 g 18.18 g Aspect Ratio 3.90 3.90 3.90 Wing Span 0.450 m 0.450 m 0.450 m
Average flight speed 2.35 m/ s 1.40 m/ s 1.36 m/ s
Centre of gravity 51% of chord from leading edge 41% of chord from leading edge 51% of chord from leading edge
Power consumption 1551.2 mW 1440.8 mW 2149.5 mW
Flapping frequency 3.69 Hz 6.17 Hz 7.90 Hz
Tail configuration Bird tail Inverted V-tail Conventional tail
Rocking amplitude 8 mm 0 mm Rotation
Comments
The monoplane that is considered in this phase of the design process is based on the Freebird model that is available at ornithopter.org.
The biplane that is considered is based on the Luna, which is also available at ornithoper.org.
The tandem is based on an existing model that has only been built on a very small scale. In order to build the test model for this configuration, this small model first had to be scaled up.

AE3-S01 The Systems Engineering Survival kit-46
Tool 13 Design Recording (including hardware diagrams) Sheet 3 of 6 Delfly example
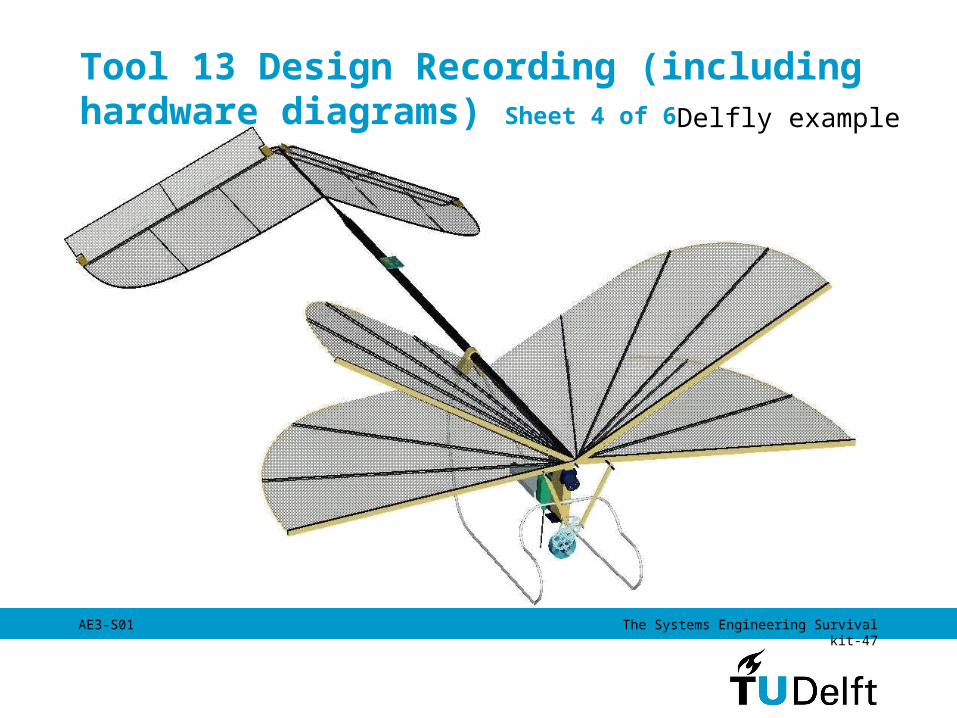
AE3-S01 The Systems Engineering Survival kit-47
Tool 13 Design Recording (including hardware diagrams) Sheet 4 of 6 Delfly example

AE3-S01 The Systems Engineering Survival kit-48
Tool 13 Design Recording (including hardware diagrams) Sheet 5 of 6 Delfly example
Elevator controller
Data handling diagram
Video Receiver
Video Capture Card
Base station
Radio Controller
RC Receiver
MAV
Micro Camera
Video Transmitter
Hardware block diagram

AE3-S01 The Systems Engineering Survival kit-49
Tool 13 Design Recording (including hardware diagrams) Sheet 6 of 6 Delfly example
Layout and packaging
AE3-S01 The Systems Engineering Survival kit-50
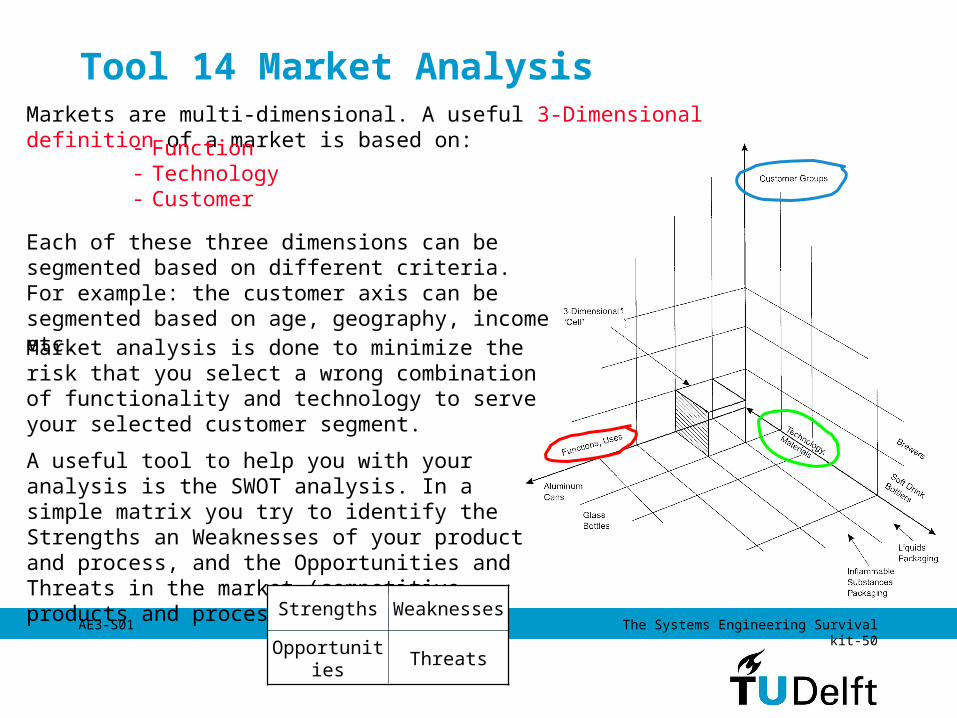
Tool 14 Market AnalysisMarkets are multi-dimensional. A useful 3-Dimensional definition of a market is based on:- Function
- Technology- Customer
Each of these three dimensions can be segmented based on different criteria. For example: the customer axis can be segmented based on age, geography, income etc.Market analysis is done to minimize the risk that you select a wrong combination of functionality and technology to serve your selected customer segment.
A useful tool to help you with your analysis is the SWOT analysis. In a simple matrix you try to identify the Strengths an Weaknesses of your product and process, and the Opportunities and Threats in the market (competitive products and processes)
Strengths Weaknesses
Opportunities
Threats

AE3-S01 The Systems Engineering Survival kit-51
Some other SE-tools that could be of useIn the lecture notes you will find other tools that can be of use to structure your design project. In addition there is a lot of literature addressing developments in Systems Engineering.
Systems engineering is becoming an increasingly useful skill in a globalizing world with distributed design and production where controlling the process is the only way to guide the development towards the desired result. So don’t fight it but try to use it to maximize the results of your efforts.
Some other tools: X.1 ‘design for X’
like design for maintainability, design for evolvability
X.2 Quality Function Deployment to map user requirements to technical requirements
X.3 Quantitative Systems Engineering to quantify some of the normally qualitative approaches within
design

AE3-S01 The Systems Engineering Survival kit-52
Tool X.1 Design for X Sheet 1 of 2
Design for X means: adding those features to your design/design process such that a specific set of requirements is fulfilled.
Examples of Design for X- Design for Manufacturability- Design for Evolvability- Design for Cost
To do Design for X you have to know the requirement analysis methods, the design options, the analysis methods and the verification methods that can be used to address the specific set of requirements.

AE3-S01 The Systems Engineering Survival kit-53
Tool X.1 Design for X Sheet 2 of 2
Examples:
Design for Cost:Requirement analysis: Value MappingDesign Options: lean engineering (KBE), lean manufacturing,
low cost materials/parts (e.g. COTS only), low cost manufacturing processes, Design for Serviceability (if costs are related mainly to maintenance) etc, etc
Analysis methods: Activity based costing, recurring / non-recurring cost analysis
Validation: Time studies, Prototyping, 0-series

AE3-S01 The Systems Engineering Survival kit-54
Tool X.2 Quality Function Deployment
Importance
Customer rating
Objective Target Values
Relationship
Correlation
Importa
nce
Custo
mer ra
ting
Strong
Medium
Weak
Strong positive
Positive
Negative
Strong negative
Cu
sto
mer
Req
uir
em
en
tsProduct Requirements
•Used to steer translation of Customer demands into demands on your product. (relationship & correlation)
•It guides you to understand the importance of specific requirements (ratings) (columns right and below)
•When filled, it answers how the product requirements fulfill the customer requirements

AE3-S01 The Systems Engineering Survival kit-55
Tool X.3 Quantitative SE Sheet 1 of 8
During the requirement analysis and, later in the development process, during preliminary and detail design some of the systems engineering processes described in other tools can be addressed in a quantitative manner.
SE processes with quantitative equivalents are a.o.:- mission need statement- filling the design option tree- design trade-off- risk analysis

AE3-S01 The Systems Engineering Survival kit-56
Tool X.3 Quantitative SE Sheet 2 of 8
Mission need statement
The quantative equivalent of the mission need statement consists of an objective function and a set of constraints
The product being designed can be described with a set of parameters and a set of design variables:• A set of parameters describes a product family• A set of design variables describes a family member
Examples
Objective function: min f(x), x is vector of design variables, f(x) can be e.g. the weight of the product. min f(x) then means: find the values for x that will minimize the weight
Constraint function: c(x)≤0: this means that the design described by x is considered feasible/acceptable only if this constraint function is true.E.g. an aircraft wing design is acceptable only if the stall speed ¨larger than.., payload equal or larger than...
AE3-S01 The Systems Engineering Survival kit-57
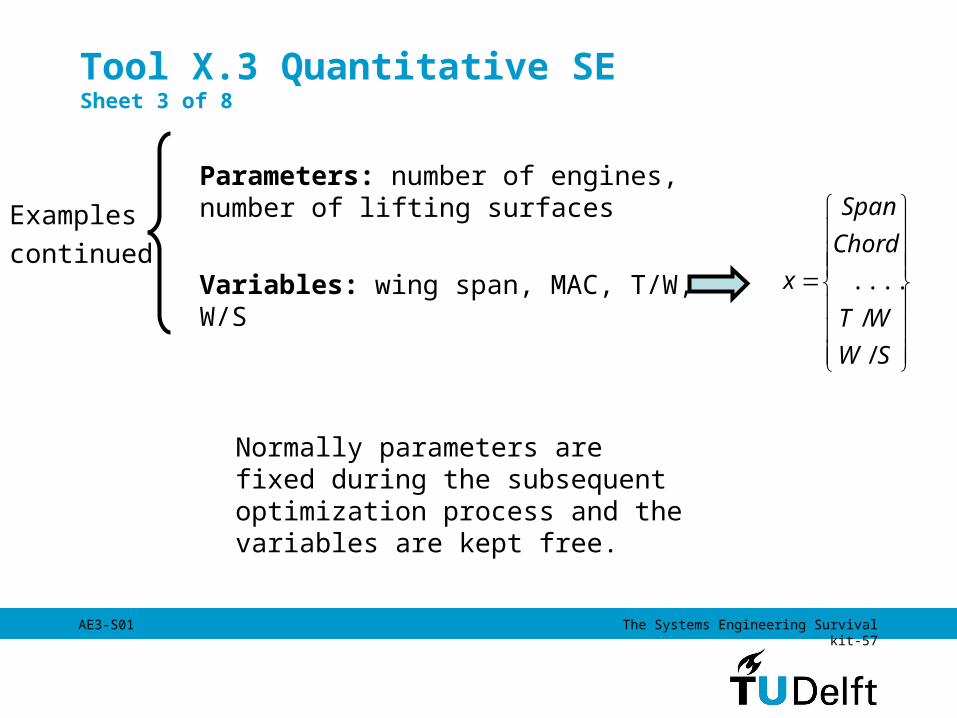
Tool X.3 Quantitative SE Sheet 3 of 8
Examples continued
Parameters: number of engines, number of lifting surfaces
Variables: wing span, MAC, T/W, W/S
Normally parameters are fixed during the subsequent optimization process and the variables are kept free.
SW
WT
Chord
Span
x
/
/
.....

AE3-S01 The Systems Engineering Survival kit-58
Tool X.3 Quantitative SE Sheet 4 of 8
],,,,,,[ 045045 Lhbnnnnxoooo
skstskskbLWWWf ribstiffenerskin /)(
Design variablesObject function
Variable Description b stiffener spacing h stiffener height nsk0 number of plies in the skin of 0o material nsk45 number of plies in the skin of ±45o material nst0 number of plies in the stiffener of 0o material nst45 number of plies in the stiffener of ±45o material L length of the panel
Examples continued

AE3-S01 The Systems Engineering Survival kit-59
Tool X.3 Quantitative SE Sheet 5 of 8Filling the design option tree: quantitative search for acceptable/optimal designs
The quantitative equivalent of a search for design options is an optimization algorithm. There are many of these algorithms available and accessible through e.g. the Matlab optimization toolbox. Important algorithms are:
These algorithms are used to minimize or maximize the objective function, taking into account the constraint functions. Differences in the methods are mainly related to:Does the method uses function values only or also derivatives
• Sequential Linear Programming• Sequential Quadratic Programming• Genetic algorithms• Hooke and Jeeves• etc

AE3-S01 The Systems Engineering Survival kit-60
Tool X.3 Quantitative SE Sheet 6 of 8
Design Trade Off
In many cases the objective function has multiple elements. The importance of each of the elements is specified by a weight factor:
Min f(x)=c1*Weight+c2*Costs
Both Weight and Costs are a function of the design variables, xc1 and c2 are the weight factors. The stakeholders decide what the relative importance of weight and costs is. Their (subjective) opinion will decide the outcome of the minimization.
AE3-S01 The Systems Engineering Survival kit-61
Tool X.3 Quantitative SE Sheet 7 of 8
Design Trade Off Continued
The trade-off is quantified using again the optimization methods discussed before. In this case not a single optimum is found but a so-called pareto front that shows combinations of the two partial objective functions that give an equal value for the total objective function

AE3-S01 The Systems Engineering Survival kit-62
Tool X.3 Quantitative SESheet 8 of 8
Probability theory
Risk can be expressed in probability of occurence times impact. Instead of using ordinal methods also quantative methods can be used when sufficient data is available. This is the field of probability theory with subfields like statistics. (see also the part on Risk Analysis and Contingencies)
A very important tool to quantify risk when probabilities have to be updated based on new information is Bayes´ rule
It is left to the reader to study this topic further.eg: Gelb, A. (ed), “Applied Optimal Estimation”, MIT Press, 1974, p25
)(.)(
)|()|( AP
BP
ABPBAP
The probability that A happens given the condition B =
probability that B happened given the condition A divided by the probability of B happening (in general)
times the probability of A happening (in general)
The probability that “the message is spam” given “a spam word” = probability that “a spam word” flagged “a message as spam” (in the past) divided by the probability of “message is spam” among all messages times the probability of “a spam word” occurring in all messages


![M ] D f ]kaken-techno.co.jp/.../632dec2515d7e5de4bbd01041d602e5e.pdf6 D MCA5203SE-S01 MCA3203SE-S01 MCA6202S0-S01 MCA4202S0-S01 MCA2202S0-S01 MCA8201S0-S01 MCE6202S0-S01 C"(ãTS ¥1,114,000](https://img.pdfslide.us/doc/110x75/60b7e1ebae35d90dba2d7a96/m-d-f-kaken-6-d-mca5203se-s01-mca3203se-s01-mca6202s0-s01-mca4202s0-s01-mca2202s0-s01.jpg)