Embed Size (px)
Citation preview

Systems Engineering Cost Estimation
Systems Engineering Day, São José dos Campos, Brazil
Dr. Ricardo ValerdiMassachusetts Institute of Technology
June 6, 2011[[email protected]]

Theory is when you know everything, but nothing works.
Practice is when everything works, but no one knows why.
Harvard is where theory and practice come together...
Nothing works and no one knows why.
- on the door of a laboratory at Harvard

The Delphic Sybil
Michelangelo Buonarroti
Capella Sistina, Il Vaticano (1508-1512)

4
Cost Commitment on Projects
Detail Designand
Development
100
25
50
75
Conceptual-Preliminary
Design
Constructionand/or
Production
System Use, Phaseout,and Disposal
NEED
% Commitment to Technology,Configuration, Performance, Cost, etc.
Cost Incurred
System-Specific Knowledge
Ease of Change
Blanchard, B., Fabrycky, W., Systems Engineering & Analysis, Prentice Hall, 1998.

5
Feasibility Plans/Rqts. Design Develop and Test
Phases and Milestones
Relative Size
Range
OperationalConcept
Life Cycle Objectives
Life Cycle Architecture
Initial Operating Capability
x
0.5x
0.25x
4x
2x
Cone of Uncertainty
Boehm, B. W., Software Engineering Economics, Prentice Hall, 1981.
6
How is Systems Engineering Defined?
• Acquisition and Supply – Supply Process– Acquisition Process
• Technical Management– Planning Process– Assessment Process– Control Process
• System Design– Requirements Definition Process– Solution Definition Process
• Product Realization– Implementation Process– Transition to Use Process
• Technical Evaluation
– Systems Analysis Process
– Requirements Validation Process
– System Verification Process
– End Products Validation Process
EIA/ANSI 632, Processes for Engineering a System, 1999.

COSYSMO Data SourcesBoeing Integrated Defense Systems (Seal Beach, CA)
Raytheon Intelligence & Information Systems (Garland, TX)
Northrop Grumman Mission Systems (Redondo Beach, CA)
Lockheed Martin Transportation & Security Solutions (Rockville, MD)
Integrated Systems & Solutions (Valley Forge, PA)
Systems Integration (Owego, NY)
Aeronautics (Marietta, GA)
Maritime Systems & Sensors (Manassas, VA; Baltimore, MD; Syracuse, NY)
General Dynamics Maritime Digital Systems/AIS (Pittsfield, MA)Surveillance & Reconnaissance Systems/AIS (Bloomington, MN)
BAE Systems National Security Solutions/ISS (San Diego, CA)
Information & Electronic Warfare Systems (Nashua, NH)
SAIC Army Transformation (Orlando, FL)
Integrated Data Solutions & Analysis (McLean, VA)
L-3 Communications Greenville, TX
8
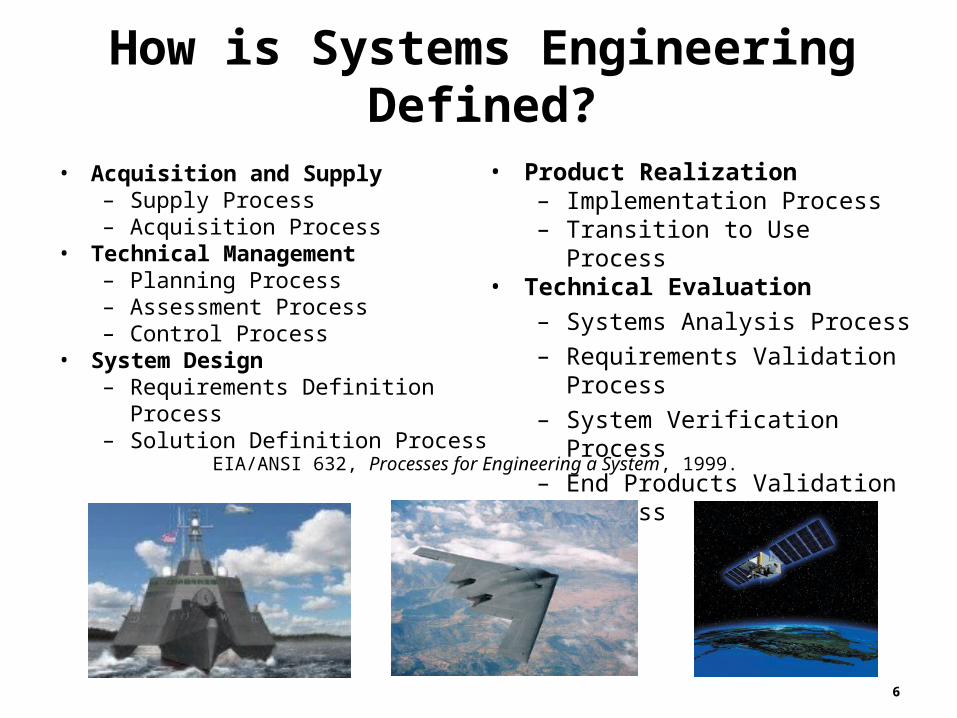
COSYSMO Scope• Addresses first four phases of the system
engineering lifecycle (per ISO/IEC 15288)
• Considers standard Systems Engineering Work Breakdown Structure tasks (per EIA/ANSI 632)
Conceptualize DevelopOper Test & Eval
Transition to Operation
Operate, Maintain, or Enhance
Replace orDismantle

9
COSYSMO
SizeDrivers
EffortMultipliers
Effort
Calibration
# Requirements# Interfaces# Scenarios# Algorithms
+3 Adj. Factors
- Application factors-8 factors
- Team factors-6 factors
COSYSMO Operational Concept

10
x
COSYSMO Model Form
14
1,,,,,, )(
jj
E
kkdkdknknkekeNS EMwwwAPM
Where: PMNS = effort in Person Months (Nominal Schedule)
A = calibration constant derived from historical project data k = {REQ, IF, ALG, SCN}wx = weight for “easy”, “nominal”, or “difficult” size driver
= quantity of “k” size driverE = represents diseconomies of scaleEM = effort multiplier for the jth cost driver. The geometric product results in an
overall effort adjustment factor to the nominal effort.
x

11
UNDERSTANDING FACTORS– Requirements understanding – Architecture understanding– Stakeholder team cohesion – Personnel experience/continuity
COMPLEXITY FACTORS– Level of service requirements– Technology Risk– # of Recursive Levels in the Design– Documentation Match to Life Cycle Needs
OPERATIONS FACTORS– # and Diversity of Installations/Platforms– Migration complexity
PEOPLE FACTORS
– Personnel/team capability
– Process capability
ENVIRONMENT FACTORS
– Multisite coordination
– Tool support
Cost Driver Clusters

12
Stakeholder team cohesion Represents a multi-attribute parameter which includes leadership, shared vision, diversity of stakeholders, approval cycles, group dynamics, IPT framework, team dynamics, trust, and amount of change in responsibilities. It further represents the heterogeneity in stakeholder community of the end users, customers, implementers, and development team.
1.5 1.22 1.00 0.81 0.65
Viewpoint Very Low Low Nominal High Very High
Culture Stakeholders with diverse expertise, task nature, language, culture, infrastructure Highly heterogeneous stakeholder communities
Heterogeneous stakeholder communitySome similarities in language and culture
Shared project culture
Strong team cohesion and project cultureMultiple similarities in language and expertise
Virtually homogeneous stakeholder communitiesInstitutionalized project culture
Compatibility Highly conflicting organizational objectives
Converging organizational objectives
Compatible organizational objectives
Clear roles & responsibilities
Strong mutual advantage to collaboration
Familiarity and trust
Lack of trust Willing to collaborate, little experience
Some familiarity and trust
Extensive successful collaboration
Very high level of familiarity and trust

Technology RiskThe maturity, readiness, and obsolescence of the technology being implemented. Immature or obsolescent technology will require more Systems Engineering effort.
Viewpoint Very Low Low Nominal High Very High
Lack of Maturity
Technology proven and widely used throughout industry
Proven through actual use and ready for widespread adoption
Proven on pilot projects and ready to roll-out for production jobs
Ready for pilot use Still in the laboratory
Lack of Readiness
Mission proven (TRL 9)
Concept qualified (TRL 8)
Concept has been demonstrated (TRL 7)
Proof of concept validated (TRL 5 & 6)
Concept defined (TRL 3 & 4)
Obsolescence
- Technology is the state-of-the-practice- Emerging technology could compete in future
- Technology is stale- New and better technology is on the horizon in the near-term
- Technology is outdated and use should be avoided in new systems- Spare parts supply is scarce

Migration complexity This cost driver rates the extent to which the legacy system affects the migration complexity, if any. Legacy system components, databases, workflows, environments, etc., may affect the new system implementation due to new technology introductions, planned upgrades, increased performance, business process reengineering, etc.
Viewpoint Nominal High Very High Extra High
Legacy contractor
Self; legacy system is well documented. Original team largely available
Self; original development team not available; most documentation available
Different contractor; limited documentation
Original contractor out of business; no documentation available
Effect of legacy system on new system
Everything is new; legacy system is completely replaced or non-existent
Migration is restricted to integration only
Migration is related to integration and development
Migration is related to integration, development, architecture and design

15
Cost Driver Rating ScalesVery Low Low Nominal High Very High
Extra High EMR
Requirements Understanding 1.87 1.37 1.00 0.77 0.60 3.12
Architecture Understanding 1.64 1.28 1.00 0.81 0.65 2.52
Level of Service Requirements 0.62 0.79 1.00 1.36 1.85 2.98
Migration Complexity 1.00 1.25 1.55 1.93 1.93
Technology Risk 0.67 0.82 1.00 1.32 1.75 2.61
Documentation 0.78 0.88 1.00 1.13 1.28 1.64
# and diversity of installations/platforms 1.00 1.23 1.52 1.87 1.87
# of recursive levels in the design 0.76 0.87 1.00 1.21 1.47 1.93
Stakeholder team cohesion 1.50 1.22 1.00 0.81 0.65 2.31
Personnel/team capability 1.50 1.22 1.00 0.81 0.65 2.31
Personnel experience/continuity 1.48 1.22 1.00 0.82 0.67 2.21
Process capability 1.47 1.21 1.00 0.88 0.77 0.68 2.16
Multisite coordination 1.39 1.18 1.00 0.90 0.80 0.72 1.93
Tool support 1.39 1.18 1.00 0.85 0.72 1.93

16
Cost Drivers Ordered by Effort Multiplier Ratio (EMR)

ISO/IEC 15288
Conceptualize DevelopTransition to
Operation
Acquisition & Supply
Technical Management
System Design
Product Realization
Technical Evaluation
Operational Test &
Evaluation
AN
SI/E
IA 6
32
Effort Profiling

18
Before Local Calibration
19
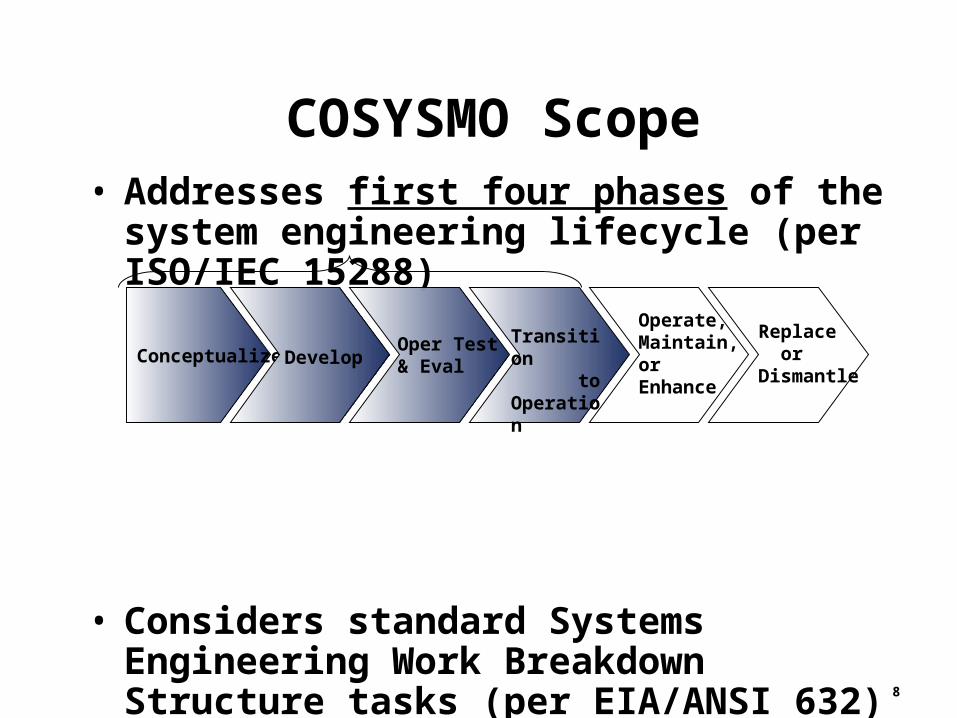
After Local Calibration

20
Prediction Accuracy
PRED(30)
PRED(25)
PRED(20)
PRED(30) = 100% PRED(25) = 57%

21
Academic prototype
Commercial Implementations
Proprietary Implementations
COSYSMO-R
SECOST
SEEMaP
ImpactAcademic Curricula
Intelligence CommunitySheppard Mullin, LLC
Policy & Contracts
Model
14
1,,,,,, )(
jj
E
kkdkdknknkekeNS EMwwwAPM
10 theses