Embed Size (px)
Citation preview


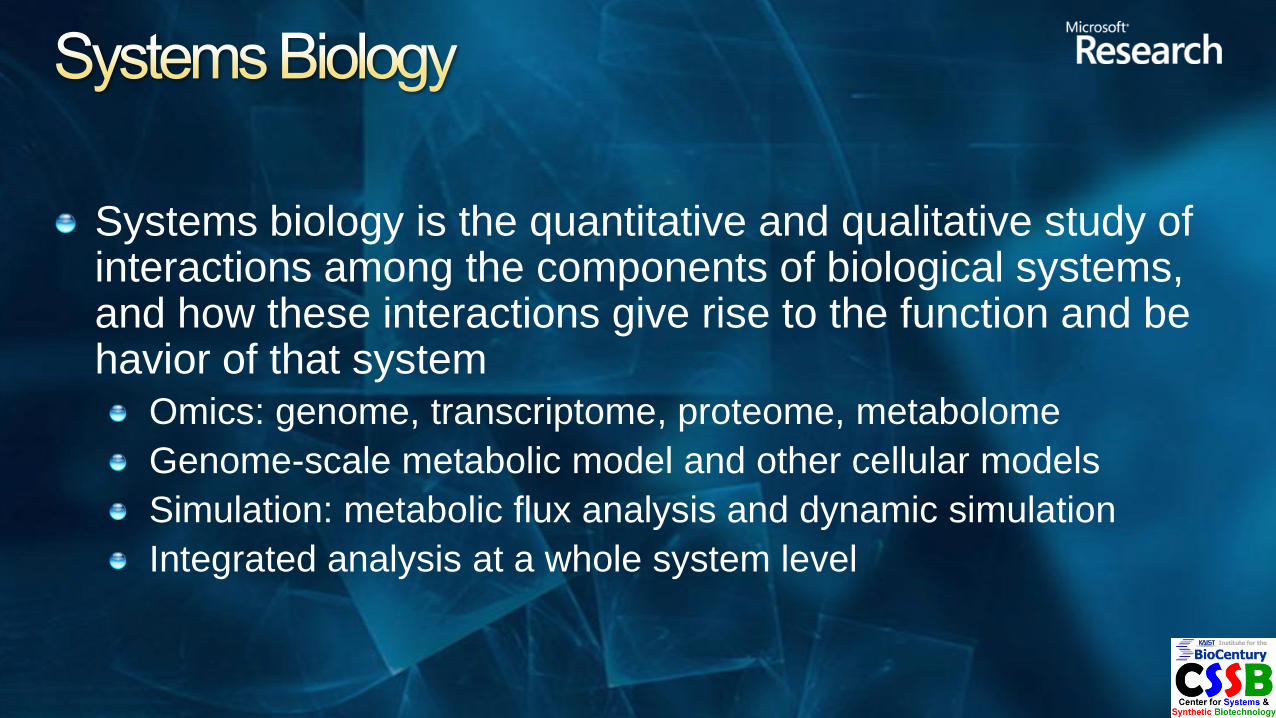
Systems biology is the quantitative and qualitative study of interactions among the components of biological systems, and how these interactions give rise to the function and behavior of that system
Omics: genome, transcriptome, proteome, metabolome
Genome-scale metabolic model and other cellular models
Simulation: metabolic flux analysis and dynamic simulation
Integrated analysis at a whole system level

X-omics data
Computational
experiments
Separation
Strain
improvement
Fermentation
Wet experiments
Regulatory
network
Metabolic
network
Signal
transduction
Virtual Cell
Medical
application
Industrial
application

White Biotechnology = Industrial Biotechnology
enabled through systems and synthetic biotechnology

Global Warming
Kyoto Protocol
Carbon tax
Environmental problems
Limited fossil resources

Sustainable system for
chemicals and materials
Current system for
chemicals and materials

Feedstock: renewable biomass
170 billion tons per year
only 6 billion tons are currently used
3.5% of this amount is used in non-food applications
170 billion tons of biomass
75% carbohydrates
20% lignin
5% others (oils, proteins, etc.)
Biorefinery BioEnergy
BioFuels
BioMaterials
BioChemicals
White Biotechnology

Carboxylic acids
Dicarboxylic acids
Alchohols
Diols
Diamines
Aromatics
Amino acids
and many others
+ Unnatural chemicals
Roche @ ExPASy

Ethanol
Diesel
Butanol/Isobutanol
Alkanes
Isoprenoids
Hydorxycarboxylic esters

Polysaccharides
Poly (amino acids)
Polyhydroxyalkanoates
Unnatural polymers
In vitro polymerization of monomers
Organic/inorganic hybrids
O*
CH
2
*
OHR
n
m


Enhanced production of metabolites and other
biologicals that are already produced by host organism
Production of modified or new metabolites and other biologicals that are new to the host organism
Broadening the substrate utilization range
Designing improved or new metabolic pathways
for degradation of various chemicals, especially xenobiotics
Modification of cell properties that facilitate bioprocessing(fermentation and product recovery)
Purposeful modification of
metabolic network to achieve… (after Jay Bailey)

S.Y.Lee

Receptors
Transcription
Factors
Ligands
Cytoplasm
Translation
processing
Intracellular
SignalingGenetic
Regulatory
NetworkmRNA
Protein
Glucose
Metabolic network
ATP
Acetate
Lactate
degradation
Complex Network of Network of Network
Networkn

Lee et al.
(2005) Trends
Biotechnol.,
23: 349-358
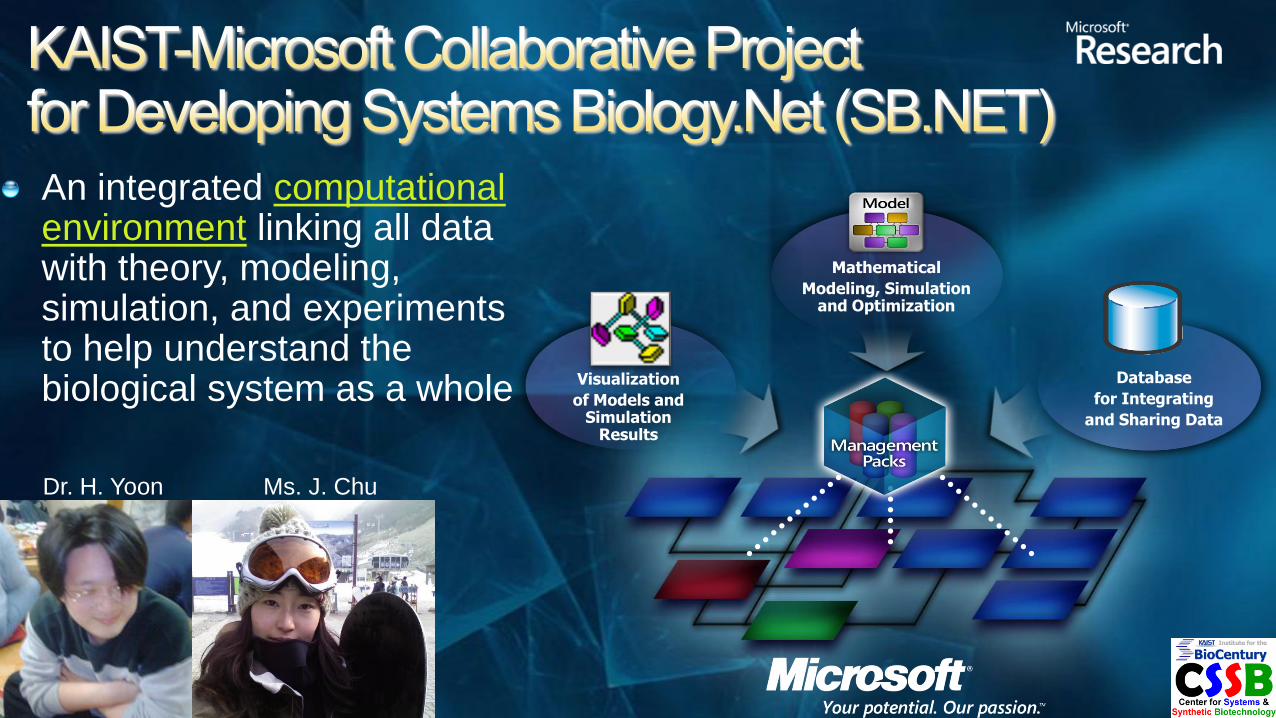
An integrated computational environment linking all data with theory, modeling, simulation, and experiments to help understand the biological system as a whole
Mathematical
Modeling, Simulation and Optimization
Database
for Integrating
and Sharing Data
Visualization
of Models and Simulation
Results
Dr. H. Yoon Ms. J. Chu


Mathematical modeling, simulation and optimizationPseudo-steady state simulation
Dynamic simulation
Hybrid simulation
Final release
Visualization of models and simulation resultsData management
Visualization of genome-scale metabolic networks
Visualization of regulatory networks
Visualization of two combined networks using 3D space
User commands
Final release

Automatic
importing
parser
DB Server
User
Public database
Integration of biochemical data
Analysis of metabolic networks
Thorough comparison of different DBs
Standardization
IntegrationenzymeSynomes
FK1,I2 ECNum
Name NameOrder
compoundIndex
PK compoundID
formula casNumber
geneIndex
PK abbreviation
Name
compoundSynomes
compoundName
FK1 compoundID nameOrder
DBLink
FK1 ECNum
linkType linkCode Description
enzymeGenes
FK1 ECNum
FK2,I2 abbreviation gene
enzymeIndex
PK ECNum
I1 name comment reversible
enzymePathways
path
FK1 ECNum pathName
enzymeReactions
FK2 ECNum
FK1 compoundID reactionType reactionOrder stoiNum
Global
Schema
Construction of reaction models
Estimation of flux distributions
Validation of metabolic networks
Metabolic behavior in response to genetic and/or
environmental modifications
Visualization of metabolic networks
DB Query
Modeling
Tool
MFA
Visualization
Dynamic
Simulation
Other software programs
MFAML

Biochemical Reactions
Stoichiometry
Cofactors
Reversibility
Biomass
ATP requirement
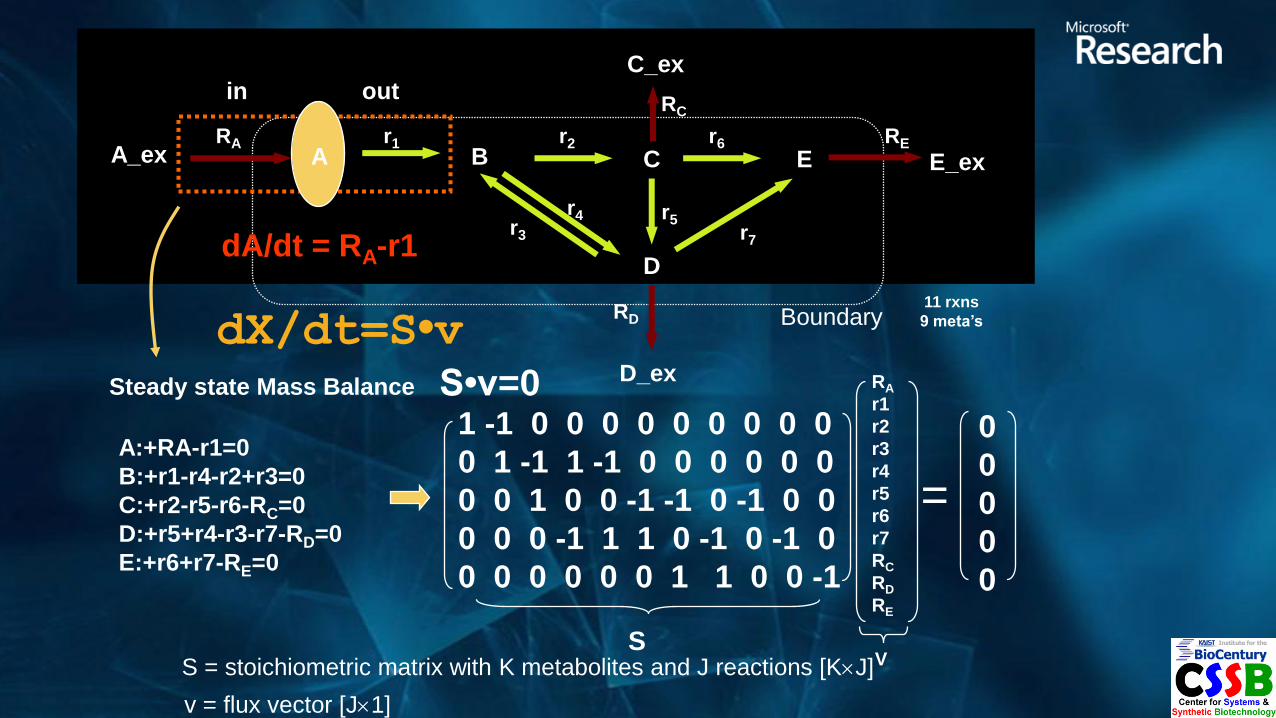
RE
Boundary
B C ERA r1 r2
r3
D
r4 r5
r6
r7
RD
RC
A_ex E_ex
C_exin out
A
Steady state Mass Balance
A:+RA-r1=0
B:+r1-r4-r2+r3=0
C:+r2-r5-r6-RC=0
D:+r5+r4-r3-r7-RD=0
E:+r6+r7-RE=0
D_ex
V
0
0
0
0
0
=
S
1 -1 0 0 0 0 0 0 0 0 0
0 1 -1 1 -1 0 0 0 0 0 0
0 0 1 0 0 -1 -1 0 -1 0 0
0 0 0 -1 1 1 0 -1 0 -1 0
0 0 0 0 0 0 1 1 0 0 -1
S•v=0 RA
r1
r2
r3
r4
r5
r6
r7
RC
RD
RE
S = stoichiometric matrix with K metabolites and J reactions [KJ]
v = flux vector [J1]
11 rxns
9 meta’sdX/dt=S•v
dA/dt = RA-r1

Transport flux
Stochiometric matrix(constraints)
Optimization Experimentalparameters
Graphical visualization
Analysis
Input
Output
Metabolic reactions
Objectivefunction

Integrated computational environment for modeling and simulation of the genome-scale metabolic model
User
DB Server
Model
Manager
Database Manager
ADO. Net
G
U
I
File Manager
LibSBMLLibMFAML
XML
Analysis
Manager
Microsoft Solver
Foundation
OML Builder
Network
Manager
Network Editor

Food and animal feed
Medical care
Sports
Health care Beauty care
Amino acid
Val, Leu, Ile : effective in hepatic failure
Glu : antiulcer drug
Arg : immune-enhancing effect
Val, Leu, Ile : Muscle building, increase of stamina, recovery from fatigue
The skin moisturizing effect
Collagen composition
Care of damaged cuticles
Efficient burning of body fat
Platform chemicals

acetohydroxy acid
Synthase I, II, III
acetohydroxy acid
isomeroreductase
dihydroxy acid
dehydratase
branched chain
amino acid
aminotransferase
ilvGMEDAx
Jin Hwan Park

ilvGMEDAPtac
Ptac
41th G A
50th C T
thr dehydratase
2-isopropylmalate
synthase3-methyl-2-oxobutanoate
hydroxymethyltransferase
Auxotrophic
2 mM Leu
2 mM Ile
1.5 mM pantoth
X X
XBase strain
Val {W3110(attilvG::ptac,
attilvB::ptac, ilvHA41G, C50T, ΔlacI,
ΔilvA, ΔleuA, ΔpanB)}
harboring pKKilvBN
DlacI

▶ 1.31 g/L L-valine
by batch fermentation
Val : W3110(attilvG::ptac, attilvB::ptac, ilvHA41G, C50T, ΔlacI, ΔilvA, ΔleuA, ΔpanB), pKKilvBN
Control : W3110 (ΔlacI, pKK223-3)
Medium NM1, Glucose (20 g/L), L-leucine (2mM), L-isoleucine (2mM), D-pantothenate (1.5μM)
Condition 31C, pH 6.0
Time (hr)
0 5 10 15 20
Cel
l gro
wth
(O
D6
00)
0
5
10
15
20
25
30
L-v
ali
ne
(g/l
iter
)
0.0
0.5
1.0
1.5
2.0
2.5
3.0
Jin Hwan Park

gene enzyme chip data
ilvB acetohydroxy acid
synthase
isoenzyme I
54.46
ilvN acetohydroxy acid
synthase
isoenzyme I
32.50
ilvC acetohydroxy acid
isomeroreductase3.74
ilvD dihydroxy acid
dehydratase4.28
ilvE branched chain
amino acid
aminotransferase
1.32
Relative expression level of L-valine
biosynthetic pathway genes
Co-amplification of the ilvCED genes in pKKilvBN
Increased L-valine production (1.31 3.43 g/L)
Val+pKKilvBN Val+pKKilvBNCED
L-v
ali
ne
(g/L
)
0
1
2
3
4

36.2% decrease (3.732.38 g/L) in L-valine production with lrp deletion
L-v
ali
ne
con
cen
tra
tio
n (
g/L
)
0
1
2
3
4
5
Val+
pK
BR
ilvB
NC
ED
+p
Trc
18
4
Va
l+p
KB
Ril
vB
NC
ED
Va
l+p
KB
Ril
vB
NC
ED
+p
Trc
18
4lr
p
Va
l (Δ
lrp
)+
pK
BR
ilvB
NC
ED
Enhanced production of L-valine by overexpression of lrp
pTrc184lrp
CM(R)
lrp5S
rrnBT1T2 pTrc
P15A ORI
21.6% increase (3.574.34 g/L) in L-valine production with lrp overexpression
Lrp plays an important role in L-valine production
Leucine responsive protein: Lrp Downregulated (ratio: 0.52)

Identification of the E. coli gene homologous to Corynebacterium glutamicum brnF
L-valine exporter in E. coli ?
YgaZH: hypothetical protein
Downregulated to 0.61-0.75 during Val production
Exporter
Engineering

L-v
ali
ne
(g/L
)
0
2
4
6
8113% (3.577.61 g/L)
Synergistic effect of ygaZH and lrp on L-valine production
pTrc184ygaZHlrp
CM(R)
ygaZH5S
rrnBT1T2
lrp
Ptrc
P15A ORI
21.6%
47.1%V
al+
pK
BR
ilvB
N
CE
D+
pT
rc1
84
Va
l+p
KB
Ril
vB
NC
ED
+p
Trc
18
4lr
p
Va
l+p
KB
Ril
vB
NC
ED
+p
Trc
18
4yg
aZ
H
Va
l+p
KB
Ril
vB
NC
ED
+p
Trc
18
4yg
aZ
Hlr
p
pTrc184ygaZH
CM(R)
ygaZH5S
rrnBT1T2Ptrc
P15A ORI
pTrc184lrp
CM(R)
lrp5S
rrnBT1T2 pTrc
P15A ORI
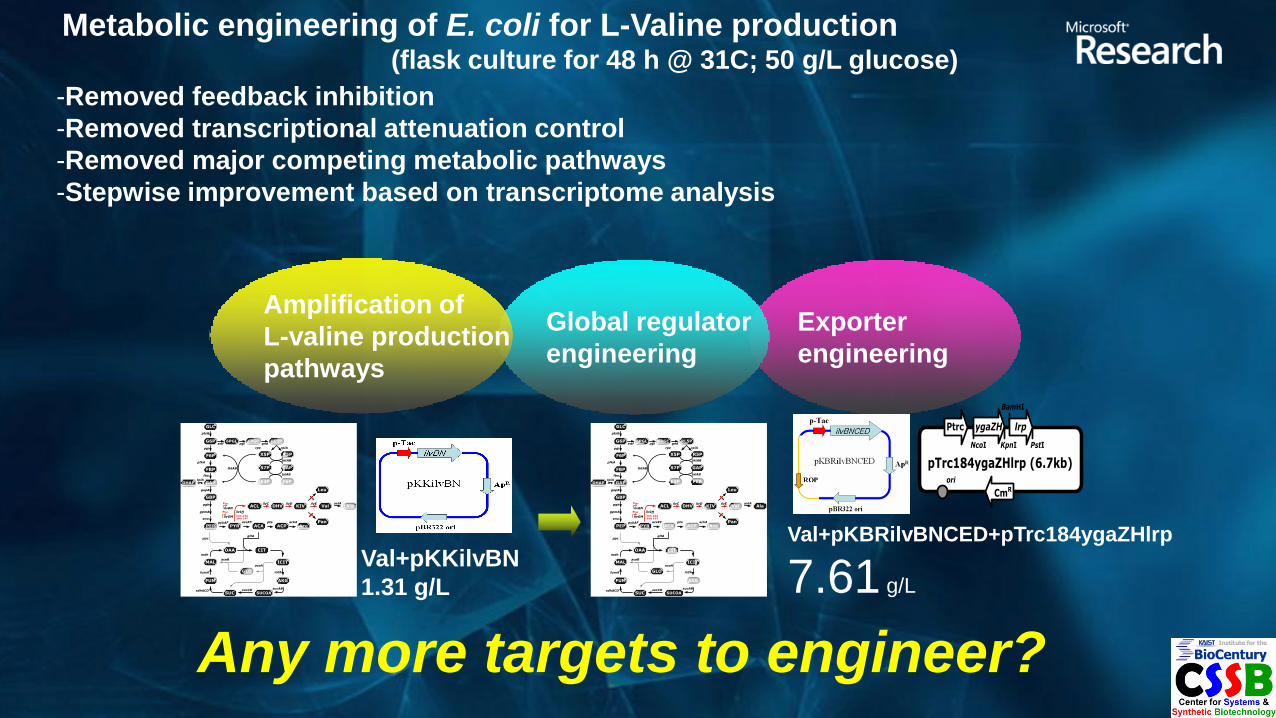
Any more targets to engineer?
-Removed feedback inhibition
-Removed transcriptional attenuation control
-Removed major competing metabolic pathways
-Stepwise improvement based on transcriptome analysis
Metabolic engineering of E. coli for L-Valine production(flask culture for 48 h @ 31C; 50 g/L glucose)
Val+pKKilvBN
1.31 g/L
Exporter
engineering
Global regulator
engineering
Amplification of
L-valine production
pathways
GLC
G6P
F6P
GAP
GBP
PEP PYR
OAA
RL5P
X5P
CIT
ICIT
AKG
SUCOASUC
FUM
MAL
ACA ACP
GLO
ACL KIV Val
Leu
Pan
ilvGM
ilvIH
ilvBNDHV
ilvC ilvD ilvE
ptsG
pgi
pykAF aceEF
gltA
icdA
sucABsucCDsdhACD
fumA
mdh
aceA
aceB
pta ackA
DHAP
6PGL 6PGC
R5P
S7P GAP
E4P F6P
ppc
fba
tpiA
gapA
eno
zwf gndpgl
tktAB
Ace
AlaavtA
rpiA
talAB
tktAB
rpe
pfkA
pgk
gpmA
FBP
Ptac
Ptac
41th GA 50th CT
Val+pKBRilvBNCED+pTrc184ygaZHlrp
7.61 g/L
Ptrc
pTrc184ygaZHlrp (6.7kb)ori
NcoI KpnI
ygaZH
CmR
lrp
BamHI
PstI

Roche @ ExPASy
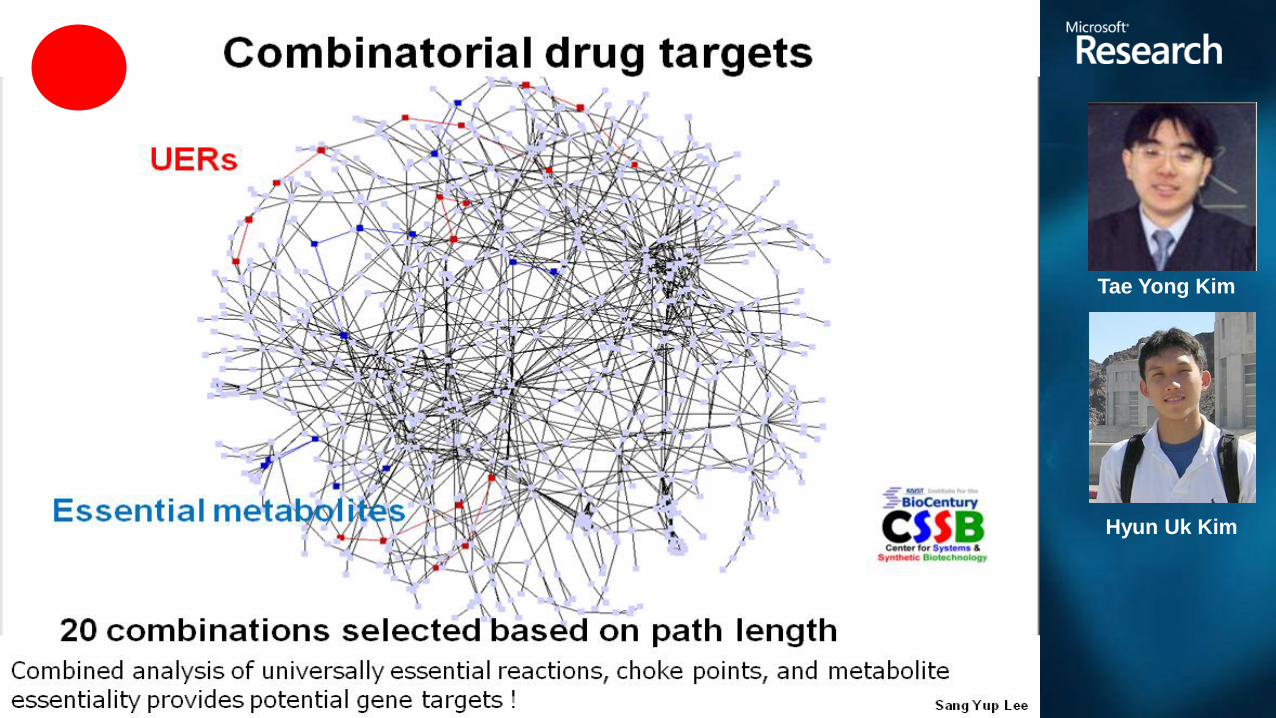
Combinatorial gene knockout
1000C2 = 499,500
1000C3 = 166,167,000
1000C4 = 41,417,124,750...
Genome-scale metabolic flux analysis
to identify new gene-deletion targets


Tae Yong Kim
Single knockout Double knockout

In silico triple gene knockout
Tae Yong Kim
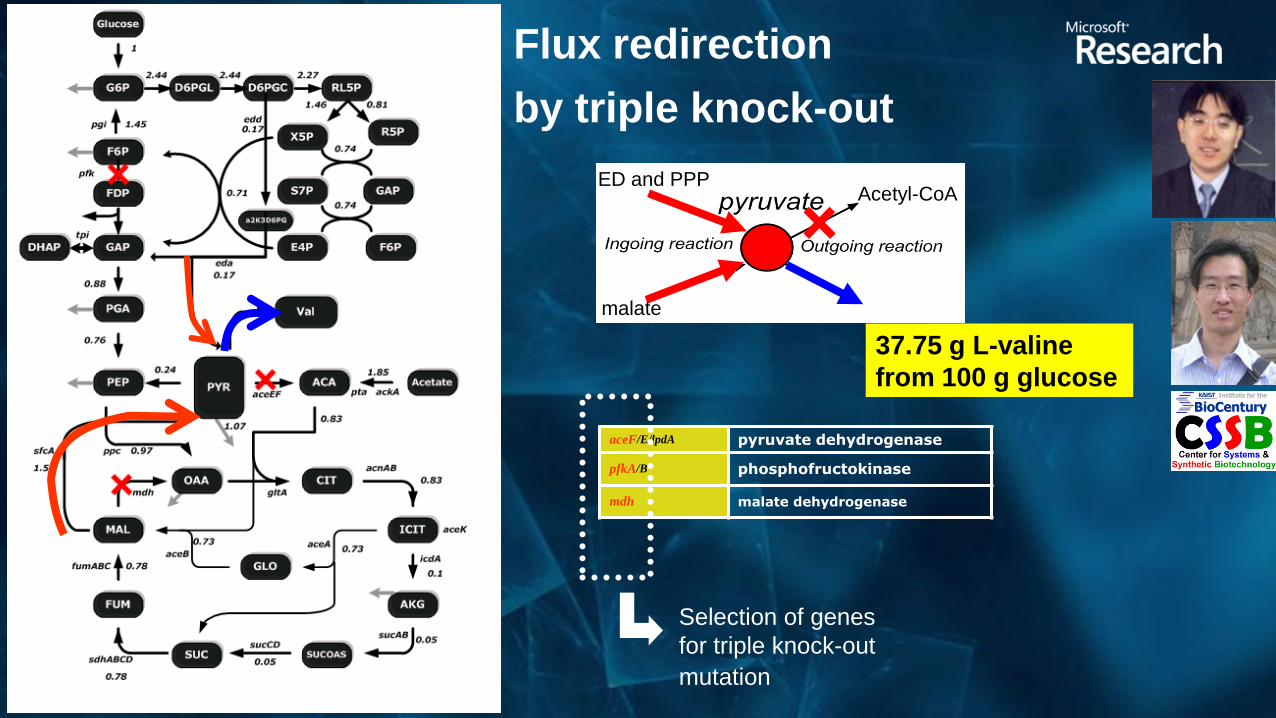
Acetyl-CoA
malate
ED and PPP
aceF/E/lpdA pyruvate dehydrogenase
pfkA/B phosphofructokinase
mdh malate dehydrogenase
Flux redirection
by triple knock-out
Selection of genes
for triple knock-out
mutation
37.75 g L-valine
from 100 g glucose

pTrc184ygaZH
CM(R)
ygaZH5S
rrnBT1T2Ptrc
P15A ORI
Glucose
G6P
F6P
G3P
PGA
PEP PYR
OAA
RL5P
X5P
CIT
ICIT
AKG
SUCOASSUC
FUM
MAL
ACA Ace-P
GLO
Aclac Kival Val
Leu
Pan
ilvBN, ilvGM, ilvIH
DhivalilvC ilvD ilvE
ptsG
pgi
pykAF aceEF
gltA
acnAB
icdA
sucABsucCDsdhABCD
fumA
mdh
aceA
aceB aceK
pta ackA
DHAP
D6PGL D6PGC
R5P
S7P GAP
E4P F6P
ppc
fbatpiA
gapA
eno
zwf gndpgl
tktAB
Ace
rpiA
talAB
tktAB
rpe
leuA
panB
F16P
pfkAB
L-valine
overproducer
L-Threonine
Ketobutyrate
Acetolactate
Ketoisovalerate
L-ValineL-Leucine Pantothenate
Dihydroxyisovalerate
Pyruvate
Pyruvate
Acetohydroxybutyrate
L-Isoleucine
ilvA
leuA panB
ilvBN ilvGM ilvIH
ilvC
ilvD
ilvE
ilvC
ilvD
ilvE
ilvBN, ilvGM, ilvIH
leuCD
leuB
ilvE tyrB
panE
panC
Systems metabolic engineering of E. coli for L-valine production
pTrc184lrp
CM(R)
lrp5S
rrnBT1T2 pTrc
P15A ORI
Replacement of
attenuator with tac
promoter
Removal of feedback inhibition
Transcriptome
analysis
In silico knock-out
simulation
E. coli W3110
Base strain
Lrp
+
+_
Power of
Systems
Metabolic
Engineering

regulation
threonine
efflux
central
carbon flux
degradation
branched
pathway
biosynthetic
pathway
byproduct
Kwang Ho Lee

Time (h)
0 2 4 6 8 10 12 14
Glu
co
se
(g
/l)
0
2
4
6
8
10
Bio
ma
ss
(g
/l)
0
1
2
3
4
5
6
7
L-t
hre
on
ine
, o
rga
nic
ac
ids
(g
/l)
0.0
0.5
1.0
1.5
2.0
TH07 (pBRThrABC, pACYC-ppc)
(ppc amplified strain)
PPC
sp
ecif
ic a
cti
vit
y o
f P
PC
(U
/mg
pro
tein
)
0
50
100
150
200
250
300
350
ICL
sp
ecif
ic a
cti
vit
y o
f IC
L (
U/m
g p
rote
in)
0
2
4
6
8
10
12
14
16
18
20
control control
ppc
-amplified
ppc
-deleted
32.0
298.4
1.72.2
5.3
ppc
-amplifiedppc
-deleted
Enzyme assay
9.3 fold ↑
Time (h)
0 2 4 6 8 10 12 14
Glu
co
se
(g
/l)
0
2
4
6
8
10
Bio
ma
ss
(g
/l)
0
1
2
3
4
5
6
7
L-t
hre
on
ine
, o
rga
nic
ac
ids
(g
/l)
0.0
0.5
1.0
1.5
2.0
1.46g/l
TH07 (pBRThrABC, pACYC177)
(control strain)
glucose
Biomass
L-Thr
pyruvate
acetate
succinate
1.21g/l
Time (h)
0 5 10 15 20
Glu
co
se
(g
/l)
0
2
4
6
8
10
Bio
ma
ss
(g
/l)
0
1
2
3
4
5
6
7
L-t
hre
on
ine
, o
rga
nic
ac
ids
(g
/l)
0.0
0.5
1.0
1.5
2.0
TH11C (pBRThrABC, pACYC177)
(ppc deleted strain)
0.19g/l

the flux of PPC is presented in the < 4 mmol/gDCW/h
in aerobic condition (Fisher et al., Anal. Chem. 2004)
biomass
Genome-scale metabolic model
E. coli MBEL979
Tae Yong Kim
Hyun Uk Kim

aspartate
threonine
homoserine phosphate
homoserinemethionine
lysineaspartate semialdehyde
aspartyl phosphate
(aspartokinase I, II, III)
(threonine synthase)
(homoserine kinase)
(homoserine dehydrogenase I, II)
(aspartate semialdehyde dehydrogenase)
thrA metL lysC
asd
thrAmetL
thrC
thrB
isoleucine
thrABC
Replacement of attenuator
with tac promoter
Removal of feedback
inhibition
1034th CT
1055th CT
Thr
GLC
G6P
F6P
GAP
GBP
PEP PYR
OAA
RL5P
X5P
CIT
ICIT
AKG
SUCOASUC
FUM
MAL
ACA ACP
GLO
ptsG
pgi
pykAF aceEF
gltA
icdA
sucABsucCDsdhACD
fumA
mdh
aceA
aceB
pta ackA
DHAP
6PGL 6PGC
R5P
S7P GAP
E4P F6P
ppc
fba
tpiA
gapA
eno
zwf gndpgl
tktAB
Ace
rpiA
talAB
tktAB
rpe
pfkA
pgk
gpmA
FBP
ppc
aceBA
iclR
_
rhtABC
acs
tdcC
ΔlacI
tdhglycine
isoleucineilvA
290th CT
Transcriptome analysis & in silico flux
response analysisBase strainPtrc
acs
Ptac
Systems metabolic engineering of E. coli for the production of L-threonine

THE28C
Time (h)
0 5 10 15 20 25 30 35 40 45 50 55
Glu
co
se
, L
-th
reo
nin
e (
g/l
), c
ell
gro
wth
(O
D6
00)
0
10
20
30
40
50
60
70
80
90
100
L-a
ce
tate
, L
-la
cta
te (
g/l
)0
2
4
6
8
10
12
14
16
18
20
OD600
Glucose
L-threonine
L-acetate
L-lactate
82.4 g/l
L-Thr Kwang Ho Lee

Park et al. 2008. Trends
Biotechnol 26: 404-412
Moving towards
genome-scale synthetic biology
“systems metabolic engineering”

Specialty
chemicals
Bioenergy
Ethanol
H2
DieselVitamins
Amino
acidsCommodity
chemicals
Biopolymers
Plastics
Elastomers
Fermentation and
midstream
processing
Biosepration and
downstream
processing
Metabolic engineering/
Cellular engineering
BiotechnologyWhite
Chiral
chemicals
Systems biotechnology
Systems metabolic engineering
Sustainable system for
chemicals, fuels and materials
Green Growth

Red Biotechnology
enabled through systems biotechnology


Multiple
enzymes?


X
X
X
X
X
X
XX X
X
X
X
X
X
X
X
X
X
X
X
X
X
Single gene deletion tests
reaction flux (j) = 0
if biomass = 0
then, reaction flux (j) = primary drug target candidate

R1
C
R2 +1
-1
-2R3
XX
Kim et al. PNAS 104:13638 (Aug 2007)
In collaboration with Prof. H. Jeong, KAIST
From gene knockout to
metabolite knockout ?

Tae Yong Kim
Hyun Uk Kim
Tae Yong Kim
Hyun Uk Kim
Systems biology allows systems-level understanding of cellular and metabolic characteristics
Systems biotechnology allows development of bioprocesses that are much more efficient than those developed by traditional strategies
Systems biological analysis of cellular network allows identification of new targets for treatment
KAIST-Microsoft Collaborative Research Project on SB.NET provides a computational platform for systems-level studies

Ministry of Education, Science & TechnologyKorean Systems Biology Research
Genome-based Integrated Bioprocess Development
BK21 Program
WCU Program
SB.NET teamDr. Hongseok Yoon Dr. Tae Yong Kim Dr. Jin Hwan Park Mr. Hyun Uk Kim
Mr. Jong Myung Park Mr. Seung Bum Sohn Ms. Jung Suk Chu Mr. Jung Ho Park

http://mbel.kaist.ac.kr Thank you !

© 2009 Microsoft Corporation. All rights reserved. Microsoft, Windows, Windows Vista and other product names are or may be registered trademarks and/or trademarks in the U.S. and/or other countries. The information herein is for informational purposes only and represents the
current view of Microsoft Corporation as of the date of this presentation. Because Microsoft must respond to changing market conditions, it should not be interpreted to be a commitment on the part of Microsoft, and Microsoft cannot guarantee the accuracy of any information
provided after the date of this presentation. MICROSOFT MAKES NO WARRANTIES, EXPRESS, IMPLIED OR STATUTORY, AS TO THE INFORMATION IN THIS PRESENTATION.