Embed Size (px)
Citation preview

Phonon-Plasmon Interaction in Metal-Insulator-Metal Localized Surface PlasmonSystems
Abdelali Mrabti, Gaëtan Lévêque, Abdellatif Akjouj, Yan Pennec, and Bahram Djafari-RouhaniInstitut d’Electronique, de Micro-électronique et de Nanotechnologie (IEMN,
CNRS-8520), Cité Scientifique, Avenue Poincaré, 59652 Villeneuve d’Ascq, France
Rana NicolasLIDYL, CEA, CNRS, Université Paris-Saclay, 91191 Gif-Sur-Yvette, France
Thomas Maurer and Pierre-Michel AdamLaboratory of Nanotechnology and Optical Instrumentation,UMR 6281 STMR, Technological University of Troyes,
12 Rue Marie Curie, CS 42060, 10004 Troyes Cedex, France
We investigate theoretically and numerically the coupling between elastic and localized surfaceplasmon modes in a system of gold nanocylinders separated from a thin gold film by a dielectricspacer of few nanometers thickness. That system supports plasmon modes confined in betweenthe bottom of the nanocylinder and the top of the gold film, which arise from the formation ofinterference patterns by short-wavelength metal-insulator-metal propagating plasmon. First wepresent the plasmonic properties of the system though computer-simulated extinction spectra andfield maps associated to the different optical modes. Next a simple analytical model is introduced,which allows to correctly reproduce the shape and wavelengths of the plasmon modes. This model isused to investigate the efficiency of the coupling between an elastic deformation and the plasmonicmodes. In the last part of the paper, we present the full numerical simulations of the phononicproperties of the system, and then compute the acousto-plasmonic coupling between the differentplasmon modes and five acoustic modes of very different shape. The efficiency of the coupling isassessed first by evaluating the modulation of the resonance wavelength, which allows comparisonwith the analytical model, and finally in term of time-modulation of the transmission spectra onthe full visible range, computed for realistic values of the deformation of the nanoparticle.
INTRODUCTION
Surface plasmons, which are optical modes supportedby metal nanoparticles, have been thoroughly investi-gated for few decades due to their fascinating abilitiesto confine and enhance electromagnetic field in very sub-wavelength volumes [1], at specific wavelengths ruled bythe shape of the particle and its nearby environment.For those reasons, nanoscale-engineered systems have alarge number of applications in domains like biosens-ing [2–4], enhanced-Raman spectroscopy [5], metamateri-als [6], photo-thermal therapy [7], and plasmomechanics[8]. Particularly interesting are systems composed of asmall ensemble of closely-coupled metal particles, or ofmetal films interacting with one or several metal par-ticles placed a few nanometers away [9, 10]. In thoseregimes, the localized plasmons modes become very sen-sitive to a variation in length well below the nanometer.In case of extended contact area between a metal film anda metal particle (nanocubes, nanocylinders...), particularmodes form where light is concentrated in between thetwo flat metal surfaces, with complex field distributionresulting from the interference of propagating plasmonsconstrained to move in between the particle and the film[11, 12]. The characteristic of the obtained modes willstrongly depend on the thickness of the spacer layer andthe shape of the cavity where the light is trapped.
Besides, surface plasmons have been investigated sincethe middle of the 90s for their sensitivity to mechani-cal oscillations sustained by metal nanoparticles. Theacousto-plasmonic interaction is generally investigatedby pump-probe experiments [13, 14], where a wealth ofphenomena are involved from the excitation of the metalparticle by a laser pulse until it is back to equilibrium [15–17], or by Raman spectroscopy [18, 19]. Beside their fun-damental interest for the understanding of electronic andmechanical properties of metal nanosytems, these studiesmay have possible applications to mass sensing [20, 21]. Ifthe coupling between surface plasmon modes and the me-chanical oscillations sustained by metal nanosytems havebeen studied for a wide range of particle’s shapes (spheres[22], cubes [23], rods [24–27], columns [28], antenna [29],crosses [30]), investigations of system composed of inter-acting metal particle and metal film are still lacking, tothe best of our knowledge.
The purpose of this paper is to investigate the acousto-plasmonic properties of a system made of an array ofnanocylinders deposited on a substrate consisting in athin (few nanometers thick) dielectric layer overcoat-ing a gold film. It has been previously shown byus that such a coupled particle-substrate system sup-ports so-called metal-insulator-metal localized-surface-plasmon modes where the light is essentially enhancedin between the cylinder and the metal film [12]. We will
arX
iv:1
606.
0020
4v1
[ph
ysic
s.op
tics]
1 J
un 2
016

2
see that the confinement of those modes in that portionof the spacer makes them very sensitive to deformation ofthat volume specifically. In the next section, we summa-rize the plasmonic properties of the system by presentingnumerical extinction spectra together with electric fielddistributions. In the following section, we introduce asimple analytical model which allows to derive a closed-form expression giving the wavelengths of the plasmonmodes as a function of the shape parameters of the por-tion of the spacer directly lying under the nanocylinder,and use that model to investigate the wavelength shiftof plasmonic modes under different kind of deformation.In the final section, we present the full numerical simula-tions of the phononic properties of the same system andof the acousto-plasmonic interaction. We focus particu-larly on five elastic modes for which the elastic energy isessentially confined in or close to the nanocylinder. Weshow that a significant modulation of the transmissionspectrum around the resonance wavelengths of the plas-mons modes can be obtained, attributed to the particularsensitivity of the MIM-plasmon modes to the geometryof the cavity ; an application to pump-probe experimentis finally discussed.
PLASMONIC PROPERTIES
The investigated system is presented in Fig. 1, andconsists in a square array of gold nanocylinders (AuNCs)deposited on a multilayered membrane composed of goldand silica. In the whole paper, the AuNCs have a radiusR = 100 nm and a height hp = 50 nm, the silica spaceris e = 6 nm thick and has a refractive index of 1.5, thegold film is hf = 50 nm thick, and lies on a H = 144nm-thick membrane of silica. The period is a = 300nm. The refractive index data for gold are from Johnsonand Christy [31]. The grating is illuminated in normalincidence from the z > 0 half space, the electric fieldbeing taken parallel to the x-axis.
Figure 2 shows the extinction spectrum 1 − T/T0,where T is the transmission through the grating (mem-brane+AuNCs) while T0 is the transmission throughthe membrane alone (without the AuNCs), and the ab-sorbance spectrum computed using Qe/(ε0cE2
0a2), where
Qe is the power losses inside the nanocylinder and E0 theamplitude of the incident electric field. For that simula-tion, a commercial finite element program has been used(Comsol). Three resonances appear, whose electric fielddistributions in the polarization (Oxz) plane and in a xy-plane just under the bottom of the AuNCs are indicatedon the right side of Fig.2. The short wavelength mode(labeled (1), λ = 525 nm) corresponds to a dipolar modelocalized on the top-edge of the nanocylinder, which hasbeen observed both experimentally and theoretically inseveral systems made of flatten nanoparticles coupled tosubstrates [4, 9, 32]. Let us notice that very little light is
D=2R
hp
hf
e
zy
x
H
z
xy
O
FIG. 1. Geometry of the system and cross-section view indi-cating the shape parameters of the nanocylinder and of themembrane. The structure is optically excited by a plane wavein normal incidence on the AuNCs, linearly polarized alongthe x-axis. The point O is the center of the bottom face ofthe AuNC.
confined in the spacer directly under the nanoparticle.
(1)
(2)
(3)
1-T
/T0
0.5
0.6
0.7
0.8
0.9
Ab
sorb
ance
0
0.1
0.2
0.3
λ (nm)500 600 700 800 900
(1)
(2)
(3)
maxmin
FIG. 2. Extinction (black line) and absorbance (red line)spectra of the system depicted in Fig. 1. The absorbance iscomputed inside the nanocylinder using Qe/(ε0cE2
0a2), where
Qe is the power losses inside the nanocylinder and E0 the am-plitude of the incident electric field. The three field maps showthe distribution of the complex electric field amplitude (colormap) and the real part of the electric field (green arrows) forthe three main resonances appearing in the spectrum.
This mode has been shown to be highly sensitive torefractive index changes is the superstrate, mostly dueto the field enhancement at the top edge of the AuNCs.The two other modes ((2), λ = 615 nm, and (3), λ = 750nm) are of very different nature: they correspond indeedto two so-called metal-insulator-metal localized-surface-plasmon (MIM-LSP) modes localized in the cavity in be-tween the bottom of the nanoparticle and the top of thegold film. That cavity plays an important role in the for-mation of those modes, and will be called MIM-cavity inthe following. As we will see in the following, those modesresult from the formation of interference patterns in theMIM-cavity where propagating plasmons are excited byscattering of the incident plane wave.

3
ANALYTICAL MODEL
Prior to any further numerical simulations, we presenta simple analytical model which allows us to explain theformation of the MIM-LSP modes. Beside giving a goodagreement of their resonance wavelengths and shape withthe full numerical simulation, that model allows to simplyassess the efficiency of the coupling between elastic andplasmonic modes.
Model of the MIM-LSP
The MIM-LSP modes supported by the investigatedstructure essentially result from the formation of res-onant patterns within the circular MIM-cavity locatedin between the particle and the gold film, and limitedtransversally by the external circular edge of the bottomof the nanocylinder. Those resonant patterns originatein the modal superposition of propagative plasmons con-strained to move under the bottom of the nanocylinder.
nef
f
0
10
20
30
e (nm)1 10
(c)
(d)
(b)
40
50
λ = 600 nmλ = 640 nmλ = 700 nm
(a)
k 0, n
m-1
0.007
0.008
0.009
0.01
qpl, nm-1
0 0.02 0.04 0.06 0.08
qpl
(1,1)
(2,1)
(0,1)
(1,2)(0,2)(1,3)
2
3
max
min
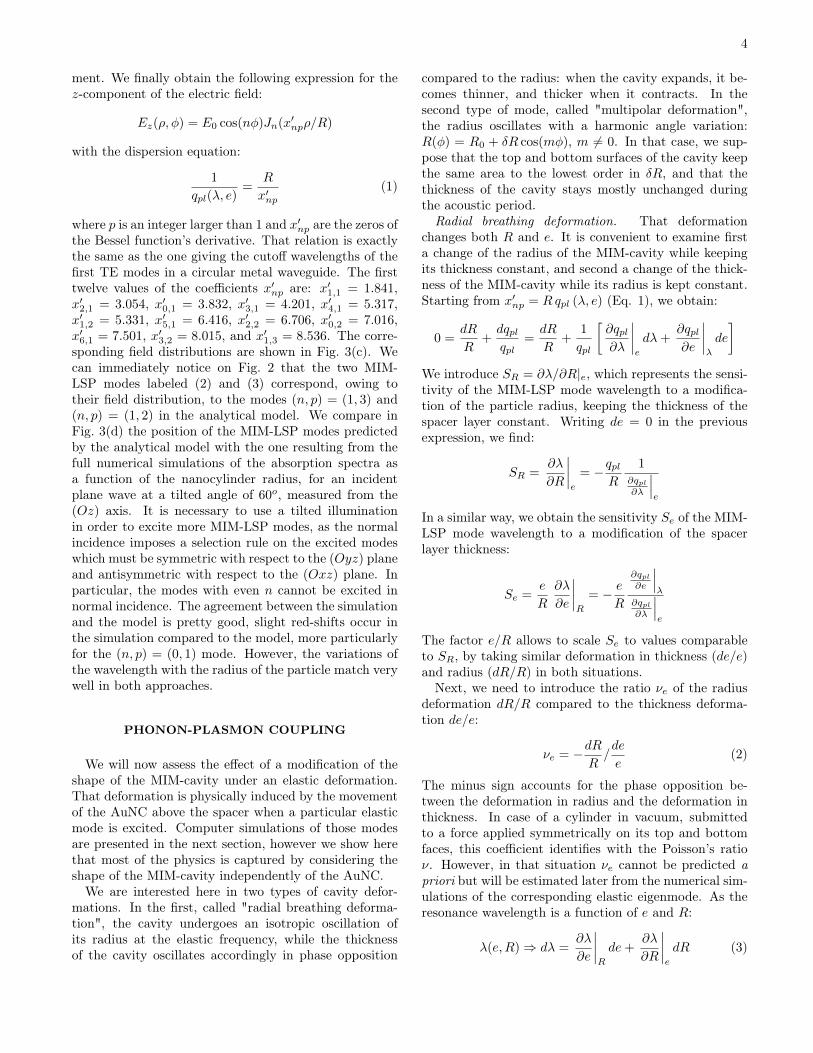
FIG. 3. (a) black line: dispersion curve ofthe MIM-PSP supported by a structure made ofair/Au(50nm)/SiO2(6nm)/Au(50nm)/SiO2(144nm)/air;red line: light line in silica ; (b) evolution of the effectiveindex neff = qpl/k0 for three wavelengths as a function ofthe spacer thickness (logarithmic scale) ; (c) distribution offield for the twelve first modes as predicted by the analyticalmodel ; (d) comparison between the resonance wavelengthsfor the MIM-LSP modes predicted by the analytical modeland the full numerical simulation (Green’s function method)of the absorption spectra computed as a function of theAuNC’s radius for a tilted incidence angle (θ = π/3).
Let us suppose first that the particle hasan infinite diameter: the system reduces thento an unidimensional system composed ofair/Au(50nm)/SiO2(6nm)/Au(50nm)/SiO2(144nm)/air.It supports MIM propagative-surface-plasmon modes(MIM-PSP) whose wavevector qpl(ω, e) depends bothon the spacer thickness e and the angular frequencyω = k0c = 2πc/λ, where c is the speed of light in thevacuum. The corresponding dispersion curve is plottedin Fig. 3(a) for e = 6nm. Notice that only the dispersioncurve of the MIM-PSP has been plotted, but the systemsupports several other modes (guided modes inside thespacer and propagative plasmons on the top and bottommetal surface of the membrane). For that geometry, theeffective index is neff = qpl/k0 ≈ 8.32 for a wavelengthin vacuum of λ = 2π/k0 = 600 nm, which correspondsto a mode wavelength of about 2π/qpl = 72 nm alongthe interface. Hence the MIM-PSP mode has a typicallength scale comparable to the nanocylinder diameter,which explains why those propagative waves can formresonant patterns on a surface with very sub-wavelengthsize. As indicated on Fig. 3(b), the effective index isstrongly dependent of the spacer layer thickness, andincreases, for a given wavelength, when the spacer isthinner.
From the numerical evaluation of qpl as a function ofthe frequency for a given thickness e, the wavelengthsand the shapes of the MIM-LSP modes can be sim-ply explained by describing them as a linear superpo-sition of MIM-PSP propagating in different directions(given by the direction of qpl) under the nanoparticle.Such a superposition necessarily obeys the wave equation∆‖Eα − q2plEα = 0, where ∆‖ = ∂2/∂x2 + ∂2/∂y2 andα = x, y, z. Let us notice that the wavevector qpl still de-pends both on the angular frequency of light ω and on thespacer thickness e, but those variables have been hiddenfor clarity. The solutions of that equation in polar co-ordinates (ρ, φ) are of the form Eα = A cos(nφ)Jn(qplρ),where A is an amplitude factor, and Jn the Bessel func-tion of first kind and of integer order n. Rigorously speak-ing, A depends on z, but this dependency is very weakin the spacer layer (see profile of the mode in the inset ofFig. 3(a)) and will be neglected in the following. In orderto find the values taken by qpl, and then the wavelengthsλ, for each MIM-LSP mode, a proper boundary condi-tion must be applied at the edge of the cavity, in ρ = R.As a simple rule, we notice that plasmonic modes gener-ally lead to large intensity enhancement at sharp edgesof metallic structures, which happens in particular in ourcase at the bottom circular edge of the AuNCs. Hence,the electric field being mostly vertical in the MIM-cavityas shown on the field distributions of Fig. 2 for modes(2) and (3), we choose values of qpl such that the z com-ponent of the electric field reaches a maximum at ρ = R.This leads to J ′n(qplR) = 0, where the prime denotes thederivative of the Bessel function with respect to its argu-
4
ment. We finally obtain the following expression for thez-component of the electric field:
Ez(ρ, φ) = E0 cos(nφ)Jn(x′npρ/R)
with the dispersion equation:
1
qpl(λ, e)=
R
x′np(1)
where p is an integer larger than 1 and x′np are the zeros ofthe Bessel function’s derivative. That relation is exactlythe same as the one giving the cutoff wavelengths of thefirst TE modes in a circular metal waveguide. The firsttwelve values of the coefficients x′np are: x′1,1 = 1.841,x′2,1 = 3.054, x′0,1 = 3.832, x′3,1 = 4.201, x′4,1 = 5.317,x′1,2 = 5.331, x′5,1 = 6.416, x′2,2 = 6.706, x′0,2 = 7.016,x′6,1 = 7.501, x′3,2 = 8.015, and x′1,3 = 8.536. The corre-sponding field distributions are shown in Fig. 3(c). Wecan immediately notice on Fig. 2 that the two MIM-LSP modes labeled (2) and (3) correspond, owing totheir field distribution, to the modes (n, p) = (1, 3) and(n, p) = (1, 2) in the analytical model. We compare inFig. 3(d) the position of the MIM-LSP modes predictedby the analytical model with the one resulting from thefull numerical simulations of the absorption spectra asa function of the nanocylinder radius, for an incidentplane wave at a tilted angle of 60o, measured from the(Oz) axis. It is necessary to use a tilted illuminationin order to excite more MIM-LSP modes, as the normalincidence imposes a selection rule on the excited modeswhich must be symmetric with respect to the (Oyz) planeand antisymmetric with respect to the (Oxz) plane. Inparticular, the modes with even n cannot be excited innormal incidence. The agreement between the simulationand the model is pretty good, slight red-shifts occur inthe simulation compared to the model, more particularlyfor the (n, p) = (0, 1) mode. However, the variations ofthe wavelength with the radius of the particle match verywell in both approaches.
PHONON-PLASMON COUPLING
We will now assess the effect of a modification of theshape of the MIM-cavity under an elastic deformation.That deformation is physically induced by the movementof the AuNC above the spacer when a particular elasticmode is excited. Computer simulations of those modesare presented in the next section, however we show herethat most of the physics is captured by considering theshape of the MIM-cavity independently of the AuNC.
We are interested here in two types of cavity defor-mations. In the first, called "radial breathing deforma-tion", the cavity undergoes an isotropic oscillation ofits radius at the elastic frequency, while the thicknessof the cavity oscillates accordingly in phase opposition
compared to the radius: when the cavity expands, it be-comes thinner, and thicker when it contracts. In thesecond type of mode, called "multipolar deformation",the radius oscillates with a harmonic angle variation:R(φ) = R0 + δR cos(mφ), m 6= 0. In that case, we sup-pose that the top and bottom surfaces of the cavity keepthe same area to the lowest order in δR, and that thethickness of the cavity stays mostly unchanged duringthe acoustic period.
Radial breathing deformation. That deformationchanges both R and e. It is convenient to examine firsta change of the radius of the MIM-cavity while keepingits thickness constant, and second a change of the thick-ness of the MIM-cavity while its radius is kept constant.Starting from x′np = Rqpl (λ, e) (Eq. 1), we obtain:
0 =dR
R+dqplqpl
=dR
R+
1
qpl
[∂qpl∂λ
∣∣∣∣e
dλ+∂qpl∂e
∣∣∣∣λ
de
]We introduce SR = ∂λ/∂R|e, which represents the sensi-tivity of the MIM-LSP mode wavelength to a modifica-tion of the particle radius, keeping the thickness of thespacer layer constant. Writing de = 0 in the previousexpression, we find:
SR =∂λ
∂R
∣∣∣∣e
= −qplR
1∂qpl∂λ
∣∣∣e
In a similar way, we obtain the sensitivity Se of the MIM-LSP mode wavelength to a modification of the spacerlayer thickness:
Se =e
R
∂λ
∂e
∣∣∣∣R
= − eR
∂qpl∂e
∣∣∣λ
∂qpl∂λ
∣∣∣e
The factor e/R allows to scale Se to values comparableto SR, by taking similar deformation in thickness (de/e)and radius (dR/R) in both situations.
Next, we need to introduce the ratio νe of the radiusdeformation dR/R compared to the thickness deforma-tion de/e:
νe = −dRR/de
e(2)
The minus sign accounts for the phase opposition be-tween the deformation in radius and the deformation inthickness. In case of a cylinder in vacuum, submittedto a force applied symmetrically on its top and bottomfaces, this coefficient identifies with the Poisson’s ratioν. However, in that situation νe cannot be predicted apriori but will be estimated later from the numerical sim-ulations of the corresponding elastic eigenmode. As theresonance wavelength is a function of e and R:
λ(e,R)⇒ dλ =∂λ
∂e
∣∣∣∣R
de+∂λ
∂R
∣∣∣∣e
dR (3)

5
By combining equations 2 and 3, we finally obtain thesensitivity Sν of the MIM-LSP wavelength λ under abreathing deformation:
Sν =∂λ
∂R
∣∣∣∣ν
= SR −1
νeSe (4)
Multipolar deformation. We suppose here that thethickness of the MIM-cavity does not change during thedeformation, but that the radius of the MIM cavity isof the form R(φ) = R0 + δR cos(mφ) at the consideredtime of the acoustic deformation, R0 being the radiusof the particle at rest.We need to evaluate how much aMIM-LSP mode of order (N,P ) is modified under thatdeformation. For that purpose, we expand that mode onthe basis of functions solution of the wave equation incylindrical coordinates (see above):
EN,Pz =
∞∑n=0
αn cos(nφ)Jn(qplρ)
with αN ≈ 1 and αn << 1, n 6= N . The new boundarycondition reads:
0 =[EN,Pz
]′(R(φ), φ) =
∞∑n=0
αn cos(nφ)Jn [qpl(R0 + δR cos(mφ))]
As the deformation is weak, the value of qplR0 stays closeto x′NP , and we write it qplR0 = x′NP (1+β). To the firstorder in αn, β and δR/R0, with J ′N (x′NP ) = 0:
0 =
cos(Nφ)β + δR2R0
[cos((m−N)φ) + cos((m+N)φ)]J ′′N (x′NP )
+∑n6=N αn cos(nφ)J ′n(x′NP )
We can verify that m = 0 corresponds to the radialbreathing deformation, and then αn = 0 if n 6= N : theshape of the MIM-LSP mode is unchanged as the MIM-cavity is still exactly cylindrical. The only effect is a shiftof the resonance wavelength. However, when m 6= 0,β 6= 0 only if N = m − N , which happens only if m iseven. In that case, the only mode affected by the defor-mation is N = m/2, and:
β = − δR
2R0x′NP
αN = 1
α3N = − δR
2R0
J ′′N (x′NP )
J ′′3N (x′NP )
αn = 0, n 6= N, 3N
The wavelength of the deformed mode N = m/2 is thengiven by:
qpl [λ, e]R0 = x′np
[1− δR
2R0
]≈ x′np +R0
∂qpl∂λ
∣∣∣∣e
δλ
Finally, the sensitivity of the MIM-LSP mode wavelengthunder a multipolar deformation is independent on m andreads:
Sm =δλ
δR= − qpl
2R
1∂qpl∂λ
∣∣∣e
=1
2SR
Figure 4(a) shows the evolution of −Se and SR with theresonance wavelength λ of the MIM-LSP mode, for e = 6nm. The sensitivity to the spacer thickness Se is negative,because when the spacer thickness increases (δe > 0),the effective index neff decreases: in order to satisfythe MIM-LSP excitation condition, the wavelength mustthen be shorter (δλ < 0). However, SR is positive: an in-crease in diameter obviously does not change the effectiveindex, and the wavelength must increase to compensateδR > 0. We can additionally see that in the whole rangeof investigated wavelengths, |Se| < SR by a factor ofabout 0.8 around λ=600 nm to about 0.5 around λ = 1µm. The most interesting result appears on Fig. 4(b),
-Se
2
4
6
8
SR
λ (nm)
600 700 800 900 1000
Sv
0
5
10
15
20
Sm
λ (nm)
600 700 800 900 1000
ν e=0.3
ν e=0.9
ν e=0.5
ν e=0.7
(a) (b)
FIG. 4. Evolution of the sensitivity of the MIM-LSP wave-length to: (a) black line (resp. red line): the thickness, (resp.radius) of the MIM-cavity at constant radius (resp. thick-ness); (b) a radial breathing deformation for different ratiosνe (black lines) or a multipolar deformation (red).
which, similarly as Fig. 4(a), shows the evolution of Sνand Sm with the wavelength. In particular, Sν has beenevaluated for several values of νe between 0.3 and 0.9.It appears clearly that Sν is always larger that Sm, be-cause the wavelength shifts Se and SR cumulate when thecavity undergoes a radial breathing deformation, as anincrease in radius generally induces a decrease in thick-ness. For example, Sν and Sm, which are both positive,differ for νe = 0.5 by a factor of about 5.5 to 4.5 from600 nm to 1 µm, the change in wavelength induced bya radial breathing deformation being then significantlylarger that the one induced by a multipolar deformationwhich does not change the MIM-cavity thickness.

6
FULL NUMERICAL SIMULATIONS
For the numerical simulations, a commercial finite ele-ment method has been used (Comsol) in order to be ableto simultaneously investigate the plasmonic, phononic,and coupled acousto-plasmonic aspects. The radio-frequency module is employed for the photonic simula-tions, while the structural-mechanics module is used forthe phononic simulations.
Phononic properties
First, we investigate the elastic properties of the struc-ture described in Fig. 1 (R = 100 nm, hp = 50 nm, e = 6nm, hf = 50 nm, H = 144 nm, a = 300 nm) by com-puting the elastic eigenmodes and eigenfrequencies of aunit cell of the grating. Free interfaces boundary condi-tions are applied on the topmost surfaces of the AuNCand the silica spacer, and on the bottom surface of the144nm-thick silica layer, while periodic boundary con-ditions are applied on the lateral boundary of the unitcell. The elastic parameters for silica and gold have beentaken in Royer and Dieulesaint [33]. Gold is anisotropic(face centered cubic), and the crystal is oriented such asxy-planes correspond to (001) crystallographic directionsof gold; silica is isotropic.
Figure 5(a) shows the resulting band diagram along theΓX direction, where a partial band-gap is opened around3GHz. Overall, the structure supports a lot of modes,most of which are strongly dispersive and have elasticenergy spread all around the AuNCs. However, for fivemodes at the Γ point most of the energy is localized inor close to the AuNC, as indicated by their displacementdistribution. Their respective frequencies are 3.7 Ghz(two degenerated modes along the x and y directions), 4.0GHz, 4.2 GHz, and 5.6 GHz, their displacement maps areindicated in Fig. 5(b). The color map shows the ampli-tude of the displacement vector u = (ux, uy, uz) (real atthe Γ point), while the green arrows indicate the displace-ment itself. The deformation is obviously exaggerated inorder to more clearly show the shape of the mode. On theright side of each displacement maps is represented thedeformed 6-nm-thick spacer layer. The deformation isagain amplified for clarity, and the colorscale representseither the z component of ∇ × u (, top) or ∂zuz (l,bottom). The first quantity indicates the rotation expe-rienced by the MIM-cavity around the vertical (z) axis,while the second shows its relative change in thickness.These maps emphasize the differences between the threeexcited modes and their potential effect on the MIM-LSPmodes.
The two lowest frequency modes at 3.7 GHz are de-generated, and correspond to flexural deformations alongthe (Ox) or the (Oy) axis of the square grating. As aresult, the nanocylinder and the MIM-cavity oscillate to-
f=4.2 GHz
f=4.0 GHz
f=5.6 GHz
F (
GH
z)
0
1
2
3
4
5
6
k a/πΓ Χ0 0.2 0.4 0.6 0.8 1
f=3.7 GHz (deg.)
(a) (b)
max
-max
0max
-max
0max
-max
0max
-max
0
min
max
min
max
min
max
min
max
FIG. 5. (a) Band diagram along the ΓX direction ; (b) Foreach of the four frequencies indicated by an arrow in (a) atthe Γ point: on the left side is plotted the displacement (u =(ux, uy, uz)) maps in 3d (color map: |u|, green arrows: <(u)),while on the right side is plotted the deformed representationof the silica spacer under the AuNC, where color maps showthe z component of ∇× u (, top) and ∂zuz (l, bottom).
gether around either the (Ox) or the (Oy) axis, and verysmall deformation occurs in the MIM-cavity: its shape ismostly unchanged and the coupling between that elasticmode and the MIM-LSP is expected to be weak. Yet,we will have to differentiate the x and y flexural modesin the plasmon-phonon coupling as the incident electricfield is polarized along the x-axis.
The next mode at 4.0GHz is an azimuthal shear de-formation mode where the displacement is essentiallyorthoradial, enhanced close to the circular top edge ofthe nanocylinder but much lower at its bottom. Underthat deformation, the MIM-cavity undergoes no compres-sion (constant thickness and radius) but a clear rotationaround the vertical axis. That displacement is coupledto a very weak radial breathing movement which corre-sponds to a small increase of the volume of the particle,which reaches a maximum every half an acoustic period.Again, this mode is not expected to strongly couple withthe MIM-LSPs.
The mode at 4.2 GHz is a quadrupolar mode, en-hanced on the top part of the nanoparticle, with dis-placement maxima along the main directions of the grat-ing. That mode is symmetric compared to both Oxzand Oyz planes, and does not strongly affect the vol-ume of the nanoparticle, as the expansion/contraction

7
along the x direction is balanced by the opposite dis-placement in the y direction. The MIM-cavity undergoesa quadrupolar deformation, which results in a slight ver-tical compression / dilatation at its circular edge: thethickness of the MIM-cavity is hardly modified exceptclose to its border. Hence, the radius of the cavity fol-lows at that frequency an azimuthal-angle dependency ofthe form R(φ) = R0 + δR cos(mφ) with m = 2.
Finally, the high-frequency mode at 5.6 GHz clearlyshows a vertical compression / dilatation of thenanocylinder, while its average radius correspondinglyincreases and decreases during an acoustic period. Thedisplacement map is mostly symmetric compared to anyplane perpendicular to the substrate containing the par-ticle revolution axis (despite slightly deformed by theclosest neighboring particles along the Ox and Oy axes).Similarly, the MIM-cavity keeps its circular shape duringthe deformation, its radius alternately increases and de-creases while its thickness decreases and increases. How-ever, contrary to the 4.0GHz mode, the rotation of thatmode around the perpendicular axis is very small. Fi-nally, the MIM-cavity at that frequency clearly under-goes a radial breathing deformation as presented in theanalytical model.
Phonon-plasmon interaction
In that section, we investigate the influence of the fiveprevious elastic modes on the optical properties of thesystem. For that purpose, the deformed geometry corre-sponding to each mode is computed for different phasesψ = Ωt = 2πFt during half an acoustic period, where Fis the eigenfrequency of the considered elastic mode. Theorigin of phase is chosen such as ψ = 0 corresponds tothe structure at rest. The amplitude of the deformationis chosen such as the maximum of the elastic displace-ment in the nanocylinder is taken equal to 2% of its ra-dius, which gives here umax = 2nm. Then, that deformedstructure is used to compute the extinction spectrum un-der the same illumination conditions as in section 2, atthe given phase ψ. Let us mention that, at the scale ofthe crystalline network, the corresponding deformationis of about umax/R ≈ 2%, which is huge and not physi-cally meaningful. For instance, in reference [26], authorsestimate that the length increase of their 150-nm-longnanorods is on the order of 5pm for the considered acous-tic modes, which gives a deformation of about 3.3 10−5.For numerical purpose it is necessary to use larger val-ues, however the obtained quantities can then be scaledto smaller deformation in order to obtain realistic figures.In the following, the modulated spectra will be analyzedto assess the strength of the coupling, using two meth-ods. In the first, the shift in wavelength of the differentplasmon modes is evaluated as a function of the acousticphase ψ = Ωt, and in the second, the relative variation of
the transmission is computed for realistic deformations,similarly to what can be realized in a typical pump-probeexperiment.
λ (nm)
600 700 800
F=4.2 GHz
λ (nm)
600 700 800
F=4.0 GHz
λ (nm)
600 700 800 900
F=5.6 GHz
λ (nm)
600 700 800
F=3.7 GHz (y)
1-T
/T0
0.5
0.6
0.7
0.8
0.9
λ (nm)
500 600 700 800 500 500 500 500
F=3.7 GHz (x)
ψ=-π/2 ψ=-3π/8 ψ=-π/4 ψ=-π/8 ψ=0 ψ=π/8 ψ=π/4 ψ=3π/8 ψ=π/2
λ (nm)
740 750 760 770
F=5.6 GHz (y)
Ab
sorb
ance
0
0.05
0.1
0.15
0.2
λ (nm)
730 740 750 760
F=4.2 GHz
ψ=-π/2 ψ=-3π/8 ψ=-π/4ψ=-π/8 ψ=0 ψ=π/8ψ=π/4 ψ=3π/8 ψ=π/2
(a)
(b)
FIG. 6. (a) Evolution of the extinction spectra 1 − T/T0
for different values of the elastic phase for the five modes ofFig. 5 (T: transmission through the membrane+AuNCs, T0:transmission through the membrane without the AuNCs); (b)Evolution of the absorbance spectra for different values of theelastic phase for the two elastic modes at 4.2GHz and 5.6GHz,around the wavelength of the main (n, p) = (1, 2) MIM-LSPmode.
First, we present on Fig. 6(a) the modulated extinctionspectra for the five elastic modes chosen in the previoussection. A closer view of the evolution of the absorbancespectrum around the wavelength of the MIM-LSP modeat 750 nm is shown in Fig. 6(b) for the two highest-frequency elastic modes. The differences between the fivemodes are very obvious. First, the two flexural modes at3.7GHz and the azimuthal shear deformation mode at4.0GHz produce no changes neither in the extinction norin the absorption spectra. That result is obvious for the4.0GHz mode as the displacement is essentially orthora-dial and then does barely move or deform any interfacesin the system. For the flexural modes, despite the factthat interfaces move, neither the shape of the particle northe shape of the MIM-cavity is modified, as they both ro-tate undeformed around the x- or the y- axis. The secondmode at 4.2GHz however induces noticeable modifica-tions which are more easily observable on the absorptionspectrum around the main resonance at 750nm (MIM-LSP mode (n, p) = (1, 2)). Finally, the high frequencymode at 5.6GHz produces the largest modifications, eas-ily observable both in the extinction and the absorptionspectra, and mostly in the range of wavelengths wherethe MIM-LSP modes are excited. In the following, wefocus only on the quadrupolar mode at 4.2GHz and the

8
vertical breathing mode at 5.6GHz.Figure 7 shows the evolution of the variation of the
resonance-wavelength of the three localized plasmonsmodes (the short-wavelength, top-face-localized-dipole atλ = 525 nm, and the two MIM-LSP modes at 615 nm((n, p) = (1, 3)) and 750 nm ((n, p) = (1, 2))) as a func-tion of the sine of the phase of the elastic wave when cou-pled to the quadrupolar mode (Fig. 7(a)) and to the verti-cal breathing mode (Fig. 7(b)). The position of the differ-ent peaks have been determined by fitting the absorbancespectra with Lorentzian functions. It appears clearly thatthe wavelengths depend linearly on the sine of the phase.Very weak deviations from that linear law might be no-ticeable, which must be attributed to the large value ofthe maximum displacement (2 nm). A linear fit of ∆λ asa function of sin(ψ) is plotted as dashed lines in Fig. 7.For the elastic mode at F=4.2 GHz, the MIM-LSPs have,for the imposed value of 2 nm maximum displacement, alinear shift of δλ/ sin(ψ)=-0.6 nm (resp. δλ/ sin(ψ)=-1.5nm) for the 615 nm (resp. 750 nm) MIM-LSP modes.The shortest-wavelength mode at 525 nm is less sensi-tive with δλ/ sin(ψ)=-0.3 nm. The wavelength shifts ob-tained with the F=5.6 GHz elastic mode are much largerfor the two MIM-LSP modes with δλ/ sin(ψ)=2.9 nm forthe 615 nm mode and δλ/ sin(ψ)=6.4 nm for the 750 nmmode. However, the 525 nm mode shows almost no wave-length dependency with a δλ/ sin(ψ)=-0.02 nm. Hence,the wavelength modulation amplitude is clearly enhancedwhith the F=5.6GHz mode compared to the 4.2GHz, bya factor of 4.9 for the λ = 615 nm MIM-LSP and by afactor of 4.4 for the λ = 750 nm MIM-LSP.
Δλ
(nm
)
−5
0
5
sin(ψ)
−1 −0.5 0 0.5 1
F=4.2 GHz
(1), λ=525nm(2), λ=615nm(3), λ=750nm
Δλ
(nm
)
−5
0
5
sin(ψ)
−1 −0.5 0 0.5 1
F=5.6 GHz
(a) (b)
FIG. 7. Modulation of the wavelength of the three plasmonmodes as a function of the sine of the acoustic phase of the twoelastic modes: (a) F=4.2 GHz ; (b) F=5.6 GHz. Symbols arethe wavelengths obtained directly from absorbance spectrawhile dashed lines are linear fits.
Those extracted values of δλ/ sin(ψ) have been ob-tained for a maximum displacement of umax = 2 nm asexplained earlier. In order to compare those numericalresults to the figures obtained with the analytical model,we need to evaluate the quantities δλ/δR where δR is
TABLE I. Summary, for the three localized plasmon modes,and for the two elastic modes at 4.2GHz and 5.6GHz, of thewavelength shifts per sin(ψ), δλ/ sin(ψ), or of the wavelengthshift per maximal variation of the cavity’s radius δλ/δR(mode at 525 nm is not concerned (n.c.)). Simulated (s) andanalytical (a) values are compared.
F=4.2GHz F=5.6GHzλLSP
δλsin(ψ)
δλδR, s δλ
δR, a δλ
sin(ψ)δλδR, s δλ
δR, a
525 nm -0.3 n.c. n.c. 0.02 n.c. n.c.615 nm 0.59 1. 0.93 2.92 2.15 3.53750 nm 1.45 2.46 1.9 6.37 4.68 6.90
the radius variation of the MIM-cavity for each of thetwo considered elastic modes. By a direct evaluation onthe simulated displacement maps, those values have beenestimated to δR = 0.59 nm for the quadrupolar mode andδR = 1.36 nm for the vertical breathing mode. For theF = 5.6 GHz elastic mode, we need as well an estimateof the deformation ratio νe. We find that de/e ≈ 0.015for umax = 2 nm, which gives νe ≈ 0.92. The comparisonbetween the sensitivities obtained in the numerical andthe analytical approach are indicated in Table I.
The agreement is overall qualitatively correct in thefour cases, with the largest discrepancy for the 615 nmLSP/5.6GHz elastic mode, and the best agreement forthe 615 nm MIM-LSP/4.2GHz elastic mode. The sensi-tivity is underestimated by the analytical model for the4.2GHz mode but overestimated for the 5.6GHz mode.Differences might partly be attributed to the fact thatthe analytical model is very simplified as it does not takeinto account the precise shape of the cavity, nor the factthat the MIM-PSP wave vector is complex. However, thestrong increase in sensitivity with the radial breathingelastic mode compared to the quadrupolar mode is cor-rectly obtained in both cases, which makes us think thatthe physics of the coupling is correctly captured even withthat simplified description. In particular, the enhancedwavelength shift with the high frequency acoustic defor-mation is clearly due to the cumulative effect of the ex-pansion of the MIM-cavity (radius) and the contractionof the spacer layer (thickness).
Finally, we estimate in that section the time-modulation of the transmission spectra for more real-istic deformations of the structure under coupling withthe quadrupolar and radial breathing acoustic deforma-tions. For that, we start from the fact that in the limitof weak deformation, the evolution of the transmissionspectrum T ∗(λ) is a harmonic function of time for everyfixed wavelength. This is relied here to the fact that thedisplacement vector u is real: at a certain time t of theacoustic period, the displacement will then be at everypoint u sin(Ωt): changing the amplitude of the displace-ment is completely equivalent to changing the sine of thephase ψ = Ωt of the acoustic mode. Despite the fact

9
ΔT
(ψ)/
T
−0.1
0
0.1
λ (nm)
500 600 700 800 900
F=4.2 GHz
ΔT
(ψ)/
T
−0.5
0
0.5
λ (nm)
500 600 700 800 900
F=5.6 GHz
ψ=-π/2 ψ=-3π/8 ψ=-π/4ψ=-π/8 ψ=0 ψ=π/8ψ=π/4 ψ=3π/8 ψ=π/2
(a) (b)
FIG. 8. ∆T/T = (T ∗ − T )/T for the different phases ψ ofthe two elastic modes at F=4.2GHz, (a), and F=5.6GHz, (b),where T ∗(λ) is the transmission through the deformed struc-ture at phase ψ and T (λ) the transmission through the struc-ture at rest.
that the transmission might oscillate with 2Ω in somesituations [34], this is not the case here. Figure 8(a)shows, for the two acoustic modes, the relative difference∆T/T = (T ∗(λ) − T (λ))/T (λ) between the modulatedT ∗(λ) and the unmodulated transmission T (λ) as a func-tion of the acoustic phase ψ: ∆T/T is a mostly symmet-ric function of the phase, and whatever the wavelength,the modulation of the optical transmission has the sameperiod than the elastic mode. Following that idea, wecompute for every wavelength the slope a(λ) of the tan-gent to the modulated transmission T ∗(λ) in ψ = 0, fromwhich we can evaluate the relative variation of transmis-sion ∆T/T = (T ∗(λ) − T (λ))/T (λ) for any arbitrarilysmall deformation of the structure using:
∆T
T(t) =
B
B0a(λ) sin(Ωt)
where B is a coefficient corresponding to the chosenâĂIJrealisticâĂİ deformation B = umax/R, and B0 =0.02 is the reference deformation used in the simulation.Figure 9 shows the relative variation in transmission ofthe modulated system under the two elastic deformationsas a function of time. In case of a pump-probe experi-ment, the amplitude of the modulation should be dampeddue to the losses, which are not taken into account here[35]. The two diagrams have been plotted using a typicaldeformation of the structure of B = umax/R = 3 10−5,which correspond to a maximum displacement of about3 pm inside the AuNC. For both acoustic modes, the ob-tained numbers are comparable to the values obtained ex-perimentally in [26], of about 10−4, and reaches 8.9 10−4close to the 750 nm MIM-LSP mode when the structureis deformed by the radial breathing elastic mode: thiscorresponds to an increase of 4.6 in the oscillation am-plitude of ∆T compared to the amplitude obtained withthe quadrupolar elastic mode.
F = 4.2 GHz F = 5.6 GHz
FIG. 9. Time evolution of the relative variation of the trans-mission (T*-T)/T compared to the nanostructure at rest un-der the two elastic modes at F=4.2 GHz and F=5.6 GHz,computed with a deformation of A = umax/R = 3.10−5. Theblue curve is the unmodulated transmission T (λ).
CONCLUSION
Using a combination of finite elements numerical sim-ulations and a simplified analytical model, we have pro-vided physical insight in both the origin of the MIM-LSPmodes supported by AuNCs on a thin silica film coatinga metal interface, and their coupling with elastic modessupported by the same system, for which the movementof the AuNCs induces a deformation of the cavity formedby the portion of the silica spacer underneath. Due tothe nature of the MIM-LSP, the three lowest-frequencyelastic modes (flexural and azimuthal shear deforma-tion modes), which do not modify the shape of thatcavity, do not change significantly the optical responseof the system. However, stronger effect is obtainedwhen the AuNC, and then the MIM-cavity, experiences aquadrupolar deformation or even better a radial breath-ing movement. The latter clearly results in an enhancedwavelength shift and transmission modulation, due to thecumulative effect of the increase/decrease of the cavity’sradius and the corresponding contraction/dilatation ofits thickness. Compared to the quadrupolar deformationwhich only affects the radius, both the wavelength shiftsand the transmission modulation are increased by a fac-tor of about 4.6. That structure could give interestingresults in a typical pump-probe experiment, despite thefact that efficiency of the coupling between the probeand the vibration of the particle is not precisely known,but only estimated from other publications. We believethat such a study can be of interest for the fundamentalunderstanding of the coupling mechanisms between local-ized plasmon modes and elastic modes, and to researchgroups working on fabrication nano-opto-mechanical de-vices.
Acknowledgement This work was partially supportedby VisionAIRR project "PolarEP" of Région Nord-Pas-de Calais (France).

10
[1] J. A. Schuller, E. S. Barnard, W. Cai, Y. C. Jun, J. S.White, and M. L. Brongersma, Nature Materials 9, 193(2010).
[2] J. J. Mock, D. R. Smith, and S. Schultz, Nano Letters3, 485 (2003).
[3] O. Saison-Francioso, G. Lévêque, A. Akjouj, Y. Pennec,B. Djafari-Rouhani, S. Szunerits, and R. Boukherroub,The Journal of Physical Chemistry C 116, 17819 (2012).
[4] T. Maurer, R. Nicolas, G. Lévêque, P. Subramanian,J. Proust, J. Béal, S. Schuermans, J.-P. Vilcot, Z. Herro,M. Kazan, and others, Plasmonics , 1 (2013).
[5] X. Wang, M. Li, L. Meng, K. Lin, J. Feng, T. Huang,Z. Yang, and B. Ren, ACS Nano 8, 528 (2014).
[6] Y. Liu and X. Zhang, Chemical Society Reviews 40, 2494(2011).
[7] D. Jaque, L. Martínez Maestro, B. del Rosal, P. Haro-Gonzalez, A. Benayas, J. L. Plaza, E. Martín Rodríguez,and J. García Solé, Nanoscale 6, 9494 (2014).
[8] T. Maurer, J. Marae-Djouda, U. Cataldi, A. Gontier,G. Montay, Y. Madi, B. Panicaud, D. Macias, P.-M.Adam, G. Lévêque, and others, Frontiers of MaterialsScience 9, 170 (2015).
[9] T. Maurer, P.-M. Adam, and G. Lévêque, Nanophotonics4 (2015).
[10] S. Zhang, K. Bao, N. J. Halas, H. Xu, and P. Nordlander,Nano Letters 11, 1657 (2011).
[11] A. Moreau, C. Ciracì, J. J. Mock, R. T. Hill, Q. Wang,B. J. Wiley, A. Chilkoti, and D. R. Smith, Nature 492,86 (2012).
[12] R. Nicolas, G. Lévêque, J. Marae-Djouda, G. Montay,Y. Madi, J. Plain, Z. Herro, M. Kazan, P.-M. Adam,and T. Maurer, Scientific reports 5, 14419 (2015).
[13] C. Voisin, N. Del Fatti, D. Christofilos, and F. Vallée,Applied surface science 164, 131 (2000).
[14] A. Nelet, A. Crut, A. Arbouet, N. Del Fatti, F. Vallée,H. Portalès, L. Saviot, and E. Duval, Applied SurfaceScience 226, 209 (2004).
[15] J. Hodak, I. Martini, and G. V. Hartland, Chemicalphysics letters 284, 135 (1998).
[16] J. H. Hodak, A. Henglein, and G. V. Hartland, TheJournal of Chemical Physics 111, 8613 (1999).
[17] G. V. Hartland, The Journal of Chemical Physics 116,8048 (2002).
[18] G. Bachelier, J. Butet, I. Russier-Antoine, C. Jonin,E. Benichou, and P.-F. Brevet, Physical Review B 82
235403 (2010).[19] H. Portales, N. Goubet, L. Saviot, S. Adichtchev, D. B.
Murray, A. Mermet, E. Duval, and M.-P. Pileni, Pro-ceedings of the National Academy of Sciences 105, 14784(2008).
[20] M. Li, H. X. Tang, and M. L. Roukes, Nature Nanotech-nology 2, 114 (2007).
[21] A. K. Naik, M. S. Hanay, W. K. Hiebert, X. L. Feng, andM. L. Roukes, Nature Nanotechnology 4, 445 (2009).
[22] M. A. van Dijk, M. Lippitz, and M. Orrit, Physical Re-view Letters 95, 267406 (2005).
[23] H. Staleva and G. V. Hartland, Advanced Functional Ma-terials 18, 3809 (2008).
[24] M. Hu, X. Wang, G. V. Hartland, P. Mulvaney, J. P.Juste, and J. E. Sader, Journal of the American Chem-ical Society 125, 14925 (2003).
[25] P. Zijlstra, A. L. Tchebotareva, J. W. M. Chon, M. Gu,and M. Orrit, Nano Letters 8, 3493 (2008).
[26] G. Soavi, I. Tempra, M. F. Pantano, A. Cattoni,S. Collin, P. Biagioni, N. M. Pugno, and G. Cerullo,ACS Nano (2016), 10.1021/acsnano.5b06904.
[27] J. Margueritat, J. Gonzalo, C. N. Afonso, A. Mlayah,D. B. Murray, and L. Saviot, Nano Letters 6, 2037(2006).
[28] N. Large, L. Saviot, J. Margueritat, J. Gonzalo, C. N.Afonso, A. Arbouet, P. Langot, A. Mlayah, and J. Aizpu-rua, Nano Letters 9, 3732 (2009).
[29] F. Della Picca, R. Berte, M. Rahmani, P. Albella, J. M.Bujjamer, M. Poblet, E. Cortés, S. A. Maier, and A. V.Bragas, Nano Letters 16, 1428 (2016).
[30] K. O’Brien, N. D. Lanzillotti-Kimura, J. Rho, H. Su-chowski, X. Yin, and X. Zhang, Nature Communications5 (2014), 10.1038/ncomms5042.
[31] P. B. Johnson and R. W. Christy, Physical Review B 6,4370 (1972).
[32] A. Hohenau and J. R. Krenn, physica status solidi (RRL)- Rapid Research Letters 4, 256 (2010).
[33] D. Royer and E. Dieulesaint, Elastic Waves in Solids 1- Free and guided propagation (Springer-Verlag, BerlinHeidelberg, 2000).
[34] Q. Rolland, M. Oudich, S. El-Jallal, S. Dupont, Y. Pen-nec, J. Gazalet, J. Kastelik, G. Lévêque, and B. Djafari-Rouhani, Applied Physics Letters 101, 061109 (2012).
[35] G. V. Hartland, Chemical Reviews 111, 3858 (2011).