Embed Size (px)
Citation preview
1
Systems Approach for Evaluating the Transitioning Oil and Gas Commercial Market
By
Caitlin Williams
BSc, Chemical Engineering, University of Alabama, 2007
Submitted to the System and Design Management Program In Partial Fulfillment of the Requirements
for the Degree of
Master of Science in Engineering and Management at the
Massachusetts Institute of Technology
February 2021 © 2021 Caitlin Williams. All rights reserved.
The author hereby grants to MIT permission to reproduce and to distribute publicly paper and electronic copies of this thesis document in whole or in part in any medium now known or
hereafter created.
Signature of Author_____________________________________________________________________________________________ Caitlin Williams
MIT System and Design Management Program January 15, 2021
Certified by_______________________________________________________________________________________________________ Bruce Cameron
Director, System Architecture Group
Accepted by______________________________________________________________________________________________________ Joan Rubin
Executive Director, System Design and Management Program

2
[This page is intentionally left blank.]
3
Systems Approach for Evaluating the Transitioning Oil and Gas Commercial Market
Submitted to the System and Design Management (SDM) program on January 15, 2021 in Partial Fulfillment of the Requirements for the Degree of Master of Science in Engineering and Management.
ABSTRACT
The United States retail industry will continue to create value for Supermajors with
branded retail networks. Regulation requiring efficiency improvements and the distribution of
lower emission fuel substitutes will require Supermajors to evolve to maintain their competitive
positions in the market. Supermajors ability to reliably produce energy at scale and their growing
capabilities in optimizing their business through digital applications uniquely positions them to
succeed in the future.
Supermajors should look at regulation as an opportunity to grow profitability. Supermajors
ability to understand lower emission energy systems in the context of their legacy assets will be
critical to delivery financial results in the future. Technological advancements among lower
emission transportation energy substitutes, like electricity and hydrogen, present an opportunity
for Supermajors to diversify their fuel offerings to meet future transportation energy needs.
Supermajors should be cautious of early investment in these alternatives considering the
financial risk but should recognize the potentially greater risk of failing to act in time.
Supermajors’ retail networks provide the optimal platform to improve their corporate
image. Supermajors consistently highlight the actions they are taking to develop lower emission
alternatives and the contributions they make to the communities in which they operate.
However, Supermajors should also consider targeting the customer experience offered by their
brand considering the success Independents have experienced by employing that strategy. This

4
appears to be a more effective approach compared to placing emphasis on fuel quality
advantages.
Thesis Supervisor: Bruce Cameron
Title: Director, System Architecture Group

5
Acknowledgement
I would like to thank my Mom and Dad as well as my sisters, Meaghan and Eleanor, for their unwavering love and support. I recognize and will be forever grateful for the often unreciprocated help you give me toward advancing my goals. Each of you are an inspiration and the best characteristics I have are because of the examples you provided and the unconditional love you always give.
I would also like to thank my Advisor Bruce. Your knowledge and willingness to teach and guide is unique. I will be eternally grateful for your support.

6
[This page is intentionally left blank.]
7
Table of Contents
Abstract ................................................................................................................................ 3
Acknowledgement ................................................................................................................. 5
1 Introduction ................................................................................................................. 17
1.1 Background ..................................................................................................................... 17
1.2 Thesis Objective ............................................................................................................... 20
2 Current State of Retail Industry in U.s. .......................................................................... 21
2.1 Introduction .................................................................................................................... 21
2.2 Background ..................................................................................................................... 22
2.2.1 Crude Production and Refining ............................................................................................................ 23
2.2.2 Marketing and retailing ........................................................................................................................ 25
2.3 Regulation in the U.S........................................................................................................ 29
2.3.1 Renewable Fuel Standard .................................................................................................................... 29
2.3.2 Low Carbon Fuel Standard ................................................................................................................... 30
2.3.3 CAFÉ Standards .................................................................................................................................... 31
2.4 Conclusion ....................................................................................................................... 31
3 Transportation Energy Demand in U.S. ......................................................................... 32
3.1 Introduction .................................................................................................................... 32
3.2 Forecasting Reliability ...................................................................................................... 36
3.2.1 Motor Gasoline & Petroleum Diesel .................................................................................................... 37
3.2.2 Electricity .............................................................................................................................................. 40
3.2.3 Ethanol ................................................................................................................................................. 42
3.2.4 Biodiesel Forecast Reliability ............................................................................................................... 44
3.2.5 Renewable Diesel Forecast Reliability ................................................................................................. 45
3.3 Future Demand Considerations ........................................................................................ 47
3.3.1 Electric Vehicle Performance ............................................................................................................... 48

8
3.3.2 U.S. Corporate Influences .................................................................................................................... 50
3.4 Regulation ....................................................................................................................... 52
3.5 Summary ......................................................................................................................... 54
4 Consumer Choice .......................................................................................................... 54
4.1 Introduction .................................................................................................................... 54
4.2 Overview of assumptions ................................................................................................. 55
4.3 Tradespace analysis ......................................................................................................... 56
4.4 Use Case 1&2 ................................................................................................................... 63
4.5 Conclusion ....................................................................................................................... 69
5 Systems Approach to Alternative Fuel Infrastructure ..................................................... 70
5.1 Introduction .................................................................................................................... 70
5.2 Electricity......................................................................................................................... 70
5.3 Compressed Natural Gas (CNG) ........................................................................................ 72
5.4 Hydrogen ......................................................................................................................... 73
5.5 Lower emission energy investments ................................................................................. 75
5.6 Summary ......................................................................................................................... 77
6 Marketing .................................................................................................................... 78
6.1 Introduction .................................................................................................................... 78
6.2 Brand Value ..................................................................................................................... 78
6.2.1 Overview .............................................................................................................................................. 78
6.2.2 Case Study – Why is Royal Dutch Shell leading? .................................................................................. 80
6.3 Supermajors Marketing Strategy ...................................................................................... 82
6.3.1 Advertising ........................................................................................................................................... 82
6.3.2 Additive Quality .................................................................................................................................... 83
6.3.3 Brand Loyalty Offerings ........................................................................................................................ 85
6.4 Independents Marketing Strategy .................................................................................... 87

9
6.4.1 Case Study – Buc-ee’s........................................................................................................................... 87
6.4.2 Case Study – Wawa .............................................................................................................................. 88
6.4.3 Comparison of Independents and Supermajors .................................................................................. 89
6.5 Summary ......................................................................................................................... 89
7 Conclusion.................................................................................................................... 90
8 References ................................................................................................................... 92

10
[This page is intentionally left blank.]
11
List of Figures
Figure 1: Factors customers consider when choosing a retail station ......................................... 20
Figure 2: Overview of integrated supply chain of Supermajors ................................................... 21
Figure 3: Historical Comparison of Upstream & Downstream Earnings versus Crude Oil Prices. 23
Figure 4: Geographic locations for producing assets.................................................................... 24
Figure 5: Change in Supermajor market share (in terms of revenue) over 5 years. .................... 25
Figure 6: Supermajor US market share (market share and station count) from 2016 to 2019. .. 27
Figure 7: Independent US market share (market share and station count) from 2016 to 2019. 28
Figure 8: Energy consumption and future demand forecasts for petroleum products in the
transportation sector. AEO Data from 1994 to 2020. ................................................................. 33
Figure 9: Energy consumption and future demand forecasts for electrification in the
transportation sector. ................................................................................................................... 34
Figure 10: Energy consumption and future demand forecasts for ethanol, biodiesel, and
renewable diesel in the transportation sector. ............................................................................ 36
Figure 11: Forecast data compared to actuals for gasoline consumption in the US transportation
sector. ........................................................................................................................................... 38
Figure 12: Forecast data compared to actuals for petroleum diesel consumption in the US
transportation sector. ................................................................................................................... 39
Figure 13: Forecasting accuracy for gasoline and diesel demand in the transportation sector. . 40
Figure 14: Forecast data compared to actuals for electricity consumption in the US transportation
sector. ........................................................................................................................................... 41
Figure 15: Forecasting accuracy of electricity demand in the transportation sector. Note the
difference in vertical scale relative to Figure 17 (0-35%) ............................................................ 42
Figure 16: Forecast data compared to actuals for biodiesel consumption in the US transportation
sector. ........................................................................................................................................... 43
Figure 17: Forecasting accuracy of electricity demand in the transportation sector. ................. 43
Figure 18: Forecast data compared to actuals for biodiesel consumption in the US transportation
sector. ........................................................................................................................................... 45

12
Figure 19: Forecast data compared to actuals for renewable diesel consumption in the US
transportation sector. ................................................................................................................... 46
Figure 20: Actual consumption by energy source for transportation fuels and AEO 2020 Forecast
for future demand. ....................................................................................................................... 47
Figure 21: The features listed below are considered the most important to consumers. Also
captured are the items that were most recently identified as the biggest barriers consumers had
around EV adoption. The qualitative scale highlights the vehicle type that is leading among each
category ........................................................................................................................................ 50
Figure 22: Feedback loop for continual improvement in Retail. .................................................. 55
Figure 23: Qualitative summary of what factors are most important to consumers when buying
fuel. ............................................................................................................................................... 56
Figure 24 Tables summarizing the factors that influence station demand and greenhouse gas
emissions. Also summarized are how the factors are weighted when it comes to the utility the
entire system offers to consumers. .............................................................................................. 57
Figure 25 The alternatives associated with each station feature. Also provided is the “demand
factor” and “GHG Factor” assigned to each alternative. .............................................................. 58
Figure 26 Sample of the ~155,000 station configuration achievable from the alternatives shown
in Figure 12.................................................................................................................................... 59
Figure 27 Demand and GHG factor for system (DFS and GHGFS) versus utility (UDF and UGHGF).
....................................................................................................................................................... 59
Figure 28 Tradespace analysis that represents current state of retail industry (consumer choice
and GHG reduction targets/requirements) .................................................................................. 61
Figure 29 Tradespace analysis that represents current state of retail industry but GHG and
Demand are equally weighted (consumer choice and GHG reduction targets/requirements) ... 62
Figure 30 Tradespace analysis that represents current state of retail industry but GHG is weighted
at 90% and Demand ay 10%. ........................................................................................................ 62
Figure 31 Tables summarizing the factors that influence station demand and greenhouse gas
emissions for Use Case 1. Also summarized are how the factors are weighted when it comes to
the utility the entire system offers to consumers. ....................................................................... 63
13
Figure 32 The Use Case 1 alternatives associated with each station feature. Also provided is the
“demand factor” and “GHG Factor” assigned to each alternative. .............................................. 64
Figure 33 Tradespace analysis that represents Use Case #1. Demand is weighted more heavily
and GHG emissions at 90% and 10% respectively. ....................................................................... 65
Figure 34 Tradespace analysis that represents Use Case #1. Demand and GHG emissions are
weighted equally at 50%. .............................................................................................................. 65
Figure 35 Tradespace analysis that represents Use Case #1. GHG emissions are weighted more
heavily than demand at 90% and 10% respectively. .................................................................... 66
Figure 36 Figure 19 The Use Case 2 alternatives associated with each station feature. Also
provided is the “demand factor” and “GHG Factor” assigned to each alternative. ..................... 67
Figure 37 Tradespace analysis that represents Use Case #2. Demand is weighted more heavily
than GHG emissions at 90% and 10% respectively....................................................................... 68
Figure 38 Tradespace analysis that represents Use Case #2. Demand and GHG emissions are
weighted equally at 50%. .............................................................................................................. 68
Figure 39 Tradespace analysis that represents Use Case #2. GHG emissions are weighted more
heavily than demand at 90% and 10% respectively. .................................................................... 69
Figure 40: Alternative Fuel Infrastructure: Electricity .................................................................. 71
Figure 41: Alternative Fuel Infrastructure: Compressed Natural Gas .......................................... 73
Figure 42: Alternative Fuel Infrastructure: Hydrogen .................................................................. 74
Figure 43: Brand value of the Supermajors over time.................................................................. 79
Figure 44: What the Supermajors say about their additives. ....................................................... 84

14
List of Tables
Table 1 Carbon intensity and energy density of motor gasoline, diesel, ethanol, biodiesel, and
renewable diesel. .......................................................................................................................... 35
Table 2: Summary of the loyalty offerings for each Supermajor.................................................. 86
15
List of Acronyms
AEO Annual Energy Outlook
AQ Additive Quality
B2C Business-to-Consumer
BEV Battery Electric Vehicle
BTU British Thermal Unit
CF Cost Factor
CNG Compressed Natural Gas
CPG Cents Per Gallon
CSO Convenience Store Offering
DF Design Factor
DTW Dealer Tank Wagon
EIA U.S. Energy Information Administration
EV Electric Vehicle
FTO Fuel Type Offering
FUT Fill Up Time
GHG Greenhouse Gas
GHG GHG Factor
HEV Hybrid Electric Vehicle
IOC Integrated Oil Company
LCFS Low Carbon Fuel Standard
LDV Light-Duty Vehicle
LPO Loyalty Program Offering
MTD Max Travel Distance
O&G Oil and Gas
OI/B Overall Image/Brand
PD Price Differential
PHEV Plug-in Hybrid Vehicle
16
PO
RFS
Payment Optionality
Renewable Fuel Standard
RIN Renewable Identification Numbers
SDM System and Design Management
T Total
U Utility
VIO Vehicles in Operation
W Weight
ZEV Zero Emission Vehicles
17
1 INTRODUCTION
1.1 Background
Energy Supermajors are composed of an Upstream and Downstream business
unit. Upstream secures reserves to extract crude oil and downstream uses crude oil to
manufacture and market finished petroleum fuels. The advantage of this structure can be
explained by the effect crude price has on Upstream and Downstream earnings. Crude oil is the
primary feedstock used to produce petroleum products for transportation energy. When the
price of crude is high, Upstream profits significantly and downstream returns are marginal.
However, when the price of crude is low, downstream earnings are strong. (Marten and Ruiz-
Cabrero 2015) This is perhaps the best explanation for why Supermajors, the largest integrated
energy companies, have thrived financially for over a century.
The Downstream division manufactures and markets petroleum products. These
products include road transportation fuel, such as multiple grades of gasoline and diesel. Once
the product is refined, it is distributed throughout different sales channels. The sales channels
include wholesale, dealer tank wagon (DTW), and retail. The wholesale outlet includes the bulk
sale of gasoline and diesel to industry customers and unbranded operators and distributors. The
retail channel represents transportation products that are sold through company-branded
gasoline stations. (“Oil 101 - Petroleum Product Marketing - Downstream Oil & Gas” n.d.) This
business to consumer retail outlet tends to be less exposed to price volatility compared to
wholesale and DTW and will be the focus of this thesis. (“How Branded Stations Operate | NACS”
n.d.)
Supermajors will face numerous challenges at the retail level as demand for petroleum
products in the transportation sector is projected to remain flat through 2050. (“Annual Energy
Outlook 2020” 2020) These challenges include:
● The ability to sell refining production in the long term due to projected demand for oil in the
transportation sector (“Annual Energy Outlook 2020” 2020)
● Competition from non-majors in the industry (“Selling America’s Fuel | NACS” n.d.)

18
● Competition in retail operations from gas stations that are not vertically integrated into oil
production (“Selling America’s Fuel | NACS” n.d.)
● Emergence of lower emission transportation vehicle alternatives that create a need for
different raw material inputs (electricity, hydrogen) and capital equipment in the retail
sector (“EV-Volumes - The Electric Vehicle World Sales Database” n.d.; “There Are More
Than 6,500 Fuel Cell Vehicles On the Road in the U.S. | Department of Energy” n.d.)
● Future automobile fleet regulations could decrease demand for gasoline (“Federal Vehicle
Standards — Center for Climate and Energy Solutions” n.d.)
● Changes in consumer preference relative to energy sources for vehicles (“Electric Vehicle
Trends | Deloitte Insights” n.d.)
The U.S. oil market experienced a significant step change with the increase in onshore drilling
operations. (“Understanding Shale’s Success Factors | Deloitte Insights” n.d.) This enabled the
U.S. to produce enough oil to meet domestic demand for energy and contributed to the
oversaturation of oil in the global market that is seen today. (“The United States Was Energy
Independent in 2019 for the First Time Since 1957 - IER” n.d.; “The US Is about to Send a Lot More
Oil into an Oversupplied Market” n.d.) The oversupply of crude, the primary feedstock for
transportation fuels, is making it increasingly more important to place refinery production
through retail outlets, now the most profitable sales channel for Majors. This market condition,
the oversupply of oil, will likely remain unchanged for the foreseeable future considering onshore
drilling is the lowest cost option for crude production in the US. (“The United States as a Global
Oil Supplier” n.d.) This has been recognized by industry and the competitive landscape at the
retail level has changed as a result.
The competitive landscape for retail has also evolved significantly over the past decades.
Roughly 10 years ago, several Supermajors divested their Retail sectors to focus on Upstream
opportunities, which enabled independent retailers to enter the market (“Major’s Divestment of
Retail” n.d.). Today, Major brands hold 34% of market share by revenue (Oller 2019; Vamburkar
and Polson n.d.). The market share for Independents is expected to increase in certain geographic
locations in the U.S. making it a critical watchpoint in the short and long term.
19
Lower emission alternatives, including Electric vehicles, have become more attractive to
consumers over the last decade. Electric vehicles sales increased by 29% between 2018 and 2019
(SOURCE) (“Electric Vehicle Trends | Deloitte Insights” n.d.). Renewable fuels entered the market
during the early 2000s and regulation incentivizing use has enabled growth in this sector.
Although forecasts for the growth of vehicle electrification and renewables in the transportation
sector indicate market share will remain below 11% through 2050, there are reasons to challenge
that projection (“Annual Energy Outlook 2020” 2020). This will be further explored in Chapters
3 and 4.
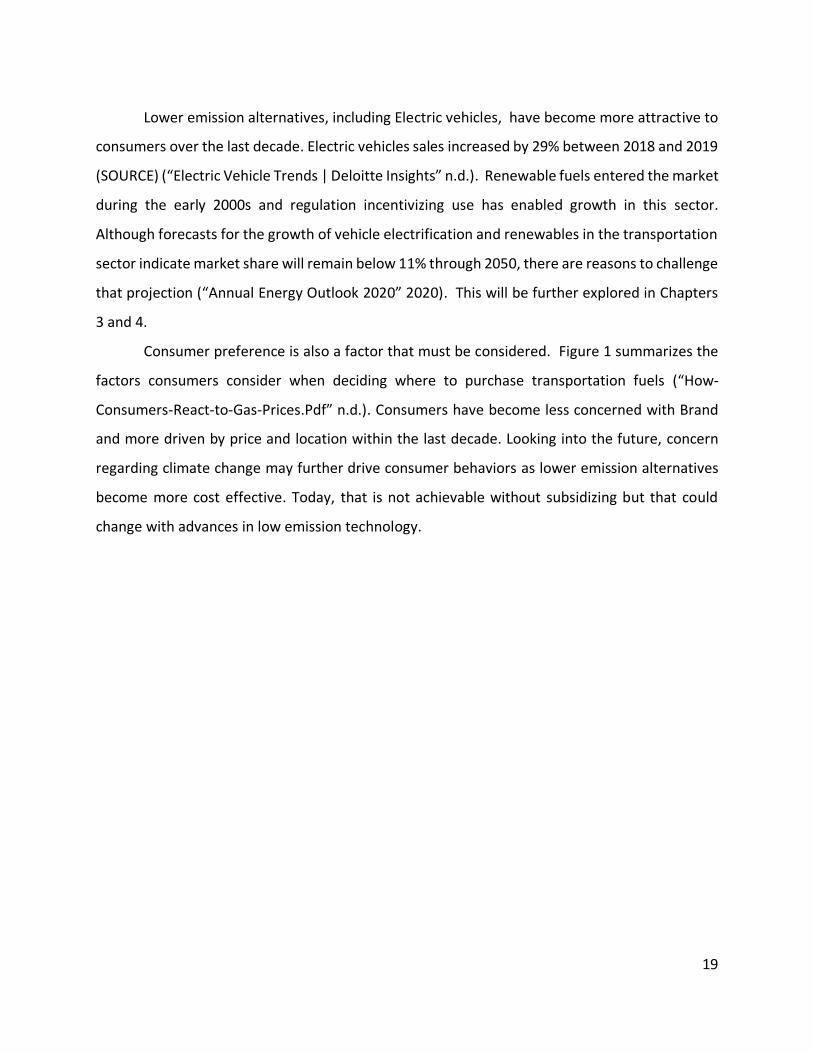
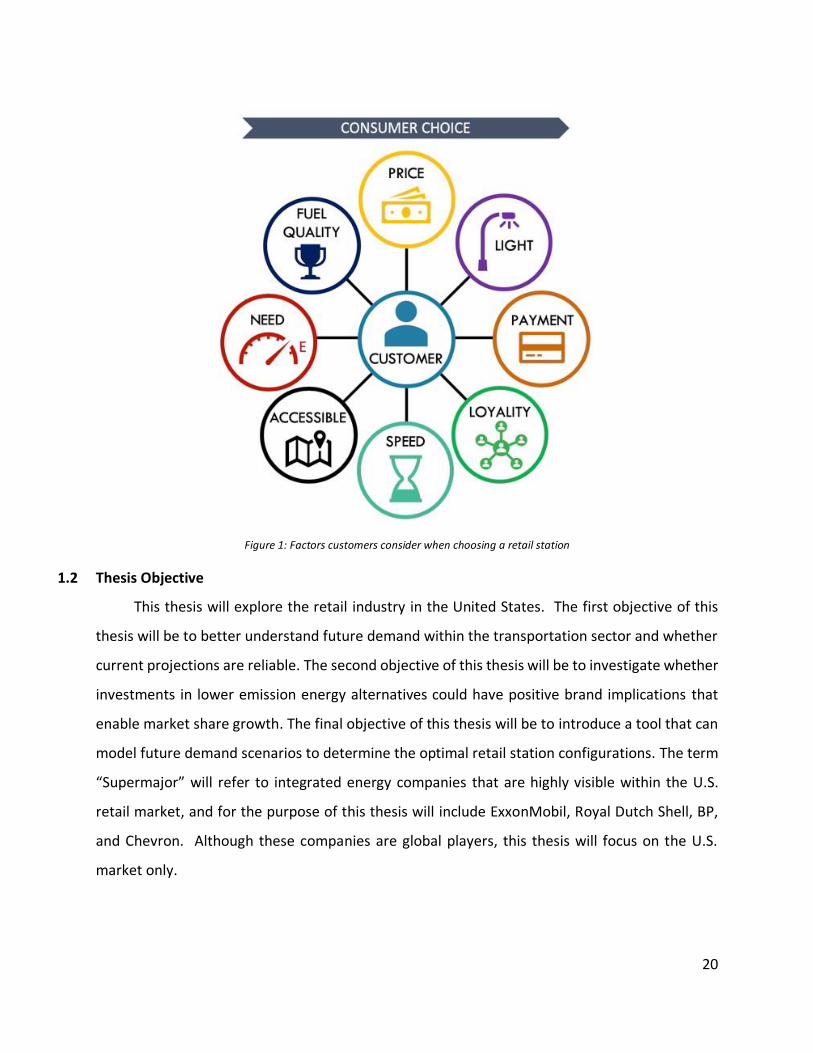
Consumer preference is also a factor that must be considered. Figure 1 summarizes the
factors consumers consider when deciding where to purchase transportation fuels (“How-
Consumers-React-to-Gas-Prices.Pdf” n.d.). Consumers have become less concerned with Brand
and more driven by price and location within the last decade. Looking into the future, concern
regarding climate change may further drive consumer behaviors as lower emission alternatives
become more cost effective. Today, that is not achievable without subsidizing but that could
change with advances in low emission technology.
20
Figure 1: Factors customers consider when choosing a retail station
1.2 Thesis Objective
This thesis will explore the retail industry in the United States. The first objective of this
thesis will be to better understand future demand within the transportation sector and whether
current projections are reliable. The second objective of this thesis will be to investigate whether
investments in lower emission energy alternatives could have positive brand implications that
enable market share growth. The final objective of this thesis will be to introduce a tool that can
model future demand scenarios to determine the optimal retail station configurations. The term
“Supermajor” will refer to integrated energy companies that are highly visible within the U.S.
retail market, and for the purpose of this thesis will include ExxonMobil, Royal Dutch Shell, BP,
and Chevron. Although these companies are global players, this thesis will focus on the U.S.
market only.

21
2 CURRENT STATE OF RETAIL INDUSTRY IN U.S.
2.1 Introduction
During the early 2000s, Supermajors divested their retail networks to secure capital for
upstream investments. Today, there is evidence showing Supermajors are re-evaluating the
importance of this segment of the crude to customer supply chain. Integration of the supply
chain, from crude production to end use, as shown in Figure 2, positions Supermajors to minimize
their financial exposure when crude prices are low. (Stacey and Crooks n.d.). Crude production
in the U.S. increased by 123% over the last ten years (“U.S. Field Production of Crude Oil,” n.d.)
with refining throughput increasing by 16% during the same period (“Energy Market Stats” n.d.).
Supermajors, like Chevron and ExxonMobil, are heavily invested in this operation and have
increased the U.S. refining capacity to reliably place their production (“IBIS - Petroleum Refining
the U.S.” n.d.). This sequence of events has led integrated oil companies to reconsider retail
considering this sector is the largest consumer of refined products. The background specific to
these changes and an overview of Supermajor’s current position across the supply chain will be
provided in Section 2.2 and 2.3.
Figure 2: Overview of integrated supply chain of Supermajors
Demand for petroleum products in the transportation sector is projected to remain flat
through 2050. This coupled with regulation deterring the use of petroleum products, is also a
variable that must be managed effectively to ensure long term success in the retail industry. The
last section of Chapter 2 will provide an overview of U.S. regulations, Federal and State, that
impact the retail industry.
22
2.2 Background
During the early 2000s, Majors began to divest their U.S. retail networks to free up capital
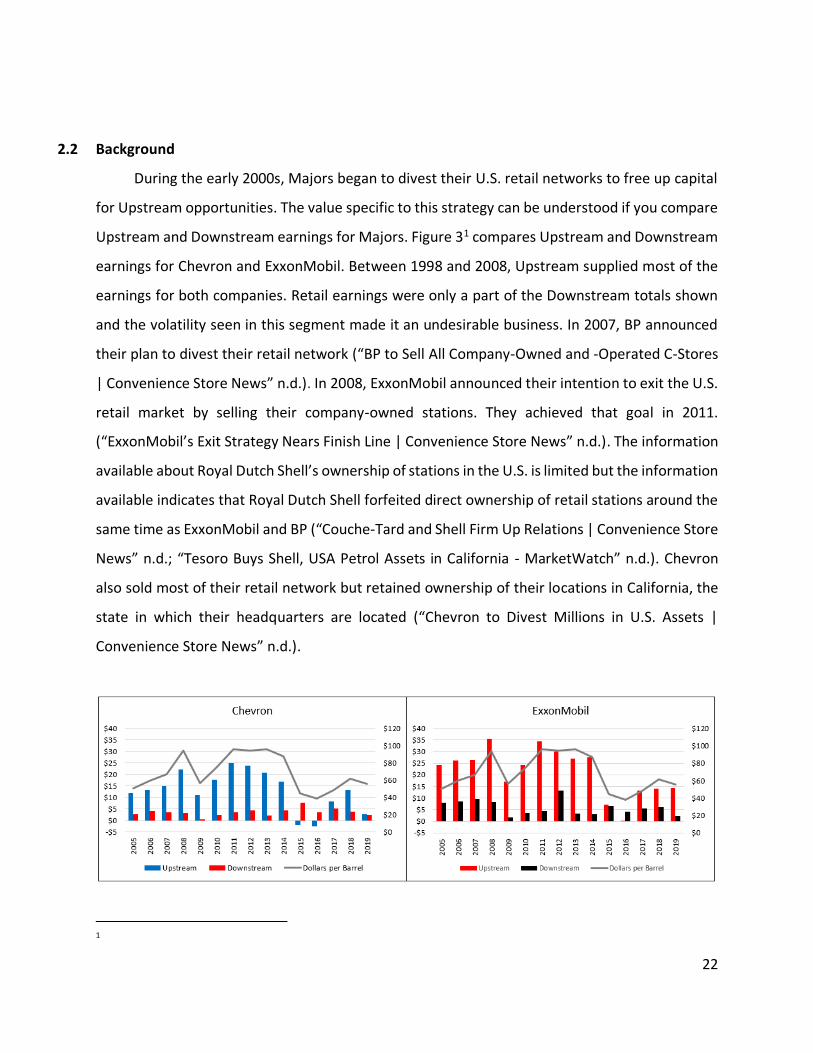
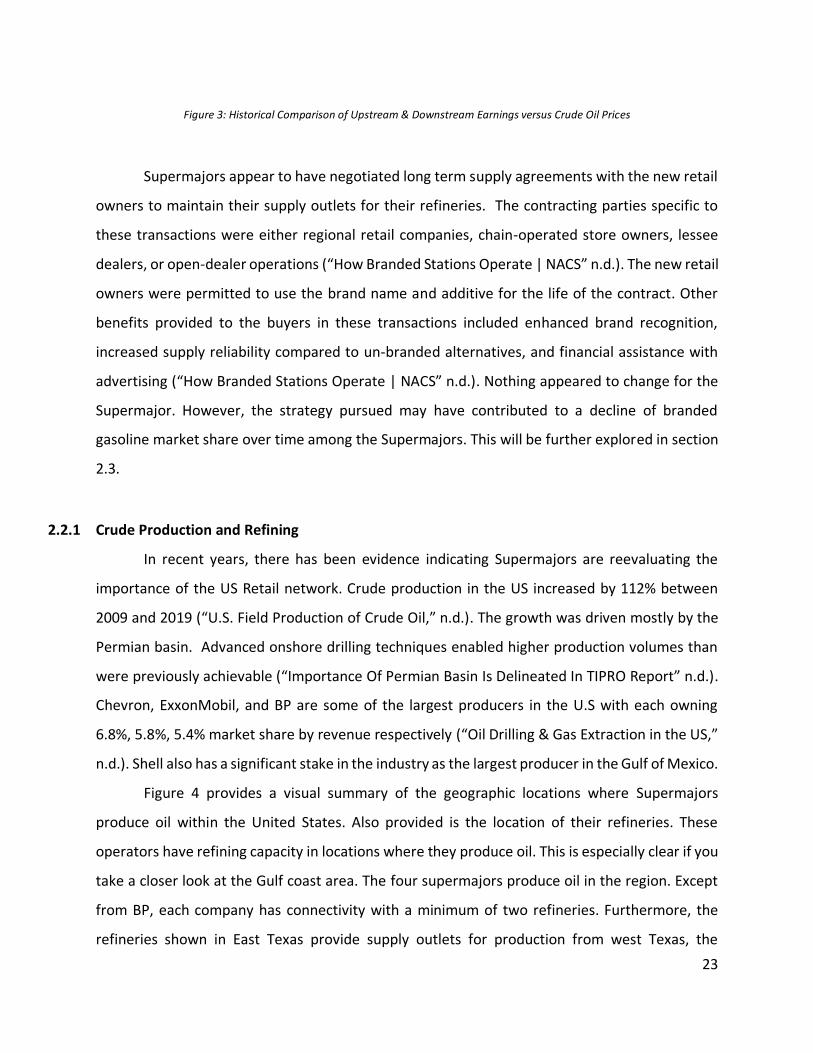
for Upstream opportunities. The value specific to this strategy can be understood if you compare
Upstream and Downstream earnings for Majors. Figure 31 compares Upstream and Downstream
earnings for Chevron and ExxonMobil. Between 1998 and 2008, Upstream supplied most of the
earnings for both companies. Retail earnings were only a part of the Downstream totals shown
and the volatility seen in this segment made it an undesirable business. In 2007, BP announced
their plan to divest their retail network (“BP to Sell All Company-Owned and -Operated C-Stores
| Convenience Store News” n.d.). In 2008, ExxonMobil announced their intention to exit the U.S.
retail market by selling their company-owned stations. They achieved that goal in 2011.
(“ExxonMobil’s Exit Strategy Nears Finish Line | Convenience Store News” n.d.). The information
available about Royal Dutch Shell’s ownership of stations in the U.S. is limited but the information
available indicates that Royal Dutch Shell forfeited direct ownership of retail stations around the
same time as ExxonMobil and BP (“Couche-Tard and Shell Firm Up Relations | Convenience Store
News” n.d.; “Tesoro Buys Shell, USA Petrol Assets in California - MarketWatch” n.d.). Chevron
also sold most of their retail network but retained ownership of their locations in California, the
state in which their headquarters are located (“Chevron to Divest Millions in U.S. Assets |
Convenience Store News” n.d.).
1
23
Figure 3: Historical Comparison of Upstream & Downstream Earnings versus Crude Oil Prices
Supermajors appear to have negotiated long term supply agreements with the new retail
owners to maintain their supply outlets for their refineries. The contracting parties specific to
these transactions were either regional retail companies, chain-operated store owners, lessee
dealers, or open-dealer operations (“How Branded Stations Operate | NACS” n.d.). The new retail
owners were permitted to use the brand name and additive for the life of the contract. Other
benefits provided to the buyers in these transactions included enhanced brand recognition,
increased supply reliability compared to un-branded alternatives, and financial assistance with
advertising (“How Branded Stations Operate | NACS” n.d.). Nothing appeared to change for the
Supermajor. However, the strategy pursued may have contributed to a decline of branded
gasoline market share over time among the Supermajors. This will be further explored in section
2.3.
2.2.1 Crude Production and Refining
In recent years, there has been evidence indicating Supermajors are reevaluating the
importance of the US Retail network. Crude production in the US increased by 112% between
2009 and 2019 (“U.S. Field Production of Crude Oil,” n.d.). The growth was driven mostly by the
Permian basin. Advanced onshore drilling techniques enabled higher production volumes than
were previously achievable (“Importance Of Permian Basin Is Delineated In TIPRO Report” n.d.).
Chevron, ExxonMobil, and BP are some of the largest producers in the U.S with each owning
6.8%, 5.8%, 5.4% market share by revenue respectively (“Oil Drilling & Gas Extraction in the US,”
n.d.). Shell also has a significant stake in the industry as the largest producer in the Gulf of Mexico.
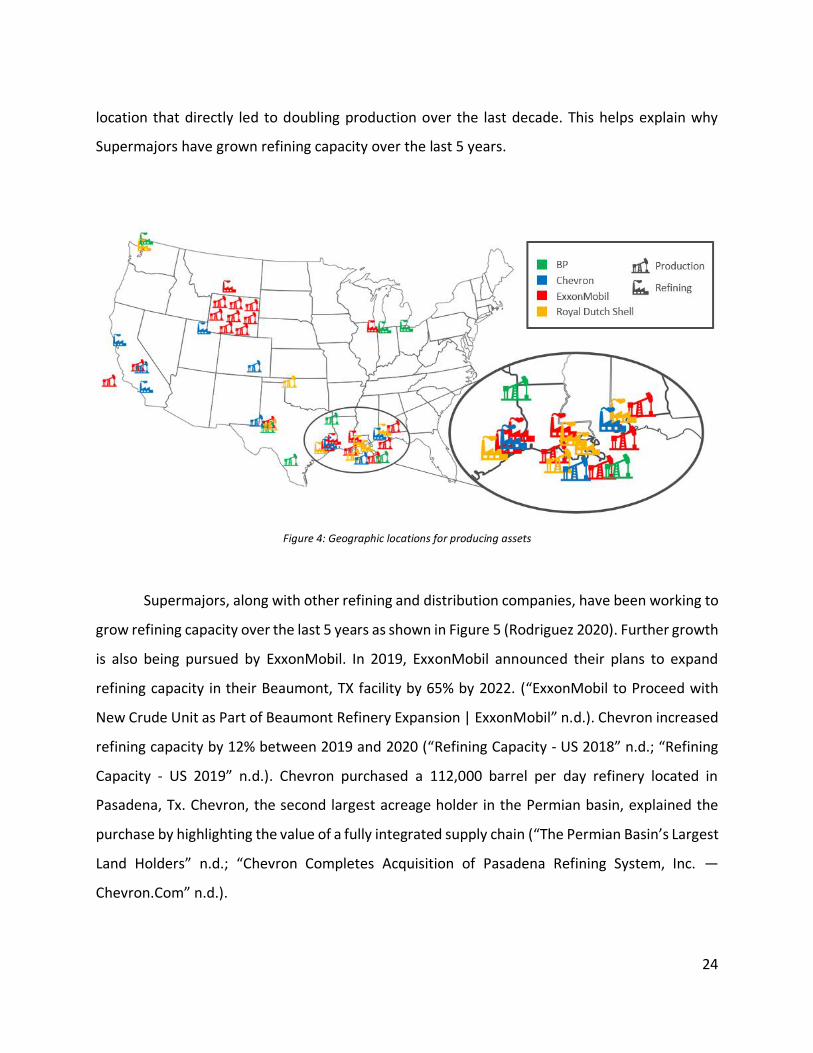
Figure 4 provides a visual summary of the geographic locations where Supermajors
produce oil within the United States. Also provided is the location of their refineries. These
operators have refining capacity in locations where they produce oil. This is especially clear if you
take a closer look at the Gulf coast area. The four supermajors produce oil in the region. Except
from BP, each company has connectivity with a minimum of two refineries. Furthermore, the
refineries shown in East Texas provide supply outlets for production from west Texas, the
24
location that directly led to doubling production over the last decade. This helps explain why
Supermajors have grown refining capacity over the last 5 years.
Figure 4: Geographic locations for producing assets
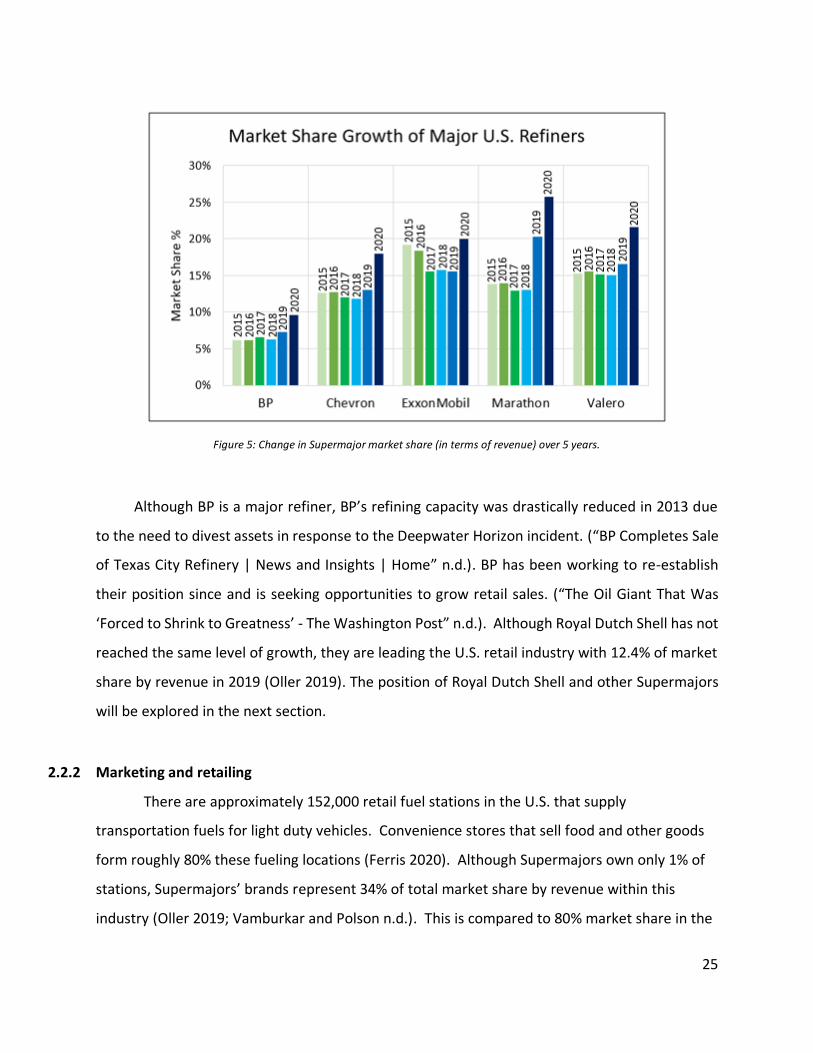
Supermajors, along with other refining and distribution companies, have been working to
grow refining capacity over the last 5 years as shown in Figure 5 (Rodriguez 2020). Further growth
is also being pursued by ExxonMobil. In 2019, ExxonMobil announced their plans to expand
refining capacity in their Beaumont, TX facility by 65% by 2022. (“ExxonMobil to Proceed with
New Crude Unit as Part of Beaumont Refinery Expansion | ExxonMobil” n.d.). Chevron increased
refining capacity by 12% between 2019 and 2020 (“Refining Capacity - US 2018” n.d.; “Refining
Capacity - US 2019” n.d.). Chevron purchased a 112,000 barrel per day refinery located in
Pasadena, Tx. Chevron, the second largest acreage holder in the Permian basin, explained the
purchase by highlighting the value of a fully integrated supply chain (“The Permian Basin’s Largest
Land Holders” n.d.; “Chevron Completes Acquisition of Pasadena Refining System, Inc. —
Chevron.Com” n.d.).
25
Figure 5: Change in Supermajor market share (in terms of revenue) over 5 years.
Although BP is a major refiner, BP’s refining capacity was drastically reduced in 2013 due
to the need to divest assets in response to the Deepwater Horizon incident. (“BP Completes Sale
of Texas City Refinery | News and Insights | Home” n.d.). BP has been working to re-establish
their position since and is seeking opportunities to grow retail sales. (“The Oil Giant That Was
‘Forced to Shrink to Greatness’ - The Washington Post” n.d.). Although Royal Dutch Shell has not
reached the same level of growth, they are leading the U.S. retail industry with 12.4% of market
share by revenue in 2019 (Oller 2019). The position of Royal Dutch Shell and other Supermajors
will be explored in the next section.
2.2.2 Marketing and retailing
There are approximately 152,000 retail fuel stations in the U.S. that supply
transportation fuels for light duty vehicles. Convenience stores that sell food and other goods
form roughly 80% these fueling locations (Ferris 2020). Although Supermajors own only 1% of
stations, Supermajors’ brands represent 34% of total market share by revenue within this
industry (Oller 2019; Vamburkar and Polson n.d.). This is compared to 80% market share in the
26
1980s (Oller 2019). Market share concentration continues to decline in the retail industry, and
it is valuable to understand what is driving this shift (Diment, n.d.).
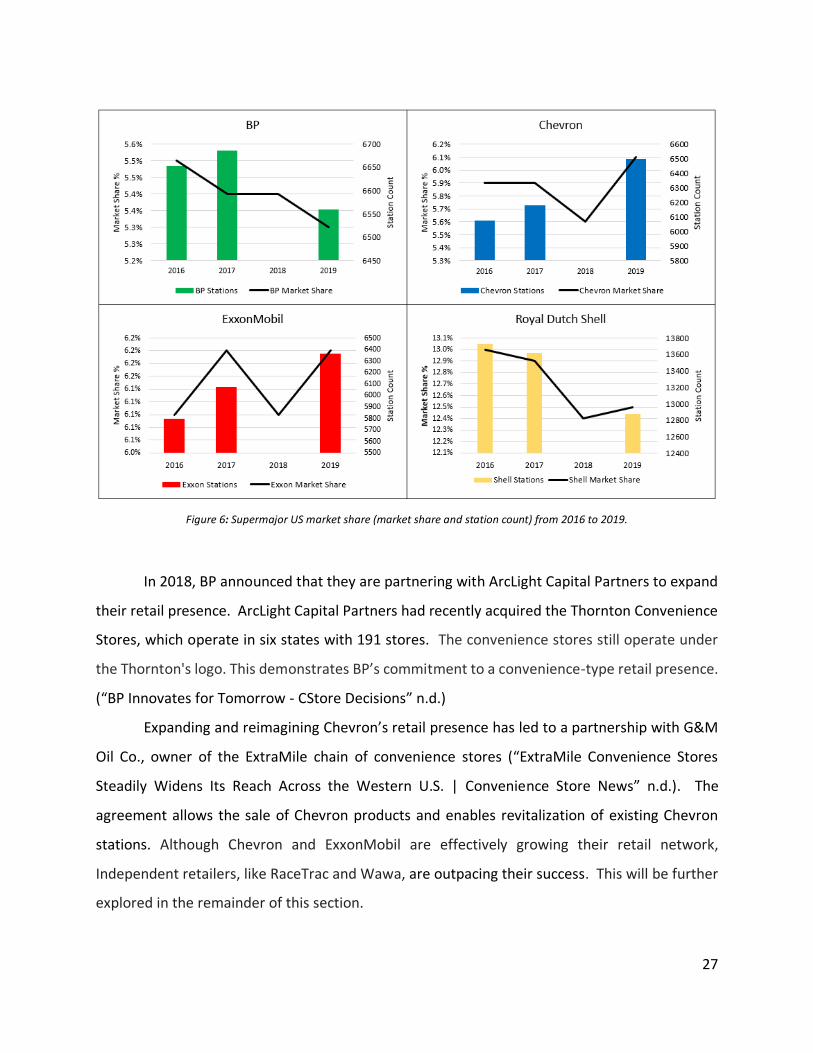
Royal Dutch Shell leads Majors in total retail market share in the US as shown in Figure 62
and they continue to act aggressively in their effort to grow their branded network. In 2017, they
entered a partnership with Motiva, a U.S. refining and fuel marketing subsidiary of Saudi Aramco,
to market Shell-branded fuel (“Shell-Motiva Deal Divides Up Downstream” n.d.). Motiva received
exclusive rights to sell Shell-branded fuel in Georgia, North Carolina, South Carolina, Virginia,
Maryland, Washington, D.C., the eastern half of Texas, and most of Florida. Royal Dutch Shell
assumed sole ownership of the Norco, La., refinery, the Convent, La., refinery, eleven distribution
terminals, and the Shell-branded markets in Alabama, Mississippi, Tennessee, Louisiana, part of
the Florida Panhandle and the entire Northeastern United States. These assets were integrated
with Royal Dutch Shell's downstream business in North America all in fulfillment of goals to
increase Royal Dutch Shell’s retail presence. Like its competitors, Royal Dutch Shell recognizes
that term retail arrangements shield their exposure to price volatility of the retail market
compared to the export and wholesale sectors. (“Big Oil Makes a Major Retail Statement” n.d.).
2 (“Fuels 50 2018: Top 10 Brands by Market Share” n.d.; Oller 2019; “2020 Fuels 50: Top 5 Gas Brands by Market
Share” n.d.)
27
Figure 6: Supermajor US market share (market share and station count) from 2016 to 2019.
In 2018, BP announced that they are partnering with ArcLight Capital Partners to expand
their retail presence. ArcLight Capital Partners had recently acquired the Thornton Convenience
Stores, which operate in six states with 191 stores. The convenience stores still operate under
the Thornton's logo. This demonstrates BP’s commitment to a convenience-type retail presence.
(“BP Innovates for Tomorrow - CStore Decisions” n.d.)
Expanding and reimagining Chevron’s retail presence has led to a partnership with G&M
Oil Co., owner of the ExtraMile chain of convenience stores (“ExtraMile Convenience Stores
Steadily Widens Its Reach Across the Western U.S. | Convenience Store News” n.d.). The
agreement allows the sale of Chevron products and enables revitalization of existing Chevron
stations. Although Chevron and ExxonMobil are effectively growing their retail network,
Independent retailers, like RaceTrac and Wawa, are outpacing their success. This will be further
explored in the remainder of this section.
28
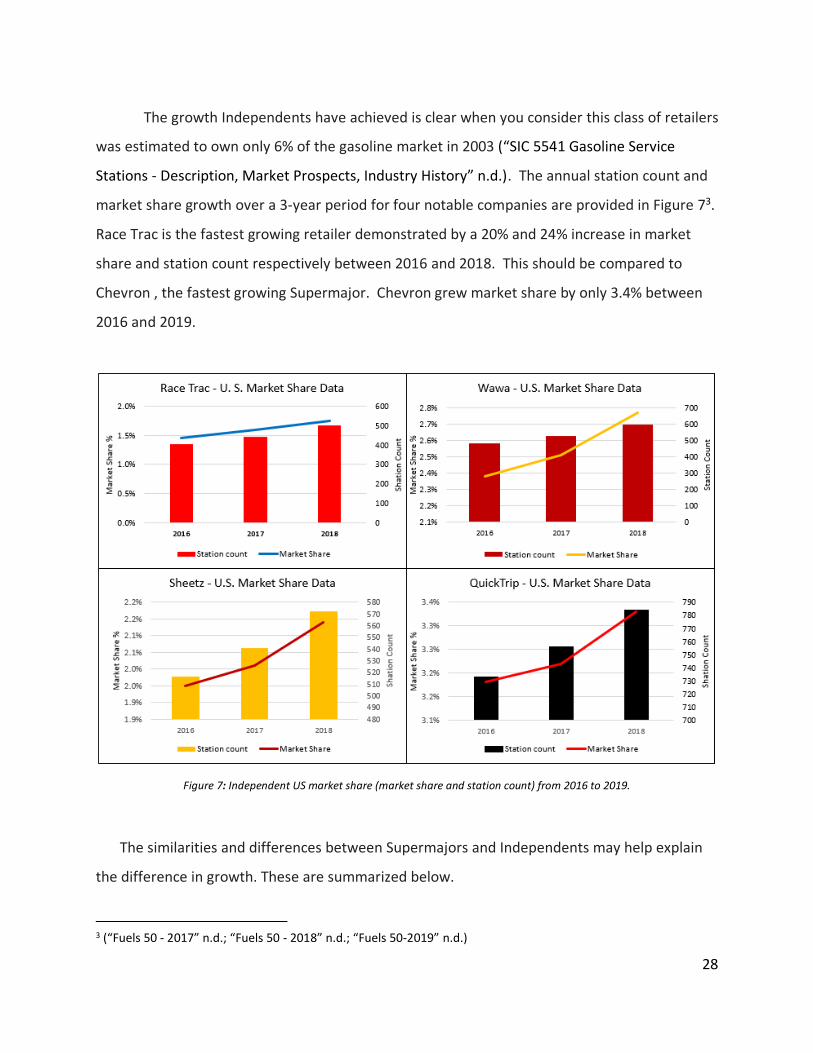
The growth Independents have achieved is clear when you consider this class of retailers
was estimated to own only 6% of the gasoline market in 2003 (“SIC 5541 Gasoline Service
Stations - Description, Market Prospects, Industry History” n.d.). The annual station count and
market share growth over a 3-year period for four notable companies are provided in Figure 73.
Race Trac is the fastest growing retailer demonstrated by a 20% and 24% increase in market
share and station count respectively between 2016 and 2018. This should be compared to
Chevron , the fastest growing Supermajor. Chevron grew market share by only 3.4% between
2016 and 2019.
Figure 7: Independent US market share (market share and station count) from 2016 to 2019.
The similarities and differences between Supermajors and Independents may help explain
the difference in growth. These are summarized below.
3 (“Fuels 50 - 2017” n.d.; “Fuels 50 - 2018” n.d.; “Fuels 50-2019” n.d.)
29
• Additive quality – Supermajors and Independents offer Top-tier additive. However, there is
strong evidence indicating that the additive packages provided by Supermajors are far superior
than those offered by Independents (“AAA: Not All Gasoline Created Equal | AAA NewsRoom”
n.d.).
• Pricing – Independents generally price their fuels below average and Supermajors charge a
premium (“The Truth about Gasoline: Does the Brand You Buy Really Make a Difference? -
South Florida Sun Sentinel - South Florida Sun-Sentinel” n.d.).
• Convenience Stores – Independents, like those highlighted in this section, achieve an
impressive level of consistency across their stores when it comes to food offerings, customer
service, and overall appearance compared to Supermajors (“Inside QuikTrip: Find out Why It’s
Always Ranked as One of the Best Places in U.S. to Work | Business News | Tulsaworld.Com”
n.d.).
The marketing strategy employed by Independents will be further assessed in Chapter 6. An
overview of current regulations affecting the retail industry will be provided in the last section of
Chapter 2.
2.3 Regulation in the U.S.
The transportation sector is one of the largest contributors to greenhouse gas emissions
in the United States (“Inventory of U.S. Greenhouse Gas Emissions and Sinks | Greenhouse Gas
(GHG) Emissions | US EPA” n.d.). Regulations, like the Renewable Fuel Standard, incentivizing the
consumption of lower emission energy alternatives are active within the U.S. today. States like
California and Oregon have enacted low carbon fuel standards to drive carbon emissions down
further (“Federal Vehicle Standards” n.d.). Standards that require efficiency improvements for
light duty vehicles may contribute to the potential for demand decline for petroleum products in
the future. These regulations will be further explored during the remainder of section 2.3.
2.3.1 Renewable Fuel Standard
The Renewable Fuel Standard was passed in 2005 (Bracmort 2020). The legislation
required refiners to blend a defined amount of renewable fuels for every gallon of petroleum
30
fuel produced. The required volumes increased every year and the class of fuels deemed
compliant included fuel categories like biomass based diesel and cellulosic (Schnepf and
Yacobucci, n.d.). If the refiners were unable to blend the necessary volumes needed, compliance
credits called RINs (Renewable Identification Numbers) could be purchased on the open market
to comply (“RINs 101: The Basics of Renewable Identification Numbers – Growth Energy” n.d.,
101). A RIN is a compliance identifier assigned to each gallon of renewables produced. The credit
generally goes to the “blender,” the entity that physically blends ethanol into gasoline prior to it
being delivered to retail. “Blenders” that are also refiners, like Supermajors, could use the RIN
generated to comply with the regulation. “Blenders” that were not refiners could generate
additional revenue by selling the credit to obligated parties (Bracmort 2020). This encouraged
parties to invest in blending capabilities which enabled the entry and growth of ethanol and
biodiesel in the transportation sector. The RFS is not set to “expire” until 2022 but could be
extended beyond that date considering the growing concern about climate change (Bracmort
2020).
2.3.2 Low Carbon Fuel Standard
In 2004, California’s Environmental Protection Agency began strategizing to reduce
greenhouse gas emissions. A Low Carbon Fuel Standard, with a goal of reducing greenhouse gas
emissions by “80% below 1990 levels by 2050” was implemented in January of 2011 as a result.
(“Low Carbon Fuel Standard | California Air Resources Board” n.d.) (“California’s 2050
Greenhouse Gas Emission Goals” n.d.). This regulation was a more aggressive attempt to enable
the supply and use of lower emission alternatives in the transportation sector compared to the
federally regulated Renewable Fuel Standard. (“Low Carbon Fuel Standard - Regulation .Pdf,”
n.d.)
Regulated parties, petroleum product distributors, have achieved compliance by blending
renewable fuels. The blending of ethanol into motor gasoline has generated the most credits
within the state since the start of the program. In 2013, the blending of biodiesel and renewable
diesel into petroleum diesel started to increase significantly and in 2017, renewable diesel passed
ethanol as the largest generator of compliance credits among renewables (Hanson and Agarwal,
31
n.d.). The program has reduced the carbon intensity of transportation fuels by 5% between 2011
and 2018 and it was recently extended through 2030 (“The Low Carbon Fuel Standard Has
Succeeded, but How Does It Work? - GHG and Carbon Accounting, Auditing, Management &
Training | Greenhouse Gas Management Institute” n.d.). States like Oregon and Washington
have passed similar legislation and wider adoption could be on the horizon (“Washington Should
Pass Clean-Fuel Standard like Oregon, California | The Seattle Times” n.d.). The impact this
standard has had on the retail industry will be further explored in Chapter 4.
2.3.3 CAFÉ Standards
The energy crisis of 1973 prompted Congress to legislate fuel efficiency standards to
reduce energy use (“Corporate Average Fuel Economy (CAFE) Standards | US Department of
Transportation” n.d.). In 1975, Corporate Average Fuel Economy (CAFÉ) standards were assigned
for each subsequent year regulating the efficiency obligation and requiring that vehicles average
the assigned mileage per gallon of fuel used. The EPA sets GHG emission reductions and the
NHTSA (National Highway Traffic Safety Administration) sets the CAFE standard for each category
of vehicle on the road. (“Corporate Average Fuel Economy | NHTSA” n.d.). The CAFE standard
remained the same for almost 20 years, between 1990 and 2010 for light duty vehicles. In 2010
the CAFE standards began increasing annually and continue that trend today (“Alternative Fuels
Data Center: Renewable Hydrocarbon Biofuels” n.d.)
2.4 Conclusion
The energy market in the U.S. has seen a remarkable change over the last 15 years.
Supermajors relinquished ownership of their retail networks and the U.S. produced more crude
than demanded for the first time in recent history. Supermajors have benefited on the Upstream
side as a result but have been challenged compared to Independents in their ability to recover
market share since. Legislation, local and Federal, disincentivizing the use of petroleum in the
transportation sector have been established and more stringent requirements are likely for the
future. A closer look at future demand within the U.S. transportation sector will be assessed in
Chapter 3.
32
3 TRANSPORTATION ENERGY DEMAND IN U.S.
3.1 Introduction
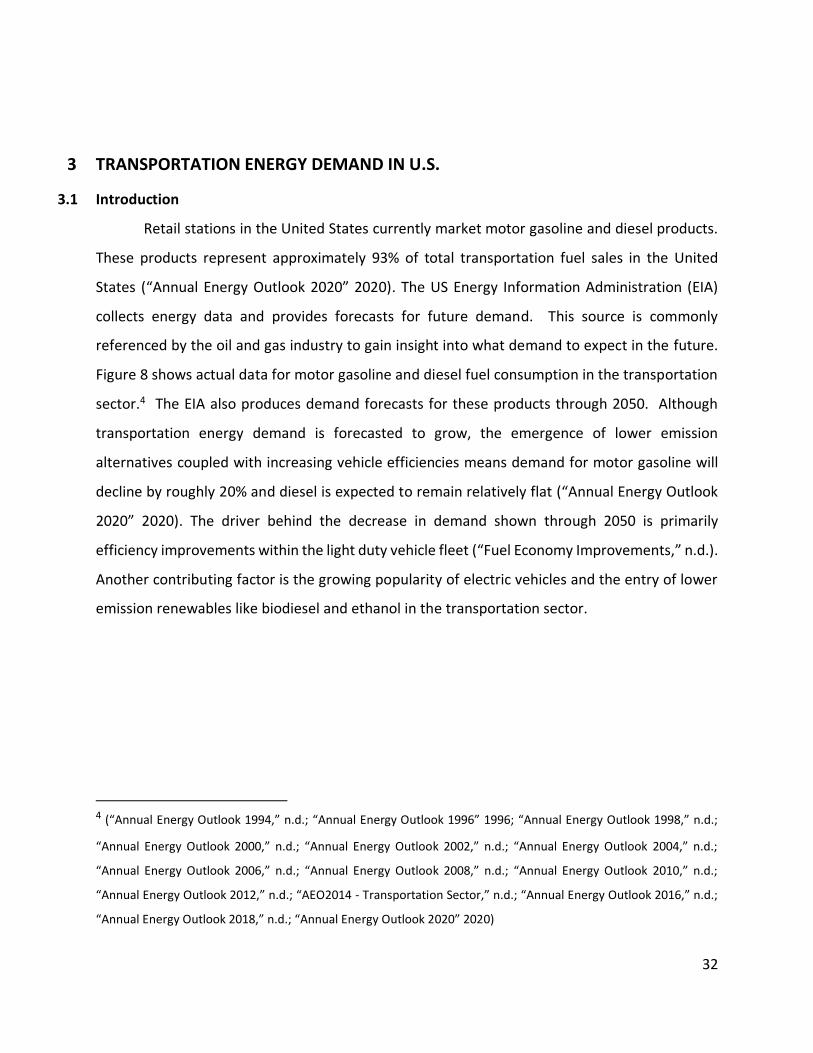
Retail stations in the United States currently market motor gasoline and diesel products.
These products represent approximately 93% of total transportation fuel sales in the United
States (“Annual Energy Outlook 2020” 2020). The US Energy Information Administration (EIA)
collects energy data and provides forecasts for future demand. This source is commonly
referenced by the oil and gas industry to gain insight into what demand to expect in the future.
Figure 8 shows actual data for motor gasoline and diesel fuel consumption in the transportation
sector.4 The EIA also produces demand forecasts for these products through 2050. Although
transportation energy demand is forecasted to grow, the emergence of lower emission
alternatives coupled with increasing vehicle efficiencies means demand for motor gasoline will
decline by roughly 20% and diesel is expected to remain relatively flat (“Annual Energy Outlook
2020” 2020). The driver behind the decrease in demand shown through 2050 is primarily
efficiency improvements within the light duty vehicle fleet (“Fuel Economy Improvements,” n.d.).
Another contributing factor is the growing popularity of electric vehicles and the entry of lower
emission renewables like biodiesel and ethanol in the transportation sector.
4 (“Annual Energy Outlook 1994,” n.d.; “Annual Energy Outlook 1996” 1996; “Annual Energy Outlook 1998,” n.d.;
“Annual Energy Outlook 2000,” n.d.; “Annual Energy Outlook 2002,” n.d.; “Annual Energy Outlook 2004,” n.d.;
“Annual Energy Outlook 2006,” n.d.; “Annual Energy Outlook 2008,” n.d.; “Annual Energy Outlook 2010,” n.d.;
“Annual Energy Outlook 2012,” n.d.; “AEO2014 - Transportation Sector,” n.d.; “Annual Energy Outlook 2016,” n.d.;
“Annual Energy Outlook 2018,” n.d.; “Annual Energy Outlook 2020” 2020)
33
Figure 8: Energy consumption and future demand forecasts for petroleum products in the transportation sector. AEO Data from
1994 to 2020.
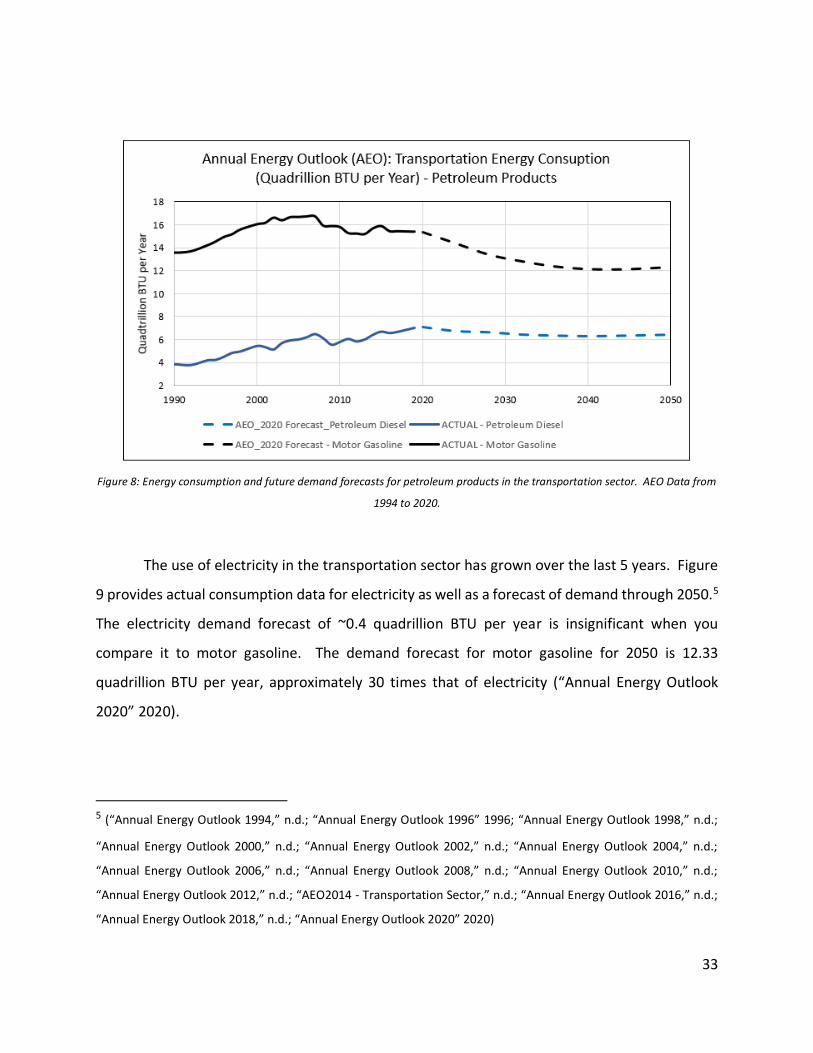
The use of electricity in the transportation sector has grown over the last 5 years. Figure
9 provides actual consumption data for electricity as well as a forecast of demand through 2050.5
The electricity demand forecast of ~0.4 quadrillion BTU per year is insignificant when you
compare it to motor gasoline. The demand forecast for motor gasoline for 2050 is 12.33
quadrillion BTU per year, approximately 30 times that of electricity (“Annual Energy Outlook
2020” 2020).
5 (“Annual Energy Outlook 1994,” n.d.; “Annual Energy Outlook 1996” 1996; “Annual Energy Outlook 1998,” n.d.;
“Annual Energy Outlook 2000,” n.d.; “Annual Energy Outlook 2002,” n.d.; “Annual Energy Outlook 2004,” n.d.;
“Annual Energy Outlook 2006,” n.d.; “Annual Energy Outlook 2008,” n.d.; “Annual Energy Outlook 2010,” n.d.;
“Annual Energy Outlook 2012,” n.d.; “AEO2014 - Transportation Sector,” n.d.; “Annual Energy Outlook 2016,” n.d.;
“Annual Energy Outlook 2018,” n.d.; “Annual Energy Outlook 2020” 2020)
34
Figure 9: Energy consumption and future demand forecasts for electrification in the transportation sector.
Over the last 15 years, the implementation of regulations, like the RFS and the Low Carbon
Fuel Standard (LCFS), incentivized the introduction of renewable fuels like ethanol, biodiesel, and
renewable diesel in the transportation sector. Ethanol, Biodiesel, and Renewable Diesel are fuels
produced from biomass like corn, vegetation-based waste, and byproducts derived from wood
processing (“Biomass-Based Diesel - Renewable Diesel Explained - U.S. Energy Information
Administration (EIA)” n.d.; “Ethanol Explained - U.S. Energy Information Administration (EIA)”
n.d.; “Alternative Fuels Data Center: Renewable Hydrocarbon Biofuels” n.d.). Renewable Diesel
and biodiesel are used as a blend component in diesel and ethanol is used as a blend component
in motor gasoline. Renewable diesel can be blended at higher percentages, compared to
biodiesel, while still maintaining vehicle performance standards. It is also chemically stable and
therefore easy to transport and store compared to Biodiesel. The carbon intensity (gCO2e/MJ)
and energy content (BTU/gallon) of these fuels are provided in Table 1 (“Transportation Fuels -
Energy Density.Pdf,” n.d.; “LCFS Pathway Certified Carbon Intensities | California Air Resources
Board” n.d.). The carbon intensity and energy density of renewables provided the lower emission
alternative needed to enable compliance.

35
Table 1 Carbon intensity and energy density of motor gasoline, diesel, ethanol, biodiesel, and renewable diesel.
Motor Gasoline Ethanol Petroleum Diesel Biodiesel Renewable Diesel
Carbon Intensity (gCO2e/MJ)
100.82 7.18-81.86 100.45 8.63-66.13 16.89-58.34
Energy Content 116,090 76,330 128,450 119,550 123,000
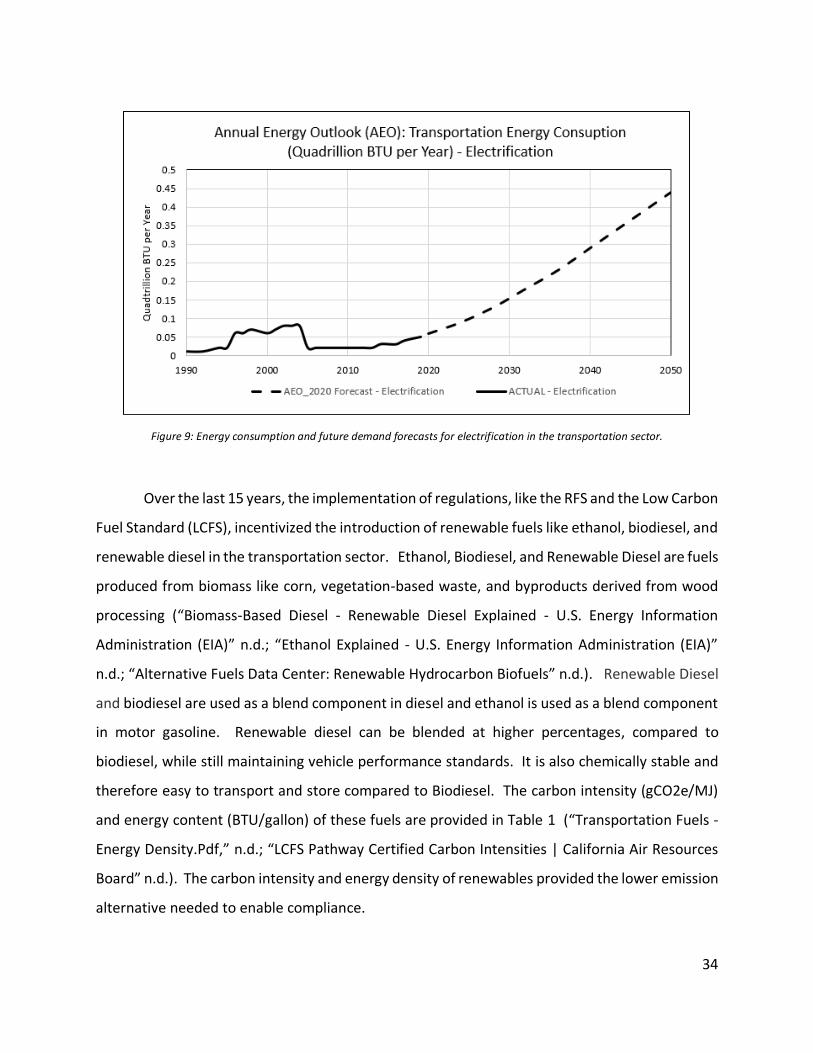
Actual consumption and the forecast for demand through 2050 for ethanol, biodiesel, and
renewable diesel are provided in Figure 106. Ethanol consumption increased by 223% between
2005 and 2010 because it was the primary compliance pathway for the Renewable Fuels Standard
at the time (“Annual Energy Outlook 2004,” n.d.; “Annual Energy Outlook 2006,” n.d.; “Annual
Energy Outlook 2008,” n.d.). Biodiesel started to come online in 2010 and consumption has
increased by 866% since (“Annual Energy Outlook 2008,” n.d.; “Annual Energy Outlook 2010,”
n.d.; “Annual Energy Outlook 2012,” n.d.; “AEO2014 - Transportation Sector,” n.d.; “Annual
Energy Outlook 2016,” n.d.; “Annual Energy Outlook 2018,” n.d.). Renewable diesel consumption
has grown significantly over the last five years. Demand for this product is expected to increase
by 2030. Although the renewable diesel demand is expected to increase by 500% between 2020
and 2032, it represents only 1% of total demand estimated in 2050 (“Annual Energy Outlook
2020” 2020).
6 (“Annual Energy Outlook 2006,” n.d.; “Annual Energy Outlook 2008,” n.d.; “Annual Energy Outlook 2010,” n.d.;
“Annual Energy Outlook 2012,” n.d.; “AEO2014 - Transportation Sector,” n.d.; “Annual Energy Outlook 2016,” n.d.;
“Annual Energy Outlook 2018,” n.d.; “Annual Energy Outlook 2020” 2020)
36
Figure 10: Energy consumption and future demand forecasts for ethanol, biodiesel, and renewable diesel in the transportation
sector.
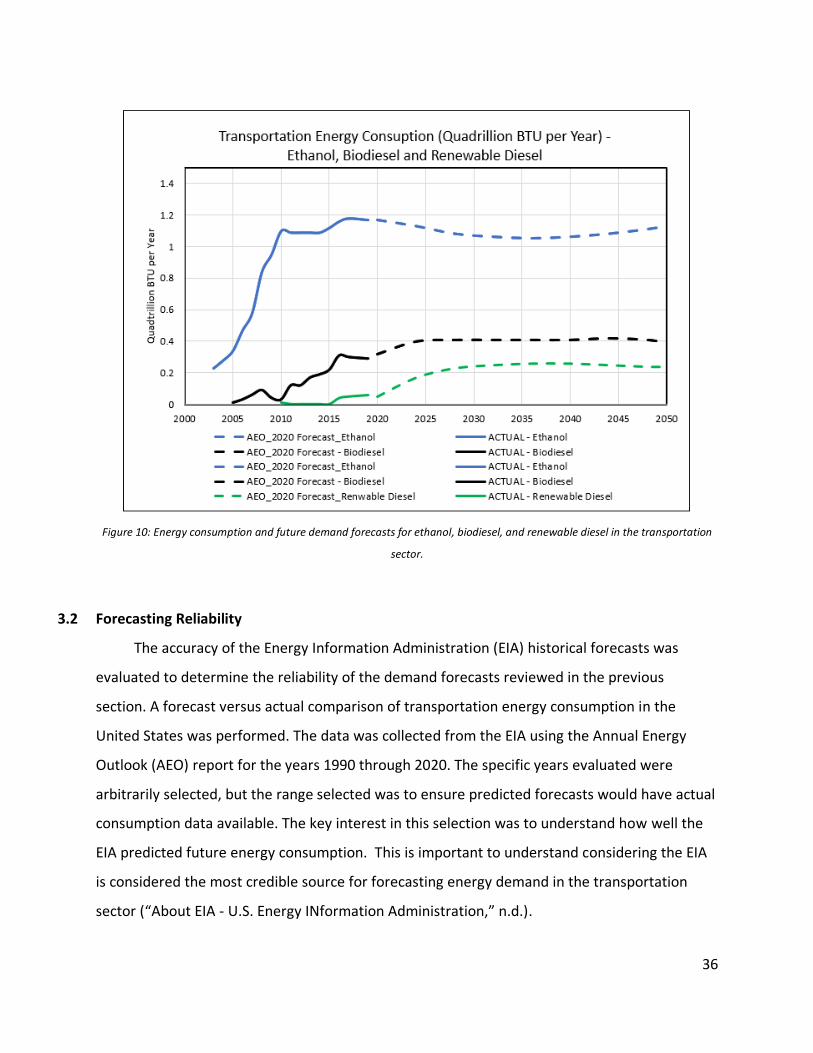
3.2 Forecasting Reliability
The accuracy of the Energy Information Administration (EIA) historical forecasts was
evaluated to determine the reliability of the demand forecasts reviewed in the previous
section. A forecast versus actual comparison of transportation energy consumption in the
United States was performed. The data was collected from the EIA using the Annual Energy
Outlook (AEO) report for the years 1990 through 2020. The specific years evaluated were
arbitrarily selected, but the range selected was to ensure predicted forecasts would have actual
consumption data available. The key interest in this selection was to understand how well the
EIA predicted future energy consumption. This is important to understand considering the EIA
is considered the most credible source for forecasting energy demand in the transportation
sector (“About EIA - U.S. Energy INformation Administration,” n.d.).
37
3.2.1 Motor Gasoline & Petroleum Diesel
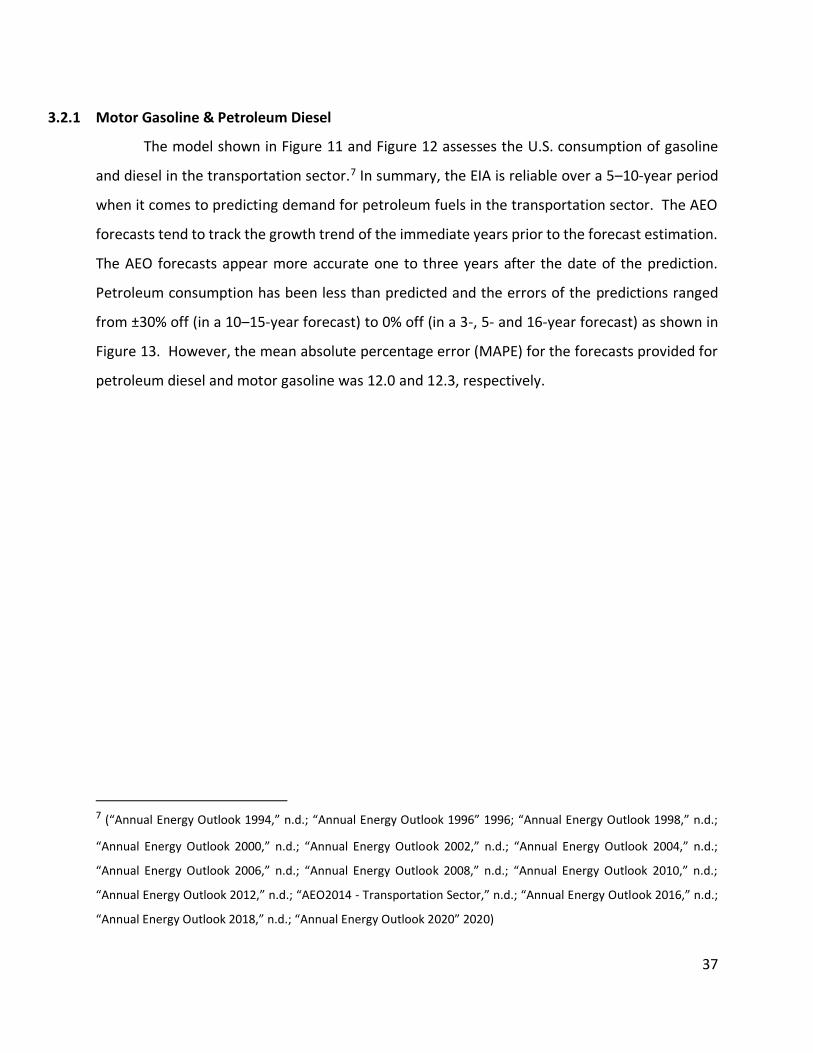
The model shown in Figure 11 and Figure 12 assesses the U.S. consumption of gasoline
and diesel in the transportation sector.7 In summary, the EIA is reliable over a 5–10-year period
when it comes to predicting demand for petroleum fuels in the transportation sector. The AEO
forecasts tend to track the growth trend of the immediate years prior to the forecast estimation.
The AEO forecasts appear more accurate one to three years after the date of the prediction.
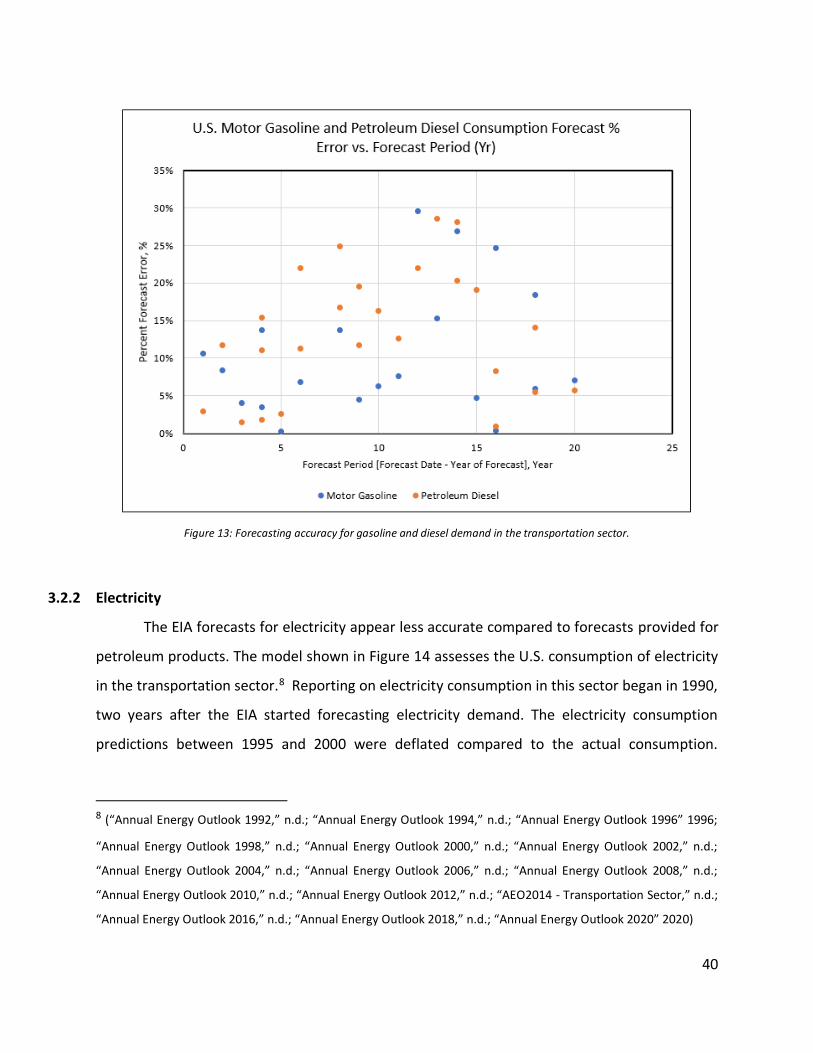
Petroleum consumption has been less than predicted and the errors of the predictions ranged
from ±30% off (in a 10–15-year forecast) to 0% off (in a 3-, 5- and 16-year forecast) as shown in
Figure 13. However, the mean absolute percentage error (MAPE) for the forecasts provided for
petroleum diesel and motor gasoline was 12.0 and 12.3, respectively.
7 (“Annual Energy Outlook 1994,” n.d.; “Annual Energy Outlook 1996” 1996; “Annual Energy Outlook 1998,” n.d.;
“Annual Energy Outlook 2000,” n.d.; “Annual Energy Outlook 2002,” n.d.; “Annual Energy Outlook 2004,” n.d.;
“Annual Energy Outlook 2006,” n.d.; “Annual Energy Outlook 2008,” n.d.; “Annual Energy Outlook 2010,” n.d.;
“Annual Energy Outlook 2012,” n.d.; “AEO2014 - Transportation Sector,” n.d.; “Annual Energy Outlook 2016,” n.d.;
“Annual Energy Outlook 2018,” n.d.; “Annual Energy Outlook 2020” 2020)

38
Figure 11: Forecast data compared to actuals for gasoline consumption in the US transportation sector.
39
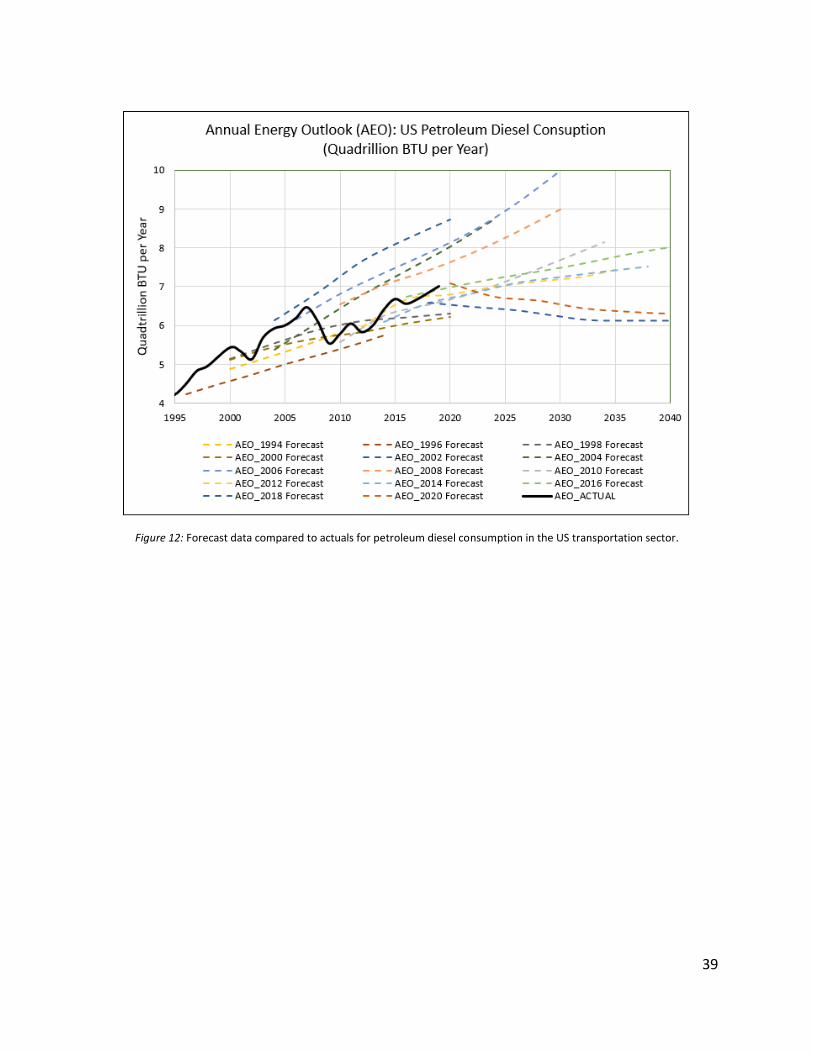
Figure 12: Forecast data compared to actuals for petroleum diesel consumption in the US transportation sector.
40
Figure 13: Forecasting accuracy for gasoline and diesel demand in the transportation sector.
3.2.2 Electricity
The EIA forecasts for electricity appear less accurate compared to forecasts provided for
petroleum products. The model shown in Figure 14 assesses the U.S. consumption of electricity
in the transportation sector.8 Reporting on electricity consumption in this sector began in 1990,
two years after the EIA started forecasting electricity demand. The electricity consumption
predictions between 1995 and 2000 were deflated compared to the actual consumption.
8 (“Annual Energy Outlook 1992,” n.d.; “Annual Energy Outlook 1994,” n.d.; “Annual Energy Outlook 1996” 1996;
“Annual Energy Outlook 1998,” n.d.; “Annual Energy Outlook 2000,” n.d.; “Annual Energy Outlook 2002,” n.d.;
“Annual Energy Outlook 2004,” n.d.; “Annual Energy Outlook 2006,” n.d.; “Annual Energy Outlook 2008,” n.d.;
“Annual Energy Outlook 2010,” n.d.; “Annual Energy Outlook 2012,” n.d.; “AEO2014 - Transportation Sector,” n.d.;
“Annual Energy Outlook 2016,” n.d.; “Annual Energy Outlook 2018,” n.d.; “Annual Energy Outlook 2020” 2020)

41
Between 2000 and 2005 the actual consumption was much lower than predicted. Predictions
made between 2005 and 2015 more accurately forecast future demand. However, with the
growing popularity of electric vehicles coupled with a growing concern among Americans
regarding climate change, the EIA has accurately predicted growth starting in 2016 (Dennis,
Mufson, and Clement 2019). In general, the AEO forecasts tend to follow the trend of the
immediate years prior to the forecast estimation and as depicted in Figure 15, the consumption
forecast is correct two years into the future and less so beyond that by ±85% on average.9
Figure 14: Forecast data compared to actuals for electricity consumption in the US transportation sector.
9 (“Annual Energy Outlook 2000,” n.d.; “Annual Energy Outlook 2004,” n.d.; “Annual Energy Outlook 2006,” n.d.;
“Annual Energy Outlook 2008,” n.d.; “Annual Energy Outlook 2010,” n.d.; “Annual Energy Outlook 2012,” n.d.;
“AEO2014 - Transportation Sector,” n.d.)

42
Figure 15: Forecasting accuracy of electricity demand in the transportation sector. Note the difference
in vertical scale relative to Figure 17 (0-35%)
3.2.3 Ethanol
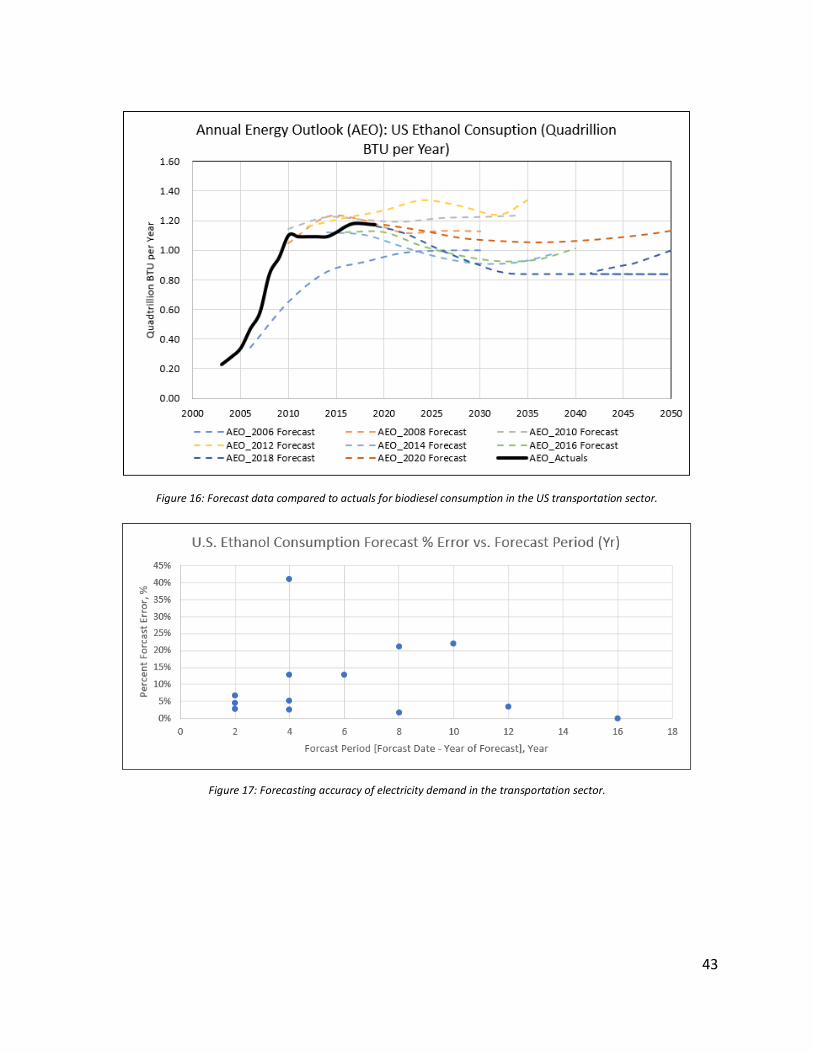
The model shown in Figure 16 assesses the US consumption of ethanol in the
transportation sector.10 Ethanol blending into motor gasoline began in 2003. The EIA did not
address ethanol as a transportation energy source until 2006. Apart from the 2006 forecast, the
ethanol consumption projections through 2019 appear accurate. If 2016 forecast data were
excluded altogether, the errors of the predictions would range from ±2% (in a 2-year forecast) to
±28% (in a 10-year forecast). This is depicted in Figure 17.11 In summary, the ethanol forecasts
are more accurate than other lower emission energy sources. The MAPE for the forecasting
system for ethanol was 10.5.
10 (“Annual Energy Outlook 2006,” n.d.; “Annual Energy Outlook 2008,” n.d.; “Annual Energy Outlook 2010,” n.d.;
“Annual Energy Outlook 2012,” n.d.; “AEO2014 - Transportation Sector,” n.d.; “Annual Energy Outlook 2016,” n.d.;
“Annual Energy Outlook 2018,” n.d.; “Annual Energy Outlook 2020” 2020)
11 (“Annual Energy Outlook 2000,” n.d.; “Annual Energy Outlook 2004,” n.d.; “Annual Energy Outlook 2006,” n.d.;
“Annual Energy Outlook 2008,” n.d.; “Annual Energy Outlook 2010,” n.d.; “Annual Energy Outlook 2012,” n.d.;
“AEO2014 - Transportation Sector,” n.d.)
43
Figure 16: Forecast data compared to actuals for biodiesel consumption in the US transportation sector.
Figure 17: Forecasting accuracy of electricity demand in the transportation sector.
44
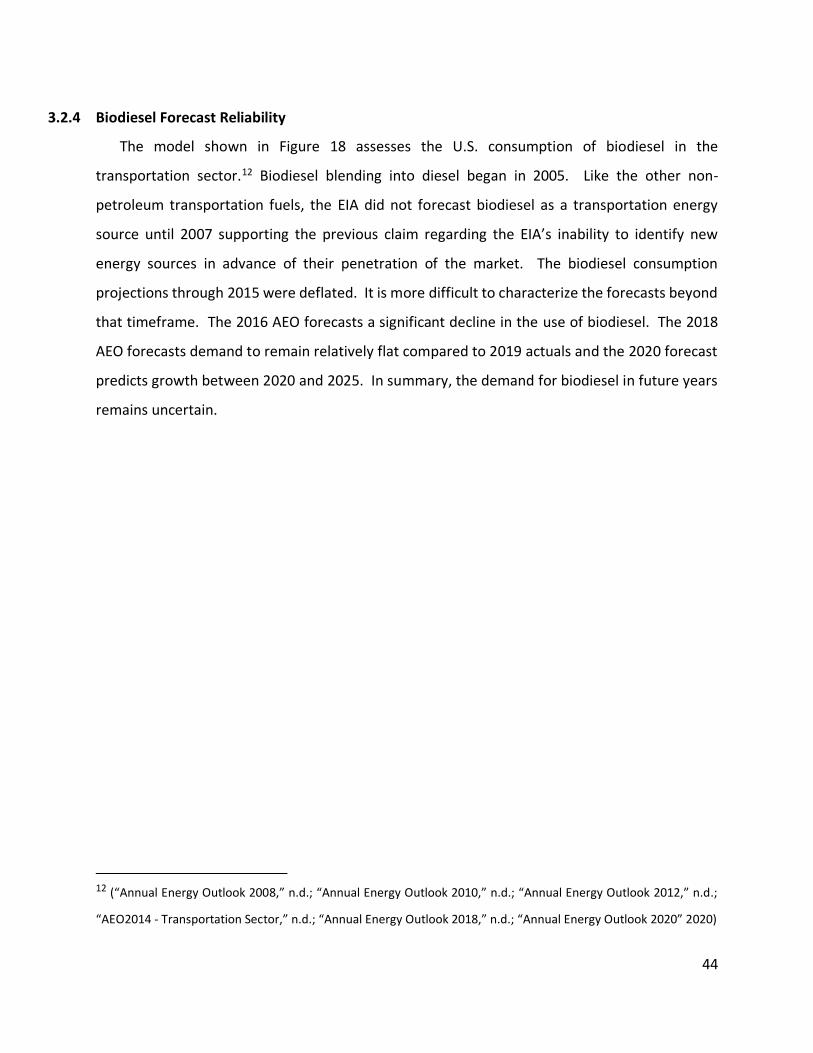
3.2.4 Biodiesel Forecast Reliability
The model shown in Figure 18 assesses the U.S. consumption of biodiesel in the
transportation sector.12 Biodiesel blending into diesel began in 2005. Like the other non-
petroleum transportation fuels, the EIA did not forecast biodiesel as a transportation energy
source until 2007 supporting the previous claim regarding the EIA’s inability to identify new
energy sources in advance of their penetration of the market. The biodiesel consumption
projections through 2015 were deflated. It is more difficult to characterize the forecasts beyond
that timeframe. The 2016 AEO forecasts a significant decline in the use of biodiesel. The 2018
AEO forecasts demand to remain relatively flat compared to 2019 actuals and the 2020 forecast
predicts growth between 2020 and 2025. In summary, the demand for biodiesel in future years
remains uncertain.
12 (“Annual Energy Outlook 2008,” n.d.; “Annual Energy Outlook 2010,” n.d.; “Annual Energy Outlook 2012,” n.d.;
“AEO2014 - Transportation Sector,” n.d.; “Annual Energy Outlook 2018,” n.d.; “Annual Energy Outlook 2020” 2020)
45
Figure 18: Forecast data compared to actuals for biodiesel consumption in the US transportation sector.
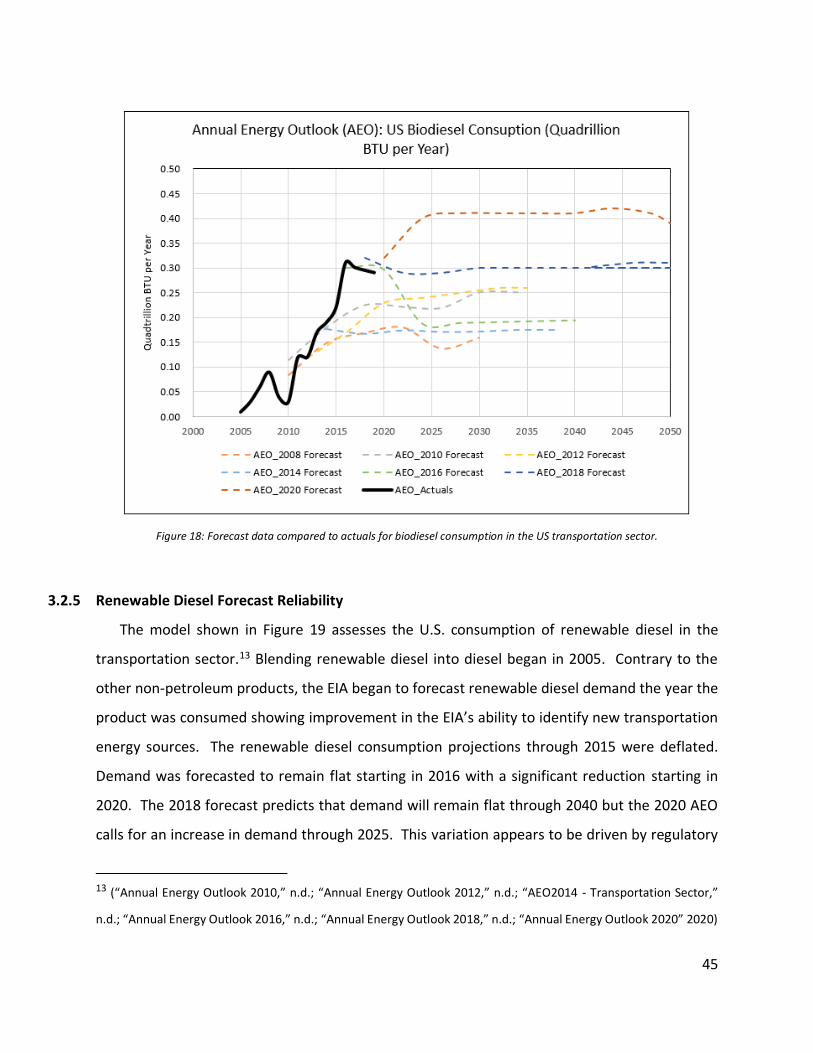
3.2.5 Renewable Diesel Forecast Reliability
The model shown in Figure 19 assesses the U.S. consumption of renewable diesel in the
transportation sector.13 Blending renewable diesel into diesel began in 2005. Contrary to the
other non-petroleum products, the EIA began to forecast renewable diesel demand the year the
product was consumed showing improvement in the EIA’s ability to identify new transportation
energy sources. The renewable diesel consumption projections through 2015 were deflated.
Demand was forecasted to remain flat starting in 2016 with a significant reduction starting in
2020. The 2018 forecast predicts that demand will remain flat through 2040 but the 2020 AEO
calls for an increase in demand through 2025. This variation appears to be driven by regulatory
13 (“Annual Energy Outlook 2010,” n.d.; “Annual Energy Outlook 2012,” n.d.; “AEO2014 - Transportation Sector,”
n.d.; “Annual Energy Outlook 2016,” n.d.; “Annual Energy Outlook 2018,” n.d.; “Annual Energy Outlook 2020” 2020)

46
requirements in California. California’s LCFS was due to expire in 2020. However, a resolution
to extend the low carbon fuel standard through 2030 was passed (“Cal LCFS - Resolution to
Extend” n.d.).
Figure 19: Forecast data compared to actuals for renewable diesel consumption in the US transportation sector.
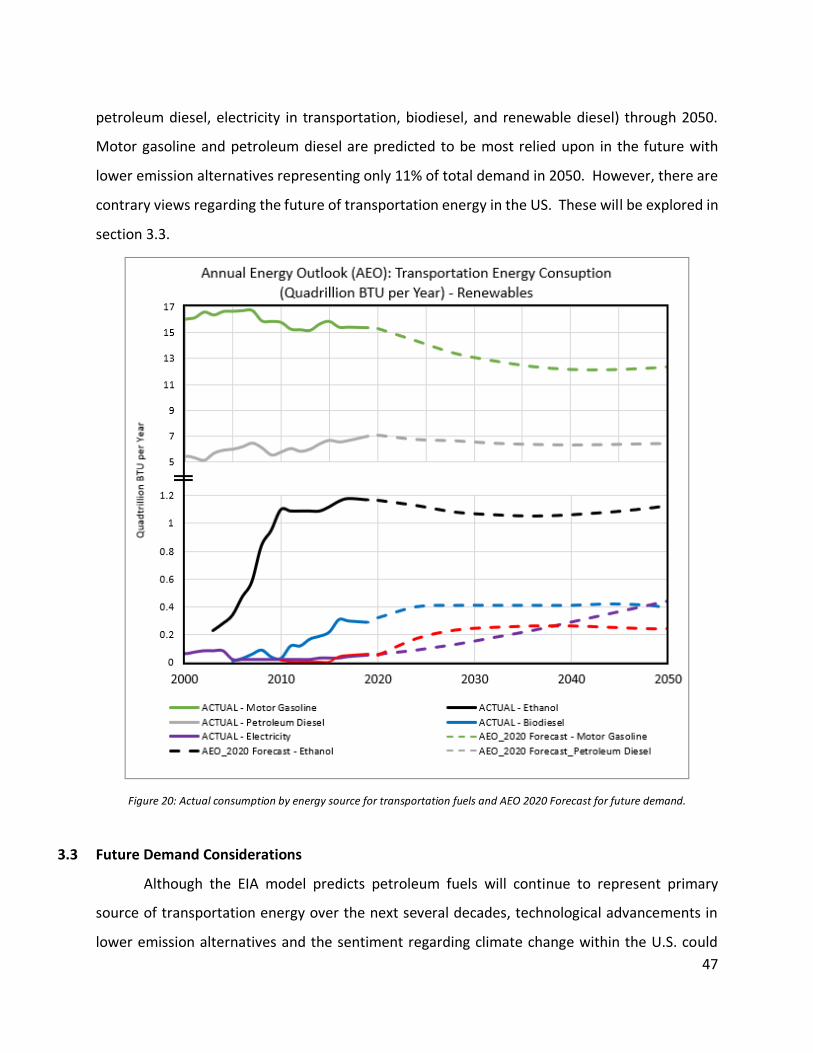
Figure 20 provides the actual consumption date for each transportation source.14 The AEO 2020
forecast is also provided to compare the scale of consumption by energy source (motor gasoline,
14 (“Annual Energy Outlook 1998,” n.d.; “Annual Energy Outlook 2000,” n.d.; “Annual Energy Outlook 2002,” n.d.;
“Annual Energy Outlook 2004,” n.d.; “Annual Energy Outlook 2006,” n.d.; “Annual Energy Outlook 2008,” n.d.;
“Annual Energy Outlook 2010,” n.d.; “Annual Energy Outlook 2012,” n.d.; “AEO2014 - Transportation Sector,” n.d.;
“Annual Energy Outlook 2016,” n.d.; “Annual Energy Outlook 2018,” n.d.; “Annual Energy Outlook 2020” 2020)
47
petroleum diesel, electricity in transportation, biodiesel, and renewable diesel) through 2050.
Motor gasoline and petroleum diesel are predicted to be most relied upon in the future with
lower emission alternatives representing only 11% of total demand in 2050. However, there are
contrary views regarding the future of transportation energy in the US. These will be explored in
section 3.3.
Figure 20: Actual consumption by energy source for transportation fuels and AEO 2020 Forecast for future demand.
3.3 Future Demand Considerations
Although the EIA model predicts petroleum fuels will continue to represent primary
source of transportation energy over the next several decades, technological advancements in
lower emission alternatives and the sentiment regarding climate change within the U.S. could
48
create a different outcome. Light duty vehicle offerings and what consumers value when they
purchase a car will drive future energy demand. Technological advances that improve
performance and lower the cost of EVs can rapidly change the energy demand landscape in the
future. Influential U.S. based corporations, like Amazon, are beginning to expand their image to
demonstrate their commitment to mitigating climate change. Regulation that incentivizes the
use of lower emission energy sources in the transportation sector will continue to enable the
growth of non-petroleum alternatives. This section will explore these influences further.
3.3.1 Electric Vehicle Performance
Future demand of transportation energy sources will be determined by the light duty
vehicles consumers choose in the coming decades. Electric vehicles (EV) appear to be the most
widely sought out alternative to internal combustion engines in the United States today. (“Drew
Kodjak_Canada Global EV_12June2019_0.Pdf” n.d.). Studies assessing consumers’ openness to
EVs indicate that acceptance of this alternative is growing at a fast pace. Approximately 40% of
U.S. consumers surveyed in 2020 would consider hybrid electric vehicles HEV or BEVs in lieu of
ICE. This is a drastic increase compared to a 2019 survey where only 29% of consumers would
consider lower emission alternatives for the next vehicle they purchase (“Us-2020-Global-
Automotive-Consumer-Study-Global-Focus-Countries.Pdf,” n.d.). Approximately half of the
participants surveyed assert carbon emissions as the primary driver behind their openness to ICE
alternatives, while 37% are driven by achieving the lowest cost of ownership for their
transportation needs. A recent study concluded that EV sales track with changes in gasoline
prices. When gasoline prices decrease, like in the instance of COVID19, EV sales have declined
and when gasoline prices increase, EV sales have increased (“Electric Vehicle Trends | Deloitte
Insights” n.d.). The more cost competitive HEVs and BEVs become, the more attractive they will
be for consumers. The AEO 2020 forecast for 2050 predicts gasoline and diesel being used to
meet 89% of transportation energy. U.S. consumers' growing acceptance of HEVs and BEVs.
Advances in battery technology and charging capabilities for EVs will also continue to
enable the growth demonstrated in the EV market (“Drew Kodjak_Canada Global
EV_12June2019_0.Pdf” n.d.). U.S. consumers were surveyed to understand the biggest
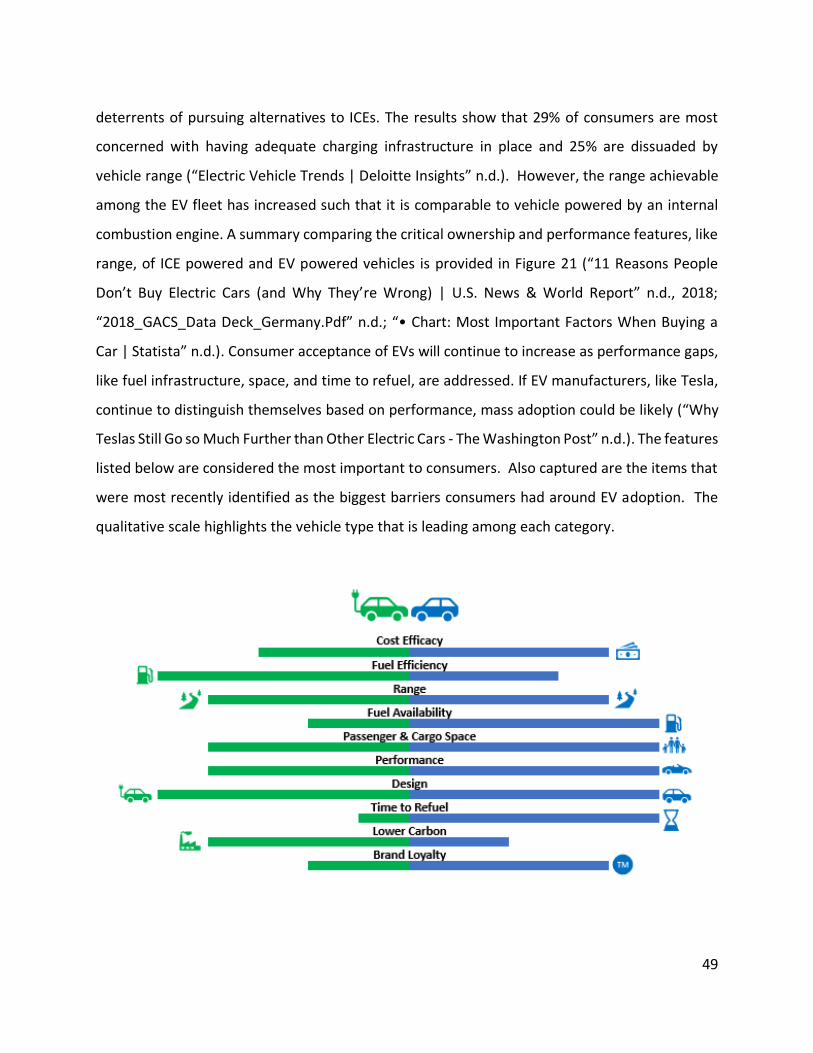
49
deterrents of pursuing alternatives to ICEs. The results show that 29% of consumers are most
concerned with having adequate charging infrastructure in place and 25% are dissuaded by
vehicle range (“Electric Vehicle Trends | Deloitte Insights” n.d.). However, the range achievable
among the EV fleet has increased such that it is comparable to vehicle powered by an internal
combustion engine. A summary comparing the critical ownership and performance features, like
range, of ICE powered and EV powered vehicles is provided in Figure 21 (“11 Reasons People
Don’t Buy Electric Cars (and Why They’re Wrong) | U.S. News & World Report” n.d., 2018;
“2018_GACS_Data Deck_Germany.Pdf” n.d.; “• Chart: Most Important Factors When Buying a
Car | Statista” n.d.). Consumer acceptance of EVs will continue to increase as performance gaps,
like fuel infrastructure, space, and time to refuel, are addressed. If EV manufacturers, like Tesla,
continue to distinguish themselves based on performance, mass adoption could be likely (“Why
Teslas Still Go so Much Further than Other Electric Cars - The Washington Post” n.d.). The features
listed below are considered the most important to consumers. Also captured are the items that
were most recently identified as the biggest barriers consumers had around EV adoption. The
qualitative scale highlights the vehicle type that is leading among each category.

50
Figure 21: The features listed below are considered the most important to consumers. Also captured are the items that were
most recently identified as the biggest barriers consumers had around EV adoption. The qualitative scale highlights the vehicle
type that is leading among each category
3.3.2 U.S. Corporate Influences
Influential non-energy business leaders in the United States, like Elon Musk, Bill Gates, and
Jeff Bezos appear to be working aggressively to tackle climate change, for the carbon footprint
specific to their business and the greater community in which they operate. Elon Musk has
pledged his net worth “to think about the future and feel good about that (Clifford n.d.).” As the
CEO of Tesla, he is all-in on electric vehicles and solar energy. Musk’s goal is to power his
Gigafactory using 100% renewable energy (“Tesla Gigafactory | Tesla” n.d.). His ability to
produce a product that appeals to a range of consumers while aiding in the fight against climate
change is compelling. With a net worth of $137B, Musk may have the resources and ambition to
advance and scale low emission alternatives in all energy sectors, including transportation (“Elon
Musk” n.d.). This supports the need to challenge the projections summarized in Figure 24.
Bill Gates, co-founder of Microsoft, is also spending a significant effort on climate change.
Gates has been vocal regarding his belief that the U.S. can effectively lead the global community
in managing climate change through innovation (“Here’s How the U.S. Can Lead the World on
Climate Change Innovation | Bill Gates” n.d.). He believes that a government-based organization
should be formed to enable innovations that advance and scale lower emissions technology. The
National Institute of Energy Innovation, a name proposed by Mr. Gates, is envisioned to operate
like the National Institutes of Health. The climate change prevention entity would be eligible for
resources and funding, like other government funded entities (“Here’s How the U.S. Can Lead the
World on Climate Change Innovation | Bill Gates” n.d.). Bill Gates is also investing to support low
emission energy innovation. A recent example includes Heliogen, an energy company working
to reduce the need for petroleum-based fuels. Bill Gates and billionaire Los Angeles Times owner
Patrick Soon-Shiong have invested in Heliogen, potentially enabling a significant breakthrough
(“Secretive Energy Startup Backed by Bill Gates Achieves Solar Breakthrough - CNN” n.d.).
Heliogen is using artificial intelligence to optimize solar technology such that supplying the
51
Industrial power sector is within reach. This highlights another example of how an influential
business leader could continue to influence the number of petroleum-based products demanded
in the future (“Secretive Energy Startup Backed by Bill Gates Achieves Solar Breakthrough - CNN”
n.d.).
Jeff Bezos is also working to mitigate climate change. He recently pledged $10B of his
$182B net worth toward the effort publicly stating climate change as “the biggest threat to our
planet (“Jeff Bezos” n.d.; “Jeff Bezos Pledges $10 Billion To Fight Climate Change, Planet’s ’Biggest
Threat’ : NPR” n.d.).” He also contributed $791 million across 16 different organizations working
to advance low carbon energy technology and, through Amazon, pledged $2B to support climate
change initiatives. Finally, Bezos took the Climate Pledge to get Amazon to net zero carbon by
2040 (“Jeff Bezos Announces First Winners of $10 Billion Climate-Change Pledge - CBS News”
n.d.). Future energy demand could be influenced if companies with the scale of Amazon follow
suit.
Amazon, under Jeff Bezos leadership, is modeled around developing solutions to optimize
their business that they can then market to others. Amazon created Amazon Web Services, Inc.
(AWS) was created from a need to scale their e-commerce site such that they could expand their
portfolio beyond books (“How Amazon Created AWS and Changed Technology Forever -
MarketWatch” n.d.). Once AWS was implemented to meet company needs, they started to
market the solution to other companies that could benefit. AWS is now one of Amazon’s fastest
growing segments. Supermajors’ ability to market petroleum products long-term could be
impacted if Bezos and the Amazon team apply the same strategy to achieve their goal of
becoming carbon neutral by 2040.
The business leaders highlighted in this section appear to view climate change as a personal
mission. Supermajors should take inventory of the resources, funding, and influence that follow
these leaders. The items highlighted in this section should not be used to draw a conclusion about
the future. However, whether petroleum-based fuels will be used to meet approximately 90%
of the transportation energy demanded 30 years from now, should be questioned.
52
3.4 Regulation
Regulations, like the Renewable Fuels Standard and the Low Carbon Fuel Standard, could
impact U.S. energy demand in the transportation sector moving forward. The impact these
regulations have had to date could predict what the future holds. The effect the LCFS, the more
stringent of the two, had on the refining and subsequently the retail industry will be evaluated
further in this section considering the potential for subsequent consequences for the Retail
Industry.
The LCFS was implemented in 2013. At the time, Refiners in California did not support its
implementation. Special interest groups claimed that the cost of compliance would present an
unmanageable burden on operators and would result in an increase in transportation energy
prices for consumers. The burden would result in refinery shutdowns creating supply shortages
and subsequent price increases across the state (“Big Oil’s Claims About CA Climate Policies Were
Wrong | NRDC” n.d.). However, there is not strong evidence indicating that refineries in
California, whether owned by Independents or Supermajors, had to shut down due to the
compliance burden of the regulation. The refineries owned by Supermajors at the time the LCFS
was established remain operational today but there is one trend specific to Supermajors worth
noting. Between 2006 and 2020, ExxonMobil, BP, and Royal Dutch Shell exited the refining
industry in California. Shell sold their 97,000 barrel per day refinery to Tesoro Corp in 2007 and
in February 2020, they completed the sale of their 157,000 barrel per day Martinez, CA refinery
(“Refinery Sales During 2007” n.d.; “Shell Finalizes Sale of Martinez Refinery | Oil & Gas Journal”
n.d.). BP also sold their 251,000 barrel per day refinery to Tesoro Corp in 2013 and ExxonMobil
exited the market in 2016 by selling their 150,900 barrel per day refinery to PBF Energy (“Refinery
Sales During 2013” n.d.; “Refinery Sales During 2016” n.d.). In contrast, Chevron retained full
ownership of their proprietary refineries. Although most Supermajors exited California, there is
no evidence indicating the reason was driven by LCFS compliance.
The Low Carbon Fuel Standard was designed to reduce the carbon intensity of
transportation fuels over time. Blending renewables will continue to be an instrumental
pathway for achieving compliance through 2030 considering credit prices have remained above
$100/Ton CO2. This, coupled with the program being extended through 2030, has incentivized

53
companies to increase renewable diesel supply in the state (“California to Expand Low Carbon
Fuel Standard to 2030 with More Stringent Targets | S&P Global Platts” n.d.) The chemical
processes used to produce renewables, like renewable gasoline and diesel, closely resemble
that of crude refining. Companies that produce renewables are looking to re-purpose refineries
as a result.
PBF holdings purchased the Martinez, CA refinery from Shell in 2020. They, in
partnership with Shell, are looking to retrofit idle refining equipment to produce renewables
(“Shell Finalizes Sale of Martinez Refinery | Oil & Gas Journal” n.d.). Global Clean Energy
Holdings is also securing production capacity for renewables in the state. They recently
purchased a petroleum refinery in Bakersfield, CA in 2020 (Tuttle 2020). The previous owner
attempted to obtain operating permits to secure crude supply for the plant. The request was
unpopular with the local community and was ultimately rejected in 2019 driving the sale.
(“Kern County Supervisors Vote to End Massive Oil Refinery, ‘Bomb Trains’ Project in Central
Valley – YubaNet” n.d.) Global Clean Energy Holdings committed to producing only renewable
based products from the plant as part of the purchase. (“Former Bakersfield Refinery to
Become Renewable Fuels Plant | Oil & Gas Journal” n.d.) Phillips 66 is also working to enable
renewables production in California. They are looking to invest roughly $800 MM to convert a
portion of their Rodeo plant for renewables production. (Tuttle 2020)
In summary, refining in California was not significantly impacted during the early years
of the LCFS program. However, as the requirement to reduce the carbon intensity of fuels
consumed within the state continues to become more stringent, there is evidence indicating
that a larger impact will be felt over the next 10 years. The subsequent effects the program had
on the retail industry within the state is more difficult to decipher but important to understand
if you are a Supermajor. There is evidence indicating that regulation, like the LCFS, is being
considered on a broader scale within the U.S. (“August+2020+-
+LCFS+Market+Overview_Final.Pdf” n.d.). Supermajors' core competencies include managing
complex processes to reliably produce energy, a skill that can be applied to renewables to
return a profit.

54
3.5 Summary
How transportation energy demand will be met in the future is uncertain. The tools and
resources available to project the future are useful but unreliable. Technology to advance and
scale low carbon energy solutions will continue to emerge in coming years creating the
potential for major disruption within the retail industry. Regulation disincentivizing reliance on
petroleum-based products presents an opportunity for Supermajors to use their core
competencies to beat the competition in the low carbon energy space.
4 CONSUMER CHOICE
4.1 Introduction
Branding retail locations offers Supermajors a unique marketing pathway to reach
consumers. Supermajors have built their credibility with consumers by reliably selling quality fuel
across the U.S. for over 100 years. Supermajor’s ability to maintain trust with consumers moving
forward will be critical. There is strong evidence indicating that retail is going to be important for
Supermajors as demonstrated in Chapter 2. Chapter 3 showed that the future of transportation
energy in the U.S. is uncertain. The slate of fuels used to satisfy transportation energy demand
today may be different decades from now. Supermajors are therefore going to be faced with
challenging decisions regarding their retail image and the fuels they plan to offer in the future.
Supermajors must understand how consumers decide how to meet their transportation
energy needs. The ability to use data to model consumer behaviors for a variety of outcomes can
enhance decision quality and financial results as illustrated in Figure 22. A tradespace analysis on
how the key components of a retail station impact demand was performed to better understand
what offerings will be important to maintaining market share into the future. Consumer surveys
highlighting the primary factors considered when selecting where to purchase fuel were used to
identify the critical features of a retail station and how demand may be impacted by each. For
example, a station located within 1 mile of a high traffic location was assumed to achieve higher
demand from consumers compared to one 5 miles from a high traffic location. The primary
assumptions and an overview of the model features will be summarized in sections 4.2 and 4.3.
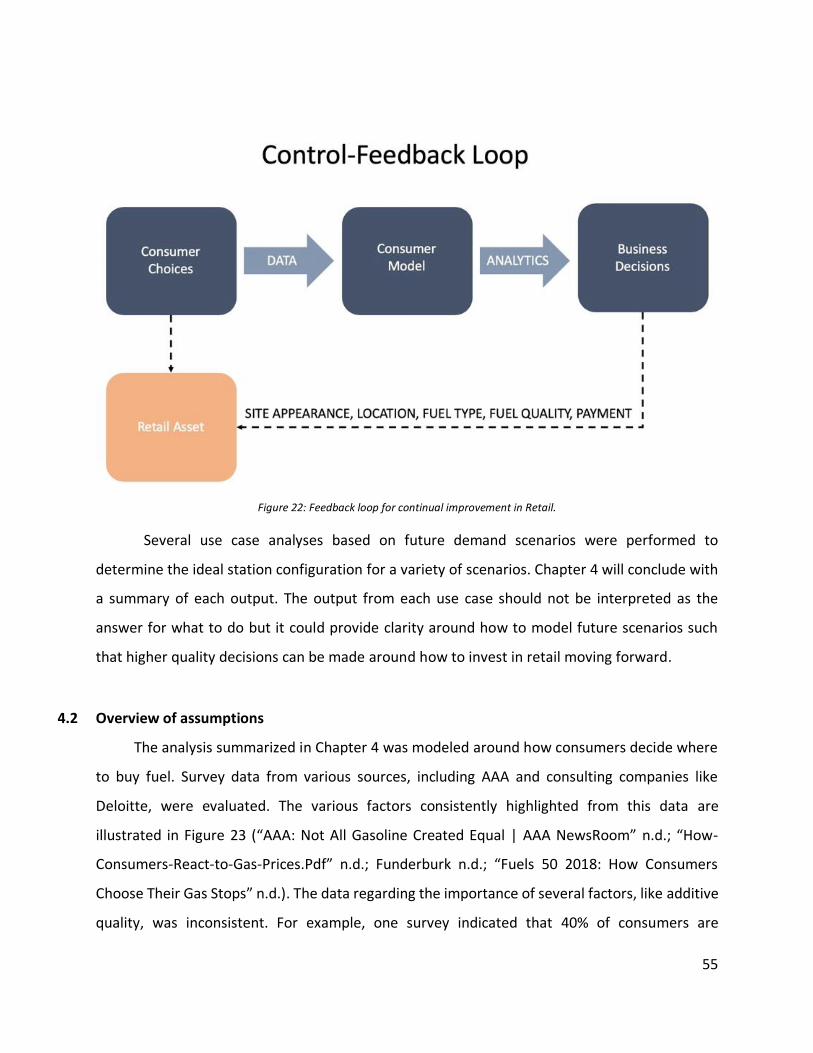
55
Figure 22: Feedback loop for continual improvement in Retail.
Several use case analyses based on future demand scenarios were performed to
determine the ideal station configuration for a variety of scenarios. Chapter 4 will conclude with
a summary of each output. The output from each use case should not be interpreted as the
answer for what to do but it could provide clarity around how to model future scenarios such
that higher quality decisions can be made around how to invest in retail moving forward.
4.2 Overview of assumptions
The analysis summarized in Chapter 4 was modeled around how consumers decide where
to buy fuel. Survey data from various sources, including AAA and consulting companies like
Deloitte, were evaluated. The various factors consistently highlighted from this data are
illustrated in Figure 23 (“AAA: Not All Gasoline Created Equal | AAA NewsRoom” n.d.; “How-
Consumers-React-to-Gas-Prices.Pdf” n.d.; Funderburk n.d.; “Fuels 50 2018: How Consumers
Choose Their Gas Stops” n.d.). The data regarding the importance of several factors, like additive
quality, was inconsistent. For example, one survey indicated that 40% of consumers are
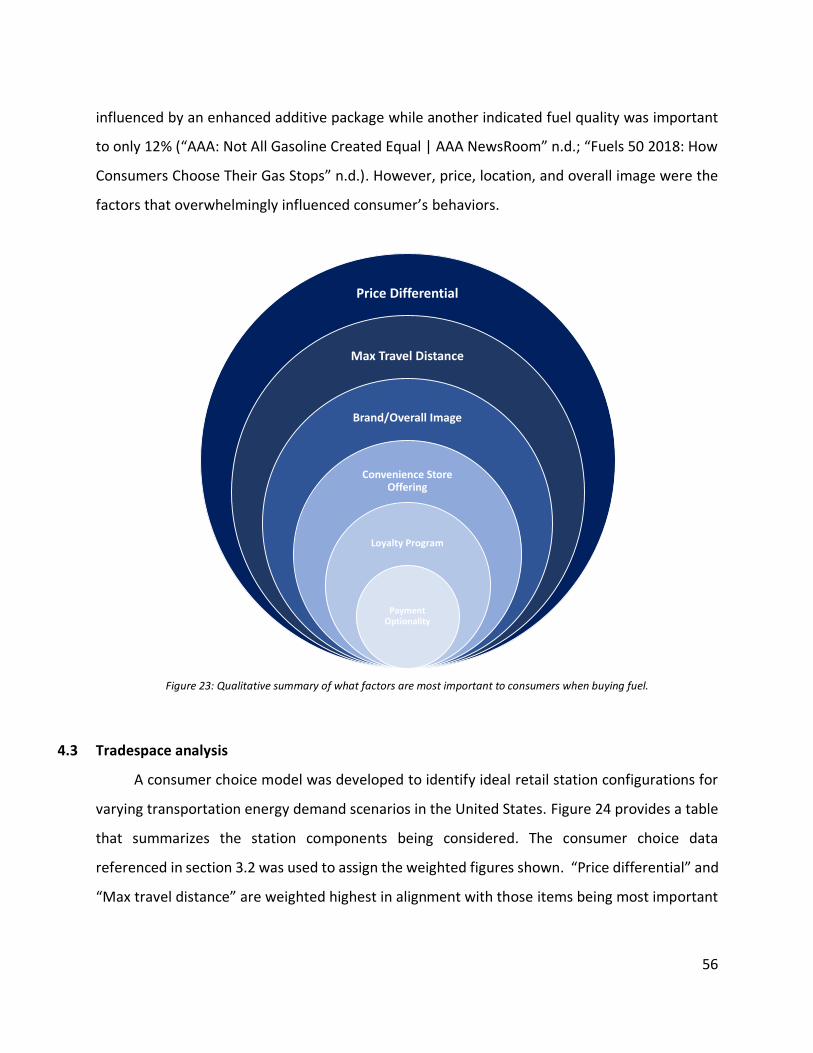
56
influenced by an enhanced additive package while another indicated fuel quality was important
to only 12% (“AAA: Not All Gasoline Created Equal | AAA NewsRoom” n.d.; “Fuels 50 2018: How
Consumers Choose Their Gas Stops” n.d.). However, price, location, and overall image were the
factors that overwhelmingly influenced consumer’s behaviors.
Figure 23: Qualitative summary of what factors are most important to consumers when buying fuel.
4.3 Tradespace analysis
A consumer choice model was developed to identify ideal retail station configurations for
varying transportation energy demand scenarios in the United States. Figure 24 provides a table
that summarizes the station components being considered. The consumer choice data
referenced in section 3.2 was used to assign the weighted figures shown. “Price differential” and
“Max travel distance” are weighted highest in alignment with those items being most important
Price Differential
Max Travel Distance
Brand/Overall Image
Convenience Store Offering
Loyalty Program
Payment Optionality

57
to consumers. Also provided is a GHG utility weighting for the system factors that influence
carbon emissions.
Figure 24 Tables summarizing the factors that influence station demand and greenhouse gas emissions. Also summarized are
how the factors are weighted when it comes to the utility the entire system offers to consumers.
Each item listed in Figure 11 was assigned a variety of alternatives as shown in Figure 25.
For example, a retail location can be priced above or below the market so 4 alternatives tagged
P1 to P4 were established. A demand factor and GHG factor was assigned to each alternative.
Like the weighting captured in Figure 24, the demand factor assigned to each alternative was
informed by the data referenced in section 3.2. The GHG factor was based on the “well to wheel”
impact that alternative had on carbon emissions15. The higher the demand factor, the more likely
consumers are to visit the station and a GHG factor that exceeds 1.0 is a station that emits more
carbon compared to others.
15(“Alternative Fuels Data Center: Emissions from Hybrid and Plug-In Electric Vehicles” n.d.; “Comparison of Well-to-
Wheels Energy Use and Emissions of a Hydrogen Fuel Cell Electric Vehicle Relative to a Conventional Gasoline-
Powered Internal Combustion Engine Vehicle (Journal Article) | OSTI.GOV” n.d.; “How Natural Gas Stacks up in the
Race to Reduce Emissions” n.d.; “Hydrogen Use Doesn’t Emit Carbon but Its Production Often Does. That Could Soon
Change | Horizon: The EU Research & Innovation Magazine | European Commission” n.d.)
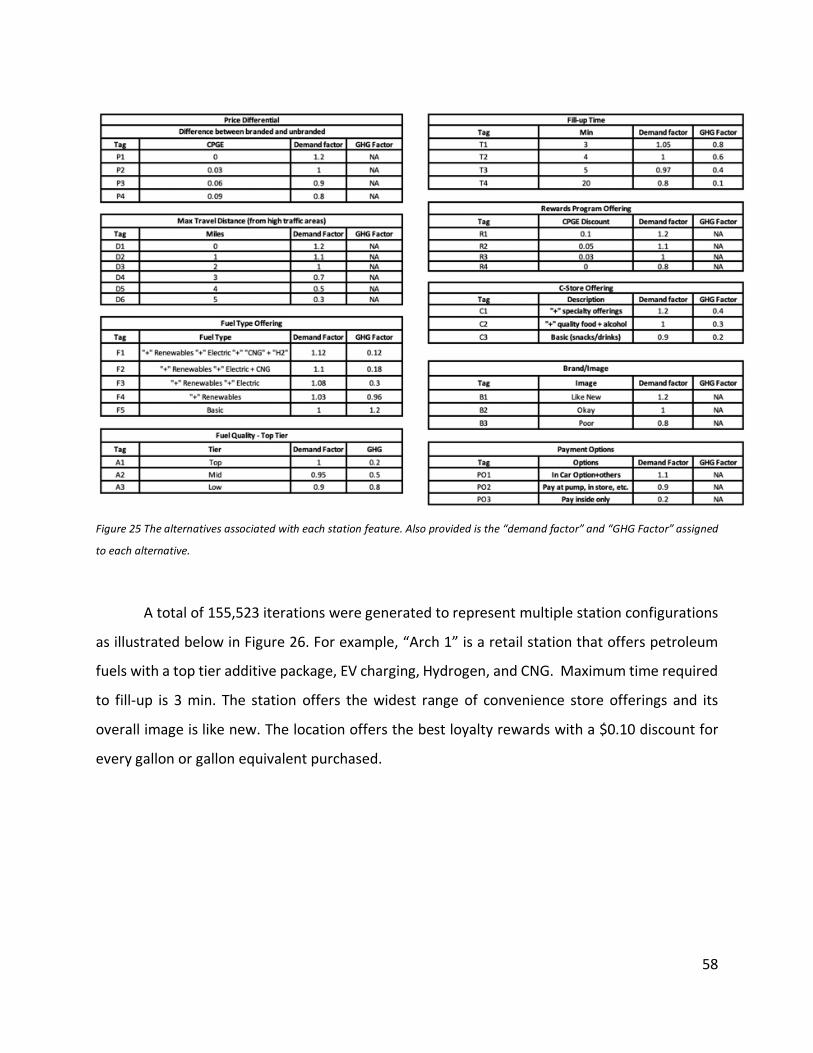
58
Figure 25 The alternatives associated with each station feature. Also provided is the “demand factor” and “GHG Factor” assigned
to each alternative.
A total of 155,523 iterations were generated to represent multiple station configurations
as illustrated below in Figure 26. For example, “Arch 1” is a retail station that offers petroleum
fuels with a top tier additive package, EV charging, Hydrogen, and CNG. Maximum time required
to fill-up is 3 min. The station offers the widest range of convenience store offerings and its
overall image is like new. The location offers the best loyalty rewards with a $0.10 discount for
every gallon or gallon equivalent purchased.
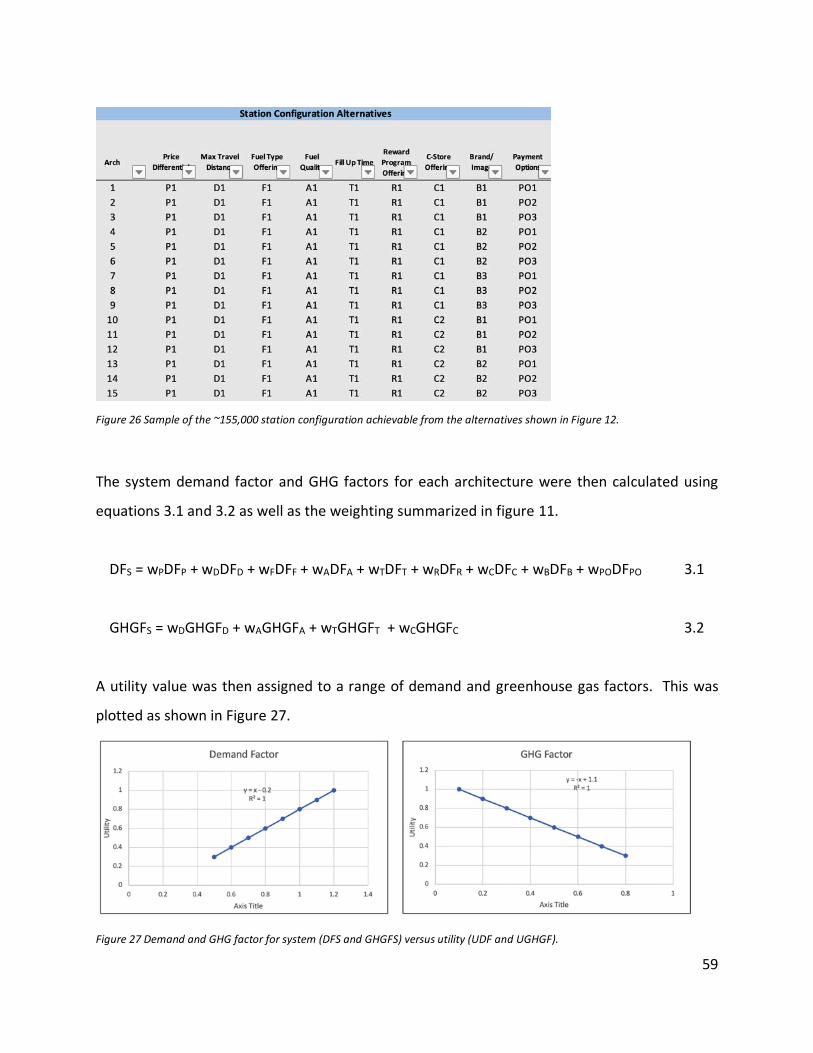
59
Figure 26 Sample of the ~155,000 station configuration achievable from the alternatives shown in Figure 12.
The system demand factor and GHG factors for each architecture were then calculated using
equations 3.1 and 3.2 as well as the weighting summarized in figure 11.
DFS = wPDFP + wDDFD + wFDFF + wADFA + wTDFT + wRDFR + wCDFC + wBDFB + wPODFPO 3.1
GHGFS = wDGHGFD + wAGHGFA + wTGHGFT + wCGHGFC 3.2
A utility value was then assigned to a range of demand and greenhouse gas factors. This was
plotted as shown in Figure 27.
Figure 27 Demand and GHG factor for system (DFS and GHGFS) versus utility (UDF and UGHGF).

60
Equation 3.3 and 3.4 were generated using the utility data plotted in figure 14. These equations
were used to calculate the system utility specific to demand and greenhouse gas factor.
UDF = DFS - 0.2 3.3
UGHGF = -GHGFS + 1.1 3.4
The multi-attribute utility function below was then used to determine the utility of all 155,532
station configurations. A weight of 90% was applied to demand and 10% was applied to GHG.
These figures represent my assumptions around how Supermajors may prioritize these attributes
when deciding how to invest in new retail ventures today. A cost factor was assigned to each
alternative shown in figure 25. These inputs were used to calculate a “total cost” for the system
using equation 3.6.
MAU = (90%)UDF + (10%)UGHG 3.5
CFs = CFP + CFD + CFF + CFA + CFT + CFR + CFC + CFB + CFPO 3.6
The system utility and cost for each station configuration was then plotted to produce the
tradespace analysis shown in Figure 28. The analysis is presented by fuel type offering
considering this is most relevant for Supermajors. A reference case was established as part of
the analysis and is highlighted within Figure 28. Architecture 152,221 was established as the
reference case as shown below. This was established as the base case because it generally
represents what is consistently available within the U.S retail market.
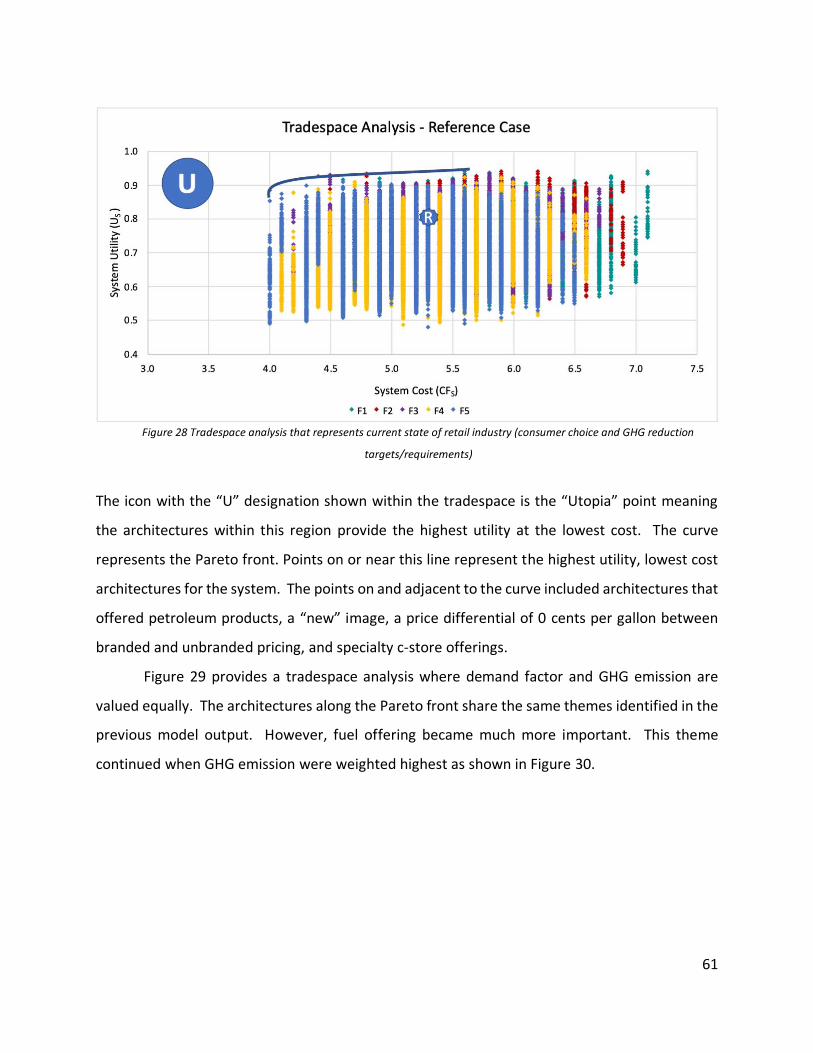
61
The icon with the “U” designation shown within the tradespace is the “Utopia” point meaning
the architectures within this region provide the highest utility at the lowest cost. The curve
represents the Pareto front. Points on or near this line represent the highest utility, lowest cost
architectures for the system. The points on and adjacent to the curve included architectures that
offered petroleum products, a “new” image, a price differential of 0 cents per gallon between
branded and unbranded pricing, and specialty c-store offerings.
Figure 29 provides a tradespace analysis where demand factor and GHG emission are
valued equally. The architectures along the Pareto front share the same themes identified in the
previous model output. However, fuel offering became much more important. This theme
continued when GHG emission were weighted highest as shown in Figure 30.
Figure 28 Tradespace analysis that represents current state of retail industry (consumer choice and GHG reduction
targets/requirements)
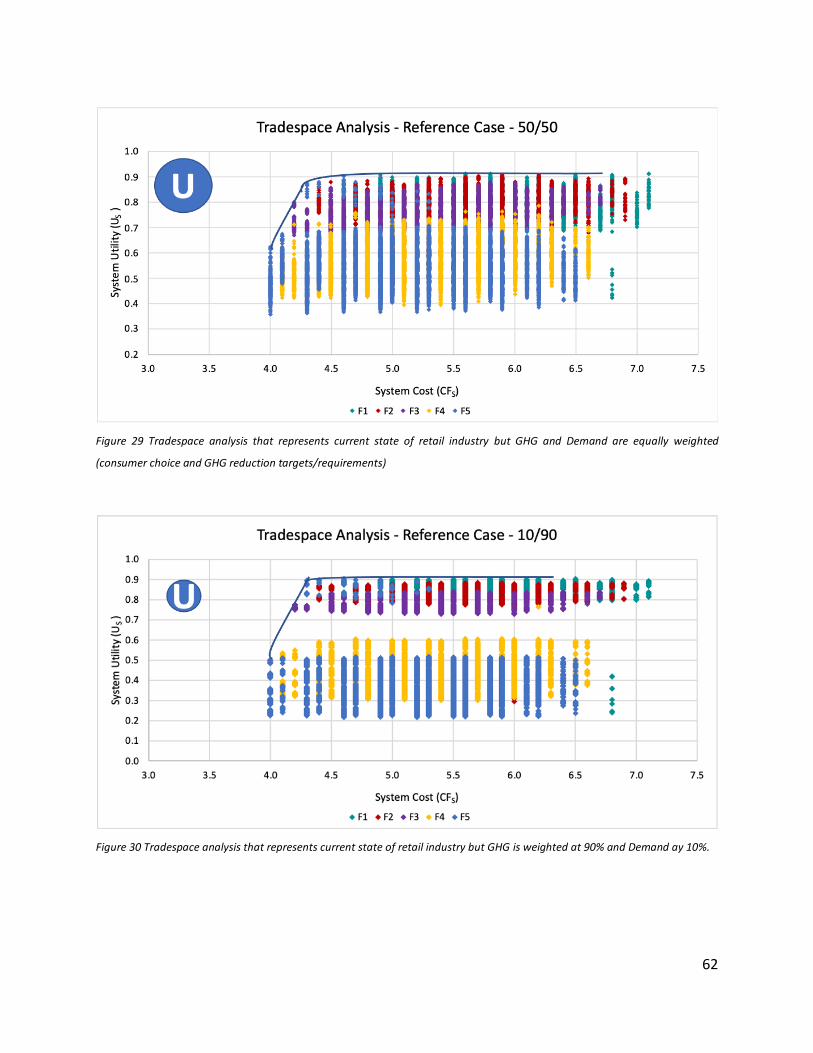
62
Figure 29 Tradespace analysis that represents current state of retail industry but GHG and Demand are equally weighted
(consumer choice and GHG reduction targets/requirements)
Figure 30 Tradespace analysis that represents current state of retail industry but GHG is weighted at 90% and Demand ay 10%.
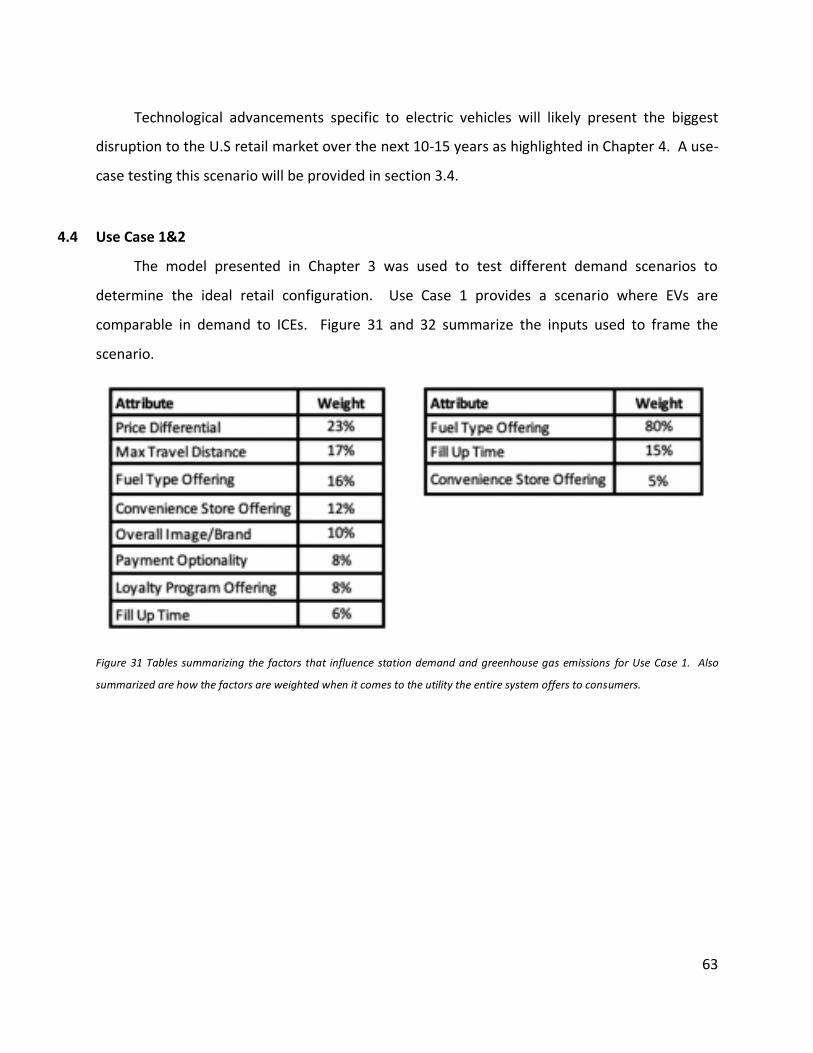
63
Technological advancements specific to electric vehicles will likely present the biggest
disruption to the U.S retail market over the next 10-15 years as highlighted in Chapter 4. A use-
case testing this scenario will be provided in section 3.4.
4.4 Use Case 1&2
The model presented in Chapter 3 was used to test different demand scenarios to
determine the ideal retail configuration. Use Case 1 provides a scenario where EVs are
comparable in demand to ICEs. Figure 31 and 32 summarize the inputs used to frame the
scenario.
Figure 31 Tables summarizing the factors that influence station demand and greenhouse gas emissions for Use Case 1. Also
summarized are how the factors are weighted when it comes to the utility the entire system offers to consumers.
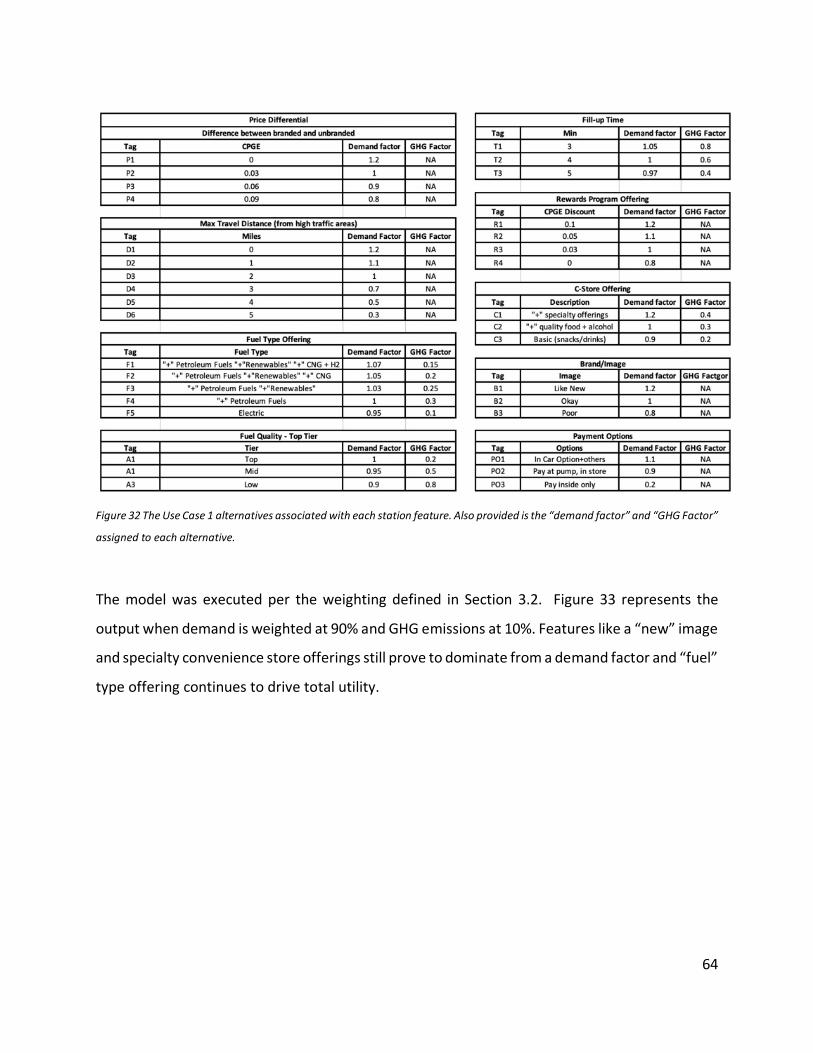
64
Figure 32 The Use Case 1 alternatives associated with each station feature. Also provided is the “demand factor” and “GHG Factor”
assigned to each alternative.
The model was executed per the weighting defined in Section 3.2. Figure 33 represents the
output when demand is weighted at 90% and GHG emissions at 10%. Features like a “new” image
and specialty convenience store offerings still prove to dominate from a demand factor and “fuel”
type offering continues to drive total utility.
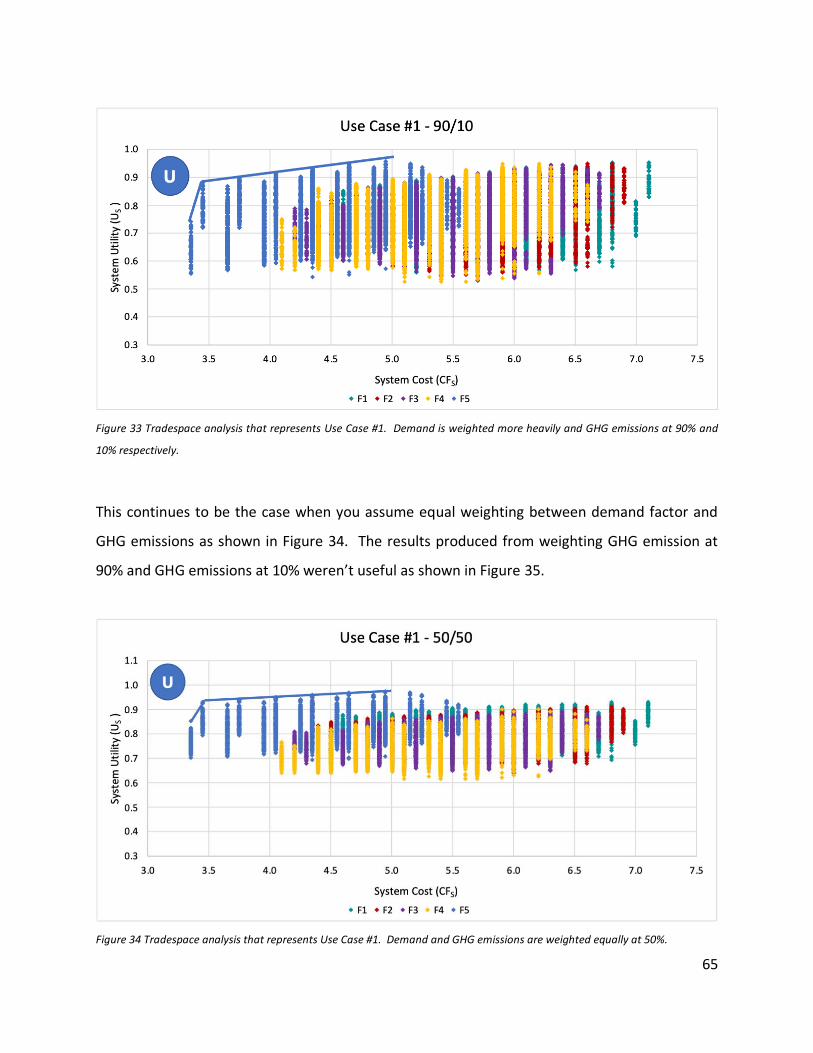
65
Figure 33 Tradespace analysis that represents Use Case #1. Demand is weighted more heavily and GHG emissions at 90% and
10% respectively.
This continues to be the case when you assume equal weighting between demand factor and
GHG emissions as shown in Figure 34. The results produced from weighting GHG emission at
90% and GHG emissions at 10% weren’t useful as shown in Figure 35.
Figure 34 Tradespace analysis that represents Use Case #1. Demand and GHG emissions are weighted equally at 50%.
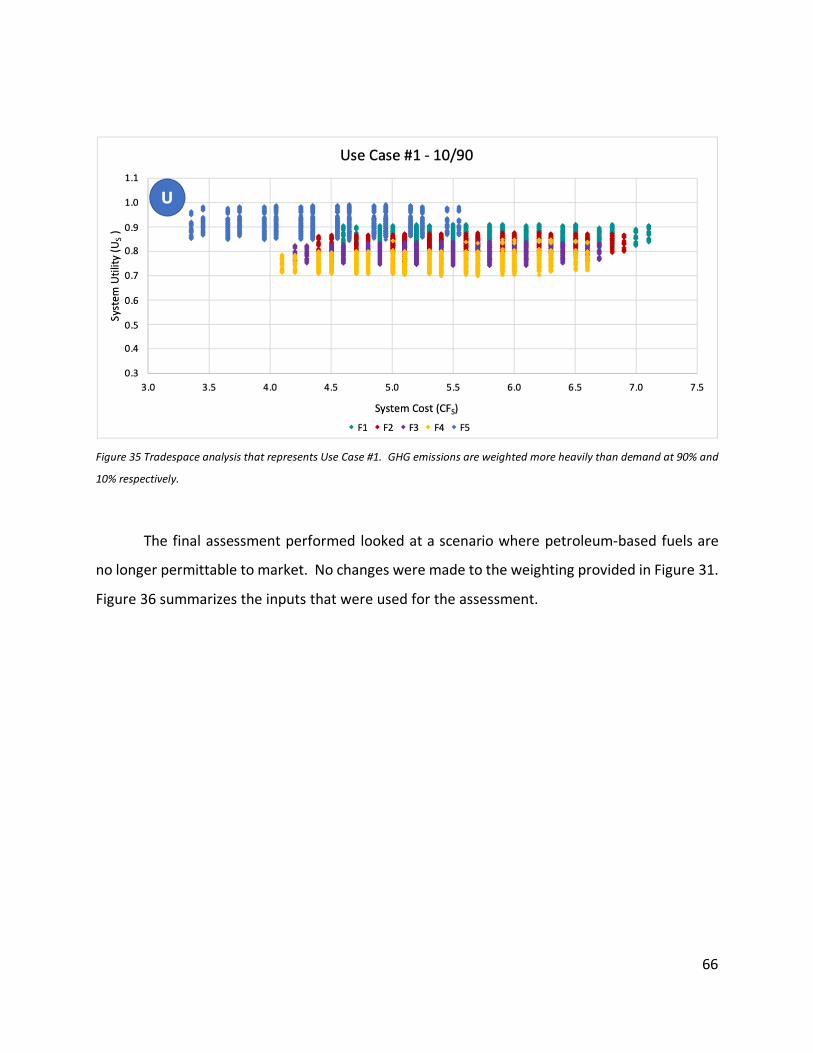
66
Figure 35 Tradespace analysis that represents Use Case #1. GHG emissions are weighted more heavily than demand at 90% and
10% respectively.
The final assessment performed looked at a scenario where petroleum-based fuels are
no longer permittable to market. No changes were made to the weighting provided in Figure 31.
Figure 36 summarizes the inputs that were used for the assessment.

67
Figure 36 Figure 19 The Use Case 2 alternatives associated with each station feature. Also provided is the “demand factor” and
“GHG Factor” assigned to each alternative.
Figure 37 was modeled with demand being weighted highest at 90% and GHG emissions at 10%.
Like use case 1, the type of fuel offered and features like a “new” image and specialty c-store
offerings produced the highest utility, options. This continue to prove true when demand and
GHG emission were weighted equally as shown in Figure 38.
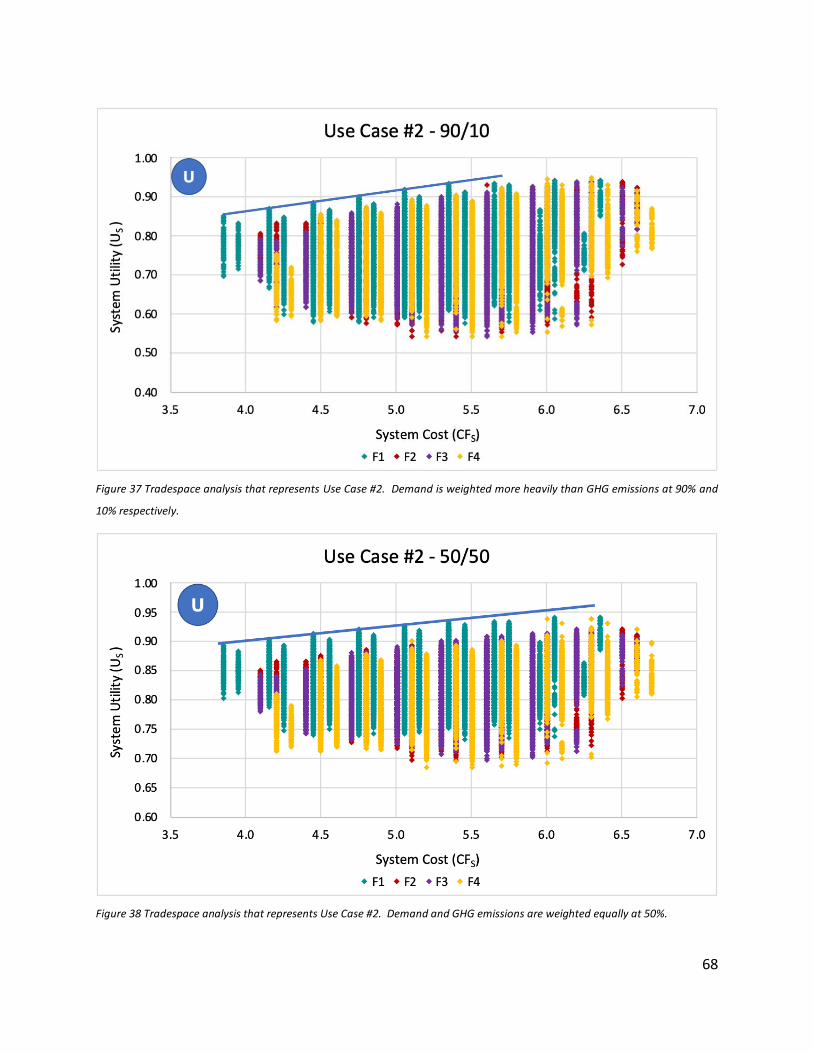
68
Figure 37 Tradespace analysis that represents Use Case #2. Demand is weighted more heavily than GHG emissions at 90% and
10% respectively.
Figure 38 Tradespace analysis that represents Use Case #2. Demand and GHG emissions are weighted equally at 50%.
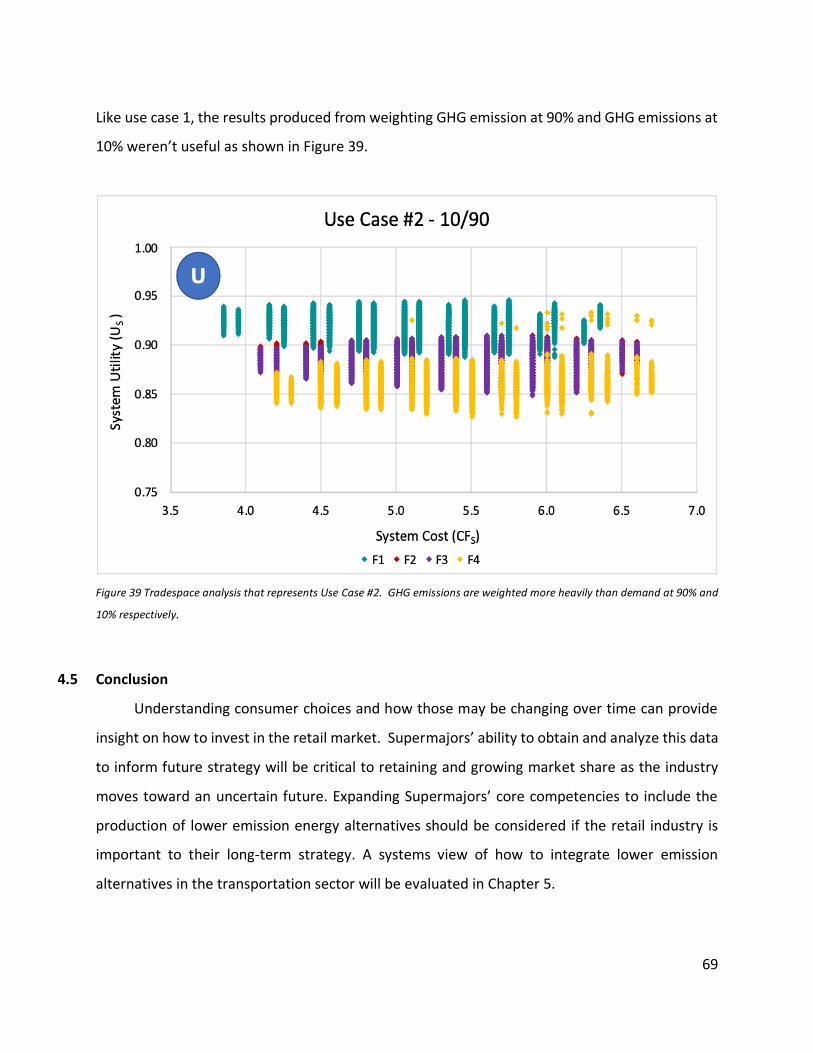
69
Like use case 1, the results produced from weighting GHG emission at 90% and GHG emissions at
10% weren’t useful as shown in Figure 39.
Figure 39 Tradespace analysis that represents Use Case #2. GHG emissions are weighted more heavily than demand at 90% and
10% respectively.
4.5 Conclusion
Understanding consumer choices and how those may be changing over time can provide
insight on how to invest in the retail market. Supermajors’ ability to obtain and analyze this data
to inform future strategy will be critical to retaining and growing market share as the industry
moves toward an uncertain future. Expanding Supermajors’ core competencies to include the
production of lower emission energy alternatives should be considered if the retail industry is
important to their long-term strategy. A systems view of how to integrate lower emission
alternatives in the transportation sector will be evaluated in Chapter 5.
70
5 SYSTEMS APPROACH TO ALTERNATIVE FUEL INFRASTRUCTURE
5.1 Introduction
The system integration of low emission energy alternatives in the U.S. transportation fuel
industry has sparked interest in recent years due to heightened concerns with mitigating climate
change. Low emission alternative fuels, like hydrogen, compressed natural gas (CNG), and
electricity, in the transportation sector offer a potential opportunity for reduced greenhouse gas
(GHG) emissions compared to petroleum products. (“67617.Pdf” n.d.) The system approach aims
to address the alternative fuel market as a holistic system, with the inclusion of stakeholders,
infrastructure, and resource dependencies. The dynamics of the system include investment risks
between utility infrastructure, resource availability, and vehicle technology – they all need to
exist to create a commercially available alternative and renewable fuel market that meets the
consumer’s needs. Though the regulatory landscape is forcing change in some jurisdictions,
Supermajors are equipped with the expertise to drive and influence innovation in this space.
The objective of Chapter 5 is to visualize the relationships between technology,
infrastructure, and feedstock to help characterize the viability of electricity, CNG, and hydrogen
as alternative fuels. Due to the system dependencies, the pathway to a commercially scalable
alternative varies across these options. This will be further defined throughout Chapter 5.
5.2 Electricity
Electric light duty vehicles (LDV) are quickly becoming the forerunner in alternative fuel
technology in the transportation sector. The EIA presents data for the global installation of LDV
chargers, and the vast majority are “private” installations (“Global EV Outlook 2019 – Analysis -
IEA” n.d.). This alludes to the greatest advantage of electricity over other lower emission
alternatives: electricity is cheap and already easily accessible in the United States. Figure 40
shows the high-level abstraction of sourcing energy to fuel electric charging stations. The
commercial availability of electricity for EV charging stations can be constructed anywhere there
is accessibility to the power grid (i.e., parking lots, home, or designated stations) or other energy
sources. The power generation required to supply the electric grid highlights the role
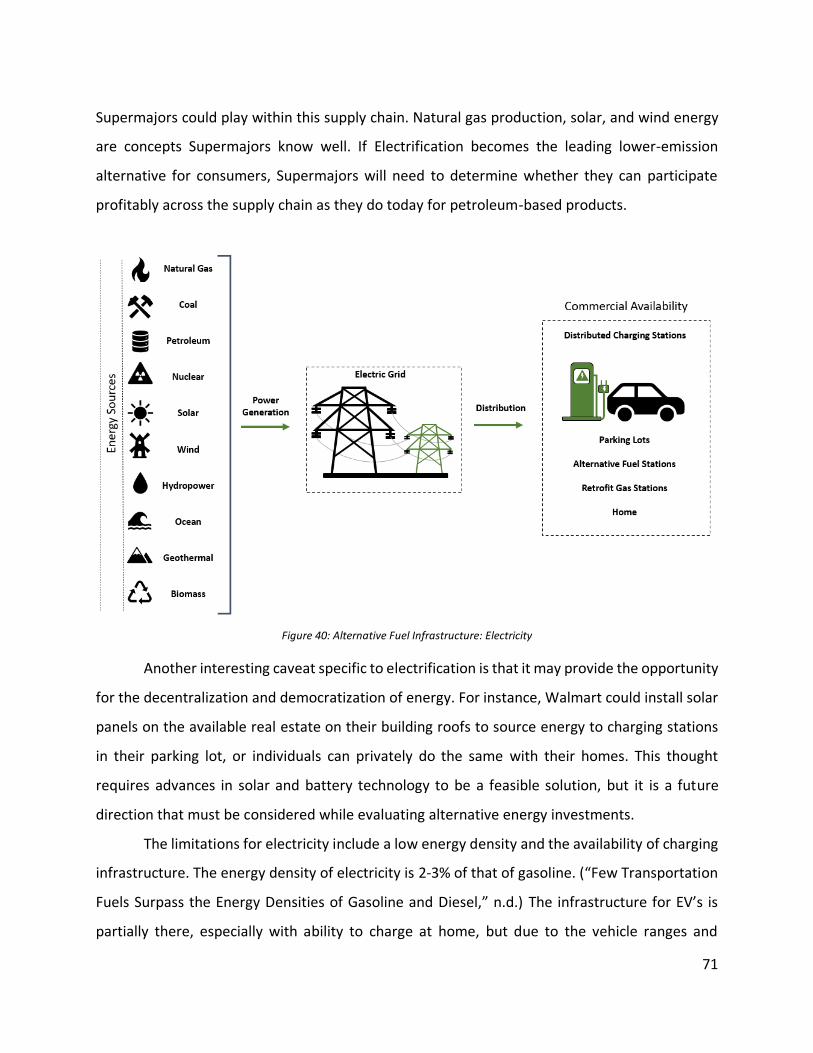
71
Supermajors could play within this supply chain. Natural gas production, solar, and wind energy
are concepts Supermajors know well. If Electrification becomes the leading lower-emission
alternative for consumers, Supermajors will need to determine whether they can participate
profitably across the supply chain as they do today for petroleum-based products.
Figure 40: Alternative Fuel Infrastructure: Electricity
Another interesting caveat specific to electrification is that it may provide the opportunity
for the decentralization and democratization of energy. For instance, Walmart could install solar
panels on the available real estate on their building roofs to source energy to charging stations
in their parking lot, or individuals can privately do the same with their homes. This thought
requires advances in solar and battery technology to be a feasible solution, but it is a future
direction that must be considered while evaluating alternative energy investments.
The limitations for electricity include a low energy density and the availability of charging
infrastructure. The energy density of electricity is 2-3% of that of gasoline. (“Few Transportation
Fuels Surpass the Energy Densities of Gasoline and Diesel,” n.d.) The infrastructure for EV’s is
partially there, especially with ability to charge at home, but due to the vehicle ranges and
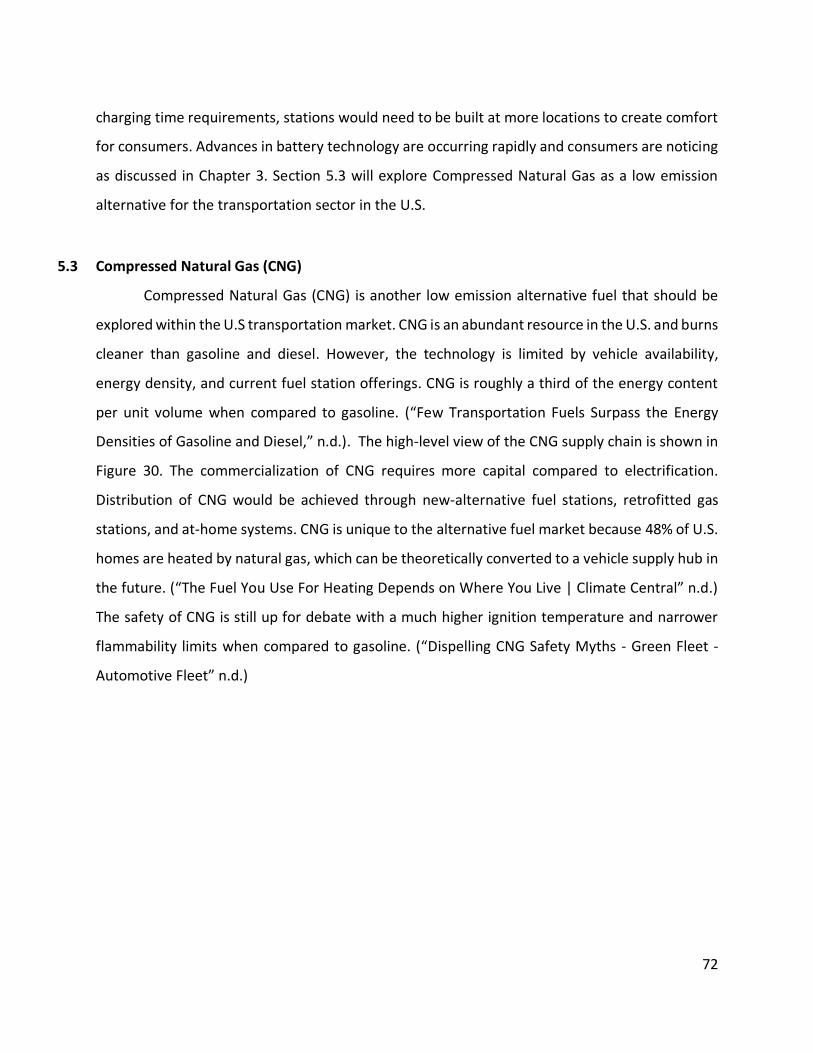
72
charging time requirements, stations would need to be built at more locations to create comfort
for consumers. Advances in battery technology are occurring rapidly and consumers are noticing
as discussed in Chapter 3. Section 5.3 will explore Compressed Natural Gas as a low emission
alternative for the transportation sector in the U.S.
5.3 Compressed Natural Gas (CNG)
Compressed Natural Gas (CNG) is another low emission alternative fuel that should be
explored within the U.S transportation market. CNG is an abundant resource in the U.S. and burns
cleaner than gasoline and diesel. However, the technology is limited by vehicle availability,
energy density, and current fuel station offerings. CNG is roughly a third of the energy content
per unit volume when compared to gasoline. (“Few Transportation Fuels Surpass the Energy
Densities of Gasoline and Diesel,” n.d.). The high-level view of the CNG supply chain is shown in
Figure 30. The commercialization of CNG requires more capital compared to electrification.
Distribution of CNG would be achieved through new-alternative fuel stations, retrofitted gas
stations, and at-home systems. CNG is unique to the alternative fuel market because 48% of U.S.
homes are heated by natural gas, which can be theoretically converted to a vehicle supply hub in
the future. (“The Fuel You Use For Heating Depends on Where You Live | Climate Central” n.d.)
The safety of CNG is still up for debate with a much higher ignition temperature and narrower
flammability limits when compared to gasoline. (“Dispelling CNG Safety Myths - Green Fleet -
Automotive Fleet” n.d.)
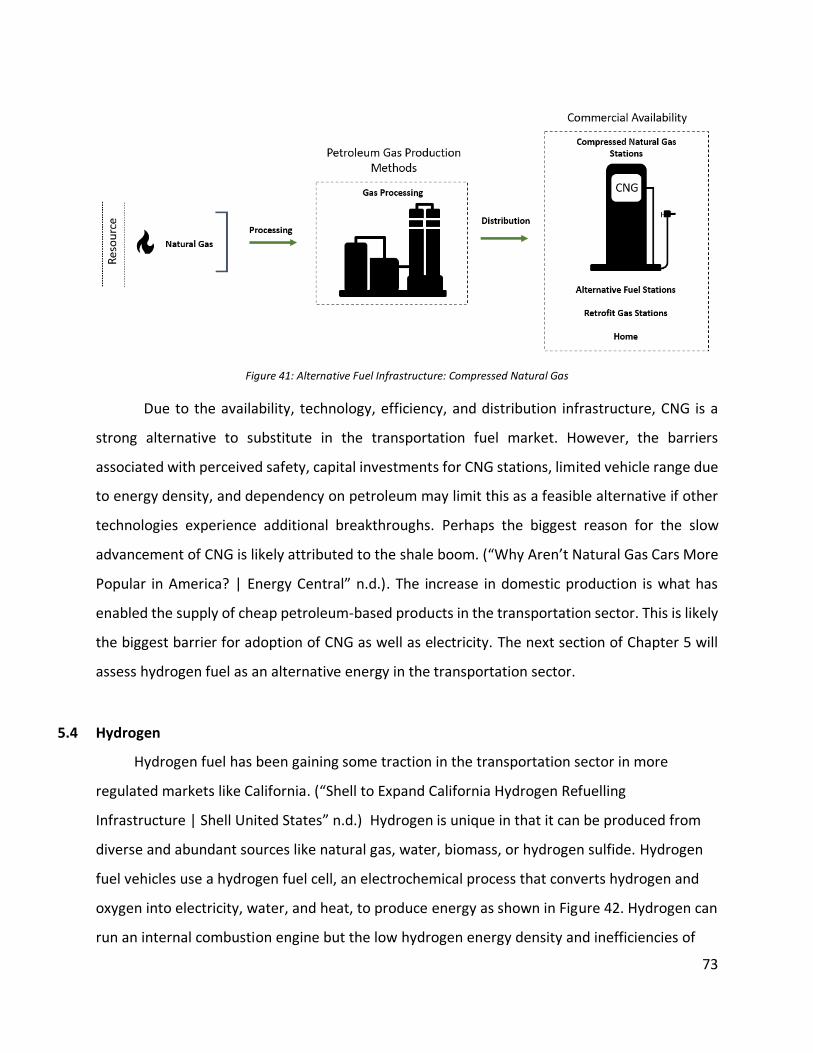
73
Figure 41: Alternative Fuel Infrastructure: Compressed Natural Gas
Due to the availability, technology, efficiency, and distribution infrastructure, CNG is a
strong alternative to substitute in the transportation fuel market. However, the barriers
associated with perceived safety, capital investments for CNG stations, limited vehicle range due
to energy density, and dependency on petroleum may limit this as a feasible alternative if other
technologies experience additional breakthroughs. Perhaps the biggest reason for the slow
advancement of CNG is likely attributed to the shale boom. (“Why Aren’t Natural Gas Cars More
Popular in America? | Energy Central” n.d.). The increase in domestic production is what has
enabled the supply of cheap petroleum-based products in the transportation sector. This is likely
the biggest barrier for adoption of CNG as well as electricity. The next section of Chapter 5 will
assess hydrogen fuel as an alternative energy in the transportation sector.
5.4 Hydrogen
Hydrogen fuel has been gaining some traction in the transportation sector in more
regulated markets like California. (“Shell to Expand California Hydrogen Refuelling
Infrastructure | Shell United States” n.d.) Hydrogen is unique in that it can be produced from
diverse and abundant sources like natural gas, water, biomass, or hydrogen sulfide. Hydrogen
fuel vehicles use a hydrogen fuel cell, an electrochemical process that converts hydrogen and
oxygen into electricity, water, and heat, to produce energy as shown in Figure 42. Hydrogen can
run an internal combustion engine but the low hydrogen energy density and inefficiencies of
74
piston engines make this opportunity unproductive. (“Why Don’t We Just Run Internal
Combustion Engines on Hydrogen?” n.d.)
Figure 42: Alternative Fuel Infrastructure: Hydrogen
Hydrogen fuel consumption has not seen the same level of growth compared to
electricity and scalability appears to be a long way off (“Hydrogen Fuel Cell Cars Are Not
Dominating the Emissions-Free Market — Here’s Why: - The Washington Post” n.d.). Achieving
commercial availability of hydrogen vehicle technology will be challenging due to the initial
capital requirements for infrastructure and the high variable costs specific to producing
hydrogen long term.
Hydrogen does seem to have its place in the power sector, where compressed hydrogen
coupled with an electrochemical fuel cell can provide power, similar to diesel or gasoline
generators. This application has made breakthroughs with applicability and scale. Notably,
Microsoft has tested hydrogen fuel cells as generators for power at data centers with success.
(“Microsoft Tests Hydrogen Fuel Cells for Backup Power at Datacenters | Innovation Stories”
n.d.). The trend of successful energy generation to reduce the dependency on fossil fuels for a
cleaner energy economy keeps hydrogen fuel cells as an important contributor to the
75
transition. The use of hydrogen in the power sector indicates hydrogen fuel cells can potentially
act as a complementor to the EV market by replacing the battery, but this requires a significant
amount of infrastructure compared to other alternatives like electricity.
The resources and infrastructure requirements for alternative solutions show that the
diversity of energy inclusion, as well as the required infrastructure, are critical factors when
Supermajors consider future investments. Chapter 5 will conclude by exploring how Supermajors
have invested in lower emission alternatives in the transportation sector.
5.5 Lower emission energy investments
Supermajors have been strategically investing in lower emission energy alternatives
within the transportation sector. In 2019, petroleum-based products met 93% of the
transportation energy demanded (“Annual Energy Outlook 2020” 2020). However, rapid change
within transportation could be observed in the coming decades as highlighted in Chapter 4. The
remainder of Chapter 5 will be used to explore where each Supermajor is investing in an effort
to identify common themes and key differences.
Shell appears to lead in this space compared to other Supermajors. Shell has been
acquiring fast charging companies, like NewMotion and Greenlots, which aligns with their
projection regarding electricity providing 50% of energy in 2050, compared to 20% today (“Shell
Buys NewMotion Charging Network in First Electric Vehicle Deal | Reuters” n.d.; “Greenlots
Announces Acquisition by Shell, One of the World’s Leading Energy Providers - Greenlots” n.d.)
Greenlots, purchased in 2019, is expected to launch Shell’s US electric mobility business. Shell is
also investing in renewable electricity, like solar and wind, to further enable the growth of
electrification in both the power and transportation sector. In 2018, Shell purchased a 44%
interest in Silicon Ranch, a solar power firm. Shell also holds 50% interest in both Altlantic
Shores and Mayflower consortium, companies looking to supply wind energy to the
Northeastern United States. (“Wind Power | Shell Global” n.d.) Shell also appears to be
mitigating the financial exposure specific to low emission energy investment by using
regulation, like California’s LCFS, to supplement their investments. In 2020, Shell announced
their expansion of their hydrogen re-fueling program within the state of California (“Shell,

76
Toyota and Honda Plan Expansion of Hydrogen Refueling Network in California | Shell United
States” n.d.). This strategy appears promising if you consider the support both Honda and
Toyota are showing by further developing their fleet of FCEVs. BP, like Shell, has invested in
wind and solar energy to enable supply of renewable electricity for the power and
transportation sectors. (“Wind Energy Sites | Where We Operate | Home” n.d.; “Lightsource BP
Completes Financing on 260 MW Solar Project in Texas | News | Home” n.d.) BP has also
invested in electric charging infrastructure to enable electrification in the transportation sector.
(“Super-Charging the Drive to Electric | News and Insights | Home” n.d.) BP recently announced
their plan to evaluate renewable hydrogen in Europe but no activity is evident within the U.S.
BP explains the lack of investment by highlighting the cost associated with hydrogen
production. (“BP Plans Move into Green Hydrogen Production | BP | The Guardian” n.d.). Shell
and BP appear to have similar investment strategies for decarbonizing the transportation sector
in the U.S. The remainder of the section will evaluate actions taken by Chevron and
ExxonMobil.
Like BP and Shell, Chevron is invested in wind, solar, and electric charging stations at
several retail locations in California through their partnership with EVgo. (“These Giant Oil
Companies Are Providing EV Chargers Next to Their Gas Pumps” n.d.) Chevron was also the
“first mover” on hydrogen fueling and operated five locations between 2005 and 2010.
Although, no recent investments have been made, Chevron appears to be re-committing their
interest in this alternative by recently joining the Hydrogen Council (“Bloomberg - Are You a
Robot?” n.d.). Chevron also partnered with California Bioenergy LLC, CalBio, for purposes of
dairy market bio-methane capture and subsequent LNG production (“Chevron & CalBio Biogas
Partnership — Chevron.Com” n.d.). In contrast to the other three Supermajors, ExxonMobil
appears to focus more heavily on advancing carbon capture and sequestration technology to
enable partial reliance on petroleum products long term (“Carbon Capture and Storage |
ExxonMobil” n.d.). The other supermajors have also invested in better understanding the
viability of this technology but it isn’t an emphasis compared to ExxonMobil. ExxonMobil has
also invested in solar technology but more so as a cost effective option for its own operations

77
versus a good option for cleaning up the grid (“Big Oil Companies Like ExxonMobil Helped
Develop Solar Industry : NPR” n.d.).
The Supermajors are taking preliminary steps to lay the foundation for lower emission
alternatives in the transportation sector. However, these alternatives are not yet scalable
without assistance from regulatory programs making it difficult to invest in a way that is
comparable to core business operations. This likely explains the reason Supermajors have
exercised caution to date. However, Supermajors have demonstrated that they can move
quickly when a strong value proposition exists. The same should be expected when it comes to
lower emission alternatives moving forward.
5.6 Summary
This chapter explored the system view for infrastructure requirements of several
alternative transportation fuel sources, including CNG, electricity, and hydrogen. The transient
state of the fuel market due to growing climate change and environmental concerns has opened
market space for value capture and value creation from substitutes. Supermajors are evaluating
how to position themselves in the alternative fuel market to create a sustainable future. Fuel
opportunities that utilize distributed renewable energy resources, like electricity, and have
available or attainable infrastructure requirements, could be the best investment strategies in
the future. The decentralization and democratization of energy is going to be a key driver for
future consumers and energy providers – with technology opportunities to not just be an energy
recipient, but to also feed energy to the grid. Technology that adapts to this future energy
ecosystem may have the highest probability of future growth.
78
6 MARKETING
6.1 Introduction
Chapter 6 will begin with an assessment of brand value for each Supermajor. An analysis
of brand equity over time will be performed to identify common trends for each company. Royal
Dutch Shell’s brand is valued as the highest among Supermajors and they have maintained that
position for more than a decade. Section 6.2 will conclude with an overview of the factors that
may have contributed to Shell’s success.
Supermajors can differentiate their brands in the eyes of the consumer through effective
marketing. Section 6.3 will begin by assessing each Supermajor’s advertising content published
on their websites, social media platforms, and other outlets to identify common themes. The
advanced additive packages offered by each Supermajor and the subsequent advertising strategy
will then be compared. The section will end with an assessment of the customer benefits offered
to those that are loyal to their brand.
Chapter 6 will conclude with an overview of the marketing strategy employed by
Independents in the Retail industry. A case study of two leading independents, Buc-ee’s and
Wawa, will be performed. The section will conclude by comparing the marketing strategies of
Supermajors with Independents.
6.2 Brand Value
The strength that accompanies the Supermajor brands will be evaluated in Section 6.2.
Data quantifying the value of each brand was obtained to understand common trends. Royal
Dutch Shell has distinguished themselves in this category compared to other supermajors
(“Brand-Finance-Oil-and-Gas-50-2020-Preview.Pdf” n.d.). Section 6.2 will end by assessing why
they have continued to widen the gap over time.
6.2.1 Overview
An estimate of brand value over time for each Supermajor is provided in Figure 43 below
(“BrandFinance Global 500 (100) - 2009 (Brand Finance) | Ranking The Brands” n.d.; “Brand
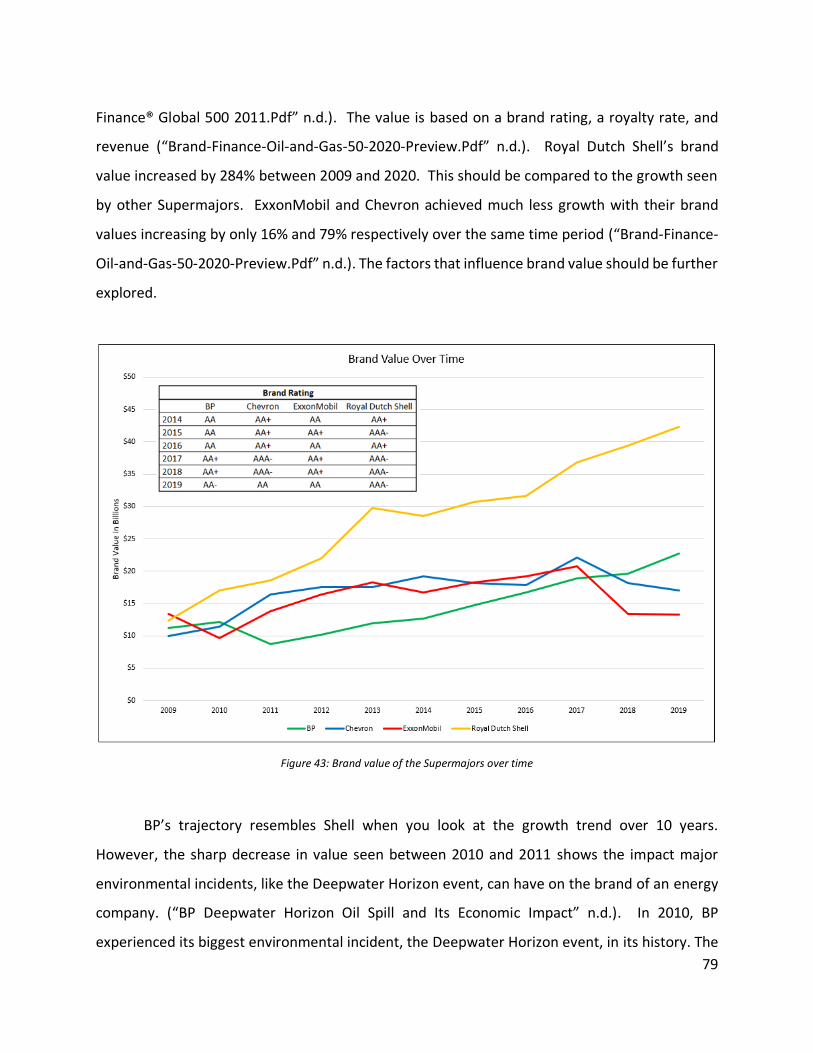
79
Finance® Global 500 2011.Pdf” n.d.). The value is based on a brand rating, a royalty rate, and
revenue (“Brand-Finance-Oil-and-Gas-50-2020-Preview.Pdf” n.d.). Royal Dutch Shell’s brand
value increased by 284% between 2009 and 2020. This should be compared to the growth seen
by other Supermajors. ExxonMobil and Chevron achieved much less growth with their brand
values increasing by only 16% and 79% respectively over the same time period (“Brand-Finance-
Oil-and-Gas-50-2020-Preview.Pdf” n.d.). The factors that influence brand value should be further
explored.
Figure 43: Brand value of the Supermajors over time
BP’s trajectory resembles Shell when you look at the growth trend over 10 years.
However, the sharp decrease in value seen between 2010 and 2011 shows the impact major
environmental incidents, like the Deepwater Horizon event, can have on the brand of an energy
company. (“BP Deepwater Horizon Oil Spill and Its Economic Impact” n.d.). In 2010, BP
experienced its biggest environmental incident, the Deepwater Horizon event, in its history. The
80
value of its brand dropped by 28% the following year. Since the Deepwater incident, BP has
achieved consistent growth demonstrated by the 166% increase in value between 2011 and
2020.
ExxonMobil and Chevron are clearly lagging from a value growth perspective.
ExxonMobil’s brand value has not increased in 10 years. Although Chevron has achieved positive
growth, it is much less compared to Shell and BP. With the exception of 2009, Chevron and
ExxonMobil’s revenue was less than Shell but another limitation appears to be their brand rating.
The brand rating is determined by the level of marketing investment made and by how the brand
is perceived by consumers. Financial performance also influences the score. (“Brand-Finance-
Oil-and-Gas-50-2020-Preview.Pdf” n.d.). A brand can receive a score that ranges from a D, the
lowest, to a AAA+, the highest. Chevron and ExxonMobil’s brand rating, as well as the other
Supermajors, between 2014 and 2019 is summarized in figure 32. Although financial
performance trumped this metric in importance in most years, brand ratings appear to have
contributed to each brand’s value over time.
Revenue and brand strength also help explain the position of Royal Dutch Shell. Shell has
maintained and grown their position over the last 10 years (“BrandFinance Global 500 (100) -
2009 (Brand Finance) | Ranking The Brands” n.d.; “Brand-Finance-Oil-and-Gas-50-2020-
Preview.Pdf” n.d.). With the exception of 2009 and 2010, Shell’s annual revenue was 3-19%
higher than the second most valuable brand helping explain the widening gap they have realized
over time. The other clear distinction for Shell was their brand strength. With the exception of
2014 and 2016, Shell has maintained a brand rating of AAA. Additional factors that may explain
Shell’s position will be further explored in section 6.2.2.
6.2.2 Case Study – Why is Royal Dutch Shell leading?
This section will explore why Royal Dutch Shell’s brand value is significantly higher year
over year compared to other Supermajors. Royal Dutch Shell has the highest market share of
retail stations in the United States as demonstrated in Chapter 2. Royal Dutch Shell also owns a
subsidiary, Shell Energy, that supplies gas and electricity for business and residences throughout
the United Kingdom (“About Shell Energy | Shell Global” n.d.). Securing an additional business
81
to consumer sales channel likely increases the brand’s visibility to consumers, perhaps partially
explaining the difference seen compared to other Supermajors.
Royal Dutch Shell is also demonstrating their position on climate change. They are
committed to including low emission energy alternatives within their portfolio (“Our Strategy |
Shell Global” n.d.). They are planning to leverage their global scale to maximize profitability in
the power sector while using income from oil and gas to enable cleaner energy alternatives
(“Shell Aims to Beat Power Utilities at Their Own Game | Reuters” n.d.). Shell is well positioned
to lead the transition to lower emission alternatives considering their technical expertise and
learnings gained from the power sector should advantage them in the event electricity is the way
of the future for transportation in the U.S.
Another approach that has seemed to help Royal Dutch Shell’s brand value is their
partnerships in the motor sports arena. Royal Dutch Shell partnered with Scuderia Ferrari in
Formula 1®, Ducati Corse in GP, and BMW in tour racing to highlight the performance of their
additive package, Shell V-Power® NiTRO+® (“Shell in Motorsport | Shell Global” n.d.). This
strategy is one that has been shared by other Supermajors. For example, Chevron sponsored
NASCAR under the Texaco Havoline brand for more than 20 years (“Chevron/Texaco Celebrates
20 Years of Racing” n.d.). However, Royal Dutch Shell is extending this platform to lower emission
vehicles. Recently, Royal Dutch Shell established a partnership with Nissan focusing on their
electric racing series, Formula E (“Shell in Motorsport | Shell Global” n.d.). This differentiates
Royal Dutch Shell from the other Supermajors because it indicates that they are working to
differentiate themselves as a low emission energy provider. Another benefit of these
partnerships is the opportunity to collaborate with vehicle manufacturers to improve the
products they make. Sponsorships, like Ferrari, perhaps enable Royal Dutch Shell to justify the
price premium for their fuel (“Shell’s Consolidation Strengthens World’s Most Valuable Oil & Gas
| Press Release | Brand Finance” n.d.). The diversification Royal Dutch Shell achieved via this
example is one to note. Royal Dutch Shell may continue to grow at the same pace if this tactic is
representative of their marketing strategy for the future.
In 2016, Royal Dutch Shell also took another brand building approach with its “Make the
Future” marketing campaign (“Make The Future - Striving for Sustainable Energy” n.d.). The
82
company enrolled six pop stars to sign “Best Day of My Life” while a video describing the
investments Royal Dutch Shell is making in lower emission energy projects played in the
background (“Shell Enlists A-List Celebrity Cast to #makethefuture | Greenbiz” n.d.). Each of the
six pop stars, along with Royal Dutch Shell, shared the video on their social media channels and
it became one of the most viral videos of 2016. This may be another example of why Royal Dutch
Shell’s brand is the most powerful among the competition.
6.3 Supermajors Marketing Strategy
Supermajors anchor their advertising strategies to enhance and protect the reputation of
the company. Their efforts include disseminating information about climate change initiatives
being sponsored by the respective companies. (“Corporate Promotion and Climate Change: An
Analysis of Key Variables Affecting Advertising Spending by Major Oil Corporations, 1986–2015 |
SpringerLink” n.d.). Advertising investments are often in response to media coverage or
congressional action that directly impacts the company’s image or ease of operating. This
approach balances activist groups’ emphasis on the environmental impacts of the oil and gas
industry (“Corporate Promotion and Climate Change: An Analysis of Key Variables Affecting
Advertising Spending by Major Oil Corporations, 1986–2015 | SpringerLink” n.d.). As highlighted
in Chapter 4, the industry often views regulation as the cause of higher operating costs and
subsequently less profits. The advertising tactics of each Supermajor will now be explored to
understand the commonalities and key differences.
6.3.1 Advertising
ExxonMobil, up until this year, was the largest publicly traded energy company in the
world (“5 Things to Know about ExxonMobil Mobil, the World’s Largest Public Oil Company | Fox
Business” n.d.). They operate on a global scale and target innovation and technology to
“responsibly meet the world’s energy needs.” (“ExxonMobil” n.d.) ExxonMobil’s social media
frequently highlights initiatives for exploring lower emission fuel alternatives, advancing
emerging technologies, and improving the communities in which they operate. (“ExxonMobil -
Home | Facebook” n.d.). Chevron’s, who recently passed ExxonMobil as the largest energy
83
company, website focuses on third-quarter results, the acquisition of Noble Energy, and the
response to COVID-19. They also share progress specific to climate change by highlighting their
success at recycling used plastics and the partnership that was established with California
Bioenergy LLC (CalBio) to produce renewable natural gas. (“Chevron Corporation - Human Energy
— Chevron.Com” n.d.) Chevron’s social media promotes their Human Energy campaign and what
they are doing to give back to the communities where they operate (“Chevron - Product/Service
| Facebook - 1,861 Photos” n.d.). Like the other Supermajors, Chevron is focused on shareholder
return and a “lower carbon future” (“Chevron CEO Says Company Is Investing in a Lower Carbon
Energy System” n.d.).
Royal Dutch Shell and BP, the largest European based energy companies, similarly focus
advertising on their commitment to combating climate change. (“• Largest European Companies
Based on Revenue 2018 | Statista” n.d.). Royal Dutch Shell highlights energy trends like electric
vehicle adoption and their response to COVID-19 (“Shell Global | Shell Global” n.d.) BP’s website
highlights clean hydrogen, employee leadership, and their third quarter financial results.
“Reimagining energy” and getting to a net zero carbon footprint by 2050 are key themes BP is
strategically communicating and they appear to have the strongest message regarding carbon
emissions compared to the other Supermajors (“BP” n.d.). Royal Dutch Shell does not appear to
have a global company presence on Facebook and Instagram and their Twitter account
emphasizes alternative fuels and innovation for helping to reduce emissions. (“Twitter - Shell”
n.d.). In contrast, BPs social media presence does include material targeting consumers of diesel
and motor gasoline and their Twitter feed is aligned with their corporate website messages (“Bp
America - Home | Facebook” n.d.; “Twitter - BP” n.d.). Supermajors appear to consistently
leverage actions specific to climate change in the marketing campaigns. Section 6.3.3 will provide
a more detailed comparison of the advertising content specific to the additive packages
Supermajors offer.
6.3.2 Additive Quality
Supermajors consistently emphasize additive quality in the limited advertising
information targeting retail. Supermajors anchor their retail advertising to the performance

84
benefits of quality additives and the subsequent impact on vehicle performance, like engine
cleanliness and increased fuel efficiency. Similar messaging is used to promote the advantages
demonstrated in Figure 4416.
Figure 44: What the Supermajors say about their additives.
Although there is strong evidence supporting the benefits of quality additives, the
message does not appear to be valued strongly by most consumers as highlighted in Chapter 3
(“Study: Top Tier Gasoline Worth the Extra Price - Consumer Reports” n.d.). The claim is further
16 {Citation}
85
challenged by how additive options are defined for consumers within the industry. There are two
categories for additives in the eyes of the consumer, top-tier and non-top tier (“What Is Top Tier
Gas?” n.d.). The additive packages offered by Supermajors exceed the standard set for achieving
a top-tier ranking. That is not widely understood or accepted by consumers considering discount
retailers like Costco and QuikTrip also offer top tier gasoline products at a price point significantly
lower than branded retailers (“Fuels 50 2019: Top 10 Low-Price Leaders” n.d.). This is troubling
for Supermajors because consumers could perceive it as if they can buy the same quality of fuel
at a lower price. Therefore, it is imperative consumers understand the unique benefits high
quality additives provide so that it becomes more central to fuel buying decisions. If this cannot
be achieved, Supermajors’ may need to reconsider whether competing with additive quality
alone is sustainable long term.
6.3.3 Brand Loyalty Offerings
Supermajors have an opportunity to differentiate themselves from the competition
through the customer rewards programs they offer. Loyalty benefits are important to consumers
when determining where to buy fuel as demonstrated in Chapter 3. Generally, Supermajors
loyalty programs include credit card incentives and mobile app benefits. Table 3 provides a
summary of loyalty offerings for each Supermajor17. Royal Dutch Shell and BP are leading the
category by offering 10¢ per gallon discounts while Chevron appears to be lagging in this category
with 3¢ per gallon discounts on gas purchases.
17 (“The Shell | Fuel Rewards® Credit Cards” n.d.; “Gold Status - Shell,” n.d.; “BP - Credit Cards | Products and Services
| Home” n.d.; “BPme Rewards | Products and Services | Home” n.d.; “Chevron Texaco Techron Advantage,” n.d.;
“Download the NEW Chevron App” n.d.; “Gas Credit Cards| Smart Cards for Gas | ExxonMobil and Mobil” n.d.;
“ExxonMobil Rewards+ Mobile App | ExxonMobil and Mobil” n.d.)
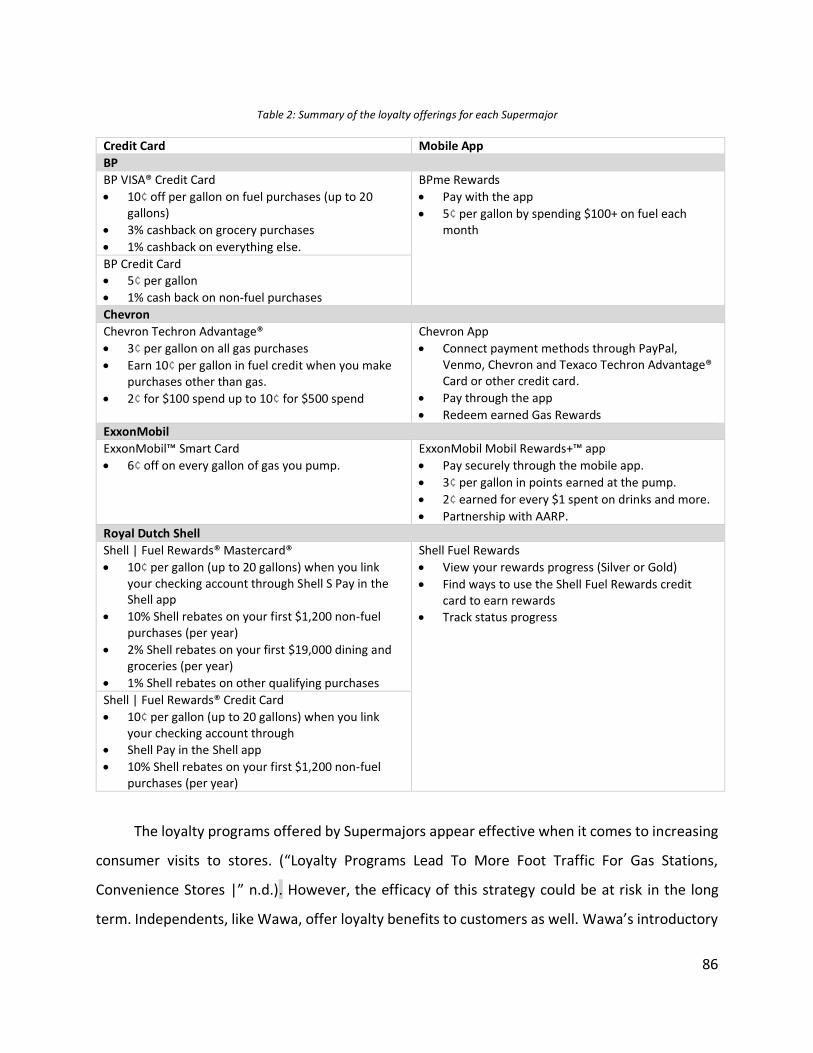
86
Table 2: Summary of the loyalty offerings for each Supermajor
Credit Card Mobile App
BP
BP VISA® Credit Card
• 10¢ off per gallon on fuel purchases (up to 20 gallons)
• 3% cashback on grocery purchases
• 1% cashback on everything else.
BPme Rewards
• Pay with the app
• 5¢ per gallon by spending $100+ on fuel each month
BP Credit Card • 5¢ per gallon
• 1% cash back on non-fuel purchases
Chevron
Chevron Techron Advantage®
• 3¢ per gallon on all gas purchases
• Earn 10¢ per gallon in fuel credit when you make purchases other than gas.
• 2¢ for $100 spend up to 10¢ for $500 spend
Chevron App
• Connect payment methods through PayPal, Venmo, Chevron and Texaco Techron Advantage® Card or other credit card.
• Pay through the app
• Redeem earned Gas Rewards ExxonMobil
ExxonMobil™ Smart Card
• 6¢ off on every gallon of gas you pump.
ExxonMobil Mobil Rewards+™ app
• Pay securely through the mobile app.
• 3¢ per gallon in points earned at the pump.
• 2¢ earned for every $1 spent on drinks and more.
• Partnership with AARP.
Royal Dutch Shell
Shell | Fuel Rewards® Mastercard®
• 10¢ per gallon (up to 20 gallons) when you link your checking account through Shell S Pay in the Shell app
• 10% Shell rebates on your first $1,200 non-fuel purchases (per year)
• 2% Shell rebates on your first $19,000 dining and groceries (per year)
• 1% Shell rebates on other qualifying purchases
Shell Fuel Rewards
• View your rewards progress (Silver or Gold)
• Find ways to use the Shell Fuel Rewards credit card to earn rewards
• Track status progress
Shell | Fuel Rewards® Credit Card
• 10¢ per gallon (up to 20 gallons) when you link your checking account through
• Shell Pay in the Shell app
• 10% Shell rebates on your first $1,200 non-fuel purchases (per year)
The loyalty programs offered by Supermajors appear effective when it comes to increasing
consumer visits to stores. (“Loyalty Programs Lead To More Foot Traffic For Gas Stations,
Convenience Stores |” n.d.). However, the efficacy of this strategy could be at risk in the long
term. Independents, like Wawa, offer loyalty benefits to customers as well. Wawa’s introductory
87
offer for their credit card will save the consumer 50¢ for every gallon purchased, 166% more
valuable compared to the best offer provided by Supermajors (“Wawa Gas Station: Quality Fuel,
Honest Pricing, Convenience | Wawa” n.d.; “Ways to Pay | Shell United States” n.d.).
Supermajors will be challenged going forward if the value gap for consumers continues to persist.
The marketing strategy of well-known, growing Independents will be further reviewed in section
6.4.
6.4 Independents Marketing Strategy
Independents have been growing in market share over the last 5 years as demonstrated
in Chapter 2. Buc-ee's and Wawa are the ones to watch among this class of retailers. Buc-ee's
and Wawa are privately owned convenience store chains that supply fuel (“Buc-Ees – Buc-Ee’s
Beaver Has the Fun Stores” n.d., 5; “50 Years & Counting: Look Back on Wawa Memories &
Milestones | Wawa” n.d.). Buc-ee's station count makes it easy to overlook but their marketing
strategy brings a fresh perspective. The financial performance of these companies is difficult to
discern but the advertising strategies they have employed may explain the success they are
experiencing when it comes to their customer following. This will be explored further in section
6.4.
6.4.1 Case Study – Buc-ee’s
Buc-ee’s marketing strategy appears to focus on the atmosphere consumers should
expect when visiting their locations. Buc-ee's mission since its start in 1982 has been a
commitment to provide positive customer experiences (“About – Buc-ees” n.d.). Customer
service culture permeates throughout the store with employees that are proud to be a part of
the Buc-ee's family. They are uniquely trained to provide a wonderful experience for everyone
who walks through the door. While most of Buc-ee's convenience stores measure about 3,000
square feet and offer the convenience of locally sourced snacks, prepared foods, and extensive
merchandise (“How Two Texans Made Buc-ee’s Convenience Stores A Phenomenon” n.d.). Buc-
ee’s restrooms are known to be the best among the competition. (“How Two Texans Made Buc-
Ee’s Convenience Stores A Phenomenon” n.d.) The locations also offer 80 to 120 gas pumps for
light duty vehicles alone and offer fuel at a discount that was 9.56 cents below average in 2019
88
(“Fuels 50” n.d.) The creative ways Buc-ee’s attracts consumers will be discussed during the
remainder of this section.
Buc-ee’s biggest claim to fame outside of their great customer service and experience is
their award-winning outdoor advertising campaign. Buc-ee's contracted AcmeFish Creative to
launch an outdoor advertising campaign utilizing clever billboard messaging (“Buc-Ee’s | Acme
Fish” n.d.). They created clever messages that attracted attention and let travelers know there
was a delightful destination coming up. The attention-grabbing messages, like “Only 262 Miles
to Buc-ee's. You Can Hold It” and “Your Throne Awaits. Fabulous Restrooms—32 miles”, appear
to create positive word-of-mouth advertising, as seen from the latest Facebook introduction of a
new store in Warner Robins, Georgia. Upon opening, the location received 1,200 comments,
3,000 likes, and 948 shares. (“Buc-Ee’s Outdoor Billboards” n.d.; “How Two Texans Made Buc-
Ee’s Convenience Stores A Phenomenon” n.d.). This type of following has made Buc-ee’s more of
a destination than a convenient store.
6.4.2 Case Study – Wawa
Wawa’s marketing strategy, like Buc-ee’s, also appears to focus on what consumers
should expect when visiting their location. Wawa is known for its customer service, clean
bathrooms, coffee bars, and food. They believe great customer service begins with training their
employees to be stewards of core values with a focus on a positive, strong culture. (“Creating the
Living Brand” n.d.). Like Buc-ee's, Wawa is known to have exceptionally clean bathrooms so
women and children can be confident about their pit stops. (“The Reviews Are in: Wawa Has the
Cleanest Gas Station Restrooms in Pennsylvania, New Jersey and Del. – NBC10 Philadelphia” n.d.).
The coffee options are where beverages and customer service come together. Each coffee area
has a barista who is known for brightening customers’ days by remembering their orders and at
times their names. Wawa is also popular because of their food and they have something for
everyone. They offer made-to-order hot and cold meals as well as options (“Convenience Store,
Food Market, Coffee Shop & Fuel Station | Wawa” n.d.). Wawa was even recognized as America’s
favorite sandwich shop in 2018 (“Wawa Has the Best Sandwiches in America - Business Insider”
n.d.). How Wawa attracts consumers will be discussed during the remainder of this section.

89
Wawa generates strong word-of-mouth digital marketing campaigns by focusing on their
brand and culture. They use creative tactics, like offering free coffee on Tuesdays, to encourage
people to join their rewards program. (“Wawa Rewards” n.d.). Wawa sells branded convenience
store merchandise further enhancing name recognition. Their social media activity emphasizes
the excitement people feel when visiting the store. (“Wawa - Home | Facebook” n.d.) The next
section will compare the marketing tactics of Buc-ee’s and Wawa to Majors.
6.4.3 Comparison of Independents and Supermajors
Independents, like Wawa and Buc-ee's, appear to rely on C-store offerings to ensure
profitability while Supermajors rely on fuel. This helps explain the stark difference between how
Supermajors and Independents market their brands. Supermajors focus on fuel first and
convenience store offerings second while Independents focus on convenience store offerings
first and fuel second. Supermajors anchor their retail marketing strategies to the benefits of
advanced additives while Independents emphasize atmosphere, merchandise, and food.
Consequently, the Buc-ee's and Wawa customer experience generates loyalty among consumers.
Their effective use of social media sites enables them to reach customers in a way that is
unique compared to Supermajors. Supermajors, Shell being the exception, poor
management of social media platforms challenge their ability to protect and enhance their
image.
6.5 Summary
Supermajors seem to be using the same approach to the market and marketing techniques
for years. They are look at their business as a whole and see the importance of giving back to the
communities they operate in while promoting the good they are doing with respect to reducing
their environmental impact. Based on the current evidence, if they want to really start attracting
customers to their retail markets, they might need to do things differently in the future. These
marketing efforts can positively impact their Downstream business but can also improve their
brand value thus attracting even more opportunities.
90
7 CONCLUSION
Supermajors recognize the value of vertical integration which presents a strong case for
remaining in the retail industry within the United States. Today, Supermajors can benefit from
pursuing aggressive growth strategies in markets where they have proprietary supply and own
significant market share. But the same logic will be challenged moving forward as efficiency
improvements are implemented and technological advancements for lower emission energy
alternatives are achieved. Supermajors should position themselves to adapt to the growing
importance of lower emission energy alternatives in the U.S. transportation energy market.
Demand for petroleum products in the transportation sector is uncertain, but Supermajors are
uniquely equipped to expand their core capabilities such that they can continue to supply energy
at scale well into the 21st century.
Demand for petroleum products in the transportation sector will likely decrease as
demonstrated in Chapter 3 and Supermajors should seek opportunities to maintain utilization of
legacy assets as a result. This can be achieved by selling branded fuels in international markets
where brand differentiation is achievable and regulation is lagging. It can also be realized by re-
purposing refining systems to produce lower emission renewables and enhancing retail locations
by offering lower emission energy alternatives. Both strategies could be worthy endeavors from
a profitability standpoint which highlights one of the more useful conclusions of this thesis.
Supermajors can increase the profitability of their retail business by managing regulation as a
profit center instead of a cost center. Supermajors will need to develop both the technology and
infrastructure, while maintaining and improving core business, to meet the energy and
environmental needs of the future. Lower emission energy investments can be high-risk with a
low return on investment, especially with the current uncertainty about which alternatives will
dominate demand in the future. Investment strategies include “build and they will come” or
“build as they come.” The former approach comes at a higher risk, but it includes the ability to
capture more market share as a first mover. While the latter approach is more risk averse, it
could also result in market position being jeopardized because they aren’t’ equipped to meet the
needs of the market. The core capabilities of Supermajors include maintaining efficient supply
chains, effectively adjusting scalability, and deploying technology to create a workable
91
transition. The path is not well-defined and the investment landscape for lower emission
alternatives is convoluted with breakthrough technologies that often fail to scale. However,
Supermajors’ ability to understand all the contributing system dependencies can help create an
optimal investment strategy.
Substitute products, like electricity and hydrogen, will disrupt the current market if they offer
more benefits at a competitive cost compared to petroleum-based fuels. Applying digital
applications to proactively identify the changing needs of the market will be fundamental to
effectively managing impending threats. The looming challenge that is creating the space for
market disruption in the U.S. transportation sector is the correlation and causation of GHG
emissions to climate change. However, the solution to reduce carbon emissions cannot be
achieved solely by adopting a substitute fuel highlighting the need to advance carbon capture
technology such that tail pipe emissions can be mitigated. Achieving this goal would create a
more certain future for petroleum-based products in the U.S. long term.
The performance of Electric Vehicles (EV) has advanced significantly in recent years such that
consumers may equally prefer them over internal combustion engines in the near future. If this
comes to fruition, and re-charging time continues to exceed 20 minutes, the future of
Supermajors’ place in retail could be questioned because consumers will opt to charge at home
versus a convenience store. Therefore, Supermajors should try to enable growth among other
lower emission alternatives like CNG and hydrogen. Supermajors can differentiate themselves
with these offerings because they know how to produce and safely distribute highly combustible
products to the public (i.e., a typical gas station). Marketing products like CNG and hydrogen,
compared to electricity, align well with this image Supermajors have worked hard to achieve.
The retail industry also provides a valuable platform for Supermajors. It is commonly used to
broadcast measures taken to demonstrate commitments to combatting climate change and
giving back to the communities in which they operate. Marketing that targets retail is typically
anchored on promoting additive quality and subsequent engine performance. Chapter 6
summarized the differences between how Supermajors market their products compared to
Independents and Chapter 2 demonstrated the growth in market share seen as a result. This data
should compel Supermajors to expand their marketing strategy to include the consumer
92
experience. The tendency to anchor advertising to fuel quality may not produce significant value
moving forward because it isn’t deemed a critical factor in the eyes of consumers. The tier
structure used to classify fuel quality doesn’t provide an advantage to Supermajors because Top-
tier fuel is widely offered at lower price points. If Supermajors continue with this marketing
approach, they must find a way to create more awareness of the benefits offered by high quality
additives.
The analysis performed on consumer behaviors helped answer a question posed in
Chapter 1: does the perception consumers have regarding the brand’s commitment to climate
change mitigation matter when it comes to fuel purchasing decisions? There is no data that
indicates it is currently a serious consideration for consumers. Individuals highly motivated by
mitigating climate change purchase lower emission vehicles, not specific brands of gasoline.
However, this could change rapidly in the future based on the results of a study performed by
Greenbiz (“Do Consumers Reward Companies for Their Climate Leadership? | Greenbiz” n.d.).
Greenbiz posed the following question to consumers, “If two products were equal and were
equally priced, would a perception of climate action by the company make a difference?” Forty
Percent of those surveyed said they would or would likely purchase from the business focused
on climate action. The survey also found that 20% said they would not purchase from a
Corporation that is known as a climate change leader. The population among this 20% may be
evolving. Climate change is becoming one of the leading concerns among citizens in the U.S (“U.S.
Public Views on Climate and Energy | Pew Research Center” n.d.). Just as rapid change occurred
within the U.S. energy market due to the increase in domestic crude production, the same could
be true for consumers' sentiment about oil-producing corporations. Supermajors can use their
retail networks to fulfill additional corporate purpose. The more Supermajors can market their
actions specific to climate change mitigation within their retail networks, the better positioned
they can be to capture value across the Corporation long term.
8 REFERENCES
93
“• Chart: Most Important Factors When Buying a Car | Statista.” n.d. Accessed December 15,
2020. https://www.statista.com/chart/13075/most-important-factors-when-buying-a-
car/.
“• Largest European Companies Based on Revenue 2018 | Statista.” n.d. Accessed December 21,
2020. https://www.statista.com/statistics/973337/largest-european-based-revenue/.
“5 Things to Know about ExxonMobil Mobil, the World’s Largest Public Oil Company | Fox
Business.” n.d. Accessed December 20, 2020.
https://www.foxbusiness.com/money/ExxonMobil-mobil-worlds-largest-public-oil-
company-5-things-to-know.
“11 Reasons People Don’t Buy Electric Cars (and Why They’re Wrong) | U.S. News & World
Report.” n.d. Accessed December 13, 2020. https://cars.usnews.com/cars-trucks/why-
people-dont-buy-electric-cars.
“50 Years & Counting: Look Back on Wawa Memories & Milestones | Wawa.” n.d. Accessed
December 20, 2020. https://www.wawa.com/about/wawa-history.
“2017-Summary-Annual-Report.Pdf.” n.d. Accessed December 23, 2020.
https://corporate.ExxonMobil.com/-/media/Global/Files/investor-relations/annual-
meeting-materials/annual-report-summaries/2017-Summary-Annual-Report.pdf.
“2018_GACS_Data Deck_Germany.Pdf.” n.d. Accessed December 15, 2020.
https://www2.deloitte.com/content/dam/Deloitte/de/Documents/consumer-industrial-
products/2018_GACS_Data%20Deck_Germany.pdf.
“2020 Fuels 50: Top 5 Gas Brands by Market Share.” n.d. Accessed December 23, 2020.
https://www.cspdailynews.com/fuels/2020-fuels-50-top-5-gas-brands-market-share.
“67617.Pdf.” n.d. Accessed November 21, 2020. https://www.nrel.gov/docs/fy17osti/67617.pdf.
“AAA: Not All Gasoline Created Equal | AAA NewsRoom.” n.d. Accessed July 13, 2020.
https://newsroom.aaa.com/2016/07/aaa-not-gasoline-created-equal/.
“About – Buc-Ees.” n.d. Accessed December 20, 2020. https://buc-ees.com/about/.
“About EIA - U.S. Energy INformation Administration.” n.d.
https://www.eia.gov/about/#:~:text=EIA%20is%20your%20trusted%20source,secu.

94
“About Shell Energy | Shell Global.” n.d. Accessed December 20, 2020.
https://www.shell.com/shellenergy/about.html.
“AEO2014 - Transportation Sector.” n.d.
“Alternative Fuels Data Center: Emissions from Hybrid and Plug-In Electric Vehicles.” n.d.
Accessed January 1, 2021. https://afdc.energy.gov/vehicles/electric_emissions.html.
“Alternative Fuels Data Center: Renewable Hydrocarbon Biofuels.” n.d. Accessed November 23,
2020a. https://afdc.energy.gov/fuels/emerging_hydrocarbon.html.
“———.” n.d. Accessed December 13, 2020b.
https://afdc.energy.gov/fuels/emerging_hydrocarbon.html.
“Annual Energy Outlook 1992.” n.d. US Energy Information Administration (EIA).
https://www.eia.gov/outlooks/archive/aeo92/pdf/0383(92).pdf.
“Annual Energy Outlook 1994.” n.d. US Energy Information Administration (EIA).
https://www.eia.gov/outlooks/archive/aeo94/pdf/0383(94).pdf.
“Annual Energy Outlook 1996.” 1996. US Energy Information Administration (EIA).
https://www.eia.gov/outlooks/archive/aeo96/assumption/index.html.
“Annual Energy Outlook 1998.” n.d. US Energy Information Administration (EIA).
https://www.eia.gov/outlooks/archive/aeo98/sup98tables/index.html.
“Annual Energy Outlook 2000.” n.d. US Energy Information Administration (EIA).
https://www.eia.gov/outlooks/archive/aeo00/supplement/index.html.
“Annual Energy Outlook 2002.” n.d. US Energy Information Administration (EIA).
https://www.eia.gov/outlooks/archive/aeo02/supplement/index.html.
“Annual Energy Outlook 2004.” n.d. US Energy Information Administration (EIA).
https://www.eia.gov/outlooks/archive/aeo04/supplement/index.html.
“Annual Energy Outlook 2006.” n.d. US Energy Information Administration (EIA).
https://www.eia.gov/outlooks/archive/aeo06/supplement/index.html.
“Annual Energy Outlook 2008.” n.d. US Energy Information Administration (EIA).
https://www.eia.gov/outlooks/archive/aeo08/supplement/index.html.
“Annual Energy Outlook 2010.” n.d. US Energy Information Administration (EIA).
https://www.eia.gov/outlooks/archive/aeo10/supplement/index.html.
95
“Annual Energy Outlook 2012.” n.d. https://www.eia.gov/outlooks/aeo/data/browser/#/?id=2-
AEO2012®ion=1-0&cases=ref2012&start=2009&end=2035&f=A&linechart=ref2012-
d020112c.56-2-AEO2012.1-0~ref2012-d020112c.57-2-AEO2012.1-0~ref2012-
d020112c.58-2-AEO2012.1-0~ref2012-d020112c.59-2-AEO2012.1-0~ref2012-
d020112c.60-2-AEO2012.1-0~ref2012-d020112c.61-2-AEO2012.1-0~ref2012-
d020112c.62-2-AEO2012.1-0~ref2012-d020112c.63-2-AEO2012.1-0~ref2012-
d020112c.64-2-AEO2012.1-0~ref2012-d020112c.65-2-AEO2012.1-0~ref2012-
d020112c.66-2-AEO2012.1-0~ref2012-d020112c.67-2-AEO2012.1-0~ref2012-
d020112c.68-2-AEO2012.1-0~ref2012-d020112c.69-2-AEO2012.1-0~ref2012-
d020112c.70-2-AEO2012.1-0&map=ref2012-d020112c.4-2-AEO2012.1-
0&ctype=linechart&sourcekey=0.
“Annual Energy Outlook 2016.” n.d. US Energy Information Administration (EIA).
https://www.eia.gov/outlooks/archive/aeo16/.
“Annual Energy Outlook 2018.” n.d. https://www.eia.gov/outlooks/aeo/data/browser/#/?id=2-
AEO2018&cases=ref2018&sourcekey=0.
“Annual Energy Outlook 2020.” 2020. US Energy Information Administration (EIA), January, 8.
“August+2020+-+LCFS+Market+Overview_Final.Pdf.” n.d. Accessed December 14, 2020.
https://srectradeblog.s3.amazonaws.com/August+2020+-
+LCFS+Market+Overview_Final.pdf.
“Big Oil Companies Like ExxonMobil Helped Develop Solar Industry : NPR.” n.d. Accessed
December 28, 2020. https://www.npr.org/2019/09/30/763844598/how-big-oil-of-the-
past-helped-launch-the-solar-industry-of-today.
“Big Oil Makes a Major Retail Statement.” n.d. Accessed September 15, 2020.
https://www.cspdailynews.com/company-news/big-oil-makes-major-retail-statement.
“Big Oil’s Claims About CA Climate Policies Were Wrong | NRDC.” n.d. Accessed December 14,
2020. https://www.nrdc.org/experts/simon-mui/big-oils-claims-about-ca-climate-
policies-were-wrong.
96
“Biomass-Based Diesel - Renewable Diesel Explained - U.S. Energy Information Administration
(EIA).” n.d. Accessed November 23, 2020.
https://www.eia.gov/energyexplained/biofuels/biodiesel-in-depth.php.
“Bloomberg - Are You a Robot?” n.d. Accessed December 28, 2020.
https://www.bloomberg.com/tosv2.html?vid=&uuid=d1978550-4958-11eb-b2cd-
1bad204a516e&url=L3ByZXNzLXJlbGVhc2VzLzIwMjAtMDEtMTUvY2hldnJvbi1qb2lucy1oe
WRyb2dlbi1jb3VuY2ls.
“BP.” n.d. Accessed November 22, 2020. https://www.bp.com/.
“BP - Credit Cards | Products and Services | Home.” n.d. Accessed December 20, 2020.
https://www.bp.com/en_us/united-states/home/products-and-services/our-
rewards/credit-cards.html.
“Bp America - Home | Facebook.” n.d. Accessed November 22, 2020.
https://www.facebook.com/bpAmerica.
“BP Completes Sale of Texas City Refinery | News and Insights | Home.” n.d. Accessed November
23, 2020. https://www.bp.com/en/global/corporate/news-and-insights/press-
releases/bp-completes-sale-of-texas-city-refinery-and-related-assets-to-marathon-
petroleum.html.
“BP Deepwater Horizon Oil Spill and Its Economic Impact.” n.d. Accessed December 20, 2020.
https://www.thebalance.com/bp-gulf-oil-spill-facts-economic-impact-3306212.
“BP Innovates for Tomorrow - CStore Decisions.” n.d. Accessed November 23, 2020.
https://cstoredecisions.com/2019/07/17/bp-innovates-for-tomorrow/.
“BP Plans Move into Green Hydrogen Production | BP | The Guardian.” n.d. Accessed December
28, 2020. https://www.theguardian.com/business/2020/nov/10/bp-plans-move-into-
green-hydrogen-production.
“BP to Sell All Company-Owned and -Operated C-Stores | Convenience Store News.” n.d.
Accessed September 15, 2020. https://csnews.com/bp-sell-all-company-owned-and-
operated-c-stores.
“BP United States.” n.d. Accessed November 22, 2020. https://www.bp.com/en_us/united-
states/home.html.

97
“BPme Rewards | Products and Services | Home.” n.d. Accessed December 20, 2020.
https://www.bp.com/en_us/united-states/home/products-and-services/our-
rewards/bpme-rewards.html.
Bracmort, Kelsi. 2020. “The Renewable Fuel Standard (RFS): An Overview.” Congressional
Research Service, April, 17.
“Brand Finance® Global 500 2011.Pdf.” n.d. Accessed December 19, 2020.
https://brandirectory.com/download-
report/Brand%20Finance%C2%AE%20Global%20500%202011.pdf.
“BrandFinance Global 500 (100) - 2009 (Brand Finance) | Ranking The Brands.” n.d. Accessed
December 19, 2020. https://www.rankingthebrands.com/The-Brand-
Rankings.aspx?rankingID=83&year=104.
“Brand-Finance-Oil-and-Gas-50-2020-Preview.Pdf.” n.d. Accessed December 19, 2020.
https://brandirectorypublic.s3.eu-west-2.amazonaws.com/reports_free/brand-finance-
oil-and-gas-50-2020-preview.pdf.
“Buc-Ee’s | Acme Fish.” n.d. Accessed December 21, 2020. https://acmefish.com/project/buc-
ees/.
“Buc-Ees – Buc-Ee’s Beaver Has the Fun Stores.” n.d. Accessed December 20, 2020. https://buc-
ees.com/.
“Buc-Ee’s Outdoor Billboards.” n.d. Accessed December 20, 2020.
https://acmefish.com/advertising/outdoor/.
“Cal LCFS - Resolution to Extend.” n.d. Accessed June 24, 2020.
https://ww2.arb.ca.gov/news/carb-amends-low-carbon-fuel-standard-wider-impact.
“California to Expand Low Carbon Fuel Standard to 2030 with More Stringent Targets | S&P
Global Platts.” n.d. Accessed December 14, 2020.
https://www.spglobal.com/platts/ko/market-insights/latest-news/agriculture/021114-
california-to-expand-low-carbon-fuel-standard-to-2030-with-more-stringent-targets.
“California’s 2050 Greenhouse Gas Emission Goals.” n.d. Accessed December 19, 2020.
https://www.physics.uci.edu/~silverma/actions/California2050.html.
98
“Carbon Capture and Storage | ExxonMobil.” n.d. Accessed December 28, 2020.
https://corporate.ExxonMobil.com/Research-and-innovation/Carbon-capture-and-
storage.
“Chevron & CalBio Biogas Partnership — Chevron.Com.” n.d. Accessed January 8, 2021.
https://www.chevron.com/stories/chevron-calbio-biogas-partnership.
“Chevron - Product/Service | Facebook - 1,861 Photos.” n.d. Accessed December 20, 2020.
https://www.facebook.com/Chevron.
“Chevron CEO Says Company Is Investing in a Lower Carbon Energy System.” n.d. Accessed
December 15, 2020. https://www.cnbc.com/2020/12/09/chevron-ceo-says-company-is-
investing-in-a-lower-carbon-energy-
system.html?fbclid=IwAR1wSy_70M8lh6UZkz9ewAimzVldwEX7iBCO5GT5REhhQX89cblf
vt7V8Wo&utm_source=facebook&utm_medium=social&utm_campaign=corporate.
“Chevron Completes Acquisition of Pasadena Refining System, Inc. — Chevron.Com.” n.d.
Accessed December 23, 2020. https://www.chevron.com/stories/chevron-completes-
acquisition-of-pasadena-refining-system-inc.
“Chevron Corporation - Human Energy — Chevron.Com.” n.d. Accessed November 22, 2020.
https://www.chevron.com/.
“Chevron Texaco Techron Advantage.” n.d. https://www.chevrontexacocards.com/Chevron/.
“Chevron to Divest Millions in U.S. Assets | Convenience Store News.” n.d. Accessed December
5, 2020. https://csnews.com/chevron-divest-millions-us-assets.
“Chevron/Texaco Celebrates 20 Years of Racing.” n.d. Accessed December 20, 2020.
https://www.cspdailynews.com/fuels/chevrontexaco-celebrates-20-years-racing.
Clifford, Catherine. n.d. “This Is the One Thing That Motivates Elon Musk.” Accessed December
13, 2020. https://www.cnbc.com/2017/07/17/this-is-the-one-thing-that-motivates-elon-
musk.html.
“Comparison of Well-to-Wheels Energy Use and Emissions of a Hydrogen Fuel Cell Electric Vehicle
Relative to a Conventional Gasoline-Powered Internal Combustion Engine Vehicle
(Journal Article) | OSTI.GOV.” n.d. Accessed January 1, 2021.
https://www.osti.gov/biblio/1580696.
99
“Convenience Store, Food Market, Coffee Shop & Fuel Station | Wawa.” n.d. Accessed December
20, 2020. https://www.wawa.com/.
“Corporate Average Fuel Economy | NHTSA.” n.d. Accessed December 23, 2020.
https://www.nhtsa.gov/laws-regulations/corporate-average-fuel-economy.
“Corporate Average Fuel Economy (CAFE) Standards | US Department of Transportation.” n.d.
Accessed December 23, 2020.
https://www.transportation.gov/mission/sustainability/corporate-average-fuel-
economy-cafe-standards.
“Corporate Promotion and Climate Change: An Analysis of Key Variables Affecting Advertising
Spending by Major Oil Corporations, 1986–2015 | SpringerLink.” n.d. Accessed November
22, 2020. https://link.springer.com/article/10.1007/s10584-019-02582-8.
“Couche-Tard and Shell Firm Up Relations | Convenience Store News.” n.d. Accessed December
19, 2020. https://csnews.com/couche-tard-and-shell-firm-relations.
“Creating the Living Brand.” n.d. Accessed December 20, 2020.
https://hbr.org/2005/05/creating-the-living-brand.
Dennis, Brady, Steven Mufson, and Scott Clement. 2019. “Climate Change - Washington Post.”
The Washington Post, September 13, 2019, sec. Climate and Environment.
https://www.washingtonpost.com/climate-environment/americans-increasingly-see-
climate-change-as-a-crisis-poll-shows/2019/09/12/74234db0-cd2a-11e9-87fa-
8501a456c003_story.html.
Diment, Dmitry. n.d. “Gas Stations in the US - Competitive Landscape.” https://my-ibisworld-
com.libproxy.mit.edu/us/en/industry/44719/competitive-landscape.
“Dispelling CNG Safety Myths - Green Fleet - Automotive Fleet.” n.d. Accessed November 21,
2020. https://www.automotive-fleet.com/156287/dispelling-cng-safety-myths.
“Do Consumers Reward Companies for Their Climate Leadership? | Greenbiz.” n.d. Accessed
January 6, 2021. https://www.greenbiz.com/article/do-consumers-reward-companies-
their-climate-leadership.
“Download the NEW Chevron App.” n.d. Accessed December 20, 2020.
https://www.chevronwithtechron.com/MobileApp.

100
“Drew Kodjak_Canada Global EV_12June2019_0.Pdf.” n.d. Accessed November 21, 2020.
https://theicct.org/sites/default/files/Drew%20Kodjak_Canada%20global%20EV_12June
2019_0.pdf.
“Electric Vehicle Trends | Deloitte Insights.” n.d. Accessed November 21, 2020.
https://www2.deloitte.com/uk/en/insights/focus/future-of-mobility/electric-vehicle-
trends-2030.html.
“Elon Musk.” n.d. Accessed December 13, 2020. https://www.forbes.com/profile/elon-
musk/?sh=79ab59ee7999.
“Energy Market Stats.” n.d. Accessed December 23, 2020.
https://www.bp.com/content/dam/bp/business-
sites/en/global/corporate/pdfs/energy-economics/statistical-review/bp-stats-review-
2020-full-report.pdf.
“Ethanol Explained - U.S. Energy Information Administration (EIA).” n.d. Accessed December 13,
2020. https://www.eia.gov/energyexplained/biofuels/ethanol.php.
“EV-Volumes - The Electric Vehicle World Sales Database.” n.d. Accessed November 28, 2020.
http://www.ev-volumes.com/country/usa/.
“ExtraMile Convenience Stores Steadily Widens Its Reach Across the Western U.S. | Convenience
Store News.” n.d. Accessed December 19, 2020. https://csnews.com/extramile-
convenience-stores-steadily-widens-its-reach-across-western-us.
“ExxonMobil.” n.d. Accessed November 22, 2020. https://corporate.ExxonMobil.com/.
“ExxonMobil - Home | Facebook.” n.d. Accessed November 22, 2020.
https://www.facebook.com/ExxonMobil.
“ExxonMobil Rewards+ Mobile App | ExxonMobil and Mobil.” n.d. Accessed December 20, 2020.
https://www.ExxonMobil.com/en/rewards-plus-mobile-app.
“ExxonMobil to Proceed with New Crude Unit as Part of Beaumont Refinery Expansion |
ExxonMobil.” n.d. Accessed November 23, 2020.
https://corporate.ExxonMobil.com/News/Newsroom/News-
releases/2019/0129_ExxonMobil-to-Proceed-with-New-Crude-Unit-as-Part-of-
Beaumont-Refinery-Expansion.
101
“ExxonMobil’s Exit Strategy Nears Finish Line | Convenience Store News.” n.d. Accessed
September 15, 2020. https://csnews.com/ExxonMobils-exit-strategy-nears-finish-line.
“Federal Vehicle Standards.” n.d. Accessed June 28, 2020.
https://www.c2es.org/content/regulating-transportation-sector-carbon-emissions/.
“Federal Vehicle Standards — Center for Climate and Energy Solutions.” n.d. Accessed November
28, 2020. https://www.c2es.org/content/regulating-transportation-sector-carbon-
emissions/.
“Few Transportation Fuels Surpass the Energy Densities of Gasoline and Diesel.” n.d. Few
Transportation Fuels Surpass the Energy Densities of Gasoline and Diesel.
https://www.eia.gov/todayinenergy/detail.php?id=9991.
“Former Bakersfield Refinery to Become Renewable Fuels Plant | Oil & Gas Journal.” n.d.
Accessed December 5, 2020. https://www.ogj.com/refining-
processing/refining/article/14175698/former-bakersfield-refinery-to-become-
renewable-fuels-plant.
“Fuel Economy Improvements.” n.d. https://www.eia.gov/todayinenergy/detail.php?id=31332.
“Fuels 50.” n.d. Accessed December 21, 2020. https://www.cspdailynews.com/fuels-50.
“Fuels 50 - 2017.” n.d. Accessed December 23, 2020. https://www.cspdailynews.com/fuels-50.
“Fuels 50 - 2018.” n.d. Accessed December 23, 2020. https://www.cspdailynews.com/fuels-
50?year=2018.
“Fuels 50 2018: How Consumers Choose Their Gas Stops.” n.d. Accessed January 6, 2021.
https://www.cspdailynews.com/fuels/fuels-50-2018-how-consumers-choose-their-gas-
stops.
“Fuels 50 2018: Top 10 Brands by Market Share.” n.d. Accessed December 23, 2020.
https://www.cspdailynews.com/fuels/fuels-50-2018-top-10-brands-market-share.
“Fuels 50 2019: Top 10 Low-Price Leaders.” n.d. Accessed December 20, 2020.
https://www.cspdailynews.com/fuels/fuels-50-2019-top-10-low-price-leaders.
“Fuels 50-2019.” n.d. Accessed December 23, 2020. https://www.cspdailynews.com/fuels-
50?year=2019.

102
Funderburk, Gail. n.d. “The Surprising Top 5 Reasons for Choosing Where We Buy Gas | Market
Force Information, Inc.” Marketforce.Com. Accessed July 13, 2020.
https://www.marketforce.com/blog/top-5-reasons-for-choosing-where-we-buy-gas.
“Gas Credit Cards| Smart Cards for Gas | ExxonMobil and Mobil.” n.d. Accessed December 20,
2020. https://www.ExxonMobil.com/en/smart-card.
“Gasoline and Diesel Fuel | ExxonMobil and Mobil.” n.d. Accessed November 22, 2020.
https://www.ExxonMobil.com/en/fuels.
“Global EV Outlook 2019 – Analysis - IEA.” n.d. Accessed November 21, 2020.
https://www.iea.org/reports/global-ev-outlook-2019.
“Gold Status - Shell.” n.d. https://www.fuelrewards.com/gold.
“Greenlots Announces Acquisition by Shell, One of the World’s Leading Energy Providers -
Greenlots.” n.d. Accessed December 28, 2020. https://greenlots.com/greenlots-
announces-acquisition-by-shell-one-of-the-worlds-leading-energy-providers/.
Hanson, Steve, and Neil Agarwal. n.d. “Renewable Diesel Is Increasingly Used to Meet California’s
Low Carbon Fuel Standard.” https://www.eia.gov/todayinenergy/detail.php?id=37472.
“Here’s How the U.S. Can Lead the World on Climate Change Innovation | Bill Gates.” n.d.
Accessed December 13, 2020. https://www.gatesnotes.com/Energy/How-the-US-can-
lead-on-climate-change-innovation.
“How Amazon Created AWS and Changed Technology Forever - MarketWatch.” n.d. Accessed
December 13, 2020. https://www.marketwatch.com/story/how-amazon-created-aws-
and-changed-technology-forever-2019-12-03.
“How Branded Stations Operate | NACS.” n.d. Accessed December 5, 2020.
https://www.convenience.org/Topics/Fuels/How-Branded-Gasoline-Stations-Work.
“How Natural Gas Stacks up in the Race to Reduce Emissions.” n.d. Accessed January 1, 2021.
https://www.cleanenergyfuels.com/compression/blog/natgassolution-part-1-clean-
natural-gas-stack-race-reduce-emissions/.
“How Two Texans Made Buc-Ee’s Convenience Stores A Phenomenon.” n.d. Accessed December
20, 2020. https://www.forbes.com/sites/petercarbonara/2017/08/22/buc-ees-game-of-
porcelain-thrones/?sh=7f174d627626.

103
“How-Consumers-React-to-Gas-Prices.Pdf.” n.d. Accessed December 3, 2020a.
https://www.convenience.org/topics/fuels/documents/how-consumers-react-to-gas-
prices.pdf.
“———.” n.d. Accessed December 3, 2020b.
https://www.convenience.org/topics/fuels/documents/how-consumers-react-to-gas-
prices.pdf.
“Hydrogen Fuel Cell Cars Are Not Dominating the Emissions-Free Market — Here’s Why: - The
Washington Post.” n.d. Accessed December 26, 2020.
https://www.washingtonpost.com/technology/2020/02/26/hydrogen-fuel-cell-cars/.
“Hydrogen Use Doesn’t Emit Carbon but Its Production Often Does. That Could Soon Change |
Horizon: The EU Research & Innovation Magazine | European Commission.” n.d. Accessed
January 1, 2021. https://horizon-magazine.eu/article/hydrogen-use-doesn-t-emit-
carbon-its-production-often-does-could-soon-change.html.
“IBIS - Petroleum Refining the U.S.” n.d. Accessed December 21, 2020.
https://login.libproxy.mit.edu/connect?session=rVqnQjxdN38gb6vq&qurl=https%3a%2f
%2fmy.ibisworld.com%2fus%2fen%2findustry%2f32411%2fmajor-companies.
“Importance Of Permian Basin Is Delineated In TIPRO Report.” n.d. Accessed December 23, 2020.
https://www.aogr.com/magazine/markets-analytics/importance-of-permian-basin-is-
delineated-in-tipro-report.
“Inside QuikTrip: Find out Why It’s Always Ranked as One of the Best Places in U.S. to Work |
Business News | Tulsaworld.Com.” n.d. Accessed December 23, 2020.
https://tulsaworld.com/business/inside-quiktrip-find-out-why-its-always-ranked-as-one-
of-the-best-places-in/article_6c45c948-2007-5d48-8fe6-07eb6a2a0cf3.html.
“Inventory of U.S. Greenhouse Gas Emissions and Sinks | Greenhouse Gas (GHG) Emissions | US
EPA.” n.d. Accessed November 24, 2020. https://www.epa.gov/ghgemissions/inventory-
us-greenhouse-gas-emissions-and-sinks.
“Jeff Bezos.” n.d. Accessed December 13, 2020. https://www.forbes.com/profile/jeff-
bezos/?sh=53f6c2fb1b23.
104
“Jeff Bezos Announces First Winners of $10 Billion Climate-Change Pledge - CBS News.” n.d.
Accessed December 13, 2020. https://www.cbsnews.com/news/jeff-bezos-climate-
change-grant-first-round-announced/.
“Jeff Bezos Pledges $10 Billion To Fight Climate Change, Planet’s ’Biggest Threat’ : NPR.” n.d.
Accessed December 13, 2020. https://www.npr.org/2020/02/17/806720144/jeff-bezos-
pledges-10-billion-to-fight-climate-change-planets-biggest-threat.
“Kern County Supervisors Vote to End Massive Oil Refinery, ‘Bomb Trains’ Project in Central
Valley – YubaNet.” n.d. Accessed December 5, 2020.
https://yubanet.com/california/kern-county-supervisors-vote-to-end-massive-oil-
refinery-bomb-trains-project-in-central-valley/.
“LCFS Pathway Certified Carbon Intensities | California Air Resources Board.” n.d. Accessed
December 6, 2020. https://ww2.arb.ca.gov/resources/documents/lcfs-pathway-
certified-carbon-intensities.
“Lightsource BP Completes Financing on 260 MW Solar Project in Texas | News | Home.” n.d.
Accessed December 28, 2020. https://www.bp.com/en_us/united-
states/home/news/press-releases/lightsource-bp-completes-financing-on-260-mw-
solar-project-in-texas.html.
“Low Carbon Fuel Standard | California Air Resources Board.” n.d. Accessed November 21, 2020.
https://ww2.arb.ca.gov/our-work/programs/low-carbon-fuel-standard/about.
“Low Carbon Fuel Standard - Regulation .Pdf.” n.d.
https://ww3.arb.ca.gov/fuels/lcfs/fro_oal_approved_clean_unofficial_010919.pdf?_ga=
2.101529666.211008848.1593024354-1241321646.1592766097.
“Loyalty Programs Lead To More Foot Traffic For Gas Stations, Convenience Stores |.” n.d.
Accessed December 20, 2020. https://geomarketing.com/loyalty-programs-lead-to-
more-foot-traffic-for-gas-stations-convenience-stores.
“Major’s Divestment of Retail.” n.d. Accessed June 27, 2020.
http://www.nbcnews.com/id/25126563/ns/business-oil_and_energy/t/ExxonMobil-sell-
all-companys-gas-stations/.
105
“Make The Future - Striving for Sustainable Energy.” n.d. Accessed December 20, 2020.
https://www.makethefuture.shell/en-gb.
Marten, Ivan, and Jaime Ruiz-Cabrero. 2015. “The Impact of Low Oil Prices on Downstream Oil.”
BCG.Com. June 2, 2015. https://www.bcg.com/en-us/publications/2015/energy-
environment-two-sides-of-the-coin-the-impact-of-low-oil-prices-on-downstream-
oil.aspx.
“Microsoft Tests Hydrogen Fuel Cells for Backup Power at Datacenters | Innovation Stories.” n.d.
Accessed November 21, 2020. https://news.microsoft.com/innovation-stories/hydrogen-
datacenters/.
“Oil 101 - Petroleum Product Marketing - Downstream Oil & Gas.” n.d. Accessed June 27, 2020.
https://www.ektinteractive.com/marketing/marketing-fundamentals/.
“Oil Drilling & Gas Extraction in the US.” n.d. https://my-ibisworld-
com.libproxy.mit.edu/us/en/industry/21111/major-companies#other-companies.
Oller, Samantha. 2019. “Fuels 50 2019: Top 10 Gas Brands by Market Share.” April 4, 2019.
https://www.cspdailynews.com/fuels/fuels-50-2019-top-10-gas-brands-market-share.
“Our Strategy | Shell Global.” n.d. Accessed December 20, 2020.
https://www.shell.com/investors/shell-and-our-strategy/our-strategy.html.
“Providing Techron Gasoline & Diesel Fuel - Chevron With Techron.” n.d. Accessed November 22,
2020.
https://www.chevronwithtechron.com/fuels?&gclid=Cj0KCQiAwMP9BRCzARIsAPWTJ_F
Vn7FfJJOE33oocO8FTyNy-7cSN9lDqJWUHVKCoKGd8BbgjFwIpPkaAr9PEALw_wcB.
“Refinery Sales During 2007.” n.d. EIA. Accessed December 4, 2020.
https://www.eia.gov/petroleum/refinerycapacity/archive/2008/table14.pdf.
“Refinery Sales During 2013.” n.d. EIA. Accessed December 4, 2020.
https://www.eia.gov/petroleum/refinerycapacity/archive/2014/table12.pdf.
“Refinery Sales During 2016.” n.d. EIA. Accessed December 4, 2020.
https://www.eia.gov/petroleum/refinerycapacity/archive/2017/table12.pdf.
“Refining Capacity - US 2018.” n.d. Accessed December 23, 2020.
https://www.eia.gov/petroleum/refinerycapacity/archive/2019/table5.pdf.
106
“Refining Capacity - US 2019.” n.d. Accessed December 23, 2020.
https://www.eia.gov/petroleum/refinerycapacity/table5.pdf.
“RINs 101: The Basics of Renewable Identification Numbers – Growth Energy.” n.d. Accessed
December 23, 2020. https://growthenergy.org/2018/07/24/rins-101-the-basics-of-
renewable-identification-numbers/.
Rodriguez, Arnez. 2020. “Petroleum Refining in the US.” IBISWorld.com. https://my-ibisworld-
com.libproxy.mit.edu/download/us/en/industry/449/1/0/pdf.
Schnepf, Randy, and Brent D Yacobucci. n.d. “Renewable Fuel Standard (RFS): Overview and
Issues,” 35.
“Secretive Energy Startup Backed by Bill Gates Achieves Solar Breakthrough - CNN.” n.d. Accessed
December 13, 2020. https://www.cnn.com/2019/11/19/business/heliogen-solar-energy-
bill-gates/index.html.
“Selling America’s Fuel | NACS.” n.d. Accessed November 28, 2020.
https://www.convenience.org/Topics/Fuels/Who-Sells-Americas-Fuel.
“Shell Aims to Beat Power Utilities at Their Own Game | Reuters.” n.d. Accessed December 20,
2020. https://www.reuters.com/article/us-shell-power-analysis/shell-aims-to-beat-
power-utilities-at-their-own-game-idUSKCN1TK1N7.
“Shell Buys NewMotion Charging Network in First Electric Vehicle Deal | Reuters.” n.d. Accessed
December 28, 2020. https://www.reuters.com/article/us-newmotion-m-a-shell/shell-
buys-newmotion-charging-network-in-first-electric-vehicle-deal-idUSKBN1CH1QV.
“Shell Enlists A-List Celebrity Cast to #makethefuture | Greenbiz.” n.d. Accessed December 20,
2020. https://www.greenbiz.com/article/shell-enlists-list-celebrity-cast-makethefuture.
“Shell Finalizes Sale of Martinez Refinery | Oil & Gas Journal.” n.d. Accessed December 5, 2020.
https://www.ogj.com/refining-processing/article/14092900/shell-finalizes-sale-of-
martinez-refinery.
“Shell Global | Shell Global.” n.d. Accessed November 22, 2020. https://www.shell.com/.
“Shell in Motorsport | Shell Global.” n.d. Accessed December 20, 2020.
https://www.shell.com/motorist/shell-motorsport.html.

107
“Shell to Expand California Hydrogen Refuelling Infrastructure | Shell United States.” n.d.
Accessed December 28, 2020. https://www.shell.us/media/2020-media-releases/shell-
to-expand-california-hydrogen-refueling-infrastructure.html.
“Shell, Toyota and Honda Plan Expansion of Hydrogen Refueling Network in California | Shell
United States.” n.d. Accessed December 28, 2020. https://www.shell.us/media/2020-
media-releases/shell--toyota-and-honda-plan-expansion-of-hydrogen-refueling-
net.html.
“Shell V-Power NiTRO+ Premium Gasoline | Shell United States.” n.d. Accessed November 22,
2020. https://www.shell.us/motorist/shell-fuels/shell-v-power-nitro-plus-premium-
gasoline.html?gclid=Cj0KCQiAwMP9BRCzARIsAPWTJ_EWXsPfUAsXJ-
QxyDg7JQ5QbuTEJostipiXiXB0_Z6Rl4IgORGmTO0aAsI9EALw_wcB&gclsrc=aw.ds.
“Shell-Motiva Deal Divides Up Downstream.” n.d. Accessed December 19, 2020.
https://www.cspdailynews.com/mergers-acquisitions/shell-motiva-deal-divides-
downstream.
“Shell’s Consolidation Strengthens World’s Most Valuable Oil & Gas | Press Release | Brand
Finance.” n.d. Accessed December 20, 2020. https://brandfinance.com/press-
releases/shells-consolidation-strengthens-worlds-most-valuable-oil-and-gas.
“SIC 5541 Gasoline Service Stations - Description, Market Prospects, Industry History.” n.d.
Accessed December 23, 2020. https://www.referenceforbusiness.com/industries/Retail-
Trade/Gasoline-Service-Stations.html.
Stacey, Kiran, and Ed Crooks. n.d. “Oil Majors Find Virtue in Integration.” Accessed December 3,
2020. https://www.ft.com/content/8ff8ec62-2dcc-11e6-a18d-a96ab29e3c95.
“Study: Top Tier Gasoline Worth the Extra Price - Consumer Reports.” n.d. Accessed November
22, 2020. https://www.consumerreports.org/car-maintenance/study-shows-top-tier-
gasoline-worth-extra-price/.
“Super-Charging the Drive to Electric | News and Insights | Home.” n.d. Accessed December 28,
2020. https://www.bp.com/en/global/corporate/news-and-insights/reimagining-
energy/world-ev-day.html.
108
“Tesla Gigafactory | Tesla.” n.d. Accessed December 13, 2020.
https://www.tesla.com/gigafactory.
“Tesoro Buys Shell, USA Petrol Assets in California - MarketWatch.” n.d. Accessed December 19,
2020. https://www.marketwatch.com/story/tesoro-buys-shell-calif-refinery-other-asets-
in-16b-deal.
“The Fuel You Use For Heating Depends on Where You Live | Climate Central.” n.d. Accessed
December 26, 2020. https://www.climatecentral.org/news/your-heating-fuel-depends-
on-where-you-live-18084.
“The Low Carbon Fuel Standard Has Succeeded, but How Does It Work? - GHG and Carbon
Accounting, Auditing, Management & Training | Greenhouse Gas Management Institute.”
n.d. Accessed December 23, 2020. https://ghginstitute.org/2020/01/22/the-low-carbon-
fuel-standard-has-succeeded-but-how-does-it-work/.
“The Oil Giant That Was ‘Forced to Shrink to Greatness’ - The Washington Post.” n.d. Accessed
November 23, 2020. https://www.washingtonpost.com/business/economy/the-oil-
giant-that-was-forced-to-shrink-to-greatness/2018/07/13/1be775e0-8159-11e8-b9a5-
7e1c013f8c33_story.html.
“The Permian Basin’s Largest Land Holders.” n.d. Accessed December 23, 2020.
https://fingfx.thomsonreuters.com/gfx/editorcharts/CHEVRON-
PERMIAN/0H001QX8M8KV/index.html.
“The Reviews Are in: Wawa Has the Cleanest Gas Station Restrooms in Pennsylvania, New Jersey
and Del. – NBC10 Philadelphia.” n.d. Accessed December 21, 2020.
https://www.nbcphiladelphia.com/news/local/wawa-restroom-cleanliness-
gasbuddy/173112/.
“The Shell | Fuel Rewards® Credit Cards.” n.d. Accessed December 20, 2020.
https://citicards.citi.com/usc/rpg/landing/default.htm?lp=shellFRdual&plsrc=FS03&cmp
=A~F~1~B~3~A~ZZZ1~CL~SH~ZZ&BT_TX=1&ProspectID=5978D6EDFD8C455D8BA69B0E
C466BCF9?cid=affiliate:shell:fuel-rewards-motorist-banner:fuel-rewards.
“The Truth about Gasoline: Does the Brand You Buy Really Make a Difference? - South Florida
Sun Sentinel - South Florida Sun-Sentinel.” n.d. Accessed December 23, 2020.
109
https://www.sun-sentinel.com/business/fl-bz-are-all-gasoline-brands-created-equal-
20180914-story.html.
“The United States as a Global Oil Supplier.” n.d. Accessed June 27, 2020.
https://www.csis.org/features/us-oil-global-economy.
“The United States Was Energy Independent in 2019 for the First Time Since 1957 - IER.” n.d.
Accessed December 3, 2020. https://www.instituteforenergyresearch.org/fossil-
fuels/gas-and-oil/the-united-states-was-energy-independent-in-2019-for-the-first-time-
since-1957/.
“The US Is about to Send a Lot More Oil into an Oversupplied Market.” n.d. Accessed December
3, 2020. https://www.cnbc.com/2019/08/27/the-us-is-about-to-send-a-lot-more-oil-
into-an-oversupplied-market.html.
“There Are More Than 6,500 Fuel Cell Vehicles On the Road in the U.S. | Department of Energy.”
n.d. Accessed November 28, 2020. https://www.energy.gov/eere/fuelcells/fact-month-
march-2019-there-are-more-6500-fuel-cell-vehicles-road-us.
“These Giant Oil Companies Are Providing EV Chargers Next to Their Gas Pumps.” n.d. Accessed
December 28, 2020. https://www.goodnewsnetwork.org/giant-oil-companies-install-ev-
chargers-at-gas-stations/.
“Transportation Fuels - Energy Density.Pdf.” n.d.
http://www.need.org/Files/curriculum/guides/Transportation%20Fuels%20Infobook%2
0web.pdf.
Tuttle, Robert. 2020. “Massive Refiners Are Turning into Biofuel Plants in the West.” August 12,
2020. https://www.bloomberg.com/tosv2.html?vid=&uuid=f53e8080-371f-11eb-b7c2-
e16163d649b3&url=L25ld3MvYXJ0aWNsZXMvMjAyMC0wOC0xMi9waGlsbGlwcy02Ni1p
cy1sYXRlc3QtcmVmaW5lci10by1zaHVuLWNydWRlLW9pbC1pbi1mYXZvci1vZi1mYXQ=.
“Twitter - BP.” n.d. Accessed November 22, 2020. https://twitter.com/bp_plc.
“Twitter - Shell.” n.d. Accessed November 22, 2020. https://twitter.com/Shell.
“Understanding Shale’s Success Factors | Deloitte Insights.” n.d. Accessed December 3, 2020.
https://www2.deloitte.com/us/en/insights/industry/oil-and-gas/us-shale-revolution-
playbook/introduction-shale-performance-productivity.html.
110
“U.S. Field Production of Crude Oil.” n.d.
https://www.eia.gov/dnav/pet/hist/LeafHandler.ashx?n=PET&s=MCRFPUS2&f=A.
“U.S. Public Views on Climate and Energy | Pew Research Center.” n.d. Accessed January 6, 2021.
https://www.pewresearch.org/science/2019/11/25/u-s-public-views-on-climate-and-
energy/.
“Us-2020-Global-Automotive-Consumer-Study-Global-Focus-Countries.Pdf.” n.d.
Vamburkar, Meenal, and Jim Polson. n.d. “Energy Companies Shedding Gas Stations |
IndustryWeek.” Industryweek.Com. Accessed June 29, 2020.
https://www.industryweek.com/finance/article/22009104/energy-companies-shedding-
gas-stations.
“Washington Should Pass Clean-Fuel Standard like Oregon, California | The Seattle Times.” n.d.
Accessed December 23, 2020. https://www.seattletimes.com/opinion/washington-
should-pass-clean-fuel-standard-like-oregon-california/.
“Wawa - Home | Facebook.” n.d. Accessed December 20, 2020.
https://www.facebook.com/wawa.
“Wawa Gas Station: Quality Fuel, Honest Pricing, Convenience | Wawa.” n.d. Accessed December
20, 2020. https://www.wawa.com/wawacreditcard.
“Wawa Has the Best Sandwiches in America - Business Insider.” n.d. Accessed December 20,
2020. https://www.businessinsider.com/wawa-best-sandwiches-in-america-2018-5.
“Wawa Rewards.” n.d. Accessed December 21, 2020. https://www.wawarewards.com/.
“Ways to Pay | Shell United States.” n.d. Accessed December 20, 2020.
https://www.shell.us/motorist/ways-to-pay.html.
“What Is Top Tier Gas?” n.d. Accessed December 21, 2020.
https://www.autolist.com/guides/top-tier-gas.
“Why Aren’t Natural Gas Cars More Popular in America? | Energy Central.” n.d. Accessed
November 21, 2020. https://energycentral.com/c/gn/why-aren%E2%80%99t-natural-
gas-cars-more-popular-america.
111
“Why Don’t We Just Run Internal Combustion Engines on Hydrogen?” n.d. Accessed November
21, 2020. https://www.roadandtrack.com/new-cars/car-technology/a25712588/why-
dont-we-burn-hydrogen-instead-of-gasoline/.
“Why Teslas Still Go so Much Further than Other Electric Cars - The Washington Post.” n.d.
Accessed December 13, 2020.
https://www.washingtonpost.com/technology/2020/01/10/tesla-battery-range/.
“Wind Energy Sites | Where We Operate | Home.” n.d. Accessed December 28, 2020.
https://www.bp.com/en_us/united-states/home/where-we-operate/wind-energy-
sites.html.
“Wind Power | Shell Global.” n.d. Accessed December 28, 2020. https://www.shell.com/energy-
and-innovation/new-energies/wind.html.


![Interactive Public Ambient Displays: Transitioning from ...ravin/papers/uist2004_ambient.pdf · emphasis on evaluating non-pixel ambient displays. Kimura [15] is an augmented office](https://img.pdfslide.us/doc/110x75/5fb6eb298b876d489c389069/interactive-public-ambient-displays-transitioning-from-ravinpapersuist2004ambientpdf.jpg)