Embed Size (px)
Citation preview
Systems AnalysisRequirements structuring Process Modeling
Representing the system with data flow diagrams
Logic Modeling Represents the logic of the DFD’s processes
Data Modeling Represents the contents and structure of the
DFD’s data flows and stores
Process Modeling
Graphically represent the processes that capture, manipulate, store and distribute data between a system and its environment and among system componentsData flow diagrams (DFD) Graphically illustrate movement of data
between external entities and the processes and data stores within a system
Process Modeling
Modeling a system’s process Utilize information gathered during
requirements determination Structure of the data is also modeled in
addition to the processes
Deliverables and Outcomes Set of coherent, interrelated data flow
diagrams
Deliverables and outcomes
Context data flow diagram (DFD) Scope of system
DFDs of current system Enables analysts to understand current system
DFDs of new logical system Technology independent Show data flows, structure and functional
requirements of new system
Project dictionary and CASE repository
Data Flow Diagram Symbols
Data Flow
Data Store
Process
Source/Sink
DFD Mechanics
Data Flow Depicts data that are in motion and moving
as a unit from one place to another in the system.
Drawn as an arrow Select a meaningful name to represent the
data
DFD Mechanics
Data Store Depicts data at rest May represent data in
File folder Computer-based file Notebook
Drawn as two horizontal parallel lines The name of the store as well as the
number are recorded in between lines
DFD Mechanics
Process Depicts work or action performed on data
so that they are transformed, stored or distributed
Drawn as a circle Number of process as well as name are
recorded
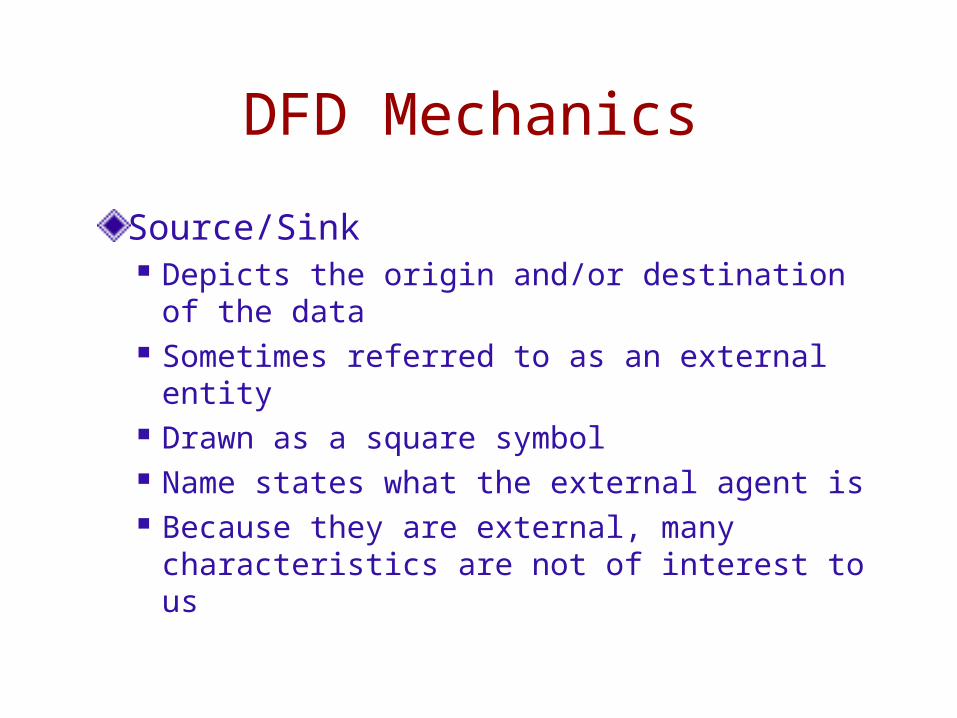
DFD Mechanics
Source/Sink Depicts the origin and/or destination of the
data Sometimes referred to as an external entity Drawn as a square symbol Name states what the external agent is Because they are external, many
characteristics are not of interest to us
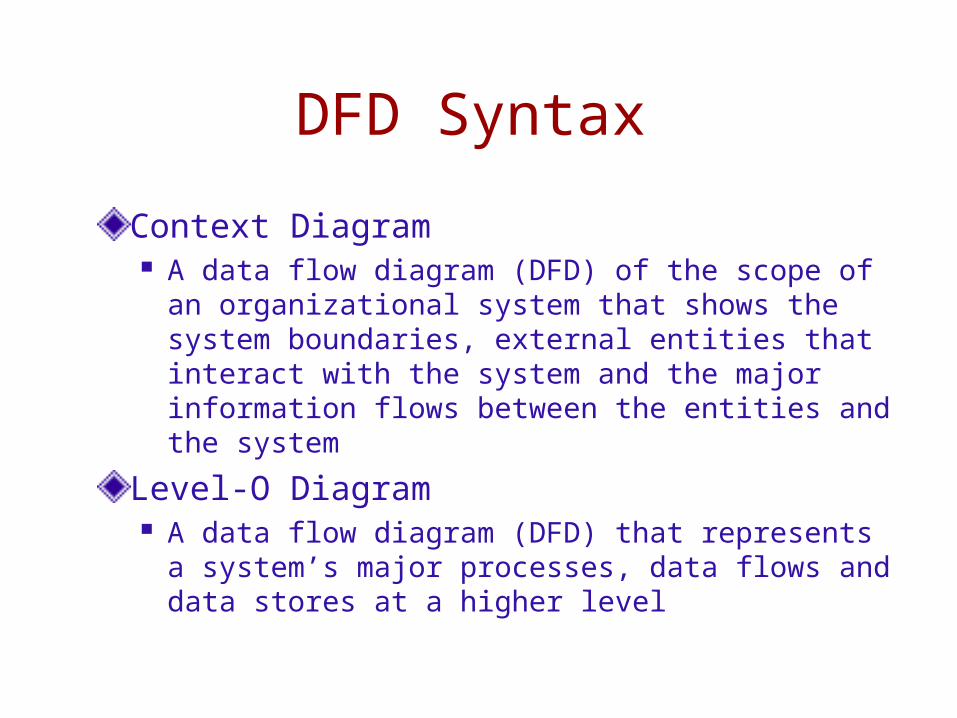
DFD Syntax
Context Diagram A data flow diagram (DFD) of the scope of an
organizational system that shows the system boundaries, external entities that interact with the system and the major information flows between the entities and the system
Level-O Diagram A data flow diagram (DFD) that represents a
system’s major processes, data flows and data stores at a higher level
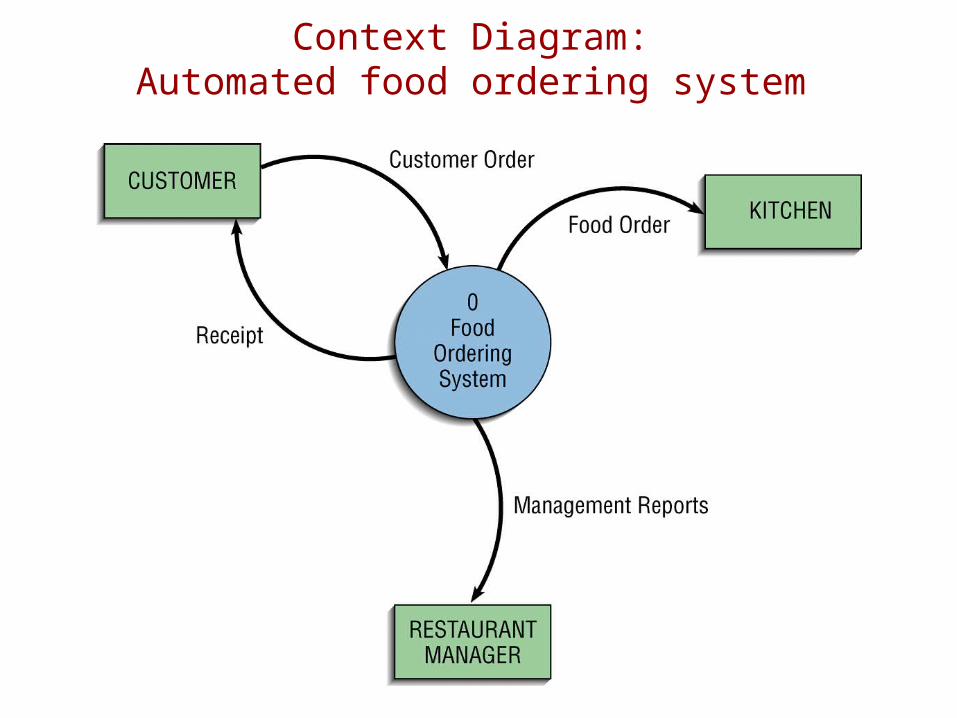
Context Diagram:Automated food ordering system
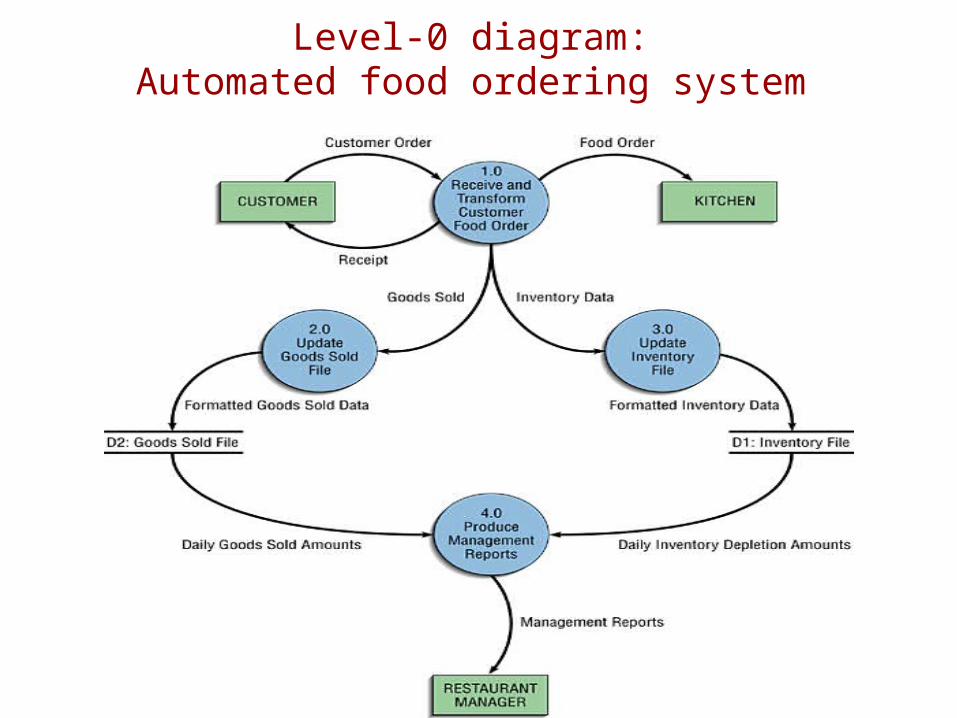
Level-0 diagram:Automated food ordering system
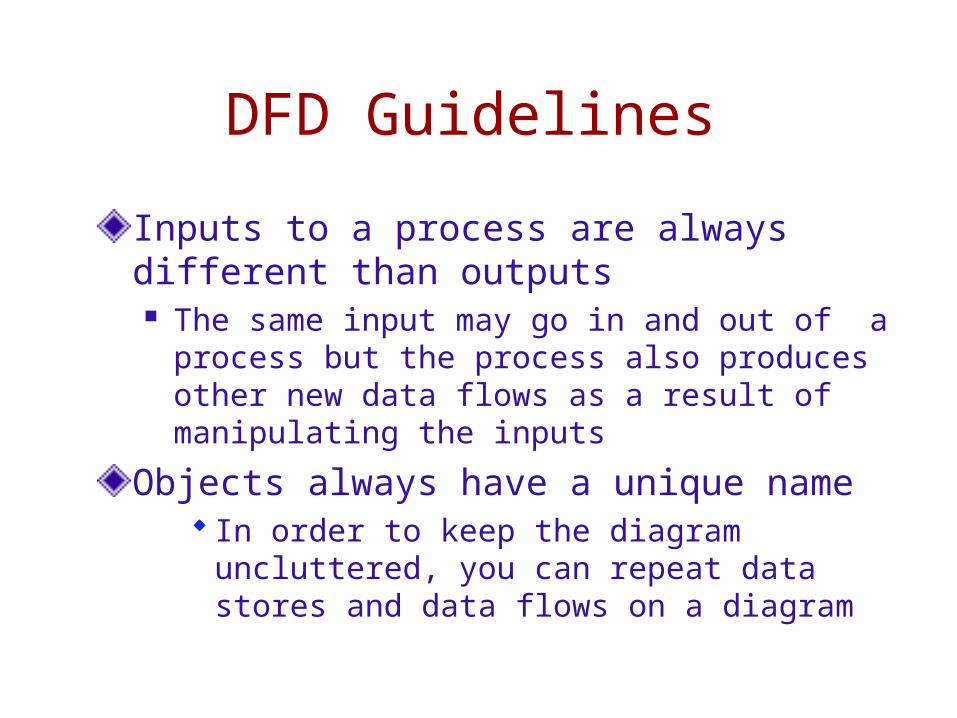
DFD Guidelines
Inputs to a process are always different than outputs The same input may go in and out of a process
but the process also produces other new data flows as a result of manipulating the inputs
Objects always have a unique name In order to keep the diagram uncluttered, you
can repeat data stores and data flows on a diagram
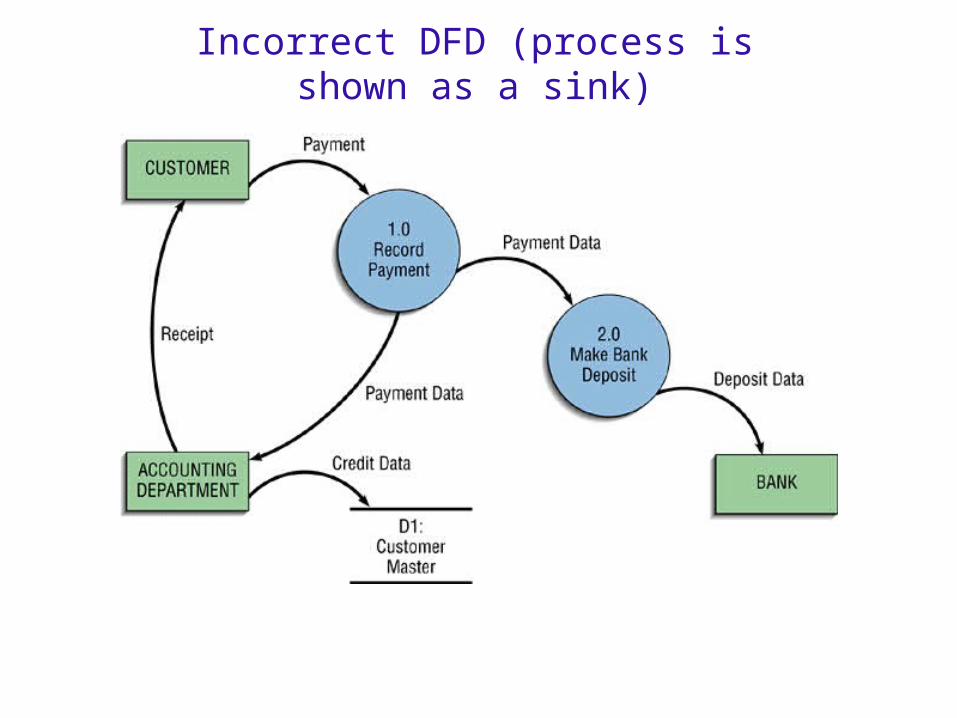
Incorrect DFD (process is shown as a sink)
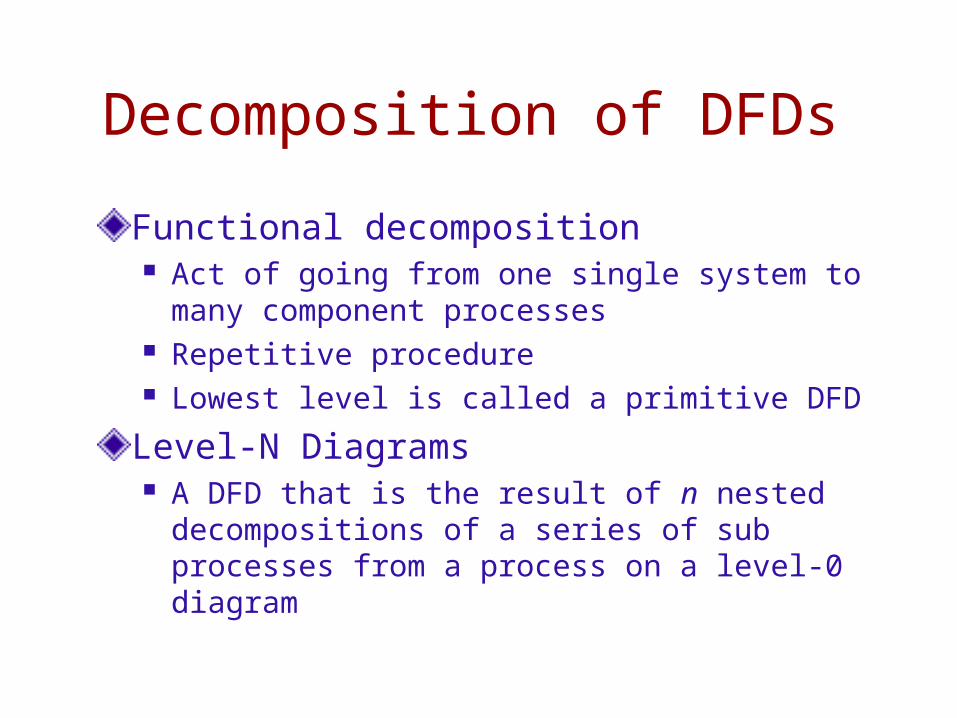
Decomposition of DFDs
Functional decomposition Act of going from one single system to many
component processes Repetitive procedure Lowest level is called a primitive DFD
Level-N Diagrams A DFD that is the result of n nested
decompositions of a series of sub processes from a process on a level-0 diagram
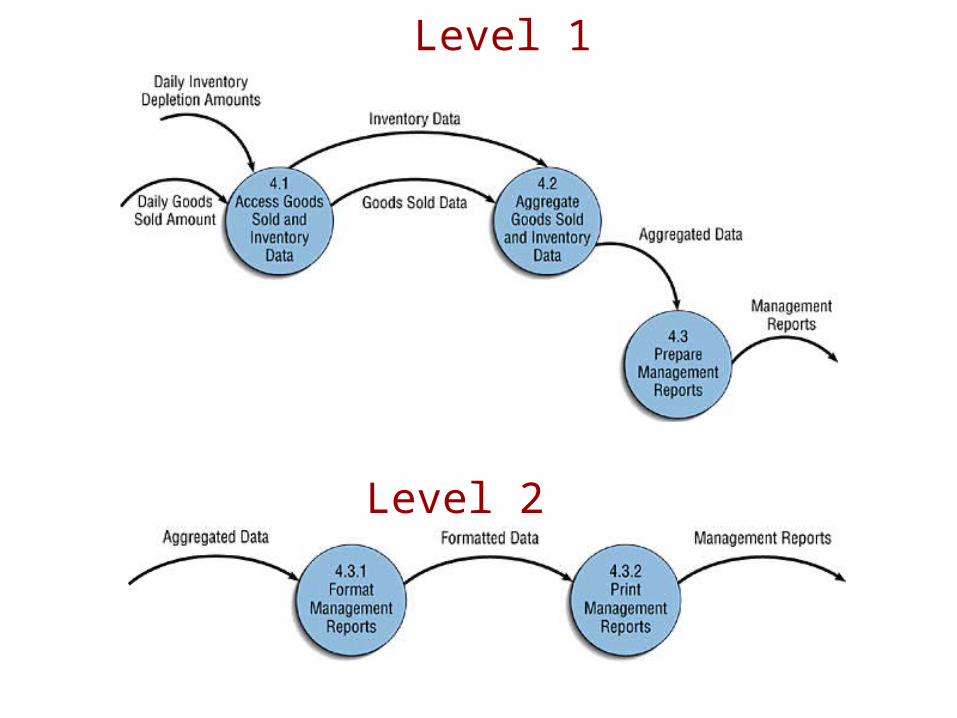
Level 1
Level 2
Balancing DFDs
When decomposing a DFD, you must conserve inputs to and outputs from a process at the next level of decomposition
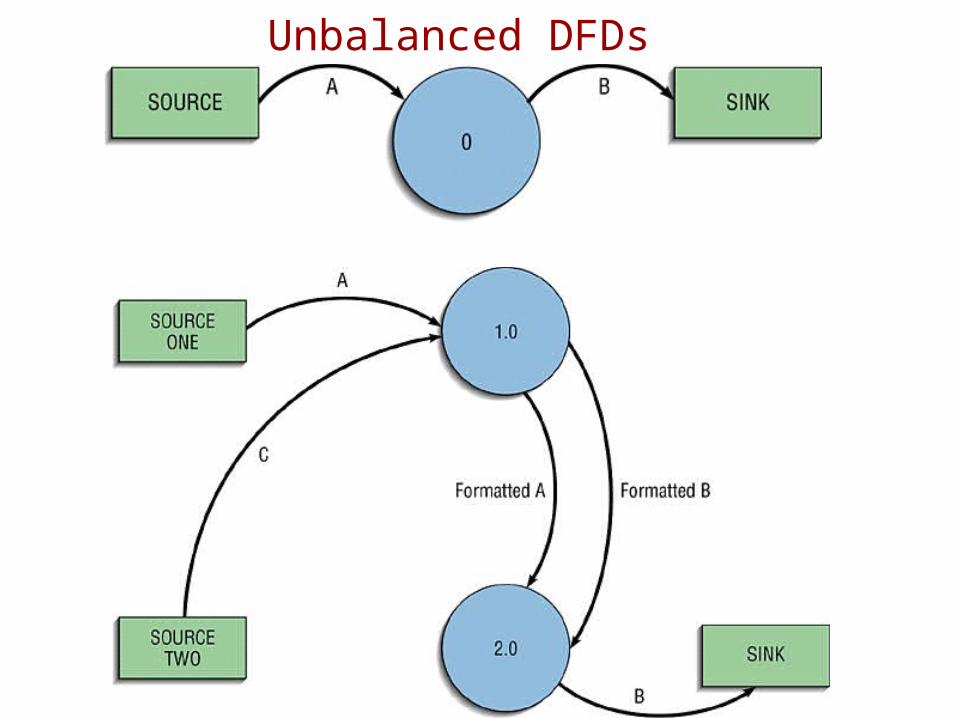
Unbalanced DFDs
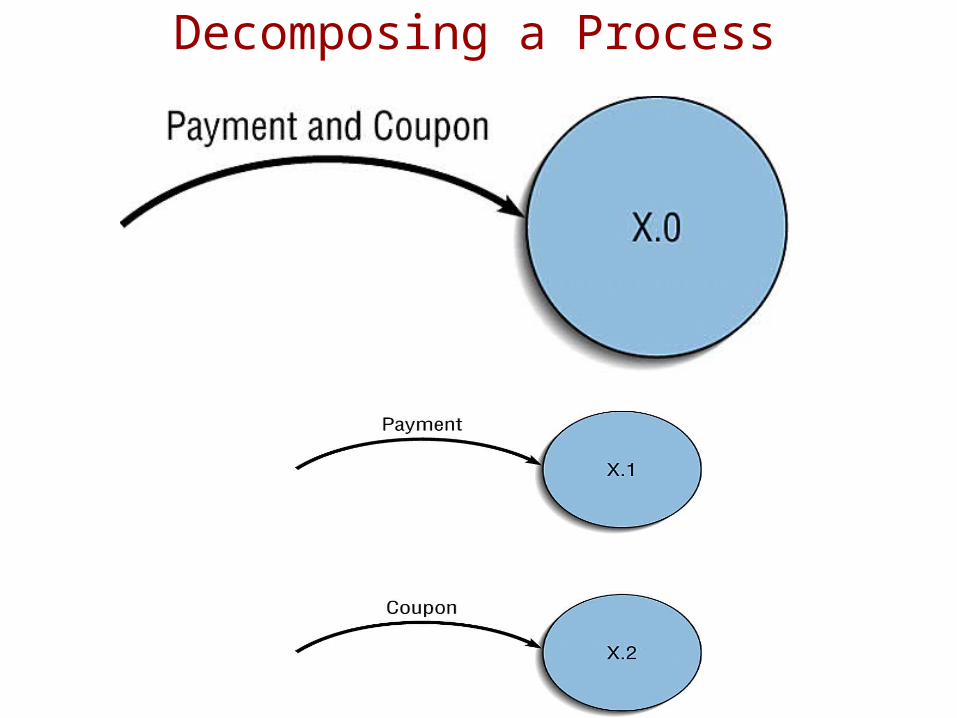
Decomposing a Process
Use Case
A set of activities the system performs to produce some output result.
Describe the tasks in the process
Identify the triggers for each task
List all inputs and outputs
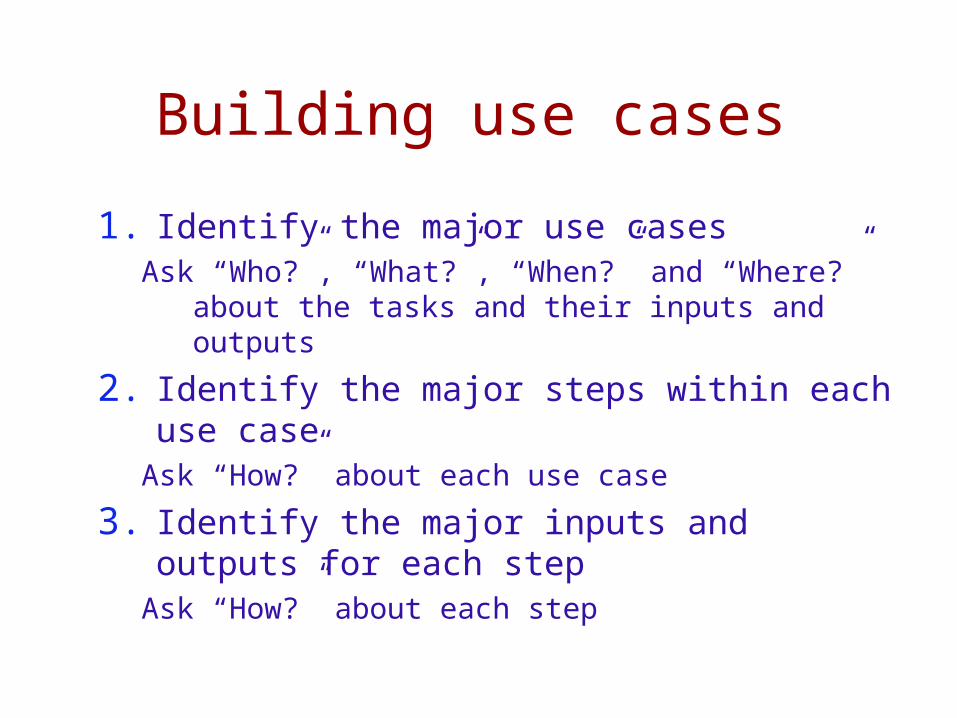
Building use cases
1. Identify the major use casesAsk “Who?”, “What?”, “When?” and “Where?” about
the tasks and their inputs and outputs
2. Identify the major steps within each use case
Ask “How?” about each use case
3. Identify the major inputs and outputs for each step
Ask “How?” about each step
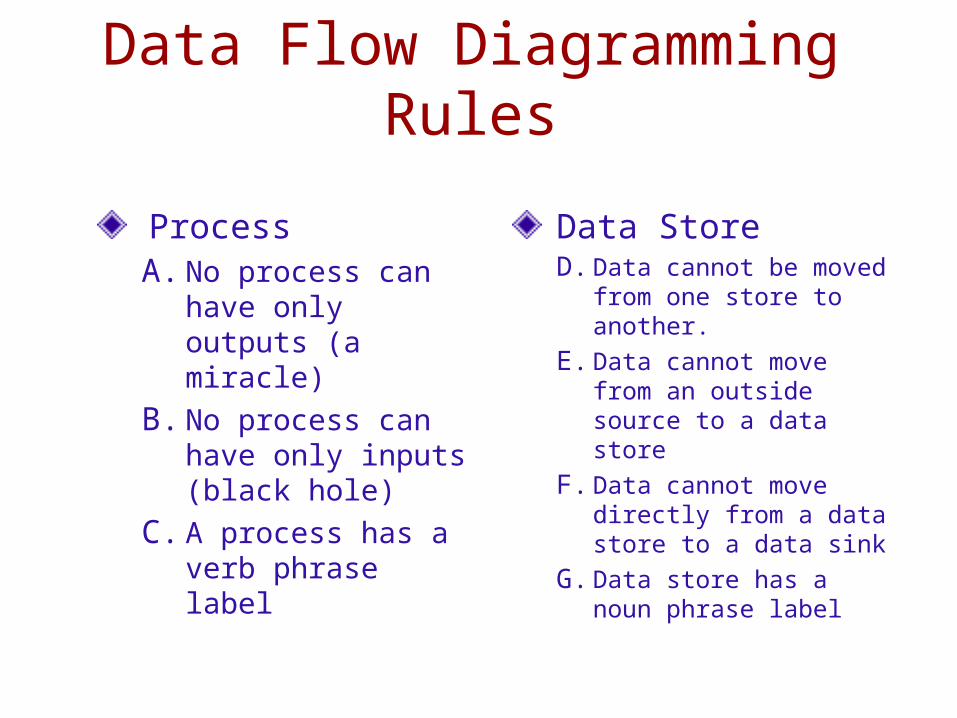
Data Flow Diagramming Rules
ProcessA. No process can
have only outputs (a miracle)
B. No process can have only inputs (black hole)
C. A process has a verb phrase label
Data StoreD. Data cannot be moved
from one store to another.
E. Data cannot move from an outside source to a data store
F. Data cannot move directly from a data store to a data sink
G. Data store has a noun phrase label
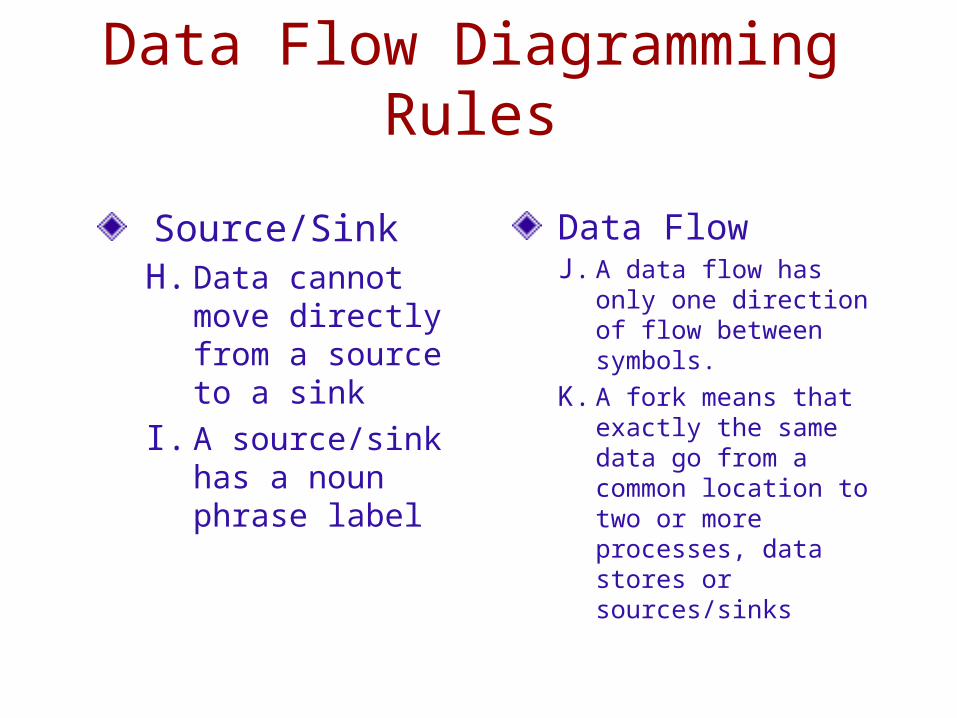
Data Flow Diagramming Rules
Source/SinkH. Data cannot move
directly from a source to a sink
I. A source/sink has a noun phrase label
Data FlowJ. A data flow has only one
direction of flow between symbols.
K. A fork means that exactly the same data go from a common location to two or more processes, data stores or sources/sinks
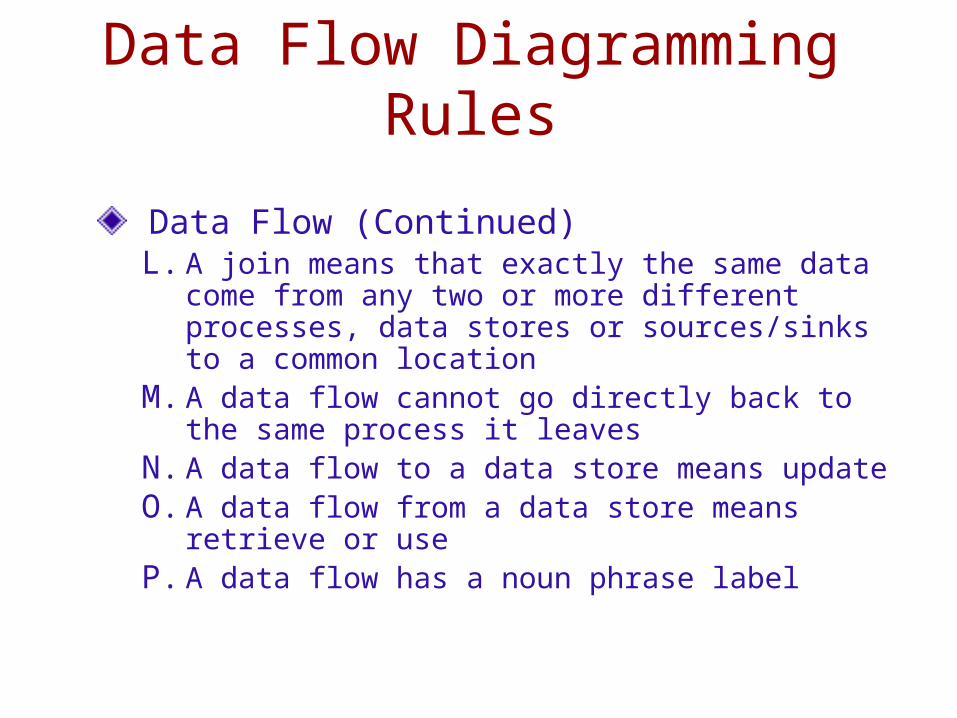
Data Flow Diagramming Rules
Data Flow (Continued)L. A join means that exactly the same data come
from any two or more different processes, data stores or sources/sinks to a common location
M. A data flow cannot go directly back to the same process it leaves
N. A data flow to a data store means updateO. A data flow from a data store means retrieve or
useP. A data flow has a noun phrase label
Advanced DFD Rules: Balancing
Composite data flow can be spilt into components data flows at the next levelInputs to a process must be sufficient to produce the outputAt the lowest level, new data flows may be addedTo avoid having data flow lines cross each other, can repeat data stores or sources/sinks on a DFD
Types of DFDsCurrent physical Process labels include the users and technology involved Data flows and stores are labeled with the name of the actual
physical media
Current logical Physical aspects of the system are removed
New logical Additional functions Obsolete functions removed Inefficient flows re-organized
New physical Defer until several alternative solutions have been considered.
Conservation of Data
Data stays at rest until moved by a process
Processes cannot consume or create data Black hole error (no output) Miracle error (no input)
Guidelines for Drawing DFDs
1. Completeness DFD must include all components
necessary for system Each component must be fully described
in the project dictionary or CASE repository
Guidelines for Drawing DFDs
2. Consistency The extent to which information contained
on one level of a set of nested DFDs is also included on other levels
3. Timing Time is not represented well on DFDs Best to draw DFDs as if the system has
never started and will never stop.
Guidelines for Drawing DFDs
4. Iterative Development Analyst should expect to redraw diagram
several times before reaching the closest approximation to the system being modeled
5. Primitive DFDs Lowest logical level of decomposition Decision has to be made when to stop
decomposition
When to Stop
Rules for stopping decomposition When each process has been reduced to a
single decision, calculation or database operation
When each data store represents data about a single entity
When the system user does not care to see any more detail
When to Stop (continued)
When every data flow does not need to be split further to show that data are handled in various ways
When you believe that you have shown each business form or transaction, on-line display and report as a single data flow
When you believe that there is a separate process for each choice on all lowest-level menu options
Final DFD Notes
when to show a direct data flow between processes and when to decouple these with a data store
what activities to encompass with each process
how to distinguish processes from sinks and sources
Using DFDs as Analysis Tools
Gap Analysis The process of discovering discrepancies
between two or more sets of data flow diagrams or discrepancies within a single DFD
Inefficiencies in a system can often be identified through DFDs
Using DFDs in Business Process Reengineering
Characteristics of a DFD that imply areas for improvement:
Processes that simply collect and pass on information (rather than transforming data)
Collecting the same information into several processes
Placing untransformed data into data stores (causing unknown delays in processing this data)
Cycles or loops that have no apparent termination
Logic Modeling
Data flow diagrams do not show the logic inside the processesLogic modeling involves representing internal structure and functionality of processes depicted on a DFDMethods Structured English Decision Tables & Trees
Modeling Logic with Structured English
Modified form of English used to specify the logic of information processes
Uses a subset of English Action verbs Noun phrases No adjectives or adverbs
No specific standards
Modeling Logic with Structured English
Similar to programming language Sequence statements Conditional statements (choice) Iterative statements (repetition)
Modeling Logic with Decision Tables
A matrix representation of the logic of a decision
Specifies the possible conditions and the resulting actions
Best used for complicated decision logic
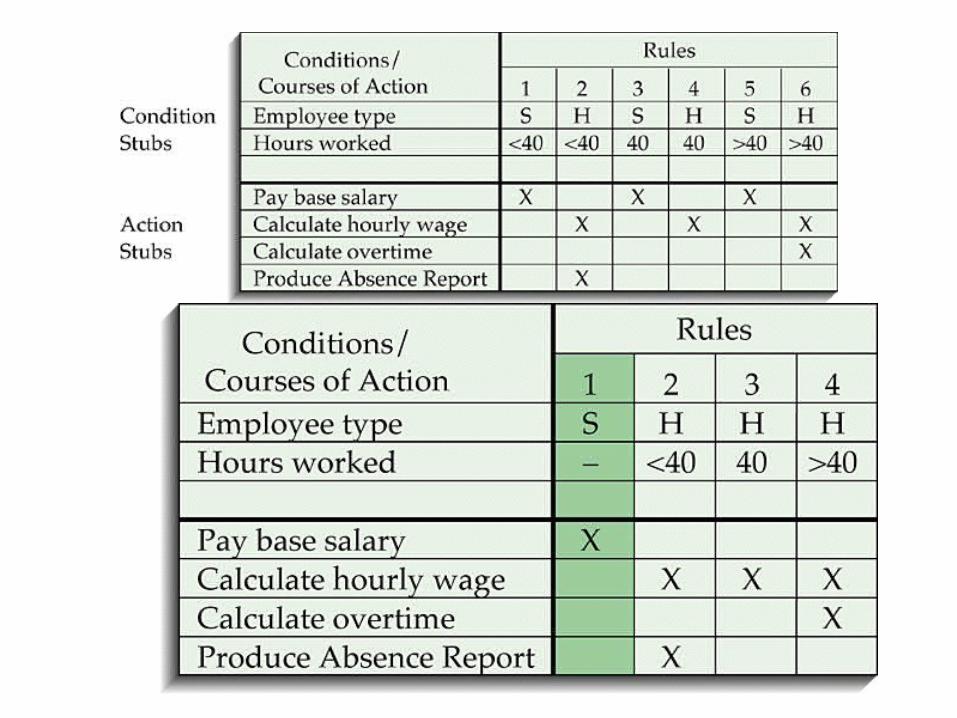
Modeling Logic withDecision Tables
Consists of three parts Condition stubs
Lists condition relevant to decision Action stubs
Actions that result for a given set of conditions Rules
Specify which actions are to be followed for a given set of conditions
Modeling Logic with Decision Tables
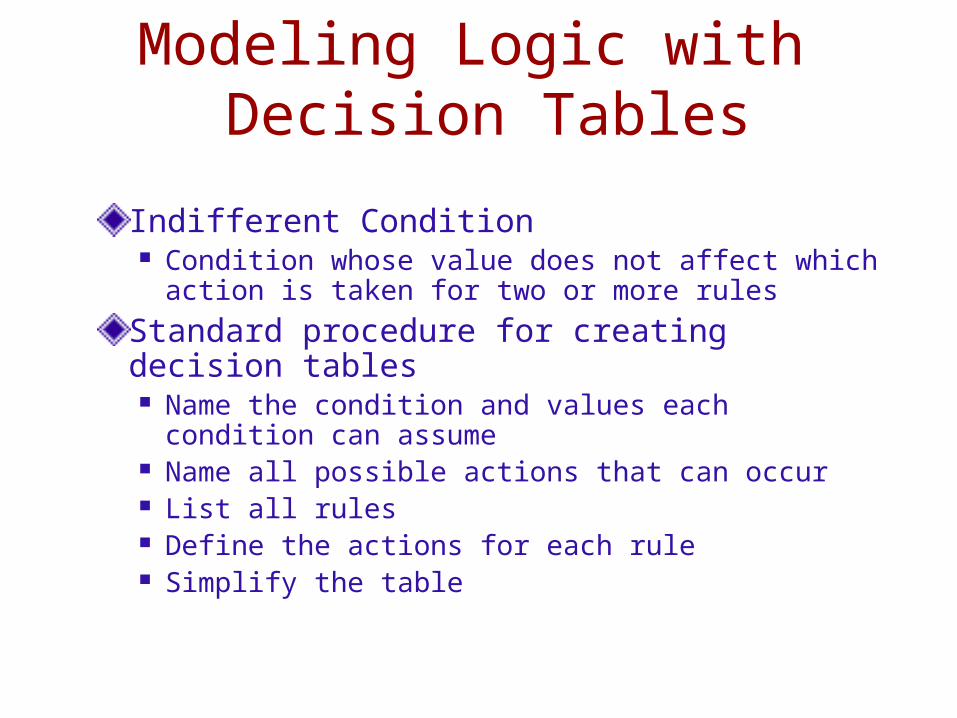
Indifferent Condition Condition whose value does not affect which action
is taken for two or more rules
Standard procedure for creating decision tables Name the condition and values each condition can
assume Name all possible actions that can occur List all rules Define the actions for each rule Simplify the table
Decision trees
Depicts a decision as a connected series of nodes and actions
Each node is a decision point with at least two branches
Branches are the available options for each node
Endpoints are the actions
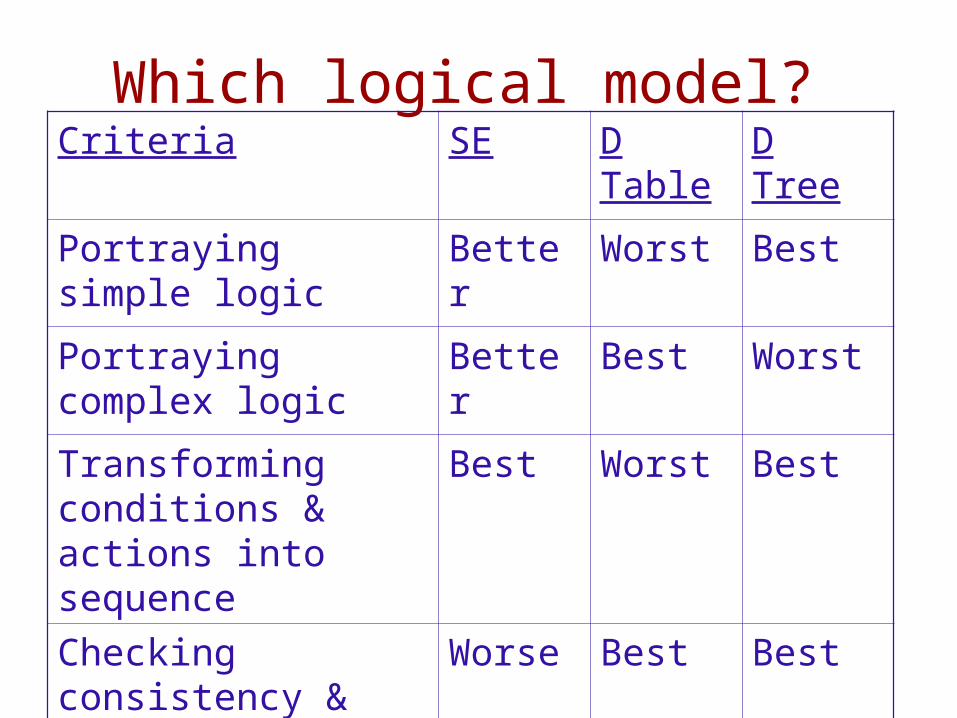
Which logical model?Criteria SE D Table D Tree
Portraying simple logic
Better Worst Best
Portraying complex logic
Better Best Worst
Transforming conditions & actions into sequence
Best Worst Best
Checking consistency & completeness
Worse Best Best