Embed Size (px)
Citation preview
Systemic Anti Cancer Therapy
(SACT)
Haematology SSCRG
Kellie Peters & Michael Wallington
National Disease Registration, CKO

What is Currently Available and How do I gain access?
Nationally
Area Team
Hospital
Coverage Map
Numbers in Treatment
Top Regimens
Data Completeness
Benchmarking
Post Chemo Mortality
Data Completeness
Top Regimens
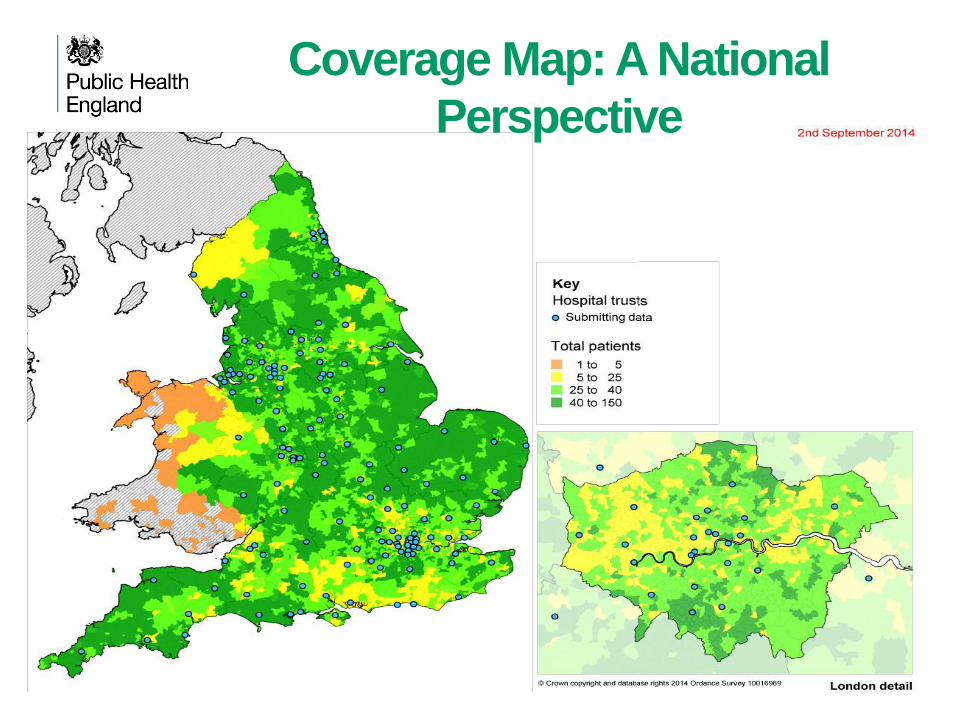
Coverage Map: A National
Perspective
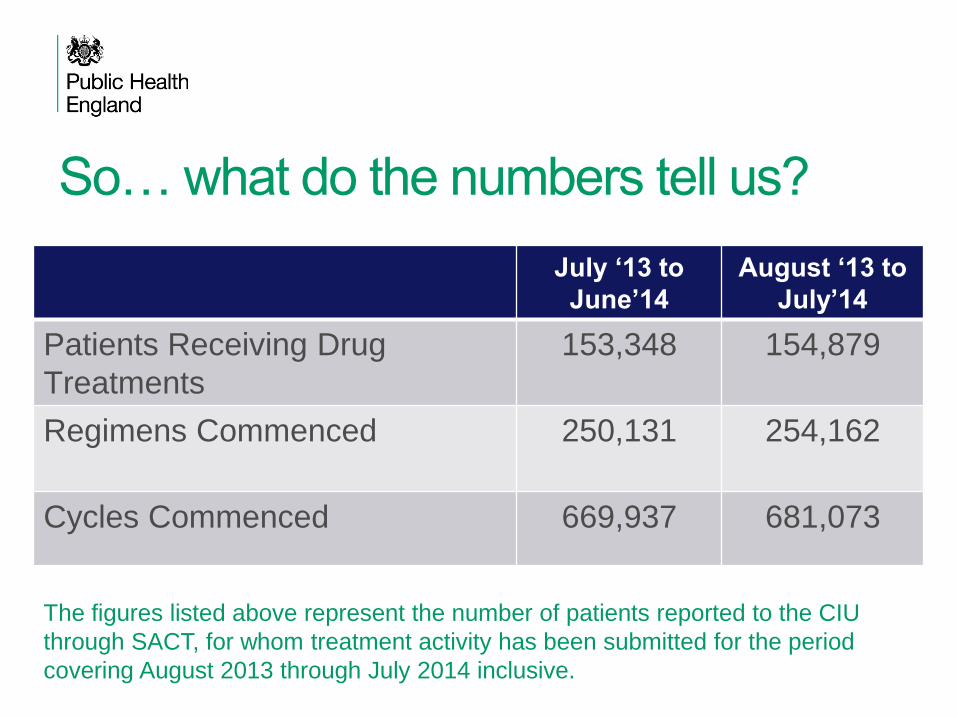
So… what do the numbers tell us?
July ‘13 to
June’14
August ‘13 to
July’14
Patients Receiving Drug
Treatments
153,348
154,879
Regimens Commenced 250,131 254,162
Cycles Commenced 669,937 681,073
The figures listed above represent the number of patients reported to the CIU
through SACT, for whom treatment activity has been submitted for the period
covering August 2013 through July 2014 inclusive.
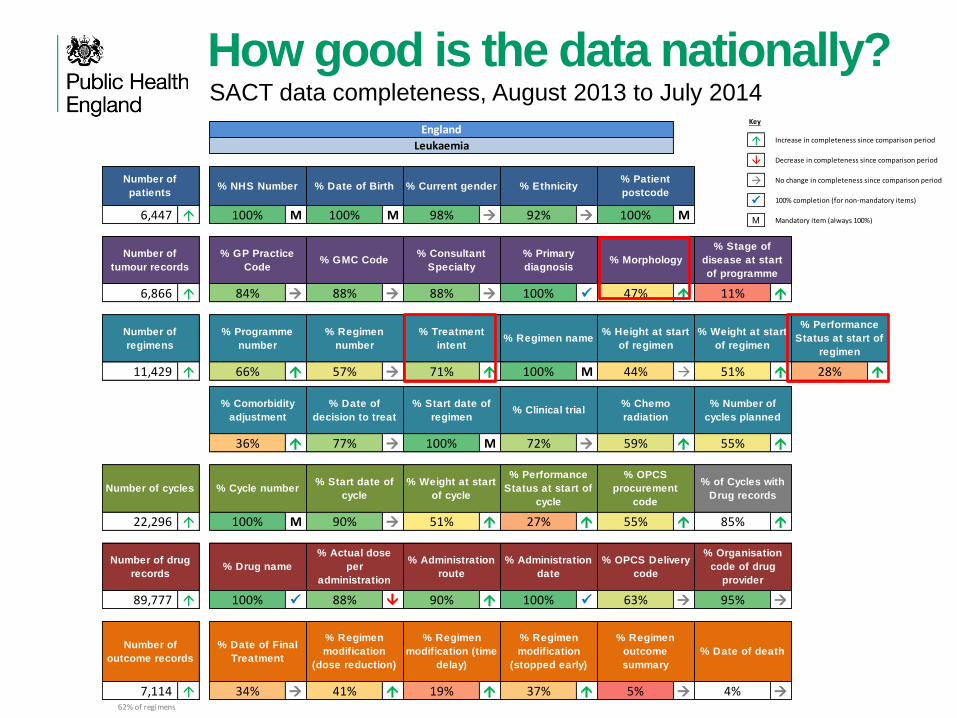
How good is the data nationally? SACT data completeness, August 2013 to July 2014
Key
Increase in completeness since comparison period
Decrease in completeness since comparison period
No change in completeness since comparison period
100% completion (for non-mandatory items)
M Mandatory item (always 100%)
SACT Data Completeness report (August 2013 to July 2014)
6,447 100% M 100% M 98% 92% 100% M
6,866 84% 88% 88% 100% 47% 11%
11,429 66% 57% 71% 100% M 44% 51% 28%
36% 77% 100% M 72% 59% 55%
22,296 100% M 90% 51% 27% 55% 85%
89,777 100% 88% 90% 100% 63% 95%
7,114 34% 41% 19% 37% 5% 4%
62% of regimens
Number of
patients% NHS Number % Date of Birth % Current gender % Ethnicity
% Stage of
disease at start
of programme
England
Leukaemia
% Patient
postcode
% GP Practice
Code% GMC Code
% Consultant
Specialty
% Primary
diagnosis% Morphology
% Cycle number
% Performance
Status at start of
regimen
% Comorbidity
adjustment
% Date of
decision to treat
% Start date of
regimen% Clinical trial
% Chemo
radiation
% Number of
cycles planned
% Programme
number
% Regimen
number
% Treatment
intent% Regimen name
% Height at start
of regimen
% Weight at start
of regimen
% of Cycles with
Drug records
% OPCS
procurement
code
% Performance
Status at start of
cycle
% Weight at start
of cycle
% Start date of
cycle
% Regimen
modification
(dose reduction)
% Date of Final
Treatment
% Drug name
% Actual dose
per
administration
% Administration
route
% Date of death
% Regimen
outcome
summary
% Regimen
modification
(stopped early)
% Regimen
modification (time
delay)
% Administration
date
% OPCS Delivery
code
% Organisation
code of drug
provider
Number of
outcome records
Number of drug
records
Number of cycles
Number of
regimens
Number of
tumour records

How good is the data nationally? SACT data completeness, August 2013 to July 2014
Key
Increase in completeness since comparison period
Decrease in completeness since comparison period
No change in completeness since comparison period
100% completion (for non-mandatory items)
M Mandatory item (always 100%)13,930 100% M 100% M 99% 92% 100% M
15,705 84% 87% 87% 100% 46% 16%
22,758 72% 67% 74% 100% M 63% 66% 36%
43% 81% 100% M 76% 62% 62%
54,495 100% M 94% 66% 37% 57% 83%
213,975 100% 94% 94% 100% 62% 96%
15,328 34% 48% 20% 42% 5% 3%
67% of regimens
Number of
outcome records
Number of drug
records
Number of cycles
Number of
regimens
Number of
tumour records
% Date of death
% Regimen
outcome
summary
% Regimen
modification
(stopped early)
% Regimen
modification (time
delay)
% Administration
date
% OPCS Delivery
code
% Organisation
code of drug
provider
% Performance
Status at start of
cycle
% Weight at start
of cycle
% Start date of
cycle
% Regimen
modification
(dose reduction)
% Date of Final
Treatment
% Drug name
% Actual dose
per
administration
% Administration
route
% Cycle number
% Performance
Status at start of
regimen
% Comorbidity
adjustment
% Date of
decision to treat
% Start date of
regimen% Clinical trial
% Chemo
radiation
% Number of
cycles planned
% Programme
number
% Regimen
number
% Treatment
intent% Regimen name
% Height at start
of regimen
% Weight at start
of regimen
% of Cycles with
Drug records
% OPCS
procurement
code
% Stage of
disease at start
of programme
England
Lymphoma
% Patient
postcode
% GP Practice
Code% GMC Code
% Consultant
Specialty
% Primary
diagnosis% Morphology
Number of
patients% NHS Number % Date of Birth % Current gender % Ethnicity
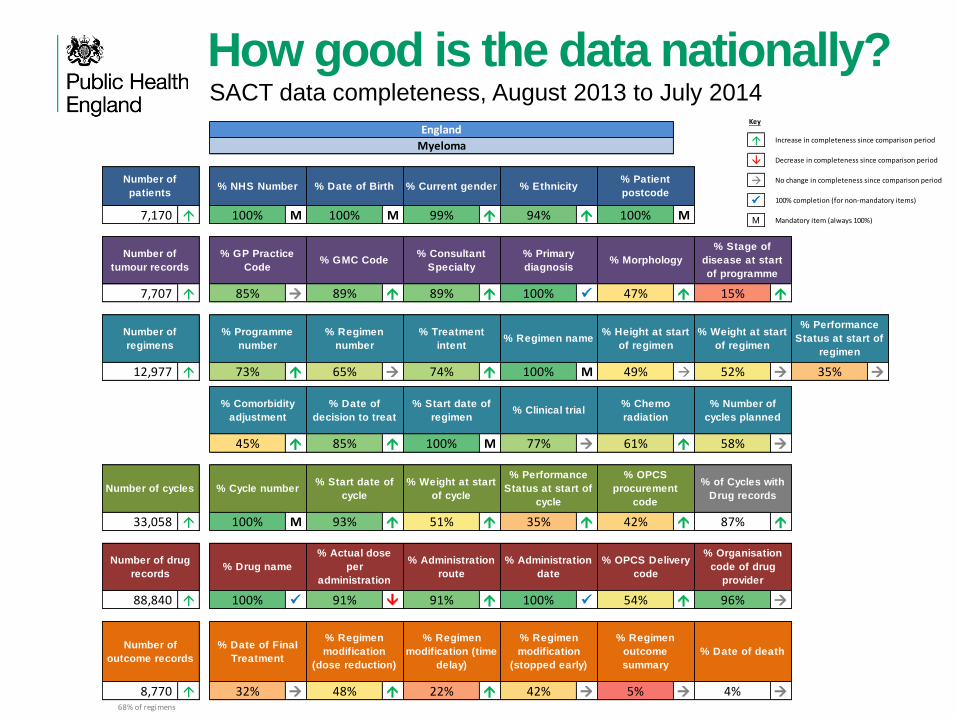
How good is the data nationally? SACT data completeness, August 2013 to July 2014
Key
Increase in completeness since comparison period
Decrease in completeness since comparison period
No change in completeness since comparison period
100% completion (for non-mandatory items)
M Mandatory item (always 100%)7,170 100% M 100% M 99% 94% 100% M
7,707 85% 89% 89% 100% 47% 15%
12,977 73% 65% 74% 100% M 49% 52% 35%
45% 85% 100% M 77% 61% 58%
33,058 100% M 93% 51% 35% 42% 87%
88,840 100% 91% 91% 100% 54% 96%
8,770 32% 48% 22% 42% 5% 4%
68% of regimens
Number of
outcome records
Number of drug
records
Number of cycles
Number of
regimens
Number of
tumour records
% Date of death
% Regimen
outcome
summary
% Regimen
modification
(stopped early)
% Regimen
modification (time
delay)
% Administration
date
% OPCS Delivery
code
% Organisation
code of drug
provider
% Performance
Status at start of
cycle
% Weight at start
of cycle
% Start date of
cycle
% Regimen
modification
(dose reduction)
% Date of Final
Treatment
% Drug name
% Actual dose
per
administration
% Administration
route
% Cycle number
% Performance
Status at start of
regimen
% Comorbidity
adjustment
% Date of
decision to treat
% Start date of
regimen% Clinical trial
% Chemo
radiation
% Number of
cycles planned
% Programme
number
% Regimen
number
% Treatment
intent% Regimen name
% Height at start
of regimen
% Weight at start
of regimen
% of Cycles with
Drug records
% OPCS
procurement
code
% Stage of
disease at start
of programme
England
Myeloma
% Patient
postcode
% GP Practice
Code% GMC Code
% Consultant
Specialty
% Primary
diagnosis% Morphology
Number of
patients% NHS Number % Date of Birth % Current gender % Ethnicity
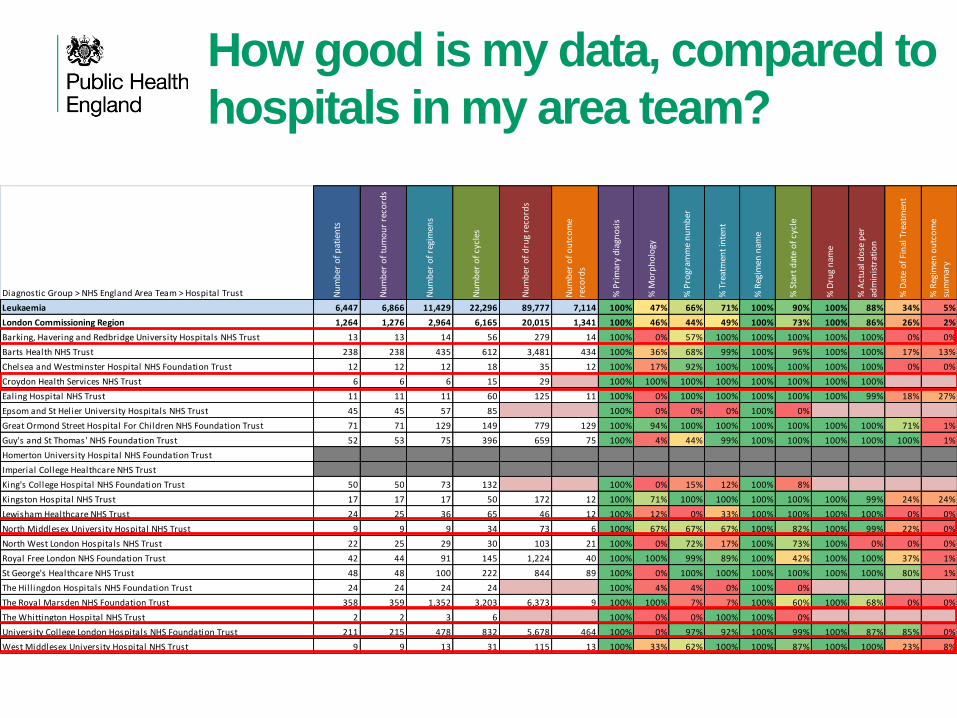
How good is my data, compared to
hospitals in my area team?
Diagnostic Group > NHS England Area Team > Hospital Trust Nu
mb
er o
f p
atie
nts
Nu
mb
er o
f tu
mo
ur
reco
rds
Nu
mb
er o
f re
gim
ens
Nu
mb
er o
f cy
cles
Nu
mb
er o
f d
rug
reco
rds
Nu
mb
er o
f o
utc
om
e
reco
rds
% P
rim
ary
dia
gno
sis
% M
orp
ho
logy
% P
rogr
amm
e n
um
ber
% T
reat
men
t in
ten
t
% R
egim
en n
ame
% S
tart
dat
e o
f cy
cle
% D
rug
nam
e
% A
ctu
al d
ose
per
adm
inis
trat
ion
% D
ate
of
Fin
al T
reat
men
t
% R
egim
en o
utc
om
e
sum
mar
y
Leukaemia 6,447 6,866 11,429 22,296 89,777 7,114 100% 47% 66% 71% 100% 90% 100% 88% 34% 5%
London Commissioning Region 1,264 1,276 2,964 6,165 20,015 1,341 100% 46% 44% 49% 100% 73% 100% 86% 26% 2%
Barking, Havering and Redbridge University Hospitals NHS Trust 13 13 14 56 279 14 100% 0% 57% 100% 100% 100% 100% 100% 0% 0%
Barts Health NHS Trust 238 238 435 612 3,481 434 100% 36% 68% 99% 100% 96% 100% 100% 17% 13%
Chelsea and Westminster Hospital NHS Foundation Trust 12 12 12 18 35 12 100% 17% 92% 100% 100% 100% 100% 100% 0% 0%
Croydon Health Services NHS Trust 6 6 6 15 29 100% 100% 100% 100% 100% 100% 100% 100% 0% 0%
Ealing Hospital NHS Trust 11 11 11 60 125 11 100% 0% 100% 100% 100% 100% 100% 99% 18% 27%
Epsom and St Helier University Hospitals NHS Trust 45 45 57 85 100% 0% 0% 0% 100% 0% 0% 0%
Great Ormond Street Hospital For Children NHS Foundation Trust 71 71 129 149 779 129 100% 94% 100% 100% 100% 100% 100% 100% 71% 1%
Guy's and St Thomas' NHS Foundation Trust 52 53 75 396 659 75 100% 4% 44% 99% 100% 100% 100% 100% 100% 1%
Homerton University Hospital NHS Foundation Trust
Imperial College Healthcare NHS Trust
King's College Hospital NHS Foundation Trust 50 50 73 132 100% 0% 15% 12% 100% 8% 0% 0%
Kingston Hospital NHS Trust 17 17 17 50 172 12 100% 71% 100% 100% 100% 100% 100% 99% 24% 24%
Lewisham Healthcare NHS Trust 24 25 36 65 46 12 100% 12% 0% 33% 100% 100% 100% 100% 0% 0%
North Middlesex University Hospital NHS Trust 9 9 9 34 73 6 100% 67% 67% 67% 100% 82% 100% 99% 22% 0%
North West London Hospitals NHS Trust 22 25 29 30 103 21 100% 0% 72% 17% 100% 73% 100% 0% 0% 0%
Royal Free London NHS Foundation Trust 42 44 91 145 1,224 40 100% 100% 99% 89% 100% 42% 100% 100% 37% 1%
St George's Healthcare NHS Trust 48 48 100 222 844 89 100% 0% 100% 100% 100% 100% 100% 100% 80% 1%
The Hill ingdon Hospitals NHS Foundation Trust 24 24 24 24 100% 4% 4% 0% 100% 0% 0% 0%
The Royal Marsden NHS Foundation Trust 358 359 1,352 3,203 6,373 9 100% 100% 7% 7% 100% 60% 100% 68% 0% 0%
The Whittington Hospital NHS Trust 2 2 3 6 100% 0% 0% 100% 100% 0% 0% 0%
University College London Hospitals NHS Foundation Trust 211 215 478 832 5,678 464 100% 0% 97% 92% 100% 99% 100% 87% 85% 0%
West Middlesex University Hospital NHS Trust 9 9 13 31 115 13 100% 33% 62% 100% 100% 87% 100% 100% 23% 8%
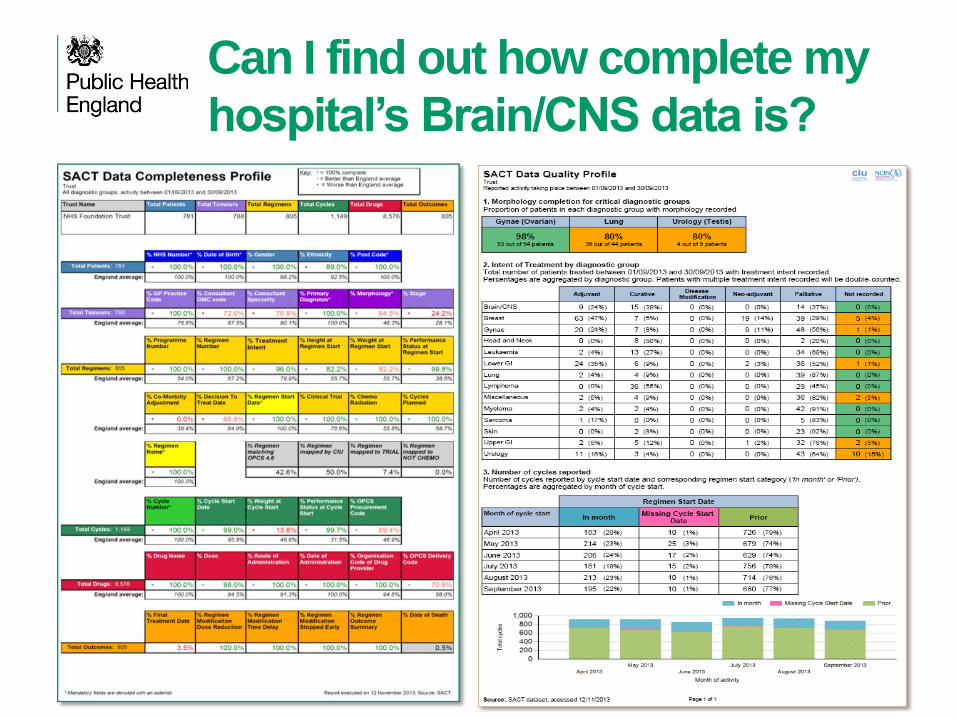
Can I find out how complete my
hospital’s Brain/CNS data is?
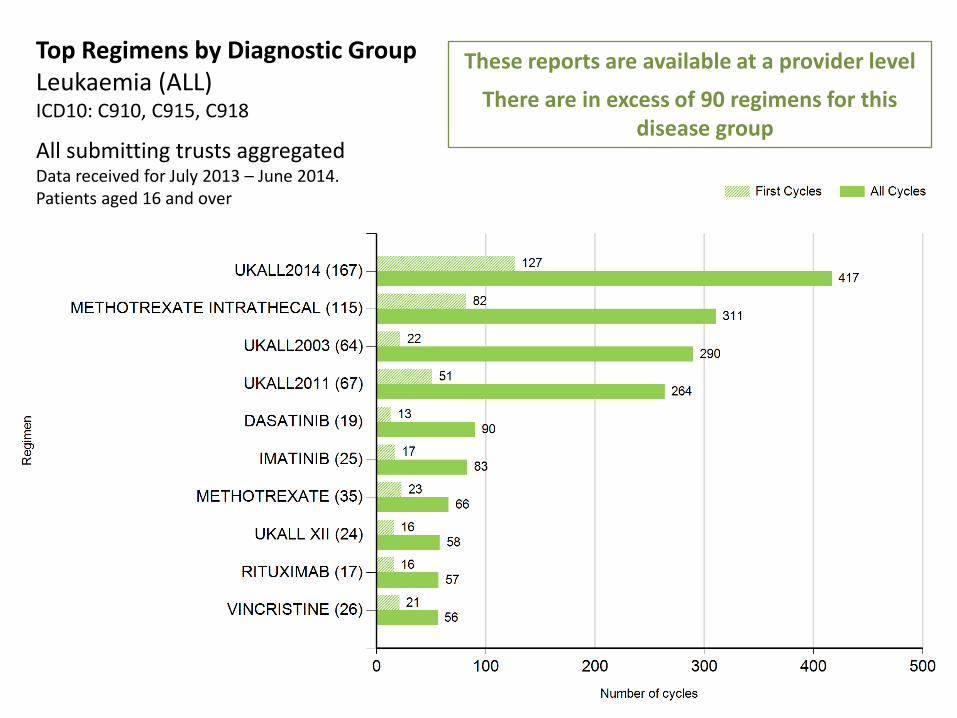
These reports are available at a provider level
There are in excess of 90 regimens for this disease group
Top Regimens by Diagnostic Group Leukaemia (ALL) ICD10: C910, C915, C918
All submitting trusts aggregated Data received for July 2013 – June 2014. Patients aged 16 and over

These reports are available at a provider level
There are in excess of 140 regimens for this disease group
Top Regimens by Diagnostic Group Leukaemia (AML) ICD10: C920, C923-C926, C928, C93, C942-C944, C962, C964, C968
All submitting trusts aggregated Data received for July 2013 – June 2014. Patients aged 16 and over
These reports are available at a provider level
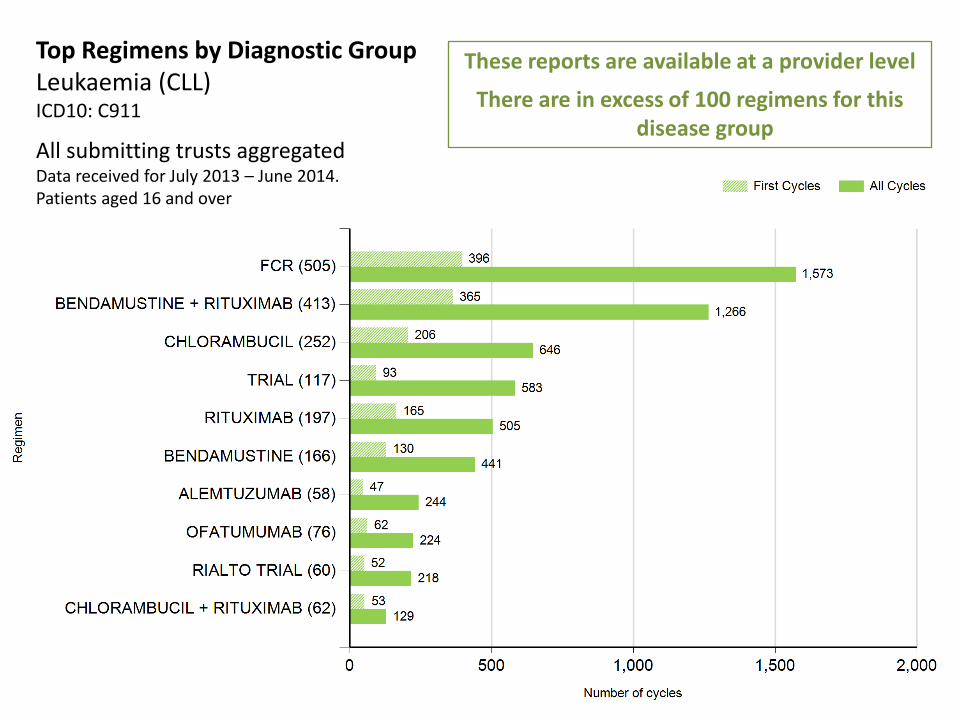
There are in excess of 100 regimens for this disease group
Top Regimens by Diagnostic Group Leukaemia (CLL) ICD10: C911
All submitting trusts aggregated Data received for July 2013 – June 2014. Patients aged 16 and over
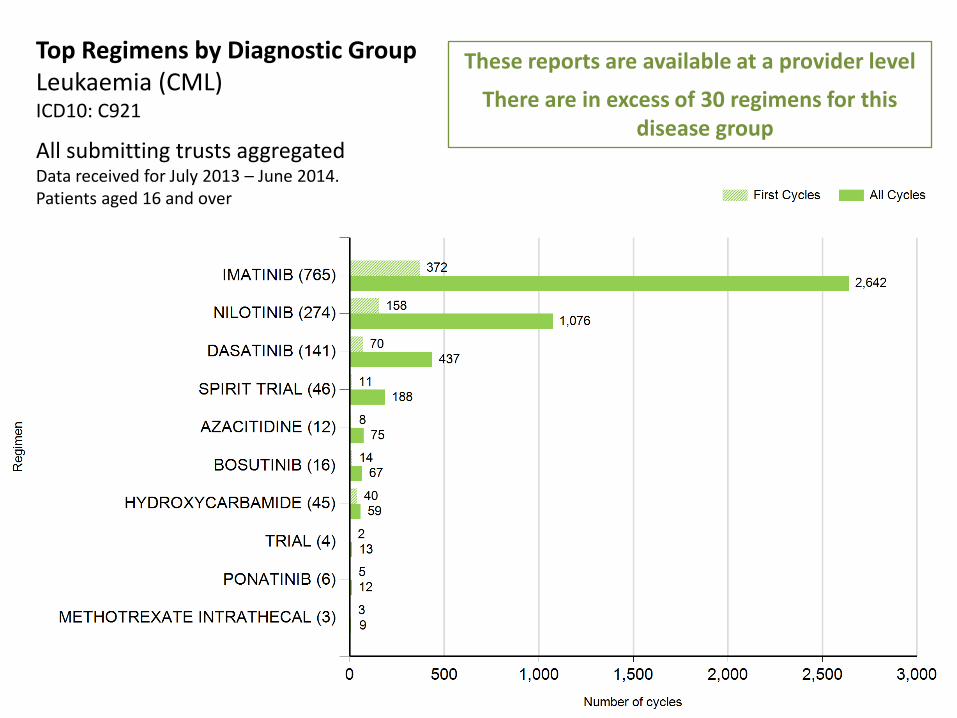
These reports are available at a provider level
There are in excess of 30 regimens for this disease group
Top Regimens by Diagnostic Group Leukaemia (CML) ICD10: C921
All submitting trusts aggregated Data received for July 2013 – June 2014. Patients aged 16 and over

These reports are available at a provider level
There are in excess of 120 regimens for this disease group
Top Regimens by Diagnostic Group Lymphoma (Hodgkin lymphoma) ICD10: C81
All submitting trusts aggregated Data received for July 2013 – June 2014. Patients aged 16 and over
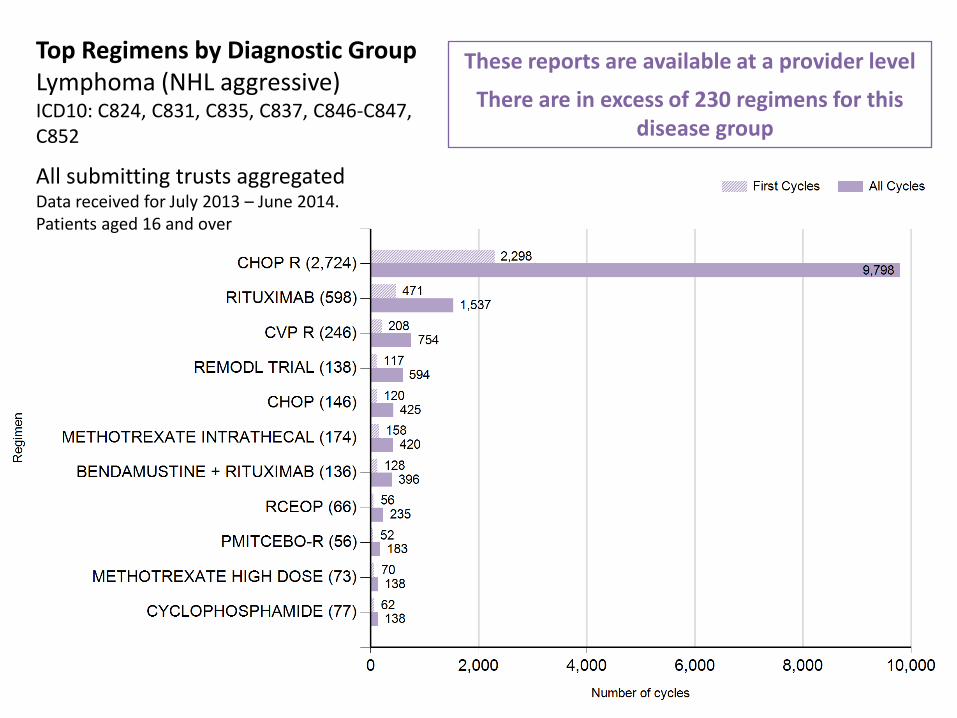
These reports are available at a provider level
There are in excess of 230 regimens for this disease group
Top Regimens by Diagnostic Group Lymphoma (NHL aggressive) ICD10: C824, C831, C835, C837, C846-C847, C852
All submitting trusts aggregated Data received for July 2013 – June 2014. Patients aged 16 and over
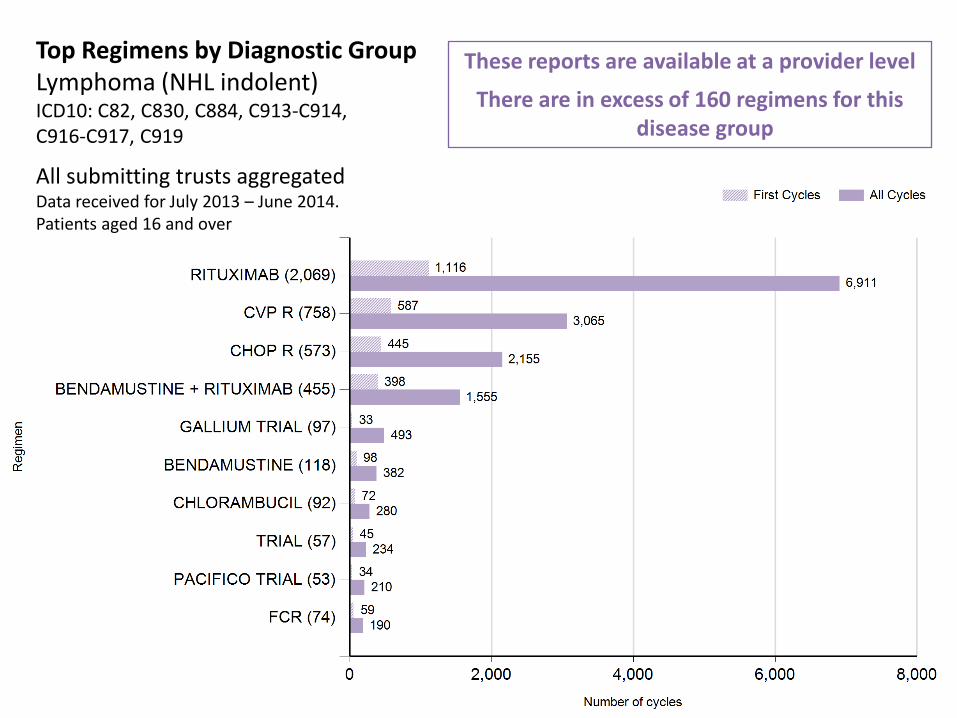
These reports are available at a provider level
There are in excess of 160 regimens for this disease group
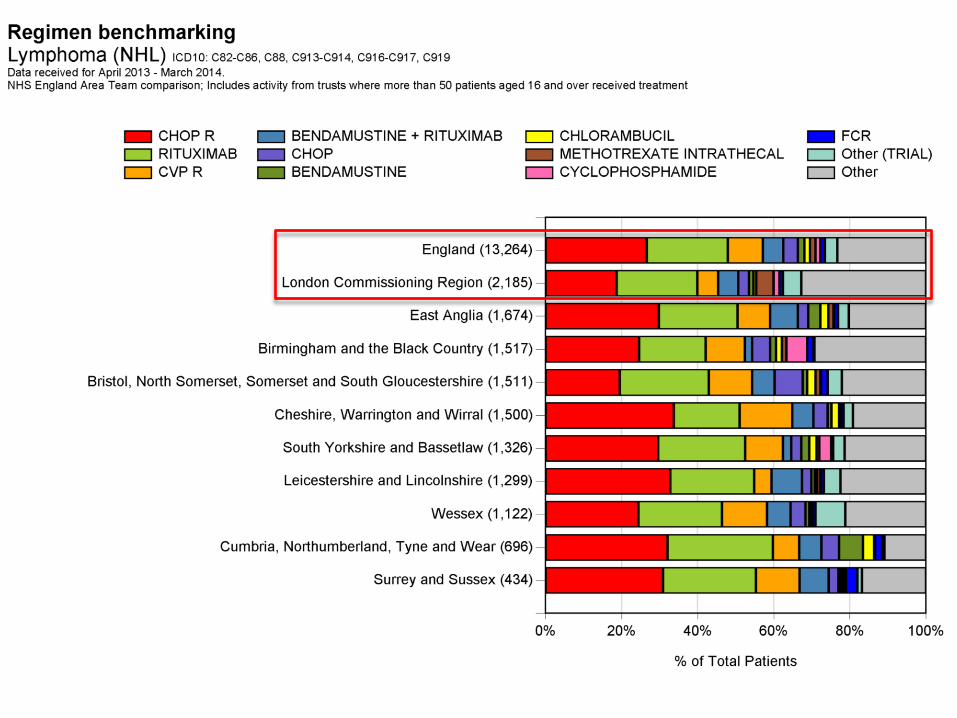
Top Regimens by Diagnostic Group Lymphoma (NHL indolent) ICD10: C82, C830, C884, C913-C914, C916-C917, C919
All submitting trusts aggregated Data received for July 2013 – June 2014. Patients aged 16 and over


From 25th July 2014 all NHS providers of chemotherapy in England will be
able to access their 30/60/90-day post chemotherapy mortality analysis through
the secure online portal.
This analysis is available by tumour group and will provide a national
comparison.
It is essential that clinical teams within provider organisations check the
accuracy of their data and contact the team in Oxford where there are any
possible discrepancies.
A letter to Medical Directors and Lead Chemotherapy Consultants has been
sent out raising awareness of these reports.
Post Chemotherapy Mortality Analysis

Post Chemotherapy Mortality Analysis
(2)
For demonstration purposes only
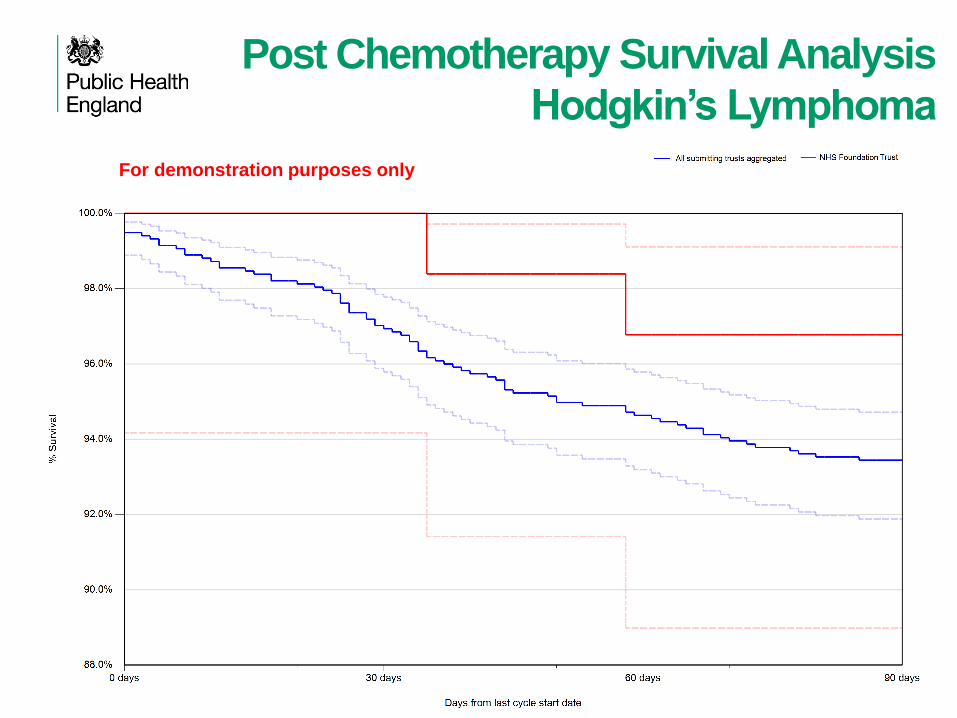
Post Chemotherapy Survival Analysis
Hodgkin’s Lymphoma
For demonstration purposes only
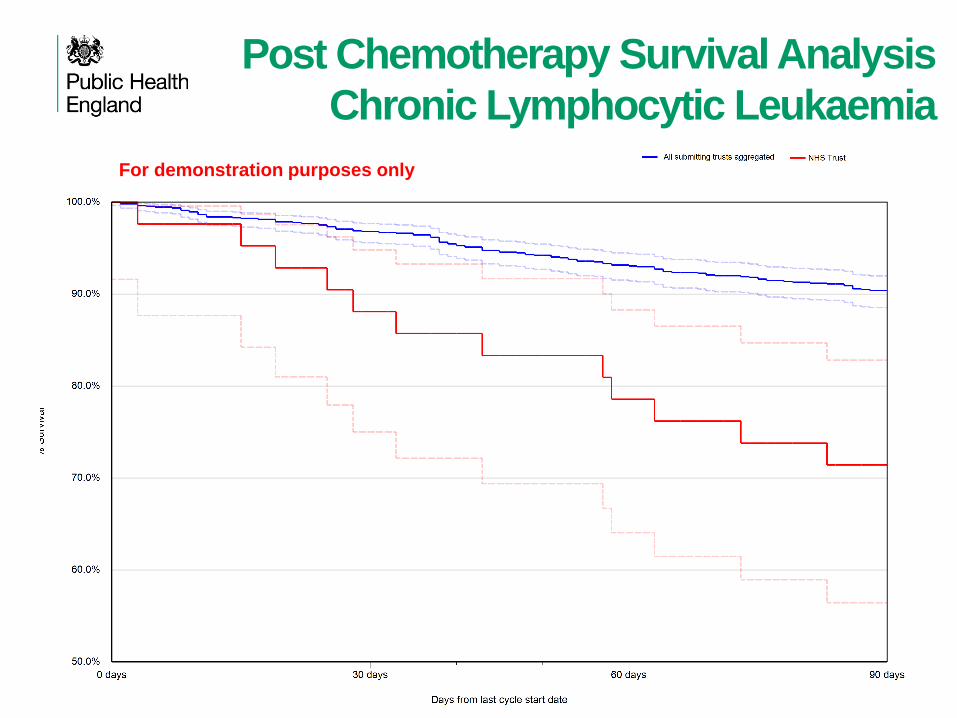
Post Chemotherapy Survival Analysis
Chronic Lymphocytic Leukaemia
For demonstration purposes only

Online Regimen Mapping Tool
Launched
Providers now have the responsibility to map their local
regimen names to nationally recognised regimen
nomenclature using the new mapping tool.
The tool was tested by members of the SACT User
Group, before being launched on the upload portal.
Using feedback, the written guidelines and step by step
guide have been produced in conjunction with senior
pharmacists who are supporting the team.
We currently have over 50 registered users with the new
role of “Regimen mapping”
We want to identify best practice
across England and share it! • Have You:
• Improved SACT data quality by introducing new
processes?
• Used your local SACT data to improve services, or your
understanding of chemotherapy?
• Shared all SACT reports (Data Quality, Top Regimen,
Benchmarking and the mortality reports) with your
pharmacy and oncology teams members in order to
improve understanding SACT and its purpose?
If yes, please contact us at [email protected]!
Improving Stakeholder
Engagement
Members of the CIU team will be attending the following meetings in August / September:
• NHS England Area Team Pharmacist Meeting
• NCIN Breast Site Specific Clinical Reference Group (SSCRG)
• NCIN Lung SSCRG
• NHS England Chemotherapy Clinical Reference Group
• NCIN Central Nervous System SSCRG
• NCIN Haematology SSCRG
Would you like to know more about SACT? Please contact the team, we are always happy to discuss the project or meet with you.
E-mail: [email protected]