Embed Size (px)
Citation preview
Health Technology Assessment 2010; Vol. 14: No. 4
Health Technology AssessmentNIHR HTA programmewww.hta.ac.uk
January 2010DOI: 10.3310/hta14040
Systematic review of the clinical effectiveness and cost-effectiveness of photodynamic diagnosis and urine biomarkers (FISH, ImmunoCyt, NMP22) and cytology for the detection and follow-up of bladder cancer
G Mowatt, S Zhu, M Kilonzo, C Boachie, C Fraser, TRL Griffiths, J N’Dow, G Nabi, J Cook and L Vale
How to obtain copies of this and other HTA programme reportsAn electronic version of this title, in Adobe Acrobat format, is available for downloading free of charge for personal use from the HTA website (www.hta.ac.uk). A fully searchable DVD is also available (see below).
Printed copies of HTA journal series issues cost £20 each (post and packing free in the UK) to both public and private sector purchasers from our despatch agents.
Non-UK purchasers will have to pay a small fee for post and packing. For European countries the cost is £2 per issue and for the rest of the world £3 per issue.
How to order:
– fax (with credit card details) – post (with credit card details or cheque)– phone during office hours (credit card only).
Additionally the HTA website allows you to either print out your order or download a blank order form.
Contact details are as follows:
Synergie UK (HTA Department)Digital House, The Loddon Centre Wade Road Basingstoke Hants RG24 8QW
Email: [email protected]
Tel: 0845 812 4000 – ask for ‘HTA Payment Services’ (out-of-hours answer-phone service)
Fax: 0845 812 4001 – put ‘HTA Order’ on the fax header
Payment methodsPaying by chequeIf you pay by cheque, the cheque must be in pounds sterling, made payable to University of Southampton and drawn on a bank with a UK address.
Paying by credit card You can order using your credit card by phone, fax or post.
SubscriptionsNHS libraries can subscribe free of charge. Public libraries can subscribe at a reduced cost of £100 for each volume (normally comprising 40–50 titles). The commercial subscription rate is £400 per volume (addresses within the UK) and £600 per volume (addresses outside the UK). Please see our website for details. Subscriptions can be purchased only for the current or forthcoming volume.
How do I get a copy of HTA on DVD?
Please use the form on the HTA website (www.hta.ac.uk/htacd/index.shtml). HTA on DVD is currently free of charge worldwide.
The website also provides information about the HTA programme and lists the membership of the various committees.
HTA
Systematic review of the clinical effectiveness and cost-effectiveness of photodynamic diagnosis and urine biomarkers (FISH, ImmunoCyt, NMP22) and cytology for the detection and follow-up of bladder cancer
G Mowatt,1* S Zhu,1 M Kilonzo,2 C Boachie,1 C Fraser,1 TRL Griffiths,3 J N’Dow,4 G Nabi,4 J Cook1 and L Vale1,2
1Health Services Research Unit, Institute of Applied Health Sciences, University of Aberdeen, UK
2Health Economics Research Unit, Institute of Applied Health Sciences, University of Aberdeen, UK
3Department of Cancer Studies and Molecular Medicine, University of Leicester, UK4Academic Urology Unit, Department of Surgery, University of Aberdeen, UK
*Corresponding author
Declared competing interests of authors: TRL Griffiths has attended a consensus panel meeting of bladder cancer experts which was supported by an educational grant from GE Healthcare, who market and distribute Hexvix (hexaminolevulinate). TRL Griffiths has also received honoraria from Karl Storz, manufacturers of cystoscopic equipment including the core component of the PDD light unit, for contributing to educational programmes.
Published January 2010 DOI: 10.3310/hta14040
This report should be referenced as follows:
Mowatt G, Zhu S, Kilonzo M, Boachie C, Fraser C, Griffiths TRL, et al. Systematic review of the clinical effectiveness and cost-effectiveness of photodynamic diagnosis and urine biomarkers (FISH, ImmunoCyt, NMP22) and cytology for the detection and follow-up of bladder cancer. Health Technol Assess 2010;14(4).
Health Technology Assessment is indexed and abstracted in Index Medicus/MEDLINE, Excerpta Medica/EMBASE and Science Citation Index Expanded (SciSearch) and Current Contents/Clinical Medicine.
Abstract
List of abbreviations
Executive summary
Chapter 1 BackgroundDescription of health problemCurrent service provisionDescription of the technologies under assessment
Chapter 2 Definition of the decision problemDecision problemAim of the reviewStructure of the remainder of the report
Chapter 3 Methods for reviewing test performance and effectivenessIdentification of studiesInclusion and exclusion criteriaData extraction strategyQuality assessment strategyData analysis
Chapter 4 Results – photodynamic diagnosisNumber of studies identifiedNumber and type of studies includedNumber and type of studies excludedCharacteristics of the included studiesQuality of the included studiesAssessment of diagnostic accuracyRecurrence/progression of diseaseSummary – assessment of diagnostic accuracy and recurrence/
progression of disease
Chapter 5 Results – biomarkers and cytologyNumber of studies identifiedNumber and type of studies includedNumber and type of studies excludedOverview of the biomarkers/cytology chapterFluorescence in situ hybridisationImmunoCytNMP22CytologyStudies directly comparing testsStudies reporting combinations of testsSummary
Chapter 6 Assessment of cost-effectivenessEconomic model for initial diagnosis and follow-up of
bladder cancerResultsSummary of results
Chapter 7 Assessment of factors relevant to the NHS and other partiesFactors relevant to the NHSFactors relevant to other parties
Chapter 8 DiscussionStatement of principal findingsStrengths and limitations of the assessmentUncertaintiesCost-effectiveness analysis
Chapter 9 ConclusionsImplications for service provisionSuggested research priorities
Acknowledgements
References
Appendix 1 Search strategies
Appendix 2 PDD quality assessment checklist (QUADAS tool)
Appendix 3 PDD quality assessment checklist (RCTs)
Appendix 4 Photodynamic diagnosis (PDD) included studies
Appendix 5 Photodynamic diagnosis excluded studies
Appendix 6 Characteristics of the PDD diagnostic studies
Appendix 7 Quality assessment results for the individual PDD studies
Appendix 8 Studies of PDD versus WLC included in pooled estimates for patient- and biopsy-level analysis and also those reporting stage/grade
Appendix 9 PDD and WLC test performance for detecting bladder cancer, results table with 2 × 2 data
Appendix 10 Biomarker/cytology included studies
Appendix 11 Biomarker/cytology excluded studies
Appendix 12
Characteristics of the biomarker and cytology studies
Appendix 13 Quality assessment results for the biomarker and cytology studies
Appendix 14 Studies of biomarkers included in pooled estimates for patient-level analysis and also those reporting specimen and stage/grade
Appendix 15 Biomarker and cytology test performance for detecting bladder cancer, results table with 2 × 2 data
Appendix 16 Cut-offs for a positive test used in studies reporting FISH
Appendix 17 Model structure
Appendix 18 Summary of studies reporting prognosis and all-cause mortality rates for the UK
Appendix 19 Results of cost–consequence analysis
Appendix 20 Cost-effectiveness acceptability curves for the eight strategies for changes in the incidence rate (base case = 5%)
Appendix 21 Cost-effectiveness acceptability curves for changes to the performance of flexible cystoscopy (base-case flexible cystoscopy is the same as white light rigid cystoscopy)
Appendix 22 Cost-effectiveness acceptability curves for changes to the relative risk (RR) of progression of bladder cancer for no treatment of bladder cancer compared with treatment of bladder cancer (base-case RR = 2.56)
Appendix 23 Cost-effectiveness acceptability curves for the eight strategies for changes in the relative risk (RR) for recurrence comparing PDD with WLC (base-case RR = 1)
Appendix 24 Cost-effectiveness acceptability curves for the eight strategies for changes in the relative risk (RR) for progression comparing PDD with WLC (base-case RR = 1)
Appendix 25 Cost-effectiveness acceptability curves for the eight
strategies for changes in the discount rate (base-case discount rate = 3.5%)
Appendix 26 Cost-effectiveness acceptability curves for the eight strategies for changes in proportions in the risk groups for non-invasive disease (base case: proportion in low-risk group is 0.1 and proportion is high-risk group is 0.45)
Appendix 27 Cost-effectiveness acceptability curves for the eight strategies for changes in the starting age and time horizon
Appendix 28 Cost-effectiveness acceptability curves for the eight strategies when WLC is replaced by PDD in follow-up for each strategy
Appendix 29 Cost-effectiveness acceptability curves for the eight strategies when quality of life measures are incorporated to produce quality-adjusted life-years
Health Technology Assessment reports published to date
Health Technology Assessment programme
NIHR Health Technology Assessment programme
The Health Technology Assessment (HTA) programme, part of the National Institute for Health Research (NIHR), was set up in 1993. It produces high-quality research information on the
effectiveness, costs and broader impact of health technologies for those who use, manage and provide care in the NHS. ‘Health technologies’ are broadly defined as all interventions used to promote health, prevent and treat disease, and improve rehabilitation and long-term care.The research findings from the HTA programme directly influence decision-making bodies such as the National Institute for Health and Clinical Excellence (NICE) and the National Screening Committee (NSC). HTA findings also help to improve the quality of clinical practice in the NHS indirectly in that they form a key component of the ‘National Knowledge Service’.The HTA programme is needs led in that it fills gaps in the evidence needed by the NHS. There are three routes to the start of projects.First is the commissioned route. Suggestions for research are actively sought from people working in the NHS, from the public and consumer groups and from professional bodies such as royal colleges and NHS trusts. These suggestions are carefully prioritised by panels of independent experts (including NHS service users). The HTA programme then commissions the research by competitive tender.Second, the HTA programme provides grants for clinical trials for researchers who identify research questions. These are assessed for importance to patients and the NHS, and scientific rigour.Third, through its Technology Assessment Report (TAR) call-off contract, the HTA programme commissions bespoke reports, principally for NICE, but also for other policy-makers. TARs bring together evidence on the value of specific technologies.Some HTA research projects, including TARs, may take only months, others need several years. They can cost from as little as £40,000 to over £1 million, and may involve synthesising existing evidence, undertaking a trial, or other research collecting new data to answer a research problem.The final reports from HTA projects are peer reviewed by a number of independent expert referees before publication in the widely read journal series Health Technology Assessment.
Criteria for inclusion in the HTA journal seriesReports are published in the HTA journal series if (1) they have resulted from work for the HTA programme, and (2) they are of a sufficiently high scientific quality as assessed by the referees and editors.Reviews in Health Technology Assessment are termed ‘systematic’ when the account of the search, appraisal and synthesis methods (to minimise biases and random errors) would, in theory, permit the replication of the review by others.
The research reported in this issue of the journal was commissioned and funded by the HTA programme on behalf of NICE as project number 07/02/01. The protocol was agreed in October 2007. The assessment report began editorial review in October 2008 and was accepted for publication in May 2009. The authors have been wholly responsible for all data collection, analysis and interpretation, and for writing up their work. The HTA editors and publisher have tried to ensure the accuracy of the authors’ report and would like to thank the referees for their constructive comments on the draft document. However, they do not accept liability for damages or losses arising from material published in this report.The views expressed in this publication are those of the authors and not necessarily those of the HTA programme or the Department of Health.
Editor-in-Chief: Professor Tom Walley CBESeries Editors: Dr Martin Ashton-Key, Dr Aileen Clarke, Professor Chris Hyde,
Dr Tom Marshall, Dr John Powell, Dr Rob Riemsma and Professor Ken Stein
ISSN 1366-5278
© 2010 Queen’s Printer and Controller of HMSOThis journal may be freely reproduced for the purposes of private research and study and may be included in professional journals provided that suitable acknowledgement is made and the reproduction is not associated with any form of advertising.Applications for commercial reproduction should be addressed to: NETSCC, Health Technology Assessment, Alpha House, University of Southampton Science Park, Southampton SO16 7NS, UK.Published by Prepress Projects Ltd, Perth, Scotland (www.prepress-projects.co.uk), on behalf of NETSCC, HTA.Printed on acid-free paper in the UK by Henry Ling Ltd, The Dorset Press, Dorchester. T
DOI: 10.3310/hta14040 Health Technology Assessment 2010; Vol. 14: No. 4
© 2010 Queen’s Printer and Controller of HMSO. All rights reserved.
iii
AbstractSystematic review of the clinical effectiveness and cost-effectiveness of photodynamic diagnosis and urine biomarkers (FISH, ImmunoCyt, NMP22) and cytology for the detection and follow-up of bladder cancer
G Mowatt,1* S Zhu,1 M Kilonzo,2 C Boachie,1 C Fraser,1 TRL Griffiths,3 J N’Dow,4 G Nabi,4 J Cook1 and L Vale1,2
1Health Services Research Unit, Institute of Applied Health Sciences, University of Aberdeen, UK2Health Economics Research Unit, Institute of Applied Health Sciences, University of Aberdeen, UK3Department of Cancer Studies and Molecular Medicine, University of Leicester, UK4Academic Urology Unit, Department of Surgery, University of Aberdeen, UK
*Corresponding author
100%)] detection was higher than those of WLC [56% (0% to 100%) and 67% (0% to 100%) respectively]. Four RCTs comparing PDD with WLC reported effectiveness outcomes. PDD use at transurethral resection of bladder tumour resulted in fewer residual tumours at check cystoscopy [relative risk, RR, 0.37 (95% CI 0.20 to 0.69)] and longer recurrence-free survival [RR 1.37 (95% CI 1.18 to 1.59)] compared with WLC. In 71 studies reporting the performance of biomarkers and cytology in detecting bladder cancer, sensitivity (95% CI) was highest for ImmunoCyt [84% (77% to 91%)] and lowest for cytology [44% (38% to 51%)], whereas specificity was highest for cytology [96% (94% to 98%)] and lowest for ImmunoCyt [75% (68% to 83%)]. In the cost-effectiveness analysis the most effective strategy in terms of true positive cases (44) and life-years (11.66) [flexible cystoscopy (CSC) and ImmunoCyt followed by PDD in initial diagnosis and CSC followed by WLC in follow-up] had an incremental cost per life-year of over £270,000. The least effective strategy [cytology followed by WLC in initial diagnosis (average cost over 20 years £1403, average life expectancy 11.59)] was most likely to be considered cost-effective when society’s willingness to pay was less than £20,000 per life-year. No strategy was cost-effective more than 50% of the time, but four of the eight strategies in the probabilistic sensitivity analysis (three involving a biomarker or PDD) were each associated with a 20% chance of being considered cost-effective. In sensitivity analyses the results were most sensitive to the pretest probability of disease (5% in the base case).
Objective: To assess the clinical effectiveness and cost-effectiveness of photodynamic diagnosis (PDD) compared with white light cystoscopy (WLC), and urine biomarkers [fluorescence in situ hybridisation (FISH), ImmunoCyt, NMP22] and cytology for the detection and follow-up of bladder cancer.Data sources: Major electronic databases including MEDLINE, MEDLINE In-Process, EMBASE, BIOSIS, Science Citation Index, Health Management Information Consortium and the Cochrane Controlled Trials Register were searched until April 2008.Review methods: A systematic review of the literature was carried out according to standard methods. An economic model was constructed to assess the cost-effectiveness of alternative diagnostic and follow-up strategies for the diagnosis and management of patients with bladder cancer.Results: In total, 27 studies reported PDD test performance. In pooled estimates [95% confidence interval (CI)] for patient-level analysis, PDD had higher sensitivity than WLC [92% (80% to 100%) versus 71% (49% to 93%)] but lower specificity [57% (36% to 79%) versus 72% (47% to 96%)]. Similar results were found for biopsy-level analysis. The median sensitivities (range) of PDD and WLC for detecting lower risk, less aggressive tumours were similar for patient-level detection [92% (20% to 95%) versus 95% (8% to 100%)], but sensitivity was higher for PDD than for WLC for biopsy-level detection [96% (88% to 100%) versus 88% (74% to 100%)]. For more aggressive, higher-risk tumours the median sensitivity of PDD for both patient-level [89% (6% to 100%)] and biopsy-level [99% (54% to

Abstract
iv
Conclusions: The advantages of PDD’s higher sensitivity in detecting bladder cancer have to be weighed against the disadvantages of a higher false-positive rate. Taking into account the assumptions made in the model, strategies involving biomarkers and/or
PDD provide additional benefits at a cost that society might be willing to pay. Strategies replacing WLC with PDD provide more life-years but it is unclear whether they are worth the extra cost.

DOI: 10.3310/hta14040 Health Technology Assessment 2010; Vol. 14: No. 4
© 2010 Queen’s Printer and Controller of HMSO. All rights reserved.
v
Contents
List of abbreviations ................................. vii
Executive summary ................................. ix
1 Background ............................................... 1Description of health problem .................. 1Current service provision ........................... 6Description of the technologies under
assessment ............................................. 9
2 Definition of the decision problem ......... 15Decision problem ....................................... 15Aim of the review ....................................... 19Structure of the remainder of the report ... 20
3 Methods for reviewing test performance and effectiveness ...................................... 21Identification of studies ............................. 21Inclusion and exclusion criteria ................. 22Data extraction strategy ............................. 23Quality assessment strategy ....................... 23Data analysis .............................................. 24
4 Results – photodynamic diagnosis .......... 27Number of studies identified ..................... 27Number and type of studies included ....... 27Number and type of studies excluded ....... 27Characteristics of the included studies ...... 27Quality of the included studies .................. 30Assessment of diagnostic accuracy ............. 32Recurrence/progression of disease ............ 38Summary – assessment of diagnostic
accuracy and recurrence/progression of disease ................................................... 43
5 Results – biomarkers and cytology ......... 47Number of studies identified ..................... 47Number and type of studies included ....... 47Number and type of studies excluded ....... 47Overview of the biomarkers/cytology
chapter .................................................. 47Fluorescence in situ hybridisation ............. 49ImmunoCyt ................................................ 52NMP22 ....................................................... 56Cytology ..................................................... 60Studies directly comparing tests ................ 66Studies reporting combinations of tests .... 66Summary .................................................... 69
6 Assessment of cost-effectiveness ............ 73Economic model for initial diagnosis and
follow-up of bladder cancer ................... 73Results ........................................................ 90Summary of results .................................... 108
7 Assessment of factors relevant to the NHS and other parties ............................ 119Factors relevant to the NHS ...................... 119Factors relevant to other parties ................ 119
8 Discussion ................................................. 121Statement of principal findings ................. 121Strengths and limitations of the
assessment ............................................. 126Uncertainties ............................................. 126Cost-effectiveness analysis ......................... 130
9 Conclusions ............................................... 135Implications for service provision ............. 135Suggested research priorities ..................... 136
Acknowledgements .................................. 139
References ................................................ 141
Appendix 1 Search strategies ................... 153
Appendix 2 PDD quality assessment checklist (QUADAS tool) ........................... 159
Appendix 3 PDD quality assessment checklist (RCTs) ......................................... 161
Appendix 4 Photodynamic diagnosis (PDD) included studies .............................. 163
Appendix 5 Photodynamic diagnosis excluded studies ......................................... 167
Appendix 6 Characteristics of the PDD diagnostic studies .............................. 169
Appendix 7 Quality assessment results for the individual PDD studies .................. 177
Appendix 8 Studies of PDD versus WLC included in pooled estimates for patient- and biopsy-level analysis and also those reporting stage/grade ................................ 181
Contents
vi
Appendix 9 PDD and WLC test performance for detecting bladder cancer, results table with 2 × 2 data ............................................ 185
Appendix 10 Biomarker/cytology included studies ......................................... 201
Appendix 11 Biomarker/cytology excluded studies ......................................... 207
Appendix 12 Characteristics of the biomarker and cytology studies ................. 219
Appendix 13 Quality assessment results for the biomarker and cytology studies ..... 231
Appendix 14 Studies of biomarkers included in pooled estimates for patient- level analysis and also those reporting specimen and stage/grade ......................... 235
Appendix 15 Biomarker and cytology test performance for detecting bladder cancer, results table with 2 × 2 data ............ 245
Appendix 16 Cut-offs for a positive test used in studies reporting FISH ................. 301
Appendix 17 Model structure .................. 303
Appendix 18 Summary of studies reporting prognosis and all-cause mortality rates for the UK ....................................................... 305
Appendix 19 Results of cost–consequence analysis ....................................................... 309
Appendix 20 Cost-effectiveness acceptability curves for the eight strategies for changes in the incidence rate (base case = 5%) ......................................... 313
Appendix 21 Cost-effectiveness acceptability curves for changes to the performance of flexible cystoscopy (base-case flexible cystoscopy is the same as white light rigid cystoscopy) .................. 315
Appendix 22 Cost-effectiveness acceptability curves for changes to the relative risk (RR) of progression of bladder cancer for no treatment of bladder cancer compared with treatment of bladder cancer (base-case RR = 2.56) ................................. 317
Appendix 23 Cost-effectiveness acceptability curves for the eight strategies for changes in the relative risk (RR) for recurrence comparing PDD with WLC (base-case RR = 1) ............ 319
Appendix 24 Cost-effectiveness acceptability curves for the eight strategies for changes in the relative risk (RR) for progression comparing PDD with WLC (base-case RR = 1) ...................................... 321
Appendix 25 Cost-effectiveness acceptability curves for the eight strategies for changes in the discount rate (base-case discount rate = 3.5%) ................................................ 323
Appendix 26 Cost-effectiveness acceptability curves for the eight strategies for changes in proportions in the risk groups for non-invasive disease (base case: proportion in low-risk group is 0.1 and proportion is high-risk group is 0.45) ............................................. 325
Appendix 27 Cost-effectiveness acceptability curves for the eight strategies for changes in the starting age and time horizon ............. 327
Appendix 28 Cost-effectiveness acceptability curves for the eight strategies when WLC is replaced by PDD in follow-up for each strategy ....................................................... 329
Appendix 29 Cost-effectiveness acceptability curves for the eight strategies when quality of life measures are incorporated to produce quality-adjusted life-years .......................... 331
Health Technology Assessment reports published to date ...................................... 333
Health Technology Assessment programme ............................................... 353
DOI: 10.3310/hta14040 Health Technology Assessment 2010; Vol. 14: No. 4
© 2010 Queen’s Printer and Controller of HMSO. All rights reserved.
vii
5-ALA 5-aminolaevulinic acid
AUA American Urological Association
BAUS British Association of Urological Surgeons
BCG bacillus Calmette–Guerin
BM biomarker
CEAC cost-effectiveness acceptability curve
CI confidence interval
CIS carcinoma in situ
CSC flexible cystoscopy
CT computerised tomography
CTL cytology
DOR diagnostic odds ratio
EAU European Association of Urology
EORTC European Organisation for Research and Treatment of Cancer
FDA Food and Drug Administration
FISH fluorescence in situ hybridisation
GC gemcitabine, cisplatin
GST glutathione S-transferase
HAL hexaminolaevulinate
HRG Healthcare Resource Group
HSROC hierarchical summary receiver operating characteristic
ICER incremental cost-effectiveness ratio
IVP intravenous pyelography
MDT multidisciplinary team
MRI magnetic resonance imaging
MVAC methotrexate, vinblastine, adriamycin, cisplatin
NAT N-acetyltransferase
NCRI National Cancer Research Institute
NICE National Institute for Health and Clinical Excellence
NMP22 nuclear matrix protein
NPV negative predictive value
PDD photodynamic diagnosis
PPIX protoporphyrin IX
PPV positive predictive value
QALY quality-adjusted life-year
QoL quality of life
RCT randomised controlled trial
ReBIP Review Body for Interventional Procedures
RR relative risk
SIGN Scottish Intercollegiate Guidelines Network
SROC summary receiver operating characteristic
TCC transitional cell carcinoma
TUR transurethral resection
TURBT transurethral resection of bladder tumour
WHO World Health Organization
WLC white light cystoscopy
WMD weighted mean difference
List of abbreviations
All abbreviations that have been used in this report are listed here unless the abbreviation is well known (e.g. NHS), or it has been used only once, or it is a non-standard abbreviation used only in figures/tables/appendices, in which case the abbreviation is defined in the figure legend or in the notes at the end of the table.

DOI: 10.3310/hta14040 Health Technology Assessment 2010; Vol. 14: No. 4
© 2010 Queen’s Printer and Controller of HMSO. All rights reserved.
ix
Background
Bladder cancer is the sixth most common cancer in the UK, affecting more than 10,000 people each year. Around 75–85% of patients are diagnosed as having non-muscle-invasive disease, which, despite treatment, has a probability of recurrence at 5 years of 31% (95% CI 24% to 37%) to 78% (95% CI 73% to 84%). Inspection of the bladder [flexible cystoscopy using white light (CSC)] facilitated with local anaesthesia and voided urine cytology (involving the examination of cells in voided urine to detect the presence of cancerous cells) are currently the routine initial investigations of the bladder in patients with haematuria or other symptoms suggestive of bladder cancer. If CSC or urine cytology are suspicious, a rigid white light cystoscopy (WLC) under general or regional anaesthesia is performed with transurethral resection of bladder tumour (TURBT) where applicable. However, WLC may fail to detect some tumours. Photodynamic diagnosis (PDD) is a technique that could potentially be used to enhance tumour detection. Also, since the mid-1990s many urine biomarker tests for detecting bladder cancer have been developed, including fluorescence in situ hybridisation (FISH), ImmunoCyt and nuclear matrix protein (NMP22).
Objectives
This review aims to assess the clinical and cost-effectiveness of PDD compared with WLC, and urine biomarkers (FISH, ImmunoCyt, NMP22) and cytology for the detection and follow-up of bladder cancer.
Methods
Electronic searches were undertaken to identify published and unpublished reports. The databases searched included MEDLINE, MEDLINE In-Process, EMBASE, BIOSIS, Science Citation Index, Health Management Information Consortium (HMIC) and the Cochrane Controlled Trials Register as well as current research registers. The date of the last searches was April 2008. The
types of studies considered for test performance were randomised controlled trials (RCTs), non-randomised comparative studies and diagnostic cross-sectional studies that reported the absolute numbers of true and false positives and negatives. Only RCTs were considered for studies reporting effectiveness. Participants had symptoms suspicious for bladder cancer or were previously diagnosed with non-muscle-invasive disease. The tests considered were (1) PDD compared with WLC or (2) FISH, ImmunoCyt, NMP22 or cytology, with a reference standard of histopathological examination of biopsied tissue.
One reviewer screened the titles and abstracts of all reports identified by the search strategy and data extracted included full-text studies, with checking by a second reviewer. Two reviewers independently assessed the quality of the diagnostic studies using a modified version of the QUADAS instrument and the quality of the effectiveness studies using a checklist adapted from Verhagen and colleagues.
The results of the individual studies were tabulated and sensitivity, specificity, positive and negative likelihood ratios, and diagnostic odds ratios (DORs) calculated. Separate summary receiver operating characteristic (SROC) curves were derived for different levels of analysis. Meta-analysis models were fitted using hierarchical summary receiver operating characteristic (HSROC) curves. Summary sensitivity, specificity, positive and negative likelihood ratios and DORs for each model were reported as median and 95% confidence interval (CI). For studies reporting effectiveness outcomes meta-analysis was employed to estimate a summary measure of effect, with dichotomous outcome data combined using relative risk (RR). Results were reported using a fixed-effect model in the absence of statistical heterogeneity.
An economic model was constructed to assess the cost-effectiveness of alternative diagnostic and follow-up strategies for the diagnosis and management of patients suspected of having bladder cancer. The model described care pathways from initial presentation, through diagnosis and treatment over a 20-year time horizon. A total of 26 different strategies were considered in the
Executive summary
Executive summary
xx
economic model, which represented plausible ways in which the tests might be used for the diagnosis and follow-up of patients with bladder cancer. Of these 26, eight strategies that appeared to perform best in the deterministic analysis were further considered in a probabilistic analysis. The clinical effectiveness data from the systematic review (summarised below) were incorporated into the model. In the base-case analysis it was assumed that the underlying risk of disease within the target population was 5%. Costs for treatments and interventions with strategies were derived from the literature review in the UK setting, in particular NHS resources. The mean cost per test for PDD was £1371, WLC £937, CSC £441, cytology £92, NMP22 £39, ImmunoCyt £54 and FISH £55. TURBT cost from £2002 to £2436 depending upon whether it was assisted by WLC or PDD respectively. Additional subsequent treatments were also included, which were based upon those typically adopted within the UK NHS. A cost–utility analysis was not possible as part of the base-case analysis because of a lack of relevant utility data. Hence, cost-effectiveness (life-years, cases of true positives) and cost–consequence analyses were conducted. Sensitivity analyses were conducted to assess the uncertainties in estimates and assumptions.
Results
A total of 27 studies enrolling 2949 participants reported PDD test performance. In the pooled estimates for patient-level analysis, based on direct evidence, PDD had higher sensitivity than WLC (92%, 95% CI 80% to 100% versus 71%, 95% CI 49% to 93%) but lower specificity (57%, 95% CI 36% to 79% versus 72%, 95% CI 47% to 96%). In the pooled estimates for biopsy-level analysis, based on direct evidence, PDD also had higher sensitivity than WLC (93%, 95% CI 90% to 96% versus 65%, 95% CI 55% to 74%) but lower specificity (60%, 95% CI 49% to 71% versus 81%, 95% CI 73% to 90%).
Across studies, the median sensitivities (range) of PDD and WLC for detecting lower risk, less aggressive tumours were broadly similar for patient-level detection [92% (20% to 95%) versus 95% (8% to 100%)], but sensitivity was higher for PDD than for WLC for biopsy-level detection [96% (88% to 100%) versus 88% (74% to 100%)]. However, for the detection of more aggressive, higher risk tumours the median sensitivity of PDD for both patient-level [89% (6% to 100%)]
and biopsy-level [99% (54% to 100%)] detection was higher than those of WLC [56% (0% to 100%) and 67% (0% to 100%) respectively]. The superior sensitivity of PDD was also reflected in the detection of carcinoma in situ (CIS) alone, both for patient-level [83% (41% to 100%) versus 32% (0% to 83%)] and biopsy-level [86% (54% to 100%) versus 50% (0% to 68%)] detection.
Four RCTs enrolling 709 participants comparing PDD with WLC reported effectiveness outcomes. The use of PDD at TURBT resulted in fewer residual tumours at check cystoscopy (pooled estimate RR 0.37, 95% CI 0.20 to 0.69) and longer recurrence-free survival (pooled estimate RR 1.37, 95% CI 1.18 to 1.59) compared with WLC. The advantages of PDD at TURBT in reducing tumour recurrence (pooled estimate RR 0.64, 95% CI 0.39 to 1.06) and progression (pooled estimate RR 0.57, 95% CI 0.22 to 1.46) in the longer term were less clear.
A total of 71 studies reported the performance of biomarkers (FISH, ImmunoCyt, NMP22) and cytology in detecting bladder cancer. In total, 14 studies enrolling 3321 participants reported on FISH, 10 studies enrolling 4199 participants reported on ImmunoCyt, 41 studies enrolling 13,885 participants reported on NMP22 and 56 studies enrolling 22,260 participants reported on cytology. In the pooled estimates, based on indirect evidence, sensitivity was highest for ImmunoCyt and lowest for cytology. FISH (76%, 95% CI 65% to 84%), ImmunoCyt (84%, 95% CI 77% to 91%) and NMP22 (68%, 95% CI 62% to 74%) all had higher sensitivity than cytology (44%, 95% CI 38% to 51%). However, cytology had higher specificity (96%, 95% CI 94% to 98%) than FISH (85%, 95% CI 78% to 92%), ImmunoCyt (75%, 95% CI 68% to 83%) or NMP22 (79%, 95% CI 74% to 84%).
Cost-effectiveness
Although the differences in outcomes and costs between these strategies appear to be small, the decision about which strategy to adopt depends upon society’s willingness to pay for additional gain. The most effective strategy in terms of true positive cases (44) and life-years (11.66) was a strategy of CSC and ImmunoCyt followed by PDD in initial diagnosis and CSC followed by WLC in follow-up. This strategy had, however, an incremental cost per life-year of over £270,000. The least effective strategy was cytology followed by WLC in initial diagnosis and follow-up (total average cost over 20 years = £1403 and average
DOI: 10.3310/hta14040 Health Technology Assessment 2010; Vol. 14: No. 4
© 2010 Queen’s Printer and Controller of HMSO. All rights reserved.
xi
life expectancy = 11.59). This strategy was most likely to be considered cost-effective when society’s willingness to pay was less than £20,000 per life-year. Over most of the ranges of willingness to pay values there appeared to be no strategy that would have a likelihood of being cost-effective more than 50% of the time, but four of the eight strategies included in the probabilistic sensitivity analysis were each associated with an approximately 20% chance of being considered cost-effective. Three of these four strategies involved the use of a biomarker or PDD.
Sensitivity analyses
The sensitivity analyses indicated that the order of the least to the most costly strategies remained the same when discount rates, RR rates and performance of CSC were changed. The results were most sensitive to the pretest probability of disease (5% in the base case). At a 1% probability it is most likely that the least costly (and least effective) strategy of cytology followed by WLC for both diagnosis and follow-up would be cost-effective. At a 20% prevalence the more effective strategies (in terms of diagnostic performance) are more likely to be worth their increased cost.
Discussion
PDD has higher sensitivity (fewer false negatives) than WLC and so will detect cases of bladder cancer missed by WLC, but its lower specificity will result in more false positives. The advantages of PDD’s higher sensitivity in detecting bladder cancer overall, and also more aggressive, higher risk tumours, have to be weighed against the disadvantages of a higher false-positive rate, which leads to additional, unnecessary biopsies of normal tissue being taken and potentially additional unnecessary investigations being carried out and the resulting anxiety caused to patients and their families.
In the four studies reporting effectiveness outcomes, such as tumour recurrence, the administration of single-dose adjuvant chemotherapy following TURBT, which can reduce recurrence rates by up to 50% in the first 2 years, varied, making it difficult to assess what the true added value of PDD might be in reducing recurrence rates in routine practice.
Based on indirect comparisons, all three biomarkers had higher sensitivity, but lower
specificity, than cytology in detecting bladder cancer. A urine biomarker test such as ImmunoCyt could potentially replace some cytology tests if higher sensitivity (fewer false negatives) is considered more important than higher specificity (fewer false positives). However, if higher specificity is considered more important then cytology would remain the test of choice.
Linking diagnostic performance to long-term outcomes required a number of assumptions to be made about the structure of the economic model and its parameters. Some assumptions were based on non-UK study data; it is unclear whether such data are applicable to the UK setting. One assumption concerned starting age and the length of time over which the benefits from a diagnostic strategy may accrue. In the base-case analysis a time period of 20 years and starting age of 67 years were used, although the impact of shorter time horizons and older starting age were explored in the sensitivity analyses. When either the time horizon was reduced or the starting age was increased, the incremental cost per life-year increased as the costs of initial diagnosis and treatments were not offset by survival and life-year gains.
ConclusionsImplications for service provisionPDD has higher sensitivity than WLC in detecting bladder cancer and is better at detecting more aggressive, higher risk tumours, including CIS, but has lower specificity. Based on limited evidence, the use of PDD at TURBT compared with WLC results in fewer residual tumours at check cystoscopy and longer recurrence-free survival, whereas the advantages of PDD at TURBT in reducing tumour recurrence and progression in the longer term are less clear. In the pooled estimates ImmunoCyt had the highest sensitivity and cytology had the highest specificity, with all three biomarkers having higher sensitivity, but lower specificity, than cytology.
Taking into account the assumptions made in the model, the strategy of CSC and ImmunoCyt followed by PDD in initial diagnosis and CSC followed by WLC in follow-up is likely to be the most costly and the most effective (£2370 per patient and 11.66 life-years). There appeared to be no strategy that would have a likelihood of being cost-effective more than 50% of the time over most of the ranges of willingness to pay values. Nevertheless, strategies involving biomarkers and/
Executive summary
xii
or PDD provide additional benefits at a cost that society might be willing to pay. Strategies involving cytology are unlikely to be considered worthwhile. Strategies that replaced WLC with PDD provided more life-years but it is less clear whether they would be worth the extra cost.
Recommendations for research
Further research is required in the following areas:
• RCTs including economic evaluations comparing PDD with rigid WLC at TURBT plus adjuvant immediate single-dose intravesical chemotherapy in patients diagnosed with bladder tumours at CSC.
• Diagnostic cross-sectional studies comparing FISH with ImmunoCyt, NMP22 BladderChek point of care test and voided urine cytology
within the setting of the British Association of Urological Surgeons and the Renal Association diagnostic algorithm for the diagnosis of patients with haematuria. Data produced should be incorporated into an economic evaluation.
• Studies to collect health state utilities are needed. These may come from further prospective studies or as part of future RCTs.
• The trade-off between process of care and short-term (diagnostic outcomes) and longer-term outcomes needs to be explored using recognised preference elicitation methodology in a way that can be incorporated into future economic evaluations.
• The impact that an incorrect diagnosis (false-negative result) has on patients either at diagnosis or at follow-up in terms of future survival, quality of life and costs.
DOI: 10.3310/hta14040 Health Technology Assessment 2010; Vol. 14: No. 4
© 2010 Queen’s Printer and Controller of HMSO. All rights reserved.
1
Description of health problemIntroductionBladder cancer, or more precisely malignant neoplasm of the bladder,1 is a disease in which the cells lining the urinary bladder lose the ability to regulate their growth and start dividing uncontrollably.2 This abnormal growth results in a mass of cells that form a tumour. People with a suspicion of bladder cancer mainly present with urinary symptoms including gross haematuria, microscopic haematuria and urinary tract symptoms. Bladder cancers can be broadly categorised into two main groups depending upon their extent of penetration into the bladder wall: non-muscle invasive and muscle invasive. The majority of diagnosed patients (75–85%) present with non-muscle-invasive disease, which as described in the next subsection is characterised by a probability of recurrence at 5 years from 31% (95% CI 24% to 37%) to 78% (95% CI 73% to 84%) despite treatment.3 The remaining cancers are muscle invasive and/or metastatic.
Aetiology, pathology and prognosis
AetiologyThe aetiology of bladder cancer appears to be multifactorial, with environmental and genetic factors as well as endogenous molecular factors having potential roles. The risk of developing bladder cancer before the age of 75 years is 2–4% for men and 0.5–1% for women.4 Cigarette smoking and specific occupational exposures are the main known risk factors for bladder cancer.5 In Europe it is estimated that up to half of bladder cancer cases in men and one-third of cases in women are caused by cigarette smoking.6,7
Occupational exposure to chemicals in Europe accounts for up to 10% of male bladder cancers. Most carcinogens have a latent period of 15–20 years between exposure and the development of tumours. The proportion may be higher in countries with less well-regulated industrial processes. Bladder cancer has an important place in the history of occupational disease. In
1895, Rehn reported cases of bladder cancer in a German aniline dye factory. It was then recognised that aromatic amines and polycyclic aromatic hydrocarbons, by-products of the catabolic process, were the key aetiological factors. Aromatic amines were widely used in the manufacture of dyes and pigments for textiles, paints, plastics, paper and hair dyes, and in drugs and pesticides and in the rubber industry. In 1953, bladder cancer became a prescribed industrial disease in the UK.8 Occupational studies of hairdressers have produced conflicting results. Within the EU, the Scientific Committee on Cosmetic Products and Non-Food Products aims to set up a ‘high-risk’ permanent and semi-permanent register of hair dye formulations.
Several dietary factors have been related to bladder cancer, but the results of different studies have been controversial. A meta-analysis9 of 38 articles supported the hypothesis that vegetable and fruit intake reduced the risk of bladder cancer. Phenacetin, chlornaphazine and cyclophosphamide also increase the risk of bladder cancer.10 In comparison to other carcinogenic agents, the latency period is relatively short. Acrolein, a metabolite of cyclophosphamide, is responsible for the ninefold increased risk of bladder cancer associated with cyclophosphamide. In addition, chronic infection by Schistosoma haematobium is a cause of squamous cell carcinoma of the bladder. Patients treated with pelvic radiotherapy for cervical and prostate cancers also have an increased risk of developing bladder cancer.11,12
Drug- and carcinogen-metabolising enzymes are important in the processing of lipophilic chemicals to products that are more water-soluble and can be excreted. These enzyme systems are partly controlled by genetic polymorphism. In the liver, chemicals are oxidised by the cytochrome P450 superfamily and detoxified by N-acetylation, predominantly by N-acetyltransferases (NAT). Aromatic amines are usually detoxified by NAT2. NAT2 slow acetylator genotypes are at increased risk of bladder cancer [relative risk (RR) 1.4], and this may be especially true in smokers.13 Approximately 50% of Caucasians and 25% of Asians are slow acetylators. Glutathione S-transferase (GST) is the product of the GSTM1
Chapter 1 Background
Background
2
gene and is involved in the detoxification of polyaromatic hydrocarbons. Approximately 50% of Caucasians and Asians have a homozygous deletion of the GSTM1 gene, which is associated with a RR of 1.4.14 There is no clear evidence that the underlying pathogenesis of bladder cancer differs by gender.10
PathologyBladder cancer is a disease in which the cells lining the urinary bladder lose the ability to regulate their growth and start dividing uncontrollably. This abnormal growth results in a mass of cells that form a tumour. The most common type of bladder cancer is transitional cell carcinoma (TCC), which accounts for more than 90% of bladder cancers in the UK; other forms of bladder cancer include squamous carcinoma, adenocarcinoma (urachal and non-urachal), small cell carcinoma, sarcoma
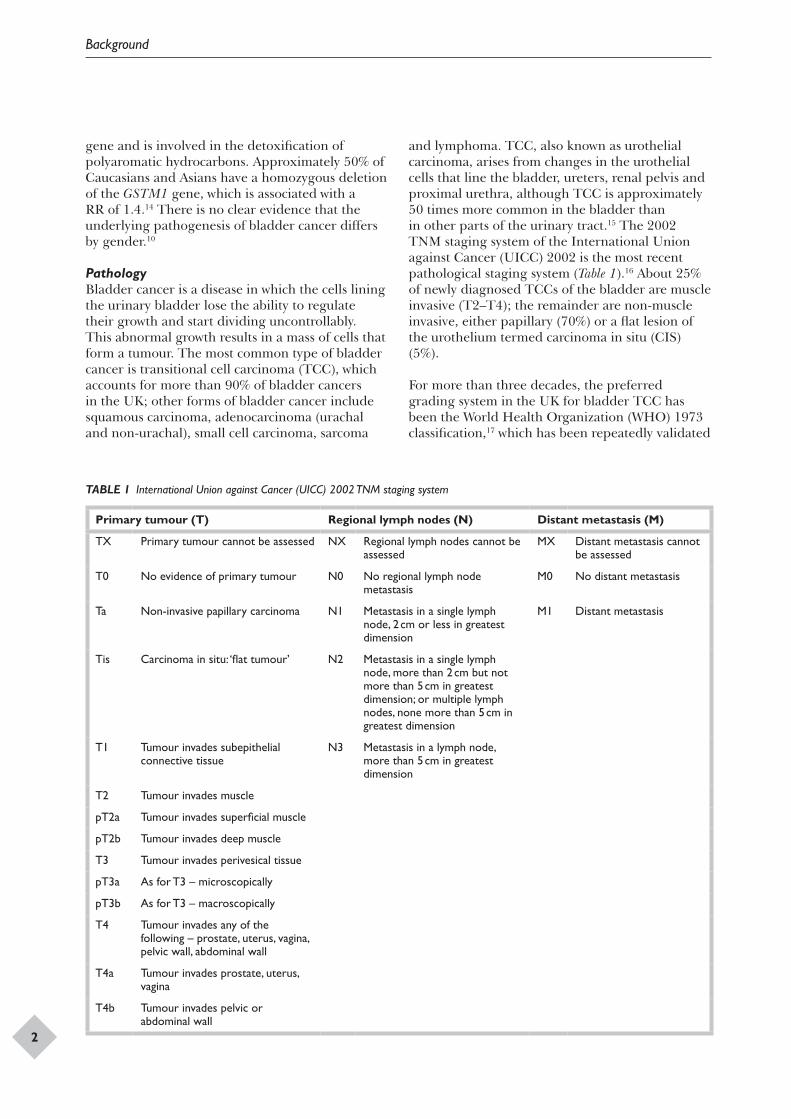
and lymphoma. TCC, also known as urothelial carcinoma, arises from changes in the urothelial cells that line the bladder, ureters, renal pelvis and proximal urethra, although TCC is approximately 50 times more common in the bladder than in other parts of the urinary tract.15 The 2002 TNM staging system of the International Union against Cancer (UICC) 2002 is the most recent pathological staging system (Table 1).16 About 25% of newly diagnosed TCCs of the bladder are muscle invasive (T2–T4); the remainder are non-muscle invasive, either papillary (70%) or a flat lesion of the urothelium termed carcinoma in situ (CIS) (5%).
For more than three decades, the preferred grading system in the UK for bladder TCC has been the World Health Organization (WHO) 1973 classification,17 which has been repeatedly validated
TABLE 1 International Union against Cancer (UICC) 2002 TNM staging system
Primary tumour (T) Regional lymph nodes (N) Distant metastasis (M)
TX Primary tumour cannot be assessed NX Regional lymph nodes cannot be assessed
MX Distant metastasis cannot be assessed
T0 No evidence of primary tumour N0 No regional lymph node metastasis
M0 No distant metastasis
Ta Non-invasive papillary carcinoma N1 Metastasis in a single lymph node, 2 cm or less in greatest dimension
M1 Distant metastasis
Tis Carcinoma in situ: ‘flat tumour’ N2 Metastasis in a single lymph node, more than 2 cm but not more than 5 cm in greatest dimension; or multiple lymph nodes, none more than 5 cm in greatest dimension
T1 Tumour invades subepithelial connective tissue
N3 Metastasis in a lymph node, more than 5 cm in greatest dimension
T2 Tumour invades muscle
pT2a Tumour invades superficial muscle
pT2b Tumour invades deep muscle
T3 Tumour invades perivesical tissue
pT3a As for T3 – microscopically
pT3b As for T3 – macroscopically
T4 Tumour invades any of the following – prostate, uterus, vagina, pelvic wall, abdominal wall
T4a Tumour invades prostate, uterus, vagina
T4b Tumour invades pelvic or abdominal wall
DOI: 10.3310/hta14040 Health Technology Assessment 2010; Vol. 14: No. 4
© 2010 Queen’s Printer and Controller of HMSO. All rights reserved.
3
and shown to be of clinical relevance for treatment and prognosis. WHO 1973 divides TCC into three grades on the basis of cytological and architectural disorder, grade 1 being well differentiated, grade 2 moderately differentiated and grade 3 poorly differentiated. WHO 2004 is the latest version of the bladder TCC classification. Current reporting guidelines recommend providing the urologist with both classifications. The main differences are two grades of carcinoma (high grade and low grade) and the introduction of the term papillary urothelial neoplasm of low malignant potential (PUNLMP) to replace the best differentiated grade 1 tumours, avoiding the term carcinoma. However, there has been considerable resistance in the UK to adopting the WHO 2004 classification, which was not prospectively validated before its introduction and which has subsequently not demonstrated either improved reproducibility or clinical relevance over WHO 1973.18 In this report we will therefore only quote the WHO 1973 classification.
PrognosisThe natural history of treated non-muscle-invasive bladder cancer (Ta/T1/CIS), a group of heterogeneous cancers, can be summarised as any of the following:
• no further recurrence• local recurrence, which can occur on a single
occasion or on multiple occasions; it can involve single or multiple tumour recurrences, but recurrent tumours are usually of the same stage and grade as the primary tumour
• local progression – an increase in local stage over time to muscle invasion or the appearance of distant metastases and subsequent death.
On average, non-muscle-invasive bladder cancer has a probability of recurrence at 5 years from 31% (95% CI 24% to 37%) to 78% (95% CI 73% to 84%) and of progression of between 0.8% (95% CI 0% to 1.7%) and 45% (95% CI 35% to 55%) after initial treatment.3 The rates of recurrence and progression vary depending upon the stage, grade and number of tumours at the time of first presentation. Of the newly diagnosed non-muscle-invasive bladder tumours, approximately 30% are multifocal at presentation. There is little information on the predictive role of environmental and genetic risk factors on tumour recurrence, progression and mortality. Tumours are most likely to recur within 5 years after transurethral resection of bladder tumour (TURBT),19 and therefore patients are closely monitored for recurrence following their initial presentation and treatment. According
to the European Organisation for Research and Treatment of Cancer (EORTC), the risk factors relating to recurrence and progression include the number of tumours present at diagnosis, the recurrence rate in the previous period, the tumour size (larger tumours being associated with greater risk), stage, grade and the presence of concomitant CIS.20 The poor prognosis of T1G3 TCC is well described; 50% progression rate if associated with concomitant CIS.21 If primary CIS is diffuse, 50% of these patients die of metastatic TCC within a year or two if maintenance intravesical immunotherapy with bacillus Calmette–Guerin (BCG) is not instituted. Once the tumour has invaded the detrusor muscle, 50% of patients have occult metastatic disease at presentation.
Epidemiology
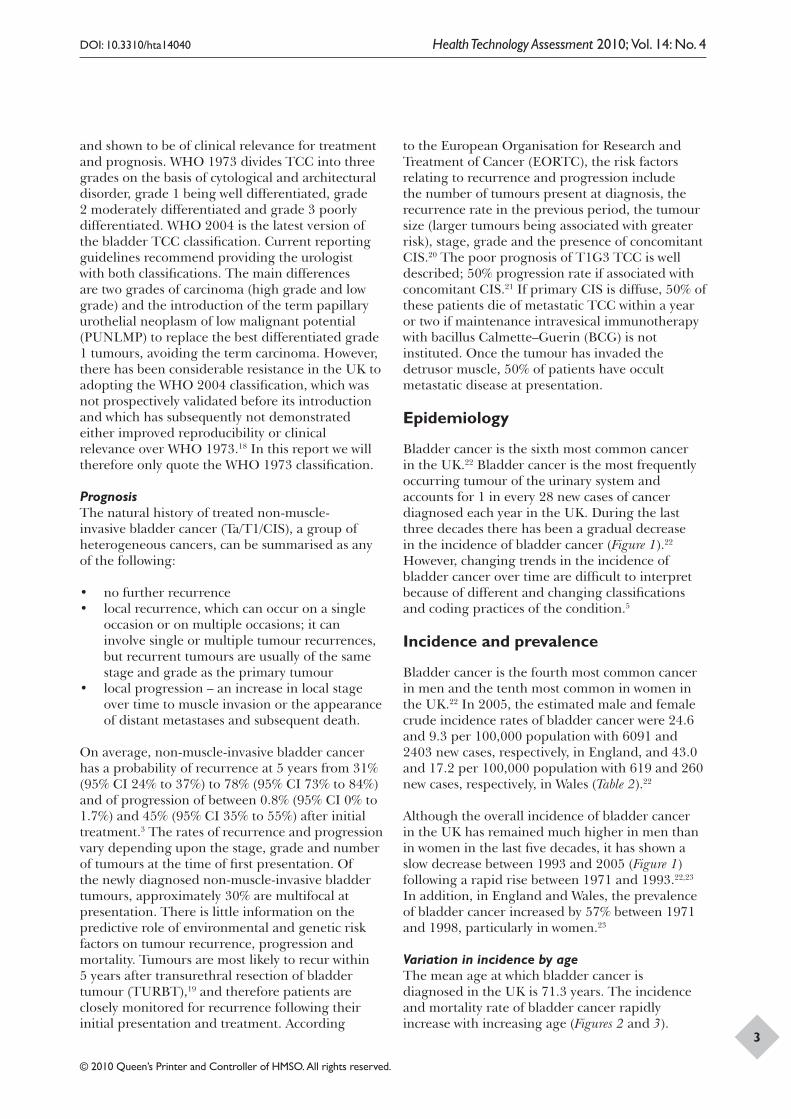
Bladder cancer is the sixth most common cancer in the UK.22 Bladder cancer is the most frequently occurring tumour of the urinary system and accounts for 1 in every 28 new cases of cancer diagnosed each year in the UK. During the last three decades there has been a gradual decrease in the incidence of bladder cancer (Figure 1).22 However, changing trends in the incidence of bladder cancer over time are difficult to interpret because of different and changing classifications and coding practices of the condition.5
Incidence and prevalence
Bladder cancer is the fourth most common cancer in men and the tenth most common in women in the UK.22 In 2005, the estimated male and female crude incidence rates of bladder cancer were 24.6 and 9.3 per 100,000 population with 6091 and 2403 new cases, respectively, in England, and 43.0 and 17.2 per 100,000 population with 619 and 260 new cases, respectively, in Wales (Table 2).22
Although the overall incidence of bladder cancer in the UK has remained much higher in men than in women in the last five decades, it has shown a slow decrease between 1993 and 2005 (Figure 1) following a rapid rise between 1971 and 1993.22,23 In addition, in England and Wales, the prevalence of bladder cancer increased by 57% between 1971 and 1998, particularly in women.23
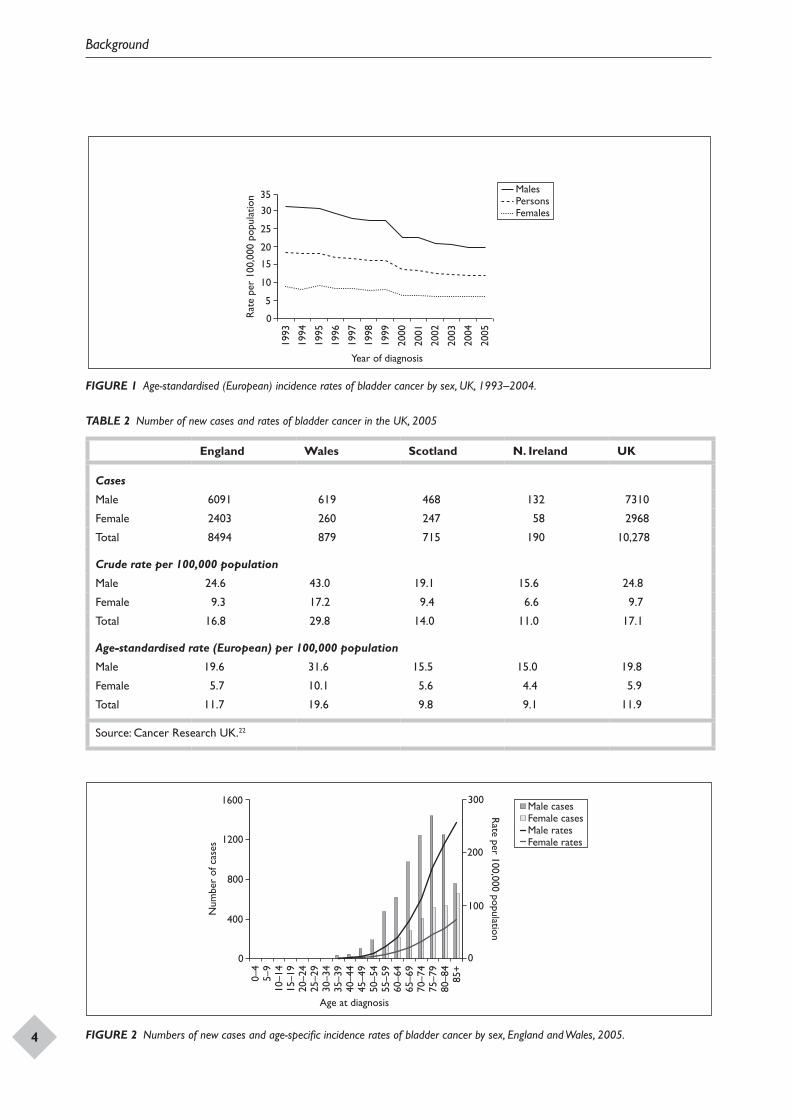
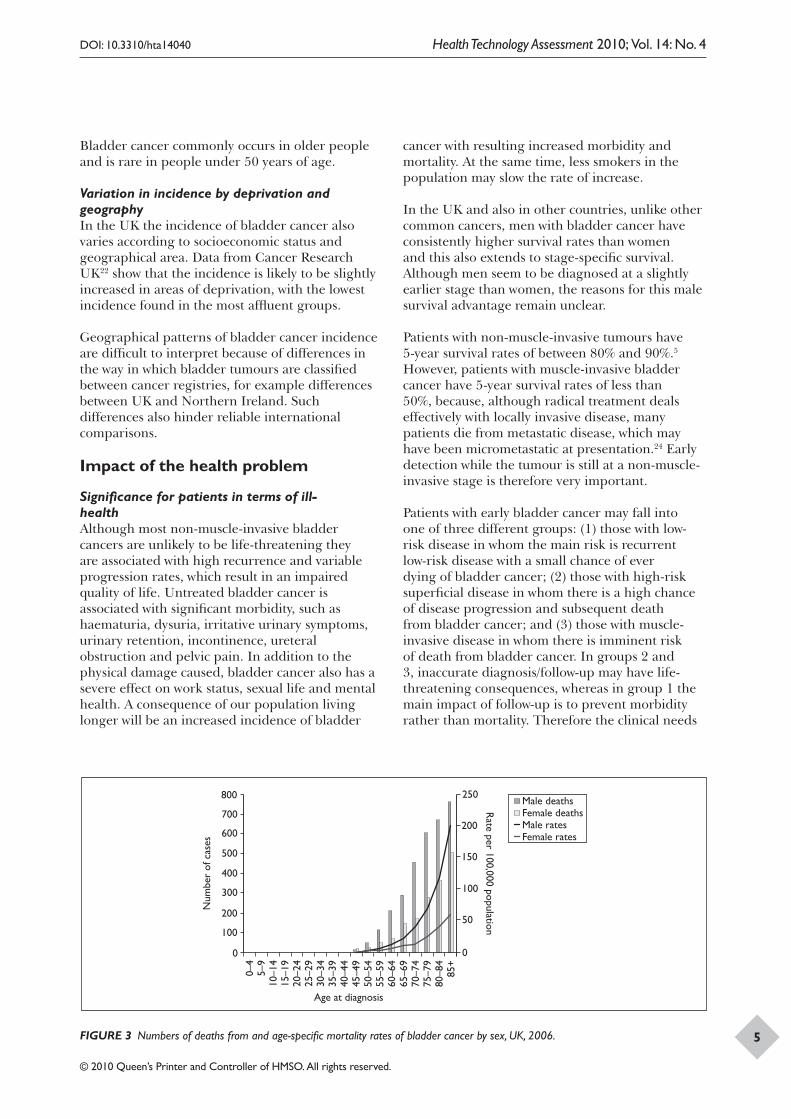
Variation in incidence by ageThe mean age at which bladder cancer is diagnosed in the UK is 71.3 years. The incidence and mortality rate of bladder cancer rapidly increase with increasing age (Figures 2 and 3).
Background
4
Rat
e pe
r 10
0,00
0 po
pula
tion
Year of diagnosis
MalesPersonsFemales
1993
1994
1995
1996
1997
1998
1999
2000
2001
2002
2003
2004
2005
0
5
10
15
20
25
30
35
FIGURE 1 Age-standardised (European) incidence rates of bladder cancer by sex, UK, 1993–2004.
TABLE 2 Number of new cases and rates of bladder cancer in the UK, 2005
England Wales Scotland N. Ireland UK
Cases
Male 6091 619 468 132 7310
Female 2403 260 247 58 2968
Total 8494 879 715 190 10,278
Crude rate per 100,000 population
Male 24.6 43.0 19.1 15.6 24.8
Female 9.3 17.2 9.4 6.6 9.7
Total 16.8 29.8 14.0 11.0 17.1
Age-standardised rate (European) per 100,000 population
Male 19.6 31.6 15.5 15.0 19.8
Female 5.7 10.1 5.6 4.4 5.9
Total 11.7 19.6 9.8 9.1 11.9
Source: Cancer Research UK.22
Num
ber
of c
ases
Age at diagnosis
Male casesFemale casesMale ratesFemale rates
0–4
5–9
10–1
415
–19
20–2
425
–29
30–3
435
–39
40–4
445
–49
50–5
455
–59
60–6
465
–69
70–7
475
–79
80–8
485
+
0
400
800
Rate per 100,000 population
200
300
100
0
1200
1600
FIGURE 2 Numbers of new cases and age-specific incidence rates of bladder cancer by sex, England and Wales, 2005.
DOI: 10.3310/hta14040 Health Technology Assessment 2010; Vol. 14: No. 4
© 2010 Queen’s Printer and Controller of HMSO. All rights reserved.
5
Bladder cancer commonly occurs in older people and is rare in people under 50 years of age.
Variation in incidence by deprivation and geographyIn the UK the incidence of bladder cancer also varies according to socioeconomic status and geographical area. Data from Cancer Research UK22 show that the incidence is likely to be slightly increased in areas of deprivation, with the lowest incidence found in the most affluent groups.
Geographical patterns of bladder cancer incidence are difficult to interpret because of differences in the way in which bladder tumours are classified between cancer registries, for example differences between UK and Northern Ireland. Such differences also hinder reliable international comparisons.
Impact of the health problem
Significance for patients in terms of ill-healthAlthough most non-muscle-invasive bladder cancers are unlikely to be life-threatening they are associated with high recurrence and variable progression rates, which result in an impaired quality of life. Untreated bladder cancer is associated with significant morbidity, such as haematuria, dysuria, irritative urinary symptoms, urinary retention, incontinence, ureteral obstruction and pelvic pain. In addition to the physical damage caused, bladder cancer also has a severe effect on work status, sexual life and mental health. A consequence of our population living longer will be an increased incidence of bladder
cancer with resulting increased morbidity and mortality. At the same time, less smokers in the population may slow the rate of increase.
In the UK and also in other countries, unlike other common cancers, men with bladder cancer have consistently higher survival rates than women and this also extends to stage-specific survival. Although men seem to be diagnosed at a slightly earlier stage than women, the reasons for this male survival advantage remain unclear.
Patients with non-muscle-invasive tumours have 5-year survival rates of between 80% and 90%.5 However, patients with muscle-invasive bladder cancer have 5-year survival rates of less than 50%, because, although radical treatment deals effectively with locally invasive disease, many patients die from metastatic disease, which may have been micrometastatic at presentation.24 Early detection while the tumour is still at a non-muscle-invasive stage is therefore very important.
Patients with early bladder cancer may fall into one of three different groups: (1) those with low-risk disease in whom the main risk is recurrent low-risk disease with a small chance of ever dying of bladder cancer; (2) those with high-risk superficial disease in whom there is a high chance of disease progression and subsequent death from bladder cancer; and (3) those with muscle-invasive disease in whom there is imminent risk of death from bladder cancer. In groups 2 and 3, inaccurate diagnosis/follow-up may have life-threatening consequences, whereas in group 1 the main impact of follow-up is to prevent morbidity rather than mortality. Therefore the clinical needs
Num
ber
of c
ases
Age at diagnosis
Male deathsFemale deathsMale ratesFemale rates
0–4
5–9
10–1
415
–19
20–2
425
–29
30–3
435
–39
40–4
445
–49
50–5
455
–59
60–6
465
–69
70–7
475
–79
80–8
485
+
0
100
200
300
400
500
Rate per 100,000 population
150
200
250
100
50
0
600
700
800
FIGURE 3 Numbers of deaths from and age-specific mortality rates of bladder cancer by sex, UK, 2006.
Background
6
of these groups differ with respect to diagnostic performance.
Significance for the NHSBladder cancer is considered to be the most expensive cancer in terms of lifetime and treatment costs because of the high recurrence rates. A higher incidence of non-muscle-invasive disease, longer survival requiring lifelong surveillance and treatment of recurrences are some of the reasons for the higher cost of non-muscle-invasive disease compared with muscle-invasive bladder cancers. However, annual research fund allocation for bladder cancer from the National Cancer Research Institute (NCRI) UK is less than those for other cancers.
Current service provisionDiagnosisHaematuria is presence of blood in the urine and is the most common symptom of bladder cancer. Bladder cancer is detected in approximately 10% of patients with gross haematuria and 3–5% of those with microscopic haematuria aged over 40 years.25,26 Less commonly, individuals may note disturbance in their urinary habits including complaints of dysuria (painful urination), increased frequency, urgency of urination, failed attempts to urinate and urinary tract infection. These symptoms can raise suspicion of diffuse CIS. Other symptoms that may be attributed to a mass in the bladder or ureteral obstruction are likely to indicate that bladder cancer may be muscle-invasive disease.5,24,27
History, physical examination and radiologyThe clinical workup for potential bladder cancer should start with a history and a complete physical examination with careful attention to potential risk factors, such as the patient’s smoking history and occupation. Clinicians must look for cancer in all areas of the urinary tract. Most haematuria clinics in the UK perform an ultrasound of the upper tracts and kidney, ureter and bladder radiography. In some centres, intravenous pyelography (IVP) is also performed routinely; in others, computerised tomography (CT) urography has replaced ultrasound and IVP in this setting.
Cystoscopy and pathologyIn many centres, voided urine for cytological analysis is usually collected before flexible cystoscopy. Flexible cystoscopy is an invasive
procedure in which an endoscope is passed within the urethra, prelubricated with local anaesthetic gel. Its purpose is to evaluate the urethra and to look for tumours and irregularities in the bladder such as red patches (which may prove to be CIS on biopsy), diverticula and trabeculations. A urine culture should be performed if dipstick analysis suggests a urinary tract infection.
Transurethral resection and/or biopsyIf a bladder tumour is identified on flexible cystoscopy, arrangements are made for the patient to return as an inpatient for TURBT and/or biopsy under general anaesthesia. Depending on the location of the tumour, resection may be aided on occasion by muscle paralysis to avoid complications arising from an obturator nerve jerk. The exophytic tumour is first resected and then a separate deep resection is obtained. Both specimens are sent separately for histological assessment. Biopsies of any red areas may also be taken and submitted for analysis. Haemostasis is then achieved by using a rollerball electrode followed by insertion of an irrigating catheter. As part of clinical staging, a bimanual examination is performed to identify if there is a residual mass at the end of the procedure. If a mass is detected, it is noted whether it is mobile (clinical T3) or fixed (clinical T4).
Imaging techniquesIf bladder cancer is detected, accurate disease staging and grading are critical. There is much debate over the role of imaging techniques, such as magnetic resonance imaging (MRI) and CT, in the staging of bladder cancer.27 A staging CT scan of chest, abdomen and pelvis and/or MRI of pelvis are therefore not usually performed in patients with papillary non-muscle-invasive TCC. The role of CT in patients with muscle-invasive disease is primarily to provide extra information on local staging, lymph node status and visceral metastases. The primary role of MRI in patients with muscle-invasive TCC is to provide further information on local stage.
Management of disease
The management of non-muscle-invasive bladder cancer is based on: (1) the pathological findings of the biopsy specimen, with attention to histological type, grade and depth of invasion; (2) the presence of associated CIS; (3) the number of tumours; (4) previous recurrence rate if applicable; and (5) size of tumour. Depending on these findings, treatment options include cystoscopic follow-up only (either flexible or rigid cystoscopy under general
DOI: 10.3310/hta14040 Health Technology Assessment 2010; Vol. 14: No. 4
© 2010 Queen’s Printer and Controller of HMSO. All rights reserved.
7
anaesthesia), cystoscopic follow-up and intravesical chemotherapy and immunotherapy courses or radical cystectomy.
The goals of current treatment for patients with non-muscle-invasive bladder cancer are to prevent disease recurrence or progression to muscle-invasive disease to avoid loss of the bladder and, ultimately, to enhance survival. The current treatment strategies for patients with bladder cancer depend on three main types of bladder cancer, non-muscle-invasive disease, muscle-invasive disease and metastases, as recommended in the multidisciplinary team (MDT) guideline.28
Non-muscle-invasive diseaseInitial treatment• TURBT of all malignant tissue is the
recommended primary treatment for non-muscle-invasive disease and should be followed as soon as possible (ideally within 6 hours, otherwise within 24 hours) by a single instillation of intravesical chemotherapy.
• Tumours should then be assessed depending on stage, grade, size, multiplicity and the presence of recurrence at cystoscopy after 3 months: – low risk – patients at low risk of recurrence
and progression have TaG1 TCC or solitary T1G1 TCC
– intermediate risk – those at intermediate risk have TaG2 TCC or multifocal T1G1 TCC
– high risk – broadly speaking, patients with Ta/T1G3 TCC, CIS or multifocal T1G2 TCC are classified as being at high risk of not only recurrence but also progression.
Follow-up of low- and intermediate-risk non-muscle-invasive bladder cancerFollow-up of non-muscle-invasive disease is by cystoscopy, the frequency and duration of follow-up depending on the risk at presentation and the presence of recurrences. Multiplicity at presentation and a tumour recurrence at 3 months have consistently been shown to be key practical predictors of future recurrence, and so many urologists in the UK tailor their cystoscopic follow-up of low- and intermediate-risk patients based on these two factors:
(a) If patients have a solitary tumour at diagnosis and no tumour recurrence at 3 months they are then followed up at 9 months and then annually for 4 further years. If at the end of this 5-year follow-up period they have
remained tumour free they are discharged. During the follow-up visits patients undergo flexible cystoscopy and in some centres cytology and/or biomarker tests. Not all patients with a tumour recurrence will receive TURBT; some may have a cystodiathermy and biopsy.
(b) Patients with multiple tumours at presentation and no recurrence at 3 months or a solitary tumour at presentation with recurrence at 3 months need more intense follow-up and are followed up every 3 months for the first year and annually if they remain tumour free until 10 years and are then discharged. During the follow-up visits patients undergo cystoscopy and in some centres cytology and/or biomarker tests. Those who present with a tumour at the follow-up visit undergo either TURBT or cystodiathermy and biopsy. These patients may be considered for a course of six intravesical instillations of mitomycin C or epirubicin.
(c) Patients with multiple tumours at presentation and recurrence at 3 months have the highest risk of recurrence and are followed up every 3 months for the first 2 years and then annually thereafter. They are usually offered a course of six intravesical instillations of mitomycin C or epirubicin. Those who present with a tumour at follow-up visits undergo either TURBT or cystodiathermy and biopsy. During the follow-up visits patients undergo cystoscopy and in some centres cytology and/or biomarker tests. Cystoscopies in the first 2 years are usually under general anaesthesia using a rigid cystoscope.29
Follow-up of high-risk non-muscle-invasive bladder cancerIf diagnosed with T1G3 TCC, patients are offered an early re-resection to ensure that the tumour is not muscle invasive. All patients in this group are usually offered an induction course of six intravesical BCG instillations followed by a maintenance regimen of a further 21 instillations over a 3-year period. Some may opt for primary radical cystectomy. Patients who opt for bladder sparing undergo their first bladder check at 3 months. If they remain tumour free they are followed up every 3 months for the first 2 years and then every 6 months thereafter. During the follow-up visits patients undergo cystoscopy and in some centres cytology and/or biomarker tests. Patients found to have a non-muscle-invasive recurrence at 3 months have four options: they can undergo cystectomy, have a second induction course of BCG
Background
8
and then reassess, have three further instillations of BCG and then reassess, or have endoscopic control.
Muscle-invasive diseaseInitial treatmentOnce again, initial treatment comprises TURBT. If muscle invasion is confirmed on histological analysis, patients undergo CT of the chest, abdomen and pelvis and in some centres MRI scanning of the pelvis. In the absence of metastatic disease and other significant comorbidity, treatment options for patients with muscle-invasive disease include radical cystectomy with ileal conduit formation, radical cystectomy with formation of a neobladder, or radical radiotherapy. Neoadjuvant systemic chemotherapy is usually recommended before radical cystectomy or radiotherapy.
Follow-up• Follow-up after radiotherapy is by regular
(usually 6-monthly) cystoscopy. The first check cystoscopy is usually performed at about 4 months post completion of radiotherapy.
• Follow-up after cystectomy is by clinical assessment and CT scanning.
• A CT scan should be performed (at around 6 months following surgery for most patients) to assess for lymph or local recurrence. Subsequent CT scanning may be required in some cases but need not be carried out routinely.
• Non-muscle-invasive recurrences are dealt with endoscopically. Intravesical chemotherapy or BCG should be considered if recurrences are multiple or frequent.
• Non-muscle-invasive recurrences after radiotherapy are dealt with endoscopically. Intravesical chemotherapy, or in advanced cases salvage cystectomy, should be considered.
• Muscle-invasive recurrences after radiotherapy are best dealt with by salvage cystectomy if the patient’s condition allows (in other cases chemotherapy may be appropriate).
• Recurrence after cystectomy may be treated with radiotherapy or chemotherapy.
Metastatic diseaseRadiotherapy can provide effective palliation for symptoms of locally advanced disease such as haematuria. Chemotherapy may be appropriate in cases of metastatic disease in which the patient has a good performance status and renal function. Treatment is purely palliative and should be selected according to the patient’s needs but may include systemic chemotherapy
with GC (gemcitabine and cisplatin) or MVAC (methotrexate, vinblastine, adriamycin, cisplatin). Combinations with cisplatin are more effective than those without.30,31 Gemcitabine plus cisplatin has equivalent survival to MVAC but is much less toxic.
Non-transitional cell carcinoma bladder cancerCareful case-by-case management of non-TCC bladder cancer patients is required including discussion by the specialist MDT. Specialist histopathological review may be required, with consideration to the fact that the primary tumour may not be arising from the bladder.
Current service cost
It is difficult to estimate the current bladder cancer service cost in the UK because of the variation in practice in the diagnosis and follow-up of patients based on their risk categorisation. It is anticipated that the costs of the higher risk patients will be greater than those of the low-risk patients because of more follow-up interventions. The total cost of treatment and 5-year follow-up of patients with bladder cancer diagnosed during 2001–2 was £55.39 million; the total cost of superficial disease was £35.25 million and that of invasive disease was £20.2 million. The total cost for patients undergoing radical radiotherapy was over twice that for those undergoing cystectomy (£8.1 versus £3.6 million)32 In the USA it is estimated that $1.7 billion is spent on bladder cancer.33
An estimate of the current cost to the UK NHS can be generated by using the total cost of each strategy (see Tables 39 and 42) and combining it with the values in Table 2. If it assumed that the current practice for diagnosis in the UK is flexible cystoscopy and cytology for initial diagnosis followed by white light rigid cystoscopy [CSC_CTL_WLC (CSC_WLC)] the cost per low-risk patient will be £6302.25. Therefore the total annual cost to the NHS will be £64,765,481. There is also evidence that costs are likely to increase with improved survival because patients need several courses of treatment.
Variation in services and/or uncertainty about best practice
All urology departments offer haematuria clinics and subsequent TURBT if appropriate either in the same hospital or in a hub hospital. Radiotherapy and systemic chemotherapy are available in cancer centres. Radical surgery for
DOI: 10.3310/hta14040 Health Technology Assessment 2010; Vol. 14: No. 4
© 2010 Queen’s Printer and Controller of HMSO. All rights reserved.
9
prostate and bladder cancer should be provided by teams carrying out a cumulative total of at least 50 such operations per annum. These procedures should be performed by surgeons performing at least five of either radical cystectomy or prostatectomy each year.34
Relevant national guidelines, including National Service FrameworksThe relevant national guidelines are:
• National Institute for Clinical Excellence (2002). Improving outcomes in urological cancers. NHS guidance on cancer services34
• National Institute for Clinical Excellence (2003). Laparoscopic cystectomy of the urinary bladder. IPG02635
• Scottish Intercollegiate Guidelines Network (SIGN) (2005). Management of transitional cell carcinoma of the bladder36
• National Institute for Health and Clinical Excellence (2007). Intravesical microwave hyperthermia with intravesical chemotherapy for superficial bladder cancer. IPG23537
• NHS Pan-Birmingham Cancer Network (2006/2007). Guidelines for the management of bladder cancer38
• UK National Screening Committee (NSC) (2002). Evaluation of urinary tract malignancy (bladder cancer) screening against NSC criteria39
• British Association of Urological Surgeons (BAUS) Section of Oncology and Uro-oncology Group (2007). MDT (multi-disciplinary team) guidance for managing bladder cancer28
• European Association of Urology (EAU) (2009). Guidelines on TaT1 (non-muscle-invasive) bladder cancer3
• European Association of Urology (EAU) (2009). Guidelines on bladder cancer: muscle invasive and metastatic40
• American National Comprehensive Cancer Network (NCCN) (2009). NCCN clinical practice guidelines in oncology. Bladder cancer including upper tract tumours and urothelial carcinoma of the prostate24
• American Urological Association (AUA) (2007). Guideline for the management of nonmuscle invasive bladder cancer (stages Ta,T1 and Tis).5
Only two of the above guidelines specifically mention photodynamic diagnosis (PDD):
The evidence suggests potential benefits from photodynamic techniques for patients with superficial bladder cancer undergoing initial
resection of their tumour. Its role in patients developing recurrence during followup is less clear.
SIGN (2005)36
The benefit of fluorescence-guided TURBT for recurrence-free survival was shown in several small randomised clinical trials, but its value remains to be proven in improving the outcome of patients for progression rates or survival. The additional costs of the equipment should be considered.
EAU (2009)3
Various guidelines, including those of the EAU and AUA, recommend the use of voided urinary cytology, both in the diagnosis and surveillance of non-muscle-invasive bladder carcinoma. However, there are no equivalent recommendations for the use of biomarkers. Although the international consensus panel on the use of biomarkers in bladder cancer realised the importance of non-invasive diagnosis and surveillance of non-muscle-invasive disease, it concluded that, although none of the non-invasive tests could replace cystoscopy, many markers together with cystoscopy could improve the current practice of managing patients with bladder cancer.41
Description of the technologies under assessmentSummary of interventionsPhotodynamic diagnosis
PrinciplesFluorescenceFluorescence occurs when a molecule absorbs one colour of light and emits another colour. Essentially, photons of light are absorbed by tissue and excite electrons in the tissue. The electron then returns to its resting state and the photon is emitted with less energy, i.e. longer wavelength, resulting in a different colour emission. Fluorescence cystoscopy is based on the principle that specific fluorochromes have increased affinity for neoplastic tissue compared with normal urothelium. When light of an appropriate wavelength is used to look at the surface of bladder to which the fluorochrome has been applied, different signal intensities are given off by neoplastic and non-neoplastic tissue. To minimise autofluorescence from cellular components such as collagen, a longpass eye filter is needed. A
Background
10
filter allowing only wavelengths > 600 nm would be ideal, but this would result in the image being very dark. A compromise is therefore to use a 450-nm yellow filter and therefore accept some autofluorescence. This does not affect colour reproduction in the white light mode.
Over the last 40 years, several agents have been evaluated for their ability to improve visualisation of urothelial cancer. These include tetracyclines, fluorescein, methylene blue and synthetic porphyrin compounds. However, these have been abandoned because of several side effects, including cutaneous toxicity lasting several weeks with synthetic porphyrins.
Photosensitisers5-Aminolaevulinic acid-mediated fluorescence cystoscopy A major breakthrough was the discovery that 5-aminolaevulinic acid (5-ALA), in a suitable dose, could be safely applied to the bladder surface and permit detection of tumours by fluorescence without serious adverse effects. 5-ALA is an initial substrate of heme biosynthesis. Exogenous application of 5-ALA induces an accumulation of fluorescent porphyrins, predominantly protoporphyrin IX (PPIX), in epithelial tissue. Using a blue–violet light with a wavelength of 450 nm, PPIX appears as fluorescent red whereas normal urothelium appears blue. This is because PPIX accumulates up to 10 times more in neoplastic cells than in normal tissue. The mechanism of accumulation of fluorescent PPIX in urothelial cancer is unclear. Several theories, including a difference in the metabolic rate of neoplastic tissue, hyperproliferation and inflammation-induced increased permeability to ALA, have been proposed. These are supported by the observations that increased PPIX can be detected in urothelial hyperplasia, inflammation and granulation tissue. 5-ALA is usually administered intravesically 2–3 hours before cystoscopy at a dose of 1.5 g. The procedure requires special endoscopes and a specific light source (D-lightTM, Karl Storz).
Hexaminolaevulinate-mediated fluorescence cystoscopy 5-ALA absorption is limited because of its positive electric charge. The esterification of 5-ALA as hexylester aminolaevulinate makes ALA more lipophilic, which enables it to cross the cell membrane more easily. A consequence of this is more rapid cellular uptake and higher fluorescence than with ALA.42 Hexaminolaevulinate (HAL) needs therefore only be administered 1 hour before cystoscopy and the dose is typically a
85-mg solution of HAL hydrochloride in 50 ml of phosphate buffered saline (Hexvix®).
Hypericin-mediated fluorescence cystoscopy Recently, hypericin has been proposed as an additional photosensitiser. Hypericin consists of a hydroxylated phenanthroperylenequinone that is extracted from the Hypericum perforatum plant, which is present in St John’s wort. Within an organic solution, hypericin produces an intense, prolonged, red fluorescence signal. This is because its pigment produces single oxygen species upon exposure to light of an appropriate wavelength. Most studies have used hypericin at a concentration of 8 μmol/l and instilled it 1–2 hours before cystoscopy.
ProcedureBefore TURBT, a 12F LoFric or two-way urethral catheter is inserted by a nurse on the ward and intravesical photosensitiser instilled. The catheter is removed immediately. In theatre, under general or spinal anesthesia, the bladder is first inspected using white light rigid cystoscopy. The bladder is then reinspected using blue–violet light. Normal-appearing bladder should appear blue. Normal-appearing bladder neck and/or prostate appear red because of tangential views that cause them to be artefactually red. This, however, acts as a useful positive control. Within the bladder, any red areas are considered to be suspicious and require biopsy.
The bladder tumour is then resected in white light. A further inspection of the bladder with blue–violet light will then identify any residual tumour that may have been missed on WLC.
Equipment• Photosensitiser, e.g. 5-ALA, HAL, hypericin.• Rigid cystoscope with longpass yellow filter for
wavelengths > 450 nm.• Fluid light cable – this blocks residual infrared
light and lowers intrinsic autofluorescence; however, a disadvantage is that it cannot be autoclaved.
• Switchable bandpass filter – this enables the surgeon to interchange between white light and blue–violet light without changing cystoscopes.
• Xenon lamp – powerful, especially in the blue light spectra.
• Camera controller.• Video monitor.• Colour charge-coupled device (CCD) camera
(on chip integration) – this is suitable for working in low light conditions. The
DOI: 10.3310/hta14040 Health Technology Assessment 2010; Vol. 14: No. 4
© 2010 Queen’s Printer and Controller of HMSO. All rights reserved.
11
fluorescent image is 10 times less intense than white light; allows increased red light intensity.
• Beam splitter cube.
Extra personnel involvedUnlike white light cystoscopy, PDD requires the instillation of a photosensitiser via a urethral catheter before TURBT. This is usually performed by a nurse on the ward.
Procedure time compared with conventional cystoscopyOn the ward, catheterisation and instillation of the photosensitiser and then removal of the catheter takes about 15 minutes. In theatre, fluorescence-guided TURBT takes an extra 10 minutes compared with conventional white light TURBT alone.
Urinary biomarkersUrinary biomarkers are molecular substances that can be objectively measured in urine and evaluated as indicators of physiological or disease processes in the urinary tract or in various systems of the body. In principle, this could act as a source of vital information for diagnosis, prognosis and predicting response to therapies. The explosion of interest in urinary biomarker research, in particular related to bladder cancer, is driven by the fact that there is a lack of non-invasive methods of diagnosis and disease surveillance. The current standard of care – endoscopic inspection of the inside of the urinary bladder – is not only invasive but can also miss up to 10% of bladder tumours.43 The urinary measurement of biomarkers could provide a diagnostic means that could either complement cystoscopy to enhance its performance or replace it as a mode of diagnosis and surveillance.
From a methodological perspective, urinary markers fall into a few broad groups, in particular soluble urinary proteins, cell-based biomarkers and nucleic acid biomarkers. As a complete review of each specific biomarker is beyond the scope of this chapter, the present study focused on four urinary biomarkers approved by the US Food and Drug Administration (FDA) for clinical use in urological practice. These are urinary cytology, nuclear matrix protein (NMP22), fluorescence in situ hybridisation (FISH) and ImmunoCyt.
Place of biomarkers in the treatment pathwayThere are several potential strategies worth considering aimed at making use of urinary
biomarkers in the care pathways of bladder cancer. They could be used:
• Alone or as an adjunct to urinary cytology to improve the detection rate of cancer in high-risk populations.
• To provide a less expensive and more objective alternative to the urinary cytology test.
• To replace or supplement direct cystoscopic surveillance of non-muscle-invasive bladder cancer. They may also serve to decrease the number of invasive procedures, provided that adequate cancer control is maintained on follow-up, and thereby reduce the health-care cost and improve the comfort of patients.
The critical issue remains the operating characteristics of these markers compared with cystoscopy, the current standard of care. False-positive results are likely to generate further unnecessary investigations in addition to fear and anxiety in patients’ minds; alternatively, false-negative results may prove to be detrimental, such as progression to muscle invasion.
SettingUrinary cytologyUrinary cytology involves examination of cells from the urinary tract under microscopy. A urinary sample is transported to the laboratory and cells are retrieved by a conventional cytospin method. Cells are examined under a microscope by a cytopathologist for the presence or absence of malignant changes using the standard Papanicolaou method. The test is laboratory based and results are observer dependent with the potential for inter- and intraobservational variation.
Nuclear matrix proteinNMP22 is a patented proteomic technology that has been commercialised by Matritech. Two products are marketed for the diagnosis of bladder cancer, the NMP22® Test Kit and the NMP22® BladderChek® Test. The NMP22 BladderChek Test is the only in-office test approved by the FDA for the diagnosis of bladder cancer. It is a non-invasive test performed on a single urine sample. Bladder cancer cells release NMP22 protein into urine, which is detected by putting 4–5 drops of urine on a prepared card. A change in colour is considered as a ‘positive test’ result. The levels of NMP22 in urine from healthy individuals are very small but can be significantly elevated in patients with urothelial cancers. The test has also been approved
Background
12
by the FDA for point of care use in the diagnosis of bladder cancer.
Fluorescence in situ hybridisationThe basis of this test is the detection of abnormal DNA sequences on chromosomes 3, 7, 17, and the loss of the 9p21 locus in cancer cells shed into the urine of patients with bladder cancer. The retrieved cells from voided urine specimens are fixed on microscopy slides and visualised using a four-colour, four-probe mixture of DNA probe sequences homologous to specific regions on the aforementioned chromosomes. This is a laboratory test and has been commercialised by Abbott under the market name of UroVysion Bladder Cancer Kit (UroVysion Kit).
ImmunoCytThe ImmunoCyt test uses a cocktail of three monoclonal antibodies labelled with fluorescent dyes that bind to two antigens, a mucin glycoprotein (green) and a carcinoembryonic antigen (red), expressed by bladder tumour cells in urine specimens. A voided urine specimen is transported to the laboratory and cells retrieved from it are fixed to a microscope slide. The antibodies are added to the slide and the stained slide examined under fluorescent microscopy by a cytopathologist.
Equipment required and personnel involvedUrine cytology requires the support of skilled laboratory cytotechnicians and cytopathologists within pathology laboratories. This means that results take longer to obtain and are not available on the same day. In addition to these requirements, the FISH and ImmunoCyt tests require specific kits and specialised fluorescence microscopes for visualisation of labelled cancer cells. Also, the FISH technique requires a special filter for cell retrieval. The only biomarker test approved for point of care diagnosis of bladder cancer is NMP22 detection using the commercially available NMP22 Test Kit. The test provides instantaneous results and can be performed by medical personnel with minimal training.
Identification of important subgroupsPhotodynamic diagnosis
• It is important to distinguish the role of fluorescence-guided TURBT for primary tumours from its role in bladder tumour recurrence. Its role in patients developing recurrence during follow-up is less clear.
• It is important to realise that the use of different photosensitisers may lead to different results in terms of sensitivity and specificity.
Biomarkers/cytologyThe diagnostic performance of urinary biomarkers can be scrutinised in the background of two clinical settings: the ability to accurately diagnose bladder cancer in high-risk populations and their potential to accurately predict recurrences in patients known to have non-muscle-invasive disease. Urinary biomarkers can either complement or replace current invasive tests such as cystoscopy. The second clinical scenario in which the diagnostic utility of urinary biomarkers comes under sharp focus is their ability to perform across all grades and stages of non-invasive bladder cancer disease. For example, urinary cytology performs well (high sensitivity) in high-grade disease, whereas its performance decreases (low sensitivity) in low-grade disease – this is why it is not a plausible replacement for cystoscopy, both at the point of diagnosis and at follow-up in the care pathways of non-muscle-invasive bladder cancer disease.
Current usage in the NHS
Photodynamic diagnosisIn most UK centres PDD is not available. Moreover, in centres in which the service is available, it is used to a varying extent. In a few centres (less than five) it is used routinely for all first-time TURBTs. In others it may be used only during follow-up when CIS is suspected, such as a normal-appearing bladder on WLC but positive urine cytology.
Two further factors are likely to influence the uptake of PDD within the wider NHS:
• Fluorescence cystoscopy has been identified as a new technology that has been signalled by the NCRI to the National Horizon Scanning Centre for early review.
• In 2008 the NHS Technology Adoption Centre took forward a PDD implementation project involving three NHS trusts. The experience gained from the project will support the wider NHS in overseeing issues associated with the adoption of new technologies.
Biomarkers/cytologyAlthough urinary cytology is the most common urinary biomarker used for the diagnosis and follow-up of non-muscle-invasive bladder cancer in the NHS, the practice varies across the UK.44 There are few reports of NMP22 being used as a diagnostic biomarker in patients with haematuria
DOI: 10.3310/hta14040 Health Technology Assessment 2010; Vol. 14: No. 4
© 2010 Queen’s Printer and Controller of HMSO. All rights reserved.
13
from UK centres.45 The clinical use of FISH and ImmunoCyt as urinary markers in patients with bladder cancer has not been reported in the UK.
Anticipated costs associated with the technologies
The anticipated costs associated with the technologies will depend on the strategies used in the diagnosis and follow-up of patients. The average unit cost of diagnosing bladder cancer using PDD is £1371, rigid white light cystoscopy £937, flexible cystoscopy £441, cytology £92.37, NMP22 £39.3, FISH £54.8 and ImmunoCyt £54.8;
and the cost of treatment using PDD-assisted TURBT is £2436, WLC-assisted TURBT £2002, mitomycin £73, BCG £89, cystectomy £6856, chemotherapy £50.22, radical radiotherapy £1050 and palliative treatment £12,825 (see Chapter 6 for details). The modelling results indicate that using the most effective strategy (the one with the highest number of true positives and the lowest number of false negatives), which includes either of the two biomarkers FISH or ImmunoCyt and PDD as the initial strategy and either FISH or ImmunoCyt with WLC as the follow-up strategy, will cost £5919.28 per low-risk patient per year.

DOI: 10.3310/hta14040 Health Technology Assessment 2010; Vol. 14: No. 4
© 2010 Queen’s Printer and Controller of HMSO. All rights reserved.
15
Decision problem
Accurate diagnosis of bladder cancer is crucial for people who may potentially have the disease to allow for early detection and to reduce the risk of tumour recurrence and progression. The ideal test for diagnosis and follow-up of bladder cancer would be non-invasive, highly sensitive and specific, inexpensive and easy to perform and would provide reproducible results. Many of the tests meet some, but not all, of these criteria. Currently, a common diagnostic scenario in the UK is that people suspected of having bladder cancer are first examined with flexible cystoscopy and voided urine cytology, followed by white light rigid cystoscopy-assisted TURBT or biopsies for those considered positive or suspicious for the disease. However, insufficient sensitivity or specificity of the three tests can result in the incomplete detection or overtreatment of primary and recurrent disease.
As patients are living longer and recurrence of disease is becoming a major issue there is a need to identify the most appropriate methods for diagnosing patients with bladder cancer and subsequently following them up. A variety of tests have been developed that have been used as alternatives to, or alongside, existing investigations. As described in Chapter 1, urinary biomarkers for bladder cancer are non-invasive assay tests that can detect protein, genetic or chromosomal aberrations, even at early stages of disease. Some are point of care tests whereas others require laboratory analysis. These tests are considered to be attractive and potentially cost-effective as they may offer the potential to avoid unnecessary cystoscopies and labour-intensive cytology. Biomarkers have the potential to play a role in the initial diagnosis of patients either in addition to or as a replacement for urine cytology, and in monitoring during follow-up.
PDD has been used alongside rigid cystoscopy with the aim of improving detection of CIS and papillary tumours during TURBT, thereby potentially reducing the residual tumour rate at the 6-week check following TURBT and consequently also reducing recurrence and progression of
disease. PDD has also been described as a safe and straightforward technique to learn.
The following sections provide a description of the care pathways that show the plausible strategies for the primary diagnosis and follow-up of people with bladder cancer.
Inclusion criteria (see Chapter 3)
Key issuesThe key issues to be addressed are:
• Can PDD improve detection of bladder cancer (1) at the time of TURBT for newly diagnosed disease and (2) during follow-up of patients with non-muscle-invasive disease?
• Can PDD reduce recurrence and/or progression of non-muscle-invasive bladder cancer compared with WLC?
• Can urine biomarkers (FISH, ImmunoCyt, NMP22) improve detection of bladder cancer during (1) initial diagnosis of patients suspected of having bladder cancer and (2) follow-up of patients diagnosed with non-muscle-invasive disease?
• What is the incremental cost-effectiveness of PDD during TURBT for newly diagnosed non-muscle-invasive bladder cancer and during follow-up?
• What is the incremental cost-effectiveness of biomarkers during the initial diagnosis of patients suspected of having bladder cancer and during follow-up of those diagnosed with non-muscle-invasive disease?
Care pathways
Care pathways describing plausible strategies for the initial diagnosis and follow-up of people with bladder cancer were developed. The basic care pathway was based on discussions with the clinical experts involved in this study and a brief description of this is provided within Chapter 1.
Initial diagnosis and treatment (Figure 4)The pathway begins with an initial presentation of symptoms or asymptomatic microscopic haematuria and varies in terms of where and when
Chapter 2 Definition of the decision problem
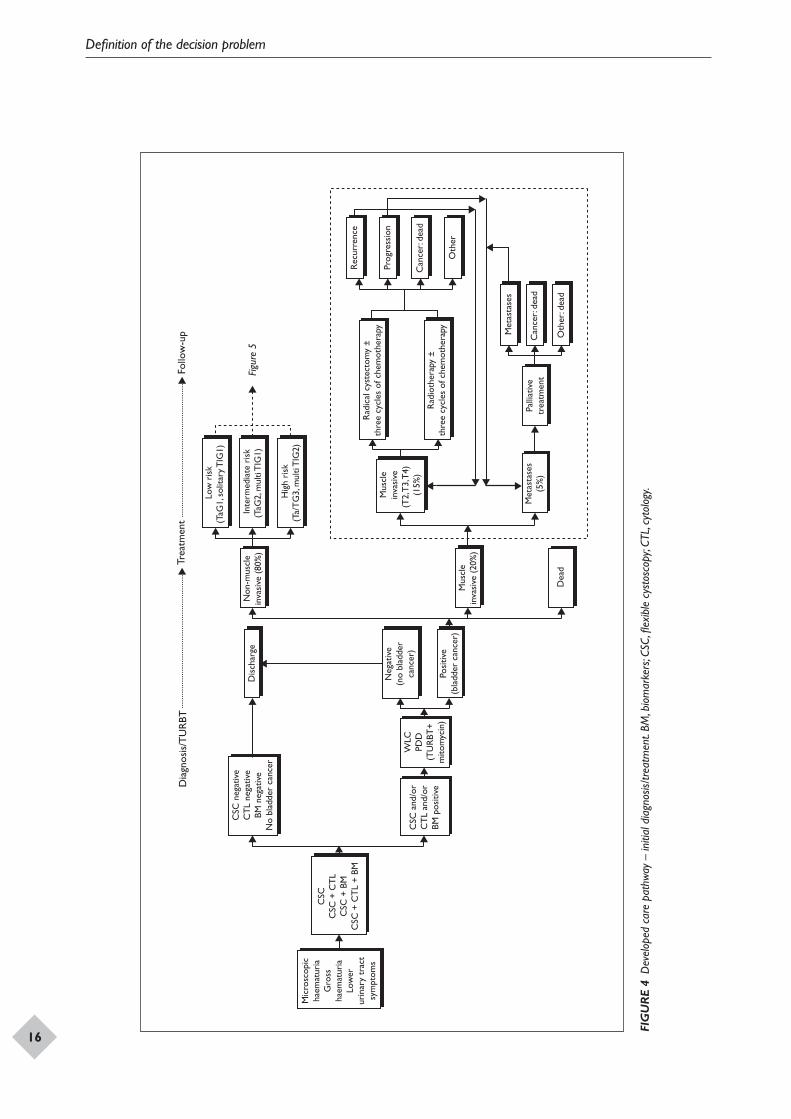
Definition of the decision problem
16
Dia
gnos
is/T
UR
BT
Follo
w-u
p
Figu
re 5
Trea
tmen
t
CSC
neg
ativ
e C
TL
nega
tive
BM n
egat
ive
No
blad
der
canc
er
CSC
C
SC +
CT
L C
SC +
BM
C
SC +
CT
L +
BM
CSC
and
/or
CT
L an
d/or
BM
pos
itive
WLC
PD
D
(TU
RBT
+ m
itom
ycin
)
Mic
rosc
opic
haem
atur
iaG
ross
haem
atur
iaLo
wer
urin
ary
trac
tsy
mpt
oms
Dis
char
ge
Neg
ativ
e (n
o bl
adde
r ca
ncer
)
Posi
tive
(bla
dder
can
cer)
Non
-mus
cle
inva
sive
(80
%)
Mus
cle
inva
sive
(20
%)
Dea
d
Met
asta
ses
(5%
) Pa
lliat
ive
trea
tmen
t
Mus
cle
inva
sive
(T
2, T
3, T
4)
(15%
)
Rad
ical
cys
tect
omy
± th
ree
cycl
es o
f che
mot
hera
py
Rad
ioth
erap
y ±
thre
e cy
cles
of c
hem
othe
rapy
Rec
urre
nce
Prog
ress
ion
Can
cer:
dead
Can
cer:
dead
Oth
er
Oth
er: d
ead
Met
asta
ses
Low
ris
k (T
aG1,
sol
itary
TIG
1)
Inte
rmed
iate
ris
k (T
aG2,
mul
ti T
IG1)
Hig
h ri
sk
(Ta/
TG
3, m
ulti
TIG
2)
FIG
UR
E 4
Dev
elop
ed c
are
path
way
– in
itial
dia
gnos
is/tre
atm
ent.
BM, b
iom
arke
rs; C
SC, fl
exib
le c
ysto
scop
y; CT
L, cy
tolo
gy.
DOI: 10.3310/hta14040 Health Technology Assessment 2010; Vol. 14: No. 4
© 2010 Queen’s Printer and Controller of HMSO. All rights reserved.
17
TABLE 3 Different test results
Cystoscopy Cytology Biomarkers
– – –
– – +
– + –
+ – –
– + +
+ – +
+ + –
+ + +
–, negative; +, positive.
biomarkers and PDD might be used. Patients who present with either microscopic or gross haematuria or lower urinary tract symptoms are tested using flexible cystoscopy and cytology. Biomarkers could be used at this point either in addition to these two tests or instead of cytology. The results of these tests can be either negative or positive. Patients who have two/three negative results are discharged. Discharged patients who later re-present with similar symptoms go back to the beginning of the care pathway. Patients with one or more positive results for these tests as outlined in Table 3 undergo TURBT during which PDD may be used with the aim of improving the detection of tumours, thereby potentially reducing the rate of residual tumours and increasing the detection of CIS and small papillary tumours.
After TURBT is performed for newly diagnosed bladder cancer, the standard UK management is that the patient also receives a single instillation of adjuvant intravesical mitomycin C, ideally within 6 hours of resection but not later than 24 hours if possible. Biopsies are taken and the results of the histological analysis may be either negative or positive for bladder cancer. Those who have a negative histology result are then discharged. Discharged patients whose symptoms are not resolved may subsequently re-present at the beginning of the care pathway. For the purposes of this review, although patients who have a negative bladder cancer test result are considered as discharged, it is noted that some who initially had a positive result may be at risk of upper tract urothelial cancer or renal cancer and consequently will require further tests, and, if positive, treatment.
Those patients whose histological results confirm the presence of bladder cancer are classified into
muscle-invasive or non-muscle-invasive disease. For those with muscle-invasive disease, treatment options are outlined in Figure 4. Essentially, those amenable to potential cure are offered either radical cystectomy with bilateral pelvic lymphadenectomy or radiotherapy. Treatment with surgery or radiotherapy is usually preceded by three cycles of systemic neoadjuvant cisplatin-based chemotherapy. The rationale for chemotherapy is that over 50% of patients with muscle-invasive disease have occult metastatic disease at presentation. It is noted that practice at individual centres may vary. The decision for cystectomy or radiotherapy is primarily based on patient choice and medical fitness. The presence of concomitant CIS and upper tract dilatation are also factors that favour cystectomy. For patients with more advanced metastatic disease, the treatment is palliative.
Follow-up of patients with non-muscle-invasive bladder cancer (Figure 5)The key factors increasing the risk of recurrence and progression in patients with non-muscle-invasive bladder cancer are: (1) tumour multiplicity, (2) greater tumour diameter, (3) previous recurrence rate, (4) higher T-stage, (5) concomitant CIS and (6) higher histological grade. A brief summary is provided in the following sections and a further short review on the management of bladder cancer, required for the description of the model structure, is provided in Chapter 6 (see Model structure, Markov model).
High riskBroadly speaking, patients with Ta/T1G3 TCC, CIS or multifocal T1G2 TCC are classified as being at high risk of not only recurrence but also progression. If diagnosed with T1G3 TCC they are offered an early re-resection to ensure that they are not muscle invasive. All patients in this group are usually offered an induction course of six intravesical BCG instillations followed by a maintenance regimen of a further 21 instillations over a 3-year period. Some may opt for primary radical cystectomy. Patients who opt for bladder sparing undergo their first bladder check at 3 months. If they remain tumour free they are followed up every 3 months for the first 2 years and then every 6 months thereafter. During the follow-up visits, patients undergo cystoscopy and in some centres cytology and/or a biomarker test. Patients found to have a non-muscle-invasive recurrence have four options: they can undergo cystectomy, have a second induction course of BCG and then reassess, have three further instillations of BCG and then reassess, or receive endoscopic control.
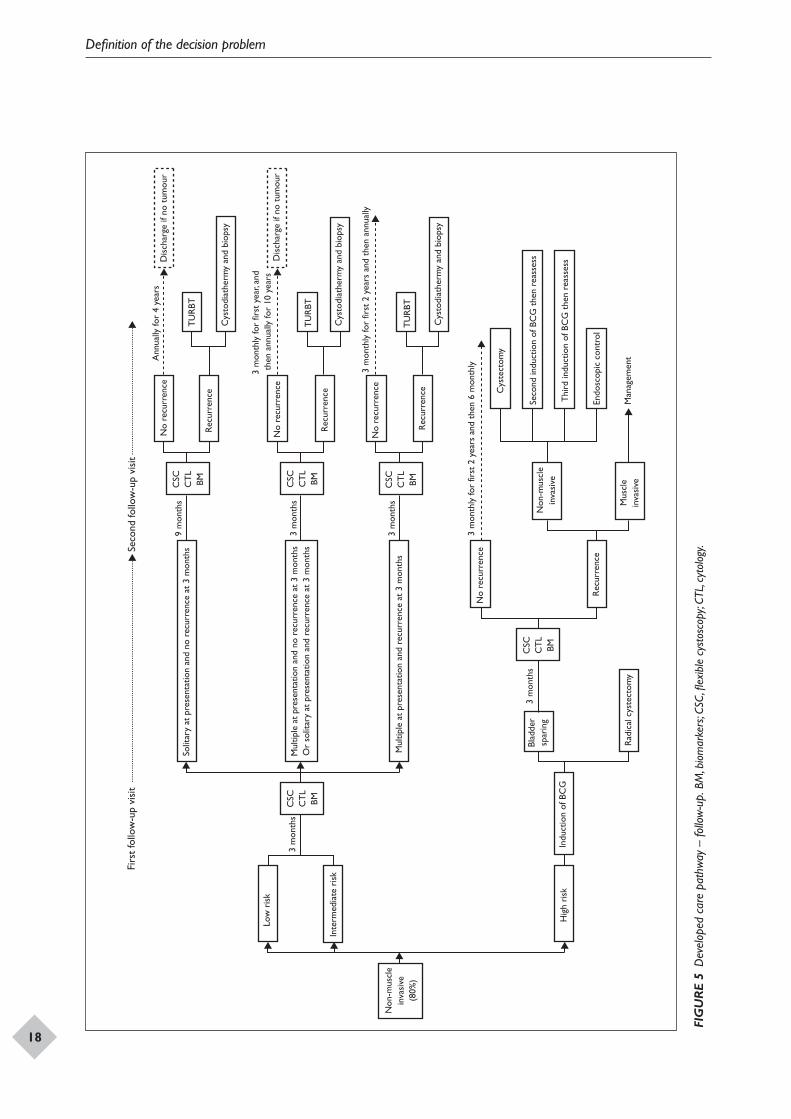
Definition of the decision problem
18
Firs
t fo
llow
-up
visi
t Se
cond
follo
w-u
p vi
sit
Low
ris
k
Inte
rmed
iate
ris
k
Hig
h ri
sk
Mul
tiple
at
pres
enta
tion
and
recu
rren
ce a
t 3
mon
ths
Non
-mus
cle
inva
sive
(8
0%)
Solit
ary
at p
rese
ntat
ion
and
no r
ecur
renc
e at
3 m
onth
s
Mul
tiple
at
pres
enta
tion
and
no r
ecur
renc
e at
3 m
onth
s O
r so
litar
y at
pre
sent
atio
n an
d re
curr
ence
at
3 m
onth
s
Blad
der
spar
ing
9 m
onth
s
3 m
onth
s
3 m
onth
s
CSC
C
TL
BM
No
recu
rren
ce
Rec
urre
nce
No
recu
rren
ce
Rec
urre
nce
No
recu
rren
ce
Rec
urre
nce
CSC
C
TL
BM
CSC
C
TL
BM
CSC
C
TL
BM
Non
-mus
cle
inva
sive
Mus
cle
inva
sive
M
anag
emen
t
Endo
scop
ic c
ontr
ol
Thi
rd in
duct
ion
of B
CG
the
n re
asse
ss
Seco
nd in
duct
ion
of B
CG
the
n re
asse
ss
Cys
tect
omy
Rad
ical
cys
tect
omy
Indu
ctio
n of
BC
G
3 m
onth
s
3 m
onth
s
CSC
C
TL
BM
No
recu
rren
ce
3 m
onth
ly fo
r fir
st 2
yea
rs a
nd t
hen
6 m
onth
ly
3 m
onth
ly fo
r fir
st y
ear,
and
then
ann
ually
for
10 y
ears
3 m
onth
ly fo
r fir
st 2
yea
rs a
nd t
hen
annu
ally
Ann
ually
for
4 ye
ars
TU
RBT
TU
RBT
TU
RBT
Cys
todi
athe
rmy
and
biop
sy
Cys
todi
athe
rmy
and
biop
sy
Cys
todi
athe
rmy
and
biop
sy
Dis
char
ge if
no
tum
our
Dis
char
ge if
no
tum
our
Rec
urre
nce
FIG
UR
E 5
Dev
elop
ed c
are
path
way
– fo
llow
-up.
BM
, bio
mar
kers
; CSC
, flex
ible
cys
tosc
opy;
CTL,
cyto
logy
.
DOI: 10.3310/hta14040 Health Technology Assessment 2010; Vol. 14: No. 4
© 2010 Queen’s Printer and Controller of HMSO. All rights reserved.
19
Low and intermediate riskPatients at low risk of recurrence and progression have TaG1 TCC or solitary T1G1 TCC. Those at intermediate risk have TaG2 TCC or multifocal T1G1 TCC. Multiplicity at presentation and a tumour recurrence at 3 months have consistently been shown to be key practical predictors of future recurrence, and many urologists in the UK tailor their cystoscopic follow-up of low- and intermediate-risk patients based on these two factors for these reasons:
(a) Patients who have a solitary tumour at diagnosis and no tumour recurrence at 3 months are followed up at 9 months and then annually for 4 further years. If at the end of this 5-year follow-up period they have remained tumour free they are discharged. During the follow-up visits these patients undergo flexible cystoscopy and in some centres cytology and/or biomarker tests. Although most patients with a tumour recurrence will receive TURBT, some may have a cystodiathermy and biopsy.
(b) Patients with multiple tumours at presentation and no recurrence at 3 months or a solitary tumour at presentation with recurrence at 3 months need more intense follow-up and are followed up every 3 months for the first year and annually if they remain tumour free until 10 years and are then discharged. During the follow-up visits patients undergo cystoscopy and in some centres cytology and/or biomarker tests. Those who present with a tumour at the follow-up visit undergo either TURBT or cystodiathermy and biopsy. These patients may be considered for a course of six intravesical instillations of mitomycin C or epirubicin.
(c) Patients with multiple tumours at presentation and recurrence at 3 months have the highest risk of recurrence and are followed up every 3 months for the first 2 years and then annually thereafter. They are usually offered a course of six intravesical instillations of mitomycin C or epirubicin. Those who present with a tumour at the follow-up visit undergo either TURBT or cystodiathermy and biopsy. During the follow-up visits patients undergo cystoscopy and in some centres cytology and/or biomarker tests. Cystoscopies in the first 2 years are usually under general anaesthesia using a rigid cystoscope.
During the follow-up period the status of patients may change and they may develop muscle-invasive
tumours. It is also possible that patients may die at any time during follow-up from causes related to bladder cancer or from unrelated causes. The outlined care pathways in Figures 4 and 5 identify the areas in which PDD and biomarkers could be used in conjunction with the standard tests to diagnose patients with suspected bladder cancer and to follow up those who have been diagnosed with non-muscle-invasive disease. These patient care pathways will be used to inform the economic model and to establish whether the use of PDD and urine biomarkers reduces recurrence or decreases progression at follow-up as a consequence of altered treatment.
Aim of the review
The aim of this review is to assess the clinical and cost-effectiveness of PDD and urine biomarker tests in the detection and follow-up of non-muscle-invasive bladder cancer.
This aim is addressed through:
• a systematic review of PDD, and urine biomarker tests (FISH, ImmunoCyt and NMP22) and cytology alone or in combination, in the diagnosis and follow-up of bladder cancer
• a structured review of the management of patients diagnosed with bladder cancer with associated costs and outcomes
• economic modelling of the cost-effectiveness and cost–utility of alternative approaches in the diagnosis and follow-up of patients with non-muscle-invasive bladder cancer.
The specific objectives of the review are to:
• estimate the incremental cost-effectiveness of PDD compared with white light rigid cystoscopy, and biomarkers and urine cytology, in initial diagnosis and follow-up
• assess the performance of PDD (1) at the time of TURBT for newly diagnosed bladder cancer and (2) during follow-up of patients with non-muscle-invasive disease
• assess the performance of urine biomarkers and cytology in (1) initial diagnosis of bladder cancer and (2) during follow-up of patients with non-muscle-invasive disease
• assess whether PDD reduces recurrence and/or progression of non-muscle-invasive disease compared with WLC.

Definition of the decision problem
20
Structure of the remainder of the reportThe remainder of the report is structured as follows. Chapter 3 describes the methods for reviewing test performance and effectiveness, Chapter 4 assesses the diagnostic accuracy, and clinical effectiveness in terms of recurrence/progression rates, of PDD compared with WLC
and Chapter 5 assesses the test performance of urine biomarkers (FISH, ImmunoCyt, NMP22) and cytology. Chapter 6 assesses the cost-effectiveness of the tests, Chapter 7 discusses factors relevant to the NHS and other parties, Chapter 8 is a discussion of the findings and Chapter 9 presents the review’s conclusions, including implications for the NHS and for research.
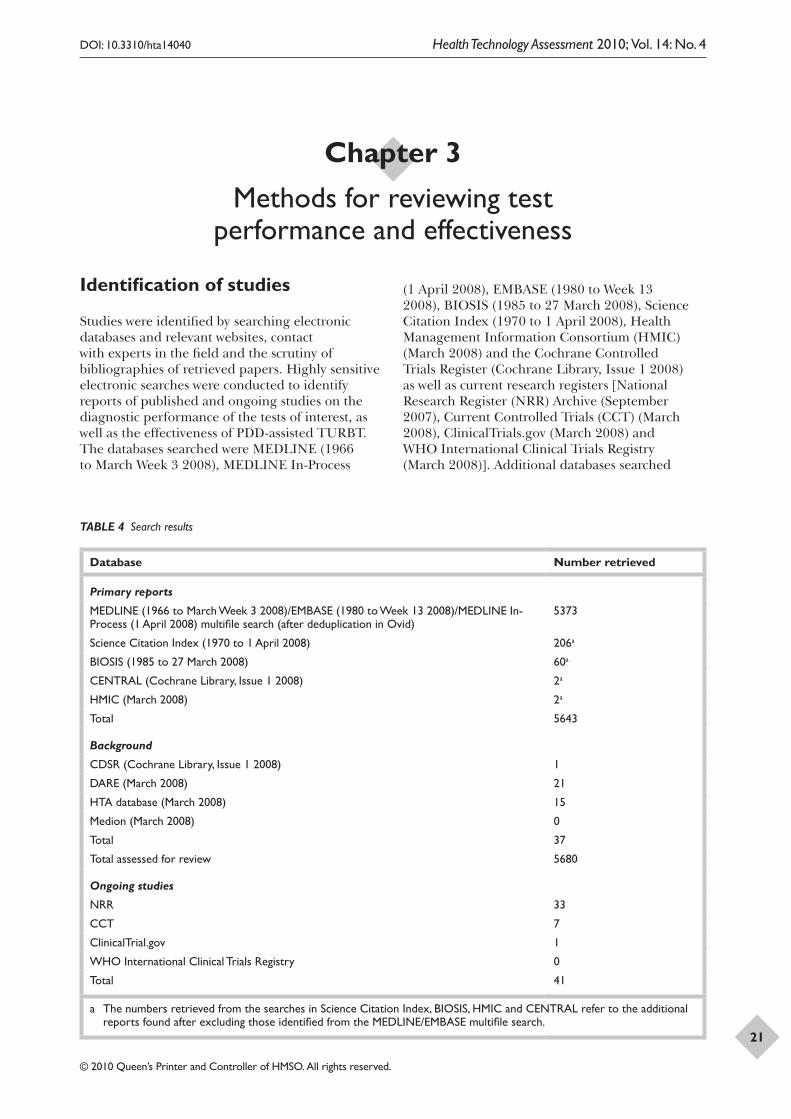
DOI: 10.3310/hta14040 Health Technology Assessment 2010; Vol. 14: No. 4
© 2010 Queen’s Printer and Controller of HMSO. All rights reserved.
21
Chapter 3 Methods for reviewing test
performance and effectiveness
Identification of studies
Studies were identified by searching electronic databases and relevant websites, contact with experts in the field and the scrutiny of bibliographies of retrieved papers. Highly sensitive electronic searches were conducted to identify reports of published and ongoing studies on the diagnostic performance of the tests of interest, as well as the effectiveness of PDD-assisted TURBT. The databases searched were MEDLINE (1966 to March Week 3 2008), MEDLINE In-Process
(1 April 2008), EMBASE (1980 to Week 13 2008), BIOSIS (1985 to 27 March 2008), Science Citation Index (1970 to 1 April 2008), Health Management Information Consortium (HMIC) (March 2008) and the Cochrane Controlled Trials Register (Cochrane Library, Issue 1 2008) as well as current research registers [National Research Register (NRR) Archive (September 2007), Current Controlled Trials (CCT) (March 2008), ClinicalTrials.gov (March 2008) and WHO International Clinical Trials Registry (March 2008)]. Additional databases searched
TABLE 4 Search results
Database Number retrieved
Primary reports
MEDLINE (1966 to March Week 3 2008)/EMBASE (1980 to Week 13 2008)/MEDLINE In-Process (1 April 2008) multifile search (after deduplication in Ovid)
5373
Science Citation Index (1970 to 1 April 2008) 206a
BIOSIS (1985 to 27 March 2008) 60a
CENTRAL (Cochrane Library, Issue 1 2008) 2a
HMIC (March 2008) 2a
Total 5643
Background
CDSR (Cochrane Library, Issue 1 2008) 1
DARE (March 2008) 21
HTA database (March 2008) 15
Medion (March 2008) 0
Total 37
Total assessed for review 5680
Ongoing studies
NRR 33
CCT 7
ClinicalTrial.gov 1
WHO International Clinical Trials Registry 0
Total 41
a The numbers retrieved from the searches in Science Citation Index, BIOSIS, HMIC and CENTRAL refer to the additional reports found after excluding those identified from the MEDLINE/EMBASE multifile search.
Methods for reviewing test performance and effectiveness
22
for systematic reviews and other background information included the Cochrane Database of Systematic Reviews (CDSR) (Cochrane Library, Issue 1 2008), Database of Abstracts of Reviews of Effectiveness (DARE) (March 2008), Health Technology Assessment (HTA) database (March 2008) and Medion (March 2008). A total of 5680 reports were identified (Table 4). In addition, the details of 41 potentially relevant ongoing studies were noted. Reference lists of all included studies were scanned to identify additional potentially relevant studies. Full details of the search strategies used and websites consulted are documented in Appendix 1.
Inclusion and exclusion criteriaTypes of studiesThe types of studies considered for reporting test performance were:
• direct (head-to-head) studies in which the index test and reference standard test were performed independently in the same group of people
• randomised controlled trials (RCTs) in which people were randomised to the index and comparator test(s) and all received the reference standard test.
In the event that there was insufficient evidence from direct and randomised studies we considered undertaking indirect (between-study) comparisons by meta-analysing studies that compared each single test or combination of tests with the reference standard test, and making comparisons between meta-analyses of the different tests. However, this type of study design is less reliable than direct studies as differences in diagnostic accuracy are susceptible to confounding factors between studies. The following types of studies were considered:
• Observational studies, including case series, in which the sample is created by identifying all people presenting at the point of testing (without any reference to the test results).
• Case–control studies in which two groups are created, one known to have the target disease and one known not to have the target disease, when it is reasonable for all included to go through the tests. We excluded case–control studies when the control group consisted of completely healthy volunteers, or when the
control group consisted of completely healthy volunteers and people with benign urinary conditions and it was not possible to calculate results for the control group minus the healthy volunteers, such that the spectrum of disease and non-disease was unlike that to be encountered in a diagnostic situation.
Studies reporting test performance had to report the absolute numbers of true positives, false positives, false negatives and true negatives, or provide information allowing their calculation. Studies reporting patient- and/or biopsy-level analysis (for PDD) and patient- or specimen-level analysis (for biomarkers/cytology) were considered.
For assessment of the effectiveness of PDD-assisted TURBT compared with WLC-assisted TURBT in terms of outcomes such as recurrence or progression we focused on RCTs.
Types of participants
The participants considered were people (1) suspected of having bladder cancer or (2) previously diagnosed with non-muscle-invasive bladder cancer and having follow-up cystoscopic examination.
Index and comparator tests
The following tests and comparators were considered:
• PDD (using the photosensitising agents 5-ALA, HAL or hypericin) compared with WLC
• urine biomarkers (FISH, ImmunoCyt, NMP22) or cytology either alone or compared with each other.
Studies reporting the test performance of combinations of the above tests were also considered.
If the evidence allowed, the following subgroup analyses were planned:
• number of tumours on first cystoscopic examination
• type (e.g. CIS) and grade of tumour (WHO 1973 or 2004 classification)
• tumour recurrence at the first 3-month cystoscopic examination following TURBT
• diagnostic performance of the different PDD photosensitising agents
DOI: 10.3310/hta14040 Health Technology Assessment 2010; Vol. 14: No. 4
© 2010 Queen’s Printer and Controller of HMSO. All rights reserved.
23
• diagnostic performance of the different categories of urine biomarkers
• for urine biomarkers, whether the urine sample was voided or obtained by bladder wash.
Numerous biomarkers exist that potentially could have been included in the review but to make the task manageable within the given time frame the review’s steering committee agreed that the review should focus only on those biomarkers regarded as being most clinically relevant. These were seen as being either those approved by the US FDA or the three generally regarded as most useful – FISH, ImmunoCyt and NMP22 – with cytology also included. It was agreed that the Chairman of the BAUS Section of Oncology should be contacted to canvass the views of the Section’s Executive Committee on the most relevant biomarkers to consider. Following this, the Chairman on behalf of the Section suggested that the review should assess ImmunoCyt, NMP22, FISH and cytology, and consequently these were the tests that were included in the review.
Reference standard
The reference standard considered both for studies reporting PDD and for studies reporting biomarkers was histopathological examination of biopsied tissue.
Types of outcomes
The following outcomes were considered:
• for PDD: – test performance in detecting non-muscle-
invasive bladder cancer – recurrence rate of bladder tumour over
time following initial resection – progression to muscle-invasive disease
• for urine biomarkers/cytology: – test performance in detecting non-muscle-
invasive bladder cancer.
In any studies reporting the above outcomes, the following outcomes were also considered if reported:
• altered treatment as a result of the tests• acceptability of the tests• interpretability of the tests• quality of life (disease-specific and generic
instruments)• adverse effects.
Exclusion criteriaThe following types of report were excluded:
• animal models• preclinical and biological studies• reviews, editorials and opinions• case reports• abstracts, as usually insufficient methodological
details are reported to allow critical appraisal of study quality
• reports investigating technical aspects of a test• non-English language studies.
In addition, studies reporting biomarkers or cytology in which the number of participants in the analysis was less than 100 were excluded. Studies reporting cytology that predated the publication year of the earliest of the included biomarker studies were also excluded.
Data extraction strategy
One reviewer screened the titles (and abstracts if available) of all reports identified by the search strategy. Full-text copies of all studies deemed to be potentially relevant were obtained and two reviewers independently assessed them for inclusion. Any disagreements were resolved by consensus or arbitration by a third party.
Data extraction forms for studies reporting PDD and studies reporting biomarkers/cytology were developed and piloted. One reviewer extracted details of study design, participants, index, comparator and reference standard tests and outcome data, and a second reviewer checked the data extraction. Any disagreements were resolved by consensus or arbitration by a third party.
Quality assessment strategy
Two reviewers independently assessed the quality of the included diagnostic studies using QUADAS, a quality assessment tool developed for use in systematic reviews of diagnostic studies.46 QUADAS was developed through a formal consensus method and was based on empirical evidence. The original QUADAS checklist contained 14 questions. The QUADAS tool was adapted to make it more applicable to assessing the quality of studies of tests for detecting bladder cancer (see Appendix 2 for an example of the modified checklist for PDD).
Methods for reviewing test performance and effectiveness
24
Questions 1, 3–7 and 10–14 of the original QUADAS tool were retained (questions 1–11 in the modified version). Three questions in the original QUADAS tool that related to the quality of reporting rather than methodological quality were omitted from the modified version (questions 2, 8 and 9). These questions related to the description of: (a) the selection criteria, (b) the execution of the index test and (c) the execution of the reference standard test. Two questions were added to the modified checklist on: (a) whether the study provided a clear definition of what was considered to be a ‘positive’ result and (b) whether data on observer variation were reported and within an acceptable range. In addition, a third question was added that related only to studies reporting biomarkers and/or cytology, on whether a prespecified cut-off value was used.
Two reviewers (from GM, CB or CR) independently assessed the quality of all included diagnostic studies using the modified version of QUADAS. Each question was checked as ‘yes’, ‘no’ or ‘unclear’. Each item was worded so that a rating of ‘yes’ was always optimal in terms of methodological quality. Any disagreements were resolved by consensus or arbitration by a third party.
Two reviewers (from GM, CB or CR) independently assessed the quality of RCTs comparing WLC-assisted TURBT with PDD-assisted TURBT using a checklist adapted from Verhagen and colleagues47 and developed through the Review Body for Interventional Procedures (ReBIP). ReBIP is a joint venture between the Medical Care Research Unit at Sheffield University and the Health Services Research Unit at the University of Aberdeen and works under the auspices of the National Institute for Health and Clinical Excellence’s (NICE) Interventional Procedures Programme (IPP). The checklist for RCTs contained 14 questions (see Appendix 3). Any disagreements were resolved by consensus or arbitration by a third party.
Data analysisDiagnostic accuracy of PDD/urine biomarker testsThe results of the individual studies were tabulated and sensitivity, specificity, positive and negative predictive values, positive and negative likelihood ratios and diagnostic odds ratios (DORs) calculated. If reported in a given study, a separate
2 × 2 table was derived for patient-level and biopsy-level analyses.
Sensitivity describes the proportion of those with disease who have positive test results, whereas specificity is the proportion of those without disease who have negative test results. A positive likelihood ratio describes how many times more likely it is that a person with disease will receive a positive test result than a person without disease whereas a negative likelihood ratio describes how many times more likely it is that a person with disease will receive a negative test result than a person without disease. A positive predictive value (PPV) describes the proportion of those with positive test results who have the disease, whereas a negative predictive value (NPV) is the proportion of those with negative test results who do not have the disease. A DOR is a single indicator of test performance and is the ratio of the odds of testing positive in those with the disease relative to the odds of testing positive in those without the disease. It can be calculated from the sensitivity and specificity values. The DOR summarises the results into a single indicator of test performance; however, information contained in sensitivity and specificity is lost and in particular a DOR cannot distinguish between tests with high sensitivity and low specificity and vice versa.
Hierarchical summary receiver operating characteristic (HSROC) curves were produced for each test when three or more studies reported sufficient data. A separate HSROC curve was derived for patient-level analysis and biopsy-level analysis when possible. Meta-analysis models were fitted using the HSROC model48 in SAS 9.1 using the NLMIXED function (SAS Institute). This HSROC model takes account of the diseased and non-diseased sample sizes in each study and allows estimation of random effects for the threshold and accuracy effects.48,49 HSROC models for PDD and WLC were fitted individually based upon the data for the individual alone, which allowed for an asymmetric summary receiver operating characteristic (SROC) curve. Additionally, two models that fitted the data simultaneously were also run, to formally assess the evidence for a difference in diagnostic accuracy between the tests. A fuller model was run that allowed for a difference between the tests in all three constituent diagnostic accuracy parameters (threshold, accuracy and shape of SROC curve) and also a simpler nested model was run that did not allow for a difference in
DOI: 10.3310/hta14040 Health Technology Assessment 2010; Vol. 14: No. 4
© 2010 Queen’s Printer and Controller of HMSO. All rights reserved.
25
diagnostic accuracy in any of the three parameters. The SROC curves from the HSROC models were produced and are shown on the corresponding SROC plots along with the individual study estimates. Summary sensitivity, specificity, positive and negative likelihood ratios and DORs for each model were reported as point estimate and 95% confidence interval (CI).
The presentation of test performance in terms of the detection of stage and grade of non-muscle-invasive bladder cancer was considered in the two broad categories of: (1) less aggressive, lower risk tumours (pTa, G1, G2) and (2) more aggressive, higher risk tumours (pT1, G3, CIS). The median (range) sensitivity of PDD and WLC across studies, for both patient- and biopsy-based detection of tumours, was reported for each category and also separately for CIS.
WLC-assisted TURBT compared with PDD-assisted TURBTFor relevant outcomes (e.g. recurrence rate after WLC-assisted TURBT compared with PDD-assisted TURBT), when appropriate, meta-analysis was employed to estimate a summary measure of effect. The dichotomous outcome data were combined using the Mantel–Haenszel (RR) method. For the estimates of RR, 95% CIs and p-values were calculated. The results were reported using a fixed-effect model in the absence of statistical heterogeneity. Chi-squared tests and I2 statistics were used to explore statistical heterogeneity across studies. Possible reasons for heterogeneity were explored using sensitivity analysis. When there was no obvious reason for heterogeneity, the results were reported using random-effects methods. In the event that a quantitative synthesis was considered to be inappropriate or not feasible, we provided a narrative synthesis of results.

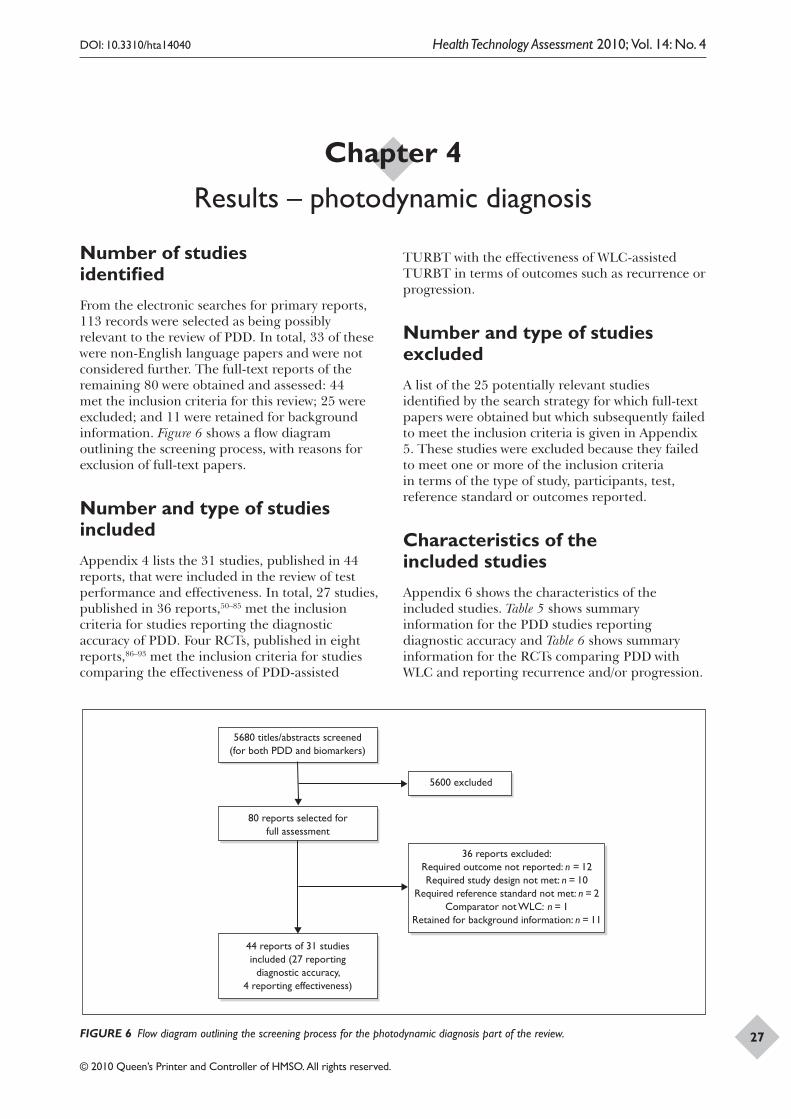
DOI: 10.3310/hta14040 Health Technology Assessment 2010; Vol. 14: No. 4
© 2010 Queen’s Printer and Controller of HMSO. All rights reserved.
27
Number of studies identifiedFrom the electronic searches for primary reports, 113 records were selected as being possibly relevant to the review of PDD. In total, 33 of these were non-English language papers and were not considered further. The full-text reports of the remaining 80 were obtained and assessed: 44 met the inclusion criteria for this review; 25 were excluded; and 11 were retained for background information. Figure 6 shows a flow diagram outlining the screening process, with reasons for exclusion of full-text papers.
Number and type of studies includedAppendix 4 lists the 31 studies, published in 44 reports, that were included in the review of test performance and effectiveness. In total, 27 studies, published in 36 reports,50–85 met the inclusion criteria for studies reporting the diagnostic accuracy of PDD. Four RCTs, published in eight reports,86–93 met the inclusion criteria for studies comparing the effectiveness of PDD-assisted
TURBT with the effectiveness of WLC-assisted TURBT in terms of outcomes such as recurrence or progression.
Number and type of studies excludedA list of the 25 potentially relevant studies identified by the search strategy for which full-text papers were obtained but which subsequently failed to meet the inclusion criteria is given in Appendix 5. These studies were excluded because they failed to meet one or more of the inclusion criteria in terms of the type of study, participants, test, reference standard or outcomes reported.
Characteristics of the included studiesAppendix 6 shows the characteristics of the included studies. Table 5 shows summary information for the PDD studies reporting diagnostic accuracy and Table 6 shows summary information for the RCTs comparing PDD with WLC and reporting recurrence and/or progression.
Chapter 4 Results – photodynamic diagnosis
5680 titles/abstracts screened (for both PDD and biomarkers)
5600 excluded
44 reports of 31 studiesincluded (27 reporting
diagnostic accuracy,4 reporting effectiveness)
80 reports selected for full assessment
36 reports excluded: Required outcome not reported: n = 12 Required study design not met: n = 10
Required reference standard not met: n = 2 Comparator not WLC: n = 1
Retained for background information: n = 11
FIGURE 6 Flow diagram outlining the screening process for the photodynamic diagnosis part of the review.
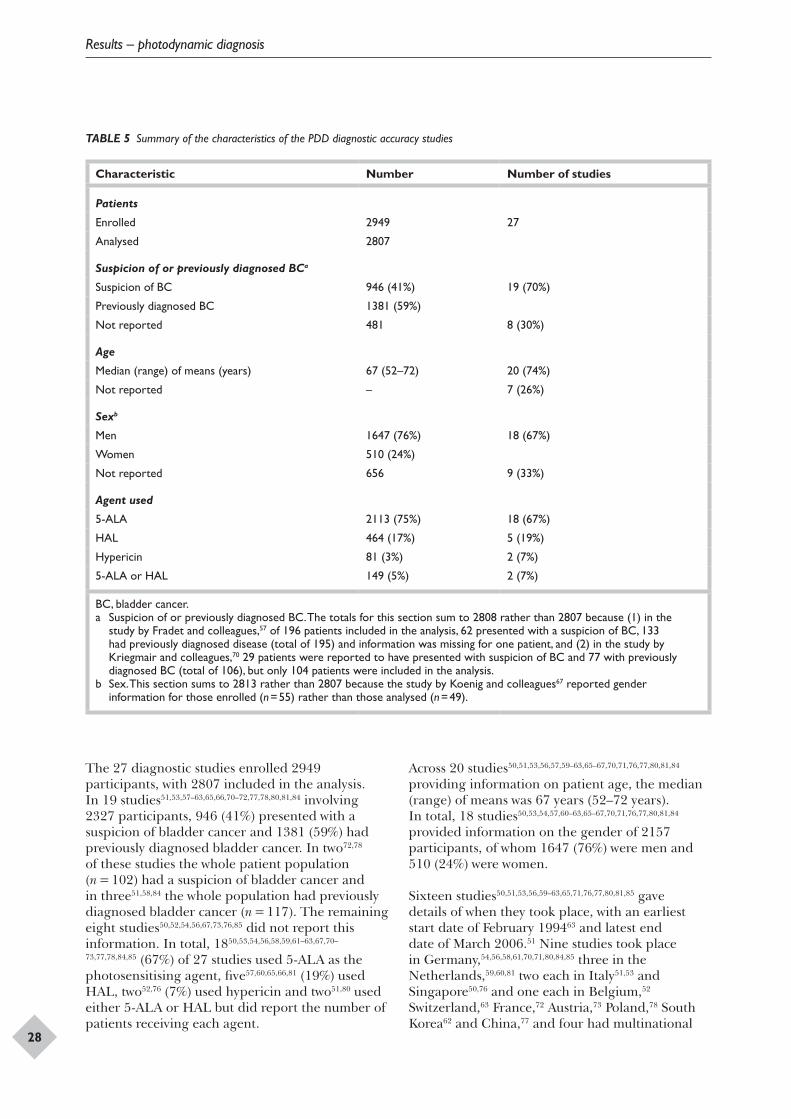
Results – photodynamic diagnosis
28
TABLE 5 Summary of the characteristics of the PDD diagnostic accuracy studies
Characteristic Number Number of studies
Patients
Enrolled 2949 27
Analysed 2807
Suspicion of or previously diagnosed BCa
Suspicion of BC 946 (41%) 19 (70%)
Previously diagnosed BC 1381 (59%)
Not reported 481 8 (30%)
Age
Median (range) of means (years) 67 (52–72) 20 (74%)
Not reported – 7 (26%)
Sexb
Men 1647 (76%) 18 (67%)
Women 510 (24%)
Not reported 656 9 (33%)
Agent used
5-ALA 2113 (75%) 18 (67%)
HAL 464 (17%) 5 (19%)
Hypericin 81 (3%) 2 (7%)
5-ALA or HAL 149 (5%) 2 (7%)
BC, bladder cancer.a Suspicion of or previously diagnosed BC. The totals for this section sum to 2808 rather than 2807 because (1) in the
study by Fradet and colleagues,57 of 196 patients included in the analysis, 62 presented with a suspicion of BC, 133 had previously diagnosed disease (total of 195) and information was missing for one patient, and (2) in the study by Kriegmair and colleagues,70 29 patients were reported to have presented with suspicion of BC and 77 with previously diagnosed BC (total of 106), but only 104 patients were included in the analysis.
b Sex. This section sums to 2813 rather than 2807 because the study by Koenig and colleagues67 reported gender information for those enrolled (n = 55) rather than those analysed (n = 49).
The 27 diagnostic studies enrolled 2949 participants, with 2807 included in the analysis. In 19 studies51,53,57–63,65,66,70–72,77,78,80,81,84 involving 2327 participants, 946 (41%) presented with a suspicion of bladder cancer and 1381 (59%) had previously diagnosed bladder cancer. In two72,78 of these studies the whole patient population (n = 102) had a suspicion of bladder cancer and in three51,58,84 the whole population had previously diagnosed bladder cancer (n = 117). The remaining eight studies50,52,54,56,67,73,76,85 did not report this information. In total, 1850,53,54,56,58,59,61–63,67,70–
73,77,78,84,85 (67%) of 27 studies used 5-ALA as the photosensitising agent, five57,60,65,66,81 (19%) used HAL, two52,76 (7%) used hypericin and two51,80 used either 5-ALA or HAL but did report the number of patients receiving each agent.
Across 20 studies50,51,53,56,57,59–63,65–67,70,71,76,77,80,81,84 providing information on patient age, the median (range) of means was 67 years (52–72 years). In total, 18 studies50,53,54,57,60–63,65–67,70,71,76,77,80,81,84 provided information on the gender of 2157 participants, of whom 1647 (76%) were men and 510 (24%) were women.
Sixteen studies50,51,53,56,59–63,65,71,76,77,80,81,85 gave details of when they took place, with an earliest start date of February 199463 and latest end date of March 2006.51 Nine studies took place in Germany,54,56,58,61,70,71,80,84,85 three in the Netherlands,59,60,81 two each in Italy51,53 and Singapore50,76 and one each in Belgium,52 Switzerland,63 France,72 Austria,73 Poland,78 South Korea62 and China,77 and four had multinational
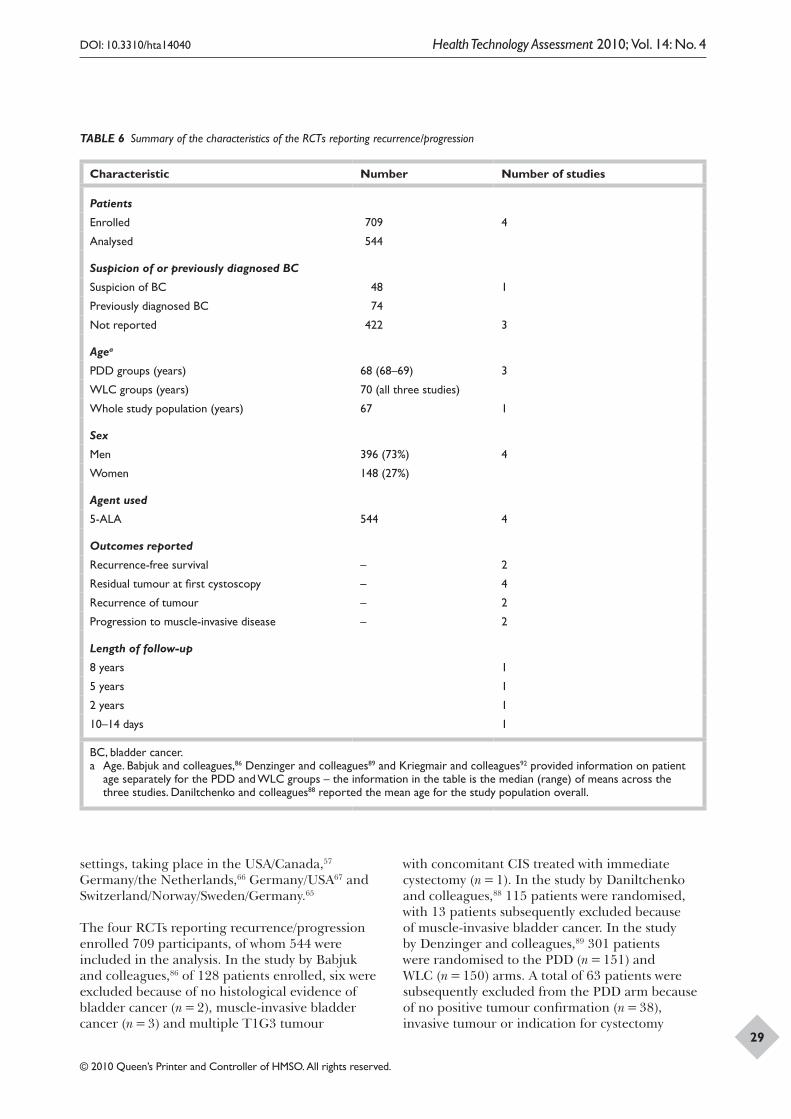
DOI: 10.3310/hta14040 Health Technology Assessment 2010; Vol. 14: No. 4
© 2010 Queen’s Printer and Controller of HMSO. All rights reserved.
29
TABLE 6 Summary of the characteristics of the RCTs reporting recurrence/progression
Characteristic Number Number of studies
Patients
Enrolled 709 4
Analysed 544
Suspicion of or previously diagnosed BC
Suspicion of BC 48 1
Previously diagnosed BC 74
Not reported 422 3
Agea
PDD groups (years) 68 (68–69) 3
WLC groups (years) 70 (all three studies)
Whole study population (years) 67 1
Sex
Men 396 (73%) 4
Women 148 (27%)
Agent used
5-ALA 544 4
Outcomes reported
Recurrence-free survival – 2
Residual tumour at first cystoscopy – 4
Recurrence of tumour – 2
Progression to muscle-invasive disease – 2
Length of follow-up
8 years 1
5 years 1
2 years 1
10–14 days 1
BC, bladder cancer.a Age. Babjuk and colleagues,86 Denzinger and colleagues89 and Kriegmair and colleagues92 provided information on patient
age separately for the PDD and WLC groups – the information in the table is the median (range) of means across the three studies. Daniltchenko and colleagues88 reported the mean age for the study population overall.
settings, taking place in the USA/Canada,57 Germany/the Netherlands,66 Germany/USA67 and Switzerland/Norway/Sweden/Germany.65
The four RCTs reporting recurrence/progression enrolled 709 participants, of whom 544 were included in the analysis. In the study by Babjuk and colleagues,86 of 128 patients enrolled, six were excluded because of no histological evidence of bladder cancer (n = 2), muscle-invasive bladder cancer (n = 3) and multiple T1G3 tumour
with concomitant CIS treated with immediate cystectomy (n = 1). In the study by Daniltchenko and colleagues,88 115 patients were randomised, with 13 patients subsequently excluded because of muscle-invasive bladder cancer. In the study by Denzinger and colleagues,89 301 patients were randomised to the PDD (n = 151) and WLC (n = 150) arms. A total of 63 patients were subsequently excluded from the PDD arm because of no positive tumour confirmation (n = 38), invasive tumour or indication for cystectomy
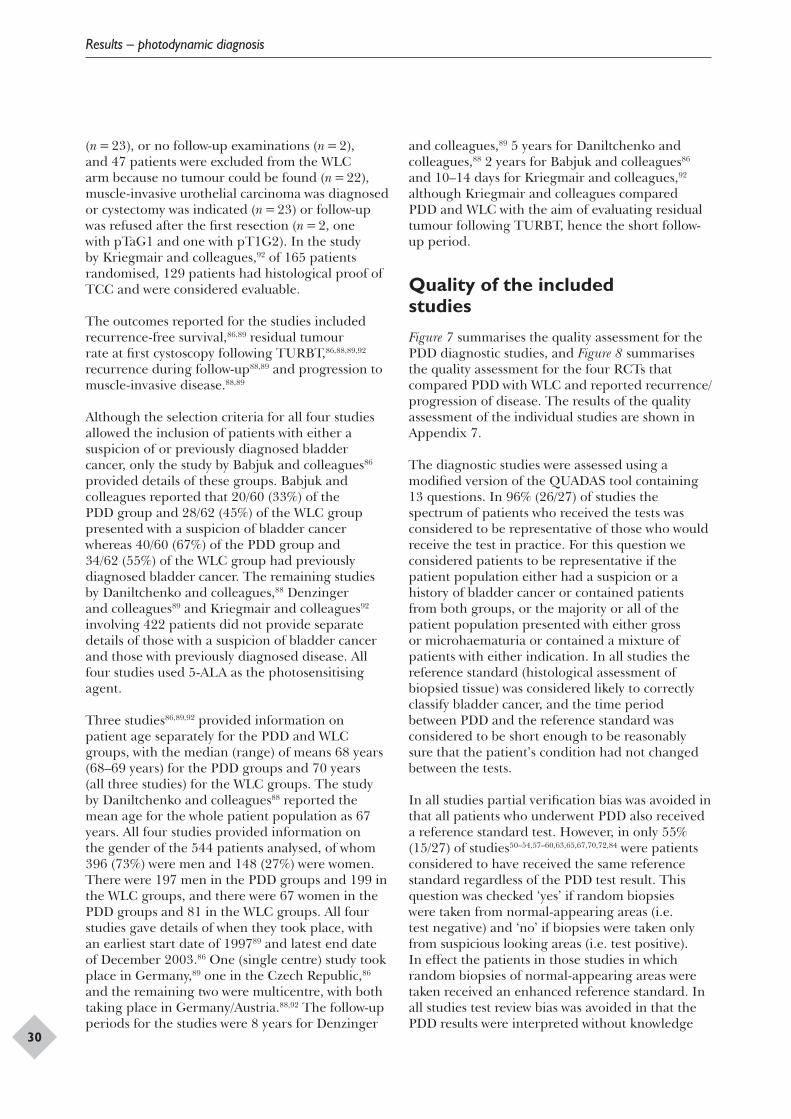
Results – photodynamic diagnosis
30
(n = 23), or no follow-up examinations (n = 2), and 47 patients were excluded from the WLC arm because no tumour could be found (n = 22), muscle-invasive urothelial carcinoma was diagnosed or cystectomy was indicated (n = 23) or follow-up was refused after the first resection (n = 2, one with pTaG1 and one with pT1G2). In the study by Kriegmair and colleagues,92 of 165 patients randomised, 129 patients had histological proof of TCC and were considered evaluable.
The outcomes reported for the studies included recurrence-free survival,86,89 residual tumour rate at first cystoscopy following TURBT,86,88,89,92 recurrence during follow-up88,89 and progression to muscle-invasive disease.88,89
Although the selection criteria for all four studies allowed the inclusion of patients with either a suspicion of or previously diagnosed bladder cancer, only the study by Babjuk and colleagues86 provided details of these groups. Babjuk and colleagues reported that 20/60 (33%) of the PDD group and 28/62 (45%) of the WLC group presented with a suspicion of bladder cancer whereas 40/60 (67%) of the PDD group and 34/62 (55%) of the WLC group had previously diagnosed bladder cancer. The remaining studies by Daniltchenko and colleagues,88 Denzinger and colleagues89 and Kriegmair and colleagues92 involving 422 patients did not provide separate details of those with a suspicion of bladder cancer and those with previously diagnosed disease. All four studies used 5-ALA as the photosensitising agent.
Three studies86,89,92 provided information on patient age separately for the PDD and WLC groups, with the median (range) of means 68 years (68–69 years) for the PDD groups and 70 years (all three studies) for the WLC groups. The study by Daniltchenko and colleagues88 reported the mean age for the whole patient population as 67 years. All four studies provided information on the gender of the 544 patients analysed, of whom 396 (73%) were men and 148 (27%) were women. There were 197 men in the PDD groups and 199 in the WLC groups, and there were 67 women in the PDD groups and 81 in the WLC groups. All four studies gave details of when they took place, with an earliest start date of 199789 and latest end date of December 2003.86 One (single centre) study took place in Germany,89 one in the Czech Republic,86 and the remaining two were multicentre, with both taking place in Germany/Austria.88,92 The follow-up periods for the studies were 8 years for Denzinger
and colleagues,89 5 years for Daniltchenko and colleagues,88 2 years for Babjuk and colleagues86 and 10–14 days for Kriegmair and colleagues,92 although Kriegmair and colleagues compared PDD and WLC with the aim of evaluating residual tumour following TURBT, hence the short follow-up period.
Quality of the included studiesFigure 7 summarises the quality assessment for the PDD diagnostic studies, and Figure 8 summarises the quality assessment for the four RCTs that compared PDD with WLC and reported recurrence/progression of disease. The results of the quality assessment of the individual studies are shown in Appendix 7.
The diagnostic studies were assessed using a modified version of the QUADAS tool containing 13 questions. In 96% (26/27) of studies the spectrum of patients who received the tests was considered to be representative of those who would receive the test in practice. For this question we considered patients to be representative if the patient population either had a suspicion or a history of bladder cancer or contained patients from both groups, or the majority or all of the patient population presented with either gross or microhaematuria or contained a mixture of patients with either indication. In all studies the reference standard (histological assessment of biopsied tissue) was considered likely to correctly classify bladder cancer, and the time period between PDD and the reference standard was considered to be short enough to be reasonably sure that the patient’s condition had not changed between the tests.
In all studies partial verification bias was avoided in that all patients who underwent PDD also received a reference standard test. However, in only 55% (15/27) of studies50–54,57–60,63,65,67,70,72,84 were patients considered to have received the same reference standard regardless of the PDD test result. This question was checked ‘yes’ if random biopsies were taken from normal-appearing areas (i.e. test negative) and ‘no’ if biopsies were taken only from suspicious looking areas (i.e. test positive). In effect the patients in those studies in which random biopsies of normal-appearing areas were taken received an enhanced reference standard. In all studies test review bias was avoided in that the PDD results were interpreted without knowledge
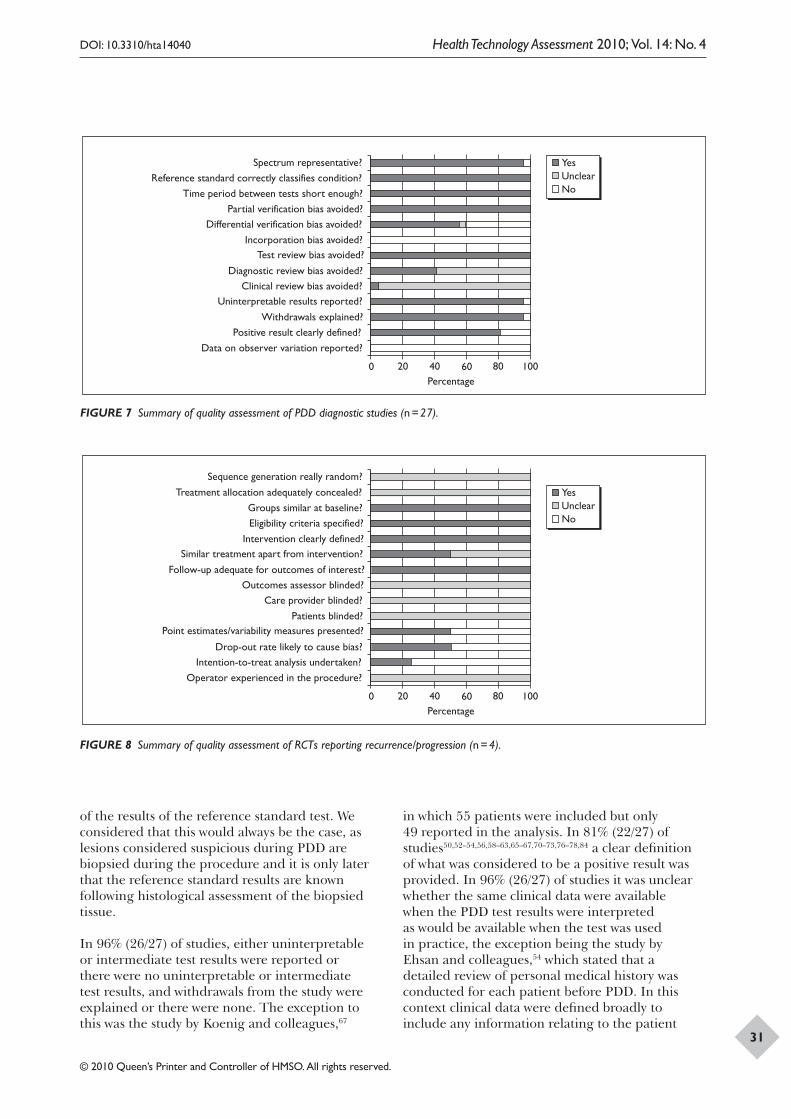
DOI: 10.3310/hta14040 Health Technology Assessment 2010; Vol. 14: No. 4
© 2010 Queen’s Printer and Controller of HMSO. All rights reserved.
31
Yes Unclear No
Spectrum representative? Reference standard correctly classifies condition?
Time period between tests short enough? Partial verification bias avoided?
Differential verification bias avoided? Incorporation bias avoided?
Diagnostic review bias avoided?
Test review bias avoided?
Clinical review bias avoided?Uninterpretable results reported?
Withdrawals explained? Positive result clearly defined?
Data on observer variation reported?
0 20 Percentage 40 60 80 100
Yes Unclear No
Sequence generation really random? Treatment allocation adequately concealed?
Groups similar at baseline? Eligibility criteria specified?
Intervention clearly defined? Similar treatment apart from intervention?
Outcomes assessor blinded? Follow-up adequate for outcomes of interest?
Care provider blinded?
Point estimates/variability measures presented?Patients blinded?
Drop-out rate likely to cause bias? Intention-to-treat analysis undertaken?
Operator experienced in the procedure?
0 20 Percentage 40 60 80 100
FIGURE 7 Summary of quality assessment of PDD diagnostic studies (n = 27).
FIGURE 8 Summary of quality assessment of RCTs reporting recurrence/progression (n = 4).
of the results of the reference standard test. We considered that this would always be the case, as lesions considered suspicious during PDD are biopsied during the procedure and it is only later that the reference standard results are known following histological assessment of the biopsied tissue.
In 96% (26/27) of studies, either uninterpretable or intermediate test results were reported or there were no uninterpretable or intermediate test results, and withdrawals from the study were explained or there were none. The exception to this was the study by Koenig and colleagues,67
in which 55 patients were included but only 49 reported in the analysis. In 81% (22/27) of studies50,52–54,56,58–63,65–67,70–73,76–78,84 a clear definition of what was considered to be a positive result was provided. In 96% (26/27) of studies it was unclear whether the same clinical data were available when the PDD test results were interpreted as would be available when the test was used in practice, the exception being the study by Ehsan and colleagues,54 which stated that a detailed review of personal medical history was conducted for each patient before PDD. In this context clinical data were defined broadly to include any information relating to the patient
Results – photodynamic diagnosis
32
such as age, gender, presence and severity of symptoms, and other test results. In 59% (16/27) of studies50,53,54,56,58,60,67,70–73,77,78,81,84,85 it was unclear whether the reference standard results were interpreted without knowledge of the results of the PDD test. All of the studies were judged to suffer from incorporation bias in that PDD was not considered to be independent of the reference standard test as the biopsies used for the reference standard were obtained via the PDD procedure. None of the studies provided information on observer variation in interpretation of test results.
The four RCTs,86,88,89,92 comparing PDD with WLC, were assessed using the 14-question checklist adapted from Verhagen and colleagues.47 In all four studies the groups were considered to be similar at baseline in terms of prognostic factors, eligibility criteria for the study were specified, and length of follow-up was considered adequate in relation to the outcomes of interest reported by the studies.
In all four studies it was unclear whether the sequence generation was really random, whether the treatment allocation was adequately concealed, whether the outcome assessors, care providers or patients were blinded to the PDD or WLC intervention, or whether the surgeon undertaking the operation was experienced in performing the procedure. In the studies by Denzinger and colleagues89 and Kriegmair and colleagues92 the withdrawal rate was considered likely to cause bias. In the studies by Babjuk and colleagues86 and Denzinger and colleagues89 the groups were considered to have been treated in the same way apart from the intervention received, whereas in the remaining two studies88,92 this was unclear. In the studies by Daniltchenko and colleagues88 and Denzinger and colleagues89 point estimates and measures of variability were presented for the primary outcome measures. Only the study by Kriegmair and colleagues92 included an intention to treat analysis.
Assessment of diagnostic accuracyOverviewThis section reports the diagnostic accuracy of PDD compared with WLC against a reference standard of histological assessment of biopsied tissue for the detection of non-muscle-invasive bladder cancer. The following levels of analysis are presented: patient, biopsy, stage/grade and photosensitising agent used. For patient and biopsy levels of analysis
figures are included showing the sensitivity and specificity of the individual studies, SROC curves and pooled estimates with 95% CIs for sensitivity, specificity, positive and negative likelihood ratios and DORs for PDD and WLC. For the stage/grade level of analysis the median (range) sensitivity and specificity across studies are presented for PDD and WLC. Appendix 8 shows the studies that reported sufficient information (true and false positives and negatives for both PDD and WLC) to allow their inclusion in the pooled estimates for patient- and biopsy-level analysis, and also those studies comparing PDD with WLC that reported the sensitivity of the tests in detecting tumour stage/grade. Individual study results are given in Appendix 9. The results of studies reporting sensitivity and specificity for PDD but not WLC were examined to assess whether they differed from those of the comparative studies.
Patient-level analysis
Although biopsy-level analysis is useful to validate the accuracy of the test, patient-level data are more useful in determining management. Five studies65,66,73,80,81 comparing PDD with WLC and enrolling 386 people, with 370 included in the analysis, provided sufficient information to allow their inclusion in the pooled estimates for patient-level analysis. In four studies,65,66,80,81 of 318 patients included in the analysis, 131 (41%) had symptoms suggestive of bladder cancer and 187 (59%) had a history of non-muscle-invasive bladder cancer. The study by Riedl and colleagues73 did not report this information. Three of the studies65,66,81 used HAL as the photosensitising agent and two73,80 used 5-ALA. In two65,73 of the studies random biopsies of normal-appearing areas were taken.
Figure 9 shows the sensitivity and specificity of the individual studies, SROC curves and pooled estimates for the sensitivity and specificity of PDD and WLC for patient-based detection of bladder cancer. The pooled sensitivity (95% CI) for PDD was 92% (80% to 100%) compared with 71% (49% to 93%) for WLC, whereas the pooled specificity (95% CI) for PDD was 57% (36% to 79%) compared with 72% (47% to 96%) for WLC. The pooled estimates show that PDD had higher sensitivity but lower specificity than WLC, with the CIs for the two techniques overlapping. None of the five studies comparing PDD with WLC reported test performance separately for the group of patients newly presenting with a suspicion of bladder cancer or for the group with a history of non-muscle-invasive disease. The DOR values (95% CI) were
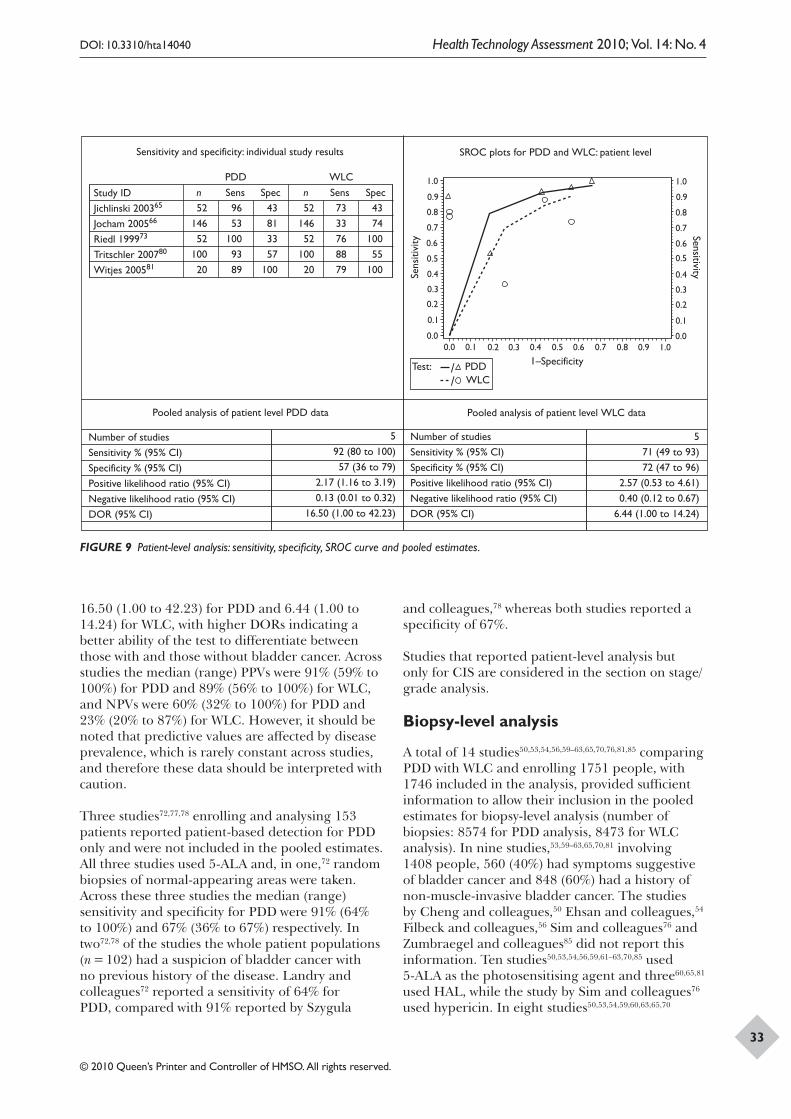
DOI: 10.3310/hta14040 Health Technology Assessment 2010; Vol. 14: No. 4
© 2010 Queen’s Printer and Controller of HMSO. All rights reserved.
33
Sensitivity and specificity: individual study results
Study IDJichlinski 200365
Jocham 200566
Riedl 199973
Tritschler 200780
Witjes 200581
PDD WLCn 52
14652
10020
n 52
14652
10020
Sens96 53
100 93 89
Sens73 33 76 88 79
Spec43 81 33 57
100
Spec43 74
100 55
100
SROC plots for PDD and WLC: patient level
Sens
itivi
ty
1.0
1.0
0.9
0.9
0.8
0.8
0.7
0.7
0.6
0.6
0.5
0.5
0.4
0.4
1–SpecificityTest: PDD// WLC
0.3
0.3
0.2
0.2
0.1
0.10.0
Sensitivity
1.0
0.9
0.8
0.7
0.6
0.5
0.4
0.3
0.2
0.1
0.00.0
592 (80 to 100)57 (36 to 79)
2.17 (1.16 to 3.19)0.13 (0.01 to 0.32)
16.50 (1.00 to 42.23)
571 (49 to 93)72 (47 to 96)
2.57 (0.53 to 4.61)0.40 (0.12 to 0.67)
6.44 (1.00 to 14.24)
Number of studiesSensitivity % (95% CI)Specificity % (95% CI)Positive likelihood ratio (95% CI)Negative likelihood ratio (95% CI)DOR (95% CI)
Pooled analysis of patient level PDD data
Number of studiesSensitivity % (95% CI)Specificity % (95% CI)Positive likelihood ratio (95% CI)Negative likelihood ratio (95% CI)DOR (95% CI)
Pooled analysis of patient level WLC data
16.50 (1.00 to 42.23) for PDD and 6.44 (1.00 to 14.24) for WLC, with higher DORs indicating a better ability of the test to differentiate between those with and those without bladder cancer. Across studies the median (range) PPVs were 91% (59% to 100%) for PDD and 89% (56% to 100%) for WLC, and NPVs were 60% (32% to 100%) for PDD and 23% (20% to 87%) for WLC. However, it should be noted that predictive values are affected by disease prevalence, which is rarely constant across studies, and therefore these data should be interpreted with caution.
Three studies72,77,78 enrolling and analysing 153 patients reported patient-based detection for PDD only and were not included in the pooled estimates. All three studies used 5-ALA and, in one,72 random biopsies of normal-appearing areas were taken. Across these three studies the median (range) sensitivity and specificity for PDD were 91% (64% to 100%) and 67% (36% to 67%) respectively. In two72,78 of the studies the whole patient populations (n = 102) had a suspicion of bladder cancer with no previous history of the disease. Landry and colleagues72 reported a sensitivity of 64% for PDD, compared with 91% reported by Szygula
and colleagues,78 whereas both studies reported a specificity of 67%.
Studies that reported patient-level analysis but only for CIS are considered in the section on stage/grade analysis.
Biopsy-level analysis
A total of 14 studies50,53,54,56,59–63,65,70,76,81,85 comparing PDD with WLC and enrolling 1751 people, with 1746 included in the analysis, provided sufficient information to allow their inclusion in the pooled estimates for biopsy-level analysis (number of biopsies: 8574 for PDD analysis, 8473 for WLC analysis). In nine studies,53,59–63,65,70,81 involving 1408 people, 560 (40%) had symptoms suggestive of bladder cancer and 848 (60%) had a history of non-muscle-invasive bladder cancer. The studies by Cheng and colleagues,50 Ehsan and colleagues,54 Filbeck and colleagues,56 Sim and colleagues76 and Zumbraegel and colleagues85 did not report this information. Ten studies50,53,54,56,59,61–63,70,85 used 5-ALA as the photosensitising agent and three60,65,81 used HAL, while the study by Sim and colleagues76 used hypericin. In eight studies50,53,54,59,60,63,65,70
FIGURE 9 Patient-level analysis: sensitivity, specificity, SROC curve and pooled estimates.
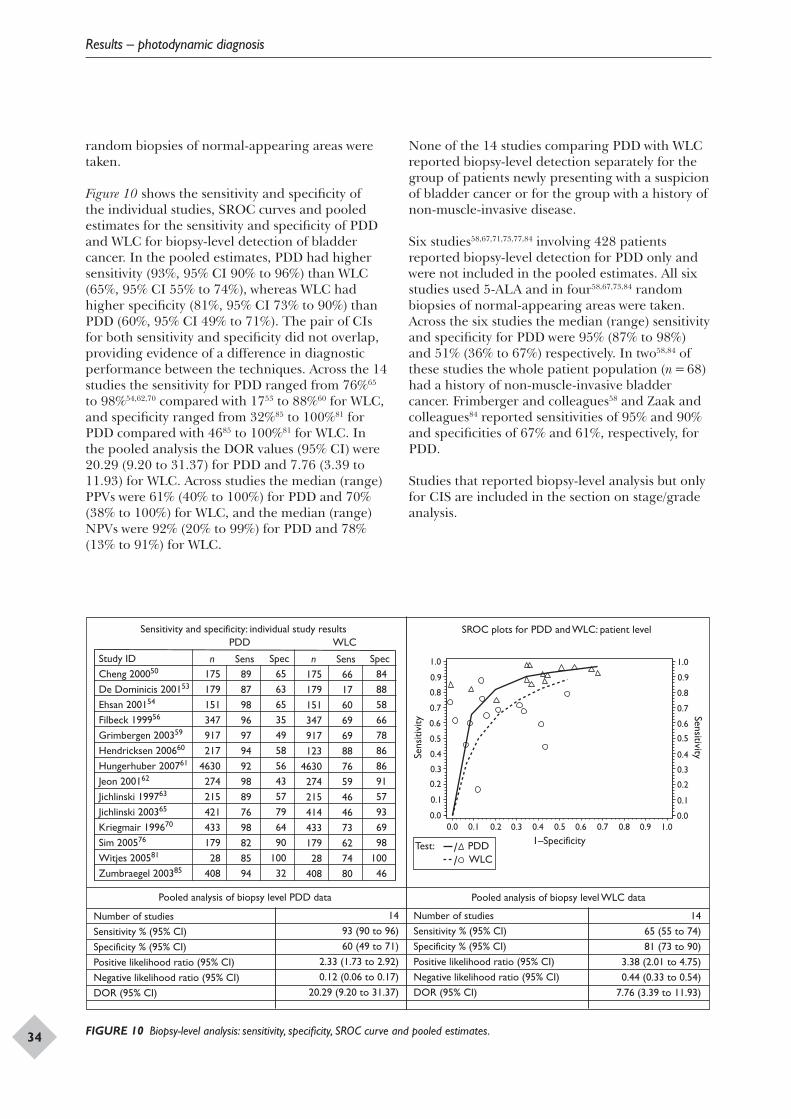
Results – photodynamic diagnosis
34
random biopsies of normal-appearing areas were taken.
Figure 10 shows the sensitivity and specificity of the individual studies, SROC curves and pooled estimates for the sensitivity and specificity of PDD and WLC for biopsy-level detection of bladder cancer. In the pooled estimates, PDD had higher sensitivity (93%, 95% CI 90% to 96%) than WLC (65%, 95% CI 55% to 74%), whereas WLC had higher specificity (81%, 95% CI 73% to 90%) than PDD (60%, 95% CI 49% to 71%). The pair of CIs for both sensitivity and specificity did not overlap, providing evidence of a difference in diagnostic performance between the techniques. Across the 14 studies the sensitivity for PDD ranged from 76%65 to 98%54,62,70 compared with 1753 to 88%60 for WLC, and specificity ranged from 32%85 to 100%81 for PDD compared with 4685 to 100%81 for WLC. In the pooled analysis the DOR values (95% CI) were 20.29 (9.20 to 31.37) for PDD and 7.76 (3.39 to 11.93) for WLC. Across studies the median (range) PPVs were 61% (40% to 100%) for PDD and 70% (38% to 100%) for WLC, and the median (range) NPVs were 92% (20% to 99%) for PDD and 78% (13% to 91%) for WLC.
None of the 14 studies comparing PDD with WLC reported biopsy-level detection separately for the group of patients newly presenting with a suspicion of bladder cancer or for the group with a history of non-muscle-invasive disease.
Six studies58,67,71,73,77,84 involving 428 patients reported biopsy-level detection for PDD only and were not included in the pooled estimates. All six studies used 5-ALA and in four58,67,73,84 random biopsies of normal-appearing areas were taken. Across the six studies the median (range) sensitivity and specificity for PDD were 95% (87% to 98%) and 51% (36% to 67%) respectively. In two58,84 of these studies the whole patient population (n = 68) had a history of non-muscle-invasive bladder cancer. Frimberger and colleagues58 and Zaak and colleagues84 reported sensitivities of 95% and 90% and specificities of 67% and 61%, respectively, for PDD.
Studies that reported biopsy-level analysis but only for CIS are included in the section on stage/grade analysis.
Sensitivity and specificity: individual study results PDD WLC
SROC plots for PDD and WLC: patient level
Sens
itivi
ty
1.0
1.0
0.9
0.9
0.8
0.8
0.7
0.7
0.6
0.6
0.5
0.5
0.4
0.4
1–Specificity Test: PDD / / WLC
0.3
0.3
0.2
0.2
0.1
0.1 0.0
Sensitivity
1.0
0.9
0.8
0.7
0.6
0.5
0.4
0.3
0.2
0.1
0.0 0.0
Number of studies Sensitivity % (95% CI) Specificity % (95% CI) Positive likelihood ratio (95% CI) Negative likelihood ratio (95% CI) DOR (95% CI)
Pooled analysis of biopsy level PDD data Number of studies Sensitivity % (95% CI) Specificity % (95% CI) Positive likelihood ratio (95% CI) Negative likelihood ratio (95% CI) DOR (95% CI)
Pooled analysis of biopsy level WLC data
Study ID Cheng 200050
De Dominicis 200153
Ehsan 200154
Filbeck 199956
Grimbergen 200359
Hendricksen 200660
Hungerhuber 200761
Jeon 200162
Jichlinski 199763
Jichlinski 200365
Kriegmair 199670
Sim 200576
Witjes 200581
Zumbraegel 200385
n 175 179 151 347 917 217
4630 274 215 421 433 179 28
408
n 175 179 151 347 917 123
4630 274 215 414 433 179 28
408
Sens 89 87 98 96 97 94 92 98 89 76 98 82 85 94
Sens 66 17 60 69 69 88 76 59 46 46 73 62 74 80
Spec 65 63 65 35 49 58 56 43 57 79 64 90
100 32
Spec84 88 58 66 78 86 86 91 57 93 69 98
100 46
14 93 (90 to 96) 60 (49 to 71)
2.33 (1.73 to 2.92) 0.12 (0.06 to 0.17)
20.29 (9.20 to 31.37)
14 65 (55 to 74) 81 (73 to 90)
3.38 (2.01 to 4.75) 0.44 (0.33 to 0.54)
7.76 (3.39 to 11.93)
FIGURE 10 Biopsy-level analysis: sensitivity, specificity, SROC curve and pooled estimates.
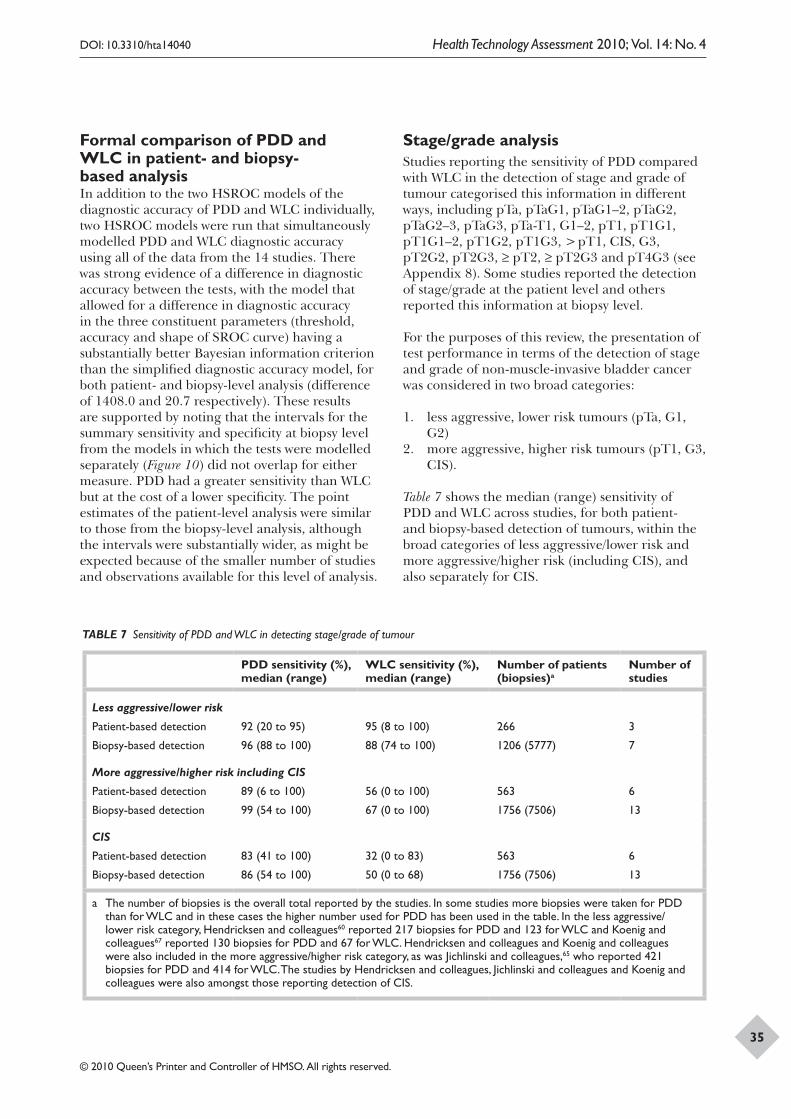
DOI: 10.3310/hta14040 Health Technology Assessment 2010; Vol. 14: No. 4
© 2010 Queen’s Printer and Controller of HMSO. All rights reserved.
35
Formal comparison of PDD and WLC in patient- and biopsy-based analysisIn addition to the two HSROC models of the diagnostic accuracy of PDD and WLC individually, two HSROC models were run that simultaneously modelled PDD and WLC diagnostic accuracy using all of the data from the 14 studies. There was strong evidence of a difference in diagnostic accuracy between the tests, with the model that allowed for a difference in diagnostic accuracy in the three constituent parameters (threshold, accuracy and shape of SROC curve) having a substantially better Bayesian information criterion than the simplified diagnostic accuracy model, for both patient- and biopsy-level analysis (difference of 1408.0 and 20.7 respectively). These results are supported by noting that the intervals for the summary sensitivity and specificity at biopsy level from the models in which the tests were modelled separately (Figure 10) did not overlap for either measure. PDD had a greater sensitivity than WLC but at the cost of a lower specificity. The point estimates of the patient-level analysis were similar to those from the biopsy-level analysis, although the intervals were substantially wider, as might be expected because of the smaller number of studies and observations available for this level of analysis.
Stage/grade analysisStudies reporting the sensitivity of PDD compared with WLC in the detection of stage and grade of tumour categorised this information in different ways, including pTa, pTaG1, pTaG1–2, pTaG2, pTaG2–3, pTaG3, pTa-T1, G1–2, pT1, pT1G1, pT1G1–2, pT1G2, pT1G3, > pT1, CIS, G3, pT2G2, pT2G3, ≥ pT2, ≥ pT2G3 and pT4G3 (see Appendix 8). Some studies reported the detection of stage/grade at the patient level and others reported this information at biopsy level.
For the purposes of this review, the presentation of test performance in terms of the detection of stage and grade of non-muscle-invasive bladder cancer was considered in two broad categories:
1. less aggressive, lower risk tumours (pTa, G1, G2)
2. more aggressive, higher risk tumours (pT1, G3, CIS).
Table 7 shows the median (range) sensitivity of PDD and WLC across studies, for both patient- and biopsy-based detection of tumours, within the broad categories of less aggressive/lower risk and more aggressive/higher risk (including CIS), and also separately for CIS.
TABLE 7 Sensitivity of PDD and WLC in detecting stage/grade of tumour
PDD sensitivity (%), median (range)
WLC sensitivity (%), median (range)
Number of patients (biopsies)a
Number of studies
Less aggressive/lower risk
Patient-based detection 92 (20 to 95) 95 (8 to 100) 266 3
Biopsy-based detection 96 (88 to 100) 88 (74 to 100) 1206 (5777) 7
More aggressive/higher risk including CIS
Patient-based detection 89 (6 to 100) 56 (0 to 100) 563 6
Biopsy-based detection 99 (54 to 100) 67 (0 to 100) 1756 (7506) 13
CIS
Patient-based detection 83 (41 to 100) 32 (0 to 83) 563 6
Biopsy-based detection 86 (54 to 100) 50 (0 to 68) 1756 (7506) 13
a The number of biopsies is the overall total reported by the studies. In some studies more biopsies were taken for PDD than for WLC and in these cases the higher number used for PDD has been used in the table. In the less aggressive/lower risk category, Hendricksen and colleagues60 reported 217 biopsies for PDD and 123 for WLC and Koenig and colleagues67 reported 130 biopsies for PDD and 67 for WLC. Hendricksen and colleagues and Koenig and colleagues were also included in the more aggressive/higher risk category, as was Jichlinski and colleagues,65 who reported 421 biopsies for PDD and 414 for WLC. The studies by Hendricksen and colleagues, Jichlinski and colleagues and Koenig and colleagues were also amongst those reporting detection of CIS.
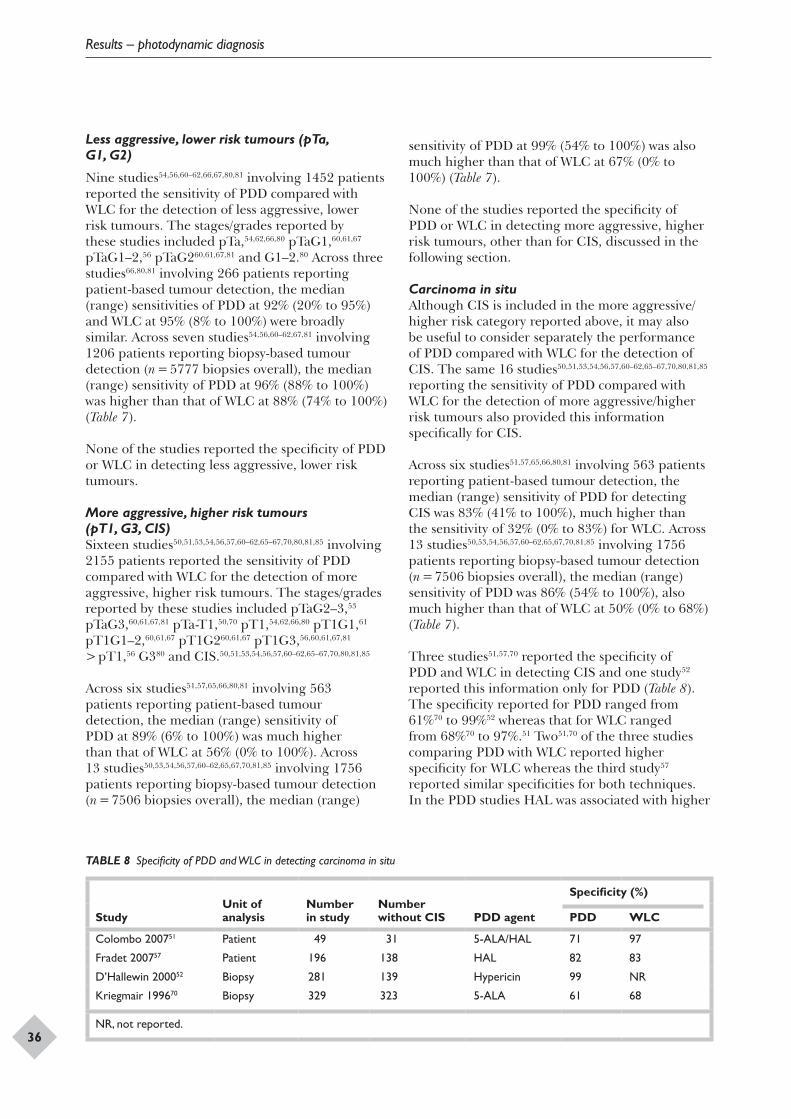
Results – photodynamic diagnosis
36
Less aggressive, lower risk tumours (pTa, G1, G2)
Nine studies54,56,60–62,66,67,80,81 involving 1452 patients reported the sensitivity of PDD compared with WLC for the detection of less aggressive, lower risk tumours. The stages/grades reported by these studies included pTa,54,62,66,80 pTaG1,60,61,67 pTaG1–2,56 pTaG260,61,67,81 and G1–2.80 Across three studies66,80,81 involving 266 patients reporting patient-based tumour detection, the median (range) sensitivities of PDD at 92% (20% to 95%) and WLC at 95% (8% to 100%) were broadly similar. Across seven studies54,56,60–62,67,81 involving 1206 patients reporting biopsy-based tumour detection (n = 5777 biopsies overall), the median (range) sensitivity of PDD at 96% (88% to 100%) was higher than that of WLC at 88% (74% to 100%) (Table 7).
None of the studies reported the specificity of PDD or WLC in detecting less aggressive, lower risk tumours.
More aggressive, higher risk tumours (pT1, G3, CIS)Sixteen studies50,51,53,54,56,57,60–62,65–67,70,80,81,85 involving 2155 patients reported the sensitivity of PDD compared with WLC for the detection of more aggressive, higher risk tumours. The stages/grades reported by these studies included pTaG2–3,53 pTaG3,60,61,67,81 pTa-T1,50,70 pT1,54,62,66,80 pT1G1,61 pT1G1–2,60,61,67 pT1G260,61,67 pT1G3,56,60,61,67,81 > pT1,56 G380 and CIS.50,51,53,54,56,57,60–62,65–67,70,80,81,85
Across six studies51,57,65,66,80,81 involving 563 patients reporting patient-based tumour detection, the median (range) sensitivity of PDD at 89% (6% to 100%) was much higher than that of WLC at 56% (0% to 100%). Across 13 studies50,53,54,56,57,60–62,65,67,70,81,85 involving 1756 patients reporting biopsy-based tumour detection (n = 7506 biopsies overall), the median (range)
sensitivity of PDD at 99% (54% to 100%) was also much higher than that of WLC at 67% (0% to 100%) (Table 7).
None of the studies reported the specificity of PDD or WLC in detecting more aggressive, higher risk tumours, other than for CIS, discussed in the following section.
Carcinoma in situAlthough CIS is included in the more aggressive/higher risk category reported above, it may also be useful to consider separately the performance of PDD compared with WLC for the detection of CIS. The same 16 studies50,51,53,54,56,57,60–62,65–67,70,80,81,85 reporting the sensitivity of PDD compared with WLC for the detection of more aggressive/higher risk tumours also provided this information specifically for CIS.
Across six studies51,57,65,66,80,81 involving 563 patients reporting patient-based tumour detection, the median (range) sensitivity of PDD for detecting CIS was 83% (41% to 100%), much higher than the sensitivity of 32% (0% to 83%) for WLC. Across 13 studies50,53,54,56,57,60–62,65,67,70,81,85 involving 1756 patients reporting biopsy-based tumour detection (n = 7506 biopsies overall), the median (range) sensitivity of PDD was 86% (54% to 100%), also much higher than that of WLC at 50% (0% to 68%) (Table 7).
Three studies51,57,70 reported the specificity of PDD and WLC in detecting CIS and one study52 reported this information only for PDD (Table 8). The specificity reported for PDD ranged from 61%70 to 99%52 whereas that for WLC ranged from 68%70 to 97%.51 Two51,70 of the three studies comparing PDD with WLC reported higher specificity for WLC whereas the third study57 reported similar specificities for both techniques. In the PDD studies HAL was associated with higher
TABLE 8 Specificity of PDD and WLC in detecting carcinoma in situ
StudyUnit of analysis
Number in study
Number without CIS PDD agent
Specificity (%)
PDD WLC
Colombo 200751 Patient 49 31 5-ALA/HAL 71 97
Fradet 200757 Patient 196 138 HAL 82 83
D’Hallewin 200052 Biopsy 281 139 Hypericin 99 NR
Kriegmair 199670 Biopsy 329 323 5-ALA 61 68
NR, not reported.
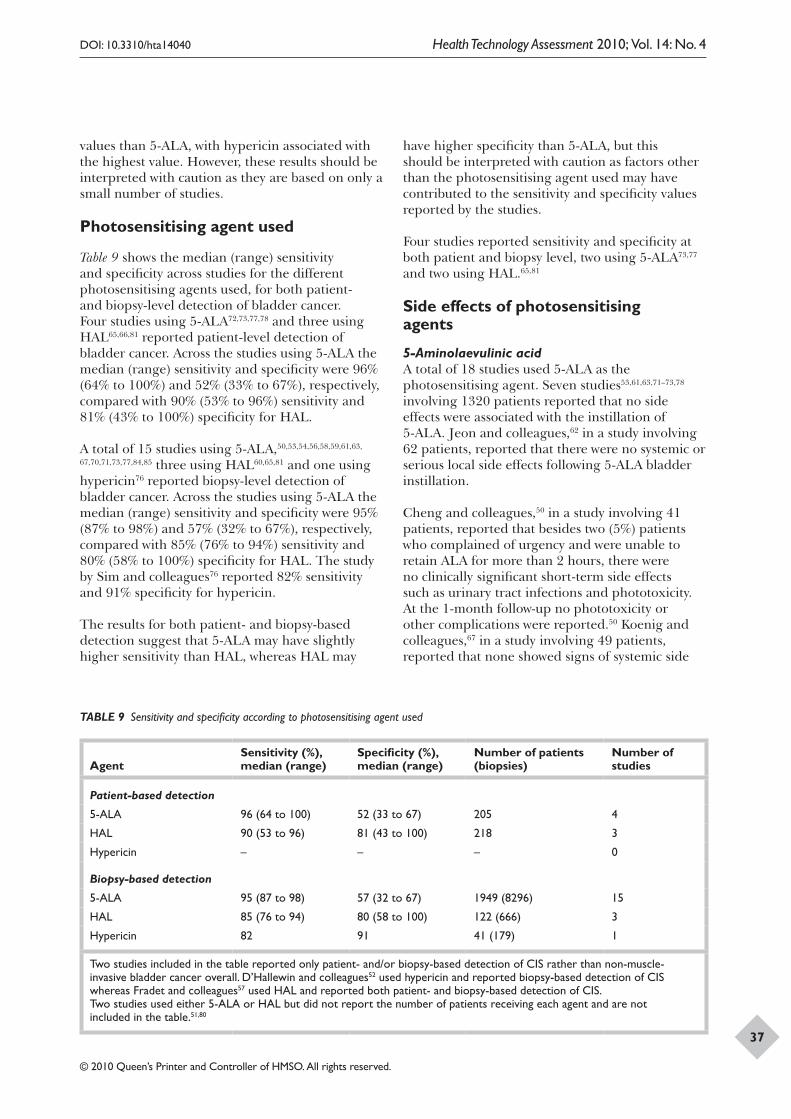
DOI: 10.3310/hta14040 Health Technology Assessment 2010; Vol. 14: No. 4
© 2010 Queen’s Printer and Controller of HMSO. All rights reserved.
37
values than 5-ALA, with hypericin associated with the highest value. However, these results should be interpreted with caution as they are based on only a small number of studies.
Photosensitising agent used
Table 9 shows the median (range) sensitivity and specificity across studies for the different photosensitising agents used, for both patient- and biopsy-level detection of bladder cancer. Four studies using 5-ALA72,73,77,78 and three using HAL65,66,81 reported patient-level detection of bladder cancer. Across the studies using 5-ALA the median (range) sensitivity and specificity were 96% (64% to 100%) and 52% (33% to 67%), respectively, compared with 90% (53% to 96%) sensitivity and 81% (43% to 100%) specificity for HAL.
A total of 15 studies using 5-ALA,50,53,54,56,58,59,61,63,
67,70,71,73,77,84,85 three using HAL60,65,81 and one using hypericin76 reported biopsy-level detection of bladder cancer. Across the studies using 5-ALA the median (range) sensitivity and specificity were 95% (87% to 98%) and 57% (32% to 67%), respectively, compared with 85% (76% to 94%) sensitivity and 80% (58% to 100%) specificity for HAL. The study by Sim and colleagues76 reported 82% sensitivity and 91% specificity for hypericin.
The results for both patient- and biopsy-based detection suggest that 5-ALA may have slightly higher sensitivity than HAL, whereas HAL may
have higher specificity than 5-ALA, but this should be interpreted with caution as factors other than the photosensitising agent used may have contributed to the sensitivity and specificity values reported by the studies.
Four studies reported sensitivity and specificity at both patient and biopsy level, two using 5-ALA73,77 and two using HAL.65,81
Side effects of photosensitising agents
5-Aminolaevulinic acidA total of 18 studies used 5-ALA as the photosensitising agent. Seven studies53,61,63,71–73,78 involving 1320 patients reported that no side effects were associated with the instillation of 5-ALA. Jeon and colleagues,62 in a study involving 62 patients, reported that there were no systemic or serious local side effects following 5-ALA bladder instillation.
Cheng and colleagues,50 in a study involving 41 patients, reported that besides two (5%) patients who complained of urgency and were unable to retain ALA for more than 2 hours, there were no clinically significant short-term side effects such as urinary tract infections and phototoxicity. At the 1-month follow-up no phototoxicity or other complications were reported.50 Koenig and colleagues,67 in a study involving 49 patients, reported that none showed signs of systemic side
TABLE 9 Sensitivity and specificity according to photosensitising agent used
AgentSensitivity (%), median (range)
Specificity (%), median (range)
Number of patients (biopsies)
Number of studies
Patient-based detection
5-ALA 96 (64 to 100) 52 (33 to 67) 205 4
HAL 90 (53 to 96) 81 (43 to 100) 218 3
Hypericin – – – 0
Biopsy-based detection
5-ALA 95 (87 to 98) 57 (32 to 67) 1949 (8296) 15
HAL 85 (76 to 94) 80 (58 to 100) 122 (666) 3
Hypericin 82 91 41 (179) 1
Two studies included in the table reported only patient- and/or biopsy-based detection of CIS rather than non-muscle-invasive bladder cancer overall. D’Hallewin and colleagues52 used hypericin and reported biopsy-based detection of CIS whereas Fradet and colleagues57 used HAL and reported both patient- and biopsy-based detection of CIS.Two studies used either 5-ALA or HAL but did not report the number of patients receiving each agent and are not included in the table.51,80
Results – photodynamic diagnosis
38
effects of PDD such as phototoxicity. One patient reported transient (< 24 hours) dysuria and one patient developed a urinary tract infection, which was treated with antibiotics.67 Song and colleagues,77 in a study involving 51 patients, reported that one cases of acute cystitis was accompanied by haemorrhagic lesion attributed to the instillation procedure (i.e. chemical cystitis).
Kriegmair and colleagues,71 in a study involving 104 patients, reported that no serious side effects were observed during or after 5-ALA instillation. However, following instillation seven patients reported urgency. After the PDD procedure, more severe alginuresis symptoms and pollakiuria were detected in four patients. Significant gram-negative bacteriuria was detected in three patients but the symptoms improved rapidly with appropriate antibiotics and spasmolytic agents. Phototoxicity was not detected in any patient.71
Five studies54,56,58,59,84 did not mention side effects.
HexaminolaevulinateFive studies used HAL as the photosensitising agent. In the studies by Jichlinski and colleagues65 and Witjes and colleagues81 adverse events were reported in 40 of 52 and 4 of 20 patients, respectively, although none was considered to be related to HAL instillation. Fradet and colleagues57 and Jocham and colleagues66 both reported that HAL was well tolerated. In the study by Fradet and colleagues,57 800 adverse events were reported by 240 of the 298 patients in the safety set, of which 19 (2.4%) were considered to be related to HAL instillation, none of which was serious. Twenty patients experienced a total of 23 serious adverse events, including one death due to an aortic aneurysm, which was unrelated to HAL instillation.57 In the study by Jocham and colleagues66 75 adverse events were reported by 47 of 162 patients, of which two (2.7%) were considered treatment related, with both occurring in the same patient (urinary retention and micturition urgency).
The study by Hendricksen and colleagues60 did not mention side effects.
5-Aminolaevulinic acid/hexaminolaevulinate not reported separatelyTwo studies51,80 involving 149 patients used 5-ALA or HAL but did not report the number of patients who received each agent. In the study by Colombo and colleagues,51 no systemic side effects related
to the PDD procedure were reported and any local side effects were referred to as negligible. Tritschler and colleagues80 did not mention side effects.
HypericinTwo studies used hypericin. D’Hallewin and colleagues,52 in a study involving 40 patients, reported that there were no significant local or systemic side effects caused by the instillation of hypericin. In the study by Sim and colleagues,76 involving 41 patients, there were no reports of urinary tract infections, contracted bladder, photosensitivity or allergies. One patient developed microscopic haematuria from cystitis, which resolved on conservative management.76
Recurrence/progression of diseaseOverviewThis section presents the results of the four RCTs86,88,89,92 comparing PDD with WLC and reporting the effectiveness outcomes of recurrence-free survival, residual tumour rate at first cystoscopy following TURBT, recurrence rate during follow-up and tumour progression. Random-effects meta-analyses using RR as the effect measure are presented comparing PDD and WLC in terms of these outcomes.
The RCTs enrolled 709 participants, with 544 included in the analysis. In the study by Daniltchenko and colleagues88 the groups were randomised to WLC or PDD, whereas in the studies by Babjuk and colleagues,86 Denzinger and colleagues89 and Kriegmair and colleagues92 the groups were randomised to WLC or WLC and PDD. The follow-up periods varied from 10–14 days for the study by Kriegmair and colleagues,92 which evaluated residual tumour following TURBT, to 2 years for the study by Babjuk and colleagues,86 5 years for the study by Daniltchenko and colleagues88 and 8 years for the study by Denzinger and colleagues.89 All four studies used 5-ALA as the photosensitising agent. Individual study results are given in Appendix 9.
In the study by Babjuk and colleagues86 none of the randomised patients with grade 1 or grade 2 tumours received adjuvant intravesical therapy during the study. All patients with grade 3 tumours (six in the PDD group and seven in the WLC group) received intravesical BCG immunotherapy, based on a standard 6-week course followed by three, weekly instillations (3-
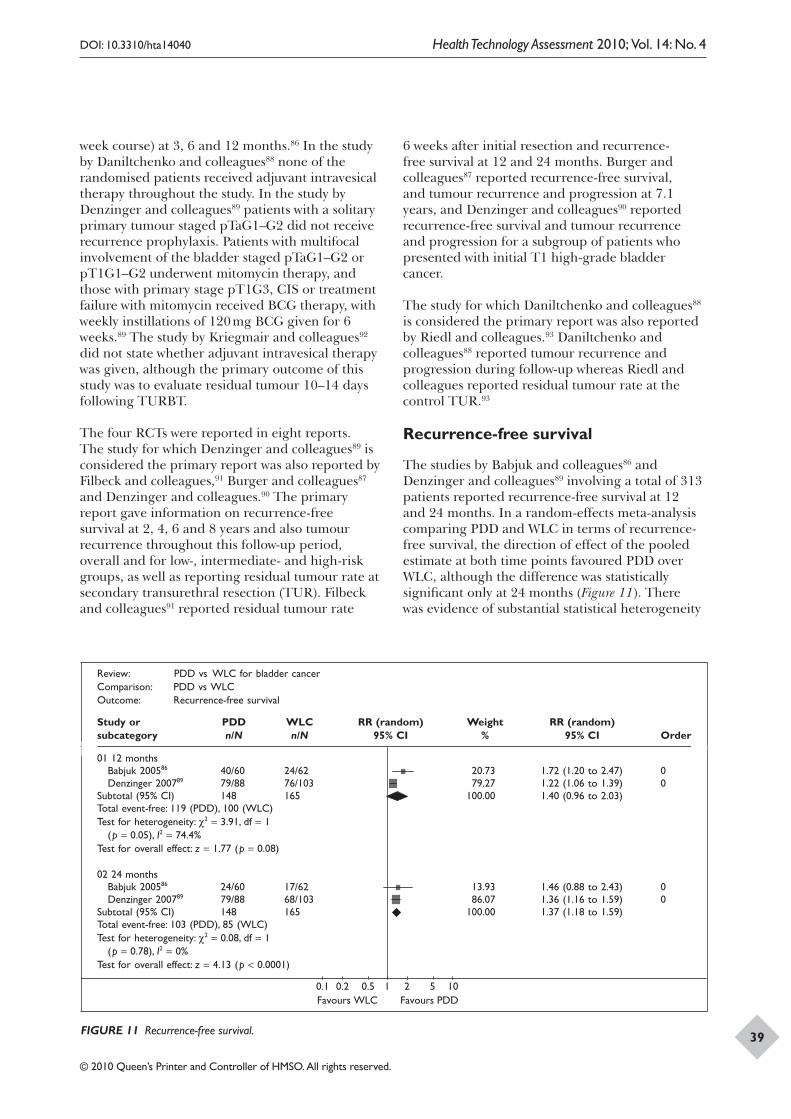
DOI: 10.3310/hta14040 Health Technology Assessment 2010; Vol. 14: No. 4
© 2010 Queen’s Printer and Controller of HMSO. All rights reserved.
39
week course) at 3, 6 and 12 months.86 In the study by Daniltchenko and colleagues88 none of the randomised patients received adjuvant intravesical therapy throughout the study. In the study by Denzinger and colleagues89 patients with a solitary primary tumour staged pTaG1–G2 did not receive recurrence prophylaxis. Patients with multifocal involvement of the bladder staged pTaG1–G2 or pT1G1–G2 underwent mitomycin therapy, and those with primary stage pT1G3, CIS or treatment failure with mitomycin received BCG therapy, with weekly instillations of 120 mg BCG given for 6 weeks.89 The study by Kriegmair and colleagues92 did not state whether adjuvant intravesical therapy was given, although the primary outcome of this study was to evaluate residual tumour 10–14 days following TURBT.
The four RCTs were reported in eight reports. The study for which Denzinger and colleagues89 is considered the primary report was also reported by Filbeck and colleagues,91 Burger and colleagues87 and Denzinger and colleagues.90 The primary report gave information on recurrence-free survival at 2, 4, 6 and 8 years and also tumour recurrence throughout this follow-up period, overall and for low-, intermediate- and high-risk groups, as well as reporting residual tumour rate at secondary transurethral resection (TUR). Filbeck and colleagues91 reported residual tumour rate
6 weeks after initial resection and recurrence-free survival at 12 and 24 months. Burger and colleagues87 reported recurrence-free survival, and tumour recurrence and progression at 7.1 years, and Denzinger and colleagues90 reported recurrence-free survival and tumour recurrence and progression for a subgroup of patients who presented with initial T1 high-grade bladder cancer.
The study for which Daniltchenko and colleagues88 is considered the primary report was also reported by Riedl and colleagues.93 Daniltchenko and colleagues88 reported tumour recurrence and progression during follow-up whereas Riedl and colleagues reported residual tumour rate at the control TUR.93
Recurrence-free survival
The studies by Babjuk and colleagues86 and Denzinger and colleagues89 involving a total of 313 patients reported recurrence-free survival at 12 and 24 months. In a random-effects meta-analysis comparing PDD and WLC in terms of recurrence-free survival, the direction of effect of the pooled estimate at both time points favoured PDD over WLC, although the difference was statistically significant only at 24 months (Figure 11). There was evidence of substantial statistical heterogeneity
Review: PDD vs WLC for bladder cancerComparison: PDD vs WLCOutcome: Recurrence-free survival
Study or subcategory
PDDn/N
WLCn/N
RR (random) 95% CI
Weight %
RR (random) 95% CI Order
01 12 monthsBabjuk 200586 40/60 24/62 20.73 1.72 (1.20 to 2.47) 0Denzinger 200789 79/88 76/103 79.27 1.22 (1.06 to 1.39) 0
Subtotal (95% CI) 148 165 100.00 1.40 (0.96 to 2.03)Total event-free: 119 (PDD), 100 (WLC)Test for heterogeneity: χ2 = 3.91, df = 1
(p = 0.05), I2 = 74.4%Test for overall effect: z = 1.77 (p = 0.08)
02 24 monthsBabjuk 200586 24/60 17/62 13.93 1.46 (0.88 to 2.43) 0Denzinger 200789 79/88 68/103 86.07 1.36 (1.16 to 1.59) 0
Subtotal (95% CI) 148 165 100.00 1.37 (1.18 to 1.59)Total event-free: 103 (PDD), 85 (WLC)Test for heterogeneity: χ2 = 0.08, df = 1
(p = 0.78), I2 = 0%Test for overall effect: z = 4.13 (p < 0.0001)
0.1 0.2 0.5 1 2 5 10Favours WLC Favours PDD
FIGURE 11 Recurrence-free survival.
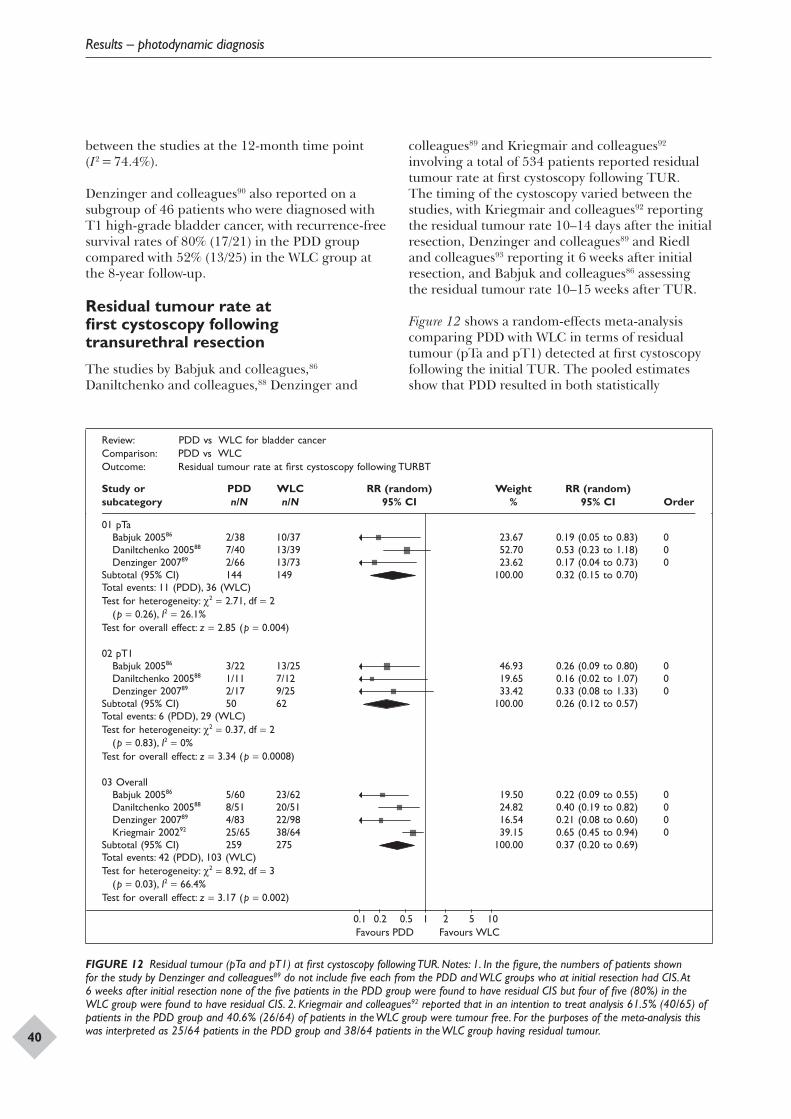
Results – photodynamic diagnosis
40
between the studies at the 12-month time point (I2 = 74.4%).
Denzinger and colleagues90 also reported on a subgroup of 46 patients who were diagnosed with T1 high-grade bladder cancer, with recurrence-free survival rates of 80% (17/21) in the PDD group compared with 52% (13/25) in the WLC group at the 8-year follow-up.
Residual tumour rate at first cystoscopy following transurethral resectionThe studies by Babjuk and colleagues,86 Daniltchenko and colleagues,88 Denzinger and
colleagues89 and Kriegmair and colleagues92 involving a total of 534 patients reported residual tumour rate at first cystoscopy following TUR. The timing of the cystoscopy varied between the studies, with Kriegmair and colleagues92 reporting the residual tumour rate 10–14 days after the initial resection, Denzinger and colleagues89 and Riedl and colleagues93 reporting it 6 weeks after initial resection, and Babjuk and colleagues86 assessing the residual tumour rate 10–15 weeks after TUR.
Figure 12 shows a random-effects meta-analysis comparing PDD with WLC in terms of residual tumour (pTa and pT1) detected at first cystoscopy following the initial TUR. The pooled estimates show that PDD resulted in both statistically
Review: PDD vs WLC for bladder cancerComparison: PDD vs WLCOutcome: Residual tumour rate at first cystoscopy following TURBT
Study or subcategory
PDDn/N
WLCn/N
RR (random) 95% CI
Weight %
RR (random) 95% CI Order
01 pTaBabjuk 200586 2/38 10/37 23.67 0.19 (0.05 to 0.83) 0Daniltchenko 200588 7/40 13/39 52.70 0.53 (0.23 to 1.18) 0Denzinger 200789 2/66 13/73 23.62 0.17 (0.04 to 0.73) 0
Subtotal (95% CI) 144 149 100.00 0.32 (0.15 to 0.70)Total events: 11 (PDD), 36 (WLC)Test for heterogeneity: χ2 = 2.71, df = 2
(p = 0.26), I2 = 26.1%Test for overall effect: z = 2.85 (p = 0.004)
02 pT1Babjuk 200586 3/22 13/25 46.93 0.26 (0.09 to 0.80) 0Daniltchenko 200588 1/11 7/12 19.65 0.16 (0.02 to 1.07) 0Denzinger 200789 2/17 9/25 33.42 0.33 (0.08 to 1.33) 0
Subtotal (95% CI) 50 62 100.00 0.26 (0.12 to 0.57)Total events: 6 (PDD), 29 (WLC)Test for heterogeneity: χ2 = 0.37, df = 2
(p = 0.83), I2 = 0%Test for overall effect: z = 3.34 (p = 0.0008)
03 OverallBabjuk 200586 5/60 23/62 19.50 0.22 (0.09 to 0.55) 0Daniltchenko 200588 8/51 20/51 24.82 0.40 (0.19 to 0.82) 0Denzinger 200789 4/83 22/98 16.54 0.21 (0.08 to 0.60) 0Kriegmair 200292 25/65 38/64 39.15 0.65 (0.45 to 0.94) 0
Subtotal (95% CI) 259 275 100.00 0.37 (0.20 to 0.69)Total events: 42 (PDD), 103 (WLC)Test for heterogeneity: χ2 = 8.92, df = 3
(p = 0.03), I2 = 66.4%Test for overall effect: z = 3.17 (p = 0.002)
0.1 0.2 0.5 1 2 5 10Favours PDD Favours WLC
FIGURE 12 Residual tumour (pTa and pT1) at first cystoscopy following TUR. Notes: 1. In the figure, the numbers of patients shown for the study by Denzinger and colleagues89 do not include five each from the PDD and WLC groups who at initial resection had CIS. At 6 weeks after initial resection none of the five patients in the PDD group were found to have residual CIS but four of five (80%) in the WLC group were found to have residual CIS. 2. Kriegmair and colleagues92 reported that in an intention to treat analysis 61.5% (40/65) of patients in the PDD group and 40.6% (26/64) of patients in the WLC group were tumour free. For the purposes of the meta-analysis this was interpreted as 25/64 patients in the PDD group and 38/64 patients in the WLC group having residual tumour.
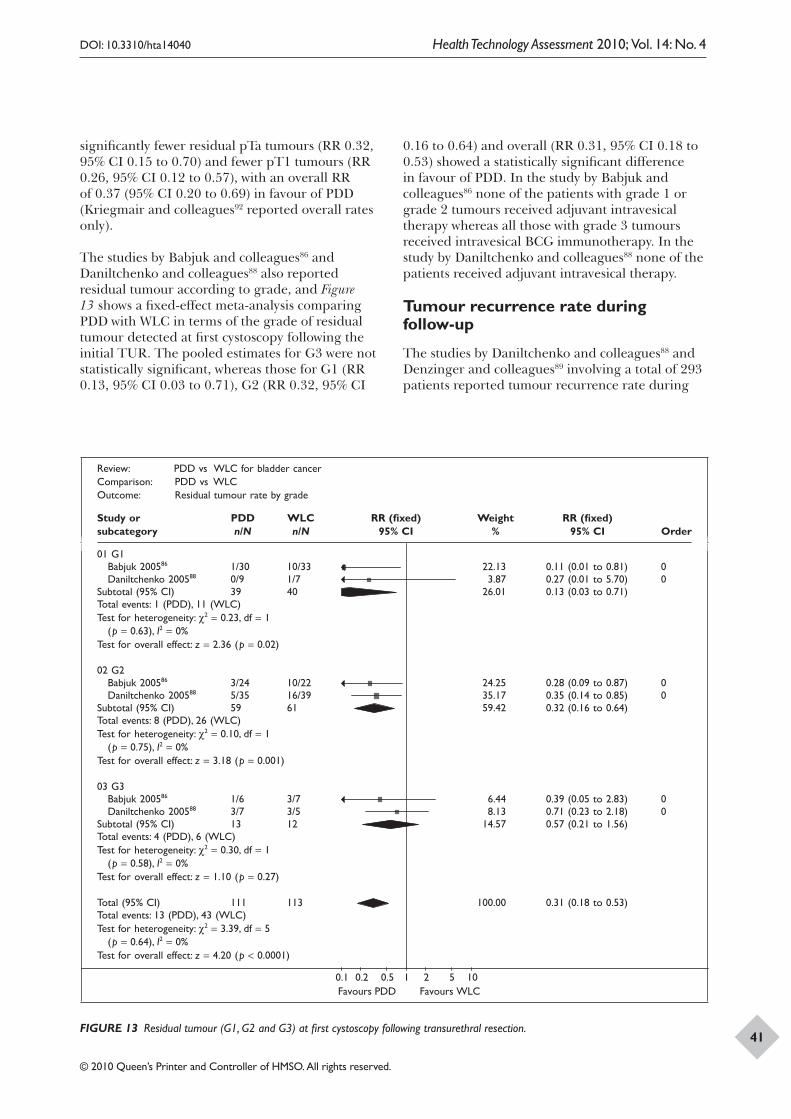
DOI: 10.3310/hta14040 Health Technology Assessment 2010; Vol. 14: No. 4
© 2010 Queen’s Printer and Controller of HMSO. All rights reserved.
41
significantly fewer residual pTa tumours (RR 0.32, 95% CI 0.15 to 0.70) and fewer pT1 tumours (RR 0.26, 95% CI 0.12 to 0.57), with an overall RR of 0.37 (95% CI 0.20 to 0.69) in favour of PDD (Kriegmair and colleagues92 reported overall rates only).
The studies by Babjuk and colleagues86 and Daniltchenko and colleagues88 also reported residual tumour according to grade, and Figure 13 shows a fixed-effect meta-analysis comparing PDD with WLC in terms of the grade of residual tumour detected at first cystoscopy following the initial TUR. The pooled estimates for G3 were not statistically significant, whereas those for G1 (RR 0.13, 95% CI 0.03 to 0.71), G2 (RR 0.32, 95% CI
0.16 to 0.64) and overall (RR 0.31, 95% CI 0.18 to 0.53) showed a statistically significant difference in favour of PDD. In the study by Babjuk and colleagues86 none of the patients with grade 1 or grade 2 tumours received adjuvant intravesical therapy whereas all those with grade 3 tumours received intravesical BCG immunotherapy. In the study by Daniltchenko and colleagues88 none of the patients received adjuvant intravesical therapy.
Tumour recurrence rate during follow-up
The studies by Daniltchenko and colleagues88 and Denzinger and colleagues89 involving a total of 293 patients reported tumour recurrence rate during
Review: PDD vs WLC for bladder cancerComparison: PDD vs WLCOutcome: Residual tumour rate by grade
Study or subcategory
PDDn/N
WLCn/N
RR (fixed) 95% CI
Weight %
RR (fixed) 95% CI Order
01 G1Babjuk 200586 1/30 10/33 22.13 0.11 (0.01 to 0.81) 0Daniltchenko 200588 0/9 1/7 3.87 0.27 (0.01 to 5.70) 0
Subtotal (95% CI) 39 40 26.01 0.13 (0.03 to 0.71)Total events: 1 (PDD), 11 (WLC)Test for heterogeneity: χ2 = 0.23, df = 1
(p = 0.63), I2 = 0%Test for overall effect: z = 2.36 (p = 0.02)
02 G2Babjuk 200586 3/24 10/22 24.25 0.28 (0.09 to 0.87) 0Daniltchenko 200588 5/35 16/39 35.17 0.35 (0.14 to 0.85) 0
Subtotal (95% CI) 59 61 59.42 0.32 (0.16 to 0.64)Total events: 8 (PDD), 26 (WLC)Test for heterogeneity: χ2 = 0.10, df = 1
(p = 0.75), I2 = 0%Test for overall effect: z = 3.18 (p = 0.001)
03 G3Babjuk 200586 1/6 3/7 6.44 0.39 (0.05 to 2.83) 0Daniltchenko 200588 3/7 3/5 8.13 0.71 (0.23 to 2.18) 0
Subtotal (95% CI) 13 12 14.57 0.57 (0.21 to 1.56)Total events: 4 (PDD), 6 (WLC)Test for heterogeneity: χ2 = 0.30, df = 1
(p = 0.58), I2 = 0%Test for overall effect: z = 1.10 (p = 0.27)
Total (95% CI) 111 113 100.00 0.31 (0.18 to 0.53)Total events: 13 (PDD), 43 (WLC)Test for heterogeneity: χ2 = 3.39, df = 5
(p = 0.64), I2 = 0%Test for overall effect: z = 4.20 (p < 0.0001)
0.1 0.2 0.5 1 2 5 10Favours PDD Favours WLC
FIGURE 13 Residual tumour (G1, G2 and G3) at first cystoscopy following transurethral resection.
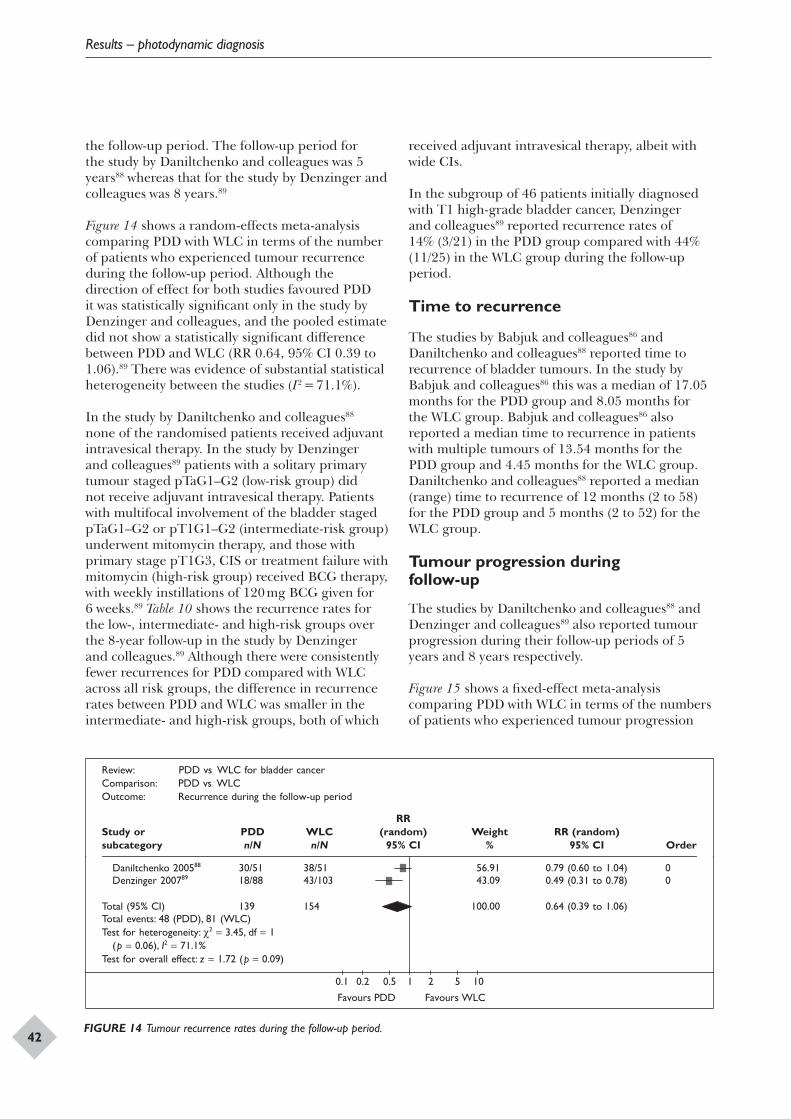
Results – photodynamic diagnosis
42
the follow-up period. The follow-up period for the study by Daniltchenko and colleagues was 5 years88 whereas that for the study by Denzinger and colleagues was 8 years.89
Figure 14 shows a random-effects meta-analysis comparing PDD with WLC in terms of the number of patients who experienced tumour recurrence during the follow-up period. Although the direction of effect for both studies favoured PDD it was statistically significant only in the study by Denzinger and colleagues, and the pooled estimate did not show a statistically significant difference between PDD and WLC (RR 0.64, 95% CI 0.39 to 1.06).89 There was evidence of substantial statistical heterogeneity between the studies (I2 = 71.1%).
In the study by Daniltchenko and colleagues88 none of the randomised patients received adjuvant intravesical therapy. In the study by Denzinger and colleagues89 patients with a solitary primary tumour staged pTaG1–G2 (low-risk group) did not receive adjuvant intravesical therapy. Patients with multifocal involvement of the bladder staged pTaG1–G2 or pT1G1–G2 (intermediate-risk group) underwent mitomycin therapy, and those with primary stage pT1G3, CIS or treatment failure with mitomycin (high-risk group) received BCG therapy, with weekly instillations of 120 mg BCG given for 6 weeks.89 Table 10 shows the recurrence rates for the low-, intermediate- and high-risk groups over the 8-year follow-up in the study by Denzinger and colleagues.89 Although there were consistently fewer recurrences for PDD compared with WLC across all risk groups, the difference in recurrence rates between PDD and WLC was smaller in the intermediate- and high-risk groups, both of which
received adjuvant intravesical therapy, albeit with wide CIs.
In the subgroup of 46 patients initially diagnosed with T1 high-grade bladder cancer, Denzinger and colleagues89 reported recurrence rates of 14% (3/21) in the PDD group compared with 44% (11/25) in the WLC group during the follow-up period.
Time to recurrence
The studies by Babjuk and colleagues86 and Daniltchenko and colleagues88 reported time to recurrence of bladder tumours. In the study by Babjuk and colleagues86 this was a median of 17.05 months for the PDD group and 8.05 months for the WLC group. Babjuk and colleagues86 also reported a median time to recurrence in patients with multiple tumours of 13.54 months for the PDD group and 4.45 months for the WLC group. Daniltchenko and colleagues88 reported a median (range) time to recurrence of 12 months (2 to 58) for the PDD group and 5 months (2 to 52) for the WLC group.
Tumour progression during follow-up
The studies by Daniltchenko and colleagues88 and Denzinger and colleagues89 also reported tumour progression during their follow-up periods of 5 years and 8 years respectively.
Figure 15 shows a fixed-effect meta-analysis comparing PDD with WLC in terms of the numbers of patients who experienced tumour progression
Review: PDD vs WLC for bladder cancerComparison: PDD vs WLCOutcome: Recurrence during the follow-up period
Study or subcategory
PDDn/N
WLCn/N
RR(random)
95% CIWeight
%RR (random)
95% CI Order
Daniltchenko 200588 30/51 38/51 56.91 0.79 (0.60 to 1.04) 0Denzinger 200789 18/88 43/103 43.09 0.49 (0.31 to 0.78) 0
Total (95% CI) 139 154 100.00 0.64 (0.39 to 1.06)Total events: 48 (PDD), 81 (WLC)Test for heterogeneity: χ2 = 3.45, df = 1
(p = 0.06), I2 = 71.1%Test for overall effect: z = 1.72 (p = 0.09)
0.1 0.2 0.5 1 2 5 10
Favours PDD Favours WLC
FIGURE 14 Tumour recurrence rates during the follow-up period.
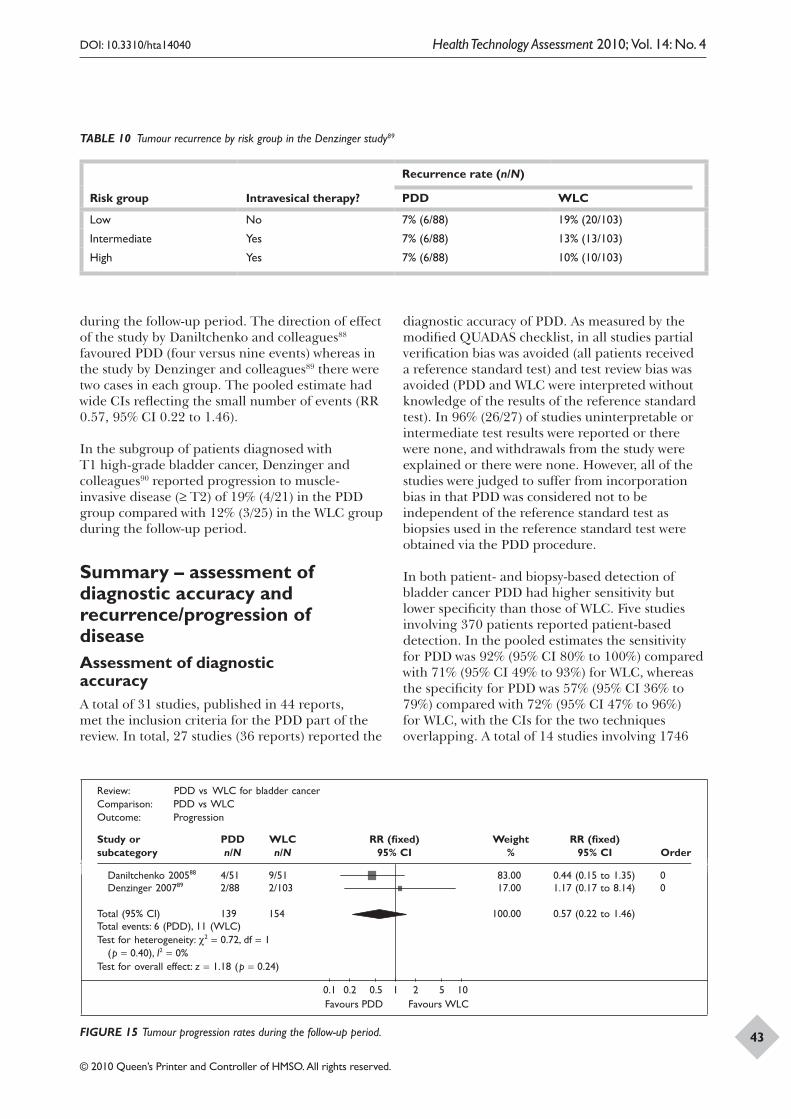
DOI: 10.3310/hta14040 Health Technology Assessment 2010; Vol. 14: No. 4
© 2010 Queen’s Printer and Controller of HMSO. All rights reserved.
43
TABLE 10 Tumour recurrence by risk group in the Denzinger study89
Risk group Intravesical therapy?
Recurrence rate (n/N)
PDD WLC
Low No 7% (6/88) 19% (20/103)
Intermediate Yes 7% (6/88) 13% (13/103)
High Yes 7% (6/88) 10% (10/103)
during the follow-up period. The direction of effect of the study by Daniltchenko and colleagues88 favoured PDD (four versus nine events) whereas in the study by Denzinger and colleagues89 there were two cases in each group. The pooled estimate had wide CIs reflecting the small number of events (RR 0.57, 95% CI 0.22 to 1.46).
In the subgroup of patients diagnosed with T1 high-grade bladder cancer, Denzinger and colleagues90 reported progression to muscle-invasive disease (≥ T2) of 19% (4/21) in the PDD group compared with 12% (3/25) in the WLC group during the follow-up period.
Summary – assessment of diagnostic accuracy and recurrence/progression of diseaseAssessment of diagnostic accuracyA total of 31 studies, published in 44 reports, met the inclusion criteria for the PDD part of the review. In total, 27 studies (36 reports) reported the
diagnostic accuracy of PDD. As measured by the modified QUADAS checklist, in all studies partial verification bias was avoided (all patients received a reference standard test) and test review bias was avoided (PDD and WLC were interpreted without knowledge of the results of the reference standard test). In 96% (26/27) of studies uninterpretable or intermediate test results were reported or there were none, and withdrawals from the study were explained or there were none. However, all of the studies were judged to suffer from incorporation bias in that PDD was considered not to be independent of the reference standard test as biopsies used in the reference standard test were obtained via the PDD procedure.
In both patient- and biopsy-based detection of bladder cancer PDD had higher sensitivity but lower specificity than those of WLC. Five studies involving 370 patients reported patient-based detection. In the pooled estimates the sensitivity for PDD was 92% (95% CI 80% to 100%) compared with 71% (95% CI 49% to 93%) for WLC, whereas the specificity for PDD was 57% (95% CI 36% to 79%) compared with 72% (95% CI 47% to 96%) for WLC, with the CIs for the two techniques overlapping. A total of 14 studies involving 1746
Review: PDD vs WLC for bladder cancerComparison: PDD vs WLCOutcome: Progression
Study or subcategory
PDDn/N
WLCn/N
RR (fixed) 95% CI
Weight %
RR (fixed) 95% CI Order
Daniltchenko 200588 4/51 9/51 83.00 0.44 (0.15 to 1.35) 0Denzinger 200789 2/88 2/103 17.00 1.17 (0.17 to 8.14) 0
Total (95% CI) 139 154 100.00 0.57 (0.22 to 1.46)Total events: 6 (PDD), 11 (WLC)Test for heterogeneity: χ2 = 0.72, df = 1
(p = 0.40), I2 = 0%Test for overall effect: z = 1.18 (p = 0.24)
0.1 0.2 0.5 1 2 5 10Favours PDD Favours WLC
FIGURE 15 Tumour progression rates during the follow-up period.
Results – photodynamic diagnosis
44
patients reported biopsy-based detection (number of biopsies: 8574 for PDD analysis, 8473 for WLC analysis). In the pooled estimates the sensitivity for PDD was 93% (95% CI 90% to 96%) compared with 65% (95% CI 55% to 74%) for WLC, whereas the specificity for PDD was 60% (95% CI 49% to 71%) compared with 81% (95% CI 73% to 90%) for WLC. The pair of CIs for both sensitivity and specificity did not overlap, providing evidence of a difference in diagnostic performance between the techniques.
Studies reporting the sensitivity of PDD compared with WLC for detecting stage/grade of bladder cancer categorised this information in different ways. For the purposes of this review the detection of stage/grade was considered in two broad categories:
1. less aggressive, lower risk tumours (pTa, G1, G2)
2. more aggressive, higher risk tumours (pT1, G3, CIS).
Across three studies66,80,81 involving 266 patients reporting patient-based detection of lower risk, less aggressive tumours, the median (range) sensitivity of PDD at 92% (20% to 95%) was broadly similar to that of WLC at 95% (8% to 100%). Across seven studies54,56,60–62,67,81 involving 1206 patients reporting biopsy-based detection (n = 5777 biopsies overall), the median (range) sensitivity of PDD was slightly higher at 96% (88% to 100%) compared with 88% (74% to 100%) for WLC. Across six studies51,57,65,66,80,81 involving 563 patients reporting patient-based detection of more aggressive, higher risk tumours, the median (range) sensitivity of PDD at 89% (6% to 100%) was higher than that of WLC at 56% (0% to 100%). Across 13 studies50,53,54,56,57,60–62,65,67,70,81,85 involving 1756 patients reporting biopsy-based detection (n = 7506 biopsies overall), the median (range) sensitivity of PDD at 99% (54% to 100%) was again much higher than that of WLC at 67% (0% to 100%) (Table 7). These results suggest that PDD is much better than WLC in detecting more aggressive, higher risk tumours. However, the results for patient- and biopsy-based detection for less aggressive, lower risk tumours and patient-based detection for more aggressive, higher risk tumours should be interpreted with caution as they are based on only a small number of studies.
When CIS was considered separately, across six studies51,57,65,66,80,81 involving 563 patients reporting patient-based detection, the median (range) sensitivity of PDD for detecting CIS
at 83% (41% to 100%) was much higher than that of WLC at 32% (0% to 83%). Across 13 studies50,53,54,56,57,60–62,65,67,70,81,85 involving 1756 patients reporting biopsy-based detection of CIS (n = 7506 biopsies overall), the median (range) sensitivity of PDD at 86% (54% to 100%) was also much higher than that of WLC at 50% (0% to 68%). The results for patient-based detection should be interpreted with caution as they are based on only a small number of studies. However, the median sensitivity across studies reported for patient-based detection of CIS (83%) was similar to that reported for biopsy-based detection of CIS (86%). Only three studies reported the specificity of PDD and WLC for detecting CIS. Two studies51,70 reported higher specificity for WLC (97% versus 71% and 68% versus 61% respectively), whereas the third57 reported similar specificity for both techniques (83% for WLC versus 82% for PDD).
Of the studies comparing PDD with WLC that were included in the pooled estimates in the present review, two65,73 of five reporting patient-based analysis and eight50,53,54,59,60,63,65,70 of 14 reporting biopsy-based analysis undertook random biopsies of normal-appearing areas. Ten50,53,54,56,60–62,70,81,85 of these 14 studies also reported detection of CIS lesions. Table 11 shows, for patient- and biopsy-level analysis and also for detection of CIS lesions, the sensitivity and specificity for PDD and WLC for those studies included in the pooled estimates that undertook random biopsies compared with those that did not. There did not appear to be any systematic pattern to the performance of the tests based on whether or not random biopsies were undertaken.
Most studies (n = 18) used 5-ALA as the photosensitising agent, with five using HAL, two hypericin and two either 5-ALA or HAL. In patient-based detection of bladder cancer, across four studies using 5-ALA72,73,77,78 and three using HAL,65,66,81 the median (range) sensitivity and specificity for 5-ALA were 96% (64% to 100%) and 52% (33% to 67%), respectively, compared with 90% (53% to 96%) sensitivity and 81% (43% to 100%) specificity for HAL. In biopsy-based detection of bladder cancer, across 15 studies50,53,54,56,58,59,61,63,67,70,71,73,77,84,85 using 5-ALA, the median (range) sensitivity and specificity for 5-ALA were 95% (87% to 98%) and 57% (32% to 67%), respectively, compared with 85% (76% to 94%) and 80% (58% to 100%) for HAL. One study, by Sim and colleagues,76 used hypericin, reporting 82% sensitivity and 91% specificity. The results for both patient- and biopsy-based detection suggest that
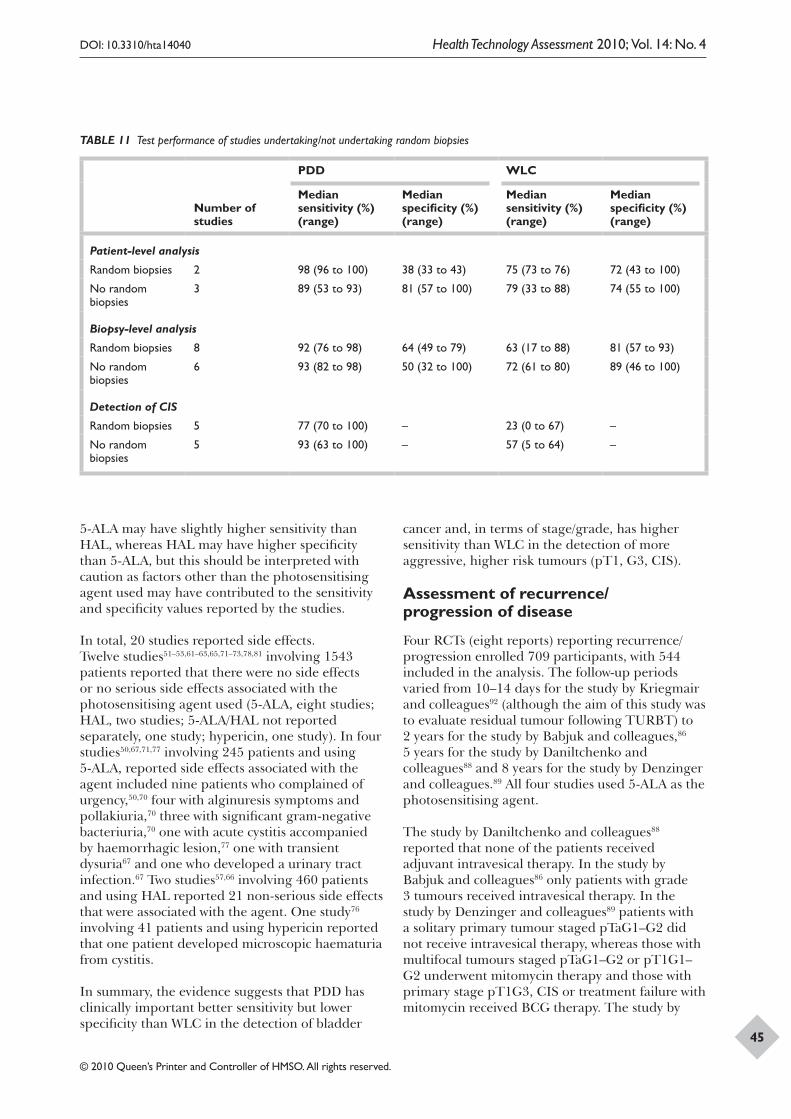
DOI: 10.3310/hta14040 Health Technology Assessment 2010; Vol. 14: No. 4
© 2010 Queen’s Printer and Controller of HMSO. All rights reserved.
45
TABLE 11 Test performance of studies undertaking/not undertaking random biopsies
Number of studies
PDD WLC
Median sensitivity (%) (range)
Median specificity (%) (range)
Median sensitivity (%) (range)
Median specificity (%) (range)
Patient-level analysis
Random biopsies 2 98 (96 to 100) 38 (33 to 43) 75 (73 to 76) 72 (43 to 100)
No random biopsies
3 89 (53 to 93) 81 (57 to 100) 79 (33 to 88) 74 (55 to 100)
Biopsy-level analysis
Random biopsies 8 92 (76 to 98) 64 (49 to 79) 63 (17 to 88) 81 (57 to 93)
No random biopsies
6 93 (82 to 98) 50 (32 to 100) 72 (61 to 80) 89 (46 to 100)
Detection of CIS
Random biopsies 5 77 (70 to 100) – 23 (0 to 67) –
No random biopsies
5 93 (63 to 100) – 57 (5 to 64) –
5-ALA may have slightly higher sensitivity than HAL, whereas HAL may have higher specificity than 5-ALA, but this should be interpreted with caution as factors other than the photosensitising agent used may have contributed to the sensitivity and specificity values reported by the studies.
In total, 20 studies reported side effects. Twelve studies51–53,61–63,65,71–73,78,81 involving 1543 patients reported that there were no side effects or no serious side effects associated with the photosensitising agent used (5-ALA, eight studies; HAL, two studies; 5-ALA/HAL not reported separately, one study; hypericin, one study). In four studies50,67,71,77 involving 245 patients and using 5-ALA, reported side effects associated with the agent included nine patients who complained of urgency,50,70 four with alginuresis symptoms and pollakiuria,70 three with significant gram-negative bacteriuria,70 one with acute cystitis accompanied by haemorrhagic lesion,77 one with transient dysuria67 and one who developed a urinary tract infection.67 Two studies57,66 involving 460 patients and using HAL reported 21 non-serious side effects that were associated with the agent. One study76 involving 41 patients and using hypericin reported that one patient developed microscopic haematuria from cystitis.
In summary, the evidence suggests that PDD has clinically important better sensitivity but lower specificity than WLC in the detection of bladder
cancer and, in terms of stage/grade, has higher sensitivity than WLC in the detection of more aggressive, higher risk tumours (pT1, G3, CIS).
Assessment of recurrence/progression of disease
Four RCTs (eight reports) reporting recurrence/progression enrolled 709 participants, with 544 included in the analysis. The follow-up periods varied from 10–14 days for the study by Kriegmair and colleagues92 (although the aim of this study was to evaluate residual tumour following TURBT) to 2 years for the study by Babjuk and colleagues,86 5 years for the study by Daniltchenko and colleagues88 and 8 years for the study by Denzinger and colleagues.89 All four studies used 5-ALA as the photosensitising agent.
The study by Daniltchenko and colleagues88 reported that none of the patients received adjuvant intravesical therapy. In the study by Babjuk and colleagues86 only patients with grade 3 tumours received intravesical therapy. In the study by Denzinger and colleagues89 patients with a solitary primary tumour staged pTaG1–G2 did not receive intravesical therapy, whereas those with multifocal tumours staged pTaG1–G2 or pT1G1–G2 underwent mitomycin therapy and those with primary stage pT1G3, CIS or treatment failure with mitomycin received BCG therapy. The study by
Results – photodynamic diagnosis
46
Kriegmair and colleagues92 did not state whether intravesical therapy was given.
In all four studies the PDD and WLC groups were similar at baseline in terms of prognostic factors, eligibility criteria for the studies were specified, and length of follow-up was considered adequate in relation to the outcomes of interest reported by the studies. However, in all four studies it was unclear whether the sequence generation was really random or whether the treatment allocation was adequately concealed.
The studies by Babjuk and colleagues86 and Denzinger and colleagues89 (involving a total of 313 patients) reported recurrence-free survival at 12 and 24 months. In a random-effects meta-analysis the direction of effect of the pooled estimate at both time points favoured PDD over WLC, although the difference was statistically significant only at 24 months (RR 1.37, 95% CI 1.18 to 1.59).
The studies by Babjuk and colleagues,86 Daniltchenko and colleagues,88 Denzinger and colleagues89 and Kriegmair and colleagues92 involving a total of 534 patients reported residual tumour rate at first cystoscopy following TURBT. In a random-effects meta-analysis PDD was associated with both statistically significantly fewer residual pTa tumours (RR 0.32, 95% CI 0.15 to 0.70) and pT1 tumours (RR 0.26, 95% CI 0.12 to 0.57), with an overall pooled estimate RR of 0.37 (95% CI 0.20 to 0.69) in favour of PDD. Babjuk and colleagues86 and Daniltchenko and colleagues88 also reported residual tumour according to grade (G1, G2 and G3). In a fixed-effect meta-analysis the pooled estimates for G1 (RR 0.13, 95% CI 0.03 to 0.71) and G2 (RR 0.32, 95% CI 0.16 to 0.64) were statistically significant in favour of PDD, as was the overall pooled estimate (RR 0.31, 95% CI 0.18 to 0.53).
Daniltchenko and colleagues88 and Denzinger and colleagues,89 in studies involving a total of 293 patients, reported tumour recurrence rate during the follow-up period (5 years and 8 years respectively). In a random-effects meta-analysis of the number of patients who experienced tumour recurrence, although the direction of effect for both studies favoured PDD it was statistically significant only in the study by Denzinger and colleagues,89 and the direction of effect in the pooled estimate also favoured PDD but was not statistically significant (RR 0.64, 95% CI 0.39 to 1.06). In the
study by Denzinger and colleagues89 the recurrence rates were consistently lower for PDD than for WLC across all three risk groups. However, the difference in the recurrence rates between PDD and WLC was smaller in the intermediate-risk [PDD 7% (6/88), WLC 13% (13/103)] and high-risk [PDD 7% (6/88), WLC 10% (10/103)] groups that received adjuvant intravesical therapy than in the low-risk group that did not [PDD 7% (6/88), WLC 19% (20/103)].
Two studies86,88 reported time to recurrence, both favouring PDD. Babjuk and colleagues86 reported a median time to recurrence of 17.05 months for the PDD group and 8.05 months for the WLC group, whereas Daniltchenko and colleagues88 reported a median (range) time to recurrence of 12 (2 to 58) months for the PDD group and 5 (2 to 52) months for the WLC group.
The studies by Daniltchenko and colleagues88 and Denzinger and colleagues89 also reported tumour progression during their respective 5- and 8-year follow-up periods. In a fixed-effect meta-analysis of the number of patients who experienced tumour progression, the direction of effect of the study by Daniltchenko and colleagues favoured PDD whereas that of the study by Denzinger and colleagues favoured WLC, although neither was statistically significant. The pooled estimate favoured PDD but again was not statistically significant (RR 0.57, 95% CI 0.22 to 1.46).88,89
In summary, the evidence suggests that, compared with WLC, the use of PDD at TURBT results in less residual tumour being found at the first cystoscopy following TURBT, longer recurrence-free survival of patients and a longer time to recurrence following TURBT, and may be associated with a lower rate of tumour recurrence over time. However, as these results are based on only a few studies they should be interpreted with caution. It should also be borne in mind that the administration of adjuvant intravesical therapy varied across the studies. Adjuvant intravesical therapy following TURBT is standard practice in the UK and much of Europe and can reduce recurrence by up to 50% in the first 2 years. The fact that in two studies86,89 only some patients received intravesical therapy and in one88 none did, while in the fourth study92 this information was not reported, makes it difficult to assess what the true added value of PDD might be in reducing recurrence rates in routine practice.
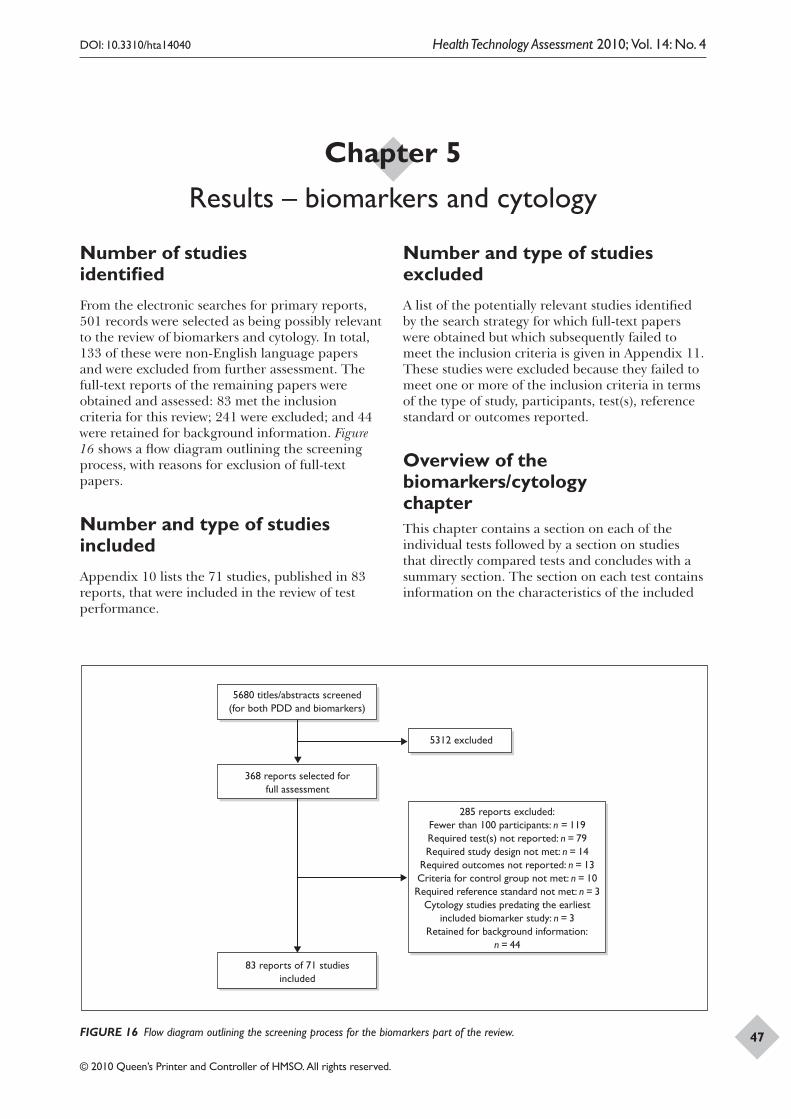
DOI: 10.3310/hta14040 Health Technology Assessment 2010; Vol. 14: No. 4
© 2010 Queen’s Printer and Controller of HMSO. All rights reserved.
47
Number of studies identifiedFrom the electronic searches for primary reports, 501 records were selected as being possibly relevant to the review of biomarkers and cytology. In total, 133 of these were non-English language papers and were excluded from further assessment. The full-text reports of the remaining papers were obtained and assessed: 83 met the inclusion criteria for this review; 241 were excluded; and 44 were retained for background information. Figure 16 shows a flow diagram outlining the screening process, with reasons for exclusion of full-text papers.
Number and type of studies includedAppendix 10 lists the 71 studies, published in 83 reports, that were included in the review of test performance.
Number and type of studies excludedA list of the potentially relevant studies identified by the search strategy for which full-text papers were obtained but which subsequently failed to meet the inclusion criteria is given in Appendix 11. These studies were excluded because they failed to meet one or more of the inclusion criteria in terms of the type of study, participants, test(s), reference standard or outcomes reported.
Overview of the biomarkers/cytology chapterThis chapter contains a section on each of the individual tests followed by a section on studies that directly compared tests and concludes with a summary section. The section on each test contains information on the characteristics of the included
Chapter 5 Results – biomarkers and cytology
5680 titles/abstracts screened(for both PDD and biomarkers)
5312 excluded
83 reports of 71 studiesincluded
368 reports selected forfull assessment
285 reports excluded:Fewer than 100 participants: n = 119Required test(s) not reported: n = 79Required study design not met: n = 14
Required outcomes not reported: n = 13Criteria for control group not met: n = 10Required reference standard not met: n = 3
Cytology studies predating the earliestincluded biomarker study: n = 3
Retained for background information:n = 44
FIGURE 16 Flow diagram outlining the screening process for the biomarkers part of the review.
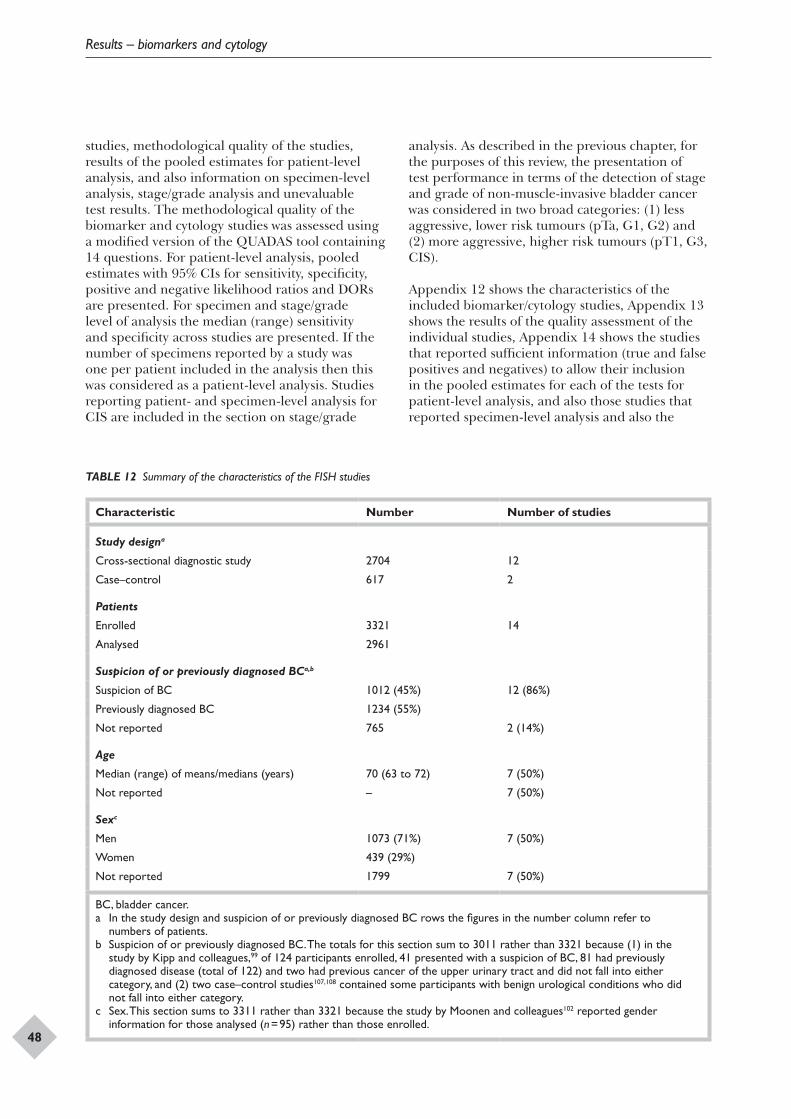
Results – biomarkers and cytology
48
studies, methodological quality of the studies, results of the pooled estimates for patient-level analysis, and also information on specimen-level analysis, stage/grade analysis and unevaluable test results. The methodological quality of the biomarker and cytology studies was assessed using a modified version of the QUADAS tool containing 14 questions. For patient-level analysis, pooled estimates with 95% CIs for sensitivity, specificity, positive and negative likelihood ratios and DORs are presented. For specimen and stage/grade level of analysis the median (range) sensitivity and specificity across studies are presented. If the number of specimens reported by a study was one per patient included in the analysis then this was considered as a patient-level analysis. Studies reporting patient- and specimen-level analysis for CIS are included in the section on stage/grade
analysis. As described in the previous chapter, for the purposes of this review, the presentation of test performance in terms of the detection of stage and grade of non-muscle-invasive bladder cancer was considered in two broad categories: (1) less aggressive, lower risk tumours (pTa, G1, G2) and (2) more aggressive, higher risk tumours (pT1, G3, CIS).
Appendix 12 shows the characteristics of the included biomarker/cytology studies, Appendix 13 shows the results of the quality assessment of the individual studies, Appendix 14 shows the studies that reported sufficient information (true and false positives and negatives) to allow their inclusion in the pooled estimates for each of the tests for patient-level analysis, and also those studies that reported specimen-level analysis and also the
TABLE 12 Summary of the characteristics of the FISH studies
Characteristic Number Number of studies
Study designa
Cross-sectional diagnostic study 2704 12
Case–control 617 2
Patients
Enrolled 3321 14
Analysed 2961
Suspicion of or previously diagnosed BCa,b
Suspicion of BC 1012 (45%) 12 (86%)
Previously diagnosed BC 1234 (55%)
Not reported 765 2 (14%)
Age
Median (range) of means/medians (years) 70 (63 to 72) 7 (50%)
Not reported – 7 (50%)
Sexc
Men 1073 (71%) 7 (50%)
Women 439 (29%)
Not reported 1799 7 (50%)
BC, bladder cancer.a In the study design and suspicion of or previously diagnosed BC rows the figures in the number column refer to
numbers of patients.b Suspicion of or previously diagnosed BC. The totals for this section sum to 3011 rather than 3321 because (1) in the
study by Kipp and colleagues,99 of 124 participants enrolled, 41 presented with a suspicion of BC, 81 had previously diagnosed disease (total of 122) and two had previous cancer of the upper urinary tract and did not fall into either category, and (2) two case–control studies107,108 contained some participants with benign urological conditions who did not fall into either category.
c Sex. This section sums to 3311 rather than 3321 because the study by Moonen and colleagues102 reported gender information for those analysed (n = 95) rather than those enrolled.
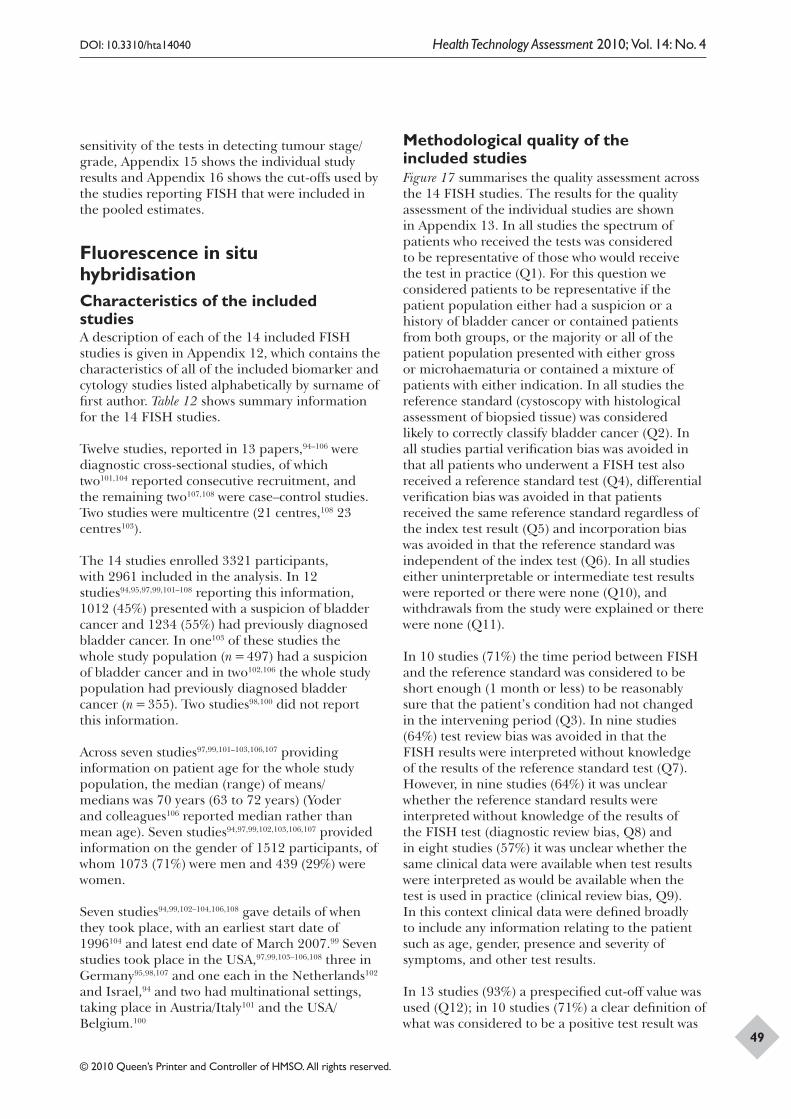
DOI: 10.3310/hta14040 Health Technology Assessment 2010; Vol. 14: No. 4
© 2010 Queen’s Printer and Controller of HMSO. All rights reserved.
49
sensitivity of the tests in detecting tumour stage/grade, Appendix 15 shows the individual study results and Appendix 16 shows the cut-offs used by the studies reporting FISH that were included in the pooled estimates.
Fluorescence in situ hybridisationCharacteristics of the included studiesA description of each of the 14 included FISH studies is given in Appendix 12, which contains the characteristics of all of the included biomarker and cytology studies listed alphabetically by surname of first author. Table 12 shows summary information for the 14 FISH studies.
Twelve studies, reported in 13 papers,94–106 were diagnostic cross-sectional studies, of which two101,104 reported consecutive recruitment, and the remaining two107,108 were case–control studies. Two studies were multicentre (21 centres,108 23 centres103).
The 14 studies enrolled 3321 participants, with 2961 included in the analysis. In 12 studies94,95,97,99,101–108 reporting this information, 1012 (45%) presented with a suspicion of bladder cancer and 1234 (55%) had previously diagnosed bladder cancer. In one103 of these studies the whole study population (n = 497) had a suspicion of bladder cancer and in two102,106 the whole study population had previously diagnosed bladder cancer (n = 355). Two studies98,100 did not report this information.
Across seven studies97,99,101–103,106,107 providing information on patient age for the whole study population, the median (range) of means/medians was 70 years (63 to 72 years) (Yoder and colleagues106 reported median rather than mean age). Seven studies94,97,99,102,103,106,107 provided information on the gender of 1512 participants, of whom 1073 (71%) were men and 439 (29%) were women.
Seven studies94,99,102–104,106,108 gave details of when they took place, with an earliest start date of 1996104 and latest end date of March 2007.99 Seven studies took place in the USA,97,99,103–106,108 three in Germany95,98,107 and one each in the Netherlands102 and Israel,94 and two had multinational settings, taking place in Austria/Italy101 and the USA/Belgium.100
Methodological quality of the included studiesFigure 17 summarises the quality assessment across the 14 FISH studies. The results for the quality assessment of the individual studies are shown in Appendix 13. In all studies the spectrum of patients who received the tests was considered to be representative of those who would receive the test in practice (Q1). For this question we considered patients to be representative if the patient population either had a suspicion or a history of bladder cancer or contained patients from both groups, or the majority or all of the patient population presented with either gross or microhaematuria or contained a mixture of patients with either indication. In all studies the reference standard (cystoscopy with histological assessment of biopsied tissue) was considered likely to correctly classify bladder cancer (Q2). In all studies partial verification bias was avoided in that all patients who underwent a FISH test also received a reference standard test (Q4), differential verification bias was avoided in that patients received the same reference standard regardless of the index test result (Q5) and incorporation bias was avoided in that the reference standard was independent of the index test (Q6). In all studies either uninterpretable or intermediate test results were reported or there were none (Q10), and withdrawals from the study were explained or there were none (Q11).
In 10 studies (71%) the time period between FISH and the reference standard was considered to be short enough (1 month or less) to be reasonably sure that the patient’s condition had not changed in the intervening period (Q3). In nine studies (64%) test review bias was avoided in that the FISH results were interpreted without knowledge of the results of the reference standard test (Q7). However, in nine studies (64%) it was unclear whether the reference standard results were interpreted without knowledge of the results of the FISH test (diagnostic review bias, Q8) and in eight studies (57%) it was unclear whether the same clinical data were available when test results were interpreted as would be available when the test is used in practice (clinical review bias, Q9). In this context clinical data were defined broadly to include any information relating to the patient such as age, gender, presence and severity of symptoms, and other test results.
In 13 studies (93%) a prespecified cut-off value was used (Q12); in 10 studies (71%) a clear definition of what was considered to be a positive test result was
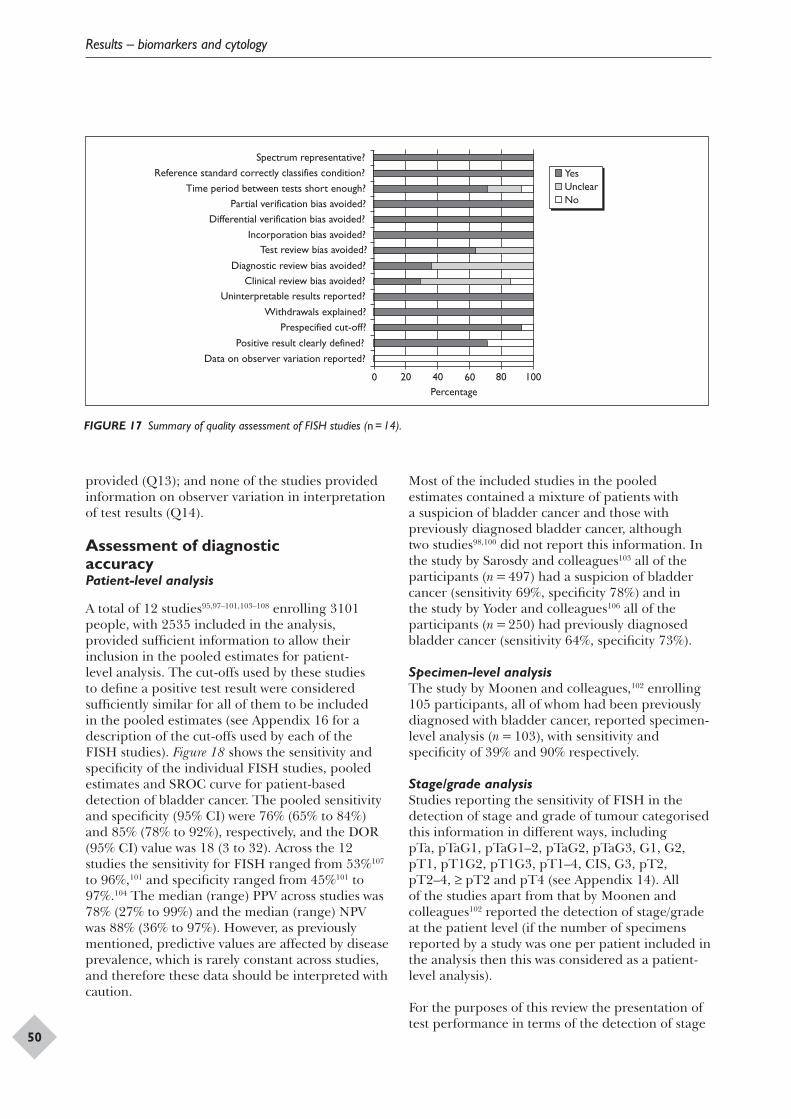
Results – biomarkers and cytology
50
Yes Unclear No
Spectrum representative? Reference standard correctly classifies condition?
Time period between tests short enough? Partial verification bias avoided?
Differential verification bias avoided? Incorporation bias avoided?
Diagnostic review bias avoided?
Test review bias avoided?
Clinical review bias avoided?Uninterpretable results reported?
Withdrawals explained? Prespecified cut-off?
Positive result clearly defined? Data on observer variation reported?
0 20 Percentage 40 60 80 100
FIGURE 17 Summary of quality assessment of FISH studies (n = 14).
provided (Q13); and none of the studies provided information on observer variation in interpretation of test results (Q14).
Assessment of diagnostic accuracyPatient-level analysis
A total of 12 studies95,97–101,103–108 enrolling 3101 people, with 2535 included in the analysis, provided sufficient information to allow their inclusion in the pooled estimates for patient-level analysis. The cut-offs used by these studies to define a positive test result were considered sufficiently similar for all of them to be included in the pooled estimates (see Appendix 16 for a description of the cut-offs used by each of the FISH studies). Figure 18 shows the sensitivity and specificity of the individual FISH studies, pooled estimates and SROC curve for patient-based detection of bladder cancer. The pooled sensitivity and specificity (95% CI) were 76% (65% to 84%) and 85% (78% to 92%), respectively, and the DOR (95% CI) value was 18 (3 to 32). Across the 12 studies the sensitivity for FISH ranged from 53%107 to 96%,101 and specificity ranged from 45%101 to 97%.104 The median (range) PPV across studies was 78% (27% to 99%) and the median (range) NPV was 88% (36% to 97%). However, as previously mentioned, predictive values are affected by disease prevalence, which is rarely constant across studies, and therefore these data should be interpreted with caution.
Most of the included studies in the pooled estimates contained a mixture of patients with a suspicion of bladder cancer and those with previously diagnosed bladder cancer, although two studies98,100 did not report this information. In the study by Sarosdy and colleagues103 all of the participants (n = 497) had a suspicion of bladder cancer (sensitivity 69%, specificity 78%) and in the study by Yoder and colleagues106 all of the participants (n = 250) had previously diagnosed bladder cancer (sensitivity 64%, specificity 73%).
Specimen-level analysisThe study by Moonen and colleagues,102 enrolling 105 participants, all of whom had been previously diagnosed with bladder cancer, reported specimen-level analysis (n = 103), with sensitivity and specificity of 39% and 90% respectively.
Stage/grade analysisStudies reporting the sensitivity of FISH in the detection of stage and grade of tumour categorised this information in different ways, including pTa, pTaG1, pTaG1–2, pTaG2, pTaG3, G1, G2, pT1, pT1G2, pT1G3, pT1–4, CIS, G3, pT2, pT2–4, ≥ pT2 and pT4 (see Appendix 14). All of the studies apart from that by Moonen and colleagues102 reported the detection of stage/grade at the patient level (if the number of specimens reported by a study was one per patient included in the analysis then this was considered as a patient-level analysis).
For the purposes of this review the presentation of test performance in terms of the detection of stage
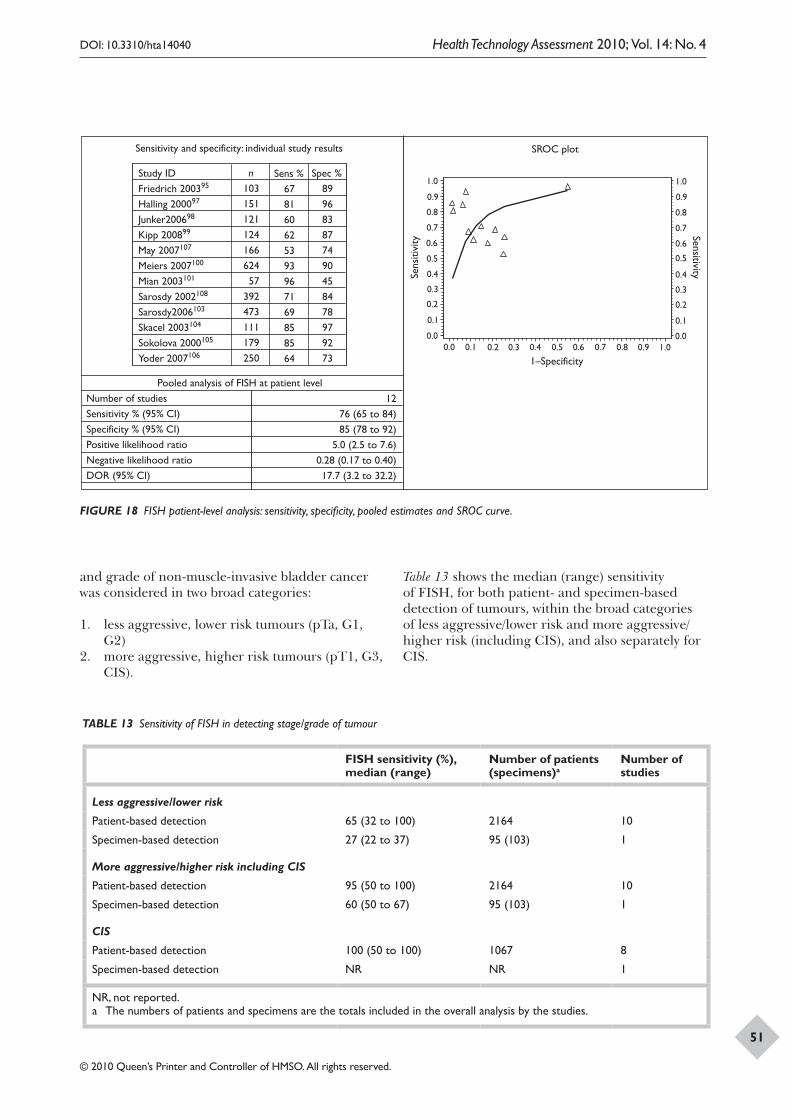
DOI: 10.3310/hta14040 Health Technology Assessment 2010; Vol. 14: No. 4
© 2010 Queen’s Printer and Controller of HMSO. All rights reserved.
51
Sensitivity and specificity: individual study results
Sens
itivi
ty
1.0
1.0
0.9
0.9
0.8
0.8
0.7
0.7
0.6
0.6
0.5
0.5
0.4
0.4
1–Specificity
0.3
0.3
0.2
0.2
0.1
0.1 0.0
Sensitivity
1.0
0.9
0.8
0.7
0.6
0.5
0.4
0.3
0.2
0.1
0.0 0.0
Study ID Friedrich 200395
Halling 200097
Junker200698
Kipp 200899
May 2007107
Meiers 2007100
Mian 2003101
Sarosdy 2002108
Sarosdy2006103
Skacel 2003104
Sokolova 2000105
Yoder 2007106
n 103 151 121 124 166 624 57
392 473 111 179 250
Sens % 67 81 60 62 53 93 96 71 69 85 85 64
Spec % 89 96 83 87 74 90 45 84 78 97 92 73
SROC plot
12 76 (65 to 84) 85 (78 to 92)
5.0 (2.5 to 7.6) 0.28 (0.17 to 0.40) 17.7 (3.2 to 32.2)
Pooled analysis of FISH at patient level Number of studies Sensitivity % (95% CI) Specificity % (95% CI) Positive likelihood ratio Negative likelihood ratio DOR (95% CI)
FIGURE 18 FISH patient-level analysis: sensitivity, specificity, pooled estimates and SROC curve.
TABLE 13 Sensitivity of FISH in detecting stage/grade of tumour
FISH sensitivity (%), median (range)
Number of patients (specimens)a
Number of studies
Less aggressive/lower risk
Patient-based detection 65 (32 to 100) 2164 10
Specimen-based detection 27 (22 to 37) 95 (103) 1
More aggressive/higher risk including CIS
Patient-based detection 95 (50 to 100) 2164 10
Specimen-based detection 60 (50 to 67) 95 (103) 1
CIS
Patient-based detection 100 (50 to 100) 1067 8
Specimen-based detection NR NR 1
NR, not reported.a The numbers of patients and specimens are the totals included in the overall analysis by the studies.
and grade of non-muscle-invasive bladder cancer was considered in two broad categories:
1. less aggressive, lower risk tumours (pTa, G1, G2)
2. more aggressive, higher risk tumours (pT1, G3, CIS).
Table 13 shows the median (range) sensitivity of FISH, for both patient- and specimen-based detection of tumours, within the broad categories of less aggressive/lower risk and more aggressive/higher risk (including CIS), and also separately for CIS.
Results – biomarkers and cytology
52
Less aggressive, lower risk tumours (pTa, G1, G2)In total, 10 studies95,97,99–101,103–105,107,108 involving 2164 patients reported the sensitivity of FISH for the patient-based detection of less aggressive, lower risk tumours. Across these studies the median (range) sensitivity of FISH was 65% (32% to 100%) (Table 13). The study by Moonen and colleagues102 reported specimen-based detection (95 patients, 103 specimens), with a median (range) sensitivity of 27% (22% to 37%).
More aggressive, higher risk tumours (pT1, G3, CIS)In total, 10 studies95,97,99–101,103–105,107,108 involving 2164 patients reported the sensitivity of FISH for the patient-based detection of more aggressive, higher risk tumours. Across these studies the median (range) sensitivity of FISH was 95% (50% to 100%) (Table 13). The study by Moonen and colleagues102 reported specimen-based detection (95 patients, 103 specimens), with a median (range) sensitivity of 60% (50% to 67%).
Carcinoma in situAlthough CIS is included in the more aggressive/higher risk category reported above, it may also be useful to consider separately the performance of biomarkers or cytology for the detection of CIS. Eight studies95,97,99,101,104,105,107,108 involving 1067 patients reported the sensitivity of FISH for the patient-based detection of CIS. Across these studies the median (range) sensitivity of FISH was 100% (50% to 100%) (Table 13).
Number of tumoursNone of the included studies reported the sensitivity of FISH in detecting varying numbers of tumours.
Size of tumoursNone of the included studies reported the sensitivity of FISH in detecting varying sizes of tumour.
Unevaluable testsFive studies98,101–103,108 reported that 65 of 1059 tests (6.1%) could not be evaluated. The other studies did not specifically report this information.
ImmunoCytCharacteristics of the included studiesA description of each of the 10 included ImmunoCyt studies is given in Appendix 12, which
contains the characteristics of all of the included biomarker and cytology studies listed alphabetically by surname of first author. Table 14 shows summary information for the 10 ImmunoCyt studies.
All 10 studies, reported in 12 papers,101,109–119 were diagnostic cross-sectional studies. Six reported consecutive recruitment.101,109,110,112,116,118 Two studies were multicentre (four centres,111 19 centres116).
The 10 studies enrolled 4199 participants, with at least 3091 included in the analysis (the study by Mian and colleagues113 enrolled 942 participants but did not report the number included in the analysis). In nine studies101,109–114,116,118 reporting this information, 890 participants (27%) presented with a suspicion of bladder cancer and 2405 (73%) had previously diagnosed bladder cancer. In one of these studies118 the whole patient population (n = 301) had a suspicion of bladder cancer and in three110,111,113 the whole population had previously diagnosed bladder cancer (n = 1499). One study119 did not report this information.
Across six studies101,109,112–114,116 providing information on patient age for the participant group as a whole, the median (range) of means was 68 years (66 to 73 years). Four studies112,114,116,118 provided information on the gender of 1371 participants, of whom 1076 (78%) were men and 295 (22%) were women.
Six studies111–114,118,119 gave details of when they took place, with an earliest start date of November 1997112 and latest end date of July 2007.118 The studies took place in Austria,112 France,116 Germany,118 Italy,113 Sweden,114 Canada119 and the USA,111 with three having multinational settings, all taking place in Austria/Italy,101,109,110 although they did not state that they were multicentre.
Methodological quality of the included studies
Figure 19 summarises the quality assessment for the 10 ImmunoCyt studies. The results for the quality assessment of the individual studies are shown in Appendix 13. In all studies the spectrum of patients who received the tests was considered to be representative of those who would receive the test in practice (Q1). In all studies the reference standard (cystoscopy with histological assessment of biopsied tissue) was considered likely to correctly classify bladder cancer (Q2). In all studies partial verification bias was avoided in that all patients who underwent an ImmunoCyt test also received a reference standard test (Q4), differential
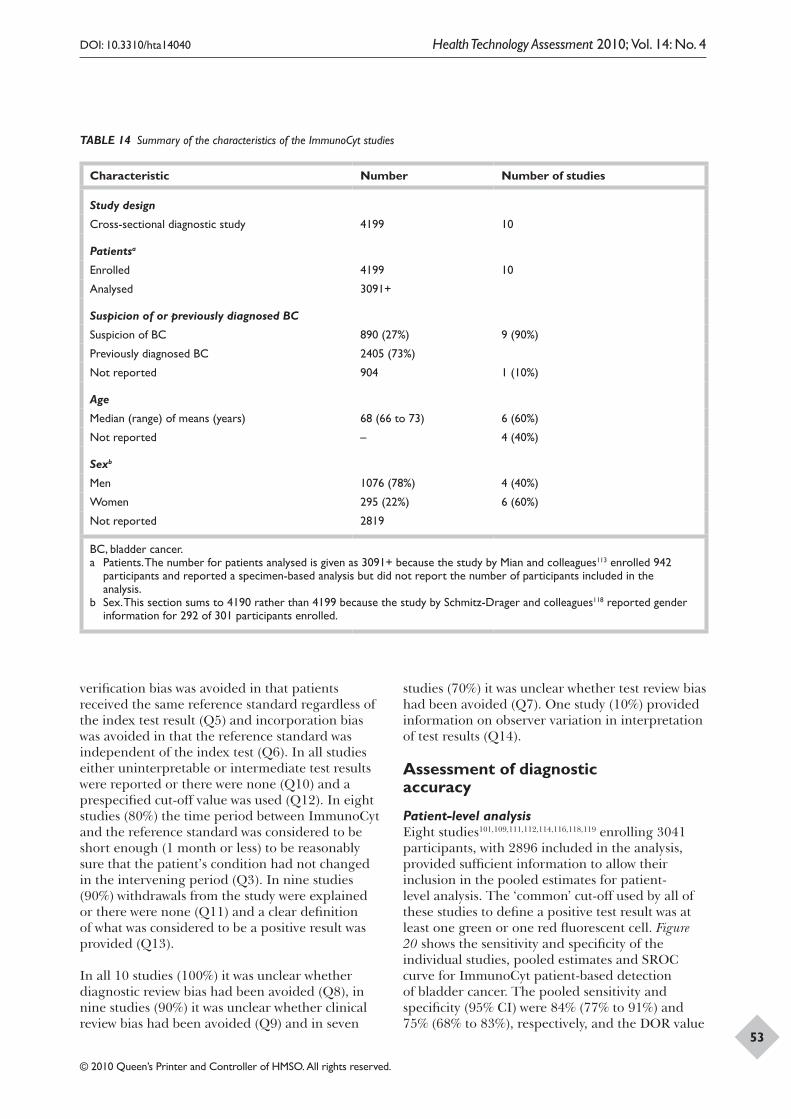
DOI: 10.3310/hta14040 Health Technology Assessment 2010; Vol. 14: No. 4
© 2010 Queen’s Printer and Controller of HMSO. All rights reserved.
53
TABLE 14 Summary of the characteristics of the ImmunoCyt studies
Characteristic Number Number of studies
Study design
Cross-sectional diagnostic study 4199 10
Patientsa
Enrolled 4199 10
Analysed 3091+
Suspicion of or previously diagnosed BC
Suspicion of BC 890 (27%) 9 (90%)
Previously diagnosed BC 2405 (73%)
Not reported 904 1 (10%)
Age
Median (range) of means (years) 68 (66 to 73) 6 (60%)
Not reported – 4 (40%)
Sexb
Men 1076 (78%) 4 (40%)
Women 295 (22%) 6 (60%)
Not reported 2819
BC, bladder cancer.a Patients. The number for patients analysed is given as 3091+ because the study by Mian and colleagues113 enrolled 942
participants and reported a specimen-based analysis but did not report the number of participants included in the analysis.
b Sex. This section sums to 4190 rather than 4199 because the study by Schmitz-Drager and colleagues118 reported gender information for 292 of 301 participants enrolled.
verification bias was avoided in that patients received the same reference standard regardless of the index test result (Q5) and incorporation bias was avoided in that the reference standard was independent of the index test (Q6). In all studies either uninterpretable or intermediate test results were reported or there were none (Q10) and a prespecified cut-off value was used (Q12). In eight studies (80%) the time period between ImmunoCyt and the reference standard was considered to be short enough (1 month or less) to be reasonably sure that the patient’s condition had not changed in the intervening period (Q3). In nine studies (90%) withdrawals from the study were explained or there were none (Q11) and a clear definition of what was considered to be a positive result was provided (Q13).
In all 10 studies (100%) it was unclear whether diagnostic review bias had been avoided (Q8), in nine studies (90%) it was unclear whether clinical review bias had been avoided (Q9) and in seven
studies (70%) it was unclear whether test review bias had been avoided (Q7). One study (10%) provided information on observer variation in interpretation of test results (Q14).
Assessment of diagnostic accuracy
Patient-level analysisEight studies101,109,111,112,114,116,118,119 enrolling 3041 participants, with 2896 included in the analysis, provided sufficient information to allow their inclusion in the pooled estimates for patient-level analysis. The ‘common’ cut-off used by all of these studies to define a positive test result was at least one green or one red fluorescent cell. Figure 20 shows the sensitivity and specificity of the individual studies, pooled estimates and SROC curve for ImmunoCyt patient-based detection of bladder cancer. The pooled sensitivity and specificity (95% CI) were 84% (77% to 91%) and 75% (68% to 83%), respectively, and the DOR value
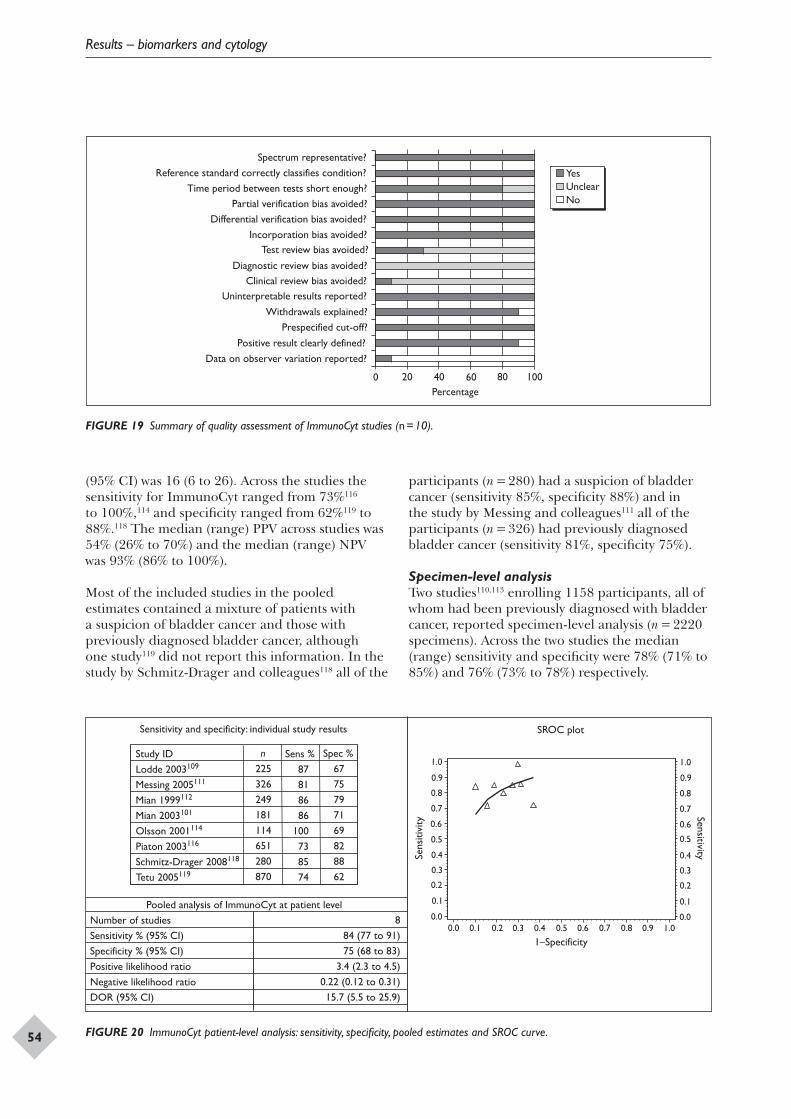
Results – biomarkers and cytology
54
Yes Unclear No
Spectrum representative? Reference standard correctly classifies condition?
Time period between tests short enough? Partial verification bias avoided?
Differential verification bias avoided? Incorporation bias avoided?
Diagnostic review bias avoided?
Test review bias avoided?
Clinical review bias avoided?Uninterpretable results reported?
Withdrawals explained? Prespecified cut-off?
Positive result clearly defined? Data on observer variation reported?
0 20 Percentage 40 60 80 100
FIGURE 19 Summary of quality assessment of ImmunoCyt studies (n = 10).
Sensitivity and specificity: individual study results
Sens
itivi
ty
1.0
1.0
0.9
0.9
0.8
0.8
0.7
0.7
0.6
0.6
0.5
0.5
0.4
0.4
1–Specificity
0.3
0.3
0.2
0.2
0.1
0.10.0
Sensitivity
1.0
0.9
0.8
0.7
0.6
0.5
0.4
0.3
0.2
0.1
0.00.0
Study IDLodde 2003109
Messing 2005111
Mian 1999112
Mian 2003101
Olsson 2001114
Piaton 2003116
Schmitz-Drager 2008118
Tetu 2005119
n 225326249181114651280870
Sens %87 81 86 86
100 73 85 74
Spec %67 75 79 71 69 82 88 62
SROC plot
884 (77 to 91)75 (68 to 83)
3.4 (2.3 to 4.5)0.22 (0.12 to 0.31)15.7 (5.5 to 25.9)
Pooled analysis of ImmunoCyt at patient levelNumber of studiesSensitivity % (95% CI)Specificity % (95% CI)Positive likelihood ratioNegative likelihood ratioDOR (95% CI)
FIGURE 20 ImmunoCyt patient-level analysis: sensitivity, specificity, pooled estimates and SROC curve.
(95% CI) was 16 (6 to 26). Across the studies the sensitivity for ImmunoCyt ranged from 73%116 to 100%,114 and specificity ranged from 62%119 to 88%.118 The median (range) PPV across studies was 54% (26% to 70%) and the median (range) NPV was 93% (86% to 100%).
Most of the included studies in the pooled estimates contained a mixture of patients with a suspicion of bladder cancer and those with previously diagnosed bladder cancer, although one study119 did not report this information. In the study by Schmitz-Drager and colleagues118 all of the
participants (n = 280) had a suspicion of bladder cancer (sensitivity 85%, specificity 88%) and in the study by Messing and colleagues111 all of the participants (n = 326) had previously diagnosed bladder cancer (sensitivity 81%, specificity 75%).
Specimen-level analysisTwo studies110,113 enrolling 1158 participants, all of whom had been previously diagnosed with bladder cancer, reported specimen-level analysis (n = 2220 specimens). Across the two studies the median (range) sensitivity and specificity were 78% (71% to 85%) and 76% (73% to 78%) respectively.
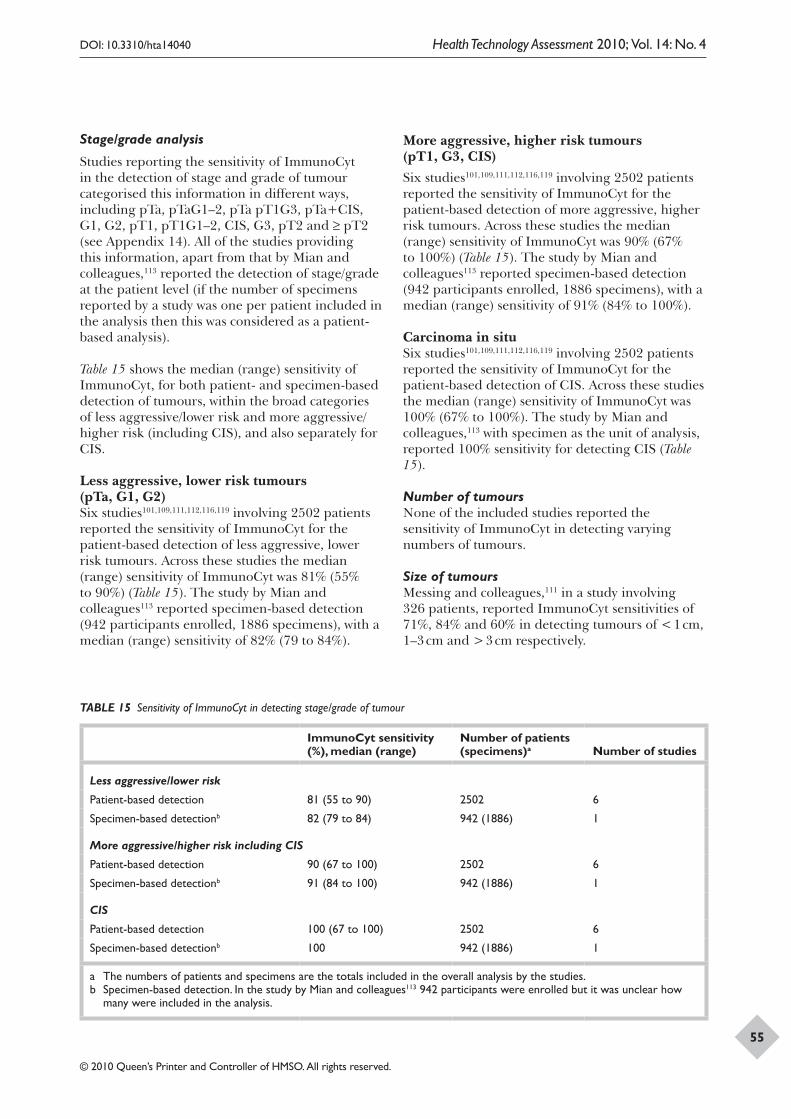
DOI: 10.3310/hta14040 Health Technology Assessment 2010; Vol. 14: No. 4
© 2010 Queen’s Printer and Controller of HMSO. All rights reserved.
55
Stage/grade analysis
Studies reporting the sensitivity of ImmunoCyt in the detection of stage and grade of tumour categorised this information in different ways, including pTa, pTaG1–2, pTa pT1G3, pTa+CIS, G1, G2, pT1, pT1G1–2, CIS, G3, pT2 and ≥ pT2 (see Appendix 14). All of the studies providing this information, apart from that by Mian and colleagues,113 reported the detection of stage/grade at the patient level (if the number of specimens reported by a study was one per patient included in the analysis then this was considered as a patient-based analysis).
Table 15 shows the median (range) sensitivity of ImmunoCyt, for both patient- and specimen-based detection of tumours, within the broad categories of less aggressive/lower risk and more aggressive/higher risk (including CIS), and also separately for CIS.
Less aggressive, lower risk tumours (pTa, G1, G2)Six studies101,109,111,112,116,119 involving 2502 patients reported the sensitivity of ImmunoCyt for the patient-based detection of less aggressive, lower risk tumours. Across these studies the median (range) sensitivity of ImmunoCyt was 81% (55% to 90%) (Table 15). The study by Mian and colleagues113 reported specimen-based detection (942 participants enrolled, 1886 specimens), with a median (range) sensitivity of 82% (79 to 84%).
More aggressive, higher risk tumours (pT1, G3, CIS)Six studies101,109,111,112,116,119 involving 2502 patients reported the sensitivity of ImmunoCyt for the patient-based detection of more aggressive, higher risk tumours. Across these studies the median (range) sensitivity of ImmunoCyt was 90% (67% to 100%) (Table 15). The study by Mian and colleagues113 reported specimen-based detection (942 participants enrolled, 1886 specimens), with a median (range) sensitivity of 91% (84% to 100%).
Carcinoma in situSix studies101,109,111,112,116,119 involving 2502 patients reported the sensitivity of ImmunoCyt for the patient-based detection of CIS. Across these studies the median (range) sensitivity of ImmunoCyt was 100% (67% to 100%). The study by Mian and colleagues,113 with specimen as the unit of analysis, reported 100% sensitivity for detecting CIS (Table 15).
Number of tumoursNone of the included studies reported the sensitivity of ImmunoCyt in detecting varying numbers of tumours.
Size of tumoursMessing and colleagues,111 in a study involving 326 patients, reported ImmunoCyt sensitivities of 71%, 84% and 60% in detecting tumours of < 1 cm, 1–3 cm and > 3 cm respectively.
TABLE 15 Sensitivity of ImmunoCyt in detecting stage/grade of tumour
ImmunoCyt sensitivity (%), median (range)
Number of patients (specimens)a Number of studies
Less aggressive/lower risk
Patient-based detection 81 (55 to 90) 2502 6
Specimen-based detectionb 82 (79 to 84) 942 (1886) 1
More aggressive/higher risk including CIS
Patient-based detection 90 (67 to 100) 2502 6
Specimen-based detectionb 91 (84 to 100) 942 (1886) 1
CIS
Patient-based detection 100 (67 to 100) 2502 6
Specimen-based detectionb 100 942 (1886) 1
a The numbers of patients and specimens are the totals included in the overall analysis by the studies.b Specimen-based detection. In the study by Mian and colleagues113 942 participants were enrolled but it was unclear how
many were included in the analysis.
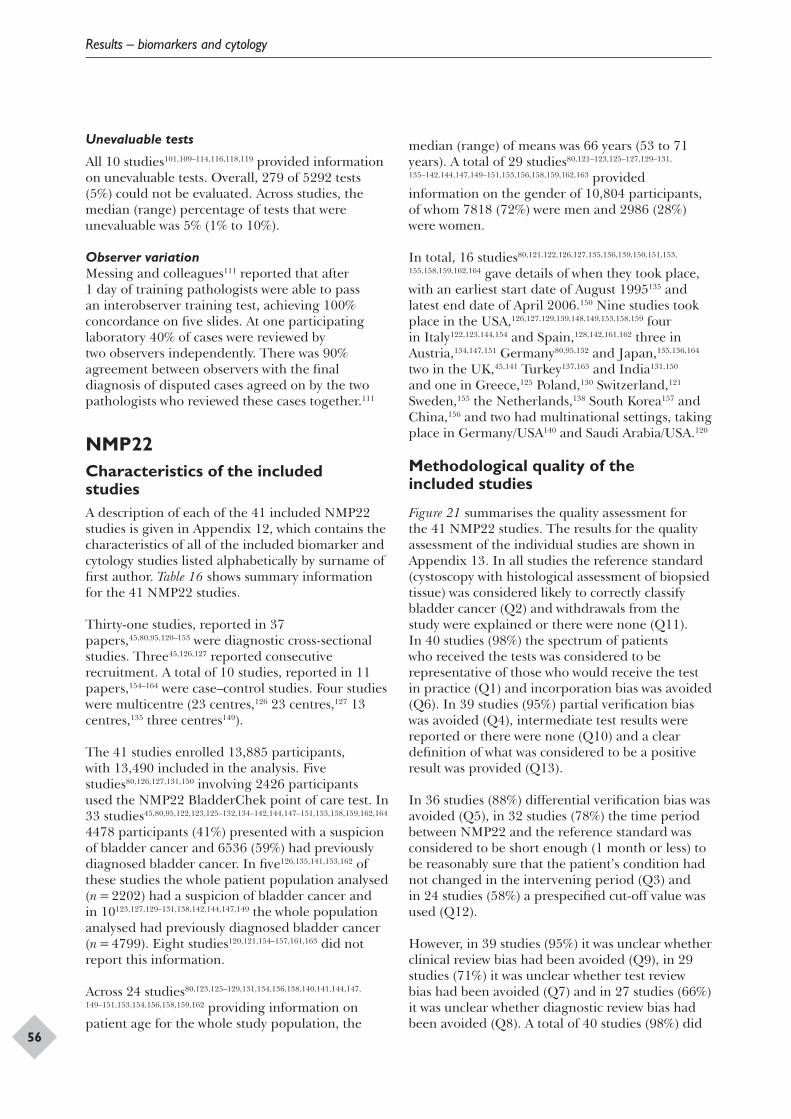
Results – biomarkers and cytology
56
Unevaluable tests
All 10 studies101,109–114,116,118,119 provided information on unevaluable tests. Overall, 279 of 5292 tests (5%) could not be evaluated. Across studies, the median (range) percentage of tests that were unevaluable was 5% (1% to 10%).
Observer variationMessing and colleagues111 reported that after 1 day of training pathologists were able to pass an interobserver training test, achieving 100% concordance on five slides. At one participating laboratory 40% of cases were reviewed by two observers independently. There was 90% agreement between observers with the final diagnosis of disputed cases agreed on by the two pathologists who reviewed these cases together.111
NMP22Characteristics of the included studiesA description of each of the 41 included NMP22 studies is given in Appendix 12, which contains the characteristics of all of the included biomarker and cytology studies listed alphabetically by surname of first author. Table 16 shows summary information for the 41 NMP22 studies.
Thirty-one studies, reported in 37 papers,45,80,95,120–153 were diagnostic cross-sectional studies. Three45,126,127 reported consecutive recruitment. A total of 10 studies, reported in 11 papers,154–164 were case–control studies. Four studies were multicentre (23 centres,126 23 centres,127 13 centres,135 three centres149).
The 41 studies enrolled 13,885 participants, with 13,490 included in the analysis. Five studies80,126,127,131,150 involving 2426 participants used the NMP22 BladderChek point of care test. In 33 studies45,80,95,122,123,125–132,134–142,144,147–151,153,158,159,162,164 4478 participants (41%) presented with a suspicion of bladder cancer and 6536 (59%) had previously diagnosed bladder cancer. In five126,135,141,153,162 of these studies the whole patient population analysed (n = 2202) had a suspicion of bladder cancer and in 10123,127,129–131,138,142,144,147,149 the whole population analysed had previously diagnosed bladder cancer (n = 4799). Eight studies120,121,154–157,161,163 did not report this information.
Across 24 studies80,123,125–129,131,134,136,138,140,141,144,147,
149–151,153,154,156,158,159,162 providing information on patient age for the whole study population, the
median (range) of means was 66 years (53 to 71 years). A total of 29 studies80,121–123,125–127,129–131,
135–142,144,147,149–151,153,156,158,159,162,163 provided information on the gender of 10,804 participants, of whom 7818 (72%) were men and 2986 (28%) were women.
In total, 16 studies80,121,122,126,127,135,136,139,150,151,153,
155,158,159,162,164 gave details of when they took place, with an earliest start date of August 1995135 and latest end date of April 2006.150 Nine studies took place in the USA,126,127,129,139,148,149,153,158,159 four in Italy122,123,144,154 and Spain,128,142,161,162 three in Austria,134,147,151 Germany80,95,132 and Japan,135,136,164 two in the UK,45,141 Turkey137,163 and India131,150 and one in Greece,125 Poland,130 Switzerland,121 Sweden,155 the Netherlands,138 South Korea157 and China,156 and two had multinational settings, taking place in Germany/USA140 and Saudi Arabia/USA.120
Methodological quality of the included studies
Figure 21 summarises the quality assessment for the 41 NMP22 studies. The results for the quality assessment of the individual studies are shown in Appendix 13. In all studies the reference standard (cystoscopy with histological assessment of biopsied tissue) was considered likely to correctly classify bladder cancer (Q2) and withdrawals from the study were explained or there were none (Q11). In 40 studies (98%) the spectrum of patients who received the tests was considered to be representative of those who would receive the test in practice (Q1) and incorporation bias was avoided (Q6). In 39 studies (95%) partial verification bias was avoided (Q4), intermediate test results were reported or there were none (Q10) and a clear definition of what was considered to be a positive result was provided (Q13).
In 36 studies (88%) differential verification bias was avoided (Q5), in 32 studies (78%) the time period between NMP22 and the reference standard was considered to be short enough (1 month or less) to be reasonably sure that the patient’s condition had not changed in the intervening period (Q3) and in 24 studies (58%) a prespecified cut-off value was used (Q12).
However, in 39 studies (95%) it was unclear whether clinical review bias had been avoided (Q9), in 29 studies (71%) it was unclear whether test review bias had been avoided (Q7) and in 27 studies (66%) it was unclear whether diagnostic review bias had been avoided (Q8). A total of 40 studies (98%) did
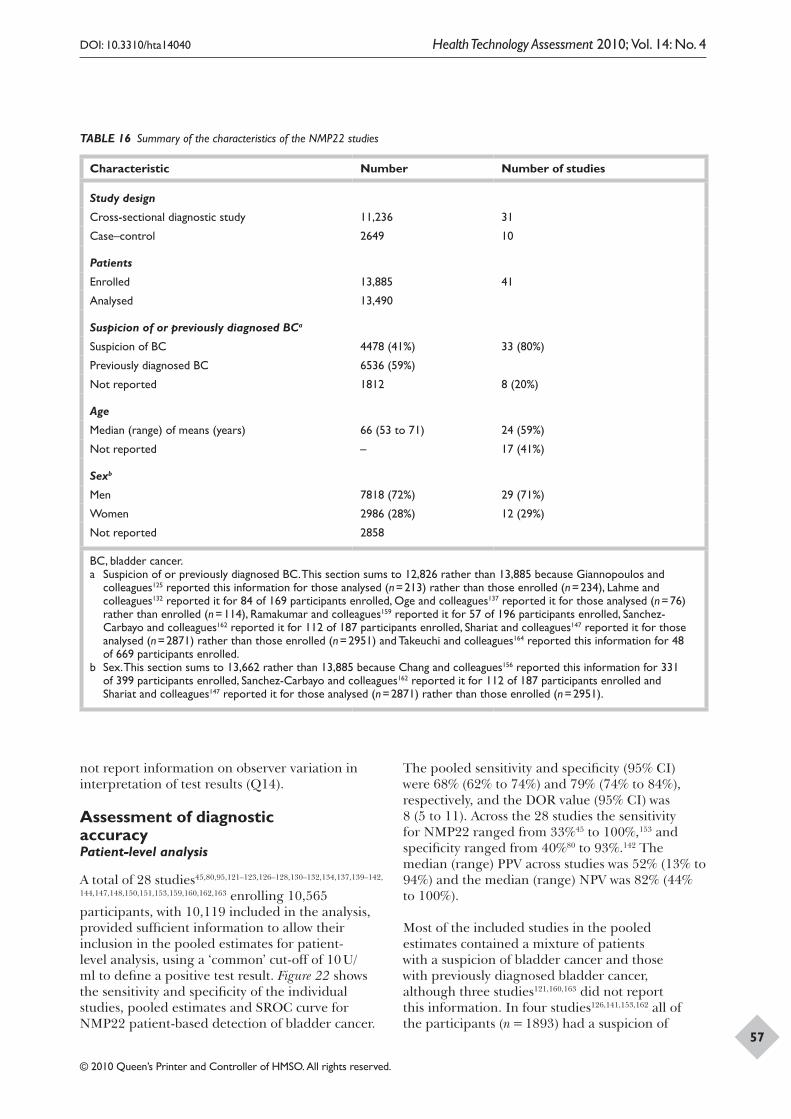
DOI: 10.3310/hta14040 Health Technology Assessment 2010; Vol. 14: No. 4
© 2010 Queen’s Printer and Controller of HMSO. All rights reserved.
57
TABLE 16 Summary of the characteristics of the NMP22 studies
Characteristic Number Number of studies
Study design
Cross-sectional diagnostic study 11,236 31
Case–control 2649 10
Patients
Enrolled 13,885 41
Analysed 13,490
Suspicion of or previously diagnosed BCa
Suspicion of BC 4478 (41%) 33 (80%)
Previously diagnosed BC 6536 (59%)
Not reported 1812 8 (20%)
Age
Median (range) of means (years) 66 (53 to 71) 24 (59%)
Not reported – 17 (41%)
Sexb
Men 7818 (72%) 29 (71%)
Women 2986 (28%) 12 (29%)
Not reported 2858
BC, bladder cancer.a Suspicion of or previously diagnosed BC. This section sums to 12,826 rather than 13,885 because Giannopoulos and
colleagues125 reported this information for those analysed (n = 213) rather than those enrolled (n = 234), Lahme and colleagues132 reported it for 84 of 169 participants enrolled, Oge and colleagues137 reported it for those analysed (n = 76) rather than enrolled (n = 114), Ramakumar and colleagues159 reported it for 57 of 196 participants enrolled, Sanchez-Carbayo and colleagues162 reported it for 112 of 187 participants enrolled, Shariat and colleagues147 reported it for those analysed (n = 2871) rather than those enrolled (n = 2951) and Takeuchi and colleagues164 reported this information for 48 of 669 participants enrolled.
b Sex. This section sums to 13,662 rather than 13,885 because Chang and colleagues156 reported this information for 331 of 399 participants enrolled, Sanchez-Carbayo and colleagues162 reported it for 112 of 187 participants enrolled and Shariat and colleagues147 reported it for those analysed (n = 2871) rather than those enrolled (n = 2951).
not report information on observer variation in interpretation of test results (Q14).
Assessment of diagnostic accuracyPatient-level analysis
A total of 28 studies45,80,95,121–123,126–128,130–132,134,137,139–142,
144,147,148,150,151,153,159,160,162,163 enrolling 10,565 participants, with 10,119 included in the analysis, provided sufficient information to allow their inclusion in the pooled estimates for patient-level analysis, using a ‘common’ cut-off of 10 U/ml to define a positive test result. Figure 22 shows the sensitivity and specificity of the individual studies, pooled estimates and SROC curve for NMP22 patient-based detection of bladder cancer.
The pooled sensitivity and specificity (95% CI) were 68% (62% to 74%) and 79% (74% to 84%), respectively, and the DOR value (95% CI) was 8 (5 to 11). Across the 28 studies the sensitivity for NMP22 ranged from 33%45 to 100%,153 and specificity ranged from 40%80 to 93%.142 The median (range) PPV across studies was 52% (13% to 94%) and the median (range) NPV was 82% (44% to 100%).
Most of the included studies in the pooled estimates contained a mixture of patients with a suspicion of bladder cancer and those with previously diagnosed bladder cancer, although three studies121,160,163 did not report this information. In four studies126,141,153,162 all of the participants (n = 1893) had a suspicion of
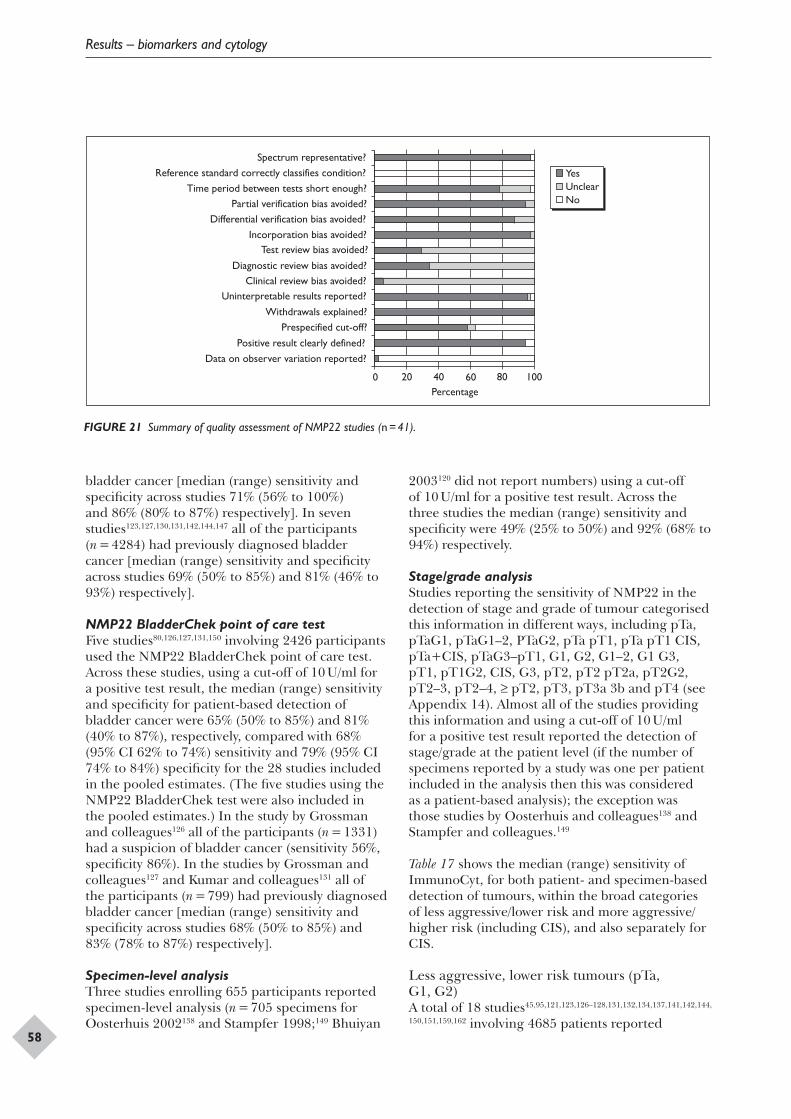
Results – biomarkers and cytology
58
Yes Unclear No
Spectrum representative? Reference standard correctly classifies condition?
Time period between tests short enough? Partial verification bias avoided?
Differential verification bias avoided? Incorporation bias avoided?
Diagnostic review bias avoided?
Test review bias avoided?
Clinical review bias avoided?Uninterpretable results reported?
Withdrawals explained? Prespecified cut-off?
Positive result clearly defined? Data on observer variation reported?
0 20 Percentage 40 60 80 100
FIGURE 21 Summary of quality assessment of NMP22 studies (n = 41).
bladder cancer [median (range) sensitivity and specificity across studies 71% (56% to 100%) and 86% (80% to 87%) respectively]. In seven studies123,127,130,131,142,144,147 all of the participants (n = 4284) had previously diagnosed bladder cancer [median (range) sensitivity and specificity across studies 69% (50% to 85%) and 81% (46% to 93%) respectively].
NMP22 BladderChek point of care testFive studies80,126,127,131,150 involving 2426 participants used the NMP22 BladderChek point of care test. Across these studies, using a cut-off of 10 U/ml for a positive test result, the median (range) sensitivity and specificity for patient-based detection of bladder cancer were 65% (50% to 85%) and 81% (40% to 87%), respectively, compared with 68% (95% CI 62% to 74%) sensitivity and 79% (95% CI 74% to 84%) specificity for the 28 studies included in the pooled estimates. (The five studies using the NMP22 BladderChek test were also included in the pooled estimates.) In the study by Grossman and colleagues126 all of the participants (n = 1331) had a suspicion of bladder cancer (sensitivity 56%, specificity 86%). In the studies by Grossman and colleagues127 and Kumar and colleagues131 all of the participants (n = 799) had previously diagnosed bladder cancer [median (range) sensitivity and specificity across studies 68% (50% to 85%) and 83% (78% to 87%) respectively].
Specimen-level analysisThree studies enrolling 655 participants reported specimen-level analysis (n = 705 specimens for Oosterhuis 2002138 and Stampfer 1998;149 Bhuiyan
2003120 did not report numbers) using a cut-off of 10 U/ml for a positive test result. Across the three studies the median (range) sensitivity and specificity were 49% (25% to 50%) and 92% (68% to 94%) respectively.
Stage/grade analysisStudies reporting the sensitivity of NMP22 in the detection of stage and grade of tumour categorised this information in different ways, including pTa, pTaG1, pTaG1–2, PTaG2, pTa pT1, pTa pT1 CIS, pTa+CIS, pTaG3–pT1, G1, G2, G1–2, G1 G3, pT1, pT1G2, CIS, G3, pT2, pT2 pT2a, pT2G2, pT2–3, pT2–4, ≥ pT2, pT3, pT3a 3b and pT4 (see Appendix 14). Almost all of the studies providing this information and using a cut-off of 10 U/ml for a positive test result reported the detection of stage/grade at the patient level (if the number of specimens reported by a study was one per patient included in the analysis then this was considered as a patient-based analysis); the exception was those studies by Oosterhuis and colleagues138 and Stampfer and colleagues.149
Table 17 shows the median (range) sensitivity of ImmunoCyt, for both patient- and specimen-based detection of tumours, within the broad categories of less aggressive/lower risk and more aggressive/higher risk (including CIS), and also separately for CIS.
Less aggressive, lower risk tumours (pTa, G1, G2)A total of 18 studies45,95,121,123,126–128,131,132,134,137,141,142,144,
150,151,159,162 involving 4685 patients reported
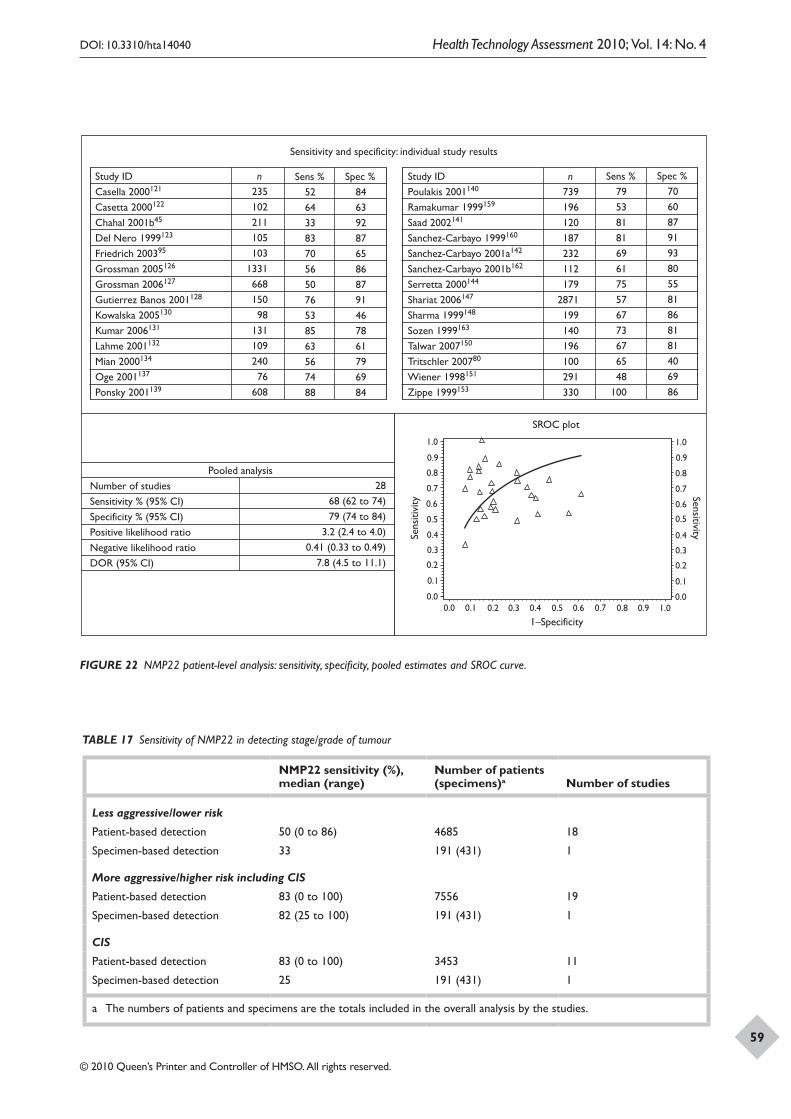
DOI: 10.3310/hta14040 Health Technology Assessment 2010; Vol. 14: No. 4
© 2010 Queen’s Printer and Controller of HMSO. All rights reserved.
59
Sens
itivi
ty
1.0
1.0
0.9
0.9
0.8
0.8
0.7
0.7
0.6
0.6
0.5
0.5
0.4
0.4
1–Specificity
0.3
0.3
0.2
0.2
0.1
0.10.0
Sensitivity
1.0
0.9
0.8
0.7
0.6
0.5
0.4
0.3
0.2
0.1
0.00.0
SROC plot
Sensitivity and specificity: individual study results
Study IDCasella 2000121
Casetta 2000122
Chahal 2001b45
Del Nero 1999123
Friedrich 200395
Grossman 2005126
Grossman 2006127
Gutierrez Banos 2001128
Kowalska 2005130
Kumar 2006131
Lahme 2001132
Mian 2000134
Oge 2001137
Ponsky 2001139
n 235102211105103
133166815098
13110924076
608
Sens %52 64 33 83 70 56 50 76 53 85 63 56 74 88
Spec %84 63 92 87 65 86 87 91 46 78 61 79 69 84
Study IDPoulakis 2001140
Ramakumar 1999159
Saad 2002141
Sanchez-Carbayo 1999160
Sanchez-Carbayo 2001a142
Sanchez-Carbayo 2001b162
Serretta 2000144
Shariat 2006147
Sharma 1999148
Sozen 1999163
Talwar 2007150
Tritschler 200780
Wiener 1998151
Zippe 1999153
n 739196120187232112179
2871199140196100291330
Sens %79 53 81 81 69 61 75 57 67 73 67 65 48
100
Spec %70 60 87 91 93 80 55 81 86 81 81 40 69 86
2868 (62 to 74)79 (74 to 84)
3.2 (2.4 to 4.0)0.41 (0.33 to 0.49)
7.8 (4.5 to 11.1)
Pooled analysisNumber of studiesSensitivity % (95% CI)Specificity % (95% CI)Positive likelihood ratioNegative likelihood ratioDOR (95% CI)
FIGURE 22 NMP22 patient-level analysis: sensitivity, specificity, pooled estimates and SROC curve.
TABLE 17 Sensitivity of NMP22 in detecting stage/grade of tumour
NMP22 sensitivity (%), median (range)
Number of patients (specimens)a Number of studies
Less aggressive/lower risk
Patient-based detection 50 (0 to 86) 4685 18
Specimen-based detection 33 191 (431) 1
More aggressive/higher risk including CIS
Patient-based detection 83 (0 to 100) 7556 19
Specimen-based detection 82 (25 to 100) 191 (431) 1
CIS
Patient-based detection 83 (0 to 100) 3453 11
Specimen-based detection 25 191 (431) 1
a The numbers of patients and specimens are the totals included in the overall analysis by the studies.
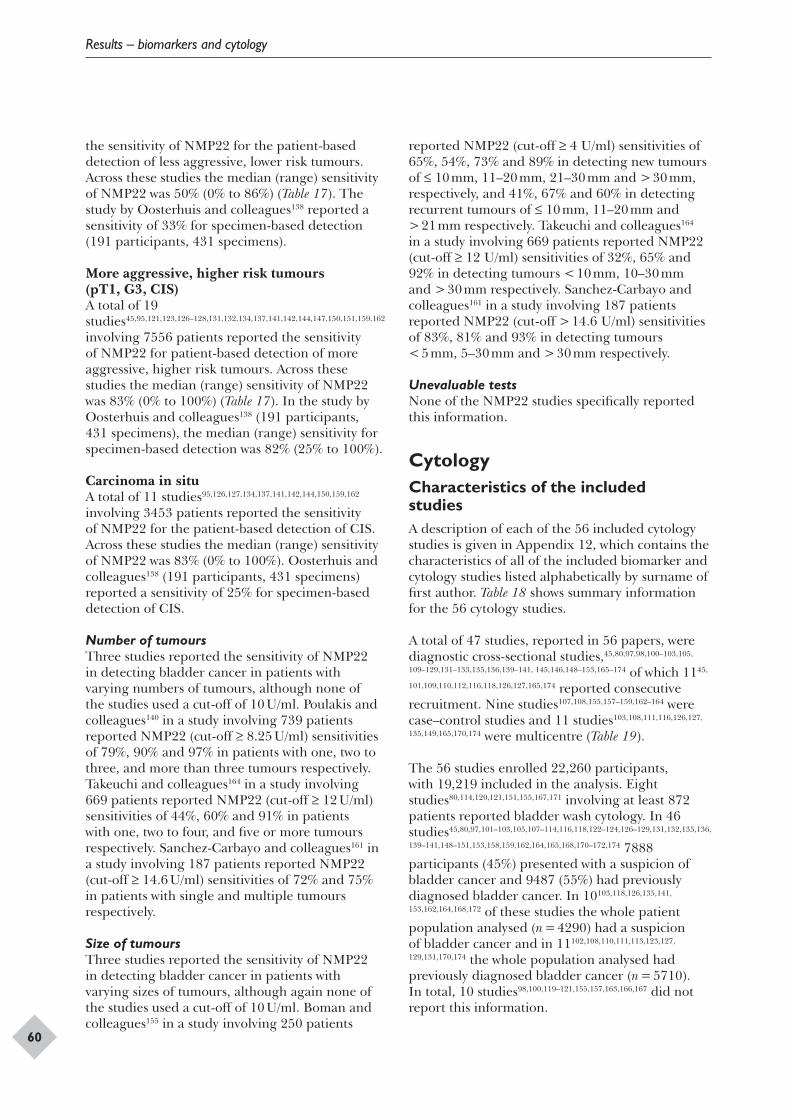
Results – biomarkers and cytology
60
the sensitivity of NMP22 for the patient-based detection of less aggressive, lower risk tumours. Across these studies the median (range) sensitivity of NMP22 was 50% (0% to 86%) (Table 17). The study by Oosterhuis and colleagues138 reported a sensitivity of 33% for specimen-based detection (191 participants, 431 specimens).
More aggressive, higher risk tumours (pT1, G3, CIS)A total of 19 studies45,95,121,123,126–128,131,132,134,137,141,142,144,147,150,151,159,162 involving 7556 patients reported the sensitivity of NMP22 for patient-based detection of more aggressive, higher risk tumours. Across these studies the median (range) sensitivity of NMP22 was 83% (0% to 100%) (Table 17). In the study by Oosterhuis and colleagues138 (191 participants, 431 specimens), the median (range) sensitivity for specimen-based detection was 82% (25% to 100%).
Carcinoma in situA total of 11 studies95,126,127,134,137,141,142,144,150,159,162 involving 3453 patients reported the sensitivity of NMP22 for the patient-based detection of CIS. Across these studies the median (range) sensitivity of NMP22 was 83% (0% to 100%). Oosterhuis and colleagues138 (191 participants, 431 specimens) reported a sensitivity of 25% for specimen-based detection of CIS.
Number of tumoursThree studies reported the sensitivity of NMP22 in detecting bladder cancer in patients with varying numbers of tumours, although none of the studies used a cut-off of 10 U/ml. Poulakis and colleagues140 in a study involving 739 patients reported NMP22 (cut-off ≥ 8.25 U/ml) sensitivities of 79%, 90% and 97% in patients with one, two to three, and more than three tumours respectively. Takeuchi and colleagues164 in a study involving 669 patients reported NMP22 (cut-off ≥ 12 U/ml) sensitivities of 44%, 60% and 91% in patients with one, two to four, and five or more tumours respectively. Sanchez-Carbayo and colleagues161 in a study involving 187 patients reported NMP22 (cut-off ≥ 14.6 U/ml) sensitivities of 72% and 75% in patients with single and multiple tumours respectively.
Size of tumoursThree studies reported the sensitivity of NMP22 in detecting bladder cancer in patients with varying sizes of tumours, although again none of the studies used a cut-off of 10 U/ml. Boman and colleagues155 in a study involving 250 patients
reported NMP22 (cut-off ≥ 4 U/ml) sensitivities of 65%, 54%, 73% and 89% in detecting new tumours of ≤ 10 mm, 11–20 mm, 21–30 mm and > 30 mm, respectively, and 41%, 67% and 60% in detecting recurrent tumours of ≤ 10 mm, 11–20 mm and > 21 mm respectively. Takeuchi and colleagues164 in a study involving 669 patients reported NMP22 (cut-off ≥ 12 U/ml) sensitivities of 32%, 65% and 92% in detecting tumours < 10 mm, 10–30 mm and > 30 mm respectively. Sanchez-Carbayo and colleagues161 in a study involving 187 patients reported NMP22 (cut-off > 14.6 U/ml) sensitivities of 83%, 81% and 93% in detecting tumours < 5 mm, 5–30 mm and > 30 mm respectively.
Unevaluable testsNone of the NMP22 studies specifically reported this information.
CytologyCharacteristics of the included studiesA description of each of the 56 included cytology studies is given in Appendix 12, which contains the characteristics of all of the included biomarker and cytology studies listed alphabetically by surname of first author. Table 18 shows summary information for the 56 cytology studies.
A total of 47 studies, reported in 56 papers, were diagnostic cross-sectional studies,45,80,97,98,100–103,105,
109–129,131–133,135,136,139–141, 145,146,148–153,165–174 of which 1145,
101,109,110,112,116,118,126,127,165,174 reported consecutive recruitment. Nine studies107,108,155,157–159,162–164 were case–control studies and 11 studies103,108,111,116,126,127,
135,149,165,170,174 were multicentre (Table 19).
The 56 studies enrolled 22,260 participants, with 19,219 included in the analysis. Eight studies80,114,120,121,151,155,167,171 involving at least 872 patients reported bladder wash cytology. In 46 studies45,80,97,101–103,105,107–114,116,118,122–124,126–129,131,132,135,136,
139–141,148–151,153,158,159,162,164,165,168,170–172,174 7888 participants (45%) presented with a suspicion of bladder cancer and 9487 (55%) had previously diagnosed bladder cancer. In 10103,118,126,135,141,
153,162,164,168,172 of these studies the whole patient population analysed (n = 4290) had a suspicion of bladder cancer and in 11102,108,110,111,113,123,127,
129,131,170,174 the whole population analysed had previously diagnosed bladder cancer (n = 5710). In total, 10 studies98,100,119–121,155,157,163,166,167 did not report this information.
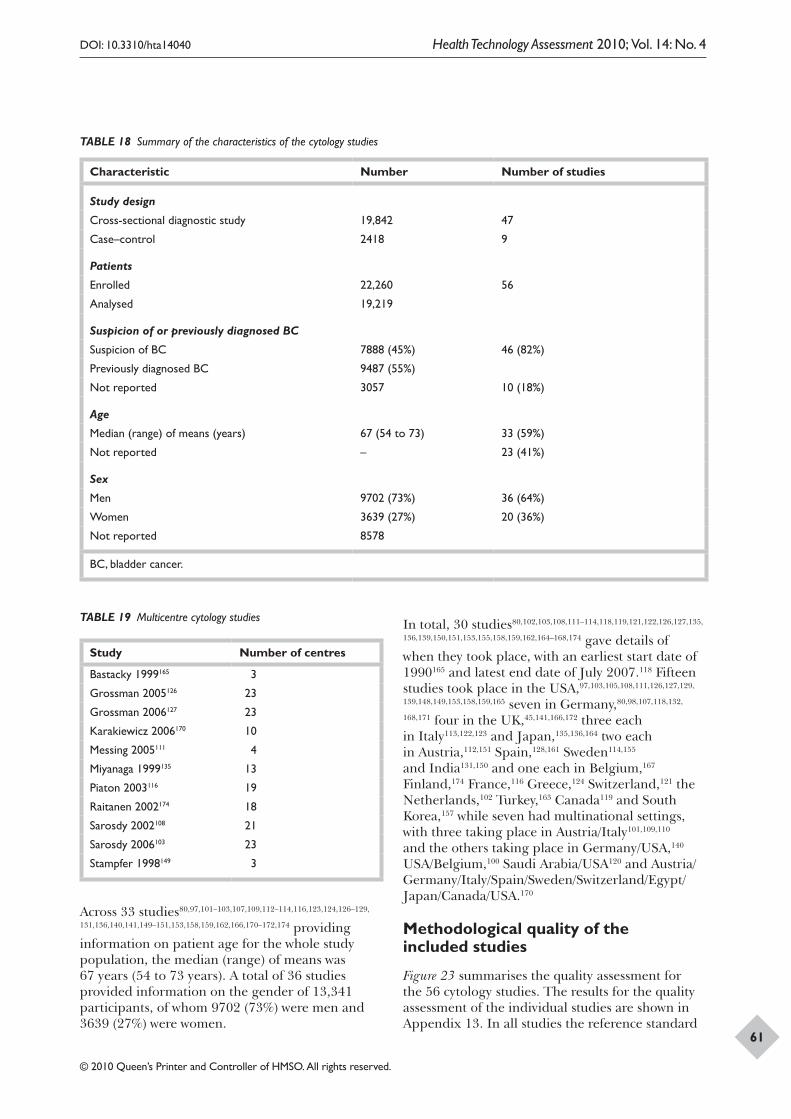
DOI: 10.3310/hta14040 Health Technology Assessment 2010; Vol. 14: No. 4
© 2010 Queen’s Printer and Controller of HMSO. All rights reserved.
61
TABLE 18 Summary of the characteristics of the cytology studies
Characteristic Number Number of studies
Study design
Cross-sectional diagnostic study 19,842 47
Case–control 2418 9
Patients
Enrolled 22,260 56
Analysed 19,219
Suspicion of or previously diagnosed BC
Suspicion of BC 7888 (45%) 46 (82%)
Previously diagnosed BC 9487 (55%)
Not reported 3057 10 (18%)
Age
Median (range) of means (years) 67 (54 to 73) 33 (59%)
Not reported – 23 (41%)
Sex
Men 9702 (73%) 36 (64%)
Women 3639 (27%) 20 (36%)
Not reported 8578
BC, bladder cancer.
Across 33 studies80,97,101–103,107,109,112–114,116,123,124,126–129,
131,136,140,141,149–151,153,158,159,162,166,170–172,174 providing information on patient age for the whole study population, the median (range) of means was 67 years (54 to 73 years). A total of 36 studies provided information on the gender of 13,341 participants, of whom 9702 (73%) were men and 3639 (27%) were women.
In total, 30 studies80,102,103,108,111–114,118,119,121,122,126,127,135,
136,139,150,151,153,155,158,159,162,164–168,174 gave details of when they took place, with an earliest start date of 1990165 and latest end date of July 2007.118 Fifteen studies took place in the USA,97,103,105,108,111,126,127,129,
139,148,149,153,158,159,165 seven in Germany,80,98,107,118,132,
168,171 four in the UK,45,141,166,172 three each in Italy113,122,123 and Japan,135,136,164 two each in Austria,112,151 Spain,128,161 Sweden114,155 and India131,150 and one each in Belgium,167 Finland,174 France,116 Greece,124 Switzerland,121 the Netherlands,102 Turkey,163 Canada119 and South Korea,157 while seven had multinational settings, with three taking place in Austria/Italy101,109,110 and the others taking place in Germany/USA,140 USA/Belgium,100 Saudi Arabia/USA120 and Austria/Germany/Italy/Spain/Sweden/Switzerland/Egypt/Japan/Canada/USA.170
Methodological quality of the included studies
Figure 23 summarises the quality assessment for the 56 cytology studies. The results for the quality assessment of the individual studies are shown in Appendix 13. In all studies the reference standard
TABLE 19 Multicentre cytology studies
Study Number of centres
Bastacky 1999165 3
Grossman 2005126 23
Grossman 2006127 23
Karakiewicz 2006170 10
Messing 2005111 4
Miyanaga 1999135 13
Piaton 2003116 19
Raitanen 2002174 18
Sarosdy 2002108 21
Sarosdy 2006103 23
Stampfer 1998149 3
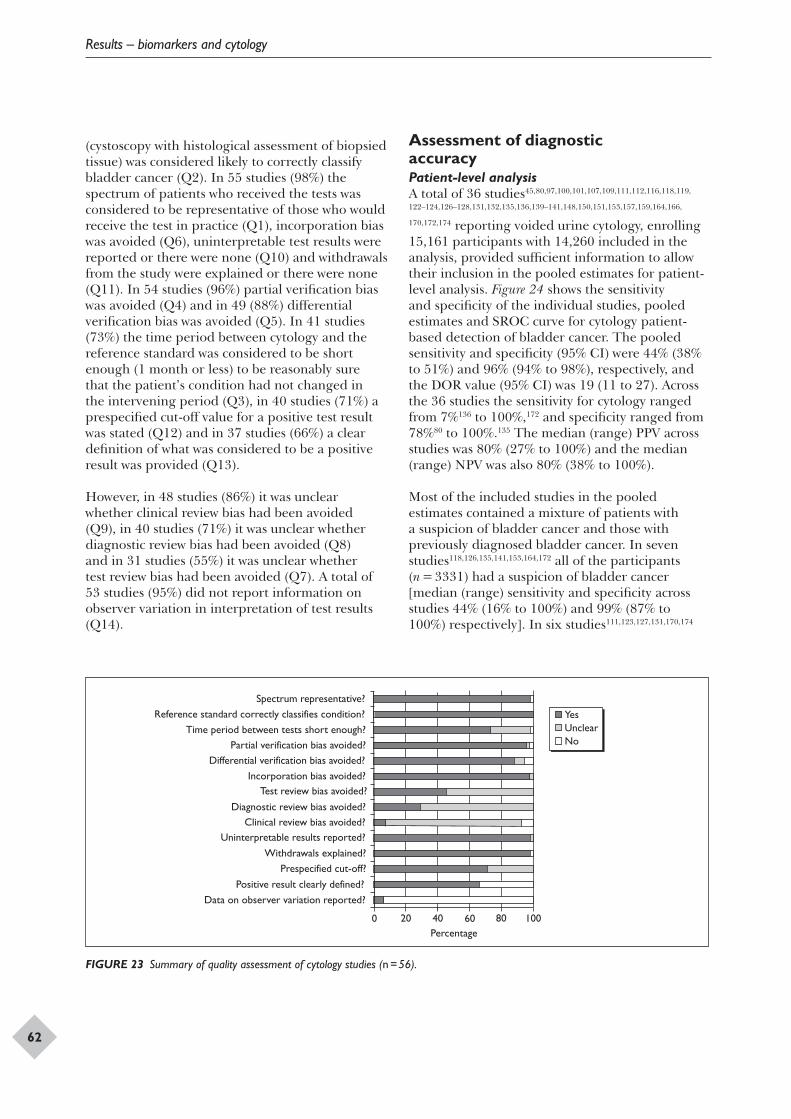
Results – biomarkers and cytology
62
(cystoscopy with histological assessment of biopsied tissue) was considered likely to correctly classify bladder cancer (Q2). In 55 studies (98%) the spectrum of patients who received the tests was considered to be representative of those who would receive the test in practice (Q1), incorporation bias was avoided (Q6), uninterpretable test results were reported or there were none (Q10) and withdrawals from the study were explained or there were none (Q11). In 54 studies (96%) partial verification bias was avoided (Q4) and in 49 (88%) differential verification bias was avoided (Q5). In 41 studies (73%) the time period between cytology and the reference standard was considered to be short enough (1 month or less) to be reasonably sure that the patient’s condition had not changed in the intervening period (Q3), in 40 studies (71%) a prespecified cut-off value for a positive test result was stated (Q12) and in 37 studies (66%) a clear definition of what was considered to be a positive result was provided (Q13).
However, in 48 studies (86%) it was unclear whether clinical review bias had been avoided (Q9), in 40 studies (71%) it was unclear whether diagnostic review bias had been avoided (Q8) and in 31 studies (55%) it was unclear whether test review bias had been avoided (Q7). A total of 53 studies (95%) did not report information on observer variation in interpretation of test results (Q14).
Assessment of diagnostic accuracyPatient-level analysisA total of 36 studies45,80,97,100,101,107,109,111,112,116,118,119,
122–124,126–128,131,132,135,136,139–141,148,150,151,153,157,159,164,166,
170,172,174 reporting voided urine cytology, enrolling 15,161 participants with 14,260 included in the analysis, provided sufficient information to allow their inclusion in the pooled estimates for patient-level analysis. Figure 24 shows the sensitivity and specificity of the individual studies, pooled estimates and SROC curve for cytology patient-based detection of bladder cancer. The pooled sensitivity and specificity (95% CI) were 44% (38% to 51%) and 96% (94% to 98%), respectively, and the DOR value (95% CI) was 19 (11 to 27). Across the 36 studies the sensitivity for cytology ranged from 7%136 to 100%,172 and specificity ranged from 78%80 to 100%.135 The median (range) PPV across studies was 80% (27% to 100%) and the median (range) NPV was also 80% (38% to 100%).
Most of the included studies in the pooled estimates contained a mixture of patients with a suspicion of bladder cancer and those with previously diagnosed bladder cancer. In seven studies118,126,135,141,153,164,172 all of the participants (n = 3331) had a suspicion of bladder cancer [median (range) sensitivity and specificity across studies 44% (16% to 100%) and 99% (87% to 100%) respectively]. In six studies111,123,127,131,170,174
Yes Unclear No
Spectrum representative? Reference standard correctly classifies condition?
Time period between tests short enough? Partial verification bias avoided?
Differential verification bias avoided? Incorporation bias avoided?
Diagnostic review bias avoided?
Test review bias avoided?
Clinical review bias avoided?Uninterpretable results reported?
Withdrawals explained? Prespecified cut-off?
Positive result clearly defined? Data on observer variation reported?
0 20 Percentage 40 60 80 100
FIGURE 23 Summary of quality assessment of cytology studies (n = 56).
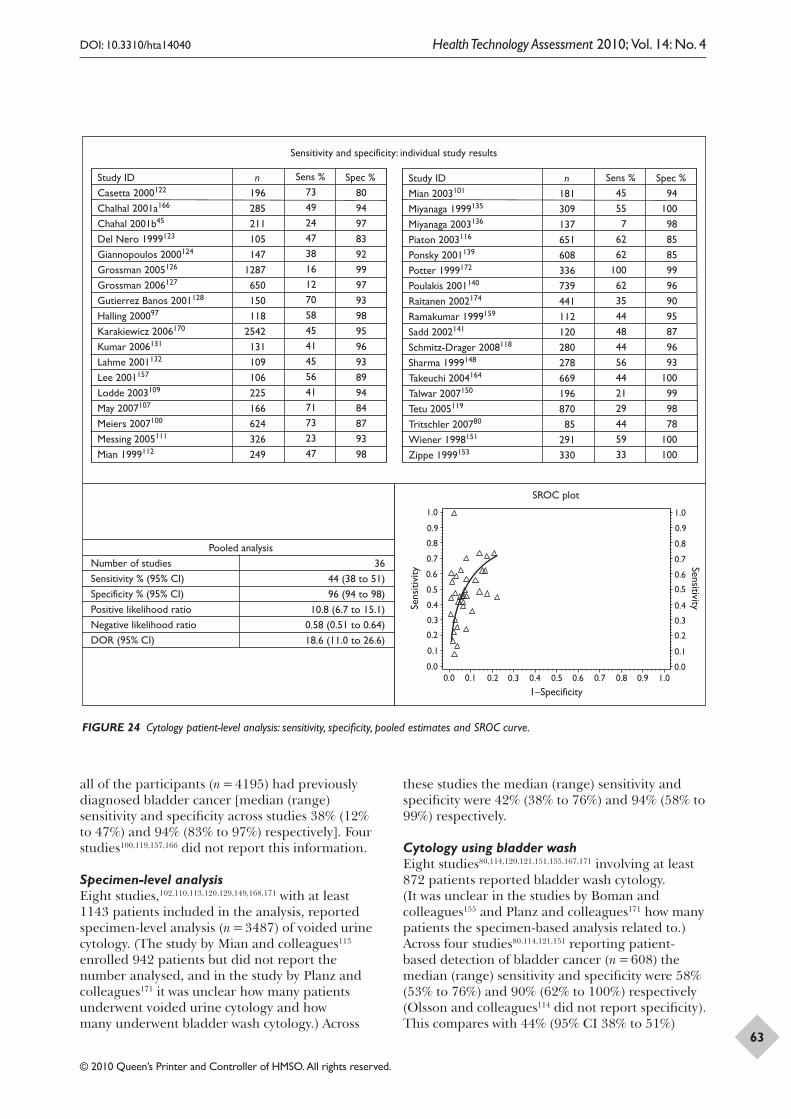
DOI: 10.3310/hta14040 Health Technology Assessment 2010; Vol. 14: No. 4
© 2010 Queen’s Printer and Controller of HMSO. All rights reserved.
63
Sens
itivi
ty
1.0
1.0
0.9
0.9
0.8
0.8
0.7
0.7
0.6
0.6
0.5
0.5
0.4
0.4
1–Specificity
0.3
0.3
0.2
0.2
0.1
0.1 0.0
Sensitivity
1.0
0.9
0.8
0.7
0.6
0.5
0.4
0.3
0.2
0.1
0.0 0.0
SROC plot
Sensitivity and specificity: individual study results
Pooled analysis Number of studies Sensitivity % (95% CI) Specificity % (95% CI) Positive likelihood ratio Negative likelihood ratio DOR (95% CI)
Study ID Casetta 2000122
Chalhal 2001a166
Chahal 2001b45
Del Nero 1999123
Giannopoulos 2000124
Grossman 2005126
Grossman 2006127
Gutierrez Banos 2001128
Halling 200097
Karakiewicz 2006170
Kumar 2006131
Lahme 2001132
Lee 2001157
Lodde 2003109
May 2007107
Meiers 2007100
Messing 2005111
Mian 1999112
n 196 285 211 105 147
1287 650 150 118
2542 131 109 106 225 166 624 326 249
Sens % 73 49 24 47 38 16 12 70 58 45 41 45 56 41 71 73 23 47
Spec % 80 94 97 83 92 99 97 93 98 95 96 93 89 94 84 87 93 98
Study ID Mian 2003101
Miyanaga 1999135
Miyanaga 2003136
Piaton 2003116
Ponsky 2001139
Potter 1999172
Poulakis 2001140
Raitanen 2002174
Ramakumar 1999159
Sadd 2002141
Schmitz-Drager 2008118
Sharma 1999148
Takeuchi 2004164
Talwar 2007150
Tetu 2005119
Tritschler 200780
Wiener 1998151
Zippe 1999153
n 181 309 137 651 608 336 739 441 112 120 280 278 669 196 870 85
291 330
Sens % 45 55 7
62 62
100 62 35 44 48 44 56 44 21 29 44 59 33
Spec % 94
100 98 85 85 99 96 90 95 87 96 93
100 99 98 78
100 100
36 44 (38 to 51) 96 (94 to 98)
10.8 (6.7 to 15.1) 0.58 (0.51 to 0.64) 18.6 (11.0 to 26.6)
FIGURE 24 Cytology patient-level analysis: sensitivity, specificity, pooled estimates and SROC curve.
all of the participants (n = 4195) had previously diagnosed bladder cancer [median (range) sensitivity and specificity across studies 38% (12% to 47%) and 94% (83% to 97%) respectively]. Four studies100,119,157,166 did not report this information.
Specimen-level analysisEight studies,102,110,113,120,129,149,168,171 with at least 1143 patients included in the analysis, reported specimen-level analysis (n = 3487) of voided urine cytology. (The study by Mian and colleagues113 enrolled 942 patients but did not report the number analysed, and in the study by Planz and colleagues171 it was unclear how many patients underwent voided urine cytology and how many underwent bladder wash cytology.) Across
these studies the median (range) sensitivity and specificity were 42% (38% to 76%) and 94% (58% to 99%) respectively.
Cytology using bladder washEight studies80,114,120,121,151,155,167,171 involving at least 872 patients reported bladder wash cytology. (It was unclear in the studies by Boman and colleagues155 and Planz and colleagues171 how many patients the specimen-based analysis related to.) Across four studies80,114,121,151 reporting patient-based detection of bladder cancer (n = 608) the median (range) sensitivity and specificity were 58% (53% to 76%) and 90% (62% to 100%) respectively (Olsson and colleagues114 did not report specificity). This compares with 44% (95% CI 38% to 51%)
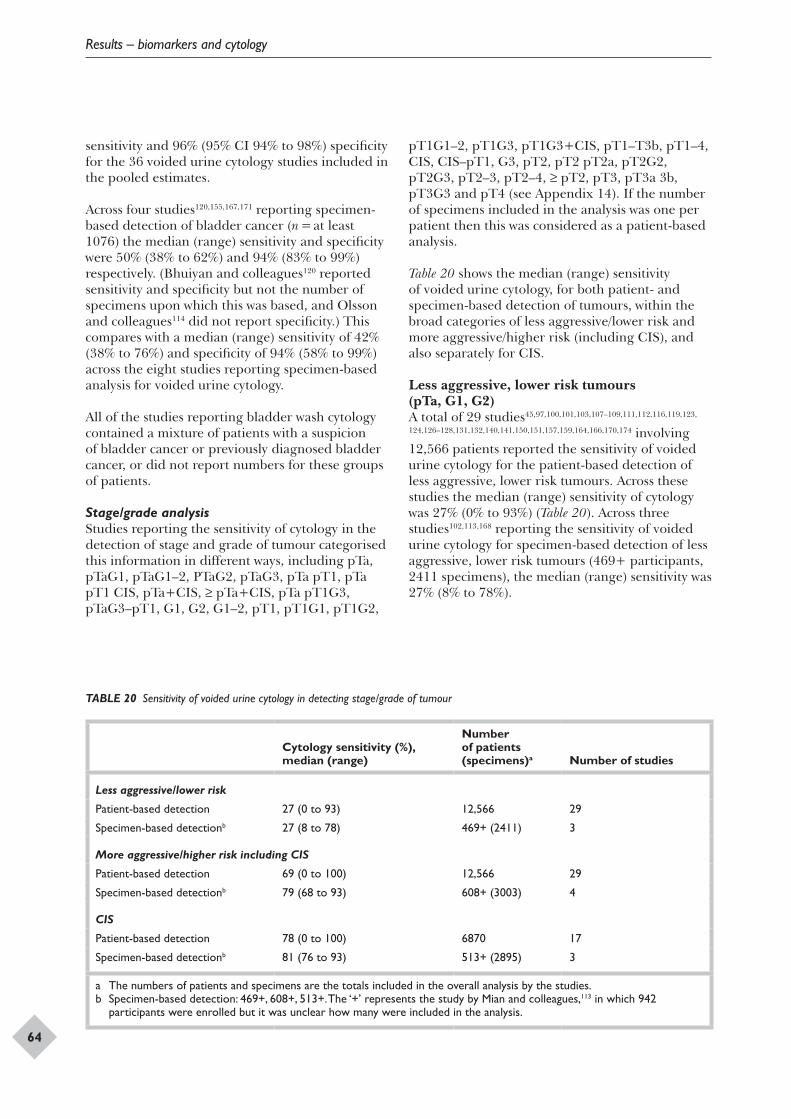
Results – biomarkers and cytology
64
sensitivity and 96% (95% CI 94% to 98%) specificity for the 36 voided urine cytology studies included in the pooled estimates.
Across four studies120,155,167,171 reporting specimen-based detection of bladder cancer (n = at least 1076) the median (range) sensitivity and specificity were 50% (38% to 62%) and 94% (83% to 99%) respectively. (Bhuiyan and colleagues120 reported sensitivity and specificity but not the number of specimens upon which this was based, and Olsson and colleagues114 did not report specificity.) This compares with a median (range) sensitivity of 42% (38% to 76%) and specificity of 94% (58% to 99%) across the eight studies reporting specimen-based analysis for voided urine cytology.
All of the studies reporting bladder wash cytology contained a mixture of patients with a suspicion of bladder cancer or previously diagnosed bladder cancer, or did not report numbers for these groups of patients.
Stage/grade analysisStudies reporting the sensitivity of cytology in the detection of stage and grade of tumour categorised this information in different ways, including pTa, pTaG1, pTaG1–2, PTaG2, pTaG3, pTa pT1, pTa pT1 CIS, pTa+CIS, ≥ pTa+CIS, pTa pT1G3, pTaG3–pT1, G1, G2, G1–2, pT1, pT1G1, pT1G2,
pT1G1–2, pT1G3, pT1G3+CIS, pT1–T3b, pT1–4, CIS, CIS–pT1, G3, pT2, pT2 pT2a, pT2G2, pT2G3, pT2–3, pT2–4, ≥ pT2, pT3, pT3a 3b, pT3G3 and pT4 (see Appendix 14). If the number of specimens included in the analysis was one per patient then this was considered as a patient-based analysis.
Table 20 shows the median (range) sensitivity of voided urine cytology, for both patient- and specimen-based detection of tumours, within the broad categories of less aggressive/lower risk and more aggressive/higher risk (including CIS), and also separately for CIS.
Less aggressive, lower risk tumours (pTa, G1, G2)A total of 29 studies45,97,100,101,103,107–109,111,112,116,119,123,
124,126–128,131,132,140,141,150,151,157,159,164,166,170,174 involving 12,566 patients reported the sensitivity of voided urine cytology for the patient-based detection of less aggressive, lower risk tumours. Across these studies the median (range) sensitivity of cytology was 27% (0% to 93%) (Table 20). Across three studies102,113,168 reporting the sensitivity of voided urine cytology for specimen-based detection of less aggressive, lower risk tumours (469+ participants, 2411 specimens), the median (range) sensitivity was 27% (8% to 78%).
TABLE 20 Sensitivity of voided urine cytology in detecting stage/grade of tumour
Cytology sensitivity (%), median (range)
Number of patients (specimens)a Number of studies
Less aggressive/lower risk
Patient-based detection 27 (0 to 93) 12,566 29
Specimen-based detectionb 27 (8 to 78) 469+ (2411) 3
More aggressive/higher risk including CIS
Patient-based detection 69 (0 to 100) 12,566 29
Specimen-based detectionb 79 (68 to 93) 608+ (3003) 4
CIS
Patient-based detection 78 (0 to 100) 6870 17
Specimen-based detectionb 81 (76 to 93) 513+ (2895) 3
a The numbers of patients and specimens are the totals included in the overall analysis by the studies.b Specimen-based detection: 469+, 608+, 513+. The ‘+’ represents the study by Mian and colleagues,113 in which 942
participants were enrolled but it was unclear how many were included in the analysis.
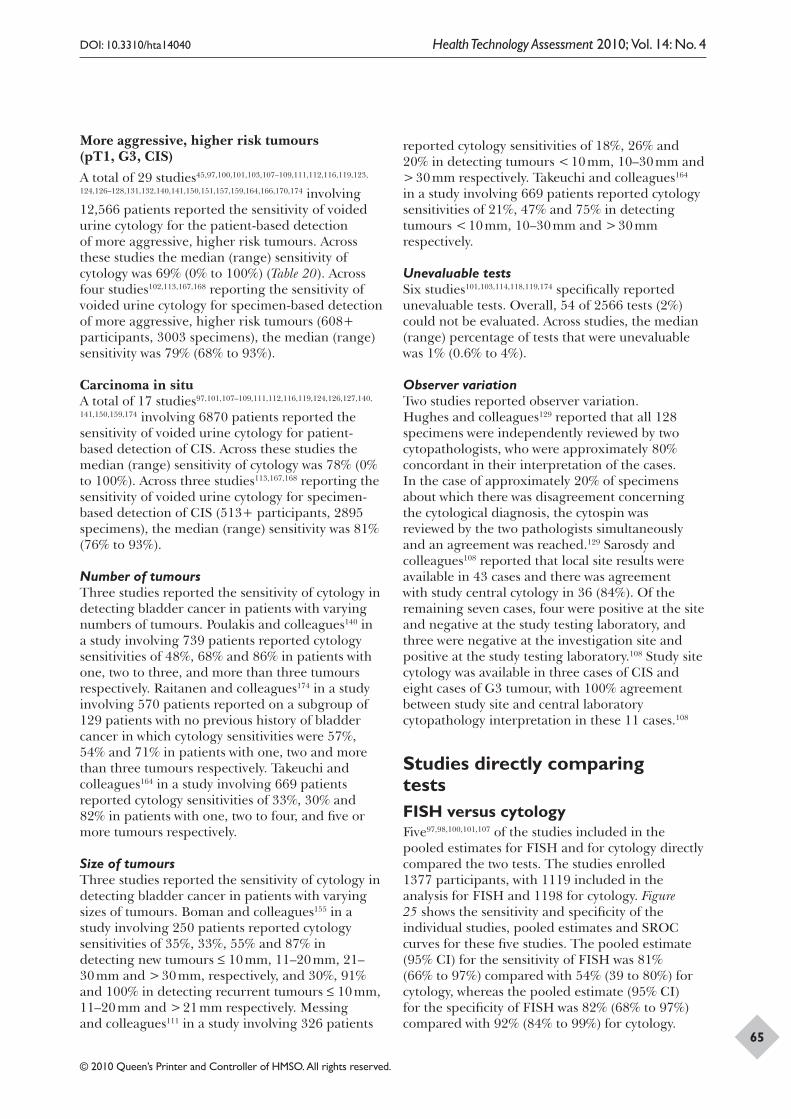
DOI: 10.3310/hta14040 Health Technology Assessment 2010; Vol. 14: No. 4
© 2010 Queen’s Printer and Controller of HMSO. All rights reserved.
65
More aggressive, higher risk tumours (pT1, G3, CIS)A total of 29 studies45,97,100,101,103,107–109,111,112,116,119,123,
124,126–128,131,132,140,141,150,151,157,159,164,166,170,174 involving 12,566 patients reported the sensitivity of voided urine cytology for the patient-based detection of more aggressive, higher risk tumours. Across these studies the median (range) sensitivity of cytology was 69% (0% to 100%) (Table 20). Across four studies102,113,167,168 reporting the sensitivity of voided urine cytology for specimen-based detection of more aggressive, higher risk tumours (608+ participants, 3003 specimens), the median (range) sensitivity was 79% (68% to 93%).
Carcinoma in situA total of 17 studies97,101,107–109,111,112,116,119,124,126,127,140,
141,150,159,174 involving 6870 patients reported the sensitivity of voided urine cytology for patient-based detection of CIS. Across these studies the median (range) sensitivity of cytology was 78% (0% to 100%). Across three studies113,167,168 reporting the sensitivity of voided urine cytology for specimen-based detection of CIS (513+ participants, 2895 specimens), the median (range) sensitivity was 81% (76% to 93%).
Number of tumoursThree studies reported the sensitivity of cytology in detecting bladder cancer in patients with varying numbers of tumours. Poulakis and colleagues140 in a study involving 739 patients reported cytology sensitivities of 48%, 68% and 86% in patients with one, two to three, and more than three tumours respectively. Raitanen and colleagues174 in a study involving 570 patients reported on a subgroup of 129 patients with no previous history of bladder cancer in which cytology sensitivities were 57%, 54% and 71% in patients with one, two and more than three tumours respectively. Takeuchi and colleagues164 in a study involving 669 patients reported cytology sensitivities of 33%, 30% and 82% in patients with one, two to four, and five or more tumours respectively.
Size of tumoursThree studies reported the sensitivity of cytology in detecting bladder cancer in patients with varying sizes of tumours. Boman and colleagues155 in a study involving 250 patients reported cytology sensitivities of 35%, 33%, 55% and 87% in detecting new tumours ≤ 10 mm, 11–20 mm, 21–30 mm and > 30 mm, respectively, and 30%, 91% and 100% in detecting recurrent tumours ≤ 10 mm, 11–20 mm and > 21 mm respectively. Messing and colleagues111 in a study involving 326 patients
reported cytology sensitivities of 18%, 26% and 20% in detecting tumours < 10 mm, 10–30 mm and > 30 mm respectively. Takeuchi and colleagues164 in a study involving 669 patients reported cytology sensitivities of 21%, 47% and 75% in detecting tumours < 10 mm, 10–30 mm and > 30 mm respectively.
Unevaluable testsSix studies101,103,114,118,119,174 specifically reported unevaluable tests. Overall, 54 of 2566 tests (2%) could not be evaluated. Across studies, the median (range) percentage of tests that were unevaluable was 1% (0.6% to 4%).
Observer variationTwo studies reported observer variation. Hughes and colleagues129 reported that all 128 specimens were independently reviewed by two cytopathologists, who were approximately 80% concordant in their interpretation of the cases. In the case of approximately 20% of specimens about which there was disagreement concerning the cytological diagnosis, the cytospin was reviewed by the two pathologists simultaneously and an agreement was reached.129 Sarosdy and colleagues108 reported that local site results were available in 43 cases and there was agreement with study central cytology in 36 (84%). Of the remaining seven cases, four were positive at the site and negative at the study testing laboratory, and three were negative at the investigation site and positive at the study testing laboratory.108 Study site cytology was available in three cases of CIS and eight cases of G3 tumour, with 100% agreement between study site and central laboratory cytopathology interpretation in these 11 cases.108
Studies directly comparing testsFISH versus cytologyFive97,98,100,101,107 of the studies included in the pooled estimates for FISH and for cytology directly compared the two tests. The studies enrolled 1377 participants, with 1119 included in the analysis for FISH and 1198 for cytology. Figure 25 shows the sensitivity and specificity of the individual studies, pooled estimates and SROC curves for these five studies. The pooled estimate (95% CI) for the sensitivity of FISH was 81% (66% to 97%) compared with 54% (39 to 80%) for cytology, whereas the pooled estimate (95% CI) for the specificity of FISH was 82% (68% to 97%) compared with 92% (84% to 99%) for cytology.
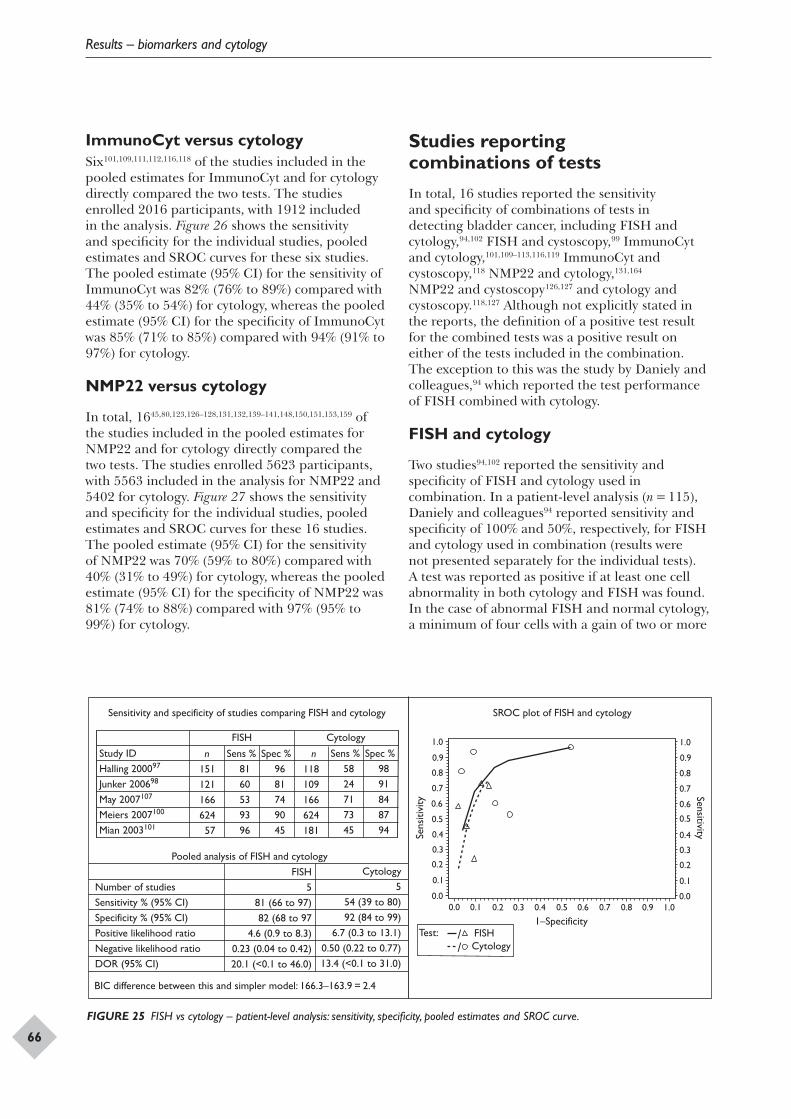
Results – biomarkers and cytology
66
ImmunoCyt versus cytologySix101,109,111,112,116,118 of the studies included in the pooled estimates for ImmunoCyt and for cytology directly compared the two tests. The studies enrolled 2016 participants, with 1912 included in the analysis. Figure 26 shows the sensitivity and specificity for the individual studies, pooled estimates and SROC curves for these six studies. The pooled estimate (95% CI) for the sensitivity of ImmunoCyt was 82% (76% to 89%) compared with 44% (35% to 54%) for cytology, whereas the pooled estimate (95% CI) for the specificity of ImmunoCyt was 85% (71% to 85%) compared with 94% (91% to 97%) for cytology.
NMP22 versus cytology
In total, 1645,80,123,126–128,131,132,139–141,148,150,151,153,159 of the studies included in the pooled estimates for NMP22 and for cytology directly compared the two tests. The studies enrolled 5623 participants, with 5563 included in the analysis for NMP22 and 5402 for cytology. Figure 27 shows the sensitivity and specificity for the individual studies, pooled estimates and SROC curves for these 16 studies. The pooled estimate (95% CI) for the sensitivity of NMP22 was 70% (59% to 80%) compared with 40% (31% to 49%) for cytology, whereas the pooled estimate (95% CI) for the specificity of NMP22 was 81% (74% to 88%) compared with 97% (95% to 99%) for cytology.
Studies reporting combinations of testsIn total, 16 studies reported the sensitivity and specificity of combinations of tests in detecting bladder cancer, including FISH and cytology,94,102 FISH and cystoscopy,99 ImmunoCyt and cytology,101,109–113,116,119 ImmunoCyt and cystoscopy,118 NMP22 and cytology,131,164 NMP22 and cystoscopy126,127 and cytology and cystoscopy.118,127 Although not explicitly stated in the reports, the definition of a positive test result for the combined tests was a positive result on either of the tests included in the combination. The exception to this was the study by Daniely and colleagues,94 which reported the test performance of FISH combined with cytology.
FISH and cytology
Two studies94,102 reported the sensitivity and specificity of FISH and cytology used in combination. In a patient-level analysis (n = 115), Daniely and colleagues94 reported sensitivity and specificity of 100% and 50%, respectively, for FISH and cytology used in combination (results were not presented separately for the individual tests). A test was reported as positive if at least one cell abnormality in both cytology and FISH was found. In the case of abnormal FISH and normal cytology, a minimum of four cells with a gain of two or more
Sens
itivi
ty
1.0
1.0
0.9
0.9
0.8
0.8
0.7
0.7
0.6
0.6
0.5
0.5
0.4
0.4
1–Specificity Test:
Cytology/ /
0.3
0.3
0.2
0.2
0.1
0.1 0.0
Sensitivity
1.0
0.9
0.8
0.7
0.6
0.5
0.4
0.3
0.2
0.1
0.0 0.0
Sensitivity and specificity of studies comparing FISH and cytology
FISH Cytology
Study ID Halling 200097
Junker 200698
May 2007107
Meiers 2007100
Mian 2003101
n 151 121 166 624 57
Sens % 81 60 53 93 96
Spec % 96 81 74 90 45
n 118 109 166 624 181
Sens % 58 24 71 73 45
Spec % 98 91 84 87 94
SROC plot of FISH and cytology
FISH 5
81 (66 to 97) 82 (68 to 97
4.6 (0.9 to 8.3) 0.23 (0.04 to 0.42) 20.1 (<0.1 to 46.0)
Cytology 5
54 (39 to 80) 92 (84 to 99)
6.7 (0.3 to 13.1) 0.50 (0.22 to 0.77) 13.4 (<0.1 to 31.0)
Pooled analysis of FISH and cytology Number of studies Sensitivity % (95% CI) Specificity % (95% CI) Positive likelihood ratio Negative likelihood ratio DOR (95% CI)
BIC difference between this and simpler model: 166.3–163.9 = 2.4
FISH
FIGURE 25 FISH vs cytology – patient-level analysis: sensitivity, specificity, pooled estimates and SROC curve.
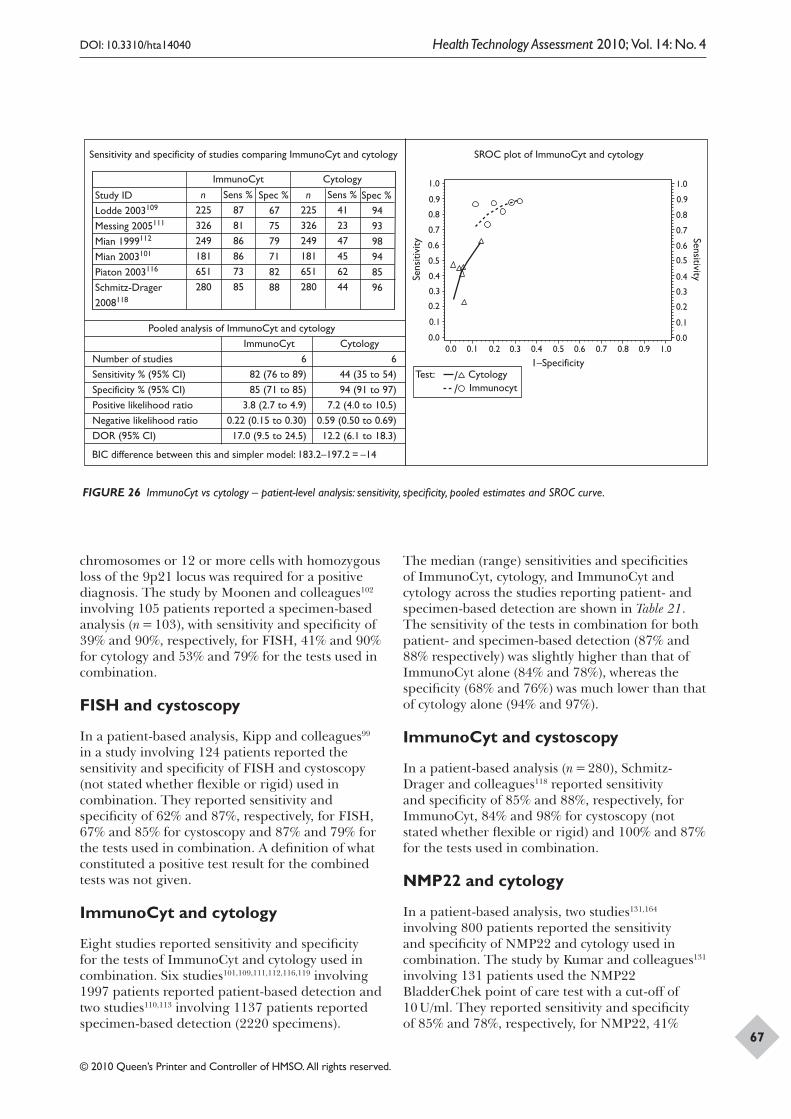
DOI: 10.3310/hta14040 Health Technology Assessment 2010; Vol. 14: No. 4
© 2010 Queen’s Printer and Controller of HMSO. All rights reserved.
67
Sens
itivi
ty
1.0
1.0
0.9
0.9
0.8
0.8
0.7
0.7
0.6
0.6
0.5
0.5
0.4
0.4
1–Specificity Test: Cytology /
/ Immunocyt
0.3
0.3
0.2
0.2
0.1
0.1 0.0
Sensitivity
1.0
0.9
0.8
0.7
0.6
0.5
0.4
0.3
0.2
0.1
0.0 0.0
Sensitivity and specificity of studies comparing ImmunoCyt and cytology SROC plot of ImmunoCyt and cytology
Study ID Lodde 2003109
Messing 2005111
Mian 1999112
Mian 2003101
Piaton 2003116
Schmitz-Drager 2008118
n 225 326 249 181 651 280
Sens % 87 81 86 86 73 85
Spec % 67 75 79 71 82 88
n 225 326 249 181 651 280
Sens % 41 23 47 45 62 44
Spec % 94 93 98 94 85 96
ImmunoCyt 6
82 (76 to 89) 85 (71 to 85)
3.8 (2.7 to 4.9) 0.22 (0.15 to 0.30) 17.0 (9.5 to 24.5)
ImmunoCyt
Cytology 6
44 (35 to 54) 94 (91 to 97)
7.2 (4.0 to 10.5) 0.59 (0.50 to 0.69) 12.2 (6.1 to 18.3)
Cytology
Pooled analysis of ImmunoCyt and cytology Number of studies Sensitivity % (95% CI) Specificity % (95% CI) Positive likelihood ratio Negative likelihood ratio DOR (95% CI)
BIC difference between this and simpler model: 183.2–197.2 = –14
FIGURE 26 ImmunoCyt vs cytology – patient-level analysis: sensitivity, specificity, pooled estimates and SROC curve.
chromosomes or 12 or more cells with homozygous loss of the 9p21 locus was required for a positive diagnosis. The study by Moonen and colleagues102 involving 105 patients reported a specimen-based analysis (n = 103), with sensitivity and specificity of 39% and 90%, respectively, for FISH, 41% and 90% for cytology and 53% and 79% for the tests used in combination.
FISH and cystoscopy
In a patient-based analysis, Kipp and colleagues99 in a study involving 124 patients reported the sensitivity and specificity of FISH and cystoscopy (not stated whether flexible or rigid) used in combination. They reported sensitivity and specificity of 62% and 87%, respectively, for FISH, 67% and 85% for cystoscopy and 87% and 79% for the tests used in combination. A definition of what constituted a positive test result for the combined tests was not given.
ImmunoCyt and cytology
Eight studies reported sensitivity and specificity for the tests of ImmunoCyt and cytology used in combination. Six studies101,109,111,112,116,119 involving 1997 patients reported patient-based detection and two studies110,113 involving 1137 patients reported specimen-based detection (2220 specimens).
The median (range) sensitivities and specificities of ImmunoCyt, cytology, and ImmunoCyt and cytology across the studies reporting patient- and specimen-based detection are shown in Table 21. The sensitivity of the tests in combination for both patient- and specimen-based detection (87% and 88% respectively) was slightly higher than that of ImmunoCyt alone (84% and 78%), whereas the specificity (68% and 76%) was much lower than that of cytology alone (94% and 97%).
ImmunoCyt and cystoscopy
In a patient-based analysis (n = 280), Schmitz-Drager and colleagues118 reported sensitivity and specificity of 85% and 88%, respectively, for ImmunoCyt, 84% and 98% for cystoscopy (not stated whether flexible or rigid) and 100% and 87% for the tests used in combination.
NMP22 and cytology
In a patient-based analysis, two studies131,164 involving 800 patients reported the sensitivity and specificity of NMP22 and cytology used in combination. The study by Kumar and colleagues131 involving 131 patients used the NMP22 BladderChek point of care test with a cut-off of 10 U/ml. They reported sensitivity and specificity of 85% and 78%, respectively, for NMP22, 41%
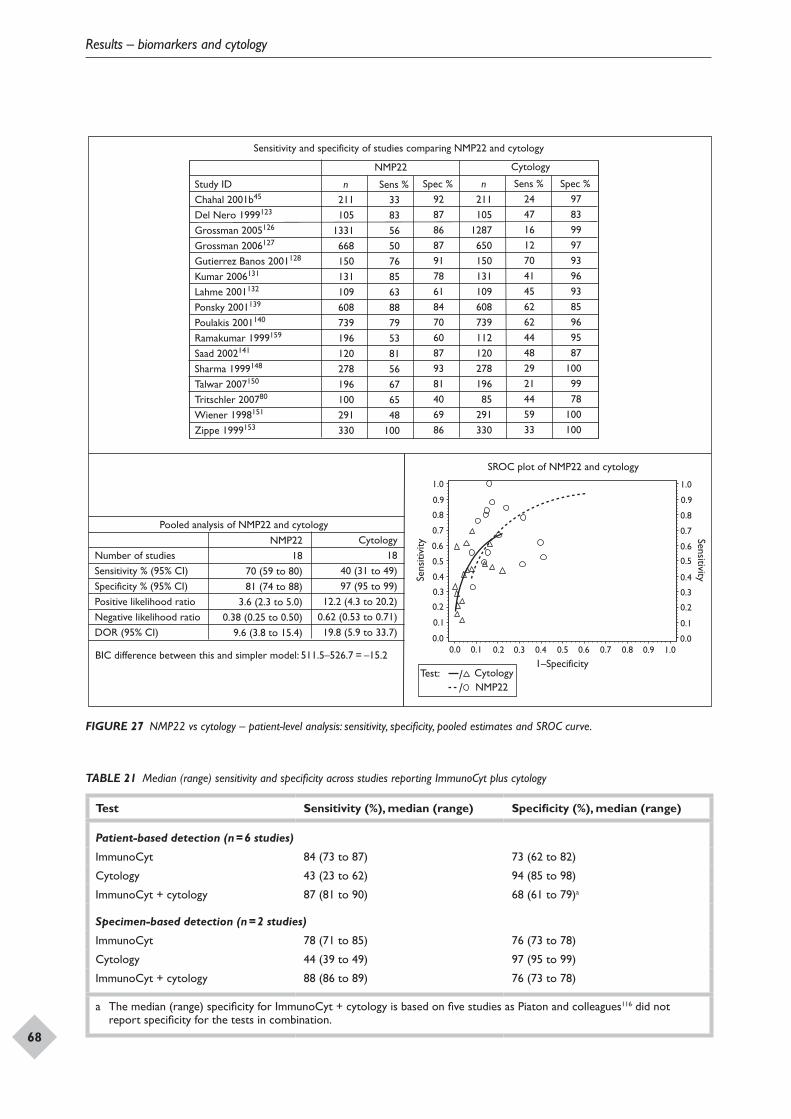
Results – biomarkers and cytology
68
Test: / /
Sens
itivi
ty
1.0
1.0
0.9
0.9
0.8
0.8
0.7
0.7
0.6
0.6
0.5
0.5
0.4
0.4
1–Specificity
0.3
0.3
0.2
0.2
0.1
0.1 0.0
Sensitivity
1.0
0.9
0.8
0.7
0.6
0.5
0.4
0.3
0.2
0.1
0.0 0.0
Sensitivity and specificity of studies comparing NMP22 and cytology
NMP22 Cytology
Study IDChahal 2001b45
Del Nero 1999123
Grossman 2005126
Grossman 2006127
Gutierrez Banos 2001128
Kumar 2006131
Lahme 2001132
Ponsky 2001139
Poulakis 2001140
Ramakumar 1999159
Saad 2002141
Sharma 1999148
Talwar 2007150
Tritschler 200780
Wiener 1998151
Zippe 1999153
n 211 105
1331 668 150 131 109 608 739 196 120 278 196 100 291 330
Sens % 33 83 56 50 76 85 63 88 79 53 81 56 67 65 48
100
Spec % 92 87 86 87 91 78 61 84 70 60 87 93 81 40 69 86
n 211 105
1287 650 150 131 109 608 739 112 120 278 196 85
291 330
Sens % 24 47 16 12 70 41 45 62 62 44 48 29 21 44 59 33
Spec %97 83 99 97 93 96 93 85 96 95 87
100 99 78
100 100
SROC plot of NMP22 and cytology
NMP22
NMP22 18
70 (59 to 80) 81 (74 to 88)
3.6 (2.3 to 5.0) 0.38 (0.25 to 0.50)
9.6 (3.8 to 15.4)
Cytology 18
40 (31 to 49) 97 (95 to 99)
12.2 (4.3 to 20.2) 0.62 (0.53 to 0.71) 19.8 (5.9 to 33.7)
Pooled analysis of NMP22 and cytology Number of studies Sensitivity % (95% CI) Specificity % (95% CI) Positive likelihood ratio Negative likelihood ratio DOR (95% CI)
BIC difference between this and simpler model: 511.5–526.7 = –15.2
Cytology
FIGURE 27 NMP22 vs cytology – patient-level analysis: sensitivity, specificity, pooled estimates and SROC curve.
TABLE 21 Median (range) sensitivity and specificity across studies reporting ImmunoCyt plus cytology
Test Sensitivity (%), median (range) Specificity (%), median (range)
Patient-based detection (n = 6 studies)
ImmunoCyt 84 (73 to 87) 73 (62 to 82)
Cytology 43 (23 to 62) 94 (85 to 98)
ImmunoCyt + cytology 87 (81 to 90) 68 (61 to 79)a
Specimen-based detection (n = 2 studies)
ImmunoCyt 78 (71 to 85) 76 (73 to 78)
Cytology 44 (39 to 49) 97 (95 to 99)
ImmunoCyt + cytology 88 (86 to 89) 76 (73 to 78)
a The median (range) specificity for ImmunoCyt + cytology is based on five studies as Piaton and colleagues116 did not report specificity for the tests in combination.
DOI: 10.3310/hta14040 Health Technology Assessment 2010; Vol. 14: No. 4
© 2010 Queen’s Printer and Controller of HMSO. All rights reserved.
69
and 96% for cytology and 91% sensitivity for the tests used in combination (specificity was not reported).131 The study by Takeuchi and colleagues164 involving 669 patients used a cut-off of 12 U/ml for NMP22. They reported sensitivity and specificity of 58% and 80%, respectively, for NMP22, 44% and 100% for cytology and 60% sensitivity for the tests used in combination (specificity was not reported). In both studies the sensitivity for the tests in combination was slightly higher than that for NMP22 alone, although there was a wide difference in the sensitivity values for NMP22 reported by the two studies.
NMP22 and cystoscopy
In a patient-based analysis (n = 1999), two studies by Grossman and colleagues126,127 reported the sensitivity and specificity of the NMP22 BladderChek point of care test and cystoscopy (not stated whether flexible or rigid) used in combination. Both studies used a cut-off of 10 U/ml to define a positive NMP22 test result. In the first study126 sensitivity was 56% and specificity 86% for NMP22 (1331 patients), whereas in 79 patients diagnosed with bladder cancer the sensitivity of cystoscopy and the tests used in combination was 89% and 94% respectively. In the second study127 sensitivity was 50% and specificity 87% for NMP22 (668 patients), whereas in 103 patients diagnosed with bladder cancer the sensitivity of cystoscopy and the tests used in combination was 91% and 99% respectively.
Cytology and cystoscopy
In a patient-based analysis (n = 280), Schmitz-Drager and colleagues118 reported sensitivity and specificity of 44% and 96%, respectively, for cytology, 84% and 98% for cystoscopy (not stated whether flexible or rigid) and 88% and 95% for the tests used in combination. In 103 patients diagnosed with bladder cancer Grossman and colleagues127 reported sensitivity of 12% for cytology, 91% for cystoscopy and 94% for the tests used in combination.
Summary
A total of 71 studies, published in 83 reports, met the inclusion criteria for studies reporting the test performance of biomarkers (FISH, ImmunoCyt, NMP22) and cytology in detecting bladder cancer. In total, 14 studies enrolling 3321 participants reported on FISH, 10 studies enrolling 4199
participants reported on ImmunoCyt, 41 studies enrolling 13,885 participants reported on NMP22 and 56 studies enrolling 22,260 participants reported on cytology. The vast majority of the studies were diagnostic cross-sectional studies (n = 59, 83%), with the remainder being case–control studies (n = 12, 17%).
Pooled estimates with 95% CIs for sensitivity, specificity, positive and negative likelihood ratios and DORs for each of the tests were undertaken for patient-level analysis. Table 22 shows the pooled estimates for sensitivity, specificity and DOR for each of the tests. Sensitivity was highest for ImmunoCyt at 84% (95% CI 77% to 91%) and lowest for cytology at 44% (95% CI 38% to 51%). ImmunoCyt (84%, 95% CI 77% to 91%) had higher sensitivity than NMP22 (68%, 95% CI 62% to 74%), with the lack of overlap of the CIs supporting evidence of a difference in sensitivity between the tests in favour of ImmunoCyt. FISH (76%, 95% CI 65% to 84%), ImmunoCyt (84%, 95% CI 77% to 91%) and NMP22 (68%, 95% CI 62% to 74%) all had higher sensitivity than cytology (44%, 95% CI 38% to 51%), and again the lack of overlap between the biomarker and cytology CIs supporting evidence of a difference in sensitivity in favour of the biomarkers over cytology.
Although sensitivity was highest for ImmunoCyt and lowest for cytology, this situation was reversed for specificity, which was highest for cytology at 96% (95% CI 94% to 98%) and lowest for ImmunoCyt at 75% (95% CI 68% to 83%). Cytology (96%, 95% CI 94% to 98%) had higher specificity than FISH (85%, 95% CI 78% to 92%), ImmunoCyt (75%, 95% CI 68% to 83%) or NMP22 (79%, 95% CI 74% to 84%), with the lack of overlap between the cytology and biomarker CIs supporting evidence of a difference in specificity in favour of cytology over the biomarkers.
DORs (95% CI) ranged from 8 (5 to 11) to 19 (6 to 26), with higher DORs indicating a better ability of the test to differentiate between those with bladder cancer and those without. Based on the DOR values, FISH and cytology performed similarly well [18 (3 to 32) and 19 (11 to 27) respectively], ImmunoCyt slightly less so [16 (6 to 26)] and NMP22 relatively poorly [8 (5 to 11)]. However, as the DOR CIs for each of the tests all overlapped these results should be interpreted with caution.
Across studies the median (range) PPV was highest for cytology at 80% (27% to 100%) and FISH at 78% (27% to 99%), followed by ImmunoCyt at
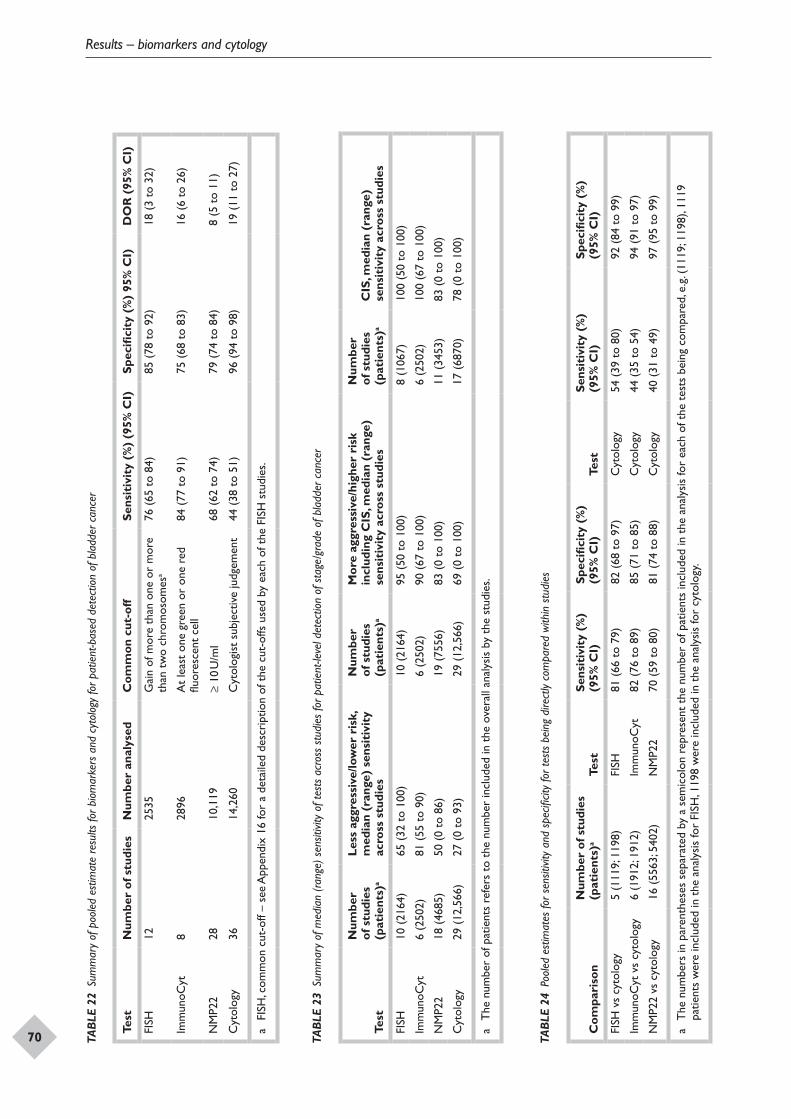
Results – biomarkers and cytology
70 TAB
LE 2
2 Su
mm
ary
of p
oole
d es
timat
e re
sults
for b
iom
arke
rs a
nd c
ytol
ogy
for p
atie
nt-b
ased
det
ectio
n of
bla
dder
can
cer
Test
Num
ber
of s
tudi
esN
umbe
r an
alys
edC
omm
on c
ut-o
ffSe
nsit
ivit
y (%
) (9
5% C
I)Sp
ecifi
city
(%
) 95
% C
I)D
OR
(95
% C
I)
FISH
1225
35G
ain
of m
ore
than
one
or
mor
e th
an t
wo
chro
mos
omes
a76
(65
to
84)
85 (
78 t
o 92
)18
(3
to 3
2)
Imm
unoC
yt8
2896
At
leas
t on
e gr
een
or o
ne r
ed
fluor
esce
nt c
ell
84 (
77 t
o 91
)75
(68
to
83)
16 (
6 to
26)
NM
P22
2810
,119
≥ 10
U/m
l68
(62
to
74)
79 (
74 t
o 84
)8
(5 t
o 11
)
Cyt
olog
y36
14,2
60C
ytol
ogis
t su
bjec
tive
judg
emen
t44
(38
to
51)
96 (
94 t
o 98
)19
(11
to
27)
a FI
SH, c
omm
on c
ut-o
ff –
see
App
endi
x 16
for
a de
taile
d de
scri
ptio
n of
the
cut
-offs
use
d by
eac
h of
the
FIS
H s
tudi
es.
TAB
LE 2
3 Su
mm
ary
of m
edia
n (ra
nge)
sen
sitivi
ty o
f tes
ts a
cros
s st
udie
s fo
r pat
ient
-leve
l det
ectio
n of
sta
ge/g
rade
of b
ladd
er c
ance
r
Test
Num
ber
of s
tudi
es
(pat
ient
s)a
Less
agg
ress
ive/
low
er r
isk,
m
edia
n (r
ange
) se
nsit
ivit
y ac
ross
stu
dies
Num
ber
of s
tudi
es
(pat
ient
s)a
Mor
e ag
gres
sive
/hig
her
risk
in
clud
ing
CIS
, med
ian
(ran
ge)
sens
itiv
ity
acro
ss s
tudi
es
Num
ber
of s
tudi
es
(pat
ient
s)a
CIS
, med
ian
(ran
ge)
sens
itiv
ity
acro
ss s
tudi
es
FISH
10 (
2164
)65
(32
to
100)
10 (
2164
)95
(50
to
100)
8 (1
067)
100
(50
to 1
00)
Imm
unoC
yt6
(250
2)81
(55
to
90)
6 (2
502)
90 (
67 t
o 10
0)6
(250
2)10
0 (6
7 to
100
)
NM
P22
18 (
4685
)50
(0
to 8
6)19
(75
56)
83 (
0 to
100
)11
(34
53)
83 (
0 to
100
)
Cyt
olog
y29
(12
,566
)27
(0
to 9
3)29
(12
,566
)69
(0
to 1
00)
17 (
6870
)78
(0
to 1
00)
a T
he n
umbe
r of
pat
ient
s re
fers
to
the
num
ber
incl
uded
in t
he o
vera
ll an
alys
is b
y th
e st
udie
s.
TAB
LE 2
4 Po
oled
est
imat
es fo
r sen
sitivi
ty a
nd s
pecifi
city
for t
ests
bei
ng d
irect
ly co
mpa
red
with
in s
tudi
es
Com
pari
son
Num
ber
of s
tudi
es
(pat
ient
s)a
Test
Sens
itiv
ity
(%)
(95%
CI)
Spec
ifici
ty (
%)
(95%
CI)
Test
Sens
itiv
ity
(%)
(9
5% C
I)Sp
ecifi
city
(%
)
(95%
CI)
FISH
vs
cyto
logy
5 (1
119;
119
8)FI
SH81
(66
to
79)
82 (
68 t
o 97
)C
ytol
ogy
54 (
39 t
o 80
)92
(84
to
99)
Imm
unoC
yt v
s cy
tolo
gy6
(191
2; 1
912)
Imm
unoC
yt82
(76
to
89)
85 (
71 t
o 85
)C
ytol
ogy
44 (
35 t
o 54
)94
(91
to
97)
NM
P22
vs c
ytol
ogy
16 (
5563
; 540
2)N
MP2
270
(59
to
80)
81 (
74 t
o 88
)C
ytol
ogy
40 (
31 t
o 49
)97
(95
to
99)
a T
he n
umbe
rs in
par
enth
eses
sep
arat
ed b
y a
sem
icol
on r
epre
sent
the
num
ber
of p
atie
nts
incl
uded
in t
he a
naly
sis
for
each
of t
he t
ests
bei
ng c
ompa
red,
e.g
. (11
19; 1
198)
, 111
9 pa
tient
s w
ere
incl
uded
in t
he a
naly
sis
for
FISH
, 119
8 w
ere
incl
uded
in t
he a
naly
sis
for
cyto
logy
.
DOI: 10.3310/hta14040 Health Technology Assessment 2010; Vol. 14: No. 4
© 2010 Queen’s Printer and Controller of HMSO. All rights reserved.
71
54% (26% to 70%) and NMP22 at 52% (13% to 94%). The median (range) NPV was highest for ImmunoCyt at 93% (86% to 100%), followed by FISH at 88% (36% to 97%), NMP22 at 82% (44% to 100%) and cytology at 80% (38% to 100%).
Table 23 summarises the sensitivity of the tests in detecting stage/grade of tumour. ImmunoCyt had the highest median sensitivity across studies (81%) for detection of less aggressive/lower risk tumours whereas FISH had the highest median sensitivity across studies (95%) for detection of more aggressive/higher risk tumours. For detection of CIS the median sensitivity across studies for both FISH and ImmunoCyt was 100%. Cytology had the lowest sensitivity across studies for detecting less aggressive/lower risk tumours (27%), more aggressive/higher risk tumours (69%) and also CIS (78%). The median sensitivity across studies for each test was consistently higher for the detection of more aggressive/higher risk tumours than it was for the detection of less aggressive, lower risk tumours.
Some of the studies included in the pooled estimates for the individual tests also directly compared tests, e.g. FISH versus cytology. Table 24 shows the pooled estimates for sensitivity and specificity for those tests being directly compared in studies and reporting a patient-level analysis. In each set of comparisons cytology had lower
sensitivity but higher specificity than the biomarker with which it was being compared. ImmunoCyt had a statistically significant higher sensitivity (82%, 95% CI 76% to 89%) than that of cytology (44%, 95% CI 35% to 54%), whereas cytology had a statistically significant higher specificity (94%, 95% CI 91% to 97%) than that of ImmunoCyt (85%, 95% CI 71% to 85%). Similarly, NMP22 had a statistically significant higher sensitivity (70%, 95% CI 59% to 80%) than that of cytology (40%, 95% CI 31% to 49%), whereas cytology had a statistically significant higher specificity (97%, 95% CI 95% to 99%) than that of NMP22 (81%, 95% CI 74% to 88%).
In studies reporting the sensitivity and specificity of tests used in combination, sensitivity was generally higher but specificity lower for the combined tests compared with the higher value of the individual tests. Most combinations of tests were reported by only one or two studies, apart from the combination of ImmunoCyt and cytology, which was reported by eight studies.
In studies specifically reporting unevaluable tests, rates were 6.1% (65/1059, five studies) for FISH, 5% (279/5292, 10 studies) for ImmunoCyt and 2% (54/2566, six studies) for cytology. None of the NMP22 studies specifically reported unevaluable tests.

DOI: 10.3310/hta14040 Health Technology Assessment 2010; Vol. 14: No. 4
© 2010 Queen’s Printer and Controller of HMSO. All rights reserved.
73
Using the care pathways described in Chapter 2, an economic model was developed to estimate
the cost-effectiveness of several management strategies for the initial diagnosis and follow-up of bladder cancer. This chapter describes how the data to estimate cost-effectiveness were derived and how these data were used in the economic model. The perspective adopted for the cost-effectiveness analysis was that of the NHS.
Economic model for initial diagnosis and follow-up of bladder cancerModel structure
Based on the care pathway described in Chapter 2, the model structure was developed following consultation with clinicians and taking into consideration the approaches adopted by the existing economic evaluations153,158,175–180 identified from the literature. The approach attempts to model patients passing through the whole sequence of care and determine the overall impact on costs and the clinical consequences. Figure 28 shows a simplified model structure for the primary diagnosis and follow-up management of bladder cancer. Within this model people with suspected bladder cancer will receive tests and investigations to diagnose bladder cancer. Subsequent management will depend upon the findings of these tests and the nature of any bladder cancer detected. The absorbing state in the model is death from either bladder cancer or other causes.
The cost-effectiveness analysis was performed in two parts. The first part considered the diagnostic tests and consisted of a decision tree model element and the second part considered the follow-up of patients after diagnosis using a Markov model.
Decision tree modelThe decision tree, constructed using TreeAge Software, displays the temporal and logical sequence of a clinical decision problem. Although this decision tree does not explicitly specify the time over which diagnosis takes as part of the
model structure, going from initial presentation to final diagnosis may take weeks or even months.
As described in Chapters 1 and 2 there does not appear to be a single standard strategy in the UK. Flexible cystoscopy alone or combined with cytology followed by white light rigid cystoscopy are the main diagnostic tests performed. Cytology or biomarkers followed by WLC or PDD for the initial diagnosis of bladder cancer are less commonly used in the UK, but the use of cytology or biomarkers followed by WLC or PDD may be feasible. The aim of this model is to reflect the costs and consequences of these tests compared with one ‘standard’ strategy, ‘flexible cystoscopy followed by WLC’.
Interventions of diagnosis and follow-upThe interventions included in the model were flexible cystoscopy, cytology, three types of biomarkers (NMP22, FISH, ImmunoCyt), WLC and PDD. Although flexible cystoscopy combined with cytology and a biomarker as the first suite of tests may be an option for the primary diagnosis of bladder cancer, there is little information about the results of these tests used in combination, as reported in Chapters 4 and 5. Table 25 summarises the potential strategies that are considered in the model. These options were based on advice from clinical experts about strategies that are currently in use or those that can potentially be used.
Strategies 1–6 consider the use of a single test for initial diagnosis. These options might represent situations that clinical practice might move towards although they may not be currently used in practice. Strategies 7–16 represent alternative situations in which two or more tests are used in the initial phase of diagnosis. Across all strategies the choice of second level diagnostic test varies between WLC and PDD. The strategies also differ in terms of the tests used for follow-up surveillance. In our study we have assumed that a single test is used for initial surveillance with any positives confirmed by WLC.
It should be noted that none of our strategies explicitly considers the use of ultrasound. Ultrasound might be considered part of all of the
Chapter 6 Assessment of cost-effectiveness
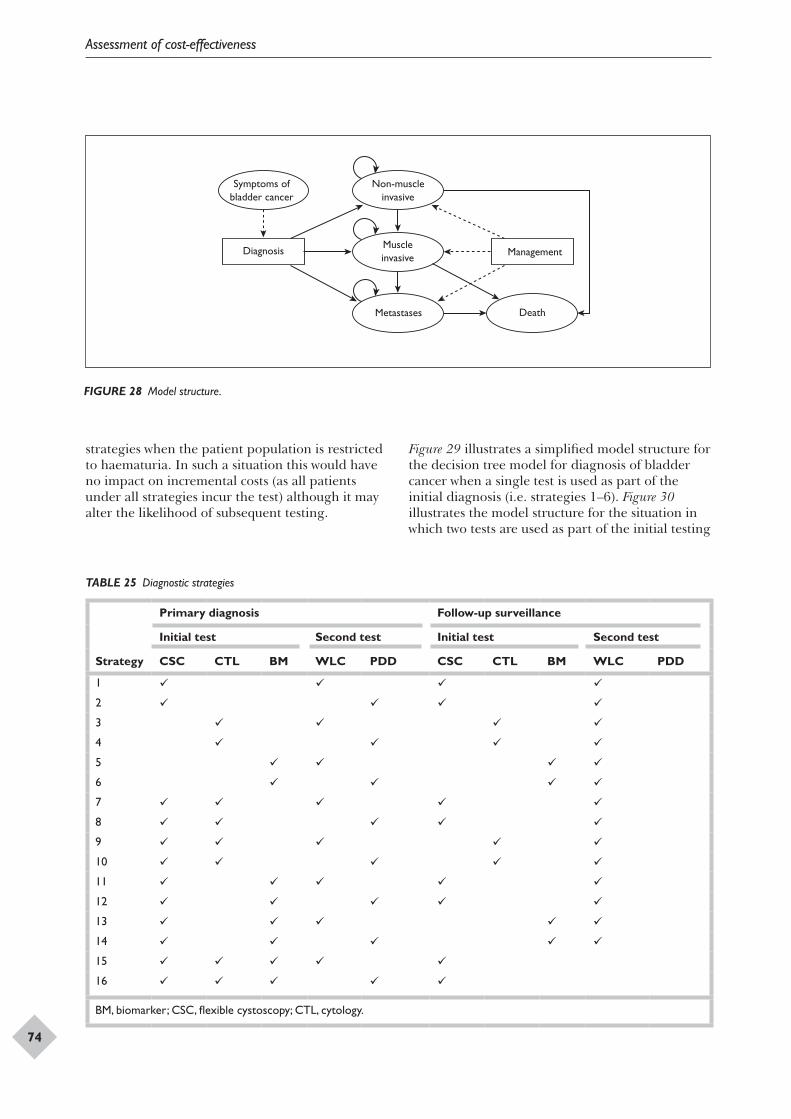
Assessment of cost-effectiveness
74
Symptoms ofbladder cancer
Diagnosis
Non-muscleinvasive
Muscleinvasive
Metastases
Management
Death
FIGURE 28 Model structure.
TABLE 25 Diagnostic strategies
Strategy
Primary diagnosis Follow-up surveillance
Initial test Second test Initial test Second test
CSC CTL BM WLC PDD CSC CTL BM WLC PDD
1
2
3
4
5
6
7
8
9
10
11
12
13
14
15
16
BM, biomarker; CSC, flexible cystoscopy; CTL, cytology.
strategies when the patient population is restricted to haematuria. In such a situation this would have no impact on incremental costs (as all patients under all strategies incur the test) although it may alter the likelihood of subsequent testing.
Figure 29 illustrates a simplified model structure for the decision tree model for diagnosis of bladder cancer when a single test is used as part of the initial diagnosis (i.e. strategies 1–6). Figure 30 illustrates the model structure for the situation in which two tests are used as part of the initial testing
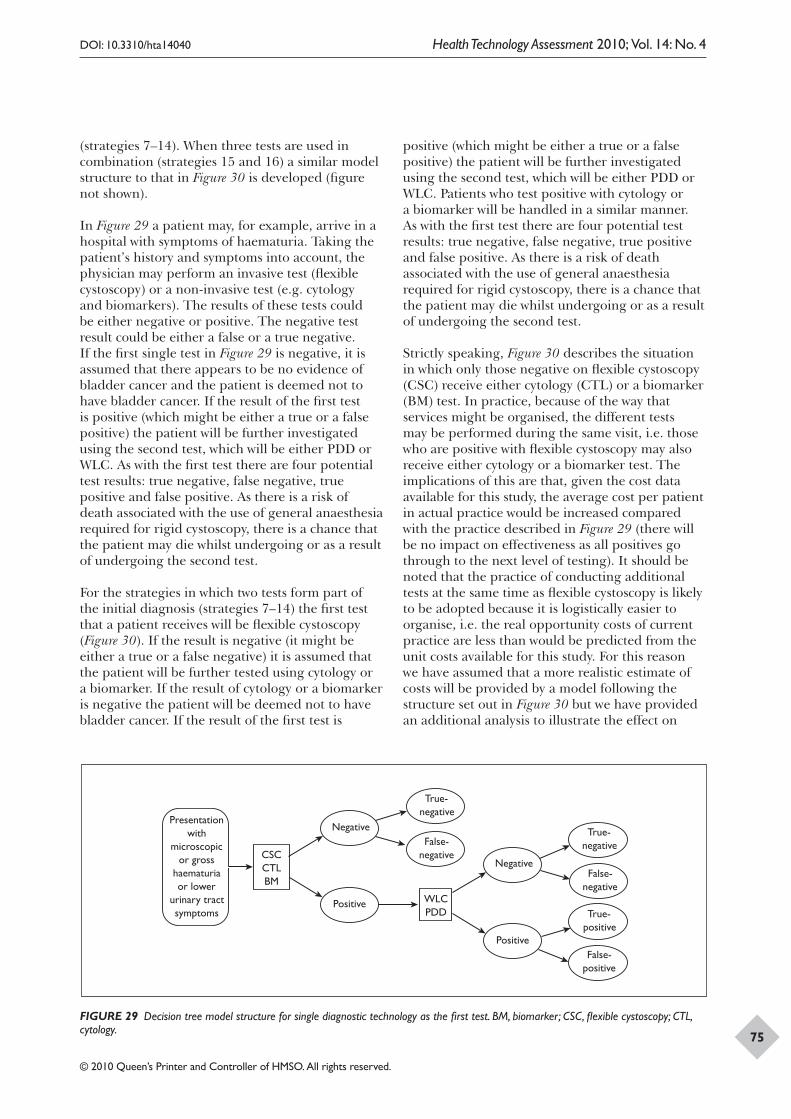
DOI: 10.3310/hta14040 Health Technology Assessment 2010; Vol. 14: No. 4
© 2010 Queen’s Printer and Controller of HMSO. All rights reserved.
75
(strategies 7–14). When three tests are used in combination (strategies 15 and 16) a similar model structure to that in Figure 30 is developed (figure not shown).
In Figure 29 a patient may, for example, arrive in a hospital with symptoms of haematuria. Taking the patient’s history and symptoms into account, the physician may perform an invasive test (flexible cystoscopy) or a non-invasive test (e.g. cytology and biomarkers). The results of these tests could be either negative or positive. The negative test result could be either a false or a true negative. If the first single test in Figure 29 is negative, it is assumed that there appears to be no evidence of bladder cancer and the patient is deemed not to have bladder cancer. If the result of the first test is positive (which might be either a true or a false positive) the patient will be further investigated using the second test, which will be either PDD or WLC. As with the first test there are four potential test results: true negative, false negative, true positive and false positive. As there is a risk of death associated with the use of general anaesthesia required for rigid cystoscopy, there is a chance that the patient may die whilst undergoing or as a result of undergoing the second test.
For the strategies in which two tests form part of the initial diagnosis (strategies 7–14) the first test that a patient receives will be flexible cystoscopy (Figure 30). If the result is negative (it might be either a true or a false negative) it is assumed that the patient will be further tested using cytology or a biomarker. If the result of cytology or a biomarker is negative the patient will be deemed not to have bladder cancer. If the result of the first test is
Presentationwith
microscopicor gross
haematuriaor lower
urinary tractsymptoms
CSCCTLBM
WLCPDD
Negative
True-negative
False-negative
True-negative
False-negative
True-positive
False-positive
Positive
Negative
Positive
FIGURE 29 Decision tree model structure for single diagnostic technology as the first test. BM, biomarker; CSC, flexible cystoscopy; CTL, cytology.
positive (which might be either a true or a false positive) the patient will be further investigated using the second test, which will be either PDD or WLC. Patients who test positive with cytology or a biomarker will be handled in a similar manner. As with the first test there are four potential test results: true negative, false negative, true positive and false positive. As there is a risk of death associated with the use of general anaesthesia required for rigid cystoscopy, there is a chance that the patient may die whilst undergoing or as a result of undergoing the second test.
Strictly speaking, Figure 30 describes the situation in which only those negative on flexible cystoscopy (CSC) receive either cytology (CTL) or a biomarker (BM) test. In practice, because of the way that services might be organised, the different tests may be performed during the same visit, i.e. those who are positive with flexible cystoscopy may also receive either cytology or a biomarker test. The implications of this are that, given the cost data available for this study, the average cost per patient in actual practice would be increased compared with the practice described in Figure 29 (there will be no impact on effectiveness as all positives go through to the next level of testing). It should be noted that the practice of conducting additional tests at the same time as flexible cystoscopy is likely to be adopted because it is logistically easier to organise, i.e. the real opportunity costs of current practice are less than would be predicted from the unit costs available for this study. For this reason we have assumed that a more realistic estimate of costs will be provided by a model following the structure set out in Figure 30 but we have provided an additional analysis to illustrate the effect on
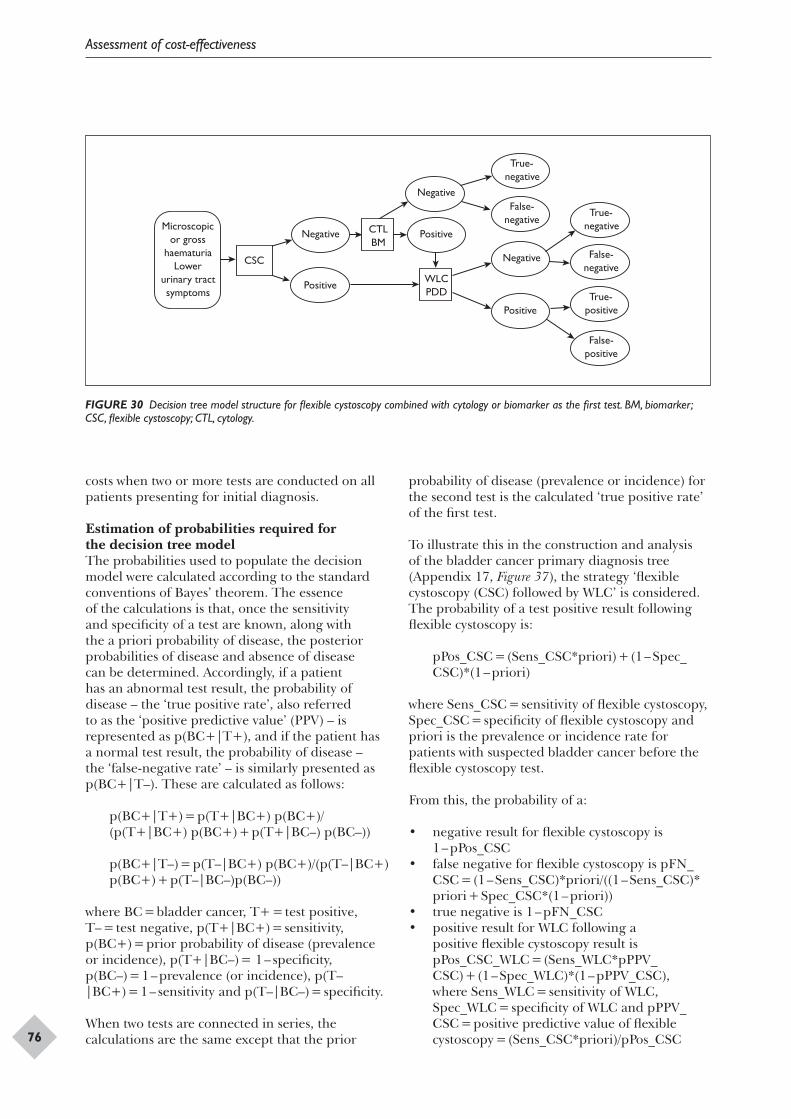
Assessment of cost-effectiveness
76
Microscopicor gross
haematuriaLower
urinary tractsymptoms
CSC
WLCPDD
CTLBM
Negative
True-negative
False-negative
True-negative
False-negative
True-positive
False-positive
Positive
Negative
Negative
Positive
Positive
FIGURE 30 Decision tree model structure for flexible cystoscopy combined with cytology or biomarker as the first test. BM, biomarker; CSC, flexible cystoscopy; CTL, cytology.
costs when two or more tests are conducted on all patients presenting for initial diagnosis.
Estimation of probabilities required for the decision tree modelThe probabilities used to populate the decision model were calculated according to the standard conventions of Bayes’ theorem. The essence of the calculations is that, once the sensitivity and specificity of a test are known, along with the a priori probability of disease, the posterior probabilities of disease and absence of disease can be determined. Accordingly, if a patient has an abnormal test result, the probability of disease – the ‘true positive rate’, also referred to as the ‘positive predictive value’ (PPV) – is represented as p(BC+|T+), and if the patient has a normal test result, the probability of disease – the ‘false-negative rate’ – is similarly presented as p(BC+|T–). These are calculated as follows:
p(BC+|T+) = p(T+|BC+) p(BC+)/(p(T+|BC+) p(BC+) + p(T+|BC–) p(BC–))
p(BC+|T–) = p(T–|BC+) p(BC+)/(p(T–|BC+) p(BC+) + p(T–|BC–)p(BC–))
where BC = bladder cancer, T+ = test positive, T– = test negative, p(T+|BC+) = sensitivity, p(BC+) = prior probability of disease (prevalence or incidence), p(T+|BC–) = 1 – specificity, p(BC–) = 1 – prevalence (or incidence), p(T–|BC+) = 1 – sensitivity and p(T–|BC–) = specificity.
When two tests are connected in series, the calculations are the same except that the prior
probability of disease (prevalence or incidence) for the second test is the calculated ‘true positive rate’ of the first test.
To illustrate this in the construction and analysis of the bladder cancer primary diagnosis tree (Appendix 17, Figure 37), the strategy ‘flexible cystoscopy (CSC) followed by WLC’ is considered. The probability of a test positive result following flexible cystoscopy is:
pPos_CSC = (Sens_CSC*priori) + (1 – Spec_CSC)*(1 – priori)
where Sens_CSC = sensitivity of flexible cystoscopy, Spec_CSC = specificity of flexible cystoscopy and priori is the prevalence or incidence rate for patients with suspected bladder cancer before the flexible cystoscopy test.
From this, the probability of a:
• negative result for flexible cystoscopy is 1 – pPos_CSC
• false negative for flexible cystoscopy is pFN_CSC = (1 – Sens_CSC)*priori/((1 – Sens_CSC)* priori + Spec_CSC*(1 – priori))
• true negative is 1 – pFN_CSC• positive result for WLC following a
positive flexible cystoscopy result is pPos_CSC_WLC = (Sens_WLC*pPPV_CSC) + (1 – Spec_WLC)*(1 – pPPV_CSC), where Sens_WLC = sensitivity of WLC, Spec_WLC = specificity of WLC and pPPV_CSC = positive predictive value of flexible cystoscopy = (Sens_CSC*priori)/pPos_CSC
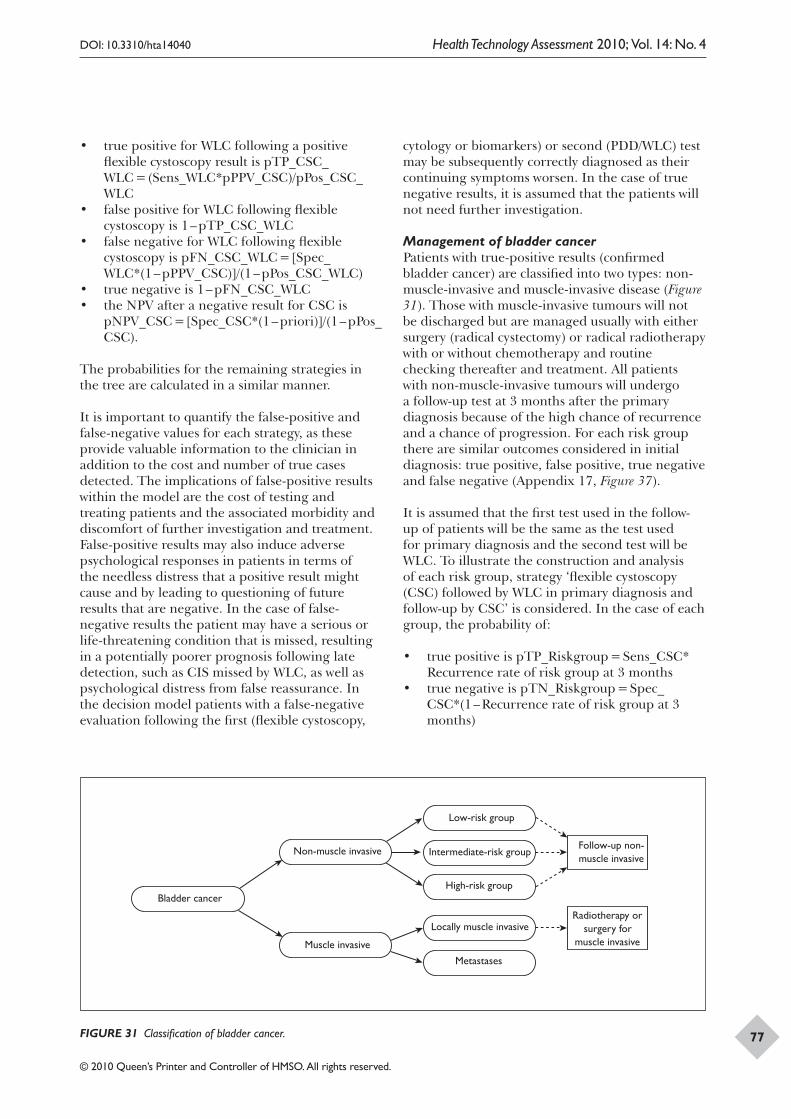
DOI: 10.3310/hta14040 Health Technology Assessment 2010; Vol. 14: No. 4
© 2010 Queen’s Printer and Controller of HMSO. All rights reserved.
77
Bladder cancer
Non-muscle invasive
Locally muscle invasive
Metastases
Muscle invasive
Low-risk group
High-risk group
Follow-up non-muscle invasive
Intermediate-risk group
Radiotherapy orsurgery for
muscle invasive
FIGURE 31 Classification of bladder cancer.
• true positive for WLC following a positive flexible cystoscopy result is pTP_CSC_WLC = (Sens_WLC*pPPV_CSC)/pPos_CSC_WLC
• false positive for WLC following flexible cystoscopy is 1 – pTP_CSC_WLC
• false negative for WLC following flexible cystoscopy is pFN_CSC_WLC = [Spec_WLC*(1 – pPPV_CSC)]/(1 – pPos_CSC_WLC)
• true negative is 1 – pFN_CSC_WLC• the NPV after a negative result for CSC is
pNPV_CSC = [Spec_CSC*(1 – priori)]/(1 – pPos_CSC).
The probabilities for the remaining strategies in the tree are calculated in a similar manner.
It is important to quantify the false-positive and false-negative values for each strategy, as these provide valuable information to the clinician in addition to the cost and number of true cases detected. The implications of false-positive results within the model are the cost of testing and treating patients and the associated morbidity and discomfort of further investigation and treatment. False-positive results may also induce adverse psychological responses in patients in terms of the needless distress that a positive result might cause and by leading to questioning of future results that are negative. In the case of false-negative results the patient may have a serious or life-threatening condition that is missed, resulting in a potentially poorer prognosis following late detection, such as CIS missed by WLC, as well as psychological distress from false reassurance. In the decision model patients with a false-negative evaluation following the first (flexible cystoscopy,
cytology or biomarkers) or second (PDD/WLC) test may be subsequently correctly diagnosed as their continuing symptoms worsen. In the case of true negative results, it is assumed that the patients will not need further investigation.
Management of bladder cancerPatients with true-positive results (confirmed bladder cancer) are classified into two types: non-muscle-invasive and muscle-invasive disease (Figure 31). Those with muscle-invasive tumours will not be discharged but are managed usually with either surgery (radical cystectomy) or radical radiotherapy with or without chemotherapy and routine checking thereafter and treatment. All patients with non-muscle-invasive tumours will undergo a follow-up test at 3 months after the primary diagnosis because of the high chance of recurrence and a chance of progression. For each risk group there are similar outcomes considered in initial diagnosis: true positive, false positive, true negative and false negative (Appendix 17, Figure 37).
It is assumed that the first test used in the follow-up of patients will be the same as the test used for primary diagnosis and the second test will be WLC. To illustrate the construction and analysis of each risk group, strategy ‘flexible cystoscopy (CSC) followed by WLC in primary diagnosis and follow-up by CSC’ is considered. In the case of each group, the probability of:
• true positive is pTP_Riskgroup = Sens_CSC* Recurrence rate of risk group at 3 months
• true negative is pTN_Riskgroup = Spec_CSC*(1 – Recurrence rate of risk group at 3 months)
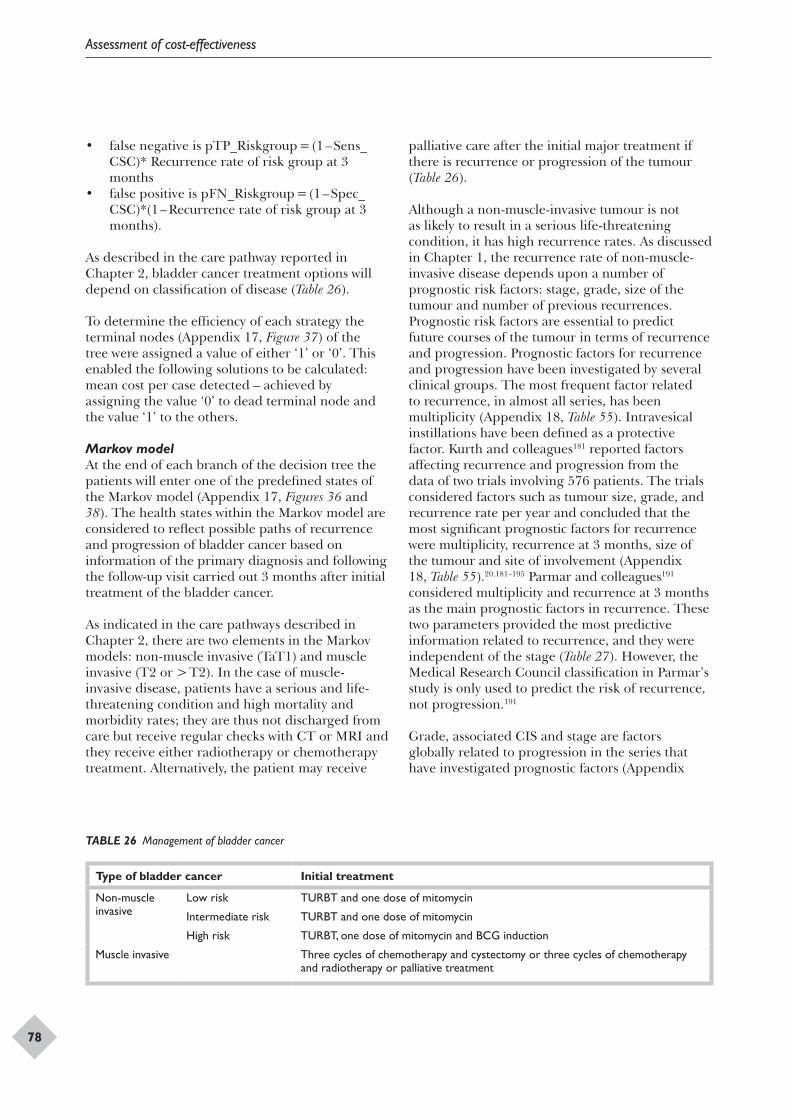
Assessment of cost-effectiveness
78
• false negative is pTP_Riskgroup = (1 – Sens_CSC)* Recurrence rate of risk group at 3 months
• false positive is pFN_Riskgroup = (1 – Spec_CSC)*(1 – Recurrence rate of risk group at 3 months).
As described in the care pathway reported in Chapter 2, bladder cancer treatment options will depend on classification of disease (Table 26).
To determine the efficiency of each strategy the terminal nodes (Appendix 17, Figure 37) of the tree were assigned a value of either ‘1’ or ‘0’. This enabled the following solutions to be calculated: mean cost per case detected – achieved by assigning the value ‘0’ to dead terminal node and the value ‘1’ to the others.
Markov modelAt the end of each branch of the decision tree the patients will enter one of the predefined states of the Markov model (Appendix 17, Figures 36 and 38). The health states within the Markov model are considered to reflect possible paths of recurrence and progression of bladder cancer based on information of the primary diagnosis and following the follow-up visit carried out 3 months after initial treatment of the bladder cancer.
As indicated in the care pathways described in Chapter 2, there are two elements in the Markov models: non-muscle invasive (TaT1) and muscle invasive (T2 or > T2). In the case of muscle-invasive disease, patients have a serious and life-threatening condition and high mortality and morbidity rates; they are thus not discharged from care but receive regular checks with CT or MRI and they receive either radiotherapy or chemotherapy treatment. Alternatively, the patient may receive
palliative care after the initial major treatment if there is recurrence or progression of the tumour (Table 26).
Although a non-muscle-invasive tumour is not as likely to result in a serious life-threatening condition, it has high recurrence rates. As discussed in Chapter 1, the recurrence rate of non-muscle-invasive disease depends upon a number of prognostic risk factors: stage, grade, size of the tumour and number of previous recurrences. Prognostic risk factors are essential to predict future courses of the tumour in terms of recurrence and progression. Prognostic factors for recurrence and progression have been investigated by several clinical groups. The most frequent factor related to recurrence, in almost all series, has been multiplicity (Appendix 18, Table 55). Intravesical instillations have been defined as a protective factor. Kurth and colleagues181 reported factors affecting recurrence and progression from the data of two trials involving 576 patients. The trials considered factors such as tumour size, grade, and recurrence rate per year and concluded that the most significant prognostic factors for recurrence were multiplicity, recurrence at 3 months, size of the tumour and site of involvement (Appendix 18, Table 55).20,181–195 Parmar and colleagues191 considered multiplicity and recurrence at 3 months as the main prognostic factors in recurrence. These two parameters provided the most predictive information related to recurrence, and they were independent of the stage (Table 27). However, the Medical Research Council classification in Parmar’s study is only used to predict the risk of recurrence, not progression.191
Grade, associated CIS and stage are factors globally related to progression in the series that have investigated prognostic factors (Appendix
TABLE 26 Management of bladder cancer
Type of bladder cancer Initial treatment
Non-muscle invasive
Low risk TURBT and one dose of mitomycin
Intermediate risk TURBT and one dose of mitomycin
High risk TURBT, one dose of mitomycin and BCG induction
Muscle invasive Three cycles of chemotherapy and cystectomy or three cycles of chemotherapy and radiotherapy or palliative treatment
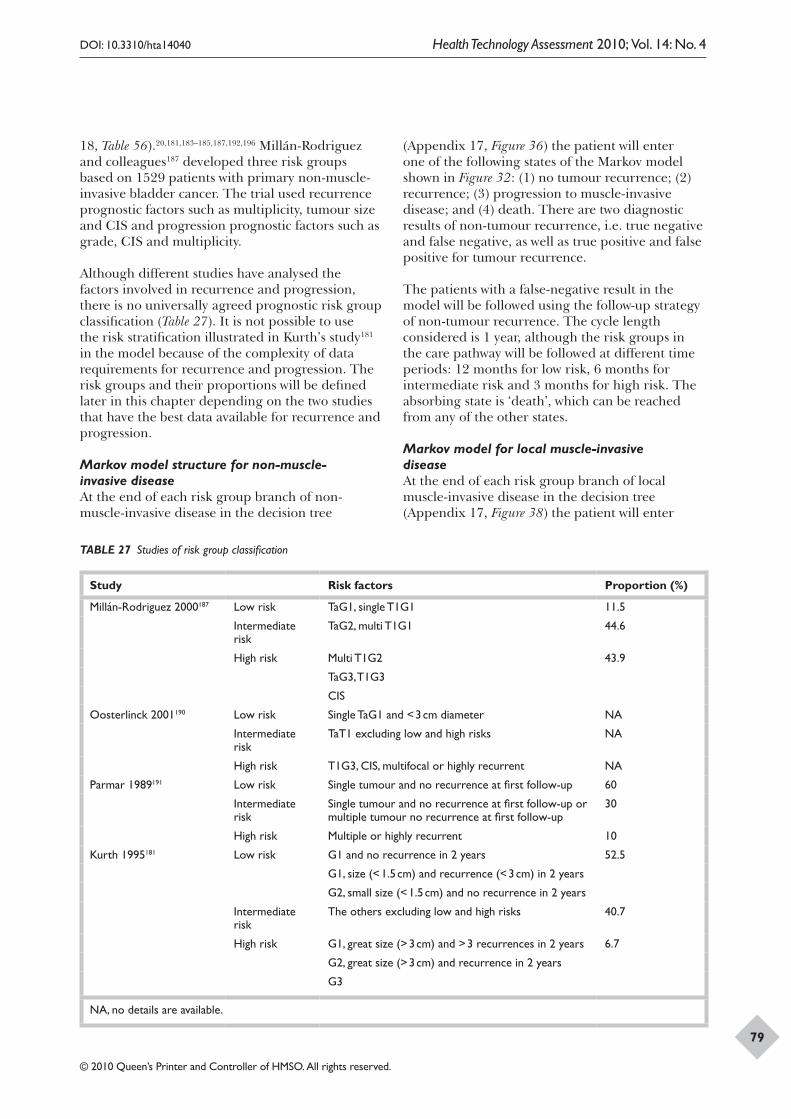
DOI: 10.3310/hta14040 Health Technology Assessment 2010; Vol. 14: No. 4
© 2010 Queen’s Printer and Controller of HMSO. All rights reserved.
79
18, Table 56).20,181,183–185,187,192,196 Millán-Rodriguez and colleagues187 developed three risk groups based on 1529 patients with primary non-muscle-invasive bladder cancer. The trial used recurrence prognostic factors such as multiplicity, tumour size and CIS and progression prognostic factors such as grade, CIS and multiplicity.
Although different studies have analysed the factors involved in recurrence and progression, there is no universally agreed prognostic risk group classification (Table 27). It is not possible to use the risk stratification illustrated in Kurth’s study181 in the model because of the complexity of data requirements for recurrence and progression. The risk groups and their proportions will be defined later in this chapter depending on the two studies that have the best data available for recurrence and progression.
Markov model structure for non-muscle-invasive diseaseAt the end of each risk group branch of non-muscle-invasive disease in the decision tree
(Appendix 17, Figure 36) the patient will enter one of the following states of the Markov model shown in Figure 32: (1) no tumour recurrence; (2) recurrence; (3) progression to muscle-invasive disease; and (4) death. There are two diagnostic results of non-tumour recurrence, i.e. true negative and false negative, as well as true positive and false positive for tumour recurrence.
The patients with a false-negative result in the model will be followed using the follow-up strategy of non-tumour recurrence. The cycle length considered is 1 year, although the risk groups in the care pathway will be followed at different time periods: 12 months for low risk, 6 months for intermediate risk and 3 months for high risk. The absorbing state is ‘death’, which can be reached from any of the other states.
Markov model for local muscle-invasive diseaseAt the end of each risk group branch of local muscle-invasive disease in the decision tree (Appendix 17, Figure 38) the patient will enter
TABLE 27 Studies of risk group classification
Study Risk factors Proportion (%)
Millán-Rodriguez 2000187 Low risk TaG1, single T1G1 11.5
Intermediate risk
TaG2, multi T1G1 44.6
High risk Multi T1G2 43.9
TaG3, T1G3
CIS
Oosterlinck 2001190 Low risk Single TaG1 and < 3 cm diameter NA
Intermediate risk
TaT1 excluding low and high risks NA
High risk T1G3, CIS, multifocal or highly recurrent NA
Parmar 1989191 Low risk Single tumour and no recurrence at first follow-up 60
Intermediate risk
Single tumour and no recurrence at first follow-up or multiple tumour no recurrence at first follow-up
30
High risk Multiple or highly recurrent 10
Kurth 1995181 Low risk G1 and no recurrence in 2 years 52.5
G1, size (< 1.5 cm) and recurrence (< 3 cm) in 2 years
G2, small size (< 1.5 cm) and no recurrence in 2 years
Intermediate risk
The others excluding low and high risks 40.7
High risk G1, great size (> 3 cm) and > 3 recurrences in 2 years 6.7
G2, great size (> 3 cm) and recurrence in 2 years
G3
NA, no details are available.
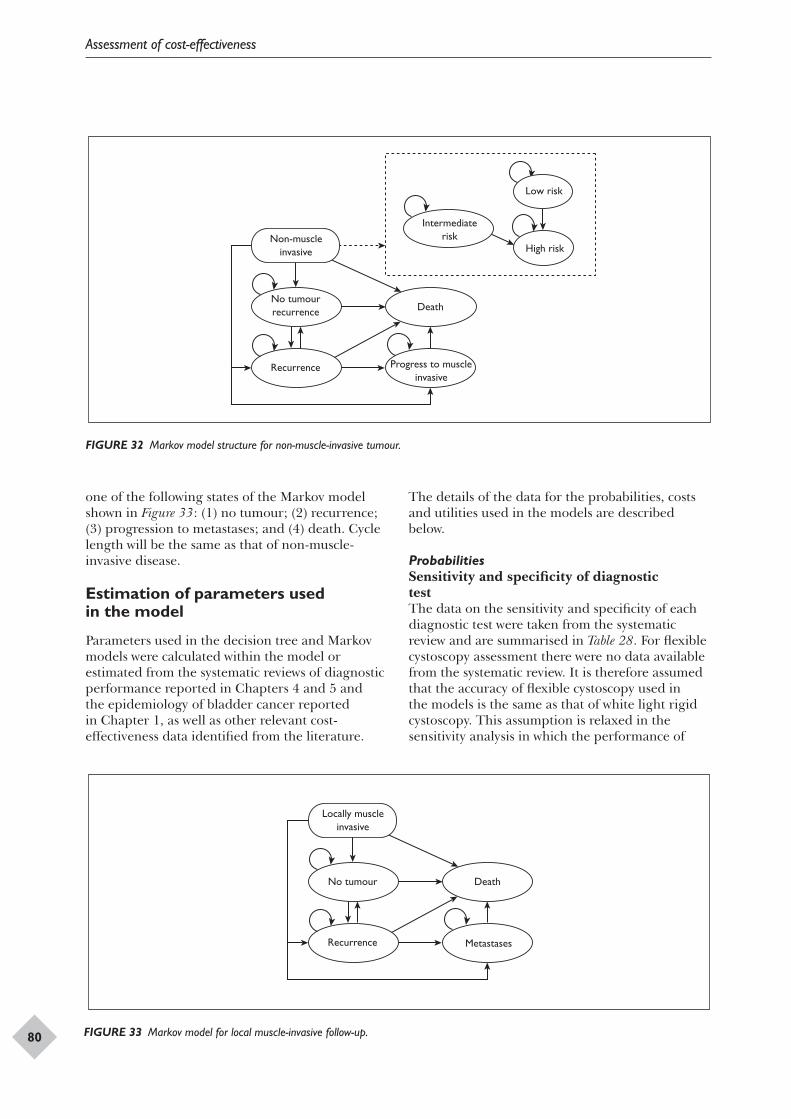
Assessment of cost-effectiveness
80
No tumourrecurrence
Recurrence
Non-muscle invasive
Low risk
High risk
Death
Intermediate risk
Progress to muscle invasive
FIGURE 32 Markov model structure for non-muscle-invasive tumour.
No tumour
Recurrence
Locally muscle invasive
Death
Metastases
FIGURE 33 Markov model for local muscle-invasive follow-up.
one of the following states of the Markov model shown in Figure 33: (1) no tumour; (2) recurrence; (3) progression to metastases; and (4) death. Cycle length will be the same as that of non-muscle-invasive disease.
Estimation of parameters used in the model
Parameters used in the decision tree and Markov models were calculated within the model or estimated from the systematic reviews of diagnostic performance reported in Chapters 4 and 5 and the epidemiology of bladder cancer reported in Chapter 1, as well as other relevant cost-effectiveness data identified from the literature.
The details of the data for the probabilities, costs and utilities used in the models are described below.
ProbabilitiesSensitivity and specificity of diagnostic testThe data on the sensitivity and specificity of each diagnostic test were taken from the systematic review and are summarised in Table 28. For flexible cystoscopy assessment there were no data available from the systematic review. It is therefore assumed that the accuracy of flexible cystoscopy used in the models is the same as that of white light rigid cystoscopy. This assumption is relaxed in the sensitivity analysis in which the performance of
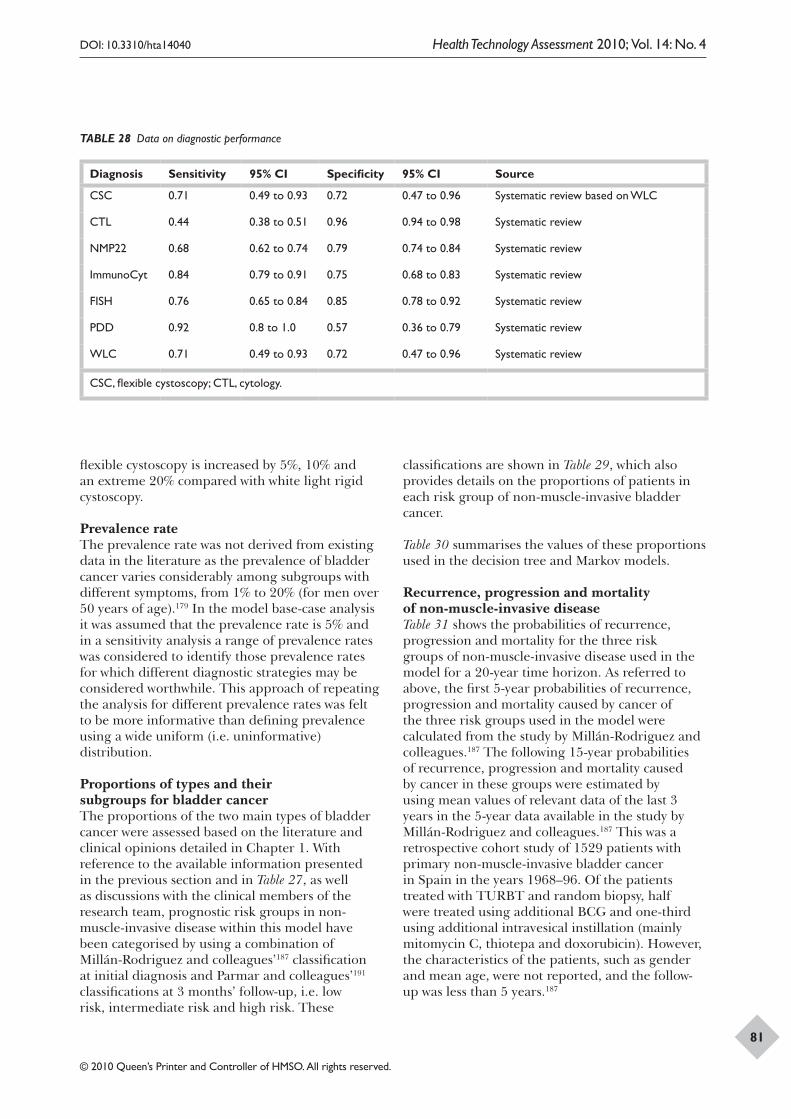
DOI: 10.3310/hta14040 Health Technology Assessment 2010; Vol. 14: No. 4
© 2010 Queen’s Printer and Controller of HMSO. All rights reserved.
81
TABLE 28 Data on diagnostic performance
Diagnosis Sensitivity 95% CI Specificity 95% CI Source
CSC 0.71 0.49 to 0.93 0.72 0.47 to 0.96 Systematic review based on WLC
CTL 0.44 0.38 to 0.51 0.96 0.94 to 0.98 Systematic review
NMP22 0.68 0.62 to 0.74 0.79 0.74 to 0.84 Systematic review
ImmunoCyt 0.84 0.79 to 0.91 0.75 0.68 to 0.83 Systematic review
FISH 0.76 0.65 to 0.84 0.85 0.78 to 0.92 Systematic review
PDD 0.92 0.8 to 1.0 0.57 0.36 to 0.79 Systematic review
WLC 0.71 0.49 to 0.93 0.72 0.47 to 0.96 Systematic review
CSC, flexible cystoscopy; CTL, cytology.
flexible cystoscopy is increased by 5%, 10% and an extreme 20% compared with white light rigid cystoscopy.
Prevalence rateThe prevalence rate was not derived from existing data in the literature as the prevalence of bladder cancer varies considerably among subgroups with different symptoms, from 1% to 20% (for men over 50 years of age).179 In the model base-case analysis it was assumed that the prevalence rate is 5% and in a sensitivity analysis a range of prevalence rates was considered to identify those prevalence rates for which different diagnostic strategies may be considered worthwhile. This approach of repeating the analysis for different prevalence rates was felt to be more informative than defining prevalence using a wide uniform (i.e. uninformative) distribution.
Proportions of types and their subgroups for bladder cancerThe proportions of the two main types of bladder cancer were assessed based on the literature and clinical opinions detailed in Chapter 1. With reference to the available information presented in the previous section and in Table 27, as well as discussions with the clinical members of the research team, prognostic risk groups in non-muscle-invasive disease within this model have been categorised by using a combination of Millán-Rodriguez and colleagues’187 classification at initial diagnosis and Parmar and colleagues’191 classifications at 3 months’ follow-up, i.e. low risk, intermediate risk and high risk. These
classifications are shown in Table 29, which also provides details on the proportions of patients in each risk group of non-muscle-invasive bladder cancer.
Table 30 summarises the values of these proportions used in the decision tree and Markov models.
Recurrence, progression and mortality of non-muscle-invasive diseaseTable 31 shows the probabilities of recurrence, progression and mortality for the three risk groups of non-muscle-invasive disease used in the model for a 20-year time horizon. As referred to above, the first 5-year probabilities of recurrence, progression and mortality caused by cancer of the three risk groups used in the model were calculated from the study by Millán-Rodriguez and colleagues.187 The following 15-year probabilities of recurrence, progression and mortality caused by cancer in these groups were estimated by using mean values of relevant data of the last 3 years in the 5-year data available in the study by Millán-Rodriguez and colleagues.187 This was a retrospective cohort study of 1529 patients with primary non-muscle-invasive bladder cancer in Spain in the years 1968–96. Of the patients treated with TURBT and random biopsy, half were treated using additional BCG and one-third using additional intravesical instillation (mainly mitomycin C, thiotepa and doxorubicin). However, the characteristics of the patients, such as gender and mean age, were not reported, and the follow-up was less than 5 years.187
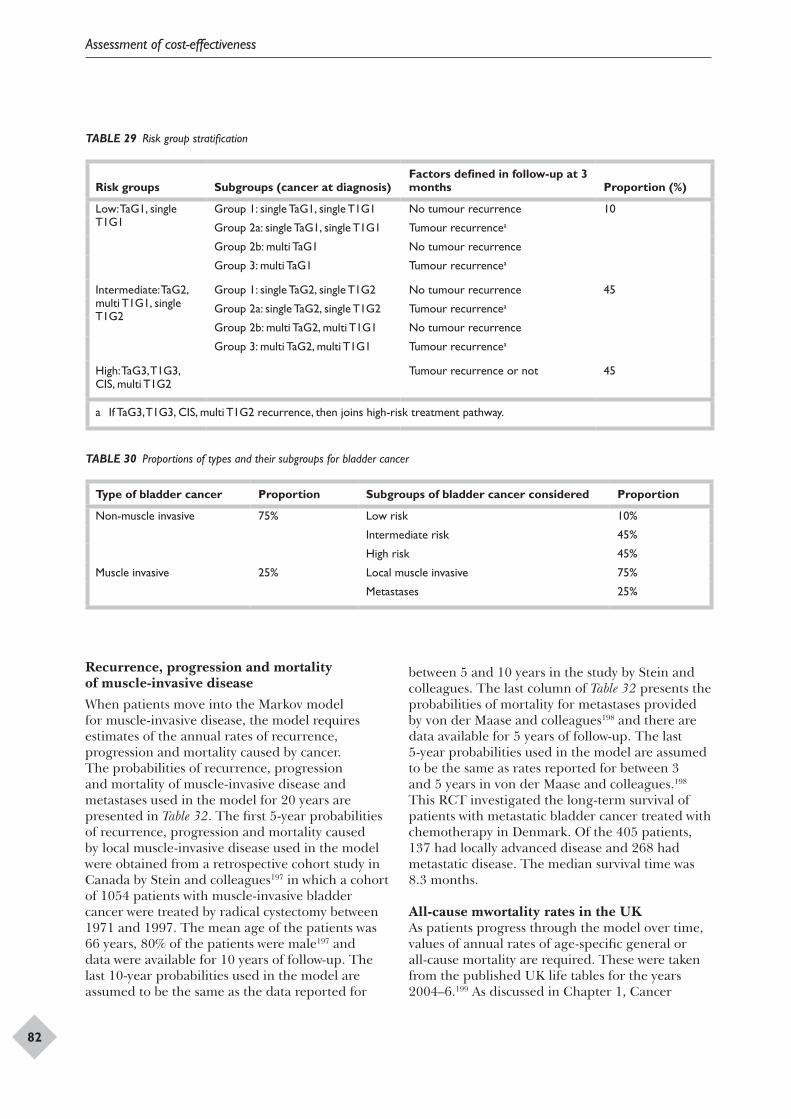
Assessment of cost-effectiveness
82
TABLE 29 Risk group stratification
Risk groups Subgroups (cancer at diagnosis)Factors defined in follow-up at 3 months Proportion (%)
Low: TaG1, single T1G1
Group 1: single TaG1, single T1G1 No tumour recurrence 10
Group 2a: single TaG1, single T1G1 Tumour recurrencea
Group 2b: multi TaG1 No tumour recurrence
Group 3: multi TaG1 Tumour recurrencea
Intermediate: TaG2, multi T1G1, single T1G2
Group 1: single TaG2, single T1G2 No tumour recurrence 45
Group 2a: single TaG2, single T1G2 Tumour recurrencea
Group 2b: multi TaG2, multi T1G1 No tumour recurrence
Group 3: multi TaG2, multi T1G1 Tumour recurrencea
High: TaG3, T1G3, CIS, multi T1G2
Tumour recurrence or not 45
a If TaG3, T1G3, CIS, multi T1G2 recurrence, then joins high-risk treatment pathway.
TABLE 30 Proportions of types and their subgroups for bladder cancer
Type of bladder cancer Proportion Subgroups of bladder cancer considered Proportion
Non-muscle invasive 75% Low risk 10%
Intermediate risk 45%
High risk 45%
Muscle invasive 25% Local muscle invasive 75%
Metastases 25%
Recurrence, progression and mortality of muscle-invasive diseaseWhen patients move into the Markov model for muscle-invasive disease, the model requires estimates of the annual rates of recurrence, progression and mortality caused by cancer. The probabilities of recurrence, progression and mortality of muscle-invasive disease and metastases used in the model for 20 years are presented in Table 32. The first 5-year probabilities of recurrence, progression and mortality caused by local muscle-invasive disease used in the model were obtained from a retrospective cohort study in Canada by Stein and colleagues197 in which a cohort of 1054 patients with muscle-invasive bladder cancer were treated by radical cystectomy between 1971 and 1997. The mean age of the patients was 66 years, 80% of the patients were male197 and data were available for 10 years of follow-up. The last 10-year probabilities used in the model are assumed to be the same as the data reported for
between 5 and 10 years in the study by Stein and colleagues. The last column of Table 32 presents the probabilities of mortality for metastases provided by von der Maase and colleagues198 and there are data available for 5 years of follow-up. The last 5-year probabilities used in the model are assumed to be the same as rates reported for between 3 and 5 years in von der Maase and colleagues.198 This RCT investigated the long-term survival of patients with metastatic bladder cancer treated with chemotherapy in Denmark. Of the 405 patients, 137 had locally advanced disease and 268 had metastatic disease. The median survival time was 8.3 months.
All-cause mwortality rates in the UKAs patients progress through the model over time, values of annual rates of age-specific general or all-cause mortality are required. These were taken from the published UK life tables for the years 2004–6.199 As discussed in Chapter 1, Cancer
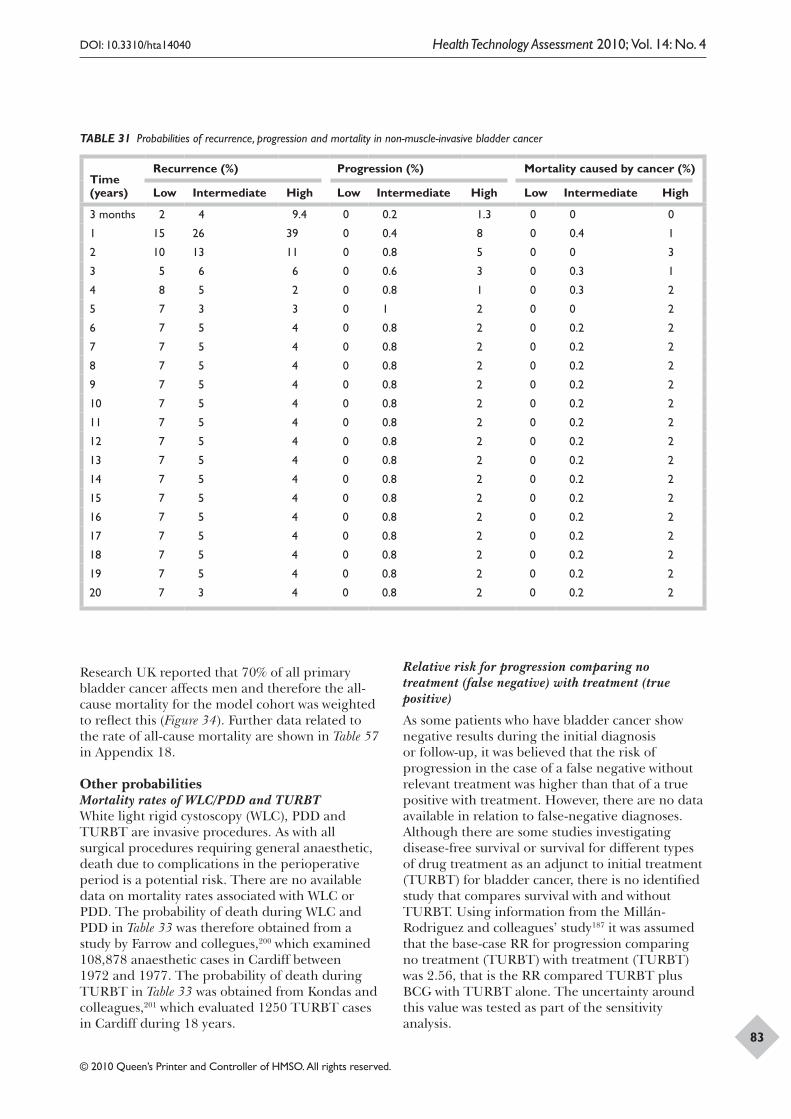
DOI: 10.3310/hta14040 Health Technology Assessment 2010; Vol. 14: No. 4
© 2010 Queen’s Printer and Controller of HMSO. All rights reserved.
83
TABLE 31 Probabilities of recurrence, progression and mortality in non-muscle-invasive bladder cancer
Time (years)
Recurrence (%) Progression (%) Mortality caused by cancer (%)
Low Intermediate High Low Intermediate High Low Intermediate High
3 months 2 4 9.4 0 0.2 1.3 0 0 0
1 15 26 39 0 0.4 8 0 0.4 1
2 10 13 11 0 0.8 5 0 0 3
3 5 6 6 0 0.6 3 0 0.3 1
4 8 5 2 0 0.8 1 0 0.3 2
5 7 3 3 0 1 2 0 0 2
6 7 5 4 0 0.8 2 0 0.2 2
7 7 5 4 0 0.8 2 0 0.2 2
8 7 5 4 0 0.8 2 0 0.2 2
9 7 5 4 0 0.8 2 0 0.2 2
10 7 5 4 0 0.8 2 0 0.2 2
11 7 5 4 0 0.8 2 0 0.2 2
12 7 5 4 0 0.8 2 0 0.2 2
13 7 5 4 0 0.8 2 0 0.2 2
14 7 5 4 0 0.8 2 0 0.2 2
15 7 5 4 0 0.8 2 0 0.2 2
16 7 5 4 0 0.8 2 0 0.2 2
17 7 5 4 0 0.8 2 0 0.2 2
18 7 5 4 0 0.8 2 0 0.2 2
19 7 5 4 0 0.8 2 0 0.2 2
20 7 3 4 0 0.8 2 0 0.2 2
Research UK reported that 70% of all primary bladder cancer affects men and therefore the all-cause mortality for the model cohort was weighted to reflect this (Figure 34). Further data related to the rate of all-cause mortality are shown in Table 57 in Appendix 18.
Other probabilitiesMortality rates of WLC/PDD and TURBTWhite light rigid cystoscopy (WLC), PDD and TURBT are invasive procedures. As with all surgical procedures requiring general anaesthetic, death due to complications in the perioperative period is a potential risk. There are no available data on mortality rates associated with WLC or PDD. The probability of death during WLC and PDD in Table 33 was therefore obtained from a study by Farrow and collegues,200 which examined 108,878 anaesthetic cases in Cardiff between 1972 and 1977. The probability of death during TURBT in Table 33 was obtained from Kondas and colleagues,201 which evaluated 1250 TURBT cases in Cardiff during 18 years.
Relative risk for progression comparing no treatment (false negative) with treatment (true positive)
As some patients who have bladder cancer show negative results during the initial diagnosis or follow-up, it was believed that the risk of progression in the case of a false negative without relevant treatment was higher than that of a true positive with treatment. However, there are no data available in relation to false-negative diagnoses. Although there are some studies investigating disease-free survival or survival for different types of drug treatment as an adjunct to initial treatment (TURBT) for bladder cancer, there is no identified study that compares survival with and without TURBT. Using information from the Millán-Rodriguez and colleagues’ study187 it was assumed that the base-case RR for progression comparing no treatment (TURBT) with treatment (TURBT) was 2.56, that is the RR compared TURBT plus BCG with TURBT alone. The uncertainty around this value was tested as part of the sensitivity analysis.
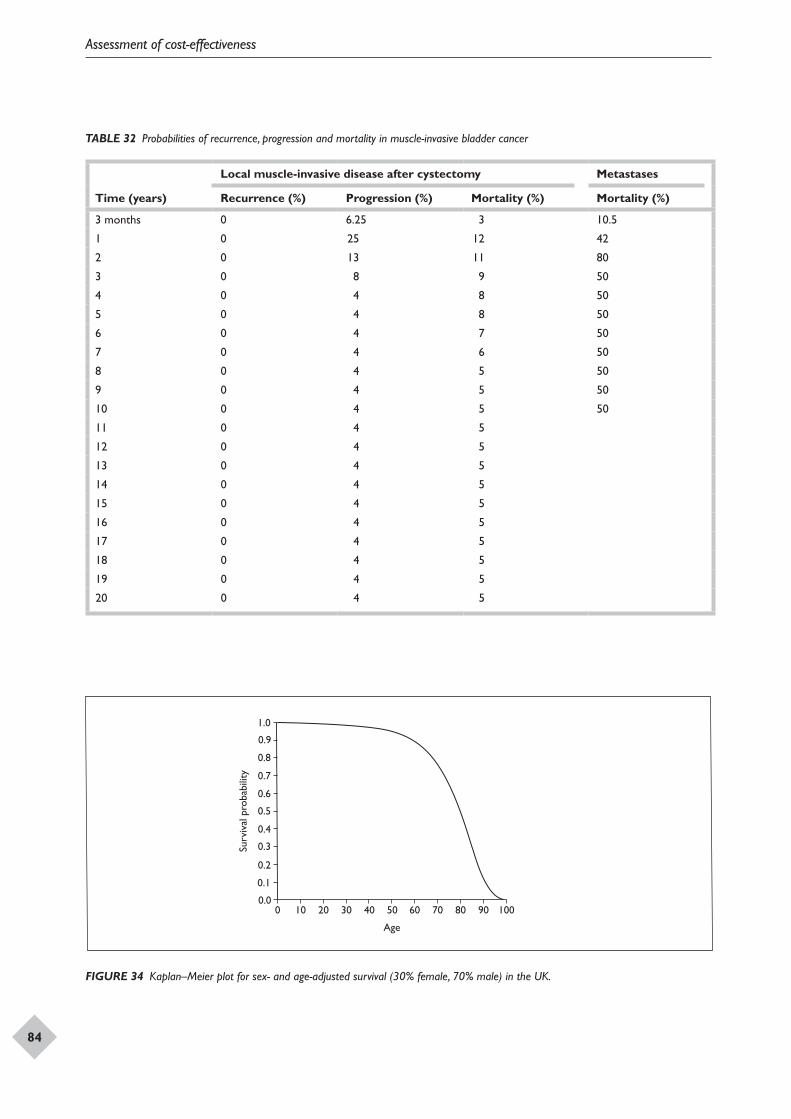
Assessment of cost-effectiveness
84
TABLE 32 Probabilities of recurrence, progression and mortality in muscle-invasive bladder cancer
Time (years)
Local muscle-invasive disease after cystectomy Metastases
Recurrence (%) Progression (%) Mortality (%) Mortality (%)
3 months 0 6.25 3 10.5
1 0 25 12 42
2 0 13 11 80
3 0 8 9 50
4 0 4 8 50
5 0 4 8 50
6 0 4 7 50
7 0 4 6 50
8 0 4 5 50
9 0 4 5 50
10 0 4 5 50
11 0 4 5
12 0 4 5
13 0 4 5
14 0 4 5
15 0 4 5
16 0 4 5
17 0 4 5
18 0 4 5
19 0 4 5
20 0 4 5
Surv
ival
pro
babi
lity
Age
0 10 20 30 40 50 60 70 80 90 1000.0
0.1
0.2
0.3
0.4
0.5
0.8
0.7
0.6
0.9
1.0
FIGURE 34 Kaplan–Meier plot for sex- and age-adjusted survival (30% female, 70% male) in the UK.
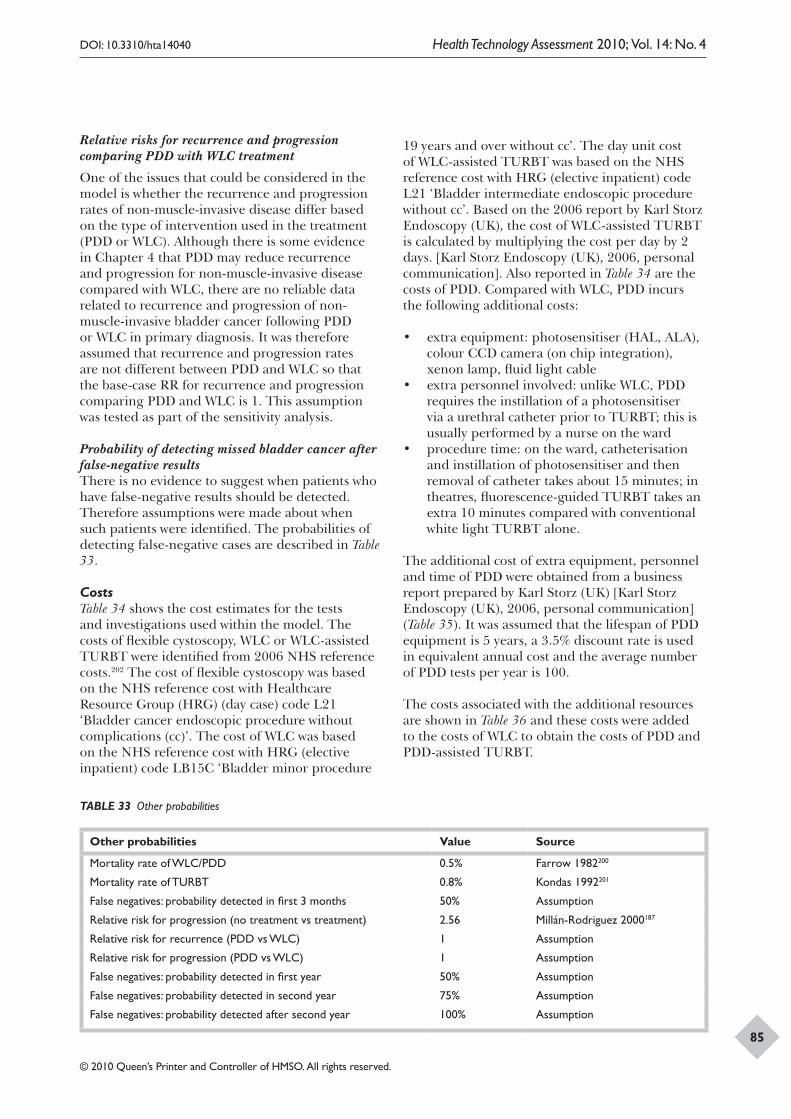
DOI: 10.3310/hta14040 Health Technology Assessment 2010; Vol. 14: No. 4
© 2010 Queen’s Printer and Controller of HMSO. All rights reserved.
85
Relative risks for recurrence and progression comparing PDD with WLC treatment
One of the issues that could be considered in the model is whether the recurrence and progression rates of non-muscle-invasive disease differ based on the type of intervention used in the treatment (PDD or WLC). Although there is some evidence in Chapter 4 that PDD may reduce recurrence and progression for non-muscle-invasive disease compared with WLC, there are no reliable data related to recurrence and progression of non-muscle-invasive bladder cancer following PDD or WLC in primary diagnosis. It was therefore assumed that recurrence and progression rates are not different between PDD and WLC so that the base-case RR for recurrence and progression comparing PDD and WLC is 1. This assumption was tested as part of the sensitivity analysis.
Probability of detecting missed bladder cancer after false-negative resultsThere is no evidence to suggest when patients who have false-negative results should be detected. Therefore assumptions were made about when such patients were identified. The probabilities of detecting false-negative cases are described in Table 33.
CostsTable 34 shows the cost estimates for the tests and investigations used within the model. The costs of flexible cystoscopy, WLC or WLC-assisted TURBT were identified from 2006 NHS reference costs.202 The cost of flexible cystoscopy was based on the NHS reference cost with Healthcare Resource Group (HRG) (day case) code L21 ‘Bladder cancer endoscopic procedure without complications (cc)’. The cost of WLC was based on the NHS reference cost with HRG (elective inpatient) code LB15C ‘Bladder minor procedure
19 years and over without cc’. The day unit cost of WLC-assisted TURBT was based on the NHS reference cost with HRG (elective inpatient) code L21 ‘Bladder intermediate endoscopic procedure without cc’. Based on the 2006 report by Karl Storz Endoscopy (UK), the cost of WLC-assisted TURBT is calculated by multiplying the cost per day by 2 days. [Karl Storz Endoscopy (UK), 2006, personal communication]. Also reported in Table 34 are the costs of PDD. Compared with WLC, PDD incurs the following additional costs:
• extra equipment: photosensitiser (HAL, ALA), colour CCD camera (on chip integration), xenon lamp, fluid light cable
• extra personnel involved: unlike WLC, PDD requires the instillation of a photosensitiser via a urethral catheter prior to TURBT; this is usually performed by a nurse on the ward
• procedure time: on the ward, catheterisation and instillation of photosensitiser and then removal of catheter takes about 15 minutes; in theatres, fluorescence-guided TURBT takes an extra 10 minutes compared with conventional white light TURBT alone.
The additional cost of extra equipment, personnel and time of PDD were obtained from a business report prepared by Karl Storz (UK) [Karl Storz Endoscopy (UK), 2006, personal communication] (Table 35). It was assumed that the lifespan of PDD equipment is 5 years, a 3.5% discount rate is used in equivalent annual cost and the average number of PDD tests per year is 100.
The costs associated with the additional resources are shown in Table 36 and these costs were added to the costs of WLC to obtain the costs of PDD and PDD-assisted TURBT.
TABLE 33 Other probabilities
Other probabilities Value Source
Mortality rate of WLC/PDD 0.5% Farrow 1982200
Mortality rate of TURBT 0.8% Kondas 1992201
False negatives: probability detected in first 3 months 50% Assumption
Relative risk for progression (no treatment vs treatment) 2.56 Millán-Rodriguez 2000187
Relative risk for recurrence (PDD vs WLC) 1 Assumption
Relative risk for progression (PDD vs WLC) 1 Assumption
False negatives: probability detected in first year 50% Assumption
False negatives: probability detected in second year 75% Assumption
False negatives: probability detected after second year 100% Assumption
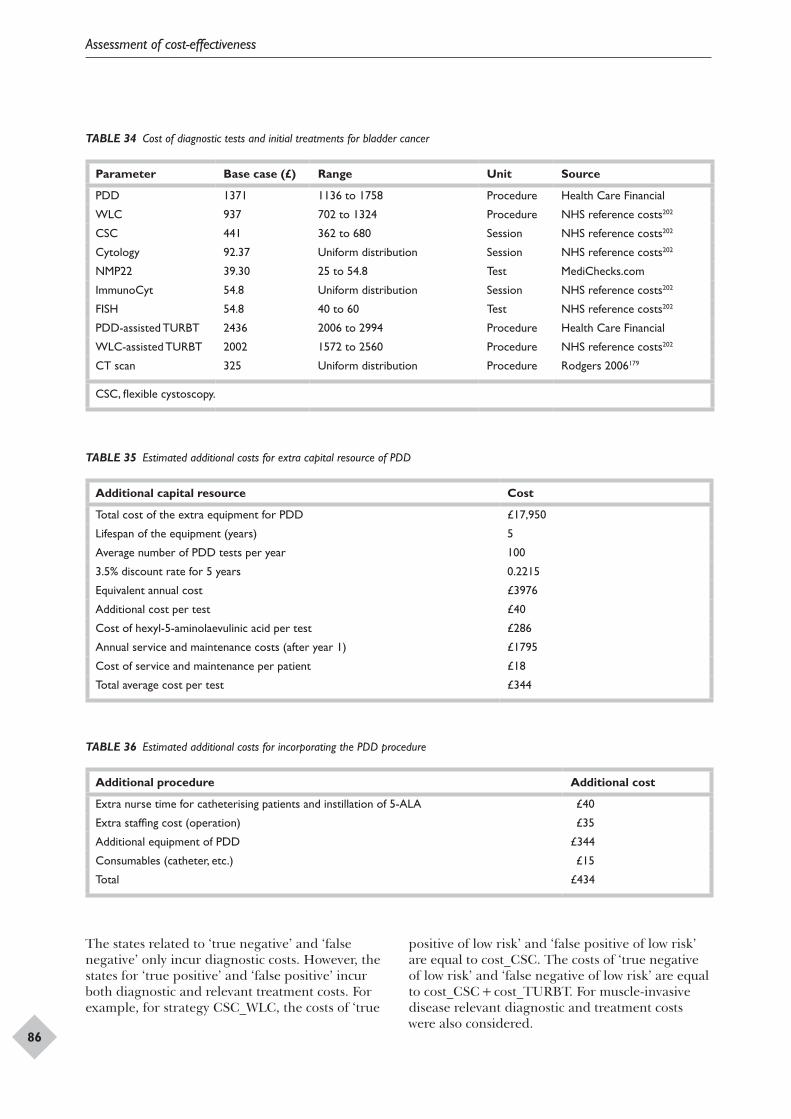
Assessment of cost-effectiveness
86
TABLE 34 Cost of diagnostic tests and initial treatments for bladder cancer
Parameter Base case (£) Range Unit Source
PDD 1371 1136 to 1758 Procedure Health Care Financial
WLC 937 702 to 1324 Procedure NHS reference costs202
CSC 441 362 to 680 Session NHS reference costs202
Cytology 92.37 Uniform distribution Session NHS reference costs202
NMP22 39.30 25 to 54.8 Test MediChecks.com
ImmunoCyt 54.8 Uniform distribution Session NHS reference costs202
FISH 54.8 40 to 60 Test NHS reference costs202
PDD-assisted TURBT 2436 2006 to 2994 Procedure Health Care Financial
WLC-assisted TURBT 2002 1572 to 2560 Procedure NHS reference costs202
CT scan 325 Uniform distribution Procedure Rodgers 2006179
CSC, flexible cystoscopy.
TABLE 35 Estimated additional costs for extra capital resource of PDD
Additional capital resource Cost
Total cost of the extra equipment for PDD £17,950
Lifespan of the equipment (years) 5
Average number of PDD tests per year 100
3.5% discount rate for 5 years 0.2215
Equivalent annual cost £3976
Additional cost per test £40
Cost of hexyl-5-aminolaevulinic acid per test £286
Annual service and maintenance costs (after year 1) £1795
Cost of service and maintenance per patient £18
Total average cost per test £344
TABLE 36 Estimated additional costs for incorporating the PDD procedure
Additional procedure Additional cost
Extra nurse time for catheterising patients and instillation of 5-ALA £40
Extra staffing cost (operation) £35
Additional equipment of PDD £344
Consumables (catheter, etc.) £15
Total £434
The states related to ‘true negative’ and ‘false negative’ only incur diagnostic costs. However, the states for ‘true positive’ and ‘false positive’ incur both diagnostic and relevant treatment costs. For example, for strategy CSC_WLC, the costs of ‘true
positive of low risk’ and ‘false positive of low risk’ are equal to cost_CSC. The costs of ‘true negative of low risk’ and ‘false negative of low risk’ are equal to cost_CSC + cost_TURBT. For muscle-invasive disease relevant diagnostic and treatment costs were also considered.
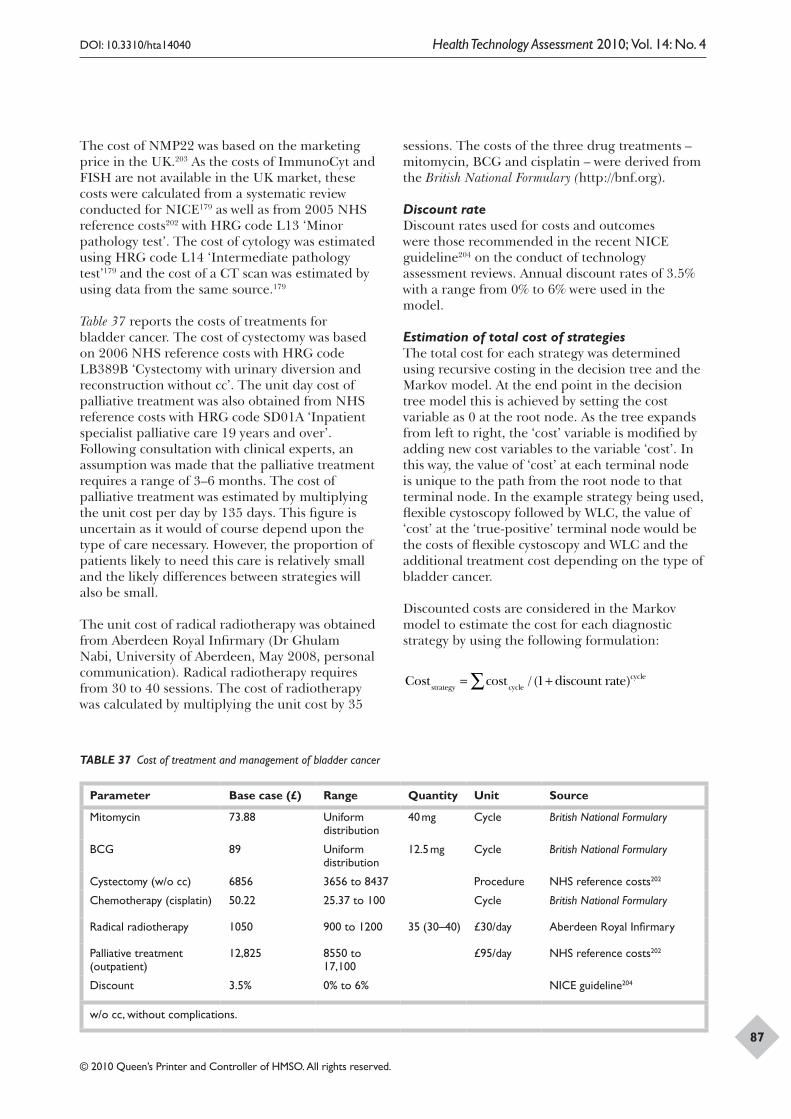
DOI: 10.3310/hta14040 Health Technology Assessment 2010; Vol. 14: No. 4
© 2010 Queen’s Printer and Controller of HMSO. All rights reserved.
87
TABLE 37 Cost of treatment and management of bladder cancer
Parameter Base case (£) Range Quantity Unit Source
Mitomycin 73.88 Uniform distribution
40 mg Cycle British National Formulary
BCG 89 Uniform distribution
12.5 mg Cycle British National Formulary
Cystectomy (w/o cc) 6856 3656 to 8437 Procedure NHS reference costs202
Chemotherapy (cisplatin) 50.22 25.37 to 100 Cycle British National Formulary
Radical radiotherapy 1050 900 to 1200 35 (30–40) £30/day Aberdeen Royal Infirmary
Palliative treatment (outpatient)
12,825 8550 to 17,100
£95/day NHS reference costs202
Discount 3.5% 0% to 6% NICE guideline204
w/o cc, without complications.
The cost of NMP22 was based on the marketing price in the UK.203 As the costs of ImmunoCyt and FISH are not available in the UK market, these costs were calculated from a systematic review conducted for NICE179 as well as from 2005 NHS reference costs202 with HRG code L13 ‘Minor pathology test’. The cost of cytology was estimated using HRG code L14 ‘Intermediate pathology test’179 and the cost of a CT scan was estimated by using data from the same source.179
Table 37 reports the costs of treatments for bladder cancer. The cost of cystectomy was based on 2006 NHS reference costs with HRG code LB389B ‘Cystectomy with urinary diversion and reconstruction without cc’. The unit day cost of palliative treatment was also obtained from NHS reference costs with HRG code SD01A ‘Inpatient specialist palliative care 19 years and over’. Following consultation with clinical experts, an assumption was made that the palliative treatment requires a range of 3–6 months. The cost of palliative treatment was estimated by multiplying the unit cost per day by 135 days. This figure is uncertain as it would of course depend upon the type of care necessary. However, the proportion of patients likely to need this care is relatively small and the likely differences between strategies will also be small.
The unit cost of radical radiotherapy was obtained from Aberdeen Royal Infirmary (Dr Ghulam Nabi, University of Aberdeen, May 2008, personal communication). Radical radiotherapy requires from 30 to 40 sessions. The cost of radiotherapy was calculated by multiplying the unit cost by 35
sessions. The costs of the three drug treatments – mitomycin, BCG and cisplatin – were derived from the British National Formulary (http://bnf.org).
Discount rateDiscount rates used for costs and outcomes were those recommended in the recent NICE guideline204 on the conduct of technology assessment reviews. Annual discount rates of 3.5% with a range from 0% to 6% were used in the model.
Estimation of total cost of strategiesThe total cost for each strategy was determined using recursive costing in the decision tree and the Markov model. At the end point in the decision tree model this is achieved by setting the cost variable as 0 at the root node. As the tree expands from left to right, the ‘cost’ variable is modified by adding new cost variables to the variable ‘cost’. In this way, the value of ‘cost’ at each terminal node is unique to the path from the root node to that terminal node. In the example strategy being used, flexible cystoscopy followed by WLC, the value of ‘cost’ at the ‘true-positive’ terminal node would be the costs of flexible cystoscopy and WLC and the additional treatment cost depending on the type of bladder cancer.
Discounted costs are considered in the Markov model to estimate the cost for each diagnostic strategy by using the following formulation:
Cost cost discount ratestrategy cycle
cycle= +∑ / ( )1
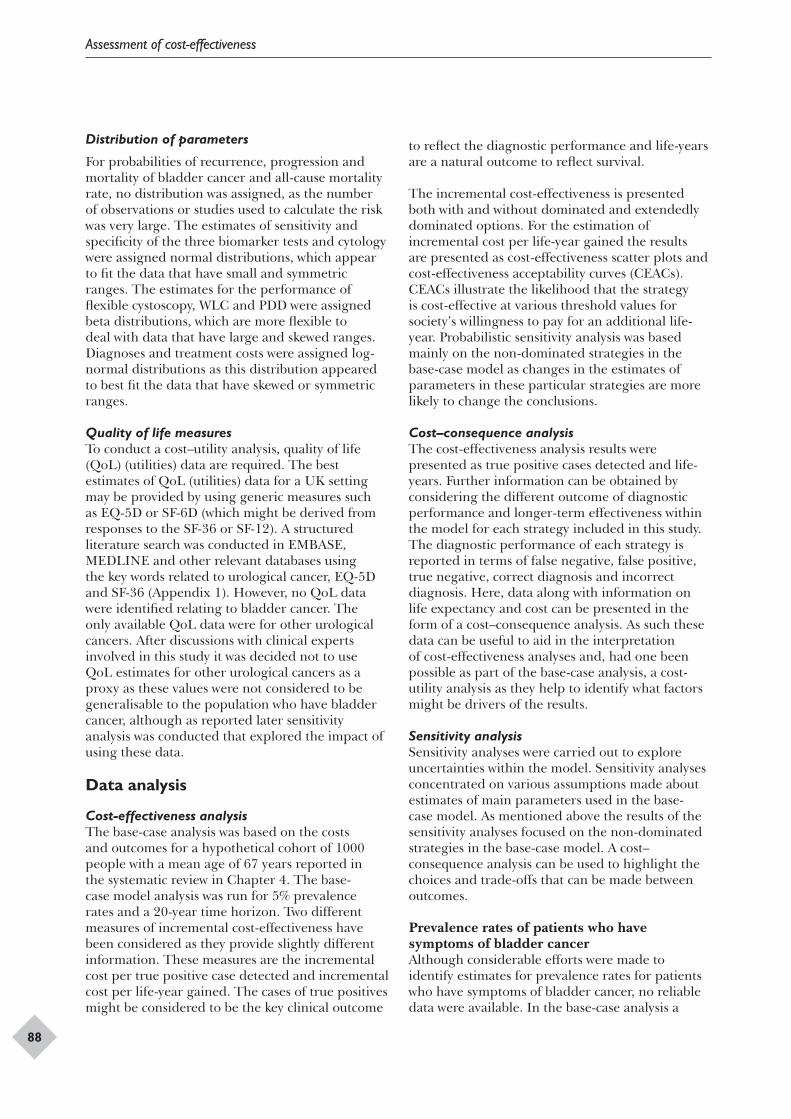
Assessment of cost-effectiveness
88
Distribution of parameters
For probabilities of recurrence, progression and mortality of bladder cancer and all-cause mortality rate, no distribution was assigned, as the number of observations or studies used to calculate the risk was very large. The estimates of sensitivity and specificity of the three biomarker tests and cytology were assigned normal distributions, which appear to fit the data that have small and symmetric ranges. The estimates for the performance of flexible cystoscopy, WLC and PDD were assigned beta distributions, which are more flexible to deal with data that have large and skewed ranges. Diagnoses and treatment costs were assigned log-normal distributions as this distribution appeared to best fit the data that have skewed or symmetric ranges.
Quality of life measuresTo conduct a cost–utility analysis, quality of life (QoL) (utilities) data are required. The best estimates of QoL (utilities) data for a UK setting may be provided by using generic measures such as EQ-5D or SF-6D (which might be derived from responses to the SF-36 or SF-12). A structured literature search was conducted in EMBASE, MEDLINE and other relevant databases using the key words related to urological cancer, EQ-5D and SF-36 (Appendix 1). However, no QoL data were identified relating to bladder cancer. The only available QoL data were for other urological cancers. After discussions with clinical experts involved in this study it was decided not to use QoL estimates for other urological cancers as a proxy as these values were not considered to be generalisable to the population who have bladder cancer, although as reported later sensitivity analysis was conducted that explored the impact of using these data.
Data analysis
Cost-effectiveness analysisThe base-case analysis was based on the costs and outcomes for a hypothetical cohort of 1000 people with a mean age of 67 years reported in the systematic review in Chapter 4. The base-case model analysis was run for 5% prevalence rates and a 20-year time horizon. Two different measures of incremental cost-effectiveness have been considered as they provide slightly different information. These measures are the incremental cost per true positive case detected and incremental cost per life-year gained. The cases of true positives might be considered to be the key clinical outcome
to reflect the diagnostic performance and life-years are a natural outcome to reflect survival.
The incremental cost-effectiveness is presented both with and without dominated and extendedly dominated options. For the estimation of incremental cost per life-year gained the results are presented as cost-effectiveness scatter plots and cost-effectiveness acceptability curves (CEACs). CEACs illustrate the likelihood that the strategy is cost-effective at various threshold values for society’s willingness to pay for an additional life-year. Probabilistic sensitivity analysis was based mainly on the non-dominated strategies in the base-case model as changes in the estimates of parameters in these particular strategies are more likely to change the conclusions.
Cost–consequence analysisThe cost-effectiveness analysis results were presented as true positive cases detected and life-years. Further information can be obtained by considering the different outcome of diagnostic performance and longer-term effectiveness within the model for each strategy included in this study. The diagnostic performance of each strategy is reported in terms of false negative, false positive, true negative, correct diagnosis and incorrect diagnosis. Here, data along with information on life expectancy and cost can be presented in the form of a cost–consequence analysis. As such these data can be useful to aid in the interpretation of cost-effectiveness analyses and, had one been possible as part of the base-case analysis, a cost-utility analysis as they help to identify what factors might be drivers of the results.
Sensitivity analysisSensitivity analyses were carried out to explore uncertainties within the model. Sensitivity analyses concentrated on various assumptions made about estimates of main parameters used in the base-case model. As mentioned above the results of the sensitivity analyses focused on the non-dominated strategies in the base-case model. A cost–consequence analysis can be used to highlight the choices and trade-offs that can be made between outcomes.
Prevalence rates of patients who have symptoms of bladder cancerAlthough considerable efforts were made to identify estimates for prevalence rates for patients who have symptoms of bladder cancer, no reliable data were available. In the base-case analysis a
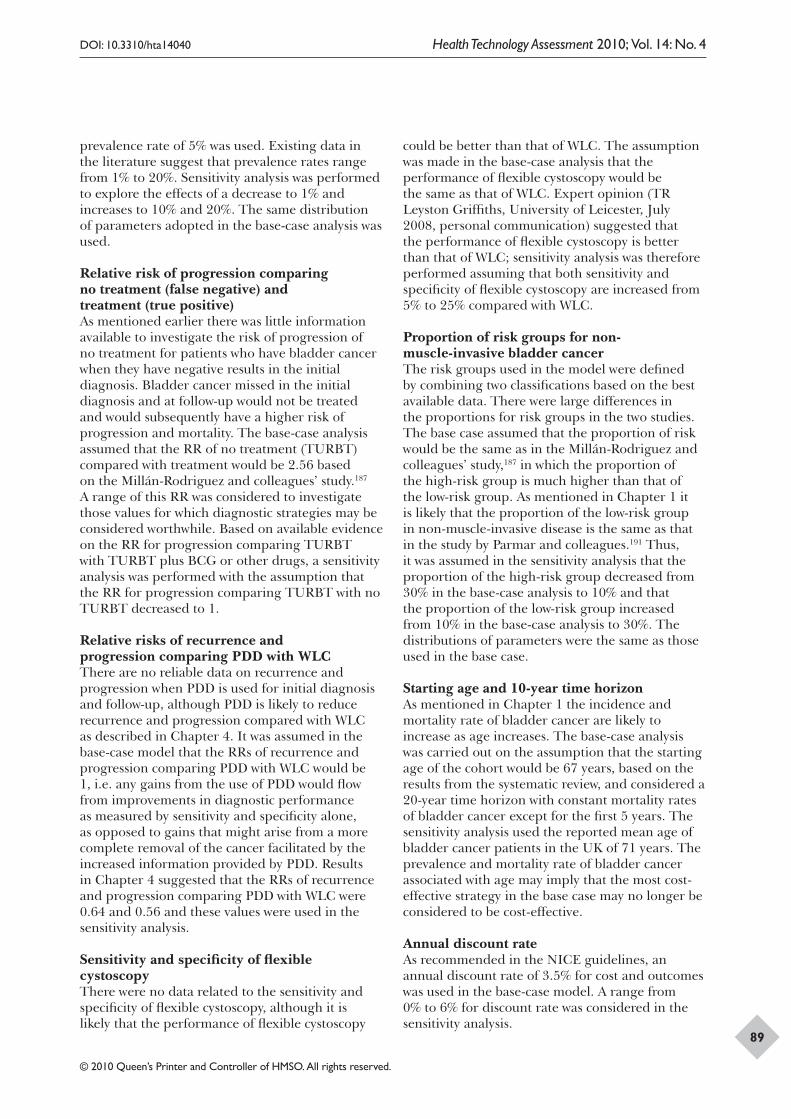
DOI: 10.3310/hta14040 Health Technology Assessment 2010; Vol. 14: No. 4
© 2010 Queen’s Printer and Controller of HMSO. All rights reserved.
89
prevalence rate of 5% was used. Existing data in the literature suggest that prevalence rates range from 1% to 20%. Sensitivity analysis was performed to explore the effects of a decrease to 1% and increases to 10% and 20%. The same distribution of parameters adopted in the base-case analysis was used.
Relative risk of progression comparing no treatment (false negative) and treatment (true positive)As mentioned earlier there was little information available to investigate the risk of progression of no treatment for patients who have bladder cancer when they have negative results in the initial diagnosis. Bladder cancer missed in the initial diagnosis and at follow-up would not be treated and would subsequently have a higher risk of progression and mortality. The base-case analysis assumed that the RR of no treatment (TURBT) compared with treatment would be 2.56 based on the Millán-Rodriguez and colleagues’ study.187 A range of this RR was considered to investigate those values for which diagnostic strategies may be considered worthwhile. Based on available evidence on the RR for progression comparing TURBT with TURBT plus BCG or other drugs, a sensitivity analysis was performed with the assumption that the RR for progression comparing TURBT with no TURBT decreased to 1.
Relative risks of recurrence and progression comparing PDD with WLCThere are no reliable data on recurrence and progression when PDD is used for initial diagnosis and follow-up, although PDD is likely to reduce recurrence and progression compared with WLC as described in Chapter 4. It was assumed in the base-case model that the RRs of recurrence and progression comparing PDD with WLC would be 1, i.e. any gains from the use of PDD would flow from improvements in diagnostic performance as measured by sensitivity and specificity alone, as opposed to gains that might arise from a more complete removal of the cancer facilitated by the increased information provided by PDD. Results in Chapter 4 suggested that the RRs of recurrence and progression comparing PDD with WLC were 0.64 and 0.56 and these values were used in the sensitivity analysis.
Sensitivity and specificity of flexible cystoscopyThere were no data related to the sensitivity and specificity of flexible cystoscopy, although it is likely that the performance of flexible cystoscopy
could be better than that of WLC. The assumption was made in the base-case analysis that the performance of flexible cystoscopy would be the same as that of WLC. Expert opinion (TR Leyston Griffiths, University of Leicester, July 2008, personal communication) suggested that the performance of flexible cystoscopy is better than that of WLC; sensitivity analysis was therefore performed assuming that both sensitivity and specificity of flexible cystoscopy are increased from 5% to 25% compared with WLC.
Proportion of risk groups for non-muscle-invasive bladder cancerThe risk groups used in the model were defined by combining two classifications based on the best available data. There were large differences in the proportions for risk groups in the two studies. The base case assumed that the proportion of risk would be the same as in the Millán-Rodriguez and colleagues’ study,187 in which the proportion of the high-risk group is much higher than that of the low-risk group. As mentioned in Chapter 1 it is likely that the proportion of the low-risk group in non-muscle-invasive disease is the same as that in the study by Parmar and colleagues.191 Thus, it was assumed in the sensitivity analysis that the proportion of the high-risk group decreased from 30% in the base-case analysis to 10% and that the proportion of the low-risk group increased from 10% in the base-case analysis to 30%. The distributions of parameters were the same as those used in the base case.
Starting age and 10-year time horizonAs mentioned in Chapter 1 the incidence and mortality rate of bladder cancer are likely to increase as age increases. The base-case analysis was carried out on the assumption that the starting age of the cohort would be 67 years, based on the results from the systematic review, and considered a 20-year time horizon with constant mortality rates of bladder cancer except for the first 5 years. The sensitivity analysis used the reported mean age of bladder cancer patients in the UK of 71 years. The prevalence and mortality rate of bladder cancer associated with age may imply that the most cost-effective strategy in the base case may no longer be considered to be cost-effective.
Annual discount rateAs recommended in the NICE guidelines, an annual discount rate of 3.5% for cost and outcomes was used in the base-case model. A range from 0% to 6% for discount rate was considered in the sensitivity analysis.
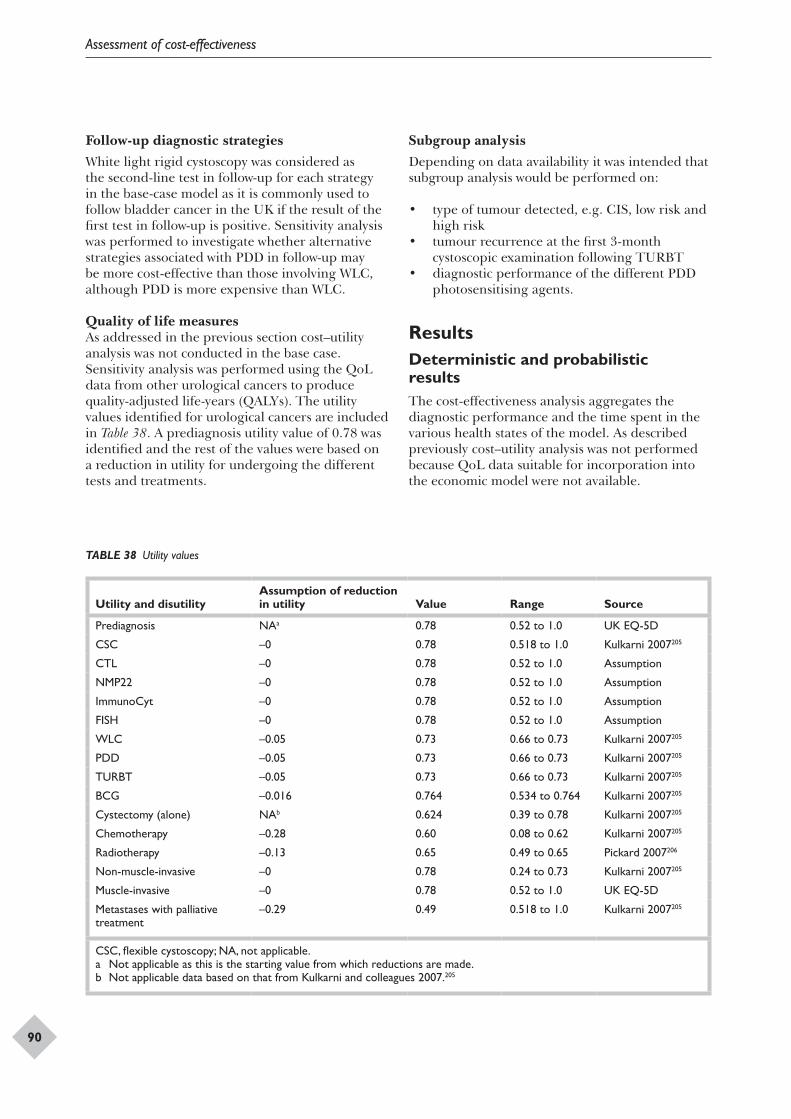
Assessment of cost-effectiveness
90
Follow-up diagnostic strategiesWhite light rigid cystoscopy was considered as the second-line test in follow-up for each strategy in the base-case model as it is commonly used to follow bladder cancer in the UK if the result of the first test in follow-up is positive. Sensitivity analysis was performed to investigate whether alternative strategies associated with PDD in follow-up may be more cost-effective than those involving WLC, although PDD is more expensive than WLC.
Quality of life measuresAs addressed in the previous section cost–utility analysis was not conducted in the base case. Sensitivity analysis was performed using the QoL data from other urological cancers to produce quality-adjusted life-years (QALYs). The utility values identified for urological cancers are included in Table 38. A prediagnosis utility value of 0.78 was identified and the rest of the values were based on a reduction in utility for undergoing the different tests and treatments.
Subgroup analysisDepending on data availability it was intended that subgroup analysis would be performed on:
• type of tumour detected, e.g. CIS, low risk and high risk
• tumour recurrence at the first 3-month cystoscopic examination following TURBT
• diagnostic performance of the different PDD photosensitising agents.
ResultsDeterministic and probabilistic resultsThe cost-effectiveness analysis aggregates the diagnostic performance and the time spent in the various health states of the model. As described previously cost–utility analysis was not performed because QoL data suitable for incorporation into the economic model were not available.
TABLE 38 Utility values
Utility and disutility Assumption of reduction in utility Value Range Source
Prediagnosis NAa 0.78 0.52 to 1.0 UK EQ-5D
CSC –0 0.78 0.518 to 1.0 Kulkarni 2007205
CTL –0 0.78 0.52 to 1.0 Assumption
NMP22 –0 0.78 0.52 to 1.0 Assumption
ImmunoCyt –0 0.78 0.52 to 1.0 Assumption
FISH –0 0.78 0.52 to 1.0 Assumption
WLC –0.05 0.73 0.66 to 0.73 Kulkarni 2007205
PDD –0.05 0.73 0.66 to 0.73 Kulkarni 2007205
TURBT –0.05 0.73 0.66 to 0.73 Kulkarni 2007205
BCG –0.016 0.764 0.534 to 0.764 Kulkarni 2007205
Cystectomy (alone) NAb 0.624 0.39 to 0.78 Kulkarni 2007205
Chemotherapy –0.28 0.60 0.08 to 0.62 Kulkarni 2007205
Radiotherapy –0.13 0.65 0.49 to 0.65 Pickard 2007206
Non-muscle-invasive –0 0.78 0.24 to 0.73 Kulkarni 2007205
Muscle-invasive –0 0.78 0.52 to 1.0 UK EQ-5D
Metastases with palliative treatment
–0.29 0.49 0.518 to 1.0 Kulkarni 2007205
CSC, flexible cystoscopy; NA, not applicable.a Not applicable as this is the starting value from which reductions are made.b Not applicable data based on that from Kulkarni and colleagues 2007.205
DOI: 10.3310/hta14040 Health Technology Assessment 2010; Vol. 14: No. 4
© 2010 Queen’s Printer and Controller of HMSO. All rights reserved.
91
Deterministic results
The cost-effectiveness of the 26 strategies for initial diagnosis and follow-up were considered over a 20-year time horizon.
Base case: diagnostic performance and life-years and costs per patientTable 39 shows the results for a hypothetical cohort of 1000 patients. The table reports performance of the strategies, from the least to the most costly. For each strategy the diagnostic performance of the strategy and the average cost and life expectancy over a 20-year time horizon are shown. It is important to remember when interpreting these data that in the base-case analysis the prevalence of disease is 5% (i.e. 50 people out of the 1000 in the cohort have bladder cancer).
Of the strategies shown, strategy 26, flexible cystoscopy and ImmunoCyt followed by PDD in initial diagnosis and flexible cystoscopy followed by WLC in follow-up [CSC_IMM_PDD (CSC_WLC)], has the best performance in terms of the highest number of true positives and lowest number of false negatives and the highest number of life-years but it also has the worst performance in terms of the highest number of false positives (n = 188), the lowest number of true negatives and the highest cost. Strategy 1, CTL_WLC (CTL_WLC), reports the lowest numbers of true positives and false positives and life-years saved and the highest values for true negatives and false negatives.
Cost–consequence analysisThe results presented in Table 39 can be used to consider the trade-offs between the different treatment strategies and this can be further illustrated using the data presented in Table 40. Table 40 reports the strategies that perform the best in terms of the different outcome measures considered. The results for all strategies are reported in Appendix 19 (Tables 58 and 59). For example, CSC_IMM_PDD (CSC_WLC) is the best-performing strategy in terms of having the lowest false-negative and the highest true-positive rates and longest survival. However, it is associated with the highest rates of false positives and the lowest rates of true negatives.
This table and Table 39 illustrate the trade-offs that exists between those strategies that can correctly identify those without disease but will result in all of the harms from an incorrect diagnosis compared with those strategies that are better able to identify disease if it is present but also result in additional
anxiety and cost for those incorrectly initially diagnosed as positive.
Cost-effectiveness analysisIncremental cost per true positive case detectedThe cost-effectiveness results for diagnostic performance are presented in Table 41 using incremental cost per true positive detected. In terms of mean true positive cases and costs, most of the strategies associated with flexible cystoscopy or WLC in the initial diagnosis [except for CTL_WLC (CTL_WLC) and FISH_WLC (FISH_WLC)] are dominated by those that involve PDD or biomarkers and can be eliminated because they are less effective and more costly than the non-dominated strategies. The lower part of the table reports the incremental cost-effectiveness ratios (ICERs) when dominated and extendedly dominated strategies are omitted.
The results in Table 41 show that strategy 26 (CSC_IMM_PDD) has the highest number of true positive cases detected (n = 44) and is the most costly strategy (£2370) per patient. Strategy 1 (CTL_WLC) has the lowest cost per patient (£1043) and produces the least number of true positives (n = 16). It is also highlighted in the table that total cost increases when moving from WLC to PDD and the number of cases detected also increases when PDD is used.
Incremental cost per life-yearThe base-case analysis was also presented in terms of incremental cost per life-year (Table 42). The results presented for life-years are similar to those presented in Table 41. As can be seen from Table 42 many strategies are dominated, that is they provide no more or even less benefits at the same or increased cost. Further strategies are extendedly dominated, that is providing a mix of a lower cost but less effective strategy and a higher cost but more effective strategy would be more efficient. The strategy of FISH_WLC (FISH_WLC) is extendedly dominated by the strategy of CTL_PDD (CTL_WLC) and it can be eliminated as its ICER is greater than that of FISH_PDD (FISH_WLC) as well as CSC_IMM_PDD. Furthermore, even for those strategies that are not dominated or extendedly dominated the incremental cost per life-year gained might be higher than society is willing to pay. Reference values for society’s willingness to pay for a life-year are not available but given that people will be in less than full health it is likely that the incremental cost per QALY
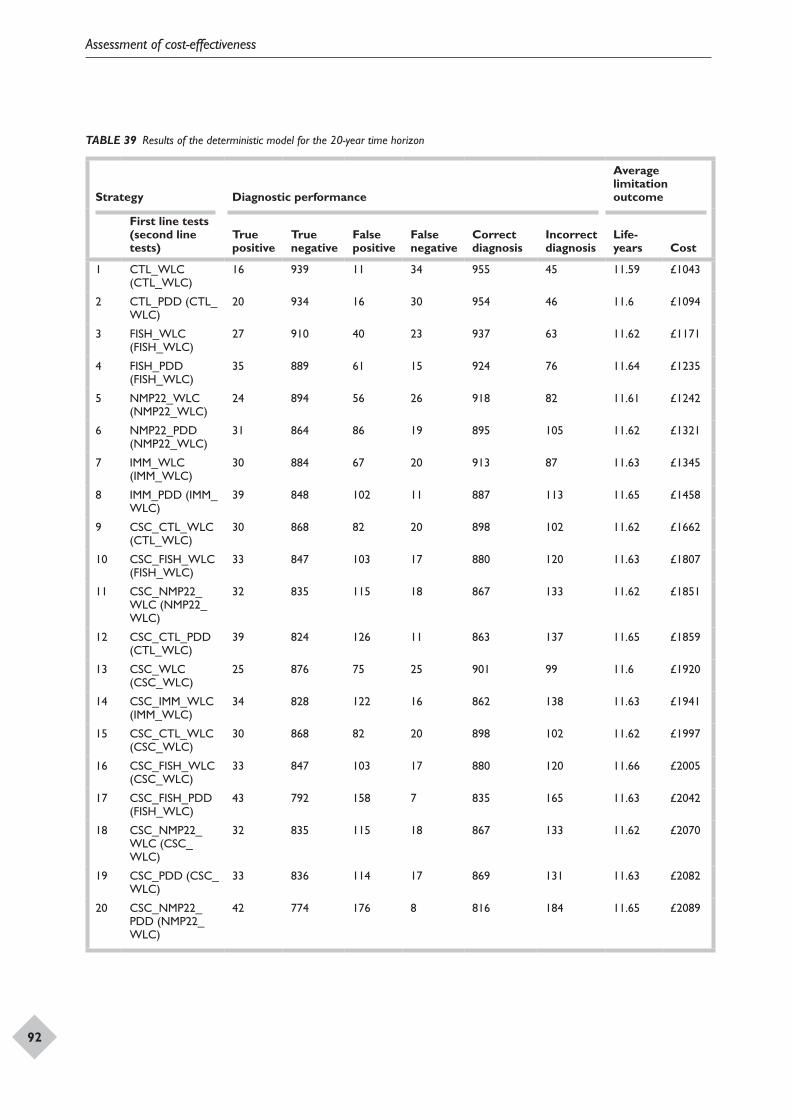
Assessment of cost-effectiveness
92
TABLE 39 Results of the deterministic model for the 20-year time horizon
Strategy Diagnostic performance
Average limitation outcome
First line tests (second line tests)
True positive
True negative
False positive
False negative
Correct diagnosis
Incorrect diagnosis
Life-years Cost
1 CTL_WLC (CTL_WLC)
16 939 11 34 955 45 11.59 £1043
2 CTL_PDD (CTL_WLC)
20 934 16 30 954 46 11.6 £1094
3 FISH_WLC (FISH_WLC)
27 910 40 23 937 63 11.62 £1171
4 FISH_PDD (FISH_WLC)
35 889 61 15 924 76 11.64 £1235
5 NMP22_WLC (NMP22_WLC)
24 894 56 26 918 82 11.61 £1242
6 NMP22_PDD (NMP22_WLC)
31 864 86 19 895 105 11.62 £1321
7 IMM_WLC (IMM_WLC)
30 884 67 20 913 87 11.63 £1345
8 IMM_PDD (IMM_WLC)
39 848 102 11 887 113 11.65 £1458
9 CSC_CTL_WLC (CTL_WLC)
30 868 82 20 898 102 11.62 £1662
10 CSC_FISH_WLC (FISH_WLC)
33 847 103 17 880 120 11.63 £1807
11 CSC_NMP22_WLC (NMP22_WLC)
32 835 115 18 867 133 11.62 £1851
12 CSC_CTL_PDD (CTL_WLC)
39 824 126 11 863 137 11.65 £1859
13 CSC_WLC (CSC_WLC)
25 876 75 25 901 99 11.6 £1920
14 CSC_IMM_WLC (IMM_WLC)
34 828 122 16 862 138 11.63 £1941
15 CSC_CTL_WLC (CSC_WLC)
30 868 82 20 898 102 11.62 £1997
16 CSC_FISH_WLC (CSC_WLC)
33 847 103 17 880 120 11.66 £2005
17 CSC_FISH_PDD (FISH_WLC)
43 792 158 7 835 165 11.63 £2042
18 CSC_NMP22_WLC (CSC_WLC)
32 835 115 18 867 133 11.62 £2070
19 CSC_PDD (CSC_WLC)
33 836 114 17 869 131 11.63 £2082
20 CSC_NMP22_PDD (NMP22_WLC)
42 774 176 8 816 184 11.65 £2089
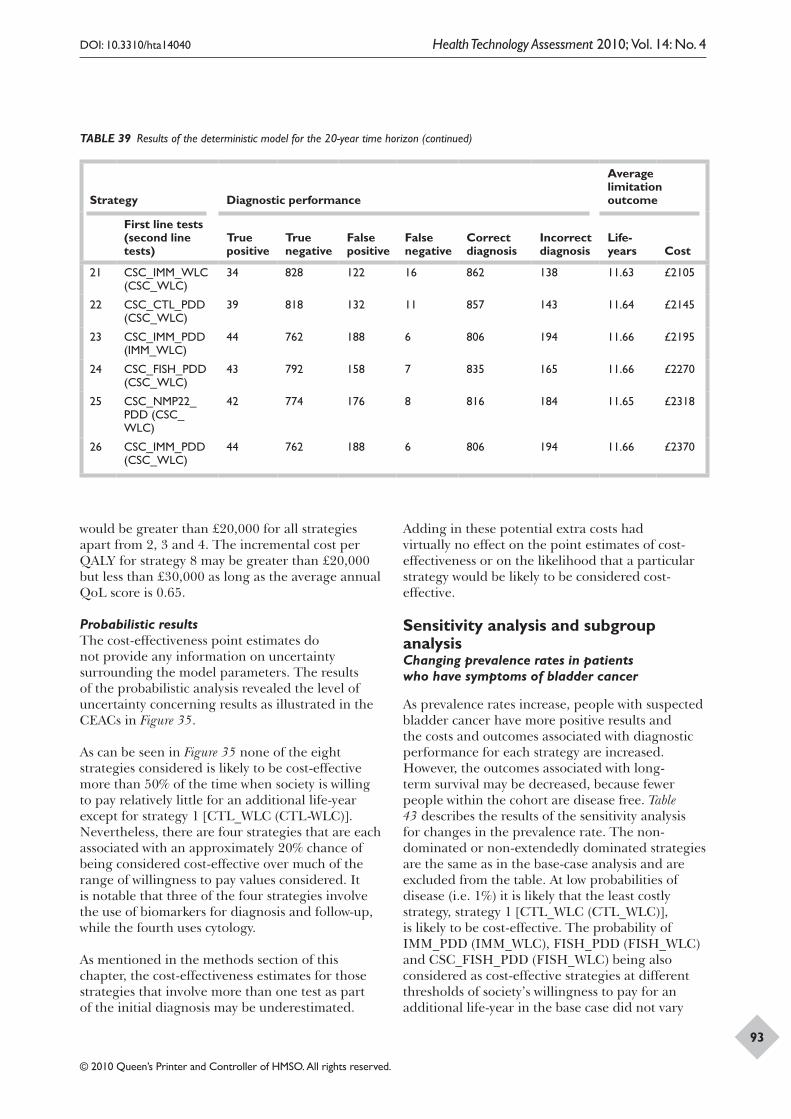
DOI: 10.3310/hta14040 Health Technology Assessment 2010; Vol. 14: No. 4
© 2010 Queen’s Printer and Controller of HMSO. All rights reserved.
93
Strategy Diagnostic performance
Average limitation outcome
First line tests (second line tests)
True positive
True negative
False positive
False negative
Correct diagnosis
Incorrect diagnosis
Life-years Cost
21 CSC_IMM_WLC (CSC_WLC)
34 828 122 16 862 138 11.63 £2105
22 CSC_CTL_PDD (CSC_WLC)
39 818 132 11 857 143 11.64 £2145
23 CSC_IMM_PDD (IMM_WLC)
44 762 188 6 806 194 11.66 £2195
24 CSC_FISH_PDD (CSC_WLC)
43 792 158 7 835 165 11.66 £2270
25 CSC_NMP22_PDD (CSC_WLC)
42 774 176 8 816 184 11.65 £2318
26 CSC_IMM_PDD (CSC_WLC)
44 762 188 6 806 194 11.66 £2370
TABLE 39 Results of the deterministic model for the 20-year time horizon (continued)
would be greater than £20,000 for all strategies apart from 2, 3 and 4. The incremental cost per QALY for strategy 8 may be greater than £20,000 but less than £30,000 as long as the average annual QoL score is 0.65.
Probabilistic resultsThe cost-effectiveness point estimates do not provide any information on uncertainty surrounding the model parameters. The results of the probabilistic analysis revealed the level of uncertainty concerning results as illustrated in the CEACs in Figure 35.
As can be seen in Figure 35 none of the eight strategies considered is likely to be cost-effective more than 50% of the time when society is willing to pay relatively little for an additional life-year except for strategy 1 [CTL_WLC (CTL-WLC)]. Nevertheless, there are four strategies that are each associated with an approximately 20% chance of being considered cost-effective over much of the range of willingness to pay values considered. It is notable that three of the four strategies involve the use of biomarkers for diagnosis and follow-up, while the fourth uses cytology.
As mentioned in the methods section of this chapter, the cost-effectiveness estimates for those strategies that involve more than one test as part of the initial diagnosis may be underestimated.
Adding in these potential extra costs had virtually no effect on the point estimates of cost-effectiveness or on the likelihood that a particular strategy would be likely to be considered cost-effective.
Sensitivity analysis and subgroup analysisChanging prevalence rates in patients who have symptoms of bladder cancer
As prevalence rates increase, people with suspected bladder cancer have more positive results and the costs and outcomes associated with diagnostic performance for each strategy are increased. However, the outcomes associated with long-term survival may be decreased, because fewer people within the cohort are disease free. Table 43 describes the results of the sensitivity analysis for changes in the prevalence rate. The non-dominated or non-extendedly dominated strategies are the same as in the base-case analysis and are excluded from the table. At low probabilities of disease (i.e. 1%) it is likely that the least costly strategy, strategy 1 [CTL_WLC (CTL_WLC)], is likely to be cost-effective. The probability of IMM_PDD (IMM_WLC), FISH_PDD (FISH_WLC) and CSC_FISH_PDD (FISH_WLC) being also considered as cost-effective strategies at different thresholds of society’s willingness to pay for an additional life-year in the base case did not vary
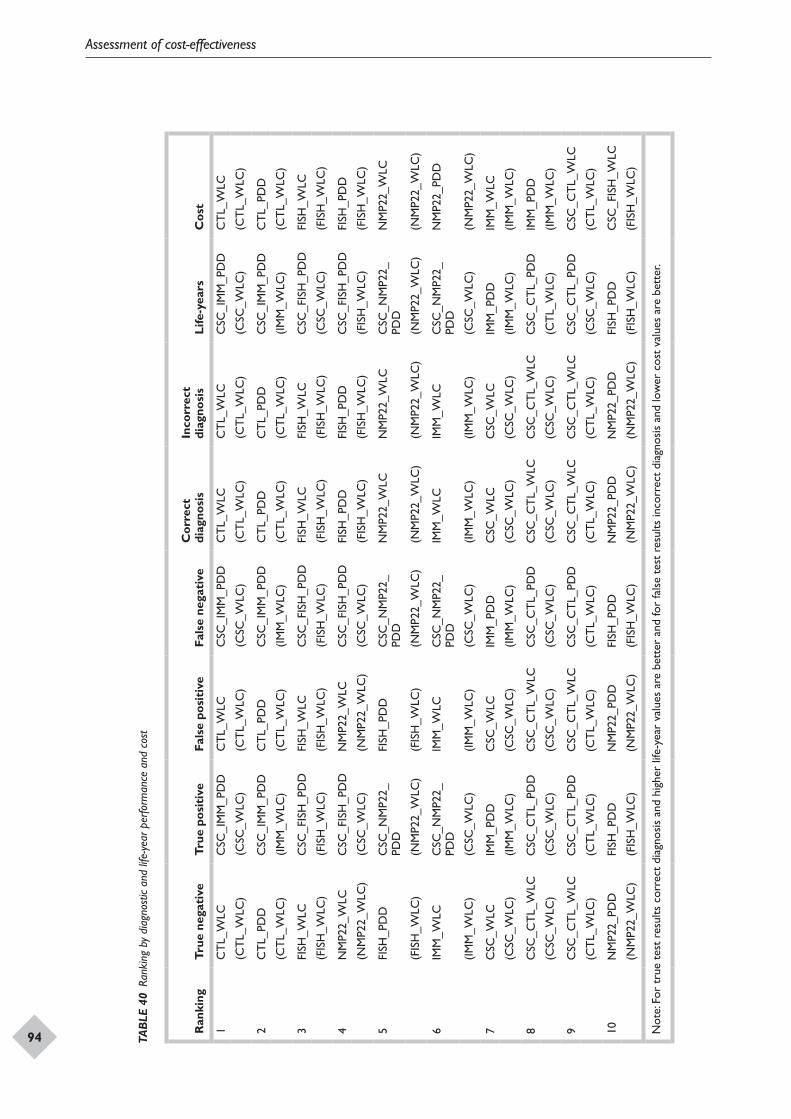
Assessment of cost-effectiveness
94 TAB
LE 4
0 Ra
nkin
g by
dia
gnos
tic a
nd li
fe-y
ear p
erfo
rman
ce a
nd c
ost
Ran
king
True
neg
ativ
eTr
ue p
osit
ive
Fals
e po
siti
veFa
lse
nega
tive
Cor
rect
di
agno
sis
Inco
rrec
t di
agno
sis
Life
-yea
rsC
ost
1C
TL_
WLC
C
SC_I
MM
_PD
DC
TL_
WLC
CSC
_IM
M_P
DD
CT
L_W
LCC
TL_
WLC
CSC
_IM
M_P
DD
CT
L_W
LC
(CT
L_W
LC)
(CSC
_WLC
)(C
TL_
WLC
)(C
SC_W
LC)
(CT
L_W
LC)
(CT
L_W
LC)
(CSC
_WLC
)(C
TL_
WLC
)
2C
TL_
PDD
CSC
_IM
M_P
DD
CT
L_PD
DC
SC_I
MM
_PD
DC
TL_
PDD
CT
L_PD
DC
SC_I
MM
_PD
DC
TL_
PDD
(CT
L_W
LC)
(IMM
_WLC
)(C
TL_
WLC
)(IM
M_W
LC)
(CT
L_W
LC)
(CT
L_W
LC)
(IMM
_WLC
)(C
TL_
WLC
)
3FI
SH_W
LCC
SC_F
ISH
_PD
DFI
SH_W
LCC
SC_F
ISH
_PD
DFI
SH_W
LCFI
SH_W
LCC
SC_F
ISH
_PD
DFI
SH_W
LC
(FIS
H_W
LC)
(FIS
H_W
LC)
(FIS
H_W
LC)
(FIS
H_W
LC)
(FIS
H_W
LC)
(FIS
H_W
LC)
(CSC
_WLC
)(F
ISH
_WLC
)
4N
MP2
2_W
LCC
SC_F
ISH
_PD
DN
MP2
2_W
LCC
SC_F
ISH
_PD
DFI
SH_P
DD
FISH
_PD
DC
SC_F
ISH
_PD
DFI
SH_P
DD
(NM
P22_
WLC
)(C
SC_W
LC)
(NM
P22_
WLC
)(C
SC_W
LC)
(FIS
H_W
LC)
(FIS
H_W
LC)
(FIS
H_W
LC)
(FIS
H_W
LC)
5FI
SH_P
DD
CSC
_NM
P22_
PDD
FISH
_PD
DC
SC_N
MP2
2_PD
DN
MP2
2_W
LCN
MP2
2_W
LCC
SC_N
MP2
2_PD
DN
MP2
2_W
LC
(FIS
H_W
LC)
(NM
P22_
WLC
)(F
ISH
_WLC
)(N
MP2
2_W
LC)
(NM
P22_
WLC
)(N
MP2
2_W
LC)
(NM
P22_
WLC
)(N
MP2
2_W
LC)
6IM
M_W
LCC
SC_N
MP2
2_PD
DIM
M_W
LCC
SC_N
MP2
2_PD
DIM
M_W
LCIM
M_W
LCC
SC_N
MP2
2_PD
DN
MP2
2_PD
D
(IMM
_WLC
)(C
SC_W
LC)
(IMM
_WLC
)(C
SC_W
LC)
(IMM
_WLC
)(IM
M_W
LC)
(CSC
_WLC
)(N
MP2
2_W
LC)
7C
SC_W
LCIM
M_P
DD
CSC
_WLC
IMM
_PD
DC
SC_W
LCC
SC_W
LCIM
M_P
DD
IMM
_WLC
(CSC
_WLC
)(IM
M_W
LC)
(CSC
_WLC
)(IM
M_W
LC)
(CSC
_WLC
)(C
SC_W
LC)
(IMM
_WLC
)(IM
M_W
LC)
8C
SC_C
TL_
WLC
CSC
_CT
L_PD
DC
SC_C
TL_
WLC
CSC
_CT
L_PD
DC
SC_C
TL_
WLC
CSC
_CT
L_W
LCC
SC_C
TL_
PDD
IMM
_PD
D
(CSC
_WLC
)(C
SC_W
LC)
(CSC
_WLC
)(C
SC_W
LC)
(CSC
_WLC
)(C
SC_W
LC)
(CT
L_W
LC)
(IMM
_WLC
)
9C
SC_C
TL_
WLC
CSC
_CT
L_PD
DC
SC_C
TL_
WLC
CSC
_CT
L_PD
DC
SC_C
TL_
WLC
CSC
_CT
L_W
LCC
SC_C
TL_
PDD
CSC
_CT
L_W
LC
(CT
L_W
LC)
(CT
L_W
LC)
(CT
L_W
LC)
(CT
L_W
LC)
(CT
L_W
LC)
(CT
L_W
LC)
(CSC
_WLC
)(C
TL_
WLC
)
10N
MP2
2_PD
DFI
SH_P
DD
NM
P22_
PDD
FISH
_PD
DN
MP2
2_PD
DN
MP2
2_PD
DFI
SH_P
DD
CSC
_FIS
H_W
LC
(NM
P22_
WLC
)(F
ISH
_WLC
)(N
MP2
2_W
LC)
(FIS
H_W
LC)
(NM
P22_
WLC
)(N
MP2
2_W
LC)
(FIS
H_W
LC)
(FIS
H_W
LC)
Not
e: Fo
r tr
ue t
est
resu
lts c
orre
ct d
iagn
osis
and
hig
her
life-
year
val
ues
are
bett
er a
nd fo
r fa
lse
test
res
ults
inco
rrec
t di
agno
sis
and
low
er c
ost
valu
es a
re b
ette
r.
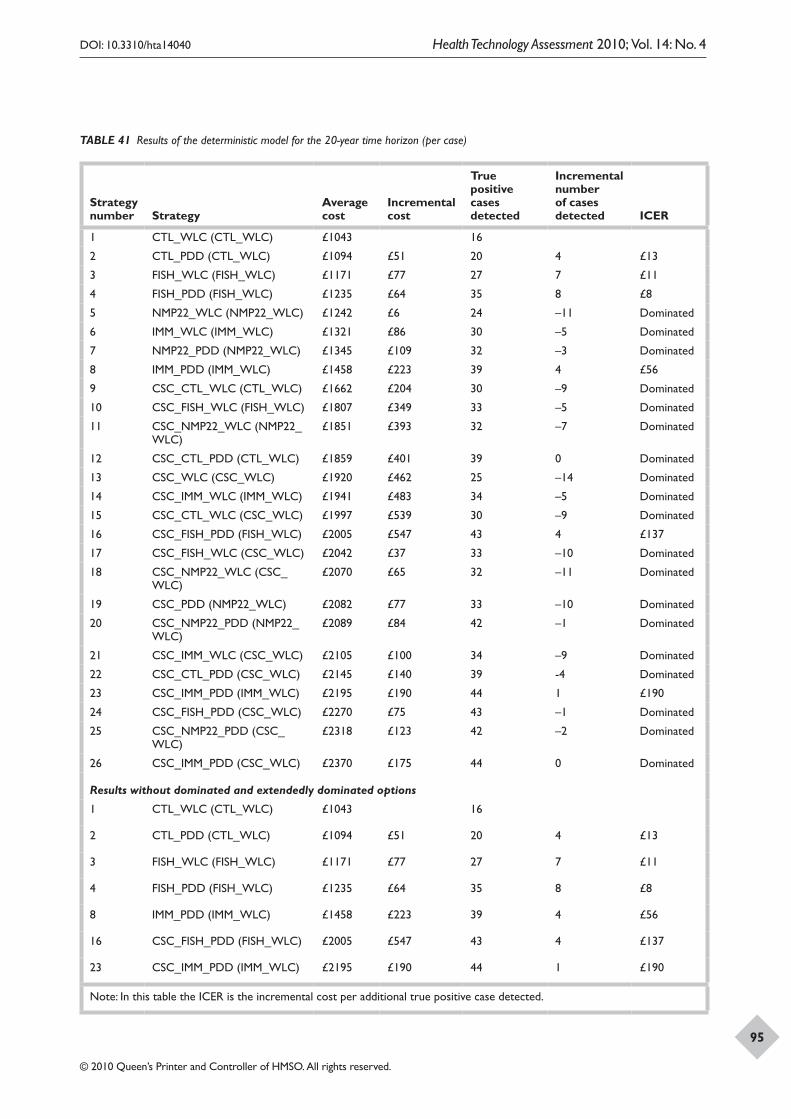
DOI: 10.3310/hta14040 Health Technology Assessment 2010; Vol. 14: No. 4
© 2010 Queen’s Printer and Controller of HMSO. All rights reserved.
95
TABLE 41 Results of the deterministic model for the 20-year time horizon (per case)
Strategy number Strategy
Average cost
Incremental cost
True positive cases detected
Incremental number of cases detected ICER
1 CTL_WLC (CTL_WLC) £1043 16
2 CTL_PDD (CTL_WLC) £1094 £51 20 4 £13
3 FISH_WLC (FISH_WLC) £1171 £77 27 7 £11
4 FISH_PDD (FISH_WLC) £1235 £64 35 8 £8
5 NMP22_WLC (NMP22_WLC) £1242 £6 24 –11 Dominated
6 IMM_WLC (IMM_WLC) £1321 £86 30 –5 Dominated
7 NMP22_PDD (NMP22_WLC) £1345 £109 32 –3 Dominated
8 IMM_PDD (IMM_WLC) £1458 £223 39 4 £56
9 CSC_CTL_WLC (CTL_WLC) £1662 £204 30 –9 Dominated
10 CSC_FISH_WLC (FISH_WLC) £1807 £349 33 –5 Dominated
11 CSC_NMP22_WLC (NMP22_WLC)
£1851 £393 32 –7 Dominated
12 CSC_CTL_PDD (CTL_WLC) £1859 £401 39 0 Dominated
13 CSC_WLC (CSC_WLC) £1920 £462 25 –14 Dominated
14 CSC_IMM_WLC (IMM_WLC) £1941 £483 34 –5 Dominated
15 CSC_CTL_WLC (CSC_WLC) £1997 £539 30 –9 Dominated
16 CSC_FISH_PDD (FISH_WLC) £2005 £547 43 4 £137
17 CSC_FISH_WLC (CSC_WLC) £2042 £37 33 –10 Dominated
18 CSC_NMP22_WLC (CSC_WLC)
£2070 £65 32 –11 Dominated
19 CSC_PDD (NMP22_WLC) £2082 £77 33 –10 Dominated
20 CSC_NMP22_PDD (NMP22_WLC)
£2089 £84 42 –1 Dominated
21 CSC_IMM_WLC (CSC_WLC) £2105 £100 34 –9 Dominated
22 CSC_CTL_PDD (CSC_WLC) £2145 £140 39 -4 Dominated
23 CSC_IMM_PDD (IMM_WLC) £2195 £190 44 1 £190
24 CSC_FISH_PDD (CSC_WLC) £2270 £75 43 –1 Dominated
25 CSC_NMP22_PDD (CSC_WLC)
£2318 £123 42 –2 Dominated
26 CSC_IMM_PDD (CSC_WLC) £2370 £175 44 0 Dominated
Results without dominated and extendedly dominated options
1 CTL_WLC (CTL_WLC) £1043 16
2 CTL_PDD (CTL_WLC) £1094 £51 20 4 £13
3 FISH_WLC (FISH_WLC) £1171 £77 27 7 £11
4 FISH_PDD (FISH_WLC) £1235 £64 35 8 £8
8 IMM_PDD (IMM_WLC) £1458 £223 39 4 £56
16 CSC_FISH_PDD (FISH_WLC) £2005 £547 43 4 £137
23 CSC_IMM_PDD (IMM_WLC) £2195 £190 44 1 £190
Note: In this table the ICER is the incremental cost per additional true positive case detected.
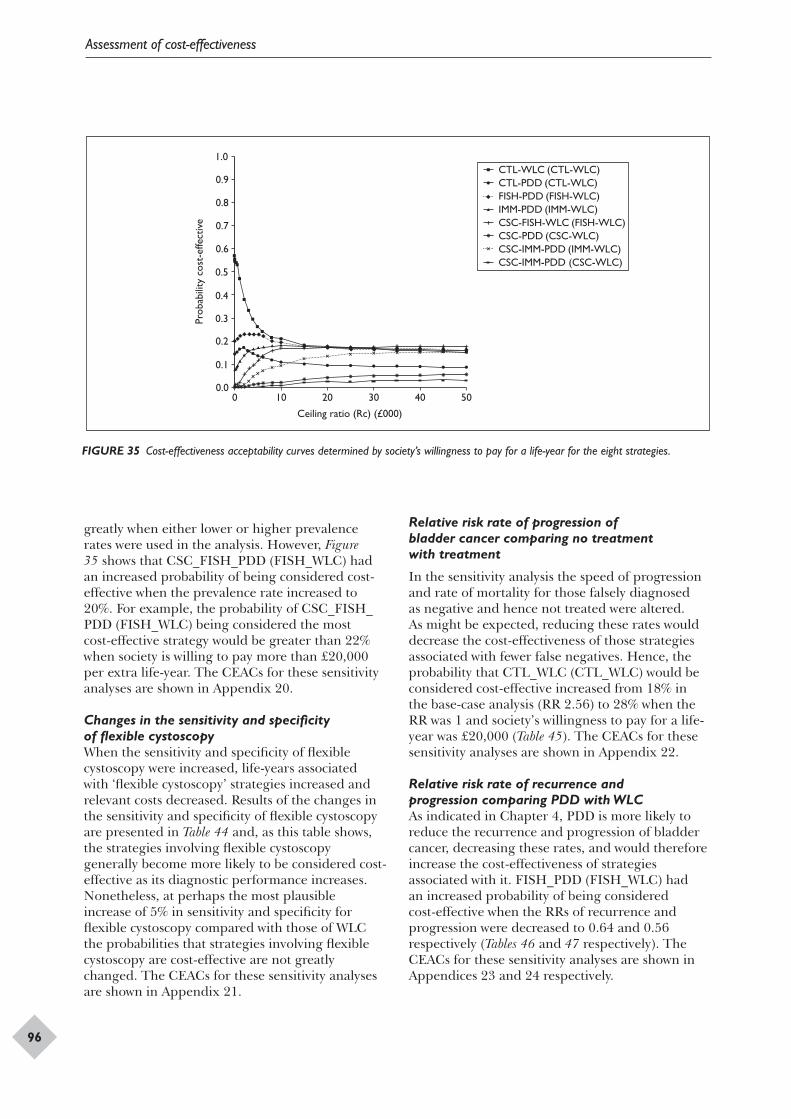
Assessment of cost-effectiveness
96
+
+ + + +
+ + + +
+ + + + + + + + + + +
+ +
+
+ + + + + + + + + + + + + + + + + + + + + + + + + + + + + + + + + + + +
+ + + + + + + + +
+ + + + + + + + + +
Prob
abili
ty c
ost-
effe
ctiv
e
Ceiling ratio (Rc) (£000)
0 10 20 30 40 50
CTL-WLC (CTL-WLC)CTL-PDD (CTL-WLC)FISH-PDD (FISH-WLC)IMM-PDD (IMM-WLC)CSC-FISH-WLC (FISH-WLC)CSC-PDD (CSC-WLC)CSC-IMM-PDD (IMM-WLC)CSC-IMM-PDD (CSC-WLC)
0.0
0.2
0.1
0.3
0.4
0.5
0.9
0.8
0.7
0.6
1.0
FIGURE 35 Cost-effectiveness acceptability curves determined by society’s willingness to pay for a life-year for the eight strategies.
greatly when either lower or higher prevalence rates were used in the analysis. However, Figure 35 shows that CSC_FISH_PDD (FISH_WLC) had an increased probability of being considered cost-effective when the prevalence rate increased to 20%. For example, the probability of CSC_FISH_PDD (FISH_WLC) being considered the most cost-effective strategy would be greater than 22% when society is willing to pay more than £20,000 per extra life-year. The CEACs for these sensitivity analyses are shown in Appendix 20.
Changes in the sensitivity and specificity of flexible cystoscopyWhen the sensitivity and specificity of flexible cystoscopy were increased, life-years associated with ‘flexible cystoscopy’ strategies increased and relevant costs decreased. Results of the changes in the sensitivity and specificity of flexible cystoscopy are presented in Table 44 and, as this table shows, the strategies involving flexible cystoscopy generally become more likely to be considered cost-effective as its diagnostic performance increases. Nonetheless, at perhaps the most plausible increase of 5% in sensitivity and specificity for flexible cystoscopy compared with those of WLC the probabilities that strategies involving flexible cystoscopy are cost-effective are not greatly changed. The CEACs for these sensitivity analyses are shown in Appendix 21.
Relative risk rate of progression of bladder cancer comparing no treatment with treatment
In the sensitivity analysis the speed of progression and rate of mortality for those falsely diagnosed as negative and hence not treated were altered. As might be expected, reducing these rates would decrease the cost-effectiveness of those strategies associated with fewer false negatives. Hence, the probability that CTL_WLC (CTL_WLC) would be considered cost-effective increased from 18% in the base-case analysis (RR 2.56) to 28% when the RR was 1 and society’s willingness to pay for a life-year was £20,000 (Table 45). The CEACs for these sensitivity analyses are shown in Appendix 22.
Relative risk rate of recurrence and progression comparing PDD with WLCAs indicated in Chapter 4, PDD is more likely to reduce the recurrence and progression of bladder cancer, decreasing these rates, and would therefore increase the cost-effectiveness of strategies associated with it. FISH_PDD (FISH_WLC) had an increased probability of being considered cost-effective when the RRs of recurrence and progression were decreased to 0.64 and 0.56 respectively (Tables 46 and 47 respectively). The CEACs for these sensitivity analyses are shown in Appendices 23 and 24 respectively.
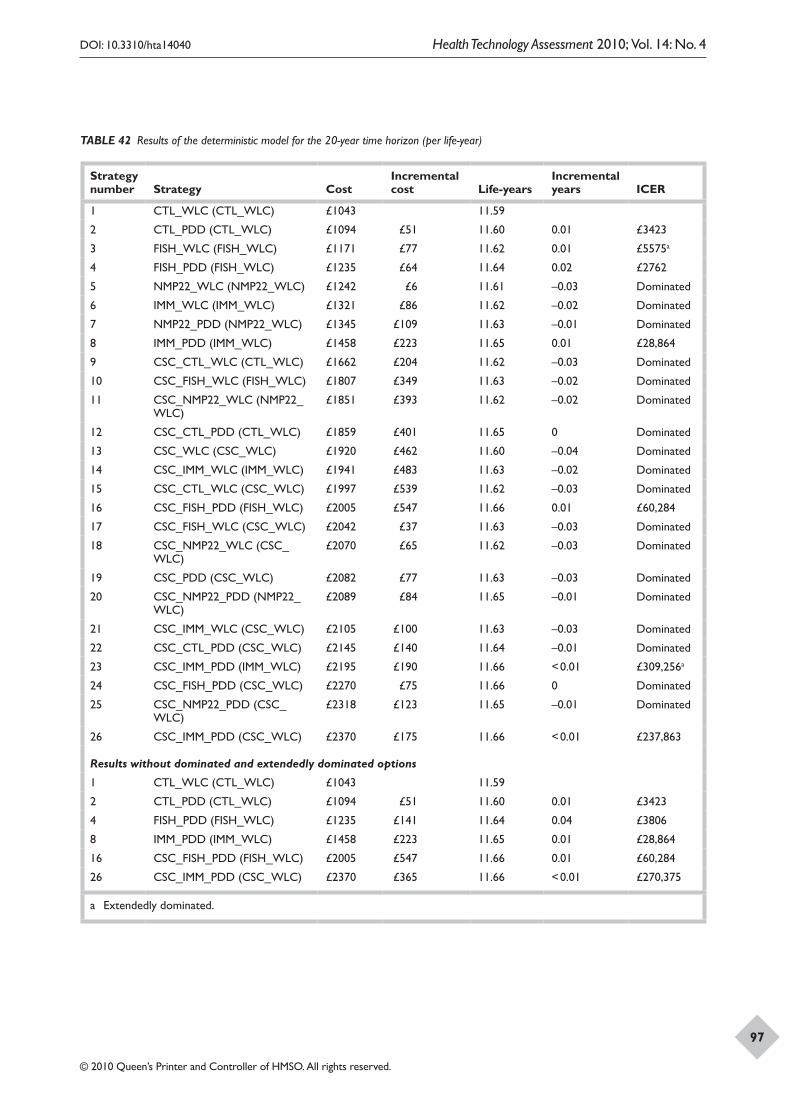
DOI: 10.3310/hta14040 Health Technology Assessment 2010; Vol. 14: No. 4
© 2010 Queen’s Printer and Controller of HMSO. All rights reserved.
97
TABLE 42 Results of the deterministic model for the 20-year time horizon (per life-year)
Strategy number Strategy Cost
Incremental cost Life-years
Incremental years ICER
1 CTL_WLC (CTL_WLC) £1043 11.59
2 CTL_PDD (CTL_WLC) £1094 £51 11.60 0.01 £3423
3 FISH_WLC (FISH_WLC) £1171 £77 11.62 0.01 £5575a
4 FISH_PDD (FISH_WLC) £1235 £64 11.64 0.02 £2762
5 NMP22_WLC (NMP22_WLC) £1242 £6 11.61 –0.03 Dominated
6 IMM_WLC (IMM_WLC) £1321 £86 11.62 –0.02 Dominated
7 NMP22_PDD (NMP22_WLC) £1345 £109 11.63 –0.01 Dominated
8 IMM_PDD (IMM_WLC) £1458 £223 11.65 0.01 £28,864
9 CSC_CTL_WLC (CTL_WLC) £1662 £204 11.62 –0.03 Dominated
10 CSC_FISH_WLC (FISH_WLC) £1807 £349 11.63 –0.02 Dominated
11 CSC_NMP22_WLC (NMP22_WLC)
£1851 £393 11.62 –0.02 Dominated
12 CSC_CTL_PDD (CTL_WLC) £1859 £401 11.65 0 Dominated
13 CSC_WLC (CSC_WLC) £1920 £462 11.60 –0.04 Dominated
14 CSC_IMM_WLC (IMM_WLC) £1941 £483 11.63 –0.02 Dominated
15 CSC_CTL_WLC (CSC_WLC) £1997 £539 11.62 –0.03 Dominated
16 CSC_FISH_PDD (FISH_WLC) £2005 £547 11.66 0.01 £60,284
17 CSC_FISH_WLC (CSC_WLC) £2042 £37 11.63 –0.03 Dominated
18 CSC_NMP22_WLC (CSC_WLC)
£2070 £65 11.62 –0.03 Dominated
19 CSC_PDD (CSC_WLC) £2082 £77 11.63 –0.03 Dominated
20 CSC_NMP22_PDD (NMP22_WLC)
£2089 £84 11.65 –0.01 Dominated
21 CSC_IMM_WLC (CSC_WLC) £2105 £100 11.63 –0.03 Dominated
22 CSC_CTL_PDD (CSC_WLC) £2145 £140 11.64 –0.01 Dominated
23 CSC_IMM_PDD (IMM_WLC) £2195 £190 11.66 < 0.01 £309,256a
24 CSC_FISH_PDD (CSC_WLC) £2270 £75 11.66 0 Dominated
25 CSC_NMP22_PDD (CSC_WLC)
£2318 £123 11.65 –0.01 Dominated
26 CSC_IMM_PDD (CSC_WLC) £2370 £175 11.66 < 0.01 £237,863
Results without dominated and extendedly dominated options
1 CTL_WLC (CTL_WLC) £1043 11.59
2 CTL_PDD (CTL_WLC) £1094 £51 11.60 0.01 £3423
4 FISH_PDD (FISH_WLC) £1235 £141 11.64 0.04 £3806
8 IMM_PDD (IMM_WLC) £1458 £223 11.65 0.01 £28,864
16 CSC_FISH_PDD (FISH_WLC) £2005 £547 11.66 0.01 £60,284
26 CSC_IMM_PDD (CSC_WLC) £2370 £365 11.66 < 0.01 £270,375
a Extendedly dominated.
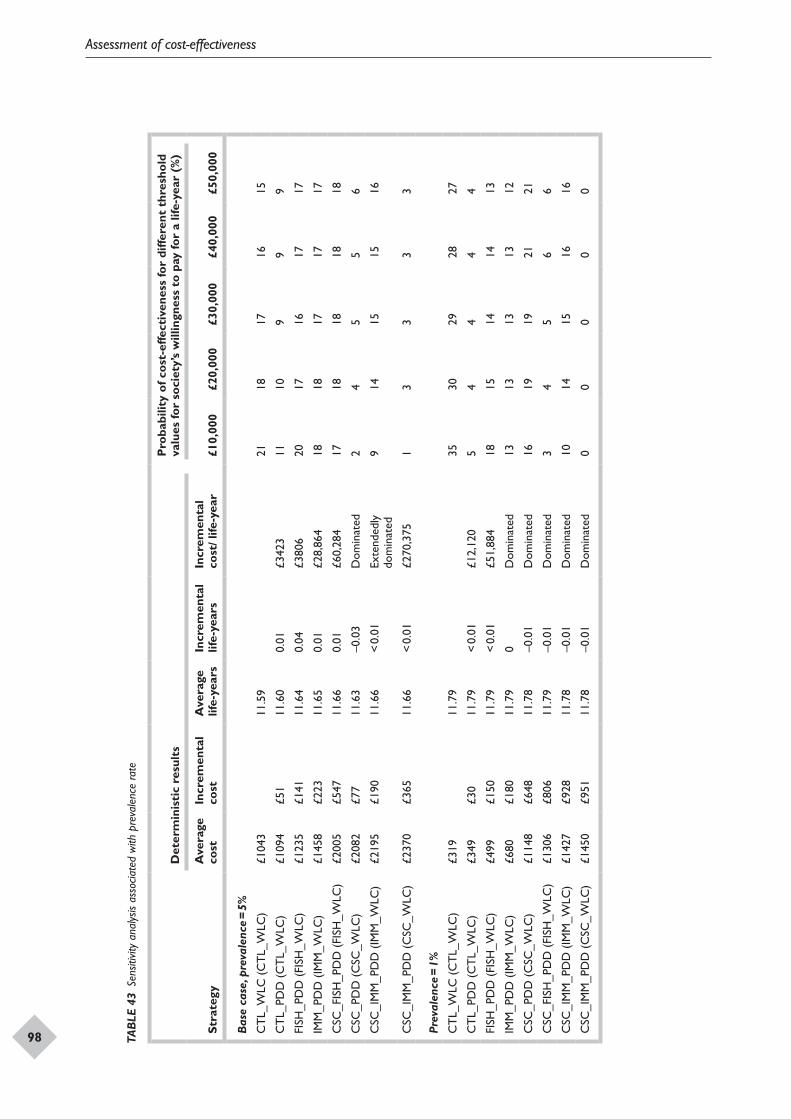
Assessment of cost-effectiveness
98 TAB
LE 4
3 Se
nsiti
vity
anal
ysis
asso
ciate
d w
ith p
reva
lenc
e ra
te
Stra
tegy
Det
erm
inis
tic
resu
lts
Pro
babi
lity
of c
ost-
effe
ctiv
enes
s fo
r di
ffere
nt t
hres
hold
va
lues
for
soci
ety’
s w
illin
gnes
s to
pay
for
a lif
e-ye
ar (
%)
Ave
rage
co
stIn
crem
enta
l co
stA
vera
ge
life-
year
sIn
crem
enta
l lif
e-ye
ars
Incr
emen
tal
cost
/ life
-yea
r£1
0,00
0£2
0,00
0£3
0,00
0£4
0,00
0£5
0,00
0
Bas
e ca
se, p
reva
lenc
e =
5%
CT
L_W
LC (
CT
L_W
LC)
£104
311
.59
2118
1716
15
CT
L_PD
D (
CT
L_W
LC)
£109
4£5
111
.60
0.01
£342
311
109
99
FISH
_PD
D (
FISH
_WLC
)£1
235
£141
11.6
40.
04£3
806
2017
1617
17
IMM
_PD
D (
IMM
_WLC
)£1
458
£223
11.6
50.
01£2
8,86
418
1817
1717
CSC
_FIS
H_P
DD
(FI
SH_W
LC)
£200
5£5
4711
.66
0.01
£60,
284
1718
1818
18
CSC
_PD
D (
CSC
_WLC
)£2
082
£77
11.6
3–0
.03
Dom
inat
ed2
45
56
CSC
_IM
M_P
DD
(IM
M_W
LC)
£219
5£1
9011
.66
< 0.
01Ex
tend
edly
do
min
ated
914
1515
16
CSC
_IM
M_P
DD
(C
SC_W
LC)
£237
0£3
6511
.66
< 0.
01£2
70,3
751
33
33
Prev
alen
ce =
1%
CT
L_W
LC (
CT
L_W
LC)
£319
11.7
935
3029
2827
CT
L_PD
D (
CT
L_W
LC)
£349
£30
11.7
9<
0.01
£12,
120
54
44
4
FISH
_PD
D (
FISH
_WLC
)£4
99£1
5011
.79
< 0.
01£5
1,88
418
1514
1413
IMM
_PD
D (
IMM
_WLC
)£6
80£1
8011
.79
0D
omin
ated
1313
1313
12
CSC
_PD
D (
CSC
_WLC
)£1
148
£648
11.7
8–0
.01
Dom
inat
ed16
1919
2121
CSC
_FIS
H_P
DD
(FI
SH_W
LC)
£130
6£8
0611
.79
–0.0
1D
omin
ated
34
56
6
CSC
_IM
M_P
DD
(IM
M_W
LC)
£142
7£9
2811
.78
–0.0
1D
omin
ated
1014
1516
16
CSC
_IM
M_P
DD
(C
SC_W
LC)
£145
0£9
5111
.78
–0.0
1D
omin
ated
00
00
0
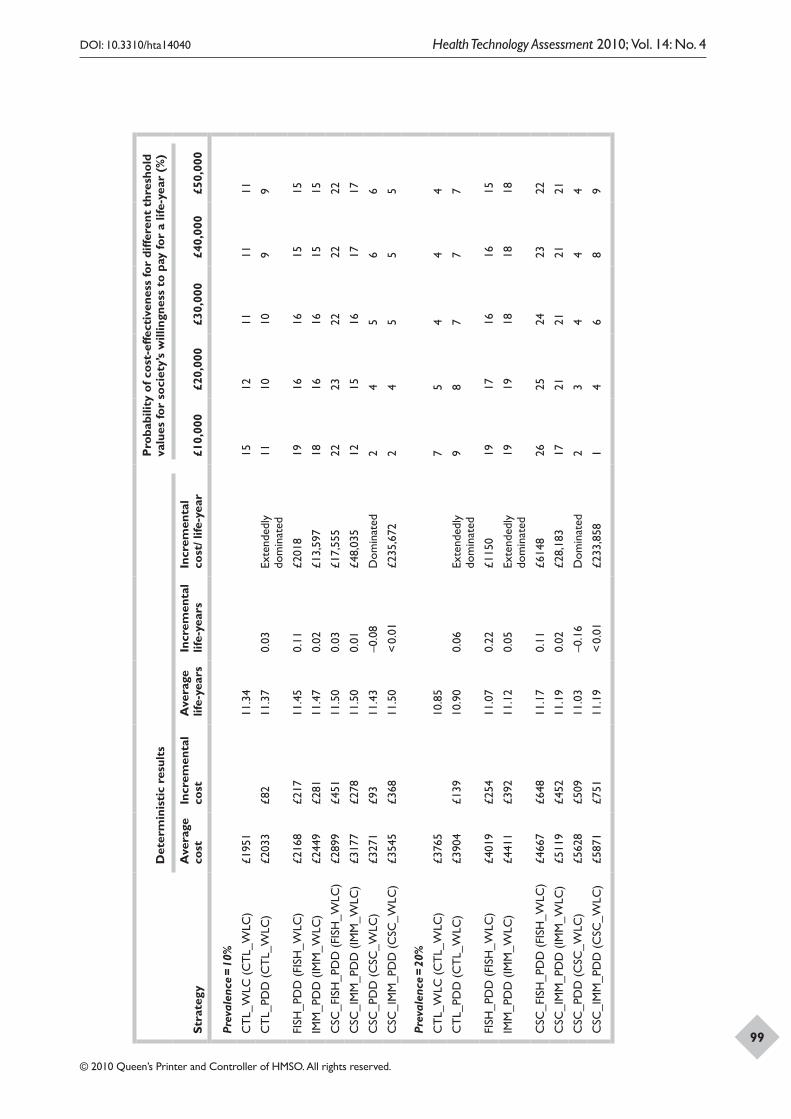
DOI: 10.3310/hta14040 Health Technology Assessment 2010; Vol. 14: No. 4
© 2010 Queen’s Printer and Controller of HMSO. All rights reserved.
99Stra
tegy
Det
erm
inis
tic
resu
lts
Pro
babi
lity
of c
ost-
effe
ctiv
enes
s fo
r di
ffere
nt t
hres
hold
va
lues
for
soci
ety’
s w
illin
gnes
s to
pay
for
a lif
e-ye
ar (
%)
Ave
rage
co
stIn
crem
enta
l co
stA
vera
ge
life-
year
sIn
crem
enta
l lif
e-ye
ars
Incr
emen
tal
cost
/ life
-yea
r£1
0,00
0£2
0,00
0£3
0,00
0£4
0,00
0£5
0,00
0
Prev
alen
ce =
10%
CT
L_W
LC (
CT
L_W
LC)
£195
111
.34
1512
1111
11
CT
L_PD
D (
CT
L_W
LC)
£203
3£8
211
.37
0.03
Exte
nded
ly
dom
inat
ed11
1010
99
FISH
_PD
D (
FISH
_WLC
)£2
168
£217
11.4
50.
11£2
018
1916
1615
15
IMM
_PD
D (
IMM
_WLC
)£2
449
£281
11.4
70.
02£1
3,59
718
1616
1515
CSC
_FIS
H_P
DD
(FI
SH_W
LC)
£289
9£4
5111
.50
0.03
£17,
555
2223
2222
22
CSC
_IM
M_P
DD
(IM
M_W
LC)
£317
7£2
7811
.50
0.01
£48,
035
1215
1617
17
CSC
_PD
D (
CSC
_WLC
)£3
271
£93
11.4
3–0
.08
Dom
inat
ed2
45
66
CSC
_IM
M_P
DD
(C
SC_W
LC)
£354
5£3
6811
.50
< 0.
01£2
35,6
722
45
55
Prev
alen
ce =
20%
CT
L_W
LC (
CT
L_W
LC)
£376
510
.85
75
44
4
CT
L_PD
D (
CT
L_W
LC)
£390
4£1
3910
.90
0.06
Exte
nded
ly
dom
inat
ed9
87
77
FISH
_PD
D (
FISH
_WLC
)£4
019
£254
11.0
70.
22£1
150
1917
1616
15
IMM
_PD
D (
IMM
_WLC
)£4
411
£392
11.1
20.
05Ex
tend
edly
do
min
ated
1919
1818
18
CSC
_FIS
H_P
DD
(FI
SH_W
LC)
£466
7£6
4811
.17
0.11
£614
826
2524
2322
CSC
_IM
M_P
DD
(IM
M_W
LC)
£511
9£4
5211
.19
0.02
£28,
183
1721
2121
21
CSC
_PD
D (
CSC
_WLC
)£5
628
£509
11.0
3–0
.16
Dom
inat
ed2
34
44
CSC
_IM
M_P
DD
(C
SC_W
LC)
£587
1£7
5111
.19
< 0.
01£2
33,8
581
46
89
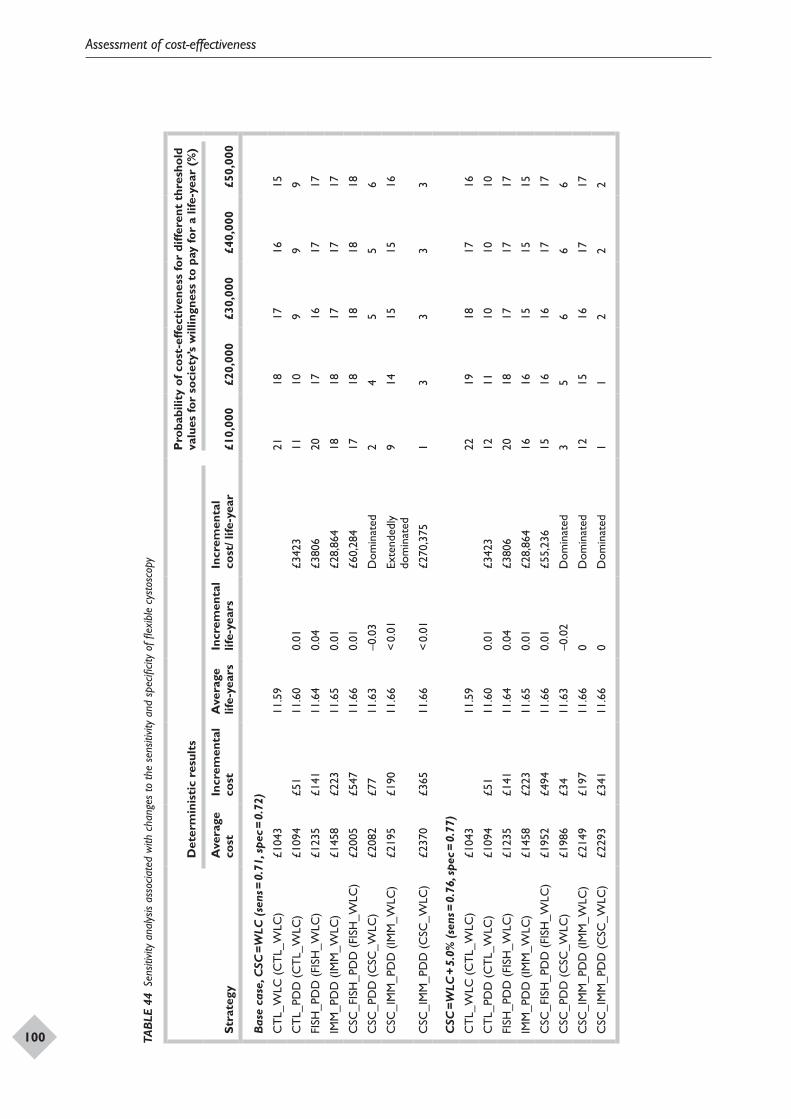
Assessment of cost-effectiveness
100 TAB
LE 4
4 Se
nsiti
vity
anal
ysis
asso
ciate
d w
ith c
hang
es to
the
sens
itivit
y an
d sp
ecifi
city
of fl
exib
le c
ysto
scop
y
Stra
tegy
Det
erm
inis
tic
resu
lts
Pro
babi
lity
of c
ost-
effe
ctiv
enes
s fo
r di
ffere
nt t
hres
hold
va
lues
for
soci
ety’
s w
illin
gnes
s to
pay
for
a lif
e-ye
ar (
%)
Ave
rage
co
stIn
crem
enta
l co
stA
vera
ge
life-
year
sIn
crem
enta
l lif
e-ye
ars
Incr
emen
tal
cost
/ life
-yea
r£1
0,00
0£2
0,00
0£3
0,00
0£4
0,00
0£5
0,00
0
Bas
e ca
se, C
SC =
WLC
(se
ns =
0.7
1, s
pec =
0.7
2)
CT
L_W
LC (
CT
L_W
LC)
£104
311
.59
2118
1716
15
CT
L_PD
D (
CT
L_W
LC)
£109
4£5
111
.60
0.01
£342
311
109
99
FISH
_PD
D (
FISH
_WLC
)£1
235
£141
11.6
40.
04£3
806
2017
1617
17
IMM
_PD
D (
IMM
_WLC
)£1
458
£223
11.6
50.
01£2
8,86
418
1817
1717
CSC
_FIS
H_P
DD
(FI
SH_W
LC)
£200
5£5
4711
.66
0.01
£60,
284
1718
1818
18
CSC
_PD
D (
CSC
_WLC
)£2
082
£77
11.6
3–0
.03
Dom
inat
ed2
45
56
CSC
_IM
M_P
DD
(IM
M_W
LC)
£219
5£1
9011
.66
< 0.
01Ex
tend
edly
do
min
ated
914
1515
16
CSC
_IM
M_P
DD
(C
SC_W
LC)
£237
0£3
6511
.66
< 0.
01£2
70,3
751
33
33
CSC
= W
LC +
5.0
% (
sens
= 0
.76,
spe
c = 0
.77)
CT
L_W
LC (
CT
L_W
LC)
£104
311
.59
2219
1817
16
CT
L_PD
D (
CT
L_W
LC)
£109
4£5
111
.60
0.01
£342
312
1110
1010
FISH
_PD
D (
FISH
_WLC
)£1
235
£141
11.6
40.
04£3
806
2018
1717
17
IMM
_PD
D (
IMM
_WLC
)£1
458
£223
11.6
50.
01£2
8,86
416
1615
1515
CSC
_FIS
H_P
DD
(FI
SH_W
LC)
£195
2£4
9411
.66
0.01
£55,
236
1516
1617
17
CSC
_PD
D (
CSC
_WLC
)£1
986
£34
11.6
3–0
.02
Dom
inat
ed3
56
66
CSC
_IM
M_P
DD
(IM
M_W
LC)
£214
9£1
9711
.66
0D
omin
ated
1215
1617
17
CSC
_IM
M_P
DD
(C
SC_W
LC)
£229
3£3
4111
.66
0D
omin
ated
11
22
2
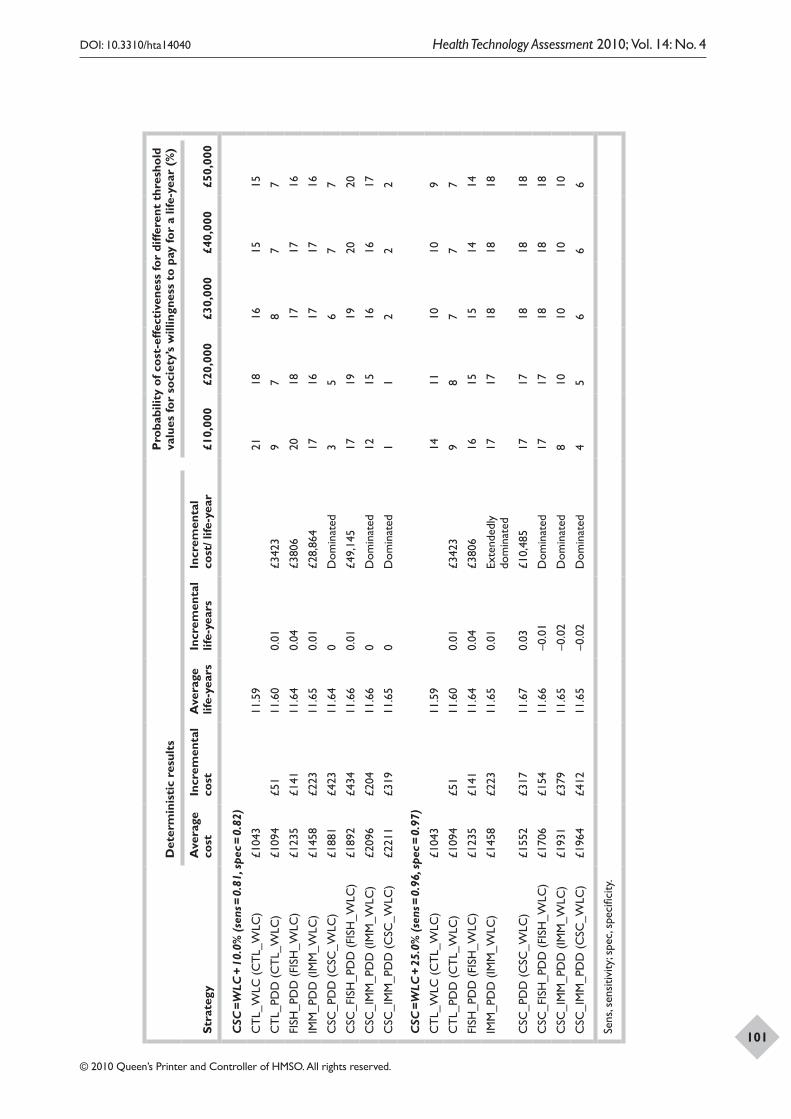
DOI: 10.3310/hta14040 Health Technology Assessment 2010; Vol. 14: No. 4
© 2010 Queen’s Printer and Controller of HMSO. All rights reserved.
101Stra
tegy
Det
erm
inis
tic
resu
lts
Pro
babi
lity
of c
ost-
effe
ctiv
enes
s fo
r di
ffere
nt t
hres
hold
va
lues
for
soci
ety’
s w
illin
gnes
s to
pay
for
a lif
e-ye
ar (
%)
Ave
rage
co
stIn
crem
enta
l co
stA
vera
ge
life-
year
sIn
crem
enta
l lif
e-ye
ars
Incr
emen
tal
cost
/ life
-yea
r£1
0,00
0£2
0,00
0£3
0,00
0£4
0,00
0£5
0,00
0
CSC
= W
LC +
10.
0% (
sens
= 0
.81,
spe
c = 0
.82)
CT
L_W
LC (
CT
L_W
LC)
£104
311
.59
2118
1615
15
CT
L_PD
D (
CT
L_W
LC)
£109
4£5
111
.60
0.01
£342
39
78
77
FISH
_PD
D (
FISH
_WLC
)£1
235
£141
11.6
40.
04£3
806
2018
1717
16
IMM
_PD
D (
IMM
_WLC
)£1
458
£223
11.6
50.
01£2
8,86
417
1617
1716
CSC
_PD
D (
CSC
_WLC
)£1
881
£423
11.6
40
Dom
inat
ed3
56
77
CSC
_FIS
H_P
DD
(FI
SH_W
LC)
£189
2£4
3411
.66
0.01
£49,
145
1719
1920
20
CSC
_IM
M_P
DD
(IM
M_W
LC)
£209
6£2
0411
.66
0D
omin
ated
1215
1616
17
CSC
_IM
M_P
DD
(C
SC_W
LC)
£221
1£3
1911
.65
0D
omin
ated
11
22
2
CSC
= W
LC +
25.
0% (
sens
= 0
.96,
spe
c = 0
.97)
CT
L_W
LC (
CT
L_W
LC)
£104
311
.59
1411
1010
9
CT
L_PD
D (
CT
L_W
LC)
£109
4£5
111
.60
0.01
£342
39
87
77
FISH
_PD
D (
FISH
_WLC
)£1
235
£141
11.6
40.
04£3
806
1615
1514
14
IMM
_PD
D (
IMM
_WLC
)£1
458
£223
11.6
50.
01Ex
tend
edly
do
min
ated
1717
1818
18
CSC
_PD
D (
CSC
_WLC
)£1
552
£317
11.6
70.
03£1
0,48
517
1718
1818
CSC
_FIS
H_P
DD
(FI
SH_W
LC)
£170
6£1
5411
.66
–0.0
1D
omin
ated
1717
1818
18
CSC
_IM
M_P
DD
(IM
M_W
LC)
£193
1£3
7911
.65
–0.0
2D
omin
ated
810
1010
10
CSC
_IM
M_P
DD
(C
SC_W
LC)
£196
4£4
1211
.65
–0.0
2D
omin
ated
45
66
6
Sens
, sen
sitiv
ity; s
pec,
spec
ifici
ty.
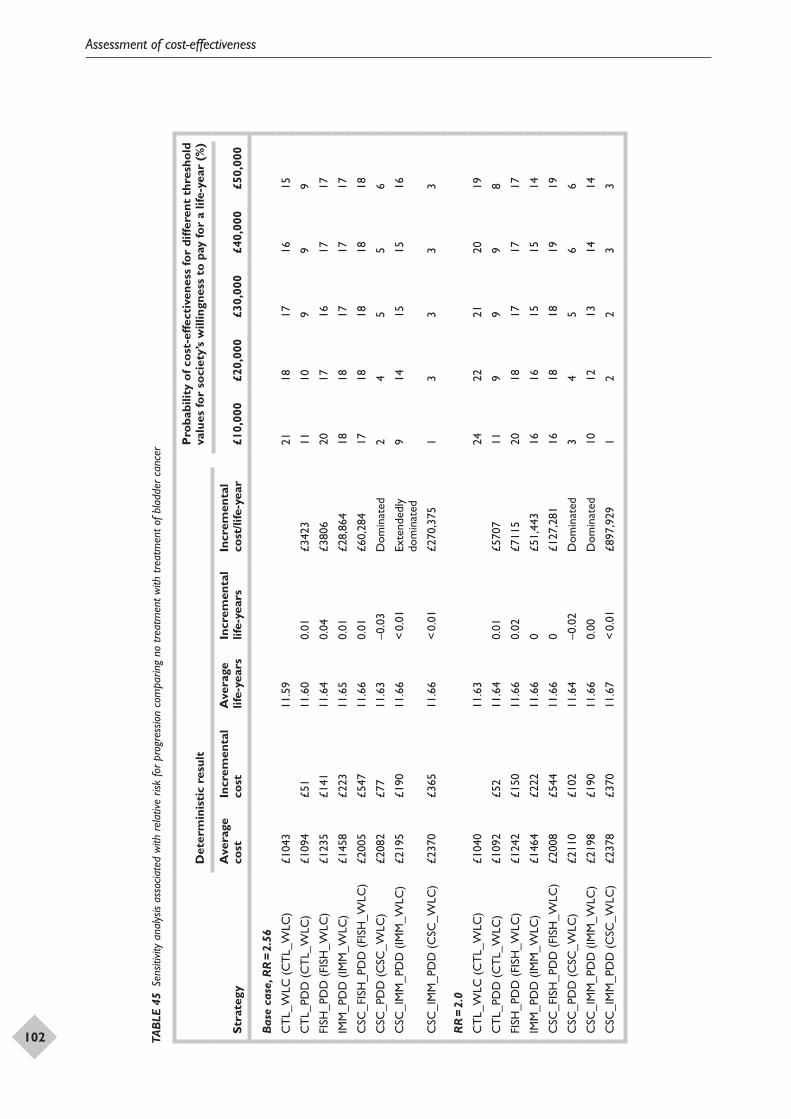
Assessment of cost-effectiveness
102 TAB
LE 4
5 Se
nsiti
vity
anal
ysis
asso
ciate
d w
ith re
lativ
e ris
k fo
r pro
gres
sion
com
parin
g no
trea
tmen
t with
trea
tmen
t of b
ladd
er c
ance
r
Stra
tegy
Det
erm
inis
tic
resu
lt
Pro
babi
lity
of c
ost-
effe
ctiv
enes
s fo
r di
ffere
nt t
hres
hold
va
lues
for
soci
ety’
s w
illin
gnes
s to
pay
for
a lif
e-ye
ar (
%)
Ave
rage
co
stIn
crem
enta
l co
stA
vera
ge
life-
year
sIn
crem
enta
l lif
e-ye
ars
Incr
emen
tal
cost
/life
-yea
r£1
0,00
0£2
0,00
0£3
0,00
0£4
0,00
0£5
0,00
0
Bas
e ca
se, R
R =
2.5
6
CT
L_W
LC (
CT
L_W
LC)
£104
311
.59
2118
1716
15
CT
L_PD
D (
CT
L_W
LC)
£109
4£5
111
.60
0.01
£342
311
109
99
FISH
_PD
D (
FISH
_WLC
)£1
235
£141
11.6
40.
04£3
806
2017
1617
17
IMM
_PD
D (
IMM
_WLC
)£1
458
£223
11.6
50.
01£2
8,86
418
1817
1717
CSC
_FIS
H_P
DD
(FI
SH_W
LC)
£200
5£5
4711
.66
0.01
£60,
284
1718
1818
18
CSC
_PD
D (
CSC
_WLC
)£2
082
£77
11.6
3–0
.03
Dom
inat
ed2
45
56
CSC
_IM
M_P
DD
(IM
M_W
LC)
£219
5£1
9011
.66
< 0.
01Ex
tend
edly
do
min
ated
914
1515
16
CSC
_IM
M_P
DD
(C
SC_W
LC)
£237
0£3
6511
.66
< 0.
01£2
70,3
751
33
33
RR
= 2
.0
CT
L_W
LC (
CT
L_W
LC)
£104
011
.63
2422
2120
19
CT
L_PD
D (
CT
L_W
LC)
£109
2£5
211
.64
0.01
£570
711
99
98
FISH
_PD
D (
FISH
_WLC
)£1
242
£150
11.6
60.
02£7
115
2018
1717
17
IMM
_PD
D (
IMM
_WLC
)£1
464
£222
11.6
60
£51,
443
1616
1515
14
CSC
_FIS
H_P
DD
(FI
SH_W
LC)
£200
8£5
4411
.66
0£1
27,2
8116
1818
1919
CSC
_PD
D (
CSC
_WLC
)£2
110
£102
11.6
4–0
.02
Dom
inat
ed3
45
66
CSC
_IM
M_P
DD
(IM
M_W
LC)
£219
8£1
9011
.66
0.00
Dom
inat
ed10
1213
1414
CSC
_IM
M_P
DD
(C
SC_W
LC)
£237
8£3
7011
.67
< 0.
01£8
97,9
291
22
33
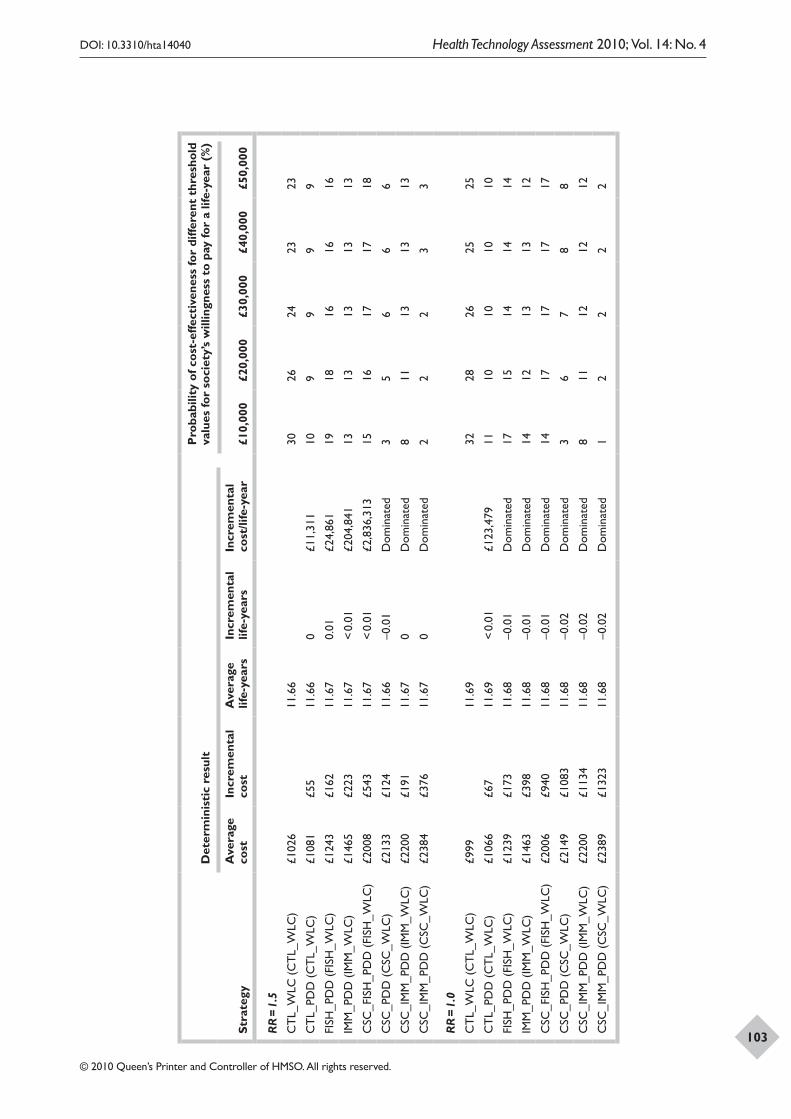
DOI: 10.3310/hta14040 Health Technology Assessment 2010; Vol. 14: No. 4
© 2010 Queen’s Printer and Controller of HMSO. All rights reserved.
103Stra
tegy
Det
erm
inis
tic
resu
lt
Pro
babi
lity
of c
ost-
effe
ctiv
enes
s fo
r di
ffere
nt t
hres
hold
va
lues
for
soci
ety’
s w
illin
gnes
s to
pay
for
a lif
e-ye
ar (
%)
Ave
rage
co
stIn
crem
enta
l co
stA
vera
ge
life-
year
sIn
crem
enta
l lif
e-ye
ars
Incr
emen
tal
cost
/life
-yea
r£1
0,00
0£2
0,00
0£3
0,00
0£4
0,00
0£5
0,00
0
RR
= 1
.5
CT
L_W
LC (
CT
L_W
LC)
£102
611
.66
3026
2423
23
CT
L_PD
D (
CT
L_W
LC)
£108
1£5
511
.66
0£1
1,31
110
99
99
FISH
_PD
D (
FISH
_WLC
)£1
243
£162
11.6
70.
01£2
4,86
119
1816
1616
IMM
_PD
D (
IMM
_WLC
)£1
465
£223
11.6
7<
0.01
£204
,841
1313
1313
13
CSC
_FIS
H_P
DD
(FI
SH_W
LC)
£200
8£5
4311
.67
< 0.
01£2
,836
,313
1516
1717
18
CSC
_PD
D (
CSC
_WLC
)£2
133
£124
11.6
6–0
.01
Dom
inat
ed3
56
66
CSC
_IM
M_P
DD
(IM
M_W
LC)
£220
0£1
9111
.67
0D
omin
ated
811
1313
13
CSC
_IM
M_P
DD
(C
SC_W
LC)
£238
4£3
7611
.67
0D
omin
ated
22
23
3
RR
= 1
.0
CT
L_W
LC (
CT
L_W
LC)
£999
11.6
932
2826
2525
CT
L_PD
D (
CT
L_W
LC)
£106
6£6
711
.69
< 0.
01£1
23,4
7911
1010
1010
FISH
_PD
D (
FISH
_WLC
)£1
239
£173
11.6
8–0
.01
Dom
inat
ed17
1514
1414
IMM
_PD
D (
IMM
_WLC
)£1
463
£398
11.6
8–0
.01
Dom
inat
ed14
1213
1312
CSC
_FIS
H_P
DD
(FI
SH_W
LC)
£200
6£9
4011
.68
–0.0
1D
omin
ated
1417
1717
17
CSC
_PD
D (
CSC
_WLC
)£2
149
£108
311
.68
–0.0
2D
omin
ated
36
78
8
CSC
_IM
M_P
DD
(IM
M_W
LC)
£220
0£1
134
11.6
8–0
.02
Dom
inat
ed8
1112
1212
CSC
_IM
M_P
DD
(C
SC_W
LC)
£238
9£1
323
11.6
8–0
.02
Dom
inat
ed1
22
22
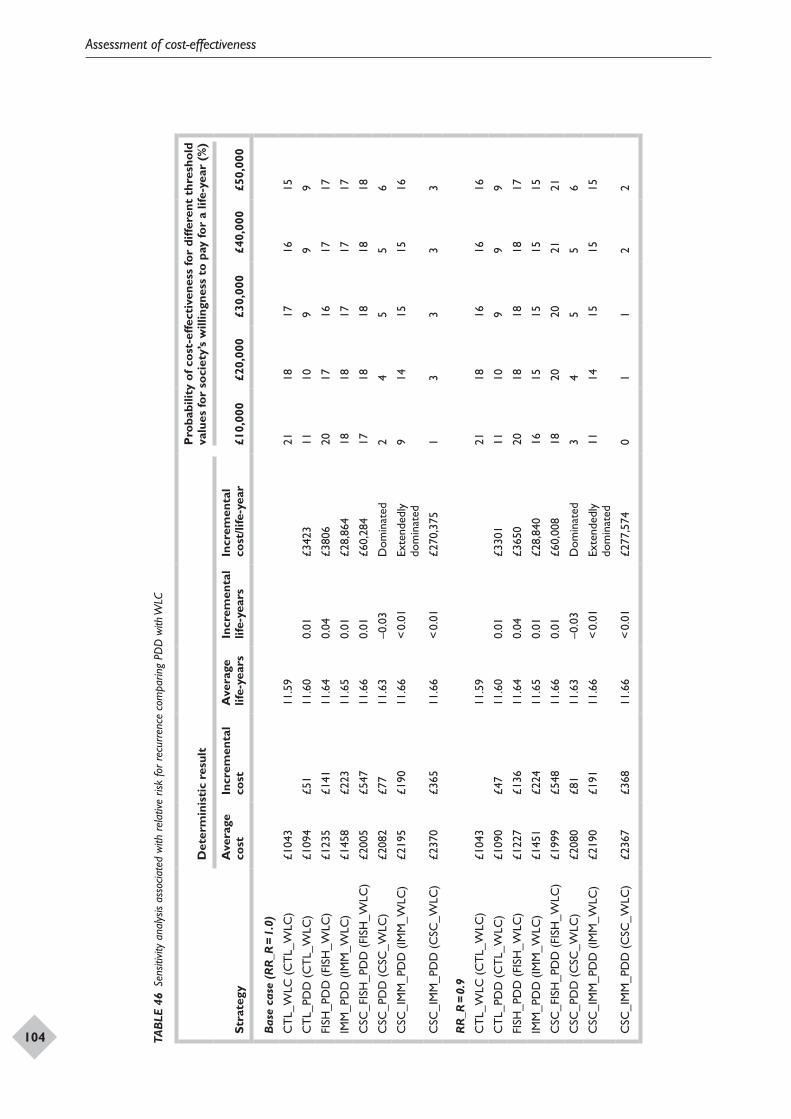
Assessment of cost-effectiveness
104 TAB
LE 4
6 Se
nsiti
vity
anal
ysis
asso
ciate
d w
ith re
lativ
e ris
k fo
r rec
urre
nce
com
parin
g PD
D w
ith W
LC
Stra
tegy
Det
erm
inis
tic
resu
lt
Pro
babi
lity
of c
ost-
effe
ctiv
enes
s fo
r di
ffere
nt t
hres
hold
va
lues
for
soci
ety’
s w
illin
gnes
s to
pay
for
a lif
e-ye
ar (
%)
Ave
rage
co
stIn
crem
enta
l co
stA
vera
ge
life-
year
sIn
crem
enta
l lif
e-ye
ars
Incr
emen
tal
cost
/life
-yea
r£1
0,00
0£2
0,00
0£3
0,00
0£4
0,00
0£5
0,00
0
Bas
e ca
se (
RR
_R =
1.0
)
CT
L_W
LC (
CT
L_W
LC)
£104
311
.59
2118
1716
15
CT
L_PD
D (
CT
L_W
LC)
£109
4£5
111
.60
0.01
£342
311
109
99
FISH
_PD
D (
FISH
_WLC
)£1
235
£141
11.6
40.
04£3
806
2017
1617
17
IMM
_PD
D (
IMM
_WLC
)£1
458
£223
11.6
50.
01£2
8,86
418
1817
1717
CSC
_FIS
H_P
DD
(FI
SH_W
LC)
£200
5£5
4711
.66
0.01
£60,
284
1718
1818
18
CSC
_PD
D (
CSC
_WLC
)£2
082
£77
11.6
3–0
.03
Dom
inat
ed2
45
56
CSC
_IM
M_P
DD
(IM
M_W
LC)
£219
5£1
9011
.66
< 0.
01Ex
tend
edly
do
min
ated
914
1515
16
CSC
_IM
M_P
DD
(C
SC_W
LC)
£237
0£3
6511
.66
< 0.
01£2
70,3
751
33
33
RR
_R =
0.9
CT
L_W
LC (
CT
L_W
LC)
£104
311
.59
2118
1616
16
CT
L_PD
D (
CT
L_W
LC)
£109
0£4
711
.60
0.01
£330
111
109
99
FISH
_PD
D (
FISH
_WLC
)£1
227
£136
11.6
40.
04£3
650
2018
1818
17
IMM
_PD
D (
IMM
_WLC
)£1
451
£224
11.6
50.
01£2
8,84
016
1515
1515
CSC
_FIS
H_P
DD
(FI
SH_W
LC)
£199
9£5
4811
.66
0.01
£60,
008
1820
2021
21
CSC
_PD
D (
CSC
_WLC
)£2
080
£81
11.6
3–0
.03
Dom
inat
ed3
45
56
CSC
_IM
M_P
DD
(IM
M_W
LC)
£219
0£1
9111
.66
< 0.
01Ex
tend
edly
do
min
ated
1114
1515
15
CSC
_IM
M_P
DD
(C
SC_W
LC)
£236
7£3
6811
.66
< 0.
01£2
77,5
740
11
22
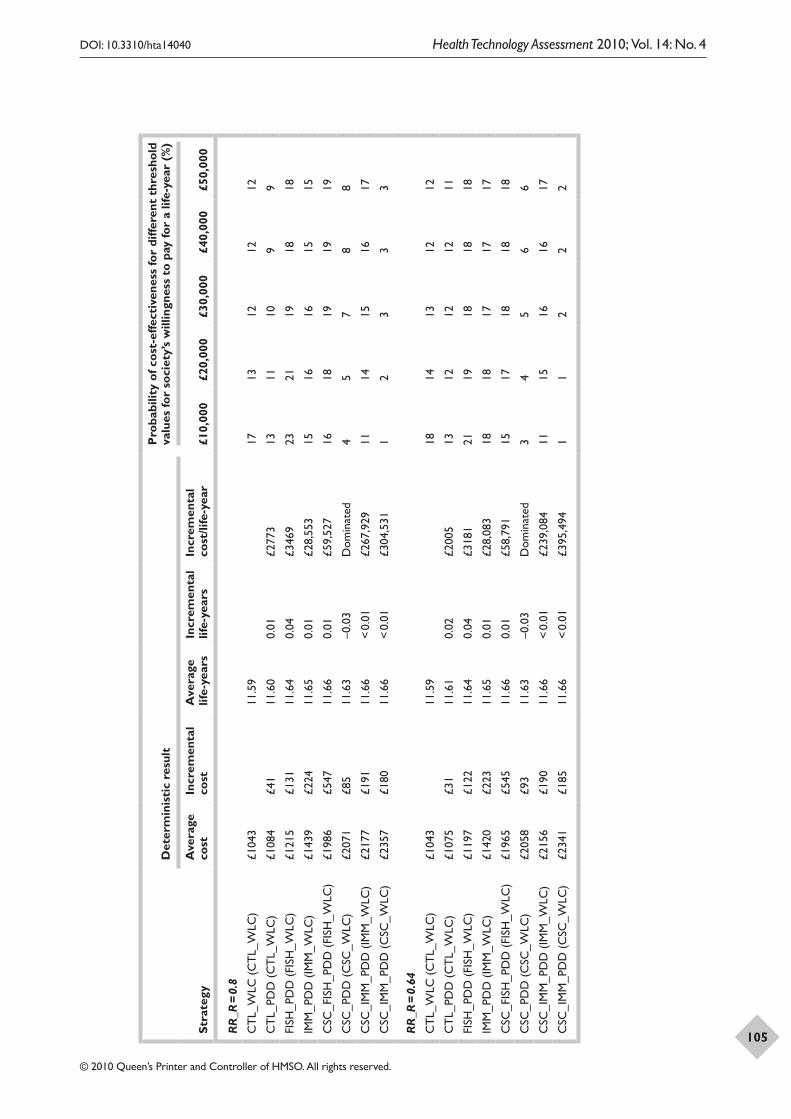
DOI: 10.3310/hta14040 Health Technology Assessment 2010; Vol. 14: No. 4
© 2010 Queen’s Printer and Controller of HMSO. All rights reserved.
105Stra
tegy
Det
erm
inis
tic
resu
lt
Pro
babi
lity
of c
ost-
effe
ctiv
enes
s fo
r di
ffere
nt t
hres
hold
va
lues
for
soci
ety’
s w
illin
gnes
s to
pay
for
a lif
e-ye
ar (
%)
Ave
rage
co
stIn
crem
enta
l co
stA
vera
ge
life-
year
sIn
crem
enta
l lif
e-ye
ars
Incr
emen
tal
cost
/life
-yea
r£1
0,00
0£2
0,00
0£3
0,00
0£4
0,00
0£5
0,00
0
RR
_R =
0.8
CT
L_W
LC (
CT
L_W
LC)
£104
311
.59
1713
1212
12
CT
L_PD
D (
CT
L_W
LC)
£108
4£4
111
.60
0.01
£277
313
1110
99
FISH
_PD
D (
FISH
_WLC
)£1
215
£131
11.6
40.
04£3
469
2321
1918
18
IMM
_PD
D (
IMM
_WLC
)£1
439
£224
11.6
50.
01£2
8,55
315
1616
1515
CSC
_FIS
H_P
DD
(FI
SH_W
LC)
£198
6£5
4711
.66
0.01
£59,
527
1618
1919
19
CSC
_PD
D (
CSC
_WLC
)£2
071
£85
11.6
3–0
.03
Dom
inat
ed4
57
88
CSC
_IM
M_P
DD
(IM
M_W
LC)
£217
7£1
9111
.66
< 0.
01£2
67,9
2911
1415
1617
CSC
_IM
M_P
DD
(C
SC_W
LC)
£235
7£1
8011
.66
< 0.
01£3
04,5
311
23
33
RR
_R =
0.6
4
CT
L_W
LC (
CT
L_W
LC)
£104
311
.59
1814
1312
12
CT
L_PD
D (
CT
L_W
LC)
£107
5£3
111
.61
0.02
£200
513
1212
1211
FISH
_PD
D (
FISH
_WLC
)£1
197
£122
11.6
40.
04£3
181
2119
1818
18
IMM
_PD
D (
IMM
_WLC
)£1
420
£223
11.6
50.
01£2
8,08
318
1817
1717
CSC
_FIS
H_P
DD
(FI
SH_W
LC)
£196
5£5
4511
.66
0.01
£58,
791
1517
1818
18
CSC
_PD
D (
CSC
_WLC
)£2
058
£93
11.6
3–0
.03
Dom
inat
ed3
45
66
CSC
_IM
M_P
DD
(IM
M_W
LC)
£215
6£1
9011
.66
< 0.
01£2
39,0
8411
1516
1617
CSC
_IM
M_P
DD
(C
SC_W
LC)
£234
1£1
8511
.66
< 0.
01£3
95,4
941
12
22

Assessment of cost-effectiveness
106 TAB
LE 4
7 Se
nsiti
vity
anal
ysis
asso
ciate
d w
ith re
lativ
e ris
k fo
r pro
gres
sion
com
parin
g PD
D w
ith W
LC
Stra
tegy
Det
erm
inis
tic
resu
lt
Pro
babi
lity
of c
ost-
effe
ctiv
enes
s fo
r di
ffere
nt t
hres
hold
va
lues
for
soci
ety’
s w
illin
gnes
s to
pay
for
a lif
e-ye
ar (
%)
Ave
rage
co
stIn
crem
enta
l co
stA
vera
ge
life-
year
sIn
crem
enta
l lif
e-ye
ars
Incr
emen
tal
cost
/life
-yea
r£1
0,00
0£2
0,00
0£3
0,00
0£4
0,00
0£5
0,00
0
Bas
e ca
se (
RR
_P =
1.0
)
CT
L_W
LC (
CT
L_W
LC)
£104
311
.59
2118
1716
15
CT
L_PD
D (
CT
L_W
LC)
£109
4£5
111
.60
0.01
£342
311
109
99
FISH
_PD
D (
FISH
_WLC
)£1
235
£141
11.6
40.
04£3
806
2017
1617
17
IMM
_PD
D (
IMM
_WLC
)£1
458
£223
11.6
50.
01£2
8,86
418
1817
1717
CSC
_FIS
H_P
DD
(FI
SH_W
LC)
£200
5£5
4711
.66
0.01
£60,
284
1718
1818
18
CSC
_PD
D (
CSC
_WLC
)£2
082
£77
11.6
3–0
.03
Dom
inat
ed2
45
56
CSC
_IM
M_P
DD
(IM
M_W
LC)
£219
5£1
9011
.66
< 0.
01Ex
tend
edly
do
min
ated
914
1515
16
CSC
_IM
M_P
DD
(C
SC_W
LC)
£237
0£3
6511
.66
< 0.
01£2
70,3
751
33
33
RR
_P =
0.9
CT
L_W
LC (
CT
L_W
LC)
£104
311
.59
2016
1514
14
CT
L_PD
D (
CT
L_W
LC)
£109
5£5
111
.60
0.01
£369
712
109
99
FISH
_PD
D (
FISH
_WLC
)£1
236
£141
11.6
40.
04£3
797
2119
1919
19
IMM
_PD
D (
IMM
_WLC
)£1
460
£225
11.6
50.
01£2
9,12
315
1615
1514
CSC
_FIS
H_P
DD
(FI
SH_W
LC)
£200
9£5
4911
.66
0.01
£60,
273
1517
1818
19
CSC
_PD
D (
CSC
_WLC
)£2
086
£77
11.6
3–0
.03
Dom
inat
ed4
67
78
CSC
_IM
M_P
DD
(IM
M_W
LC)
£220
0£1
9111
.66
< 0.
01Ex
tend
edly
do
min
ated
1114
1515
16
CSC
_IM
M_P
DD
(C
SC_W
LC)
£237
6£3
6611
.66
< 0.
01£2
72,2
852
22
33
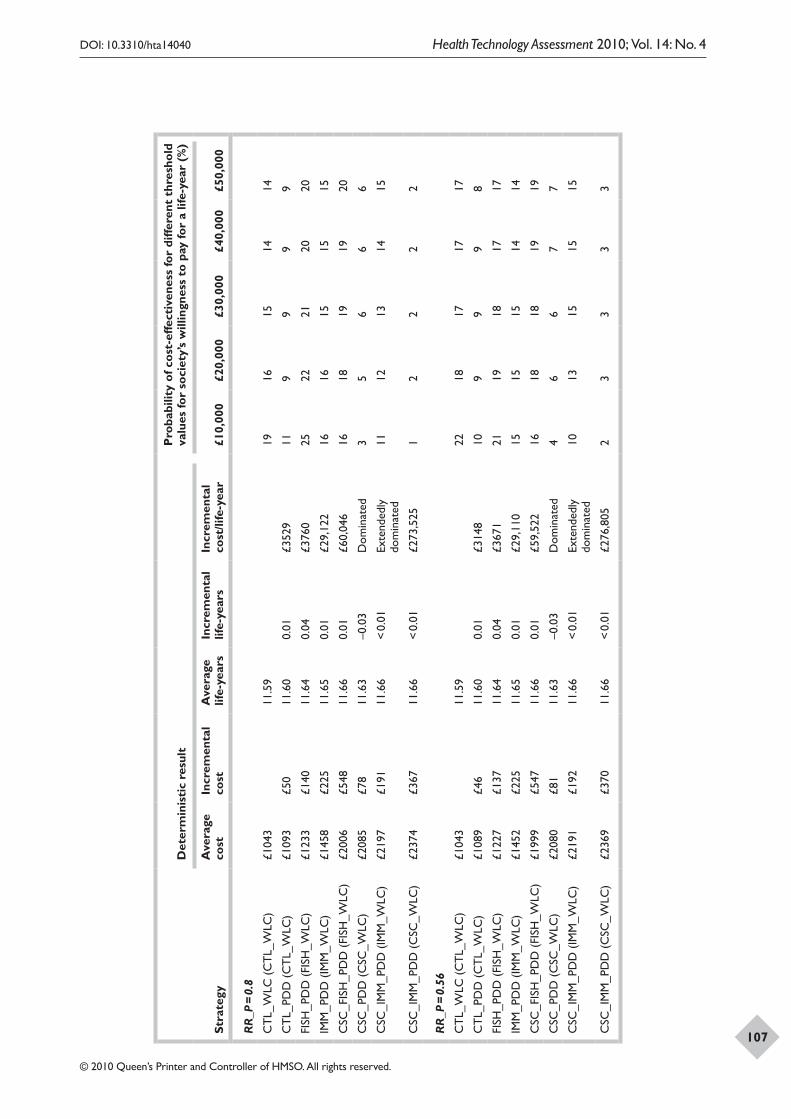
DOI: 10.3310/hta14040 Health Technology Assessment 2010; Vol. 14: No. 4
© 2010 Queen’s Printer and Controller of HMSO. All rights reserved.
107Stra
tegy
Det
erm
inis
tic
resu
lt
Pro
babi
lity
of c
ost-
effe
ctiv
enes
s fo
r di
ffere
nt t
hres
hold
va
lues
for
soci
ety’
s w
illin
gnes
s to
pay
for
a lif
e-ye
ar (
%)
Ave
rage
co
stIn
crem
enta
l co
stA
vera
ge
life-
year
sIn
crem
enta
l lif
e-ye
ars
Incr
emen
tal
cost
/life
-yea
r£1
0,00
0£2
0,00
0£3
0,00
0£4
0,00
0£5
0,00
0
RR
_P =
0.8
CT
L_W
LC (
CT
L_W
LC)
£104
311
.59
1916
1514
14
CT
L_PD
D (
CT
L_W
LC)
£109
3£5
011
.60
0.01
£352
911
99
99
FISH
_PD
D (
FISH
_WLC
)£1
233
£140
11.6
40.
04£3
760
2522
2120
20
IMM
_PD
D (
IMM
_WLC
)£1
458
£225
11.6
50.
01£2
9,12
216
1615
1515
CSC
_FIS
H_P
DD
(FI
SH_W
LC)
£200
6£5
4811
.66
0.01
£60,
046
1618
1919
20
CSC
_PD
D (
CSC
_WLC
)£2
085
£78
11.6
3–0
.03
Dom
inat
ed3
56
66
CSC
_IM
M_P
DD
(IM
M_W
LC)
£219
7£1
9111
.66
< 0.
01Ex
tend
edly
do
min
ated
1112
1314
15
CSC
_IM
M_P
DD
(C
SC_W
LC)
£237
4£3
6711
.66
< 0.
01£2
73,5
251
22
22
RR
_P =
0.5
6
CT
L_W
LC (
CT
L_W
LC)
£104
311
.59
2218
1717
17
CT
L_PD
D (
CT
L_W
LC)
£108
9£4
611
.60
0.01
£314
810
99
98
FISH
_PD
D (
FISH
_WLC
)£1
227
£137
11.6
40.
04£3
671
2119
1817
17
IMM
_PD
D (
IMM
_WLC
)£1
452
£225
11.6
50.
01£2
9,11
015
1515
1414
CSC
_FIS
H_P
DD
(FI
SH_W
LC)
£199
9£5
4711
.66
0.01
£59,
522
1618
1819
19
CSC
_PD
D (
CSC
_WLC
)£2
080
£81
11.6
3–0
.03
Dom
inat
ed4
66
77
CSC
_IM
M_P
DD
(IM
M_W
LC)
£219
1£1
9211
.66
< 0.
01Ex
tend
edly
do
min
ated
1013
1515
15
CSC
_IM
M_P
DD
(C
SC_W
LC)
£236
9£3
7011
.66
< 0.
01£2
76,8
052
33
33
Assessment of cost-effectiveness
108
Discount rate
Another sensitivity analysis was conducted by changing the discount rate. The cost-effectiveness of the different strategies did not markedly change when the discount rate was changed between 0% and 6% (Table 48). The CEACs for these sensitivity analyses are shown in Appendix 25.
Proportions in each prognostic risk group for non-muscle-invasive diseaseChanges to the proportions in each prognostic risk group for non-muscle-invasive disease were also considered (note that as the proportion in the low-risk group was increased, the proportion in the high-risk group decreased). The likelihood that CTL_WLC (CTL_WLC), IMM_PDD (IMM_WLC), FISH_PDD (FISH_WLC) or CSC_FISH_PDD (FISH_WLC) would be considered cost-effective did not change although some non-dominated or non-extendedly dominated strategies in the base-case analysis became dominated or extendedly dominated (Table 49). The CEACs for these sensitivity analyses are shown in Appendix 26.
Starting age of population and time horizonSensitivity analysis was used to investigate the effects of changing the starting age of the patient population or changing the number of years that the model was performed. None of these sensitivity analyses altered the likelihood of a given strategy being considered cost-effective (Table 50). However, as the time horizon was reduced, the incremental cost per life-year gained for each non-dominated strategy increased. This is because the majority of costs are incurred in earlier years but of course as the time horizon increases it is possible to gain more life-years. The CEACs for the sensitivity analyses are shown in Appendix 27.
Strategy used in follow-up and quality of life measuresThe final sensitivity analyses performed involved including the use of PDD in follow-up and conducting cost–utility analysis using the values reported in Table 38. The CEACs for these two sensitivity analyses are shown in Appendices 28 and 29 respectively. These results did not change much and there was no strategy that was likely to be considered the most cost-effective as shown in Table 51. It was noted that the strategies associated with flexible cystoscopy were dominated by others when using QoL measures.
Subgroup analyses
No subgroup analyses were conducted because of lack of relevant data.
Summary of results
The economic model presented in this chapter considered some strategies involving PDD, WLC, biomarkers, cytology and flexible cystoscopy that are potentially relevant for the diagnosis and follow-up of bladder cancer patients. The effectiveness data for diagnostic tests came from the effectiveness review. However, there were no data available on the performance of flexible cystoscopy alone or combined with cytology or biomarkers. Therefore, the sensitivity and specificity of flexible cystoscopy were assumed to be the same as those of WLC as it was likely that flexible and rigid cystoscopies would identify similar types of cancer at the same rate. Plausible changes in this rate did not change the results to any extent. For the strategies relating to combined tests it was assumed that flexible cystoscopy was combined with cytology and/or biomarkers and then followed by WLC or PDD if any one of the previous tests performed was positive.
The base-case analysis model suggests that, for a prevalence rate of 5% in a population with suspected bladder cancer, the diagnostic strategy that would be cost-effective depends upon the value that society would be willing to pay to obtain an additional unit of outcome. Broadly speaking the results based on cases detected were similar to those based upon life-years. The strategy of flexible cystoscopy and ImmunoCyt followed by PDD in initial diagnosis and flexible cystoscopy followed by WLC in follow-up [CSC_IMM_PDD(CSC_WLC)], which produced 11.66 life-years and had a mean cost of £2370 per patient, was the most costly among the diagnostic strategies in the base-case analysis. The CTL_WLC (CTL_WLC) strategy was the least costly (£1043) and least effective (11.59 life-years). Although the differences between strategies in terms of costs and effects appear to be small, the important issue is the results of the willingness to pay for additional gain. CTL_WLC (CTL_WLC) had a greater chance of being cost-effective when the willingness to pay was less than £20,000 per life-year. IMM_PDD (IMM_WLC), FISH_PDD (FISH_WLC) and CSC_FISH_PDD (FISH_WLC) had a greater probability of being cost-effective when the willingness to pay was
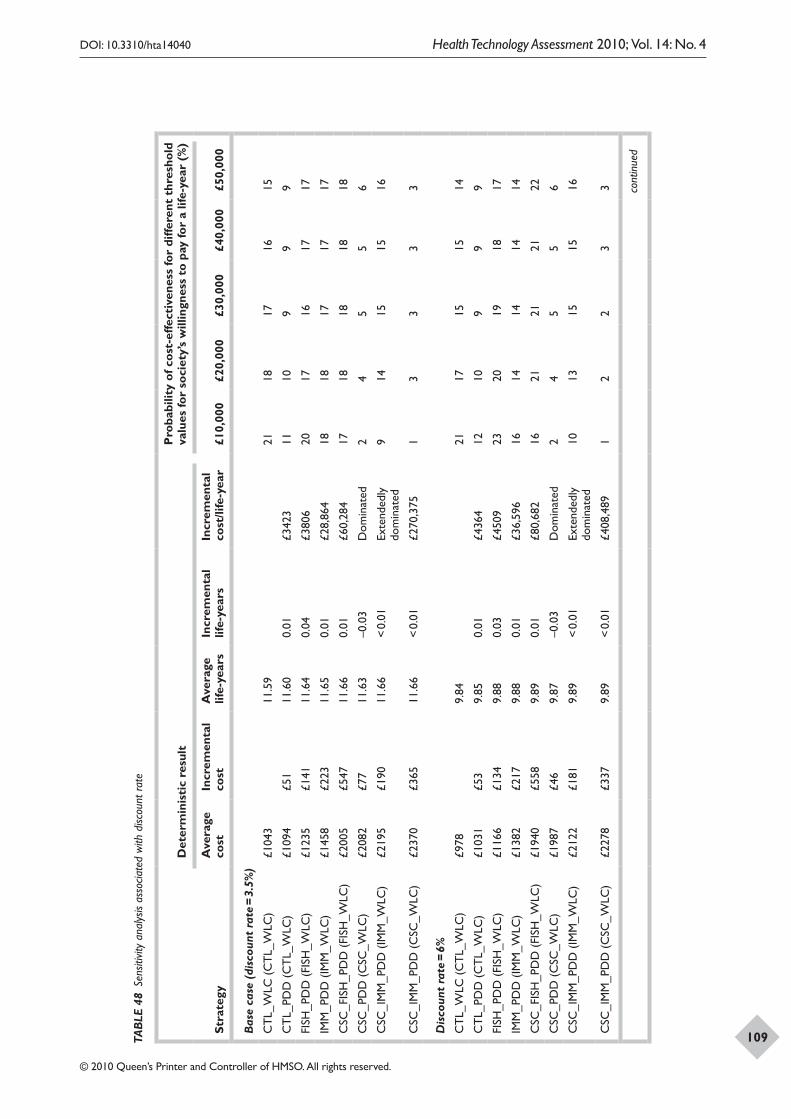
DOI: 10.3310/hta14040 Health Technology Assessment 2010; Vol. 14: No. 4
© 2010 Queen’s Printer and Controller of HMSO. All rights reserved.
109TAB
LE 4
8 Se
nsiti
vity
anal
ysis
asso
ciate
d w
ith d
iscou
nt ra
te
Stra
tegy
Det
erm
inis
tic
resu
lt
Pro
babi
lity
of c
ost-
effe
ctiv
enes
s fo
r di
ffere
nt t
hres
hold
va
lues
for
soci
ety’
s w
illin
gnes
s to
pay
for
a lif
e-ye
ar (
%)
Ave
rage
co
stIn
crem
enta
l co
stA
vera
ge
life-
year
sIn
crem
enta
l lif
e-ye
ars
Incr
emen
tal
cost
/life
-yea
r£1
0,00
0£2
0,00
0£3
0,00
0£4
0,00
0£5
0,00
0
Bas
e ca
se (
disc
ount
rat
e =
3.5%
)
CT
L_W
LC (
CT
L_W
LC)
£104
311
.59
2118
1716
15
CT
L_PD
D (
CT
L_W
LC)
£109
4£5
111
.60
0.01
£342
311
109
99
FISH
_PD
D (
FISH
_WLC
)£1
235
£141
11.6
40.
04£3
806
2017
1617
17
IMM
_PD
D (
IMM
_WLC
)£1
458
£223
11.6
50.
01£2
8,86
418
1817
1717
CSC
_FIS
H_P
DD
(FI
SH_W
LC)
£200
5£5
4711
.66
0.01
£60,
284
1718
1818
18
CSC
_PD
D (
CSC
_WLC
)£2
082
£77
11.6
3–0
.03
Dom
inat
ed2
45
56
CSC
_IM
M_P
DD
(IM
M_W
LC)
£219
5£1
9011
.66
< 0.
01Ex
tend
edly
do
min
ated
914
1515
16
CSC
_IM
M_P
DD
(C
SC_W
LC)
£237
0£3
6511
.66
< 0.
01£2
70,3
751
33
33
Dis
coun
t ra
te =
6%
CT
L_W
LC (
CT
L_W
LC)
£978
9.84
2117
1515
14
CT
L_PD
D (
CT
L_W
LC)
£103
1£5
39.
850.
01£4
364
1210
99
9
FISH
_PD
D (
FISH
_WLC
)£1
166
£134
9.88
0.03
£450
923
2019
1817
IMM
_PD
D (
IMM
_WLC
)£1
382
£217
9.88
0.01
£36,
596
1614
1414
14
CSC
_FIS
H_P
DD
(FI
SH_W
LC)
£194
0£5
589.
890.
01£8
0,68
216
2121
2122
CSC
_PD
D (
CSC
_WLC
)£1
987
£46
9.87
–0.0
3D
omin
ated
24
55
6
CSC
_IM
M_P
DD
(IM
M_W
LC)
£212
2£1
819.
89<
0.01
Exte
nded
ly
dom
inat
ed10
1315
1516
CSC
_IM
M_P
DD
(C
SC_W
LC)
£227
8£3
379.
89<
0.01
£408
,489
12
23
3 cont
inue
d
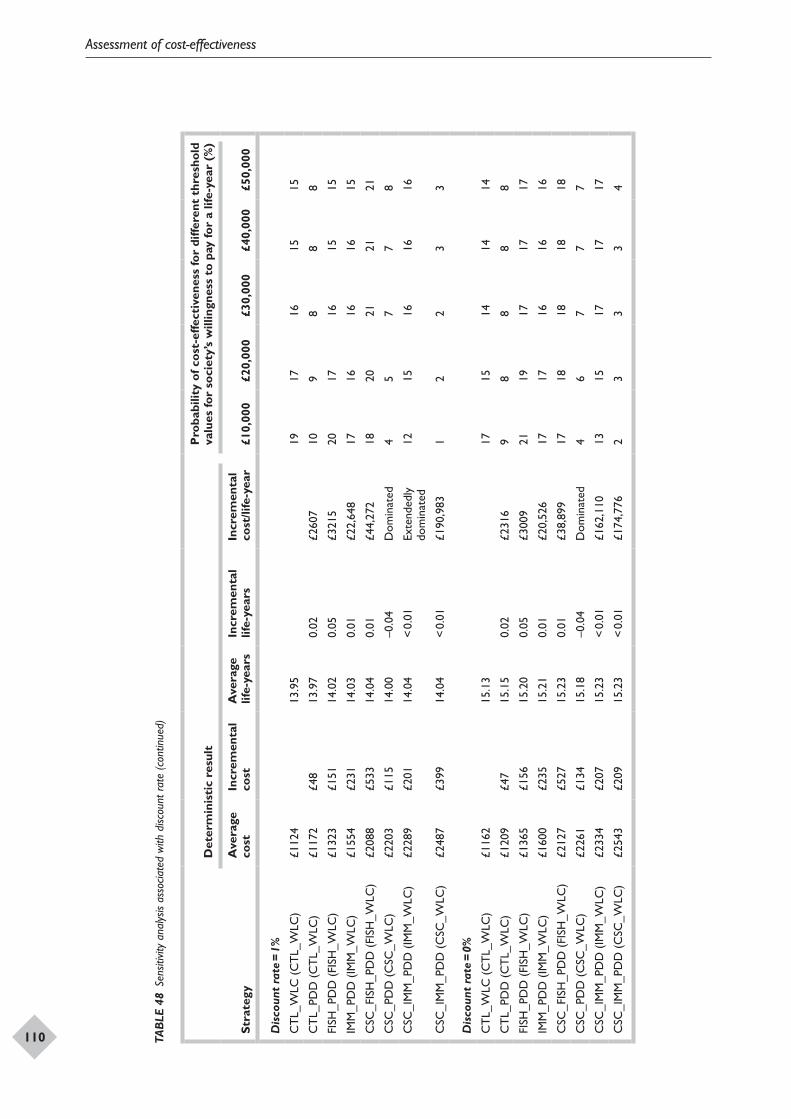
Assessment of cost-effectiveness
110 Stra
tegy
Det
erm
inis
tic
resu
lt
Pro
babi
lity
of c
ost-
effe
ctiv
enes
s fo
r di
ffere
nt t
hres
hold
va
lues
for
soci
ety’
s w
illin
gnes
s to
pay
for
a lif
e-ye
ar (
%)
Ave
rage
co
stIn
crem
enta
l co
stA
vera
ge
life-
year
sIn
crem
enta
l lif
e-ye
ars
Incr
emen
tal
cost
/life
-yea
r£1
0,00
0£2
0,00
0£3
0,00
0£4
0,00
0£5
0,00
0
Dis
coun
t ra
te =
1%
CT
L_W
LC (
CT
L_W
LC)
£112
413
.95
1917
1615
15
CT
L_PD
D (
CT
L_W
LC)
£117
2£4
813
.97
0.02
£260
710
98
88
FISH
_PD
D (
FISH
_WLC
)£1
323
£151
14.0
20.
05£3
215
2017
1615
15
IMM
_PD
D (
IMM
_WLC
)£1
554
£231
14.0
30.
01£2
2,64
817
1616
1615
CSC
_FIS
H_P
DD
(FI
SH_W
LC)
£208
8£5
3314
.04
0.01
£44,
272
1820
2121
21
CSC
_PD
D (
CSC
_WLC
)£2
203
£115
14.0
0–0
.04
Dom
inat
ed4
57
78
CSC
_IM
M_P
DD
(IM
M_W
LC)
£228
9£2
0114
.04
< 0.
01Ex
tend
edly
do
min
ated
1215
1616
16
CSC
_IM
M_P
DD
(C
SC_W
LC)
£248
7£3
9914
.04
< 0.
01£1
90,9
831
22
33
Dis
coun
t ra
te =
0%
CT
L_W
LC (
CT
L_W
LC)
£116
215
.13
1715
1414
14
CT
L_PD
D (
CT
L_W
LC)
£120
9£4
715
.15
0.02
£231
69
88
88
FISH
_PD
D (
FISH
_WLC
)£1
365
£156
15.2
00.
05£3
009
2119
1717
17
IMM
_PD
D (
IMM
_WLC
)£1
600
£235
15.2
10.
01£2
0,52
617
1716
1616
CSC
_FIS
H_P
DD
(FI
SH_W
LC)
£212
7£5
2715
.23
0.01
£38,
899
1718
1818
18
CSC
_PD
D (
CSC
_WLC
)£2
261
£134
15.1
8–0
.04
Dom
inat
ed4
67
77
CSC
_IM
M_P
DD
(IM
M_W
LC)
£233
4£2
0715
.23
< 0.
01£1
62,1
1013
1517
1717
CSC
_IM
M_P
DD
(C
SC_W
LC)
£254
3£2
0915
.23
< 0.
01£1
74,7
762
33
34
TAB
LE 4
8 Se
nsiti
vity
anal
ysis
asso
ciate
d w
ith d
iscou
nt ra
te (c
ontin
ued)
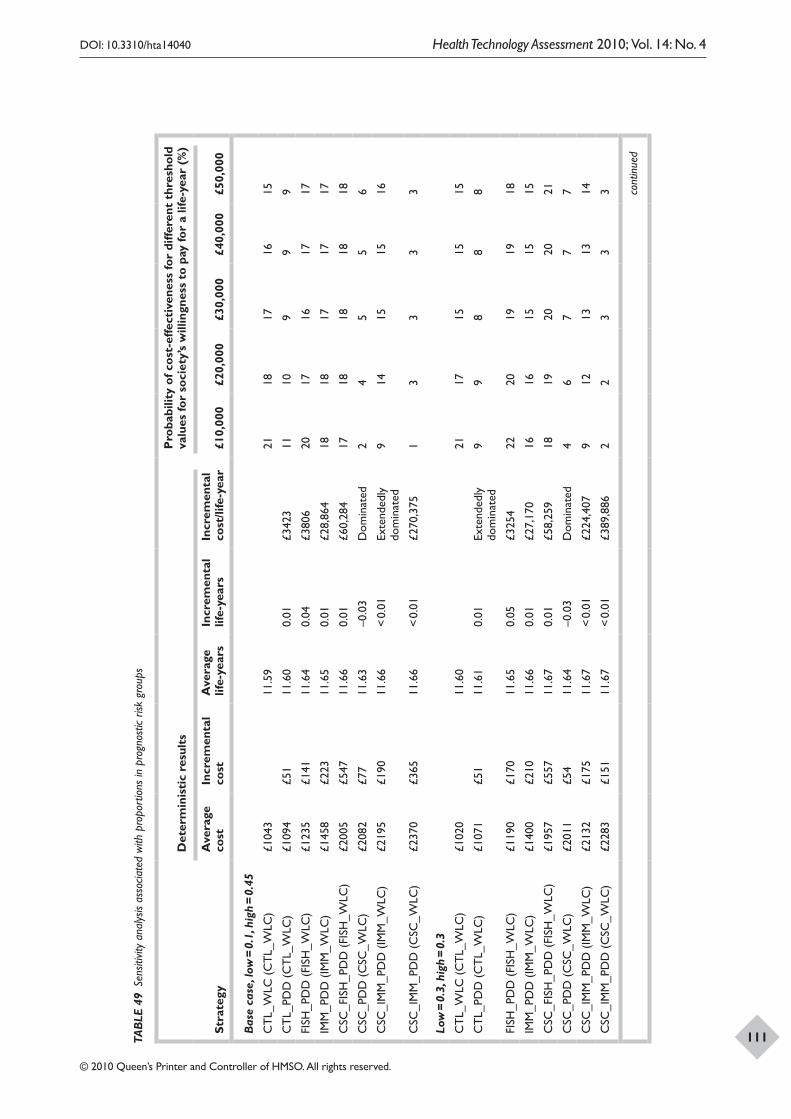
DOI: 10.3310/hta14040 Health Technology Assessment 2010; Vol. 14: No. 4
© 2010 Queen’s Printer and Controller of HMSO. All rights reserved.
111TAB
LE 4
9 Se
nsiti
vity
anal
ysis
asso
ciate
d w
ith p
ropo
rtio
ns in
pro
gnos
tic r
isk g
roup
s
Stra
tegy
Det
erm
inis
tic
resu
lts
Pro
babi
lity
of c
ost-
effe
ctiv
enes
s fo
r di
ffere
nt t
hres
hold
va
lues
for
soci
ety’
s w
illin
gnes
s to
pay
for
a lif
e-ye
ar (
%)
Ave
rage
co
stIn
crem
enta
l co
stA
vera
ge
life-
year
sIn
crem
enta
l lif
e-ye
ars
Incr
emen
tal
cost
/life
-yea
r£1
0,00
0£2
0,00
0£3
0,00
0£4
0,00
0£5
0,00
0
Bas
e ca
se, l
ow =
0.1
, hig
h =
0.45
CT
L_W
LC (
CT
L_W
LC)
£104
311
.59
2118
1716
15
CT
L_PD
D (
CT
L_W
LC)
£109
4£5
111
.60
0.01
£342
311
109
99
FISH
_PD
D (
FISH
_WLC
)£1
235
£141
11.6
40.
04£3
806
2017
1617
17
IMM
_PD
D (
IMM
_WLC
)£1
458
£223
11.6
50.
01£2
8,86
418
1817
1717
CSC
_FIS
H_P
DD
(FI
SH_W
LC)
£200
5£5
4711
.66
0.01
£60,
284
1718
1818
18
CSC
_PD
D (
CSC
_WLC
)£2
082
£77
11.6
3–0
.03
Dom
inat
ed2
45
56
CSC
_IM
M_P
DD
(IM
M_W
LC)
£219
5£1
9011
.66
< 0.
01Ex
tend
edly
do
min
ated
914
1515
16
CSC
_IM
M_P
DD
(C
SC_W
LC)
£237
0£3
6511
.66
< 0.
01£2
70,3
751
33
33
Low
= 0
.3, h
igh
= 0.
3
CT
L_W
LC (
CT
L_W
LC)
£102
011
.60
2117
1515
15
CT
L_PD
D (
CT
L_W
LC)
£107
1£5
111
.61
0.01
Exte
nded
ly
dom
inat
ed9
98
88
FISH
_PD
D (
FISH
_WLC
)£1
190
£170
11.6
50.
05£3
254
2220
1919
18
IMM
_PD
D (
IMM
_WLC
)£1
400
£210
11.6
60.
01£2
7,17
016
1615
1515
CSC
_FIS
H_P
DD
(FI
SH_W
LC)
£195
7£5
5711
.67
0.01
£58,
259
1819
2020
21
CSC
_PD
D (
CSC
_WLC
)£2
011
£54
11.6
4–0
.03
Dom
inat
ed4
67
77
CSC
_IM
M_P
DD
(IM
M_W
LC)
£213
2£1
7511
.67
< 0.
01£2
24,4
079
1213
1314
CSC
_IM
M_P
DD
(C
SC_W
LC)
£228
3£1
5111
.67
< 0.
01£3
89,8
862
23
33 co
ntin
ued
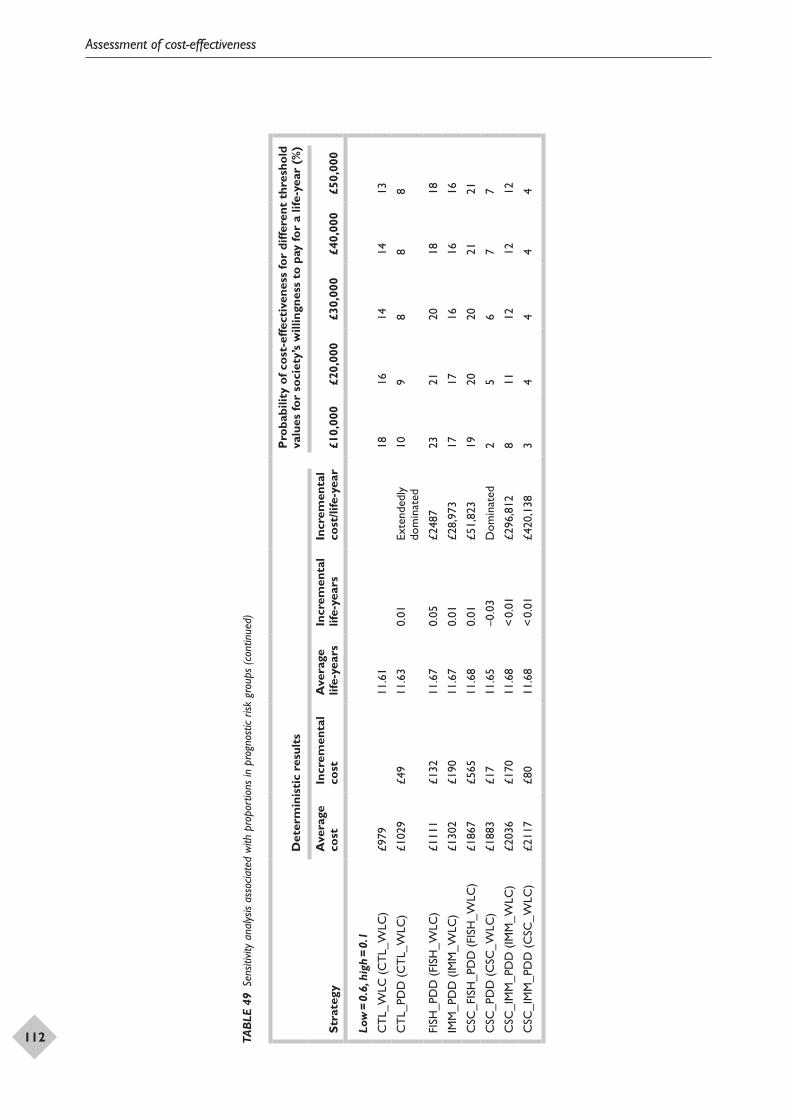
Assessment of cost-effectiveness
112
Stra
tegy
Det
erm
inis
tic
resu
lts
Pro
babi
lity
of c
ost-
effe
ctiv
enes
s fo
r di
ffere
nt t
hres
hold
va
lues
for
soci
ety’
s w
illin
gnes
s to
pay
for
a lif
e-ye
ar (
%)
Ave
rage
co
stIn
crem
enta
l co
stA
vera
ge
life-
year
sIn
crem
enta
l lif
e-ye
ars
Incr
emen
tal
cost
/life
-yea
r£1
0,00
0£2
0,00
0£3
0,00
0£4
0,00
0£5
0,00
0
Low
= 0
.6, h
igh
= 0.
1
CT
L_W
LC (
CT
L_W
LC)
£979
11.6
118
1614
1413
CT
L_PD
D (
CT
L_W
LC)
£102
9£4
911
.63
0.01
Exte
nded
ly
dom
inat
ed10
98
88
FISH
_PD
D (
FISH
_WLC
)£1
111
£132
11.6
70.
05£2
487
2321
2018
18
IMM
_PD
D (
IMM
_WLC
)£1
302
£190
11.6
70.
01£2
8,97
317
1716
1616
CSC
_FIS
H_P
DD
(FI
SH_W
LC)
£186
7£5
6511
.68
0.01
£51,
823
1920
2021
21
CSC
_PD
D (
CSC
_WLC
)£1
883
£17
11.6
5–0
.03
Dom
inat
ed2
56
77
CSC
_IM
M_P
DD
(IM
M_W
LC)
£203
6£1
7011
.68
< 0.
01£2
96,8
128
1112
1212
CSC
_IM
M_P
DD
(C
SC_W
LC)
£211
7£8
011
.68
< 0.
01£4
20,1
383
44
44
TAB
LE 4
9 Se
nsiti
vity
anal
ysis
asso
ciate
d w
ith p
ropo
rtio
ns in
pro
gnos
tic r
isk g
roup
s (c
ontin
ued)
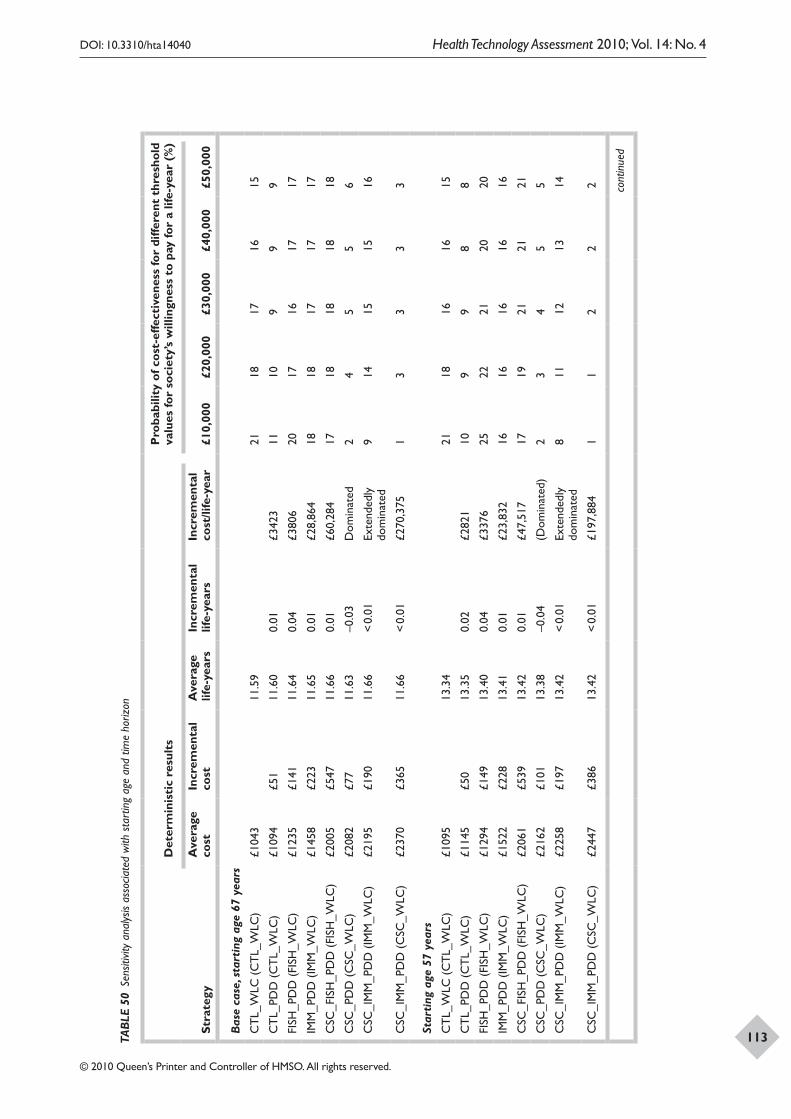
DOI: 10.3310/hta14040 Health Technology Assessment 2010; Vol. 14: No. 4
© 2010 Queen’s Printer and Controller of HMSO. All rights reserved.
113TAB
LE 5
0 Se
nsiti
vity
anal
ysis
asso
ciate
d w
ith s
tart
ing
age
and
time
horiz
on
Stra
tegy
Det
erm
inis
tic
resu
lts
Pro
babi
lity
of c
ost-
effe
ctiv
enes
s fo
r di
ffere
nt t
hres
hold
va
lues
for
soci
ety’
s w
illin
gnes
s to
pay
for
a lif
e-ye
ar (
%)
Ave
rage
co
stIn
crem
enta
l co
stA
vera
ge
life-
year
sIn
crem
enta
l lif
e-ye
ars
Incr
emen
tal
cost
/life
-yea
r£1
0,00
0£2
0,00
0£3
0,00
0£4
0,00
0£5
0,00
0
Bas
e ca
se, s
tart
ing
age
67 y
ears
CT
L_W
LC (
CT
L_W
LC)
£104
311
.59
2118
1716
15
CT
L_PD
D (
CT
L_W
LC)
£109
4£5
111
.60
0.01
£342
311
109
99
FISH
_PD
D (
FISH
_WLC
)£1
235
£141
11.6
40.
04£3
806
2017
1617
17
IMM
_PD
D (
IMM
_WLC
)£1
458
£223
11.6
50.
01£2
8,86
418
1817
1717
CSC
_FIS
H_P
DD
(FI
SH_W
LC)
£200
5£5
4711
.66
0.01
£60,
284
1718
1818
18
CSC
_PD
D (
CSC
_WLC
)£2
082
£77
11.6
3–0
.03
Dom
inat
ed2
45
56
CSC
_IM
M_P
DD
(IM
M_W
LC)
£219
5£1
9011
.66
< 0.
01Ex
tend
edly
do
min
ated
914
1515
16
CSC
_IM
M_P
DD
(C
SC_W
LC)
£237
0£3
6511
.66
< 0.
01£2
70,3
751
33
33
Star
ting
age
57
year
s
CT
L_W
LC (
CT
L_W
LC)
£109
513
.34
2118
1616
15
CT
L_PD
D (
CT
L_W
LC)
£114
5£5
013
.35
0.02
£282
110
99
88
FISH
_PD
D (
FISH
_WLC
)£1
294
£149
13.4
00.
04£3
376
2522
2120
20
IMM
_PD
D (
IMM
_WLC
)£1
522
£228
13.4
10.
01£2
3,83
216
1616
1616
CSC
_FIS
H_P
DD
(FI
SH_W
LC)
£206
1£5
3913
.42
0.01
£47,
517
1719
2121
21
CSC
_PD
D (
CSC
_WLC
)£2
162
£101
13.3
8–0
.04
(Dom
inat
ed)
23
45
5
CSC
_IM
M_P
DD
(IM
M_W
LC)
£225
8£1
9713
.42
< 0.
01Ex
tend
edly
do
min
ated
811
1213
14
CSC
_IM
M_P
DD
(C
SC_W
LC)
£244
7£3
8613
.42
< 0.
01£1
97,8
841
12
22 cont
inue
d
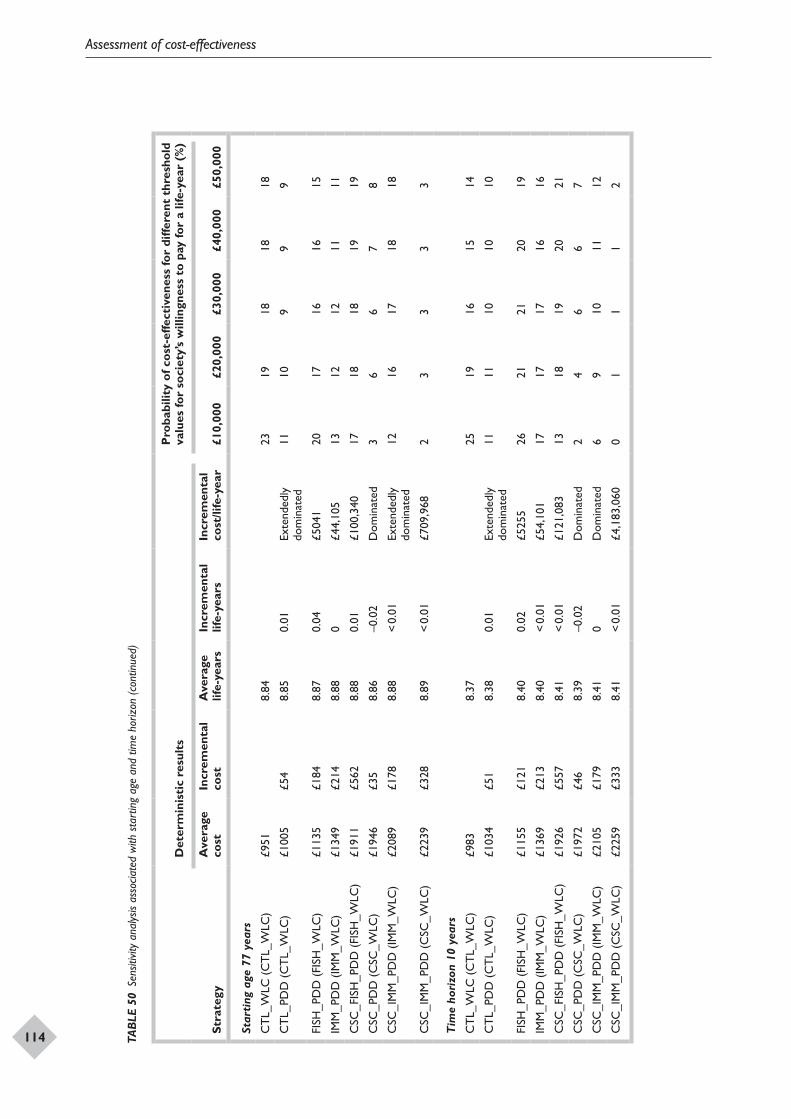
Assessment of cost-effectiveness
114 Stra
tegy
Det
erm
inis
tic
resu
lts
Pro
babi
lity
of c
ost-
effe
ctiv
enes
s fo
r di
ffere
nt t
hres
hold
va
lues
for
soci
ety’
s w
illin
gnes
s to
pay
for
a lif
e-ye
ar (
%)
Ave
rage
co
stIn
crem
enta
l co
stA
vera
ge
life-
year
sIn
crem
enta
l lif
e-ye
ars
Incr
emen
tal
cost
/life
-yea
r£1
0,00
0£2
0,00
0£3
0,00
0£4
0,00
0£5
0,00
0
Star
ting
age
77
year
s
CT
L_W
LC (
CT
L_W
LC)
£951
8.84
2319
1818
18
CT
L_PD
D (
CT
L_W
LC)
£100
5£5
48.
850.
01Ex
tend
edly
do
min
ated
1110
99
9
FISH
_PD
D (
FISH
_WLC
)£1
135
£184
8.87
0.04
£504
120
1716
1615
IMM
_PD
D (
IMM
_WLC
)£1
349
£214
8.88
0£4
4,10
513
1212
1111
CSC
_FIS
H_P
DD
(FI
SH_W
LC)
£191
1£5
628.
880.
01£1
00,3
4017
1818
1919
CSC
_PD
D (
CSC
_WLC
)£1
946
£35
8.86
–0.0
2D
omin
ated
36
67
8
CSC
_IM
M_P
DD
(IM
M_W
LC)
£208
9£1
788.
88<
0.01
Exte
nded
ly
dom
inat
ed12
1617
1818
CSC
_IM
M_P
DD
(C
SC_W
LC)
£223
9£3
288.
89<
0.01
£709
,968
23
33
3
Tim
e ho
rizo
n 10
yea
rs
CT
L_W
LC (
CT
L_W
LC)
£983
8.37
2519
1615
14
CT
L_PD
D (
CT
L_W
LC)
£103
4£5
18.
380.
01Ex
tend
edly
do
min
ated
1111
1010
10
FISH
_PD
D (
FISH
_WLC
)£1
155
£121
8.40
0.02
£525
526
2121
2019
IMM
_PD
D (
IMM
_WLC
)£1
369
£213
8.40
< 0.
01£5
4,10
117
1717
1616
CSC
_FIS
H_P
DD
(FI
SH_W
LC)
£192
6£5
578.
41<
0.01
£121
,083
1318
1920
21
CSC
_PD
D (
CSC
_WLC
)£1
972
£46
8.39
–0.0
2D
omin
ated
24
66
7
CSC
_IM
M_P
DD
(IM
M_W
LC)
£210
5£1
798.
410
Dom
inat
ed6
910
1112
CSC
_IM
M_P
DD
(C
SC_W
LC)
£225
9£3
338.
41<
0.01
£4,1
83,0
600
11
12
TAB
LE 5
0 Se
nsiti
vity
anal
ysis
asso
ciate
d w
ith s
tart
ing
age
and
time
horiz
on (c
ontin
ued)
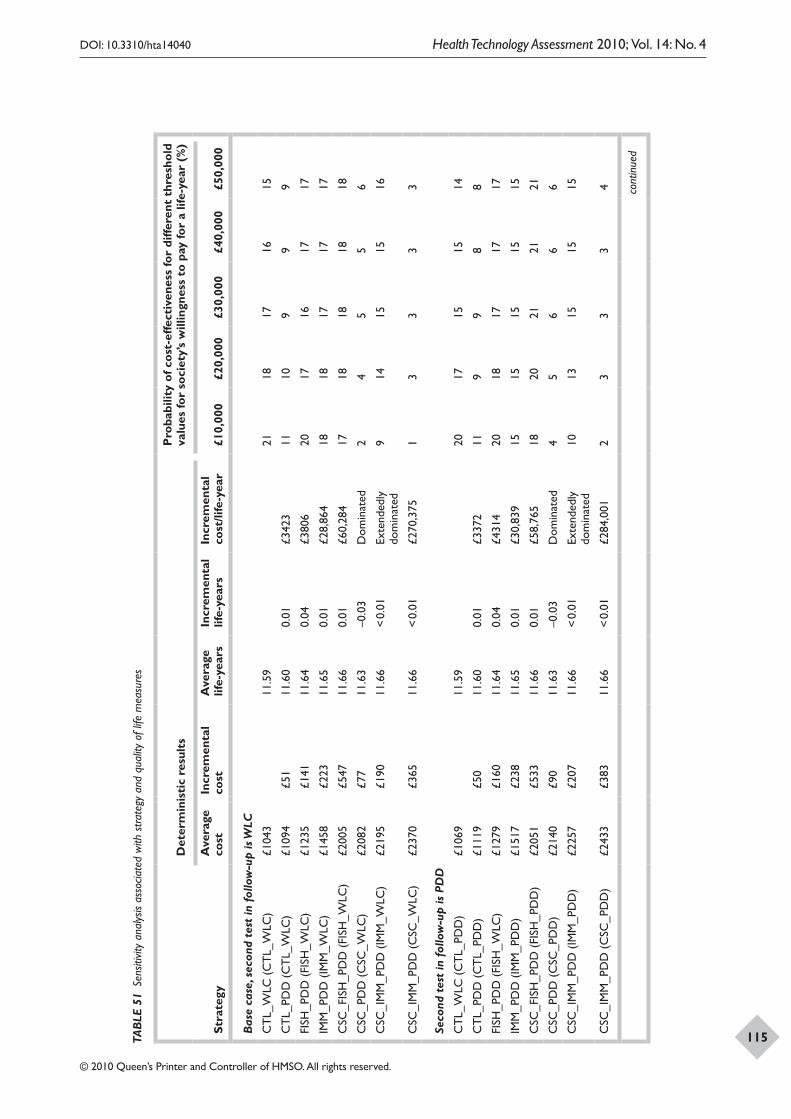
DOI: 10.3310/hta14040 Health Technology Assessment 2010; Vol. 14: No. 4
© 2010 Queen’s Printer and Controller of HMSO. All rights reserved.
115TAB
LE 5
1 Se
nsiti
vity
anal
ysis
asso
ciate
d w
ith s
trate
gy a
nd q
ualit
y of
life
mea
sure
s
Stra
tegy
Det
erm
inis
tic
resu
lts
Pro
babi
lity
of c
ost-
effe
ctiv
enes
s fo
r di
ffere
nt t
hres
hold
va
lues
for
soci
ety’
s w
illin
gnes
s to
pay
for
a lif
e-ye
ar (
%)
Ave
rage
co
stIn
crem
enta
l co
stA
vera
ge
life-
year
sIn
crem
enta
l lif
e-ye
ars
Incr
emen
tal
cost
/life
-yea
r£1
0,00
0£2
0,00
0£3
0,00
0£4
0,00
0£5
0,00
0
Bas
e ca
se, s
econ
d te
st in
fol
low
-up
is W
LC
CT
L_W
LC (
CT
L_W
LC)
£104
311
.59
2118
1716
15
CT
L_PD
D (
CT
L_W
LC)
£109
4£5
111
.60
0.01
£342
311
109
99
FISH
_PD
D (
FISH
_WLC
)£1
235
£141
11.6
40.
04£3
806
2017
1617
17
IMM
_PD
D (
IMM
_WLC
)£1
458
£223
11.6
50.
01£2
8,86
418
1817
1717
CSC
_FIS
H_P
DD
(FI
SH_W
LC)
£200
5£5
4711
.66
0.01
£60,
284
1718
1818
18
CSC
_PD
D (
CSC
_WLC
)£2
082
£77
11.6
3–0
.03
Dom
inat
ed2
45
56
CSC
_IM
M_P
DD
(IM
M_W
LC)
£219
5£1
9011
.66
< 0.
01Ex
tend
edly
do
min
ated
914
1515
16
CSC
_IM
M_P
DD
(C
SC_W
LC)
£237
0£3
6511
.66
< 0.
01£2
70,3
751
33
33
Seco
nd t
est
in f
ollo
w-u
p is
PD
D
CT
L_W
LC (
CT
L_PD
D)
£106
911
.59
2017
1515
14
CT
L_PD
D (
CT
L_PD
D)
£111
9£5
011
.60
0.01
£337
211
99
88
FISH
_PD
D (
FISH
_WLC
)£1
279
£160
11.6
40.
04£4
314
2018
1717
17
IMM
_PD
D (
IMM
_PD
D)
£151
7£2
3811
.65
0.01
£30,
839
1515
1515
15
CSC
_FIS
H_P
DD
(FI
SH_P
DD
)£2
051
£533
11.6
60.
01£5
8,76
518
2021
2121
CSC
_PD
D (
CSC
_PD
D)
£214
0£9
011
.63
–0.0
3D
omin
ated
45
66
6
CSC
_IM
M_P
DD
(IM
M_P
DD
)£2
257
£207
11.6
6<
0.01
Exte
nded
ly
dom
inat
ed10
1315
1515
CSC
_IM
M_P
DD
(C
SC_P
DD
)£2
433
£383
11.6
6<
0.01
£284
,001
23
33
4 cont
inue
d
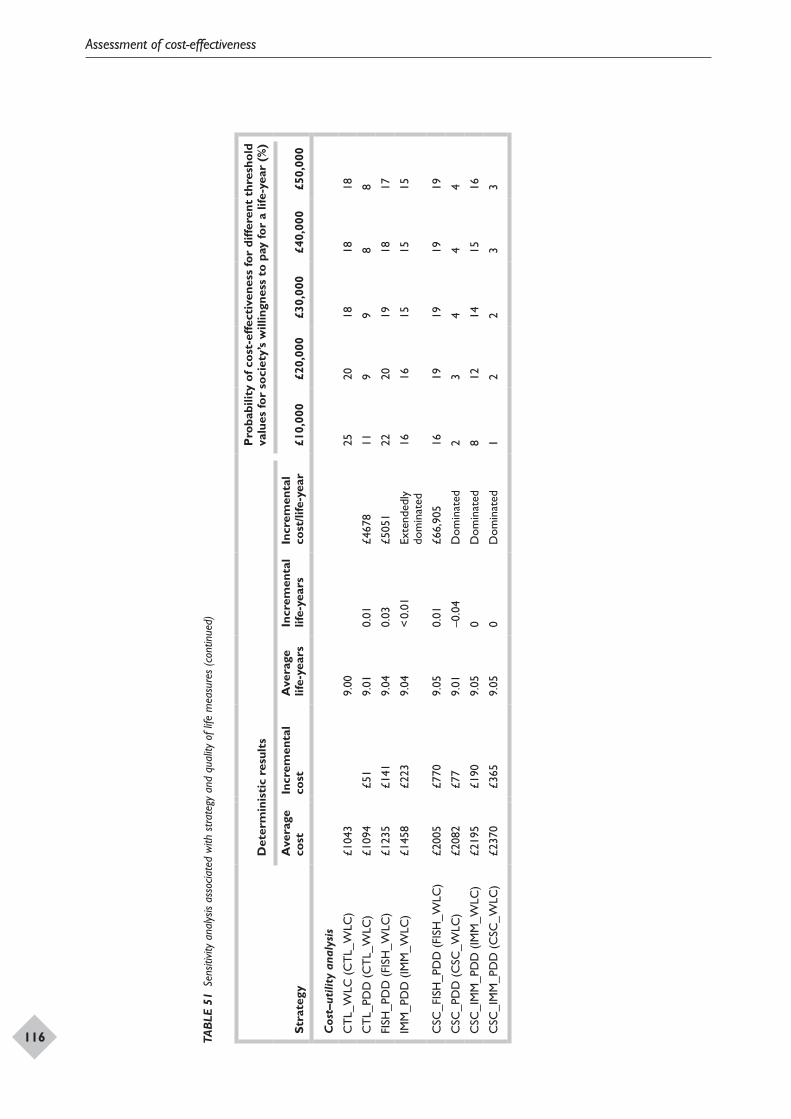
Assessment of cost-effectiveness
116 Stra
tegy
Det
erm
inis
tic
resu
lts
Pro
babi
lity
of c
ost-
effe
ctiv
enes
s fo
r di
ffere
nt t
hres
hold
va
lues
for
soci
ety’
s w
illin
gnes
s to
pay
for
a lif
e-ye
ar (
%)
Ave
rage
co
stIn
crem
enta
l co
stA
vera
ge
life-
year
sIn
crem
enta
l lif
e-ye
ars
Incr
emen
tal
cost
/life
-yea
r£1
0,00
0£2
0,00
0£3
0,00
0£4
0,00
0£5
0,00
0
Cos
t–ut
ility
ana
lysi
s
CT
L_W
LC (
CT
L_W
LC)
£104
39.
0025
2018
1818
CT
L_PD
D (
CT
L_W
LC)
£109
4£5
19.
010.
01£4
678
119
98
8
FISH
_PD
D (
FISH
_WLC
)£1
235
£141
9.04
0.03
£505
122
2019
1817
IMM
_PD
D (
IMM
_WLC
)£1
458
£223
9.04
< 0.
01Ex
tend
edly
do
min
ated
1616
1515
15
CSC
_FIS
H_P
DD
(FI
SH_W
LC)
£200
5£7
709.
050.
01£6
6,90
516
1919
1919
CSC
_PD
D (
CSC
_WLC
)£2
082
£77
9.01
–0.0
4D
omin
ated
23
44
4
CSC
_IM
M_P
DD
(IM
M_W
LC)
£219
5£1
909.
050
Dom
inat
ed8
1214
1516
CSC
_IM
M_P
DD
(C
SC_W
LC)
£237
0£3
659.
050
Dom
inat
ed1
22
33
TAB
LE 5
1 Se
nsiti
vity
anal
ysis
asso
ciate
d w
ith s
trate
gy a
nd q
ualit
y of
life
mea
sure
s (c
ontin
ued)
DOI: 10.3310/hta14040 Health Technology Assessment 2010; Vol. 14: No. 4
© 2010 Queen’s Printer and Controller of HMSO. All rights reserved.
117
increased to £30,000. Nevertheless, over most of the range of willingness to pay values there appeared to be no strategy that would have a likelihood of being cost-effective more than 50% of the time. For example, when the willingness to pay was over £10,000 per life-year the cost-effectiveness of FISH_PDD ranged from 16% to 20%. It should be noted, however, that four out of the eight strategies considered in the sensitivity analyses each had a probability of being considered cost-effective of approximately 20%. Three of these four strategies involved a biomarker and PDD.
The results of probabilistic sensitivity analyses performed to handle the uncertainty around the parameters within the model were broadly consistent with the point estimates in the base-case analysis and did not change the order of strategies in terms of cost. The likelihood that different strategies might be considered cost-effective, however, did change in some sensitivity analyses. For example, the CSC_FISH_PDD (FISH_WLC) strategy had a 31% chance of being considered cost-effective when the prevalence rate was increased to 20% and society’s willingness to pay for a life-year was £20,000. Furthermore, CSC_IMM_PDD (IMM_WLC) and CSC_FISH_PDD (FISH_WLC) had an increased chance of being cost-effective in the situation in which the sensitivity and specificity of flexible cystoscopy were increased. This is important because in the base-case analysis it was assumed that the sensitivity and specificity of flexible cystoscopy would be the same
as those of WLC. Both methods of cystoscopy use white light so it might be appropriate to assume that they would identify (and miss) similar types of cancer at the same rates. However, flexible cystoscopy may be able to visualise more of the bladder than rigid cystoscopy. This means that it may be possible for flexible cystoscopy to detect more cancers. Whether this is true and, if it is true, to what extent it improves sensitivity and specificity is unclear. Overall, a potentially plausible 5% gain in performance would not greatly alter the conclusions drawn on the basis of the cost-effectiveness results.
In sensitivity analyses the results did not change greatly when the QoL estimates were used to determine QALYs. The strategies associated with flexible cystoscopy were dominated and there was a decreased chance of them being considered cost-effective. This is because flexible cystoscopy, being an invasive surgical procedure, is more likely to reduce QoL than cytology or biomarkers.
In the model WLC was considered the second test in follow-up in each strategy if the result of the first test in follow-up was positive. Sensitivity analysis suggested that the non-dominated or non-extendedly dominated strategies had slightly improved life-years with higher costs compared with the base case when WLC in follow-up was replaced by PDD. However, strategies did not markedly change in how likely they were to be cost-effective.

DOI: 10.3310/hta14040 Health Technology Assessment 2010; Vol. 14: No. 4
© 2010 Queen’s Printer and Controller of HMSO. All rights reserved.
119
Factors relevant to the NHSShould strategies that involve PDD be adopted by the NHS then costs to the NHS would increase and new capital equipment would be required. It is likely, however, that learning to use PDD should be straightforward for an experienced cystoscopist and hence the training period should be short. Replacing WLC with PDD should increase the number of cancers detected but this comes at the price of an increasing number of false positives. These false positives lead to an increased workload as unnecessary tests and investigations are performed and, because these tests are unlikely to be without risk, a potential increase in complications.
The results of the economic evaluation suggest that the use of cytology as part of a diagnostic strategy might be reduced. Furthermore, the results suggest that there may be merit in the increased use of biomarkers. Changes in the use of such tests would have resource implications for the NHS and would suggest transfers of resources between those parts of the NHS involved in the conduct, analysis and interpretation of these tests.
The adoption of less invasive tests in place of more invasive tests may also allow shifts in the balance of care between secondary and primary care, at least for initial diagnosis and potentially also for follow-up. Whether such changes are desirable would of course depend upon a host of other factors in addition to feasibility, such as a desire to maintain continuity of care amongst those who have been treated for bladder cancer.
One consequence of any adoption of a more effective diagnostic test is that it may result in greater survival (as estimated in the economic evaluation). Although this outcome is desirable it is important to remember that these patients will require continuing care and follow-up over a longer period. Therefore, it is possible that workload will increase for those specialties involved in follow-up. Other longer-term effects, for example the effect on palliative services, are less easy to predict.
The results of the cost-effectiveness analysis suggest that the strategies involving PDD were likely to detect more true positive cases and produce more life-years at higher costs.
Factors relevant to other parties
Quality of life for patients
The use of strategies involving PDD, ImmunoCyt and FISH could provide advantages to patients in terms of early detection of disease and (for strategies that replace an invasive procedure with a biomarker) provide a reduction in the number of invasive procedures that they may have to undergo. These strategies are also likely to decrease the number of false negatives, which will reduce the risks from false reassurance and the psychological distress following a subsequent correct diagnosis. However, there is a price to pay for this in that strategies involving these tests are also associated with an increased chance of a false-positive diagnosis. Such a diagnosis may have health effects as further tests and investigations performed are not without risk. The false-positive diagnosis may also cause considerable anxiety and distress, not only for the patients but also for their families.
Patients and their families may also have views about which diagnostic strategy they prefer that go beyond preferences over different aspects of diagnostic performance or longer-term health effects. In particular, there may be preferences about the process of care. All things being equal patients would prefer the use of non-invasive biomarker tests to the use of unpleasant, less convenient and potentially risky invasive tests. Nevertheless, all things are not equal and there are choices and trade-offs to be made between process, short-term outcomes and long-term outcomes. Currently there are no data with which to inform decision-makers about how these different outcomes might be traded off against each other.
Chapter 7 Assessment of factors relevant to
the NHS and other parties

DOI: 10.3310/hta14040 Health Technology Assessment 2010; Vol. 14: No. 4
© 2010 Queen’s Printer and Controller of HMSO. All rights reserved.
121
Statement of principal findingsPhotodynamic diagnosisDiagnostic accuracyThe included diagnostic accuracy studies reported true and false positive and negative results or provided information that allowed these data to be calculated, thereby allowing further calculation of sensitivity, specificity, positive and negative likelihood ratios, DORs and positive and negative predictive values. Most studies compared PDD with WLC. Studies comparing PDD with WLC were included in the pooled estimates (meta-analyses) using a HSROC curve model. This method takes into account the inherent trade-off between sensitivity and specificity and also allows for differences in accuracy between studies. Summary pooled estimates of the sensitivity and the specificity were calculated. Meta-analyses were performed on two levels:
• patient• biopsy.
In addition to the meta-analysis models of the diagnostic accuracy of PDD and WLC individually, two HSROC models were run for patient- and biopsy-level analysis that simultaneously modelled PDD and WLC diagnostic accuracy from all of the studies included in the pooled estimates. Analysis was also undertaken on the sensitivity of PDD and WLC for the detection of stage and grade of bladder cancer, which was considered in two broad categories:
• less aggressive, lower risk tumours (pTa, G1, G2)
• more aggressive, higher risk tumours (pT1, G3, CIS).
The sensitivity of PDD and WLC for the detection of CIS alone was also considered. Stage and grade analysis was undertaken for both patient- and biopsy-level detection of bladder cancer. An analysis of the sensitivity of PDD according to the type of photosensitising agent used (5-ALA, HAL or hypericin) was also undertaken. Information on
stage and grade analysis and type of agent used was presented as median and range across studies.
In terms of methodological quality, in all studies the spectrum of patients who received the tests was considered to be representative of those who would receive the tests in practice, partial verification bias was avoided in that all patients who underwent PDD also received a reference standard test, and test review bias was avoided in that the PDD results were considered to have been interpreted without knowledge of the results of the reference standard test. However, in only 55% (15/27) of studies were patients considered to have received the same reference standard regardless of the index test result. All of the studies were judged to have suffered from incorporation bias in that PDD was not considered to be independent of the reference standard test as the biopsies used for the reference standard were obtained via the PDD procedure.
Although biopsy-level analysis of the accuracy of the test is more commonly reported, patient-level data are more useful in determining management. Most studies took multiple biopsies from participants, leading to clustering within participants. We were unable to account for this clustering in the biopsy-level analysis and therefore estimates from the biopsy-level analysis will be to some degree artificially precise. In the pooled estimates for patient-level analysis, based on direct evidence, PDD had higher sensitivity than WLC [92% (95% CI 80% to 100%) versus 71% (95% CI 49% to 93%)] but lower specificity [57% (95% CI 36% to 79%) versus 72% (95% CI 47% to 96%)]. As for patient-level analysis, in the pooled estimates for biopsy-level analysis, based on direct evidence, PDD also had higher sensitivity than WLC [93% (95% CI 90% to 96%) versus 65% (95% CI 55% to 74%)] but lower specificity [60% (95% CI 49% to 71%) versus 81% (95% CI 73% to 90%)]. In terms of sensitivity the upper CI for WLC did not overlap with the lower CI for PDD, supporting evidence of a difference in sensitivity in favour of PDD, and for specificity the upper CI for PDD did not overlap with the lower CI for WLC, supporting evidence of a difference in specificity in favour of WLC. The corresponding CIs for the patient-level analysis were wider because of the reduced number
Chapter 8 Discussion
Discussion
122
of studies although the direction was consistent. Although at least four of the five studies included for patient-level analysis and at least nine of the 14 studies included for biopsy-level analysis in the pooled estimates contained a mixture of patients with a suspicion of bladder cancer and those with previously diagnosed non-muscle-invasive disease, test performance in these groups was not reported separately. The formal comparison of PDD and WLC in patient- and biopsy-based analysis supported strong evidence of a difference in sensitivity in favour of PDD and in specificity in favour of WLC.
The consequence of underdiagnosis at a patient level would mean that a patient’s treatment path may be detrimentally affected (e.g. discharged from follow-up or chanelled to an inappropriately low-risk follow-up pathway). The consequence of underdiagnosis at a biopsy level is that a patient may have suboptimal treatment of their known bladder cancer, for example by failure to remove an occult lesion or failure to institute a therapy because of underestimating the patient’s risk category (e.g. by failing to diagnose concomitant CIS).
Across studies the median sensitivities (range) of PDD and WLC for detecting lower risk, less aggressive tumours were broadly similar for patient-level detection [92% (20% to 95%) versus 95% (8% to 100%)], but sensitivity was higher for PDD for biopsy-level detection [96% (88% to 100%) versus 88% (74% to 100%)]. However, for the detection of more aggressive, higher risk tumours the median sensitivities of PDD for both patient-level [89% (6% to 100%)] and biopsy-level [99% (54% to 100%)] detection were much higher than those of WLC [56% (0% to 100%) and 67% (0% to 100%) respectively]. The superior sensitivity of PDD was also reflected in the detection of CIS alone, both for patient-level [83% (41% to 100%) versus 32% (0% to 83%)] and biopsy-level [86% (54% to 100%) versus 50% (0% to 68%)] detection. However, these results should be interpreted with caution as, other than for PDD biopsy-based detection of lower risk disease, the range of sensitivities for both tests was very wide. [It may also be useful to note that, although not meeting the inclusion criteria for this review as information was not provided on false positives and true negatives, Schmidbauer and colleagues,207 in a European multicentre study (19 centres), reported that, of 83 patients with CIS lesions, CIS was detected in 80 (96%) by PDD (HAL) compared with 64 (77%) by WLC.]
In terms of the relative sensitivities of the photosensitising agents used, for patient-level detection of bladder cancer, the median sensitivity (range) of 5-ALA was slightly higher than that of HAL [96% (64% to 100%) versus 90% (53% to 96%)] whereas HAL had higher specificity than 5-ALA [81% (43% to 100%) versus 52% (33% to 67%)]. This situation was also reflected in biopsy-based detection, with 5-ALA associated with higher sensitivity [95% (87% to 98%) versus 85% (76% to 94%)] but lower specificity [57% (32 to 67%) versus 80% (58 to 100%)] than HAL. One study, by Sim and colleagues,76 reporting biopsy-based detection of bladder cancer, used hypericin, reporting sensitivity of 82% and specificity of 91%. These results suggest that 5-ALA may be associated with slightly higher sensitivity than HAL and that HAL has higher specificity than 5-ALA, but this should be interpreted with caution as a number of factors other than the photosensitising agent used may have contributed to the sensitivity and specificity values reported by the studies.
Twelve studies51–53,61–63,65,71–73,78,81 involving 1543 patients reported that there were no side effects or no serious side effects associated with the photosensitising agent used. Seven studies50,57,66,67,71,76,77 involving 746 patients reported 41 side effects associated with the agent (5-ALA, 19; HAL, 21; hypericin, 1), none of which was considered to be serious.
No other systematic reviews of PDD for detecting bladder cancer or reporting effectiveness outcomes such as tumour recurrence were identified.
In summary, compared with WLC, PDD has higher sensitivity (fewer false negatives) and so will detect cases of bladder cancer that are missed by WLC. However, compared with WLC, PDD’s lower specificity (more false positives) will result in additional, unnecessary biopsies of non-cancerous tissue being taken and sent for analysis. Reasons cited in the literature for PDD false-positive results include: (1) inexperience in using PDD, in which the application of tangential fluorescence light may cause fluorescence in normal urothelium, (2) simple hyperplasia, (3) lesions with inflammation or scarring after previous TURBT when PDD was carried out within 6 weeks of the previous procedure and (4) previous instillation therapy within 3–6 months of PDD.208,209 De Dominicis and colleagues53 noted that a greater number of false-positive lesions were detected during the period when the authors were still not sufficiently trained in the PDD procedure, particularly in the first 15
DOI: 10.3310/hta14040 Health Technology Assessment 2010; Vol. 14: No. 4
© 2010 Queen’s Printer and Controller of HMSO. All rights reserved.
123
patients. In terms of the detection of stage and grade of tumour, the results suggest that PDD is much more sensitive than WLC in the detection of more aggressive, higher risk tumours, and the superior performance of PDD is also reflected in the detection of CIS alone. From a clinical point of view, compared with WLC, the advantages of PDD’s higher overall sensitivity in detecting bladder cancer and also its higher sensitivity in detecting more aggressive, higher risk tumours have to be weighed against the disadvantages of a higher false-positive rate leading to additional, unnecessary biopsies of normal tissue being taken and potentially additional unnecessary investigations being carried out and the resulting anxiety caused to patients and their families.
Recurrence/progression of diseaseJain and Kockelbergh210 noted that the high recurrence rate of superficial bladder cancer, up to 70% at 5 years, was responsible for a huge workload for urologists and much inconvenience for patients. They stated that the recurrence rate at the first check cystoscopy varied enormously, suggesting that incomplete resection or failure to detect small additional tumours may be a risk factor.210 The evidence from the diagnostic accuracy part of this review suggests that PDD has a higher sensitivity for the detection of bladder cancer than WLC. Therefore, compared with WLC, the use of PDD during initial TURBT may be expected to result in lower recurrence and progression rates, given that some tumours, including more aggressive, higher risk tumours such as CIS, that might be missed by WLC will be detected by PDD.
For the assessment of PDD-assisted TURBT compared with WLC in terms of effectiveness outcomes such as recurrence and progression, this review focused on RCTs. Four RCTs (reported in eight papers) involving 544 participants met the inclusion criteria. In terms of methodological quality, in all four studies the groups were considered to be similar at baseline in terms of prognostic factors, eligibility criteria for the studies were specified and the length of follow-up was considered adequate in relation to the outcomes of interest. However, in all studies it was unclear whether the sequence generation was really random or whether treatment allocation was adequately concealed.
When meta-analysis was undertaken, the results were reported using RR as the effect measure and a fixed-effect model in the absence of statistical heterogeneity, otherwise a random-effects model
was used. Two studies86,89 reported recurrence-free survival at 12 and 24 months. In pooled estimates the direction of effect for both time points favoured PDD, although the difference was statistically significant only at the 24-month time point (RR 1.37, 95% CI 1.18 to 1.59).
Four studies86,88,89,92 reported residual tumour rate at first cystoscopy following TURBT. In pooled estimates PDD was associated with both statistically significantly fewer residual pTa tumours (RR 0.32, 95% CI 0.15 to 0.70) and fewer residual pT1 tumours (RR 0.26, 95% CI 0.12 to 0.57) than WLC (overall pooled estimate RR 0.37, 95% CI 0.20 to 0.69). Two of the studies86,88 also reported residual tumour according to grade (G1, G2 and G3). Pooled estimates for G1 (RR 0.13, 95% CI 0.03 to 0.71) and G2 (RR 0.32, 95% CI 0.16 to 0.64) were statistically significant in favour of PDD, with the direction of effect for G3 favouring PDD without reaching statistical significance (RR 0.57, 95% CI 0.21 to 1.56), and the overall pooled estimate was statistically significant in favour of PDD (RR 0.31, 95% CI 0.18 to 0.53).
Two studies88,89 reported tumour recurrence rate during follow-up (5 years and 8 years respectively). In pooled estimates the direction of effect favoured PDD without reaching statistical significance (RR 0.64, 95% CI 0.39 to 1.06). Both studies88,89 also reported tumour progression during their respective follow-up periods and again in the pooled estimates the direction of effect favoured PDD without reaching statistical significance (RR 0.57, 95% CI 0.22 to 1.46).
Two studies86,88 reported time to recurrence, both favouring PDD. Babjuk and colleagues86 reported a median time to recurrence of 17.05 months for the PDD group and 8.05 months for the WLC group, whereas Daniltchenko and colleagues88 reported a median (range) time to recurrence of 12 (2 to 58) months for the PDD group and 5 (2 to 52) months for the WLC group.
In summary, the evidence from the RCTs86,88,89,92 suggests that, compared with WLC, the use of PDD during TURBT results in a statistically significant and large reduction in residual pTa and pT1 tumours, longer recurrence-free survival of patients at 2 years following surgery and a longer interval between TURBT and tumour recurrence. However, these results should be interpreted with caution as they are based on data from only four small studies. Based on the limited evidence it is unclear whether PDD compared with WLC is associated with lower
Discussion
124
tumour recurrence and progression rates in the longer term. Also, as discussed in the section on uncertainties, the administration of adjuvant intravesical therapy varied across the studies, making it difficult to assess what the true added value of PDD might be in reducing recurrence rates in routine clinical practice.
Biomarkers and cytology
The included diagnostic accuracy studies reported true and false positive and negative results or provided information that allowed these data to be calculated, thereby allowing the further calculation of sensitivity and specificity, positive and negative likelihood ratios, DORs and positive and negative predictive values for the three included urine biomarkers (FISH, ImmunoCyt and NMP22) and cytology. Meta-analyses were undertaken for each of the individual biomarkers and cytology for patient-based detection of bladder cancer using the HSROC model. Additional meta-analyses were also undertaken on the subset of studies included in the pooled estimates that directly compared biomarkers with cytology. Analysis was also undertaken on the sensitivity of the biomarkers and cytology for the detection of stage and grade of bladder cancer, which was considered in the two broad categories previously referred to (less aggressive/lower risk tumours and more aggressive/higher risk tumours), and also for detection of CIS alone.
For each biomarker only those studies that were considered to have a similar (‘common’) cut-off, which was generally taken to be the most frequently used cut-off across studies, were included in the meta-analyses. The common cut-off was also used when studies reported results using a number of different cut-offs. The following common cut-offs were used: FISH, gains of two or more chromosomes or five or more cells with polysomy or four or more aneusomic of 25 counted cells; ImmunoCyt, at least one green or one red fluorescent cell; NMP22, 10 U/ml; urine cytology, cytologist subjective assessment.
In terms of methodological quality, in all 71 studies the reference standard (cystoscopy with histological assessment of biopsied tissue) was considered likely to correctly classify bladder cancer. In 99% (70/71) of studies the spectrum of patients receiving the tests was considered to be representative of those who would receive the test in practice, and incorporation bias was avoided
in that the reference standard was independent of the biomarker/cytology test. In 96% (68/71) of studies partial verification bias was avoided in that all patients who received a biomarker/cytology test also received a reference standard test, and in 87% (62/71) of studies differential verification bias was avoided in that all patients received the same reference standard regardless of the index test result. However, only 69% (49/71) of studies were considered to have given a clear definition of what constituted a positive result.
Table 52 shows the pooled estimates (sensitivity, specificity, DORs) as well as the median (range) positive and negative predictive values across studies for the biomarkers and cytology for patient-based detection of bladder cancer. In the pooled estimates, based on indirect evidence, sensitivity was highest for ImmunoCyt at 84% (95% CI 77% to 91%) and lowest for cytology at 44% (95% CI 38% to 51%). ImmunoCyt (84%, 95% CI 77% to 91%) had higher sensitivity than NMP22 (68%, 95% CI 62% to 74%), with the lack of overlap between the CIs supporting evidence of a difference in sensitivity in favour of ImmunoCyt over NMP22. FISH (76%, 95% CI 65% to 84%), ImmunoCyt (84%, 95% CI 77% to 91%) and NMP22 (68%, 95% CI 62% to 74%) all had higher sensitivity than cytology (44%, 95% CI 38% to 51%), and again the lack of overlap of the CIs between the three biomarkers and cytology supported evidence of a difference in sensitivity in favour of the three biomarkers over cytology. This situation was reversed for specificity, which was highest for cytology at 96% (95% CI 94% to 98%) and lowest for ImmunoCyt at 75% (68% to 83%). Cytology (96%, 95% CI 94% to 98%) had higher specificity than FISH (85%, 95% CI 78% to 92%), ImmunoCyt (75%, 95% CI 68% to 83%) or NMP22 (79%, 95% CI 74% to 84%), with the lack of overlap of the CIs between cytology and the three biomarkers supporting evidence of a difference in specificity in favour of cytology over the biomarkers.
DORs (95% CI) ranged from 8 (5 to 11) to 19 (6 to 26), with higher DORs indicating a better ability of the test to differentiate between those with and those without bladder cancer. Based on the DOR values, FISH and cytology performed similarly well [18 (3 to 32) and 19 (11 to 27) respectively], ImmunoCyt slightly less so [16 (6 to 26)] and NMP22 relatively poorly [8 (5 to 11)]. However, as the DOR confidence intervals for each of the tests all overlapped these results should be interpreted with caution.
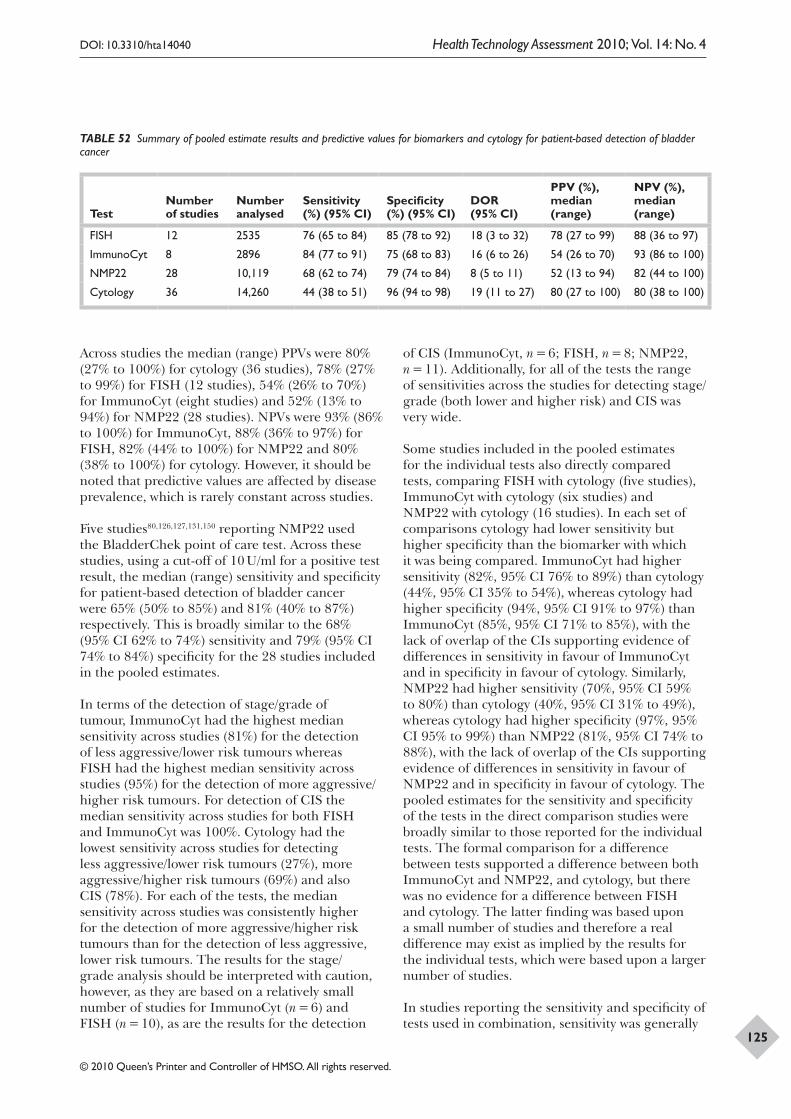
DOI: 10.3310/hta14040 Health Technology Assessment 2010; Vol. 14: No. 4
© 2010 Queen’s Printer and Controller of HMSO. All rights reserved.
125
TABLE 52 Summary of pooled estimate results and predictive values for biomarkers and cytology for patient-based detection of bladder cancer
TestNumber of studies
Number analysed
Sensitivity (%) (95% CI)
Specificity (%) (95% CI)
DOR (95% CI)
PPV (%), median (range)
NPV (%), median (range)
FISH 12 2535 76 (65 to 84) 85 (78 to 92) 18 (3 to 32) 78 (27 to 99) 88 (36 to 97)
ImmunoCyt 8 2896 84 (77 to 91) 75 (68 to 83) 16 (6 to 26) 54 (26 to 70) 93 (86 to 100)
NMP22 28 10,119 68 (62 to 74) 79 (74 to 84) 8 (5 to 11) 52 (13 to 94) 82 (44 to 100)
Cytology 36 14,260 44 (38 to 51) 96 (94 to 98) 19 (11 to 27) 80 (27 to 100) 80 (38 to 100)
Across studies the median (range) PPVs were 80% (27% to 100%) for cytology (36 studies), 78% (27% to 99%) for FISH (12 studies), 54% (26% to 70%) for ImmunoCyt (eight studies) and 52% (13% to 94%) for NMP22 (28 studies). NPVs were 93% (86% to 100%) for ImmunoCyt, 88% (36% to 97%) for FISH, 82% (44% to 100%) for NMP22 and 80% (38% to 100%) for cytology. However, it should be noted that predictive values are affected by disease prevalence, which is rarely constant across studies.
Five studies80,126,127,131,150 reporting NMP22 used the BladderChek point of care test. Across these studies, using a cut-off of 10 U/ml for a positive test result, the median (range) sensitivity and specificity for patient-based detection of bladder cancer were 65% (50% to 85%) and 81% (40% to 87%) respectively. This is broadly similar to the 68% (95% CI 62% to 74%) sensitivity and 79% (95% CI 74% to 84%) specificity for the 28 studies included in the pooled estimates.
In terms of the detection of stage/grade of tumour, ImmunoCyt had the highest median sensitivity across studies (81%) for the detection of less aggressive/lower risk tumours whereas FISH had the highest median sensitivity across studies (95%) for the detection of more aggressive/higher risk tumours. For detection of CIS the median sensitivity across studies for both FISH and ImmunoCyt was 100%. Cytology had the lowest sensitivity across studies for detecting less aggressive/lower risk tumours (27%), more aggressive/higher risk tumours (69%) and also CIS (78%). For each of the tests, the median sensitivity across studies was consistently higher for the detection of more aggressive/higher risk tumours than for the detection of less aggressive, lower risk tumours. The results for the stage/grade analysis should be interpreted with caution, however, as they are based on a relatively small number of studies for ImmunoCyt (n = 6) and FISH (n = 10), as are the results for the detection
of CIS (ImmunoCyt, n = 6; FISH, n = 8; NMP22, n = 11). Additionally, for all of the tests the range of sensitivities across the studies for detecting stage/grade (both lower and higher risk) and CIS was very wide.
Some studies included in the pooled estimates for the individual tests also directly compared tests, comparing FISH with cytology (five studies), ImmunoCyt with cytology (six studies) and NMP22 with cytology (16 studies). In each set of comparisons cytology had lower sensitivity but higher specificity than the biomarker with which it was being compared. ImmunoCyt had higher sensitivity (82%, 95% CI 76% to 89%) than cytology (44%, 95% CI 35% to 54%), whereas cytology had higher specificity (94%, 95% CI 91% to 97%) than ImmunoCyt (85%, 95% CI 71% to 85%), with the lack of overlap of the CIs supporting evidence of differences in sensitivity in favour of ImmunoCyt and in specificity in favour of cytology. Similarly, NMP22 had higher sensitivity (70%, 95% CI 59% to 80%) than cytology (40%, 95% CI 31% to 49%), whereas cytology had higher specificity (97%, 95% CI 95% to 99%) than NMP22 (81%, 95% CI 74% to 88%), with the lack of overlap of the CIs supporting evidence of differences in sensitivity in favour of NMP22 and in specificity in favour of cytology. The pooled estimates for the sensitivity and specificity of the tests in the direct comparison studies were broadly similar to those reported for the individual tests. The formal comparison for a difference between tests supported a difference between both ImmunoCyt and NMP22, and cytology, but there was no evidence for a difference between FISH and cytology. The latter finding was based upon a small number of studies and therefore a real difference may exist as implied by the results for the individual tests, which were based upon a larger number of studies.
In studies reporting the sensitivity and specificity of tests used in combination, sensitivity was generally
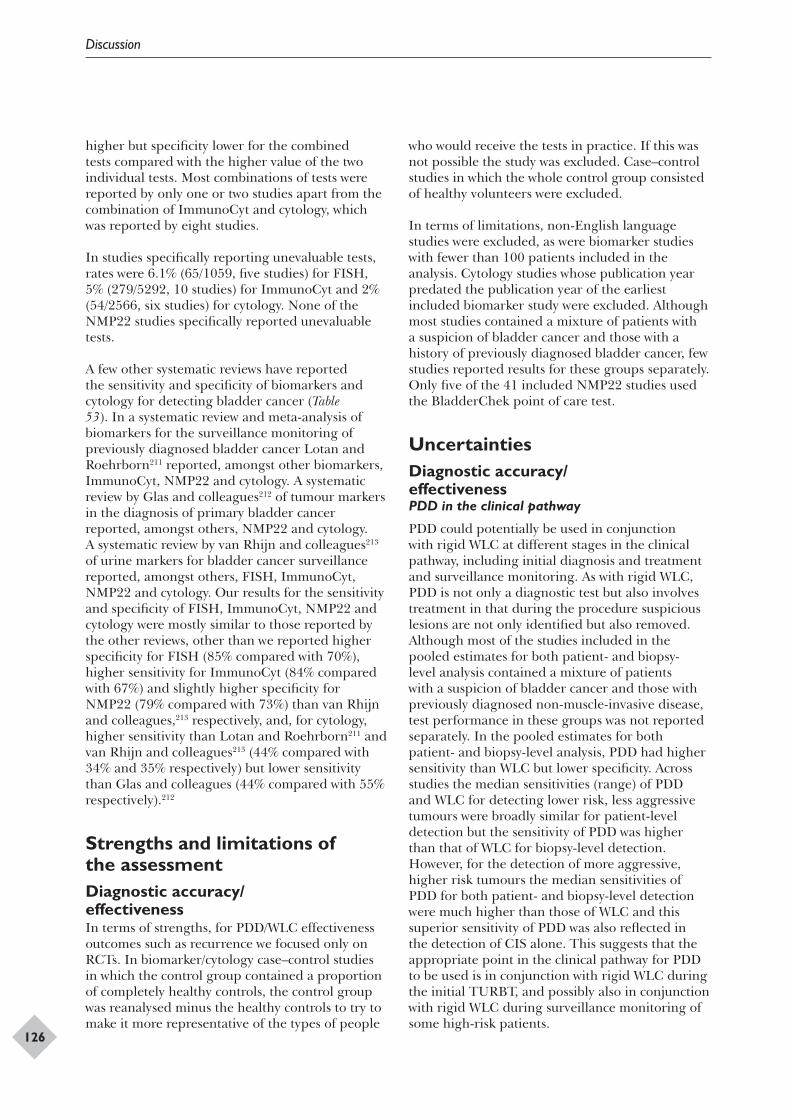
Discussion
126
higher but specificity lower for the combined tests compared with the higher value of the two individual tests. Most combinations of tests were reported by only one or two studies apart from the combination of ImmunoCyt and cytology, which was reported by eight studies.
In studies specifically reporting unevaluable tests, rates were 6.1% (65/1059, five studies) for FISH, 5% (279/5292, 10 studies) for ImmunoCyt and 2% (54/2566, six studies) for cytology. None of the NMP22 studies specifically reported unevaluable tests.
A few other systematic reviews have reported the sensitivity and specificity of biomarkers and cytology for detecting bladder cancer (Table 53). In a systematic review and meta-analysis of biomarkers for the surveillance monitoring of previously diagnosed bladder cancer Lotan and Roehrborn211 reported, amongst other biomarkers, ImmunoCyt, NMP22 and cytology. A systematic review by Glas and colleagues212 of tumour markers in the diagnosis of primary bladder cancer reported, amongst others, NMP22 and cytology. A systematic review by van Rhijn and colleagues213 of urine markers for bladder cancer surveillance reported, amongst others, FISH, ImmunoCyt, NMP22 and cytology. Our results for the sensitivity and specificity of FISH, ImmunoCyt, NMP22 and cytology were mostly similar to those reported by the other reviews, other than we reported higher specificity for FISH (85% compared with 70%), higher sensitivity for ImmunoCyt (84% compared with 67%) and slightly higher specificity for NMP22 (79% compared with 73%) than van Rhijn and colleagues,213 respectively, and, for cytology, higher sensitivity than Lotan and Roehrborn211 and van Rhijn and colleagues213 (44% compared with 34% and 35% respectively) but lower sensitivity than Glas and colleagues (44% compared with 55% respectively).212
Strengths and limitations of the assessmentDiagnostic accuracy/effectivenessIn terms of strengths, for PDD/WLC effectiveness outcomes such as recurrence we focused only on RCTs. In biomarker/cytology case–control studies in which the control group contained a proportion of completely healthy controls, the control group was reanalysed minus the healthy controls to try to make it more representative of the types of people
who would receive the tests in practice. If this was not possible the study was excluded. Case–control studies in which the whole control group consisted of healthy volunteers were excluded.
In terms of limitations, non-English language studies were excluded, as were biomarker studies with fewer than 100 patients included in the analysis. Cytology studies whose publication year predated the publication year of the earliest included biomarker study were excluded. Although most studies contained a mixture of patients with a suspicion of bladder cancer and those with a history of previously diagnosed bladder cancer, few studies reported results for these groups separately. Only five of the 41 included NMP22 studies used the BladderChek point of care test.
UncertaintiesDiagnostic accuracy/effectivenessPDD in the clinical pathway
PDD could potentially be used in conjunction with rigid WLC at different stages in the clinical pathway, including initial diagnosis and treatment and surveillance monitoring. As with rigid WLC, PDD is not only a diagnostic test but also involves treatment in that during the procedure suspicious lesions are not only identified but also removed. Although most of the studies included in the pooled estimates for both patient- and biopsy-level analysis contained a mixture of patients with a suspicion of bladder cancer and those with previously diagnosed non-muscle-invasive disease, test performance in these groups was not reported separately. In the pooled estimates for both patient- and biopsy-level analysis, PDD had higher sensitivity than WLC but lower specificity. Across studies the median sensitivities (range) of PDD and WLC for detecting lower risk, less aggressive tumours were broadly similar for patient-level detection but the sensitivity of PDD was higher than that of WLC for biopsy-level detection. However, for the detection of more aggressive, higher risk tumours the median sensitivities of PDD for both patient- and biopsy-level detection were much higher than those of WLC and this superior sensitivity of PDD was also reflected in the detection of CIS alone. This suggests that the appropriate point in the clinical pathway for PDD to be used is in conjunction with rigid WLC during the initial TURBT, and possibly also in conjunction with rigid WLC during surveillance monitoring of some high-risk patients.
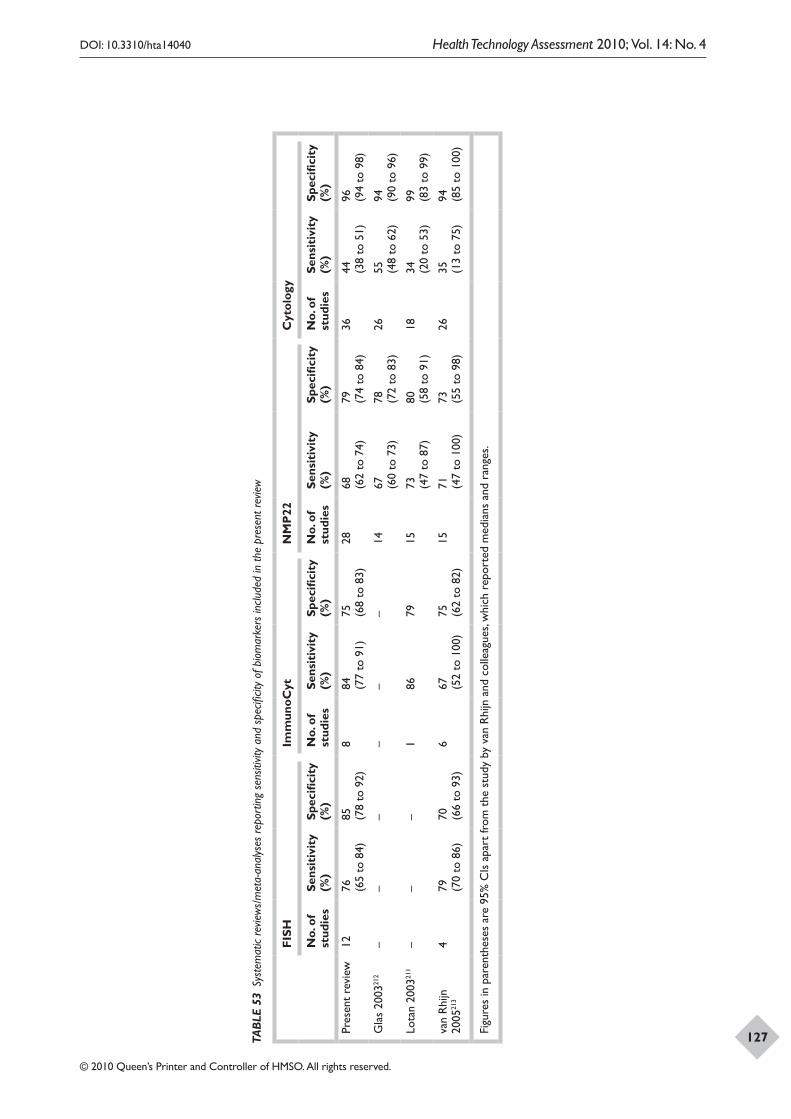
DOI: 10.3310/hta14040 Health Technology Assessment 2010; Vol. 14: No. 4
© 2010 Queen’s Printer and Controller of HMSO. All rights reserved.
127TAB
LE 5
3 Sy
stem
atic
revie
ws/
met
a-an
alys
es re
port
ing
sens
itivit
y an
d sp
ecifi
city
of b
iom
arke
rs in
clude
d in
the
pres
ent r
evie
w
FISH
Imm
unoC
ytN
MP
22C
ytol
ogy
No.
of
stud
ies
Sens
itiv
ity
(%)
Spec
ifici
ty
(%)
No.
of
stud
ies
Sens
itiv
ity
(%)
Spec
ifici
ty
(%)
No.
of
stud
ies
Sens
itiv
ity
(%)
Spec
ifici
ty
(%)
No.
of
stud
ies
Sens
itiv
ity
(%)
Spec
ifici
ty
(%)
Pres
ent
revi
ew12
76
(65
to 8
4)85
(7
8 to
92)
884
(7
7 to
91)
75
(68
to 8
3)28
68
(62
to 7
4)79
(7
4 to
84)
3644
(3
8 to
51)
96
(94
to 9
8)
Gla
s 20
0321
2–
––
––
–14
67
(60
to 7
3)78
(7
2 to
83)
2655
(4
8 to
62)
94
(90
to 9
6)
Lota
n 20
0321
1–
––
186
7915
73
(47
to 8
7)80
(5
8 to
91)
1834
(2
0 to
53)
99
(83
to 9
9)
van
Rhi
jn
2005
213
479
(7
0 to
86)
70
(66
to 9
3)6
67
(52
to 1
00)
75
(62
to 8
2)15
71
(47
to 1
00)
73
(55
to 9
8)26
35
(13
to 7
5)94
(8
5 to
100
)
Figu
res
in p
aren
thes
es a
re 9
5% C
Is a
part
from
the
stu
dy b
y va
n R
hijn
and
col
leag
ues,
whi
ch r
epor
ted
med
ians
and
ran
ges.
Discussion
128
In the four studies reporting effectiveness outcomes, PDD was used during the initial TURBT. Patients were randomised to WLC- or WLC- and PDD-assisted TURBT,86,89,92 or WLC- or PDD-assisted TURBT.88 In the studies by Babjuk and colleagues,86 Denzinger and colleagues89 and Kriegmair and colleagues92 residual tumour in both groups was evaluated by WLC-assisted resection. However, in the study by Daniltchenko and colleagues88 residual tumour in both groups was evaluated by PDD-assisted resection. In three studies the patients were followed up using WLC and urinary cytology.86,88,89 (As the aim of the study by Kriegmair and colleagues92 was to assess residual tumour 10–14 days following TURBT there was no longer-term follow-up).
Adjuvant chemotherapyAdjuvant single-dose chemotherapy administered within the first 24 hours and ideally within the first 6 hours following TURBT is standard practice in the UK and much of Europe and can reduce recurrence rates by up to 50% in the first 2 years. However, the administration of adjuvant intravesical therapy varied across the four studies reporting effectiveness outcomes. The study by Kriegmair and colleagues92 did not state whether intravesical therapy was given. The study by Daniltchenko and colleagues88 reported that none of the patients received adjuvant intravesical therapy. In the study by Babjuk and colleagues86 none of the patients with grade 1 or grade 2 tumours received intravesical therapy, whereas all those with grade 3 tumours received intravesical BCG immunotherapy. In the study by Denzinger and colleagues89 patients with a solitary primary tumour staged pTaG1–G2 (low-risk group) did not receive intravesical therapy, whereas those with multifocal tumours staged pTaG1–G2 or pT1G1–G2 (intermediate-risk group) underwent mitomycin therapy and those with primary stage pT1G3, CIS or treatment failure with mitomycin (high-risk group) received BCG therapy. In this study, although there were consistently fewer recurrences for PDD compared with WLC across all risk groups, the difference in recurrence rates between PDD and WLC was smaller in the intermediate- and high-risk groups, both of which received adjuvant intravesical therapy, than it was in the low-risk group.89 The fact that adjuvant intravesical therapy was not given to all of the patients in all of the studies makes it difficult to assess what the true added value of PDD might be in reducing bladder tumour recurrence rates in routine practice.
Biomarker/cytology test performance in patients with a suspicion of bladder cancer and those with a history of non-muscle-invasive disease
It is possible that the diagnostic accuracy of urine biomarkers/cytology may differ in patients newly presenting with a suspicion of bladder cancer compared with those with a previous history of non-muscle-invasive disease. Most of the included studies contained a mixture of patients with a suspicion of bladder cancer and those with previously diagnosed disease but did not report results for these groups separately. However, in a few of the studies included in the pooled estimates that reported patient-level analysis the whole patient population consisted either of one or other of these groups. Table 54 shows, for each test, the median (range) sensitivity and specificity across studies containing those newly presenting with symptoms of bladder cancer and those with previously diagnosed non-muscle-invasive disease. For each test, both sensitivity and specificity were slightly higher for the studies containing patients newly presenting with symptoms of bladder cancer, although these results should be interpreted with caution as they are based on limited evidence, especially for FISH and ImmunoCyt.
Biomarkers as a replacement for cytologyIn the pooled estimates the lack of overlap of the CIs between the three biomarkers and cytology supported evidence of the biomarkers’ superior sensitivity over cytology. ImmunoCyt had the highest sensitivity (84%, 95% CI 77% to 91%), followed by FISH (76%, 95% CI 65% to 84%) and NMP22 (68%, 95% CI 62% to 74%), with cytology having the lowest sensitivity (44%, 95% CI 38% to 51%). This situation was reversed for specificity, with the lack of overlap of the CIs between cytology and the three biomarkers supporting evidence of cytology’s superior specificity over all three biomarkers. The specificity of cytology was 96% (95% CI 94% to 98%), compared with 85% (95% CI 78% to 92%) for FISH, 79% (95% CI 74% to 84%) for NMP22 and 75% (95% CI 68% to 73%) for ImmunoCyt. The question of whether biomarkers might replace cytology depends on the relative importance of higher sensitivity (fewer false-negative results) compared with higher specificity (fewer false-positive results). If the sensitivity of the test was seen as being more important than its specificity then a test such as ImmunoCyt could be regarded as a potential candidate for replacing cytology. However, if the specificity of the test
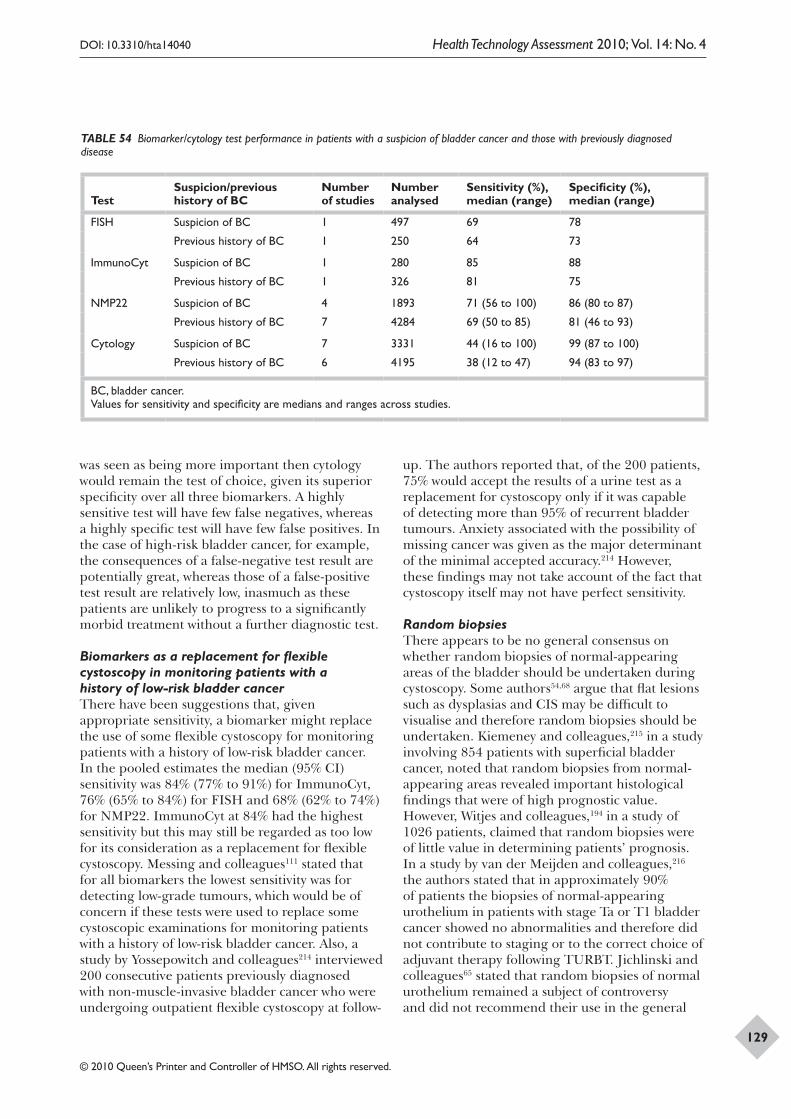
DOI: 10.3310/hta14040 Health Technology Assessment 2010; Vol. 14: No. 4
© 2010 Queen’s Printer and Controller of HMSO. All rights reserved.
129
TABLE 54 Biomarker/cytology test performance in patients with a suspicion of bladder cancer and those with previously diagnosed disease
TestSuspicion/previous history of BC
Number of studies
Number analysed
Sensitivity (%), median (range)
Specificity (%), median (range)
FISH Suspicion of BC 1 497 69 78
Previous history of BC 1 250 64 73
ImmunoCyt Suspicion of BC 1 280 85 88
Previous history of BC 1 326 81 75
NMP22 Suspicion of BC 4 1893 71 (56 to 100) 86 (80 to 87)
Previous history of BC 7 4284 69 (50 to 85) 81 (46 to 93)
Cytology Suspicion of BC 7 3331 44 (16 to 100) 99 (87 to 100)
Previous history of BC 6 4195 38 (12 to 47) 94 (83 to 97)
BC, bladder cancer.Values for sensitivity and specificity are medians and ranges across studies.
was seen as being more important then cytology would remain the test of choice, given its superior specificity over all three biomarkers. A highly sensitive test will have few false negatives, whereas a highly specific test will have few false positives. In the case of high-risk bladder cancer, for example, the consequences of a false-negative test result are potentially great, whereas those of a false-positive test result are relatively low, inasmuch as these patients are unlikely to progress to a significantly morbid treatment without a further diagnostic test.
Biomarkers as a replacement for flexible cystoscopy in monitoring patients with a history of low-risk bladder cancerThere have been suggestions that, given appropriate sensitivity, a biomarker might replace the use of some flexible cystoscopy for monitoring patients with a history of low-risk bladder cancer. In the pooled estimates the median (95% CI) sensitivity was 84% (77% to 91%) for ImmunoCyt, 76% (65% to 84%) for FISH and 68% (62% to 74%) for NMP22. ImmunoCyt at 84% had the highest sensitivity but this may still be regarded as too low for its consideration as a replacement for flexible cystoscopy. Messing and colleagues111 stated that for all biomarkers the lowest sensitivity was for detecting low-grade tumours, which would be of concern if these tests were used to replace some cystoscopic examinations for monitoring patients with a history of low-risk bladder cancer. Also, a study by Yossepowitch and colleagues214 interviewed 200 consecutive patients previously diagnosed with non-muscle-invasive bladder cancer who were undergoing outpatient flexible cystoscopy at follow-
up. The authors reported that, of the 200 patients, 75% would accept the results of a urine test as a replacement for cystoscopy only if it was capable of detecting more than 95% of recurrent bladder tumours. Anxiety associated with the possibility of missing cancer was given as the major determinant of the minimal accepted accuracy.214 However, these findings may not take account of the fact that cystoscopy itself may not have perfect sensitivity.
Random biopsiesThere appears to be no general consensus on whether random biopsies of normal-appearing areas of the bladder should be undertaken during cystoscopy. Some authors54,68 argue that flat lesions such as dysplasias and CIS may be difficult to visualise and therefore random biopsies should be undertaken. Kiemeney and colleagues,215 in a study involving 854 patients with superficial bladder cancer, noted that random biopsies from normal-appearing areas revealed important histological findings that were of high prognostic value. However, Witjes and colleagues,194 in a study of 1026 patients, claimed that random biopsies were of little value in determining patients’ prognosis. In a study by van der Meijden and colleagues,216 the authors stated that in approximately 90% of patients the biopsies of normal-appearing urothelium in patients with stage Ta or T1 bladder cancer showed no abnormalities and therefore did not contribute to staging or to the correct choice of adjuvant therapy following TURBT. Jichlinski and colleagues65 stated that random biopsies of normal urothelium remained a subject of controversy and did not recommend their use in the general
Discussion
130
population of patients with non-muscle-invasive bladder cancer.
Cost-effectiveness analysisStatement of principal findingsThe base-case analysis was based on a 5% prevalence rate of bladder cancer regardless of whether the cost-effectiveness measure was presented in terms of either cost per true positive case detected or cost per life-year. Flexible cystoscopy and ImmunoCyt followed by PDD in initial diagnosis and flexible cystoscopy followed by WLC in follow-up [CSC_IMM_PDD (CSC_WLC)], which produced on average 11.66 life-years and had a mean cost of £2370 per patient, was the most costly among the diagnostic strategies considered in this study. The CTL_WLC strategy was the least costly (£1043) and least effective (11.59 life-years). There were six ‘non-dominated’ or non-extendedly dominated strategies in the base-case model when outcomes were measured in terms of incremental cost per life-year: CTL_WLC (CTL_WLC), CTL_PDD (CTL_WLC), FISH_PDD (FISH_WLC), IMM_PDD (IMM_WLC), CSC_FISH_PDD (FISH_WLC) and CSC_IMM_PDD (CSC_WLC). Although the differences between these appear to be small in terms of cost and effects, it is important to remember that in only 5% of patients in the base-case analysis would testing provide any gain. The important issue is what society would be willing to pay for additional gain. The base-case results of the economic model indicated that the diagnostic strategy that would be cost-effective depends upon the value that society would be willing to pay to obtain an additional life-year. Cytology followed by WLC as the initial diagnosis and follow-up using the same interventions [CTL_WLC (CTL_WLC)] had a greater chance of being cost-effective when the willingness to pay was less than £20,000 per life-year. However, when the willingness to pay was increased to £30,000 per life-year IMM_PDD (IMM_WLC), FISH_PDD (FISH_WLC) and CSC_FISH_PDD (FISH_PDD) also had a greater probability of being cost-effective. Nevertheless, over most of the range of willingness to pay values there appeared to be no strategy that would have a likelihood of being cost-effective more than 50% of the time. For example, when the willingness to pay was over £10,000 per life-year the cost-effectiveness of FISH_PDD (FISH_WLC) ranged from 16% to 20%. Of note, however, is that four of the eight strategies considered in the probabilistic analysis were each associated with a 20% probability of being considered cost-effective at a range of values that society might be willing to pay. Three of these
four strategies involved the use of a biomarker and PDD.
Results of probabilistic sensitivity analyses performed to handle the uncertainty around the parameters within the model were broadly consistent with the point estimates in the base-case analysis and did not change the order of strategies in terms of cost. However, the likelihood that different strategies might be considered cost-effective changed when some of the parameters were varied. For example, the CSC_FISH_PDD (FISH_WLC) strategy had a 25% chance of being considered cost-effective when the prevalence rate was increased to 20% and society’s willingness to pay for a life-year was £20,000. There was some concern that, because of lack of data, the performance of flexible cystoscopy might be underestimated. Sensitivity analyses suggest that plausible (but contentious) increases in diagnostic performance would not alter the conclusions drawn.
In the cost–consequence analysis presented as part of the economic evaluation it was shown that the different strategies were likely to vary not only in terms of long-term performance but also in terms of short-term diagnostic performance. It is likely that patients will have preferences about these different short-term outcomes that would not be reflected in estimates of life-years or indeed in QALYs based upon standard generic instruments such as the EQ-5D. Furthermore, as indicated in Chapter 7 patients may also have preferences about the process of care (including the use of non-invasive tests). The net impact of including these other potential benefits is unclear at present and might be considered as an area for further research.
Strengths and limitations
This work is important as it is the first study to evaluate the cost-effectiveness of the diagnostic and follow-up strategies in patients with bladder cancer. The analysis considered the use of PDD, biomarkers and cytology, in a variety of combinations, using a decision tree and a Markov model.
A structured literature search was performed to identify existing economic analyses of the diagnosis and management of patients with bladder cancer. No studies were identified that directly compared the interventions under consideration. The approach adopted in this study provides an explicit, reproducible methodology with which to
DOI: 10.3310/hta14040 Health Technology Assessment 2010; Vol. 14: No. 4
© 2010 Queen’s Printer and Controller of HMSO. All rights reserved.
131
consider the interventions under consideration. Based on the relevant guidelines and detailed discussion with clinical experts involved in this study, the care pathways were developed to build up the structure of an economic model. The methods used to estimate the parameters used in the model were explicit and systematic and sought to identify the best available evidence.
Although the methods adopted to obtain the parameter estimates sought to identify the best evidence available, the results should be interpreted with caution as there are uncertainties and assumptions made in the economic model. For example, there was no evidence of what happens to patients who have false-negative results. It is likely that bladder cancers missed in initial diagnosis would not be treated until later, resulting in the risk of faster progression of disease. It was also difficult to identify suitable data on how quickly untreated bladder cancer progresses compared with treated bladder cancer. In the model a RR of progression or mortality comparing no treatment (false-negative results) with treatment (treatment of true positives) was used. In the base-case analysis it was assumed that the rate of RRs for progression (to muscle-invasive disease) and mortality for patients who did not receive treatment (i.e. those falsely diagnosed as negative) compared with those who did receive treatment (i.e. those correctly diagnosed as positive) was 2.56. It should be noted, however, that the sensitivity analysis that addressed this assumption had very little impact on the results because there were small differences in false-negative cases (or proportions) between strategies at the level of prevalence (5%) of bladder cancer considered in the base-case analysis, indicating that this variable might not be that important as a determinant of cost-effectiveness.
The model structure focused on the diagnosis and management of bladder cancer. The costs and benefits of identifying and treating other causes of the symptoms (e.g. upper urinary tract problems, etc.) that patients presented with have not been included. The net effect of not including this in a model is uncertain.
Besides the uncertainties surrounding the parameter estimates there were several other limitations to the report. One of the limitations of the economic evaluation was that it was not possible to perform analysis on the impact of diagnosis and treatment of bladder cancer on QoL as there were no data based on a generic economic tool. Although QoL data for other urological cancers
were available, after discussion with clinical experts they were deemed not to be generalisable to this group of patients. A simple sensitivity analysis suggested that the inclusion of QoL estimates may not greatly change the results. However, further research to elicit relevant health rate utilities would be useful.
Another challenge was that it was not possible to conduct subgroup analysis because of a lack of data relating to subgroups. The subgroups considered in this study were number of tumours on first cystoscopic examination; type of tumour; tumour recurrence at the first 3-month cystoscopic examination following TURBT; and diagnostic performance of the different PDD photosensitising agents. Also considered were types of tumour and tumour recurrence on diagnostic performance of the different categories of urine biomarker; and whether the urine sample for urine biomarkers was voided or obtained by bladder wash. More data are needed to perform these subgroup analyses.
Another limitation was the lack of evidence on the performance of flexible cystoscopy, although it is the most commonly used test in current UK practice. The reasons for lack of evidence for flexible cystoscopy may be attributable to the fact that it is an invasive procedure purely based on the judgement of the person performing it, making it difficult to evaluate the subjective outcome. Sensitivity analysis showed that potentially plausible improvements in the performance of flexible cystoscopy may not be meaningful.
Another limitation was the determination of the most appropriate value for the prevalence rate of bladder cancer in the population that presents with various symptoms of bladder cancer. There is evidence that the prevalence rate may vary depending on the symptoms that the patients present with. Ideally the population in the model should have been based on patients who had primary bladder cancer without a cancer history. However, it was difficult to establish relevant numbers from the review of effectiveness as the results were based on both first-time presentations as well as repeat patients. It can be argued that the prevalence rate considered in the model may either overestimate or underestimate the number of people with primary bladder cancer. Sensitivity analysis results indicated that the prevalence rate has a big impact on the cost-effectiveness results. At a low level of prevalence (e.g. 1%) it is most likely that the least costly strategy [CTL_WLC (CTL_WLC)] would be cost-effective over most of the
Discussion
132
strategy range for a cost per life-year that society might be willing to pay. At higher prevalences (e.g. 20%) it is more likely that the more costly but more effective strategies would be considered worthwhile. One implication of the sensitivity of the model to prevalence rates is that it suggests that should a subgroup of the population be identified that has a higher expected prevalence rate then it is possible that more effective (but more costly) strategies would be worthwhile for such patients. Further research could consider whether such subgroups could be identified.
The economic evaluation may suffer from other limitations in addition to those related to the evidence base. A number of assumptions were made with respect to the way that the decision tree and the Markov model were constructed. These assumptions were mostly made because of the lack of data to populate the model. As mentioned in Chapter 6, it was assumed that the cycle lengths for risk groups were the same during follow-up. Given the different intensities of follow-up for different types of bladder cancer, in practice there would be more than one opportunity per cycle for recurrent cancer to be diagnosed for some risk groups.
A further assumption was made regarding the management of patients following recurrent disease. During follow-up following treatment for bladder cancer, individuals could be incorrectly identified as still clear of cancer at a follow-up visit (i.e. be a false-negative). There were no data to help model the impact of missing a cancer on follow-up on mortality and progression. However, in our model all patients would have relatively frequent repeat testing during follow-up so the impact of this limitation is debatable.
Uncertainty in cost-effectiveness
Although cost-effectiveness analysis was performed using the best available data there was some uncertainty surrounding some of the parameters used in the model. One of these parameters was the risk group categorisation of non-muscle-invasive disease. The ideal categorisation would need to be based on all six prognostic risk factors and include long-term survival and disease-free information. As mentioned in Chapter 1, although the EORTC classification was the most recently recommended version and may have been the ideal one to be adopted in the model, it was not possible to use because of its complexity. Also, there were no reliable data associated with the risk groups. In
addition, the diagnostic technology for follow-up of bladder cancer may depend on the risk level for progression and recurrence, for example T1G3 and CIS will always be followed up using rigid cystoscopy. It is acknowledged that the definition of risk groups may affect the judgement of cost-effectiveness in the model. However, the sensitivity analysis suggested that there is only a slight impact on base-case analysis when the proportions of risk group are changed.
There was also uncertainty relating to survival and recurrence-free and progression-free survival data as they were only available up to 5 years post initial diagnosis. These data were extrapolated to predict cost-effectiveness up to 20 years. Data at 5 years suggested little difference in terms of survival and recurrence- and progression-free survival. However, results would be greatly strengthened if longer-term randomised data were available. For the purposes of the model the mortality, progression and recurrence rates were assumed to be constant over time. Given that data were extrapolated for 20 years in total, this assumption is perhaps unrealistic. However, it is unlikely that the effect of holding the recurrence, progression and mortality rates constant would have any impact on the direction of results.
The cost data used were also imprecise because the costs of diagnosis and treatments were mainly identified from NHS reference costs. As mentioned there were very few studies that collected data on resource utilisation and, what published data there were, were not generalisable to the UK. A further issue regarding costs was that inflation was not taken into account. For the purposes of the analysis all prices were taken for the year 2007. However, the costs identified from NHS reference costs, the paper by Rodgers and colleagues179 and the unpublished report for PDD were all 2006 costs. Normal practice within an economic evaluation would argue that such costs be inflated to the same base year allowing all costs to be comparable. The analyses conducted as part of this review, however, did not take into account inflation over time. However, it is anticipated that the failure to inflate the costs, given the similar price years of the data, may have little impact on the results.
One final point of uncertainty was the discount rate. The discount rates utilised followed published guidance relevant at the time that the technology assessment report was commissioned. Increases to the discount rate (mentioned in the methods

DOI: 10.3310/hta14040 Health Technology Assessment 2010; Vol. 14: No. 4
© 2010 Queen’s Printer and Controller of HMSO. All rights reserved.
133
chapter) would not change the overall direction of effects but are likely to make the more effective strategies (in terms of life-years) less likely to be
cost-effective. This is because these additional benefits accrue over time and hence are given less weight when the discount rate is increased.

DOI: 10.3310/hta14040 Health Technology Assessment 2010; Vol. 14: No. 4
© 2010 Queen’s Printer and Controller of HMSO. All rights reserved.
135
Implications for service provisionIn terms of test performance, PDD has higher sensitivity than WLC [pooled estimates for biopsy-level analysis: 93% (95% CI 90% to 96%) versus 65% (95% CI 55% to 74%) respectively] in detecting bladder cancer in patients with symptoms such as haematuria and is better at detecting more aggressive, higher risk tumours, including CIS [median (range) sensitivity across studies for biopsy-level analysis: 99% (54% to 100%) versus 67% (0% to 100%) respectively]. However, PDD has lower specificity than WLC [pooled estimates for biopsy-level analysis: 60% (95% CI 49% to 71%) versus 81% (95% CI 73% to 90%) respectively]. The advantages of higher sensitivity (fewer false-negative results, better detection of higher risk tumours) have to be weighed against the disadvantages of lower specificity (more false-positive results, leading to additional unnecessary biopsies and potentially additional unnecessary investigations and the resulting anxiety caused to patients and their families).
In terms of the photosensitising agents used, across studies the median (range) specificity reported for HAL was higher than that of 5-ALA for both patient-level [81% (43% to 100%) compared with 52% (33 to 67%)] and biopsy-level [80% (58% to 100%) compared with 57% (32% to 67%)] detection of bladder cancer, although the ranges were wide and factors other than the agent used may also have contributed to the specificity values reported.
Compared with WLC, the use of PDD at TURBT results in fewer residual tumours at check cystoscopy (pooled estimate RR 0.37, 95% CI 0.20 to 0.69) and longer recurrence-free survival (pooled estimate RR 1.37, 95% CI 1.18 to 1.59), although these results are based on limited evidence (three and two studies respectively) and should be interpreted with caution. The advantages of PDD at TURBT in reducing tumour recurrence (pooled estimate RR 0.64, 95% CI 0.39 to 1.06) and progression (pooled estimate RR 0.57, 95% CI 0.22 to 1.46) in the longer term were less clear (based on two studies, one with 5 years’ and one with 8 years’ follow-up). In addition, as adjuvant
single-dose intravesical therapy following TURBT (standard practice in the UK and much of Europe) was not given to all of the patients in all of the studies it is difficult to assess what the true added value of PDD over WLC might be in routine clinical practice in terms of outcomes such as residual tumour at check cystoscopy, tumour recurrence and progression. However, single-dose intravesical chemotherapy is known to be ineffective against high-risk tumours, the types more likely to be detected by PDD.
All three biomarkers had higher sensitivity but lower specificity than cytology for detecting bladder cancer in patients with symptoms such as haematuria. In the pooled estimates (95% CI) ImmunoCyt had the highest sensitivity [84% (77% to 91%)], followed by FISH [76% (65% to 84%)], NMP22 [68% (62% to 74%)] and cytology [44% (38% to 51%)], whereas cytology had the highest specificity [96% (94% to 98%)], followed by FISH [85% (78% to 92%)], NMP22 [79% (74% to 84%)] and ImmunoCyt [75% (68% to 83%)]. ImmunoCyt [84% (95% CI 77% to 91%)] had higher sensitivity than NMP22 [68% (95% CI 62% to 74%)], with the lack of overlap between the CIs supporting evidence of a difference in sensitivity in favour of ImmunoCyt. FISH [76% (95% CI 65% to 84%)] also had higher sensitivity than NMP22 although the difference in sensitivity was more uncertain as the CIs overlapped. All three biomarkers and cytology were better at detecting more aggressive, higher risk tumours [median (range) sensitivity across studies: FISH 95% (50% to 100%), ImmunoCyt 90% (67% to 100%), NMP22 83% (0% to 100%), cytology 69% (0% to 100%)] than lower risk, less aggressive tumours [ImmunoCyt 81% (55% to 90%), FISH 65% (32% to 100%), NMP22 50% (0% to 86%), cytology 27% (0% to 93%)]. A urine biomarker test such as ImmunoCyt could potentially replace some cytology tests if higher sensitivity (fewer false negatives) was considered more important than higher specificity (fewer false positives). However, if higher specificity was considered to be more important then cytology would remain the test of choice.
The most cost-effective strategy for diagnosis and follow-up of bladder cancer patients amongst PDD,
Chapter 9 Conclusions
Conclusions
136
WLC, biomarkers, cytology and flexible cystoscopy was evaluated. Based on currently available data and taking into account the assumptions made in the model, the strategy of flexible cystoscopy and ImmunoCyt followed by PDD in initial diagnosis and flexible cystoscopy followed by WLC in follow-up is likely to be the most costly and the most effective (£2370 per patient and 11.66 life-years). The strategy of cytology followed by WLC in initial diagnosis and follow-up is likely to be the least costly (£1043 per patient) and least effective in terms of life-years (11.59) per patient. Compared with WLC in each strategy, PDD is more likely to be cost-effective. However, it should be noted that the diagnostic strategy that would be cost-effective depends upon the value that society would be willing to pay to obtain an additional life-year. There appeared to be no strategy that would have a likelihood of being cost-effective more than 50% of the time over most of the range of willingness to pay values. Nevertheless, the four strategies involving PDD and biomarkers were cumulatively associated with over a 70% likelihood of being considered cost-effective. The strategies of ImmunoCyt or FISH followed by PDD in initial diagnosis and ImmunoCyt or FISH followed by WLC in follow-up may be considered to be the most cost-effective when the willingness to pay is over £20,000.
In summary, given the evidence presented a judgement needs to be made as to whether the current ‘standard’ strategies with regard to diagnosis and follow-up of bladder cancer should be altered. Currently, there is no standard strategy for the detection and follow-up of primary bladder cancer. The implications of the finding that diagnostic strategies involving ImmunoCyt or FISH and PDD appear to have potential long-term outcome benefits compared with current commonly used strategies involving cytology or flexible cystoscopy need to be considered. Diagnostic strategies involving ImmunoCyt or FISH and PDD may also have potential short-term benefits, such as more true-positive cases detected and less false-negative cases missed. However, any decision needs to take into account the extra costs associated with PDD and indeed whether the probable gains in QoL justify this increased cost.
In the sensitivity analyses no strategy was likely to have more than a 50% probability of being cost-effective. This suggests that either the evidence base is insufficient to warrant a change in practice or we are indifferent between several strategies in terms of cost-effectiveness, or more likely a combination of these two factors.
There were no data on the combination of flexible cystoscopy and cytology, the tests that are involved in current commonly used strategies. Also, as there were no data available with which to explicitly incorporate QoL within the model, a judgement needs to be made as to whether the expected gain in QoL is sufficient to offset any extra cost.
Currently, PDD is used in only a few centres in the UK and therefore the impact on the use of operating theatres arising from an increase in the use of PDD would need to be considered. Learning to use PDD should be straightforward for an experienced cystoscopist and the training period should be relatively short.
Suggested research prioritiesFurther research is required in the following areas:
• RCTs comparing PDD with rigid WLC plus adjuvant intravesical therapy at TURBT in patients presumed to have non-muscle-invasive bladder cancer. The design of such studies should take into account participant characteristic risk groups, for example smoking and age, and allow outcomes to be reported based on risk categories at randomisation. Clinical effectiveness outcomes should include residual tumour rates at first check cystoscopy, recurrence-free survival, tumour recurrence rates, time to first recurrence, and progression. Such studies should make provision for longer-term follow-up (up to 10 years) and as a matter of course include an economic evaluation and measurement of health state utilities for incorporation into a cost–utility analysis.
• Diagnostic cross-sectional studies comparing FISH with ImmunoCyt, NMP22 BladderChek point of care test and voided urine cytology, and also combinations of these tests, against a reference standard of cystoscopy with histological assessment of biopsied tissue in the same patient population. The patient population would be those newly presenting with symptoms suspicious for bladder cancer and those with previously diagnosed non-muscle-invasive bladder cancer. The studies should report true and false positives and negatives for a patient-level analysis of the whole patient group and also for the suspicion of bladder cancer/previously diagnosed disease subgroups. For each of these groups the studies should report the sensitivity of the tests in detecting stage (pTa, pT1, ≥ pT2, CIS)
DOI: 10.3310/hta14040 Health Technology Assessment 2010; Vol. 14: No. 4
© 2010 Queen’s Printer and Controller of HMSO. All rights reserved.
137
and grade (G1, G2, G3) of tumour, and size (< 1 cm, 1–3 cm, > 3cm) and number (one, two to three, more than three) of tumours. Upper tract end points should also be considered. Observer variability in the interpretation of tests should also be reported. There should be formal follow-up of patients who are categorised as negative for bladder cancer to better understand the consequences of false-negative case ascertainment. The results of such studies should be incorporated into a refined economic model that fully reflects the pragmatic factors listed above.
• In addition, BAUS and the Renal Association have recently produced a new diagnostic algorithm for the diagnosis of patients with haematuria. This would be an appropriate setting for further evaluating novel urinary biomarkers such as ImmunoCyt and FISH and also for assessing their performance in specific populations with a higher prevalence of bladder cancer, such as men aged over 60 years who smoke.
• The level of QoL data suitable for incorporation into an economic model. Consideration should be given to the collection
of data suitable to expand on economic evaluations from cost-effectiveness analyses. Such data may be derived from further prospective studies or stand-alone studies that seek to identify health state utilities relevant to a refined economic model.
• The different strategies differ in terms of longer-term outcomes and also in terms of the process of care and short-term outcomes. This suggests that consideration should be given to preference elicitation studies using recognised methodology that explore the trade-offs and valuations between processes and health outcomes. Such analysis should be conducted in such a way that it can be incorporated into future models based on trial-based analysis.
• False-negative results, either at diagnosis or at follow-up, will prevent or at least delay those patients from receiving potentially beneficial treatment. Further information is required as to what would happen to these patients in practice and the impact of an incorrect diagnosis on future survival, QoL and costs. Such information could be identified through follow-up of patients who are discharged following an initial negative result.

DOI: 10.3310/hta14040 Health Technology Assessment 2010; Vol. 14: No. 4
© 2010 Queen’s Printer and Controller of HMSO. All rights reserved.
139
Acknowledgements
We thank Satchi Swami for advice on clinical aspects of the review, Adrian Grant for
commenting on drafts, Clare Robertson and Susan Wong for assistance with assessing full-text studies for inclusion, data extraction and quality assessment, Clare Robertson for preparation of the characteristics of the included studies tables and Kathleen McIntosh and Karen McLeod for secretarial support. We thank the British Association of Urological Surgeons (BAUS) Section of Oncology Executive Committee for its suggestions as to which biomarkers the review might consider. The Health Services Research Unit and Health Economics Research Unit, Institute of Applied Health Sciences, University of Aberdeen, are core funded by the Chief Scientist Office of the Scottish Government Health Directorates. The views expressed are those of the authors and not necessarily those of the funding bodies. Any errors are the responsibility of the authors.
Contribution of authors
Graham Mowatt (Research Fellow) screened the search results, assessed full-text studies for
inclusion, undertook data extraction and quality assessment, drafted the chapters on photodynamic diagnosis and biomarkers, and coordinated the review. Shihua Zhu (TAR Training Fellow) and Mary Kilonzo (Research Fellow) drafted the chapter on cost-effectiveness, supervised by Luke Vale (Professor of Health Technology Assessment). Shihua Zhu, TR Leyshon Griffiths (Senior Lecturer and Honorary Consultant Urological Surgeon) and Ghulam Nabi (Clinical Lecturer in Urology) drafted the background chapter. Charles Boachie (Statistician) drafted the data analysis section of the review and conducted the statistical analysis, supervised by Jonathan Cook (Statistician). TR Leyshon Griffiths, James N’Dow (Professor of Urology) and Ghulam Nabi provided expert advice on clinical aspects of the review. Cynthia Fraser (Information Officer) developed and ran the search strategies, obtained papers and formatted the references. All authors assisted in preparing the manuscript, reading and commenting on drafts, and reading the final draft.

DOI: 10.3310/hta14040 Health Technology Assessment 2010; Vol. 14: No. 4
© 2010 Queen’s Printer and Controller of HMSO. All rights reserved.
141
1. World Health Organization. International classificiation of diseases and related health problems (ICD) 10th revision. Geneva: World Health Organization; 2007. URL: www.who.int/classifications/apps/icd/icd10online/. Accesssed July 2008.
2. UroVysion fluorescence in situ hybridisation (FISH) assay. MSAC Application 1084. Canberra: Medical Services Advisory Committee; 2005. URL: www.msac.gov.au/internet/msac/publishing.nsf/Content/4753418A5C8F33DDCA25745E000A3933/$File/1084%20-%20UroVysion%20Report.pdf. Accesssed September 2008.
3. Babjuk M, Oosterlinck W, Sylvester R, Kaasinen E, Bohle A, Palou J. Guidelines on TaT1 (non-muscle-invasive) bladder cancer [document on the internet]. Arnhem: European Association of Urology; 2009 [accesssed May 2009]. URL: www.uroweb.org/fileadmin/tx_eauguidelines/2009/Full/TaT1_BC.pdf.
4. Kirkali Z, Chan T, Manoharan M, Algaba F, Busch C, Cheng L, et al. Bladder cancer: epidemiology, staging and grading, and diagnosis. Urology 2005;66:4–34.
5. Hall MC, Chang SS, Dalbagni G, Pruthi RS, Schellhammer PF, Seigne JD, et al. Guideline for the management of nonmuscle invasive bladder cancer: (stages Ta,T1 and Tis). 2007 update. Linthicum, MD: American Urological Association; 2007. URL: www.auanet.org/guidelines/bladcan07.cfm. Accesssed July 2008.
6. Brennan P, Bogillot O, Cordier S, Greiser E, Schill W, Vineis P, et al. Cigarette smoking and bladder cancer in men: a pooled analysis of 11 case–control studies. Int J Cancer 2000;86:289–94.
7. Brennan P, Bogillot O, Greiser E, Chang-Claude J, Wahrendorf J, Cordier S, et al. The contribution of cigarette smoking to bladder cancer in women (pooled European data). Cancer Causes Control 2001;12:411–7.
8. Occupational bladder cancer: a guide for clinicians. The BAUS Subcommittee on Industrial Bladder Cancer. Br J Urol 1988;61:183–91.
9. Steinmaus CM, Nunez S, Smith AH. Diet and bladder cancer: a meta-analysis of six dietary variables. Am J Epidemiol 2000;151:693–702.
10. Murta-Nascimento C, Schmitz-Drager BJ, Zeegers MP, Steineck G, Kogevinas M, Real FX, et al. Epidemiology of urinary bladder cancer: from tumor development to patient’s death. World J Urol 2007;25:285–95.
11. Boorjian S, Cowan JE, Konety BR, DuChane J, Tewari A, Carroll PR, et al. Bladder cancer incidence and risk factors in men with prostate cancer: results from Cancer of the Prostate Strategic Urologic Research Endeavor. J Urol 2007;177:883–7.
12. Duncan RE, Bennett DW, Evans AT, Aron BS, Schellhas HF. Radiation-induced bladder tumors. J Urol 1977;118:43–5.
13. Garcia-Closas M, Malats N, Silverman D, Dosemeci M, Kogevinas M, Hein DW, et al. NAT2 slow acetylation, GSTM1 null genotype, and risk of bladder cancer: results from the Spanish Bladder Cancer Study and meta-analyses. Lancet 2005;366:649–59.
14. Engel LS, Taioli E, Pfeiffer R, Garcia-Closas M, Marcus PM, Lan Q, et al. Pooled analysis and meta-analysis of glutathione S-transferase M1 and bladder cancer: a HuGE review. Am J Epidemiol 2002;156:95–109.
15. Newling DW, Robinson MR, Smith PH, Byar D, Lockwood R, Stevens I, et al. Tryptophan metabolites, pyridoxine (vitamin B6) and their influence on the recurrence rate of superficial bladder cancer. Results of a prospective, randomised phase III study performed by the EORTC GU Group. EORTC Genito-Urinary Tract Cancer Cooperative Group. Eur Urol 1995;27:110–6.
16. Sobin DH, Witteking CH, editors. TNM classification of malignant tumours. 6th edn. New York: Wiley-Liss; 2002.
17. Mostofi FK. International histologic classification of tumors. A report by the Executive Committee of the International Council of Societies of Pathology. Cancer 1974;33:1480–4.
18. Harnden P. A critical appraisal of the classification of urothelial tumours: time for a review of the evidence and a radical change? BJU Int 2007;99:723–5.
19. Sylvester RJ, van der Meijden AP, Lamm DL. Intravesical bacillus Calmette-Guerin reduces the
References
References
142
risk of progression in patients with superficial bladder cancer: a meta-analysis of the published results of randomized clinical trials. J Urol 2002;168:1964–70.
20. Sylvester RJ, van der Meijden AP, Oosterlinck W, Witjes JA, Bouffioux C, Denis L, et al. Predicting recurrence and progression in individual patients with stage Ta T1 bladder cancer using EORTC risk tables: a combined analysis of 2596 patients from seven EORTC trials. Eur Urol 2006;49:466–77.
21. Heney NM, Ahmed S, Flanagan MJ, Frable W, Corder MP, Hafermann MD, et al. Superficial bladder cancer: progression and recurrence. J Urol 1983;130:1083–6.
22. Cancer Research UK. UK bladder cancer statistics. 2007. URL: http://info.cancerresearchuk.org/cancerstats/types/bladder/?a=5441. Accesssed July 2008.
23. Hayne D, Arya M, Quinn MJ, Babb PJ, Beacock CJ, Patel HR. Current trends in bladder cancer in England and Wales. J Urol 2004;172:1051–5.
24. National Comprehensive Cancer Network. NCCN clinical practice guidelines in oncology. Bladder cancer including upper tract tumours and urothelial carcinoma of the prostate. V.2.2008. Fort Washington, PA: National Comprehensive Cancer Network; 2008. URL: www.nccn.org/professionals/physician_gls/PDF/bladder.pdf. Accesssed July 2008.
25. Edwards TJ, Dickinson AJ, Natale S, Gosling J, McGrath JS. A prospective analysis of the diagnostic yield resulting from the attendance of 4020 patients at a protocol-driven haematuria clinic. BJU Int 2006;97:301–5.
26. Khadra MH, Pickard RS, Charlton M, Powell PH, Neal DE. A prospective analysis of 1,930 patients with hematuria to evaluate current diagnostic practice. J Urol 2000;163:524–7.
27. Pashos CL, Botteman MF, Laskin BL, Redaelli A. Bladder cancer: epidemiology, diagnosis, and management. Cancer Pract 2002;10:311–22.
28. BAUS Section of Oncology, British Uro-oncology Group (BUG). MDT (multi-disciplinary team) guidance for the managing of bladder cancer [document on the internet]. London: British Association of Urological Surgeons; 2007 [accesssed July 2008]. URL: www.bauslibrary.co.uk/PDFS/BSONC/MDT%20guidance%20for%20bladder%20cancer.pdf.
29. Hall RR, et al. Proposal for changes in cystoscopic follow up of patients with bladder cancer and adjuvant intravesical chemotherapy. BMJ 1994;308:257–60.
30. Mead GM, Russell M, Clark P, Harland SJ, Harper PG, Cowan R, et al. A randomized trial comparing methotrexate and vinblastine (MV) with cisplatin, methotrexate and vinblastine (CMV) in advanced transitional cell carcinoma: results and a report on prognostic factors in a Medical Research Council study. MRC Advanced Bladder Cancer Working Party. Br J Cancer 1998;78:1067–75.
31. Saxman SB, Propert KJ, Einhorn LH, Crawford ED, Tannock I, Raghavan D, et al. Long-term follow-up of a phase III intergroup study of cisplatin alone or in combination with methotrexate, vinblastine, and doxorubicin in patients with metastatic urothelial carcinoma: a cooperative group study. J Clin Oncol 1997;15:2564–9.
32. Sangar VK, Ragavan N, Matanhelia SS, Watson MW, Blades RA. The economic consequences of prostate and bladder cancer in the UK. BJU Int 2005;95:59–63.
33. Bosanquet N, Sikora K. The economics of cancer care in the UK. Lancet Oncol 2004;5:568–74.
34. Impoving outcomes in urological cancers. Guidance on cancer services: the manual. London: National Institute for Clinical Excellence; 2002. URL: www.nice.org.uk/nicemedia/pdf/Urological_Manual.pdf. Accesssed July 2008.
35. National Institute for Clinical Excellence. Laparoscopic cystectomy. Interventional procedures guidance IPG026. London: National Institute for Clinical Excellence; 2003. URL: www.nice.org.uk/nicemedia/pdf/ip/ipg026guidance.pdf. Accesssed July 2008.
36. Scottish Intercollegiate Guidelines Network. Management of transitional cell carcinoma of the bladder. SIGN Guideline No. 85. Edinburgh: Scottish Intercollegiate Guidelines Network; 2005. URL: www.sign.ac.uk/pdf/sign85.pdf. Accesssed July 2008.
37. National Institute for Health and Clinical Excellence. Intravesical microwave hyperthermia with intravesical chemotherapy for superficial bladder cancer. Interventional procedure guidance IPG235. London: National Institute for Health and Clinical Excellence; 2007. URL: www.nice.org.uk/Guidance/IPG235/Guidance/pdf/English. Accesssed July 2008.
38. Foster M, Barnish L, Tudway D, Guest P, James N, McGarr C, et al. Guidelines for the management of bladder. Birmingham: NHS Pan-Birmingham Cancer Network; 2007. URL: www.birminghamcancer.nhs.uk/viewdoc.ashx?id=wORYwedcX6oZ1cEsM0xp6g%3d%3d. Accesssed July 2008.
39. National Screening Committee. Evaluation of urinary tract malignancy (bladder cancer) screening against NSC criteria. London: UK
DOI: 10.3310/hta14040 Health Technology Assessment 2010; Vol. 14: No. 4
© 2010 Queen’s Printer and Controller of HMSO. All rights reserved.
143
National Screening Committee; 2002. URL: www.library.nhs.uk/screening/ViewResource.aspx?resID=60477&tabID=288. Accesssed July 2008.
40. Stenzl A, Cowan NC, de Santis M, Jakse G, Kuczyk M, Merseburger MS, et al. Guideline on bladder cancer: muscle-invasive and metastatic [document on the internet]. Arnhem: European Association of Urology; 2009 [accesssed July 2008]. URL: www.uroweb.org/fileadmin/tx_eauguidelines/2009/Full/Muscle-Invasive_BC.pdf.
41. Lokeshwar VB, et al. Bladder tumor markers beyond cytology: International Consensus Panel on bladder tumor markers. Urology 2005;66:35–63.
42. Marti A, Jichlinski P, Lange N, Ballini JP, Guillou L, Leisinger HJ, et al. Comparison of aminolevulinic acid and hexylester aminolevulinate induced protoporphyrin IX distribution in human bladder cancer. J Urol 2003;170:428–32.
43. Grossman HB, Blute ML, Dinney CP, Jones JS, Liou LS, Reuter VE, et al. The use of urine-based biomarkers in bladder cancer. Urology 2006;67:62–4.
44. Wazait HD, Al Bhueissi SZ, Patel HR, Nathan MS, Miller RA. Long-term surveillance of bladder tumours: current practice in the United Kingdom and Ireland. Eur Urol 2003;43:485–8.
45. Chahal R, Darshane A, Browning AJ, Sundaram SK. Evaluation of the clinical value of urinary NMP22 as a marker in the screening and surveillance of transitional cell carcinoma of the urinary bladder. Eur Urol 2001;40:415–20.
46. Whiting P, Rutjes AW, Reitsma JB, Bossuyt PM, Kleijnen J. The development of QUADAS: a tool for the quality assessment of studies of diagnostic accuracy included in systematic reviews. BMC Med Res Methodol 2003;3:25.
47. Verhagen AP, de Vet HC, de Bie RA, Kessels AG, Boers M, Bouter LM, et al. The Delphi list: a criteria list for quality assessment of randomized clinical trials for conducting systematic reviews developed by Delphi consensus. J Clin Epidemiol 1998;51:1235–41.
48. Macaskill P. Empirical Bayes estimates generated in a hierarchical summary ROC analysis agreed closely with those of a full Bayesian analysis. J Clin Epidemiol 2004;57:925–32.
49. Rutter CM, Gatsonis CA. A hierarchical regression approach to meta-analysis of diagnostic test accuracy evaluations. Stat Med 2001;20:2865–84.
50. Cheng CW, Lau WK, Tan PH, Olivo M. Cystoscopic diagnosis of bladder cancer by intravesical
instillation of 5-aminolevulinic acid induced porphyrin fluorescence – the Singapore experience. Ann Acad Med Singapore 2000;29:153–8.
51. Colombo R, Naspro R, Bellinzoni P, Fabbri F, Guazzoni G, Scattoni V, et al. Photodynamic diagnosis for follow-up of carcinoma in situ of the bladder. Therap Clin Risk Manag 2007;3:1003–7.
52. D’Hallewin MA, De Witte PA, Waelkens E, Merlevede W, Baert L. Fluorescence detection of flat bladder carcinoma in situ after intravesical instillation of hypericin. J Urol 2000;164:349–51.
53. De Dominicis C, Liberti M, Perugia G, De Nunzio C, Sciobica F, Zuccala A, et al. Role of 5-aminolevulinic acid in the diagnosis and treatment of superficial bladder cancer: improvement in diagnostic sensitivity. Urology 2001;57:1059–62.
54. Ehsan A, Sommer F, Haupt G, Engelmann U. Significance of fluorescence cystoscopy for diagnosis of superficial bladder cancer after intravesical instillation of delta aminolevulinic acid. Urol Int 2001;67:298–304.
55. Filbeck T, Roessler W, Knuechel R, Straub M, Kiel HJ, Wieland WF. 5-aminolevulinic acid-induced fluorescence endoscopy applied at secondary transurethral resection after conventional resection of primary superficial bladder tumors. Urology 1999;53:77–81.
56. Filbeck T, Roessler W, Knuechel R, Straub M, Kiel HJ, Wieland WF. Clinical results of the transurethral resection and evaluation of superficial bladder carcinomas by means of fluorescence diagnosis after intravesical instillation of 5-aminolevulinic acid. J Endourol 1999;13:117–21.
57. Fradet Y, Grossman HB, Gomella L, Lerner S, Cookson M, Albala D, et al. A comparison of hexaminolevulinate fluorescence cystoscopy and white light cystoscopy for the detection of carcinoma in situ in patients with bladder cancer: a phase III, multicenter study. J Urol 2007;178:68–73.
58. Frimberger D, Zaak D, Stepp H, Knuchel R, Baumgartner R, Schneede P, et al. Autofluorescence imaging to optimize 5-ALA-induced fluorescence endoscopy of bladder carcinoma. Urology 2001;58:372–5.
59. Grimbergen MC, van Swol CF, Jonges TG, Boon TA, van Moorselaar RJ. Reduced specificity of 5-ALA induced fluorescence in photodynamic diagnosis of transitional cell carcinoma after previous intravesical therapy. Eur Urol 2003;44:51–6.
60. Hendricksen K, Moonen PM, der Heijden AG, Witjes JA. False-positive lesions detected by
References
144
fluorescence cystoscopy: any association with p53 and p16 expression? World J Urol 2006;24:597–601.
61. Hungerhuber E, Stepp H, Kriegmair M, Stief C, Hofstetter A, Hartmann A, et al. Seven years’ experience with 5-aminolevulinic acid in detection of transitional cell carcinoma of the bladder. Urology 2007;69:260–4.
62. Jeon SS, Kang I, Hong JH, Choi HY, Chai SE. Diagnostic efficacy of fluorescence cystoscopy for detection of urothelial neoplasms. J Endourol 2001;15:753–9.
63. Jichlinski P, Forrer M, Mizeret J, Glanzmann T, Braichotte D, Wagnieres G, et al. Clinical evaluation of a method for detecting superficial surgical transitional cell carcinoma of the bladder by light-induced fluorescence of protoporphyrin IX following the topical application of 5-aminolevulinic acid: preliminary results. Lasers Surg Med 1997;20:402–8.
64. Jichlinski P, Wagnieres G, Forrer M, Mizeret J, Guillou L, Oswald M, et al. Clinical assessment of fluorescence cytoscopy during transurethral bladder resection in superficial bladder cancer. Urol Res 1997;25:S3–6.
65. Jichlinski P, Guillou L, Karlsen SJ, Malmstrom PU, Jocham D, Brennhovd B, et al. Hexyl aminolevulinate fluorescence cystoscopy: new diagnostic tool for photodiagnosis of superficial bladder cancer – a multicenter study. J Urol 2003;170:226–9.
66. Jocham D, Witjes F, Wagner S, Zeylemaker B, van Moorselaar J, Grimm MO, et al. Improved detection and treatment of bladder cancer using hexaminolevulinate imaging: a prospective, phase III multicenter study. J Urol 2005;174:862–6.
67. Koenig F, McGovern FJ, Larne R, Enquist H, Schomacker KT, Deutsch TF. Diagnosis of bladder carcinoma using protoporphyrin IX fluorescence induced by 5-aminolaevulinic acid. BJU Int 1999;83:129–35.
68. Kriegmair M, Baumgartner R, Knuechel R, Steinbach P, Ehsan A, Lumper W, et al. Fluorescence photodetection of neoplastic urothelial lesions following intravesical instillation of 5-aminolevulinic acid. Urology 1994;44:836–41.
69. Kriegmair M, Stepp H, Steinbach P, Lumper W, Ehsan A, Stepp HG, et al. Fluorescence cystoscopy following intravesical instillation of 5-aminolevulinic acid: a new procedure with high sensitivity for detection of hardly visible urothelial neoplasias. Urol Int 1995;55:190–6.
70. Kriegmair M, Baumgartner R, Knuchel R, Stepp H, Hofstadter F, Hofstetter A. Detection of early bladder cancer by 5-aminolevulinic acid induced porphyrin fluorescence. J Urol 1996;155:105–9.
71. Kriegmair M, Zaak D, Stepp H, Stepp H, Baumgartner R, Knuechel R, et al. Transurethral resection and surveillance of bladder cancer supported by 5-aminolevulinic acid-induced fluorescence endoscopy. Eur Urol 1999;36:386–92.
72. Landry JL, Gelet A, Bouvier R, Dubernard JM, Martin X, Colombel M. Detection of bladder dysplasia using 5-aminolaevulinic acid-induced porphyrin fluorescence. BJU Int 2003;91:623–6.
73. Riedl CR, Plas E, Pfluger H. Fluorescence detection of bladder tumors with 5-amino-levulinic acid. J Endourol 1999;13:755–9.
74. Schneeweiss S, Kriegmair M, Stepp H. Is everything all right if nothing seems wrong? A simple method of assessing the diagnostic value of endoscopic procedures when a gold standard is absent. J Urol 1999;161:1116–9.
75. Schneeweiss S. Sensitivity analysis of the diagnostic value of endoscopies in cross-sectional studies in the absence of a gold standard. Int J Technol Assess Health Care 2000;16:834–41.
76. Sim HG, Lau WK, Olivo M, Tan PH, Cheng CW. Is photodynamic diagnosis using hypericin better than white-light cystoscopy for detecting superficial bladder carcinoma? BJU Int 2005;95:1215–8.
77. Song X, Ye Z, Zhou S, Yang W, Zhang X, Liu J, et al. The application of 5-aminolevulinic acid-induced fluorescence for cystoscopic diagnosis and treatment of bladder carcinoma. Photodiagnosis Photodyn Ther 2007;4:39–43.
78. Szygula M, Wojciechowski B, Adamek M, Pietrusa A, Kawczyk-Krupka A, Cebula W, et al. Fluorescent diagnosis of urinary bladder cancer – a comparison of two diagnostic modalities. Photodiagnosis Photodyn Ther 2004;1:23–6.
79. Szygula M, Wojciechowski B, Adamek M, Kawczyk-Krupka A, Cebula W, Zieleznik W, et al. Photodynamic vs autofluorescent diagnosis of urinary bladder using Xillix LIFE system. Phys Med 2004;20:55–7.
80. Tritschler S, Scharf S, Karl A, Tilki D, Knuechel R, Hartmann A, et al. Validation of the diagnostic value of NMP22 BladderChek test as a marker for bladder cancer by photodynamic diagnosis. Eur Urol 2007;51:403–7.
81. Witjes JA, Moonen PM, van der Heijden AG. Comparison of hexaminolevulinate based flexible
DOI: 10.3310/hta14040 Health Technology Assessment 2010; Vol. 14: No. 4
© 2010 Queen’s Printer and Controller of HMSO. All rights reserved.
145
and rigid fluorescence cystoscopy with rigid white light cystoscopy in bladder cancer: results of a prospective Phase II study. Eur Urol 2005;47:319–22.
82. Zaak D, Kriegmair M, Stepp H, Stepp H, Baumgartner R, Oberneder R, et al. Endoscopic detection of transitional cell carcinoma with 5-aminolevulinic acid: results of 1012 fluorescence endoscopies. Urology 2001;57:690–4.
83. Zaak D, Hungerhuber E, Schneede P, Stepp H, Frimberger D, Corvin S, et al. Role of 5-aminolevulinic acid in the detection of urothelial premalignant lesions. Cancer 2002;95:1234–8.
84. Zaak D, Stepp H, Baumgartner R, Schneede P, Waidelich R, Frimberger D, et al. Ultraviolet-excited (308 nm) autofluorescence for bladder cancer detection. Urology 2002;60:1029–33.
85. Zumbraegel A, Bichler KH, Krause FS, Feil G, Nelde HJ. The photodynamic diagnosis (PDD) for early detection of carcinoma and dysplasia of the bladder. Adv Exp Med Biol 2003;539:61–6.
86. Babjuk M, Soukup V, Petrik R, Jirsa M, Dvoracek J. 5-aminolaevulinic acid-induced fluorescence cystoscopy during transurethral resection reduces the risk of recurrence in stage Ta/T1 bladder cancer. BJU Int 2005;96:798–802.
87. Burger M, Zaak D, Stief CG, Filbeck T, Wieland WF, Roessler W, et al. Photodynamic diagnostics and noninvasive bladder cancer: is it cost-effective in long-term application? A Germany-based cost analysis. Eur Urol 2007;52:142–7.
88. Daniltchenko DI, Riedl CR, Sachs MD, Koenig F, Daha KL, Pflueger H, et al. Long-term benefit of 5-aminolevulinic acid fluorescence assisted transurethral resection of superficial bladder cancer: 5-year results of a prospective randomized study. J Urol 2005;174:2129–33.
89. Denzinger S, Burger M, Walter B, Knuechel R, Roessler W, Wieland WF, et al. Clinically relevant reduction in risk of recurrence of superficial bladder cancer using 5-aminolevulinic acid-induced fluorescence diagnosis: 8-year results of prospective randomized study. Urology 2007;69:675–9.
90. Denzinger S, Wieland WF, Otto W, Filbeck T, Knuechel R, Burger M. Does photodynamic transurethral resection of bladder tumour improve the outcome of initial T1 high-grade bladder cancer? A long-term follow-up of a randomized study. BJU Int 2008;101:566–9.
91. Filbeck T, Pichlmeier U, Knuechel R, Wieland WF, Roessler W. Clinically relevant improvement of
recurrence-free survival with 5-aminolevulinic acid induced fluorescence diagnosis in patients with superficial bladder tumors. J Urol 2002;168:67–71.
92. Kriegmair M, Zaak D, Rothenberger KH, Rassweiler J, Jocham D, Eisenberger F, et al. Transurethral resection for bladder cancer using 5-aminolevulinic acid induced fluorescence endoscopy versus white light endoscopy. J Urol 2002;168:475–8.
93. Riedl CR, Daniltchenko D, Koenig F, Simak R, Loening SA, Pflueger H. Fluorescence endoscopy with 5-aminolevulinic acid reduces early recurrence rate in superficial bladder cancer. J Urol 2001;165:1121–3.
94. Daniely M, Rona R, Kaplan T, Olsfanger S, Elboim L, Freiberger A, et al. Combined morphologic and fluorescence in situ hybridization analysis of voided urine samples for the detection and follow-up of bladder cancer in patients with benign urine cytology. Cancer 2007;111:517–24.
95. Friedrich MG, Toma MI, Hellstern A, Pantel K, Weisenberger DJ, Noldus J, et al. Comparison of multitarget fluorescence in situ hybridization in urine with other noninvasive tests for detecting bladder cancer. BJU Int 2003;92:911–4.
96. Friedrich MG, Hellstern A, Hautmann SH, Graefen M, Conrad S, Huland E, et al. Clinical use of urinary markers for the detection and prognosis of bladder carcinoma: a comparison of immunocytology with monoclonal antibodies against Lewis X and 486p3/12 with the BTA STAT and NMP22 tests. J Urol 2002;168:470–4.
97. Halling KC, King W, Sokolova IA, Meyer RG, Burkhardt HM, Halling AC, et al. A comparison of cytology and fluorescence in situ hybridization for the detection of urothelial carcinoma. J Urol 2000;164:1768–75.
98. Junker K, Fritsch T, Hartmann A, Schulze W, Schubert J. Multicolor fluorescence in situ hybridization (M-FISH) on cells from urine for the detection of bladder cancer. Cytogenet Genome Res 2006;114:279–83.
99. Kipp BR, Halling KC, Campion MB, Wendel AJ, Karnes RJ, Zhang J, et al. Assessing the value of reflex fluorescence in situ hybridization testing in the diagnosis of bladder cancer when routine urine cytological examination is equivocal. J Urol 2008;179:1296–301.
100. Meiers I, Singh H, Hossain D, Lang K, Liu L, Qian JQ, et al. Improved filter method for urine sediment detection of urothelial carcinoma by fluorescence in situ hybridization. Arch Pathol Lab Med 2007;131:1574–7.
References
146
101. Mian C, Lodde M, Comploj E, Negri G, Egarter-Vigl E, Lusuardi L, et al. Liquid-based cytology as a tool for the performance of uCyt+ and Urovysion Multicolour-FISH in the detection of urothelial carcinoma. Cytopathology 2003;14:338–42.
102. Moonen PM, Merkx GF, Peelen P, Karthaus HF, Smeets DF, Witjes JA. UroVysion compared with cytology and quantitative cytology in the surveillance of non-muscle invasive bladder cancer. Eur Urol 2007;51:1275–80.
103. Sarosdy MF, Kahn PR, Ziffer MD, Love WR, Barkin J, Abara EO, et al. Use of a multitarget fluorescence in situ hybridization assay to diagnose bladder cancer in patients with hematuria. J Urol 2006;176:44–7.
104. Skacel M, Fahmy M, Brainard JA, Pettay JD, Biscotti CV, Liou LS, et al. Multitarget fluorescence in situ hybridization assay detects transitional cell carcinoma in the majority of patients with bladder cancer and atypical or negative urine cytology. J Urol 2003;169:2101–5.
105. Sokolova IA, Halling KC, Jenkins RB, Burkhardt HM, Meyer RG, Seelig SA, et al. The development of a multitarget, multicolor fluorescence in situ hybridization assay for the detection of urothelial carcinoma in urine. J Mol Diagn 2000;2:116–23.
106. Yoder BJ, Skacel M, Hedgepeth R, Babineau D, Ulchaker JC, Liou LS, et al. Reflex UroVysion testing of bladder cancer surveillance patients with equivocal or negative urine cytology: a prospective study with focus on the natural history of anticipatory positive findings. Am J Clin Pathol 2007;127:295–301.
107. May M, Hakenberg OW, Gunia S, Pohling P, Helke C, Lubbe L, et al. Comparative diagnostic value of urine cytology, UBC-ELISA, and fluorescence in situ hybridization for detection of transitional cell carcinoma of urinary bladder in routine clinical practice. Urology 2007;70:449–53.
108. Sarosdy MF, Schellhammer P, Bokinsky G, Kahn P, Chao R, Yore L, et al. Clinical evaluation of a multi-target fluorescent in situ hybridization assay for detection of bladder cancer. J Urol 2002;168:1950–4.
109. Lodde M, Mian C, Negri G, Berner L, Maffei N, Lusuardi L, et al. Role of uCyt+ in the detection and surveillance of urothelial carcinoma. Urology 2003;61:243–7.
110. Lodde M, Mian C, Comploj E, Palermo S, Longhi E, Marberger M, et al. uCyt+ test: alternative to cystoscopy for less-invasive follow-up of patients with low risk of urothelial carcinoma. Urology 2006;67:950–4.
111. Messing EM, Teot L, Korman H, Underhill E, Barker E, Stork B, et al. Performance of urine test in patients monitored for recurrence of bladder cancer: a multicenter study in the United States. J Urol 2005;174:1238–41.
112. Mian C, Pycha A, Wiener H, Haitel A, Lodde M, Marberger M. Immunocyt: a new tool for detecting transitional cell cancer of the urinary tract. J Urol 1999;161:1486–9.
113. Mian C, Maier K, Comploj E, Lodde M, Berner L, Lusuardi L, et al. uCyt+/ImmunoCyt in the detection of recurrent urothelial carcinoma: an update on 1991 analyses. Cancer 2006;108:60–5.
114. Olsson H, Zackrisson B. ImmunoCyt a useful method in the follow-up protocol for patients with urinary bladder carcinoma. Scand J Urol Nephrol 2001;35:280–2.
115. Pfister C, Chautard D, Devonec M, Perrin P, Chopin D, Rischmann P, et al. Immunocyt test improves the diagnostic accuracy of urinary cytology: results of a French multicenter study. J Urol 2003;169:921–4.
116. Piaton E, Daniel L, Verriele V, Dalifard I, Zimmermann U, Renaudin K, et al. Improved detection of urothelial carcinomas with fluorescence immunocytochemistry (uCyt+ assay) and urinary cytology: results of a French Prospective Multicenter Study. Lab Invest 2003;83:845–52.
117. Schmitz-Drager BJ, Beiche B, Tirsar LA, Schmitz-Drager C, Bismarck E, Ebert T. Immunocytology in the assessment of patients with asymptomatic microhaematuria. Eur Urol 2007;51:1582–8.
118. Schmitz-Drager BJ, Tirsar LA, Schmitz-Drager C, Dorsam J, Mellan Z, Bismarck E, et al. Immunocytology in the assessment of patients with asymptomatic hematuria. World J Urol 2008;26:31–7.
119. Tetu B, Tiguert R, Harel F, Fradet Y. ImmunoCyt/uCyt+ improves the sensitivity of urine cytology in patients followed for urothelial carcinoma. Mod Pathol 2005;18:83–9.
120. Bhuiyan J, Akhter J, O’Kane DJ. Performance characteristics of multiple urinary tumor markers and sample collection techniques in the detection of transitional cell carcinoma of the bladder. Clin Chim Acta 2003;331:69–77.
121. Casella R, Huber P, Blochlinger A, Stoffel F, Dalquen P, Gasser TC, et al. Urinary level of nuclear matrix protein 22 in the diagnosis of bladder cancer: experience with 130 patients with biopsy confirmed tumor. J Urol 2000;164:1926–8.
DOI: 10.3310/hta14040 Health Technology Assessment 2010; Vol. 14: No. 4
© 2010 Queen’s Printer and Controller of HMSO. All rights reserved.
147
122. Casetta G, Gontero P, Zitella A, Pelucelli G, Formiconi A, Priolo G, et al. BTA quantitative assay and NMP22 testing compared with urine cytology in the detection of transitional cell carcinoma of the bladder. Urol Int 2000;65:100–5.
123. Del Nero A, Esposito N, Curro A, Biasoni D, Montanari E, Mangiarotti B, et al. Evaluation of urinary level of NMP22 as a diagnostic marker for stage pTa-pT1 bladder cancer: comparison with urinary cytology and BTA test. Eur Urol 1999;35:93–7.
124. Giannopoulos A, Manousakas T, Mitropoulos D, Botsoli-Stergiou E, Constantinides C, Giannopoulou M, et al. Comparative evaluation of the BTA stat test, NMP22, and voided urine cytology in the detection of primary and recurrent bladder tumors. Urology 2000;55:871–5.
125. Giannopoulos A, Manousakas T, Gounari A, Constantinides C, Choremi-Papadopoulou H, Dimopoulos C. Comparative evaluation of the diagnostic performance of the BTA stat test, NMP22 and urinary bladder cancer antigen for primary and recurrent bladder tumors [see comment]. J Urol 2001;166:470–5.
126. Grossman HB, Messing E, Soloway M, Tomera K, Katz G, Berger Y, et al. Detection of bladder cancer using a point-of-care proteomic assay. JAMA 2005;293:810–6.
127. Grossman HB, Soloway M, Messing E, Katz G, Stein B, Kassabian V, et al. Surveillance for recurrent bladder cancer using a point-of-care proteomic assay. JAMA 2006;295:299–305.
128. Gutierrez Banos JL, Rebollo Rodrigo MH, Antolin Juarez FM, Martin GB. NMP 22, BTA stat test and cytology in the diagnosis of bladder cancer: a comparative study. Urol Int 2001;66:185–90.
129. Hughes JH, Katz RL, Rodriguez-Villanueva J, Kidd L, Dinney C, Grossman HB, et al. Urinary nuclear matrix protein 22 (NMP22): a diagnostic adjunct to urine cytologic examination for the detection of recurrent transitional-cell carcinoma of the bladder. Diagn Cytopathol 1999;20:285–90.
130. Kowalska M, Kaminska J, Kotowicz B, Fuksiewicz M, Rysinska A, Demkow T, et al. Evaluation of the urinary nuclear matrix protein (NMP22) as a tumour marker in bladder cancer patients. Nowotwory 2005;55:300–2.
131. Kumar A, Kumar R, Gupta NP. Comparison of NMP22 BladderChek test and urine cytology for the detection of recurrent bladder cancer. Jpn J Clin Oncol 2006;36:172–5.
132. Lahme S, Bichler KH, Feil G, Krause S. Comparison of cytology and nuclear matrix protein 22 for the detection and follow-up of bladder cancer. Urol Int 2001;66:72–7.
133. Lahme S, Bichler KH, Feil G, Zumbragel A, Gotz T. Comparison of cytology and nuclear matrix protein 22 (NMP 22) for the detection and follow-up of bladder-cancer. Adv Exp Med Biol 2003;539:111–9.
134. Mian C, Lodde M, Haitel A, Vigl EE, Marberger M, Pycha A. Comparison of the monoclonal UBC-ELISA test and the NMP22 ELISA test for the detection of urothelial cell carcinoma of the bladder. Urology 2000;55:223–6.
135. Miyanaga N, Akaza H, Tsukamoto T, Ishikawa S, Noguchi R, Ohtani M, et al. Urinary nuclear matrix protein 22 as a new marker for the screening of urothelial cancer in patients with microscopic hematuria. Int J Urol 1999;6:173–7.
136. Miyanaga N, Akaza H, Tsukamoto S, Shimazui T, Ohtani M, Ishikawa S, et al. Usefulness of urinary NMP22 to detect tumor recurrence of superficial bladder cancer after transurethral resection. Int J Clin Oncol 2003;8:369–73.
137. Oge O, Atsu N, Kendi S, Ozen H. Evaluation of nuclear matrix protein 22 (NMP22) as a tumor marker in the detection of bladder cancer. Int Urol Nephrol 2001;32:367–70.
138. Oosterhuis JWA, Pauwels RPE, Schapers RFM, Van Pelt J, Smeets W, Newling DWW. Detection of recurrent transitional cell carcinoma of the bladder with nuclear matrix protein-22 in a follow-up setting. Urooncology 2002;2:137–42.
139. Ponsky LE, Sharma S, Pandrangi L, Kedia S, Nelson D, Agarwal A, et al. Screening and monitoring for bladder cancer: refining the use of NMP22. J Urol 2001;166:75–8.
140. Poulakis V, Witzsch U, De Vries R, Altmannsberger HM, Manyak MJ, Becht E. A comparison of urinary nuclear matrix protein-22 and bladder tumour antigen tests with voided urinary cytology in detecting and following bladder cancer: the prognostic value of false-positive results. BJU Int 2001;88:692–701.
141. Saad A, Hanbury DC, McNicholas TA, Boustead GB, Morgan S, Woodman AC. A study comparing various noninvasive methods of detecting bladder cancer in urine. BJU Int 2002;89:369–73.
142. Sanchez-Carbayo M, Urrutia M, Gonzalez de Buitrago JM, Navajo JA. Utility of serial urinary tumor markers to individualize intervals between cystoscopies in the monitoring of patients with bladder carcinoma. Cancer 2001;92:2820–8.
References
148
143. Serretta V, Lo PD, Vasile P, Gange E, Esposito E, Menozzi I. Urinary NMP22 for the detection of recurrence after transurethral resection of transitional cell carcinoma of the bladder: experience on 137 patients. Urology 1998;52:793–6.
144. Serretta V, Pomara G, Rizzo I, Esposito E. Urinary BTA-stat, BTA-trak and NMP22 in surveillance after TUR of recurrent superficial transitional cell carcinoma of the bladder. Eur Urol 2000;38:419–25.
145. Shariat SF, Casella R, Monoski MA, Sulser T, Gasser TC, Lerner SP. The addition of urinary urokinase-type plasminogen activator to urinary nuclear matrix protein 22 and cytology improves the detection of bladder cancer. J Urol 2003;170:2244–7.
146. Shariat SF, Casella R, Khoddami SM, Hernandez G, Sulser T, Gasser TC, et al. Urine detection of survivin is a sensitive marker for the noninvasive diagnosis of bladder cancer. J Urol 2004;171:626–30.
147. Shariat SF, Marberger MJ, Lotan Y, Sanchez-Carbayo M, Zippe C, Ludecke G, et al. Variability in the performance of nuclear matrix protein 22 for the detection of bladder cancer. J Urol 2006;176:919–26.
148. Sharma S, Zippe CD, Pandrangi L, Nelson D, Agarwal A. Exclusion criteria enhance the specificity and positive predictive value of NMP22 and BTA stat. J Urol 1999;162:53–7.
149. Stampfer DS, Carpinito GA, Rodriguez-Villanueva J, Willsey LW, Dinney CP, Grossman HB, et al. Evaluation of NMP22 in the detection of transitional cell carcinoma of the bladder. J Urol 1998;159:394–8.
150. Talwar R, Sinha T, Karan SC, Doddamani D, Sandhu A, Sethi GS, et al. Voided urinary cytology in bladder cancer: is it time to review the indications? Urology 2007;70:267–71.
151. Wiener HG, Mian C, Haitel A, Pycha A, Schatzl G, Marberger M. Can urine bound diagnostic tests replace cystoscopy in the management of bladder cancer? J Urol 1998;159:1876–80.
152. Zippe C, Pandrangi L, Potts JM, Kursh E, Novick A, Agarwal A. NMP22: a sensitive, cost-effective test in patients at risk for bladder cancer. Anticancer Res 1999;19:2621–3.
153. Zippe C, Pandrangi L, Agarwal A. NMP22 is a sensitive, cost-effective test in patients at risk for bladder cancer. J Urol 1999;161:62–5.
154. Abbate I, D’Introno A, Cardo G, Marano A, Addabbo L, Musci MD, et al. Comparison of nuclear
matrix protein 22 and bladder tumor antigen in urine of patients with bladder cancer. Anticancer Res 1998;18:3803–5.
155. Boman H, Hedelin H, Holmang S. Four bladder tumor markers have a disappointingly low sensitivity for small size and low grade recurrence. J Urol 2002;167:80–3.
156. Chang YH, Wu CH, Lee YL, Huang PH, Kao YL, Shiau MY. Evaluation of nuclear matrix protein-22 as a clinical diagnostic marker for bladder cancer. Urology 2004;64:687–92.
157. Lee KH. Evaluation of the NMP22 test and comparison with voided urine cytology in the detection of bladder cancer. Yonsei Med J 2001;42:14–8.
158. Parekattil SJ, Fisher HA, Kogan BA. Neural network using combined urine nuclear matrix protein-22, monocyte chemoattractant protein-1 and urinary intercellular adhesion molecule-1 to detect bladder cancer. J Urol 2003;169:917–20.
159. Ramakumar S, Bhuiyan J, Besse JA, Roberts SG, Wollan PC, Blute ML, et al. Comparison of screening methods in the detection of bladder cancer. J Urol 1999;161:388–94.
160. Sanchez-Carbayo M, Herrero E, Megias J, Mira A, Soria F. Evaluation of nuclear matrix protein 22 as a tumour marker in the detection of transitional cell carcinoma of the bladder. BJU Int 1999;84:706–13.
161. Sanchez-Carbayo M, Herrero E, Megias J, Mira A, Soria F. Comparative sensitivity of urinary CYFRA 21–1, urinary bladder cancer antigen, tissue polypeptide antigen, tissue polypeptide antigen and NMP22 to detect bladder cancer. J Urol 1999;162:1951–6.
162. Sanchez-Carbayo M, Urrutia M, Silva JM, Romani R, De Buitrago JM, Navajo JA. Comparative predictive values of urinary cytology, urinary bladder cancer antigen, CYFRA 21–1 and NMP22 for evaluating symptomatic patients at risk for bladder cancer. J Urol 2001;165:1462–7.
163. Sozen S, Biri H, Sinik Z, Kupeli B, Alkibay T, Bozkirli I. Comparison of the nuclear matrix protein 22 with voided urine cytology and BTA stat test in the diagnosis of transitional cell carcinoma of the bladder. Eur Urol 1999;36:225–9.
164. Takeuchi Y, Sawada Y. A clinical study of urinary NMP22 in urinary epithelial cancer. J Med Soc Toho Univ 2004;51:332–8.
165. Bastacky S, Ibrahim S, Wilczynski SP, Murphy WM. The accuracy of urinary cytology in daily practice. Cancer 1999;87:118–28.
DOI: 10.3310/hta14040 Health Technology Assessment 2010; Vol. 14: No. 4
© 2010 Queen’s Printer and Controller of HMSO. All rights reserved.
149
166. Chahal R, Gogoi NK, Sundaram SK. Is it necessary to perform urine cytology in screening patients with haematuria? Eur Urol 2001;39:283–6.
167. Garbar C, Mascaux C, Wespes E. Is urinary tract cytology still useful for diagnosis of bladder carcinomas? A large series of 592 bladder washings using a five-category classification of different cytological diagnoses. Cytopathology 2007;18:79–83.
168. Hakenberg OW, Franke P, Froehner M, Manseck A, Wirth MP. The value of conventional urine cytology in the diagnosis of residual tumour after transurethral resection of bladder carcinomas. Onkologie 2000;23:252–7.
169. Hutterer GC, Karakiewicz PI, Zippe C, Ludecke G, Boman H, Sanchez-Carbayo M, et al. Urinary cytology and nuclear matrix protein 22 in the detection of bladder cancer recurrence other than transitional cell carcinoma. BJU Int 2008;101:561–5.
170. Karakiewicz PI, Benayoun S, Zippe C, Ludecke G, Boman H, Sanchez-Carbayo M, et al. Institutional variability in the accuracy of urinary cytology for predicting recurrence of transitional cell carcinoma of the bladder. BJU Int 2006;97:997–1001.
171. Planz B, Jochims E, Deix T, Caspers HP, Jakse G, Boecking A. The role of urinary cytology for detection of bladder cancer. Eur J Surg Oncol 2005;31:304–8.
172. Potter JM, Quigley M, Pengelly AW, Fawcett DP, Malone PR. The role of urine cytology in the assessment of lower urinary tract symptoms. BJU Int 1999;84:30–1.
173. Raitanen M-P, Aine R, Rintala E, Kallio J, Rajala P, Juusela H, et al. Differences between local and review urinary cytology in diagnosis of bladder cancer. An interobserver multicenter analysis. Eur Urol 2002;41:284–9.
174. Raitanen MP, Aine RA, Kaasinen ES, Liukkonen TJ, Kylmala TM, Huhtala H, et al. Suspicious urine cytology (class III) in patients with bladder cancer: should it be considered as negative or positive? Scand J Urol Nephrol 2002;36:213–7.
175. Botteman MF, Pashos CL, Redaelli A, Laskin B, Hauser R. The health economics of bladder cancer: a comprehensive review of the published literature. Pharmacoeconomics 2003;21:1315–30.
176. Corwin HL, Silverstein MD. The diagnosis of neoplasia in patients with asymptomatic microscopic hematuria: a decision analysis. J Urol 1988;139:1002–6.
177. Ellwein LB, Farrow GM. Urinary cytology screening: the decision facing the asymptomatic patient. Med Decis Making 1988;8:110–9.
178. Novicki DE, Stern JA, Nemec R, Lidner TK. Cost-effective evaluation of indeterminate urinary cytology. J Urol 1998;160:734–6.
179. Rodgers M, Nixon J, Hempel S, Aho T, Kelly J, Neal D, et al. Diagnostic tests and algorithms used in the investigation of haematuria: systematic reviews and economic evaluation. Health Technol Assess 2006;10(18).
180. Lotan Y, Svatek RS, Sagalowsky AI. Should we screen for bladder cancer in a high-risk population? A cost per life-year saved analysis. Cancer 2006;107:982–90.
181. Kurth KH, Denis L, Bouffioux C, Sylvester R, Debruyne FMJ, Pavone-Macaluso M, et al. Factors affecting recurrence and progression in superficial bladder tumours. Eur J Cancer 1995;31:1840–6.
182. Dalesio O, Schulman CC, Sylvester R, De Pauw M, Robinson M, Denis L, et al. Prognostic factors in superficial bladder tumors. A study of the European Organization for Research on Treatment of Cancer: Genitourinary Tract Cancer Cooperative Group. J Urol 1983;129:730–3.
183. García RJ, Fernandez Gomez JM, Escaf BS, Jalon MA, Alvarez MM, Regadera SJ. [Pronostic factors on recurrence and progression of superficial bladder cancer. Risk groups (part II)]. Actas Urol Esp 2006;30:1009–16.
184. Kiemeney LA, Witjes JA, Heijbroek RP, Verbeek AL, Debruyne FM. Predictability of recurrent and progressive disease in individual patients with primary superficial bladder cancer. J Urol 1993;150:60–4.
185. Kiemeney LA, Witjes JA, Heijbroek RP, Debruyne FM, Verbeek AL. Dysplasia in normal-looking urothelium increases the risk of tumour progression in primary superficial bladder cancer. Eur J Cancer 1994;30A:1621–5.
186. Loening S, Narayana A, Yoder L, Slymen D, Penick G, Culp D. Analysis of bladder tumor recurrence in 178 patients. Urology 1980;16:137–41.
187. Millán-Rodriguez F, Chéchile-Toniolo G, Salvador-Bayarri J, Palou J, Algaba F, Vicente-Rodriguez J. Primary superficial bladder cancer risk groups according to progression, mortality and recurrence. J Urol 2000;164:680–4.
188. Mulders PF, Meyden AP, Doesburg WH, Oosterhof GO, Debruyne FM. Prognostic factors in pTa-pT1 superficial bladder tumours treated with intravesical
References
150
instillations. The Dutch South-Eastern Urological Collaborative Group. Br J Urol 1994;73:403–8.
189. Narayana AS, Loening SA, Slymen DJ, Culp DA. Bladder cancer: factors affecting survival. J Urol 1983;130:56–60.
190. Oosterlinck W, Lobel B, Jakse G, Malmstrom PU, Stockle M, Sternberg CO. Guidelines on bladder cancer. Arnhem: European Association of Urology; 2001. URL: www.uroweb.org/fileadmin/tx_eauguidelines/2001_Bladder%20_Cancer.PDF. Accesssed September 2008.
191. Parmar H, Charlton C, Phillips RH, Lightman SL. Management of advanced prostatic cancer. Lancet 1989;2:1338–9.
192. Pawinski A, Sylvester R, Kurth KH, Bouffioux C, Van der MA, Parmar MK, et al. A combined analysis of European Organization for Research and Treatment of Cancer, and Medical Research Council randomized clinical trials for the prophylactic treatment of stage TaT1 bladder cancer. European Organization for Research and Treatment of Cancer Genitourinary Tract Cancer Cooperative Group and the Medical Research Council Working Party on Superficial Bladder Cancer. J Urol 1996;156:1934–40.
193. Shinka T, Matsumoto M, Ogura H, Hirano A, Ohkawa T. Recurrence of primary superficial bladder cancer treated with prophylactic intravesical Tokyo 172 bacillus Calmette-Guerin: a long-term follow-up. Int J Urol 1997;4:139–43.
194. Witjes JA, Kiemeney LALM, Verbeek ALM, Heijbroek RP, Debruyne FMJ. Random bladder biopsies and the risk of recurrent superficial bladder cancer: a prospective study in 1026 patients. World J Urol 1992;10:231–4.
195. Witjes JA, Kiemeney LA, Schaafsma HE, Debruyn FM. The influence of review pathology on study outcome of a randomized multicentre superficial bladder cancer trial. Members of the Dutch South East Cooperative Urological Group. Br J Urol 1994;73:172–6.
196. Herr HW. Natural history of superficial bladder tumors: 10- to 20-year follow-up of treated patients. World J Urol 1997;15:84–8.
197. Stein JP, Lieskovsky G, Cote R, Groshen S, Feng A-C, Boyd S, et al. Radical cystectomy in the treatment of invasive bladder cancer: long-term results in 1,054 patients. J Clin Oncol 2001;19:666–75.
198. von der Maase H, Sengelov L, Roberts JT, Ricci S, Dogliotti L, Oliver T, et al. Long-term survival results of a randomized trial comparing
gemcitabine plus cisplatin, with methotrexate, vinblastine, doxorubicin, plus cisplatin in patients with bladder cancer. J Clin Oncol 2005;23:4602–8.
199. Government Actuary’s Department. Interim life tables 2004–6. London: Government Actuary’s Department; 2008. URL: www.gad.gov.uk/Demography%5FData/Life_Tables/Interim_life_tables.asp. Accesssed September 2008.
200. Farrow SC, Fowkes FGR, Lunn JN. Epidemiology in anaesthesia. II. Factors affecting mortality in hospital. Br J Anaesth 1982;54:811–7.
201. Kondas J, Szentgyorgyi E. Transurethral resection of 1250 bladder tumours. Int Urol Nephrol 1992;24:35–42.
202. Department of Health. NHS reference costs 2005–6. 2006. URL: www.dh.gov.uk/en/Publicationsandstatistics/Publications/PublicationsPolicyAndGuidance/DH_062884. Accesssed September 2008.
203. Tumour-marker NMP22 (NMP). Nottingham: MediChecks.com; 2008. URL: http://medichecks.com/index.cfm?s=2&d=21&test=NMP. Accesssed September 2008.
204. National Institute for Health and Clinical Excellence. Guide to the methods of technology appraisal. London: National Institute for Health and Clinical Excellence; 2008. URL: www.nice.org.uk/media/B52/A7/TAMethodsGuideUpdatedJune2008.pdf. Accesssed September 2008.
205. Kulkarni GS, Finelli A, Fleshner NE, Jewett MAS, Lopushinsky SR, Alibhai SMH. Optimal management of high-risk T1G3 bladder cancer: a decision analysis. PLoS Med 2007;4:1538–49.
206. Pickard AS, Neary MP, Cella D. Estimation of minimally important differences in EQ-5D utility and VAS scores in cancer. Health Qual Life Outcomes 2007;5:70.
207. Schmidbauer J, Witjes F, Schmeller N, Donat R, Susani M, Marberger M, et al. Improved detection of urothelial carcinoma in situ with hexaminolevulinate fluorescence cystoscopy. J Urol 2004;171:135–8.
208. Spiess PE, Grossman HB. Fluorescence cystoscopy: is it ready for use in routine clinical practice? Curr Opin Urol 2006;16:372–6.
209. Zaak D, Karl A, Knuchel R, Stepp H, Hartmann A, Reich O, et al. Diagnosis of urothelial carcinoma of the bladder using fluorescence endoscopy. BJU Int 2005;96:217–22.
DOI: 10.3310/hta14040 Health Technology Assessment 2010; Vol. 14: No. 4
© 2010 Queen’s Printer and Controller of HMSO. All rights reserved.
151
210. Jain S, Kockelbergh RC. The role of photodynamic diagnosis in the contemporary management of superficial bladder cancer. BJU Int 2005;96:17–21.
211. Lotan Y, Roehrborn CG. Sensitivity and specificity of commonly available bladder tumor markers versus cytology: results of a comprehensive literature review and meta-analyses. Urology 2003;61:109–18.
212. Glas AS, Roos D, Deutekom M, Zwinderman AH, Bossuyt PM, Kurth KH. Tumor markers in the diagnosis of primary bladder cancer. A systematic review. J Urol 2003;169:1975–82.
213. van Rhijn BW, van der Poel HG, van der Kwast TH. Urine markers for bladder cancer surveillance: a systematic review. Eur Urol 2005;47:736–48.
214. Yossepowitch O, Herr HW, Donat SM. Use of urinary biomarkers for bladder cancer surveillance: patient perspectives. J Urol 2007;177:1277–82.
215. Kiemeney LALM, Witjes JA, Heijbroek RP, Koper NP, Verbeek ALM, Debruyne FMJ. Should random urothelial biopsies be taken from patients with primary superficial bladder cancer? A decision analysis. Br J Urol 1994;73:164–71.
216. van der Meijden A, Oosterlinck W, Brausi M, Kurth K-H, Sylvester R, de Balincourt C. Significance of bladder biopsies in Ta,T1 bladder tumors: a report from the EORTC genito-urinary tract cancer cooperative group. Eur Urol 1999;35:267–71.

DOI: 10.3310/hta14040 Health Technology Assessment 2010; Vol. 14: No. 4
© 2010 Queen’s Printer and Controller of HMSO. All rights reserved.
153
Clinical effectivenessMEDLINE (1966 to March Week 3 2008), EMBASE (1980 to 2008 Week 13), Medline In-Process (31 March 2008) Ovid Multifile SearchURL: http://gateway.ovid.com/athens
1. urinary bladder neoplasms/use mesz2. exp bladder cancer/use emez 3. hematuria/4. (bladder adj3 (cancer$or neoplasms$or
carci$)).tw.5. (hematuria or haematuria).tw. 6. or/1–5 7. *urinary bladder neoplasms/su use mesz8. exp *bladder cancer/su use emez 9. cystectomy/10. ((bladder adj3 resect$) or cystectomy or turbt).
tw.11. or/7–10 12. cystoscopy/13. cystoscop$.tw. 14. (photo dynamic$or photodynamic$or
fluorescence$).tw. 15. (12 or 13) and 14 16. hypericin.tw. 17. 548–04–9.rn. 18. hexvix.tw. 19. hexaminolevulinate.tw.20. (hexyl$adj3 aminolevulinate).tw. 21. 106–60–5.rn. 22. 5-ALA.tw. 23. 5-aminolevulinic acid.tw. 24. 5-aminolevulinic acid hexyl ester.tw,rn. 25. or/15–24 26. (6 or 11) and 25 27. tumor markers,biological/use mesz 28. exp tumor marker/or biological marker/or
disease marker/use emez 29. ((tumo?r or biological or molecular or
histolog$or biochem$or genetic$or urine or disease) adj3 marker$).tw.
30. 6 and (27 or 28 or 29))31. In Situ Hybridization, Fluorescence/32. fluorescence in situ hybridization.tw.33. urovysion.tw34. or/31–33 35. 6 and 34 36. nuclear proteins/
37. (nuclear matrix protein 22 or nmp22).tw,rn. 38. or/36–37 39. 6 and 38 40. urine/cy 41. urine cytology/use emez 42. cytodiagnosis/use mesz 43. cancer cytodiagnosis/use emez 44. cell count/45. immunocyt$or ucyt$.tw.46. or/40–45 47. 6 and 46 48. 26 or 30 or 35 or 39 or 47 49. (animals/or nonhuman/) not humans/50. 48 not 49 51. (editorial or letter or comment or case reports).
pt. 52. editorial/or letter/or note/or case report/use
emez 53. 50 not (51 or 52)54. “sensitivity and specificity”/55. roc curve/56. receiver operating characteristic/use emez 57. predictive value of tests/58. diagnostic errors/use emez 59. false positive reactions/use mesz 60. false negative reactions/use mesz 61. diagnostic accuracy/use emez62. diagnostic value/use emez 63. du.fs. use mesz 64. sensitivity.tw. 65. distinguish$.tw. 66. differentiate.tw.67. identif$.tw. 68. detect$.tw. 69. diagnos$.tw. 70. (predictive adj4 value$).tw.71. accura$.tw. 72. comparison.tw. 73. or/54–7274. 53 and 73 75. exp diagnostic errors/76. reproducibility of results/77. observer variation78. exp reliability/79. diagnosis, differential/80. early diagnosis/81. (reliab$or reproduc$).tw. 82. or/75–81 83. 53 and 82
Appendix 1 Search strategies
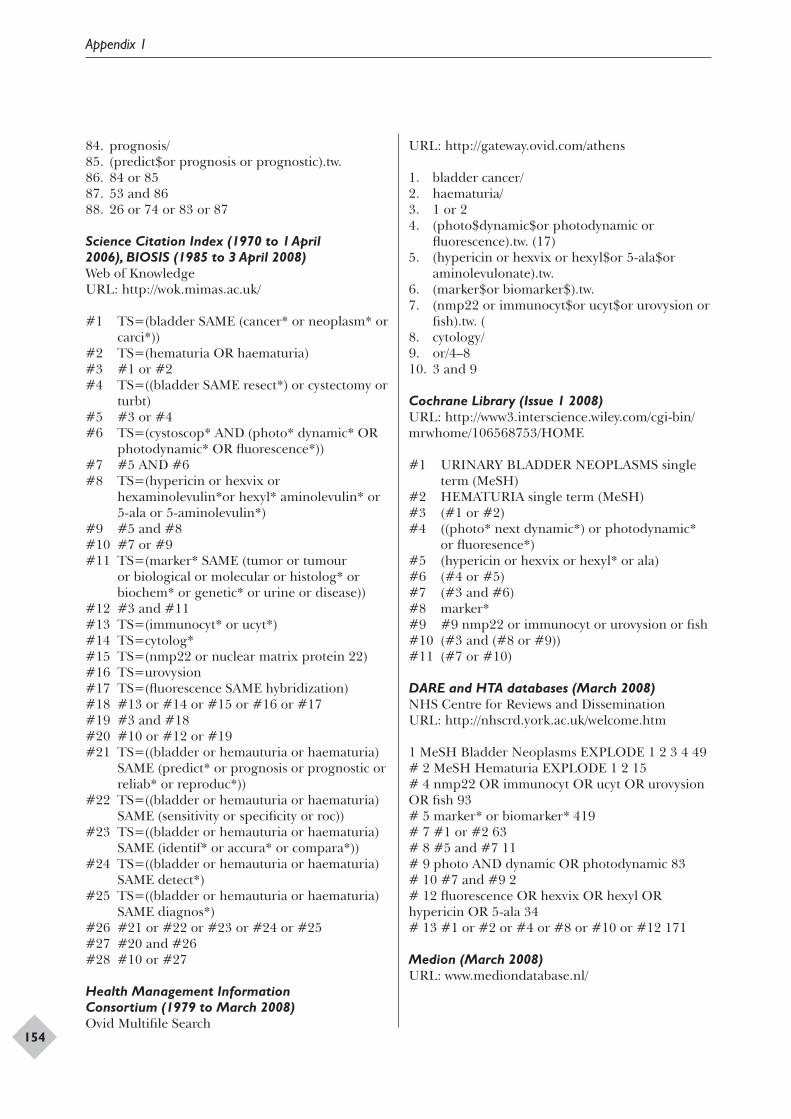
Appendix 1
154
84. prognosis/85. (predict$or prognosis or prognostic).tw.86. 84 or 85 87. 53 and 86 88. 26 or 74 or 83 or 87
Science Citation Index (1970 to 1 April 2006), BIOSIS (1985 to 3 April 2008)Web of KnowledgeURL: http://wok.mimas.ac.uk/
#1 TS=(bladder SAME (cancer* or neoplasm* or carci*))
#2 TS=(hematuria OR haematuria)#3 #1 or #2#4 TS=((bladder SAME resect*) or cystectomy or
turbt)#5 #3 or #4#6 TS=(cystoscop* AND (photo* dynamic* OR
photodynamic* OR fluorescence*))#7 #5 AND #6#8 TS=(hypericin or hexvix or
hexaminolevulin*or hexyl* aminolevulin* or 5-ala or 5-aminolevulin*)
#9 #5 and #8#10 #7 or #9#11 TS=(marker* SAME (tumor or tumour
or biological or molecular or histolog* or biochem* or genetic* or urine or disease))
#12 #3 and #11#13 TS=(immunocyt* or ucyt*) #14 TS=cytolog*#15 TS=(nmp22 or nuclear matrix protein 22)#16 TS=urovysion#17 TS=(fluorescence SAME hybridization)#18 #13 or #14 or #15 or #16 or #17#19 #3 and #18#20 #10 or #12 or #19#21 TS=((bladder or hemauturia or haematuria)
SAME (predict* or prognosis or prognostic or reliab* or reproduc*))
#22 TS=((bladder or hemauturia or haematuria) SAME (sensitivity or specificity or roc))
#23 TS=((bladder or hemauturia or haematuria) SAME (identif* or accura* or compara*))
#24 TS=((bladder or hemauturia or haematuria) SAME detect*)
#25 TS=((bladder or hemauturia or haematuria) SAME diagnos*)
#26 #21 or #22 or #23 or #24 or #25#27 #20 and #26#28 #10 or #27
Health Management Information Consortium (1979 to March 2008) Ovid Multifile Search
URL: http://gateway.ovid.com/athens
1. bladder cancer/2. haematuria/3. 1 or 24. (photo$dynamic$or photodynamic or
fluorescence).tw. (17)5. (hypericin or hexvix or hexyl$or 5-ala$or
aminolevulonate).tw. 6. (marker$or biomarker$).tw. 7. (nmp22 or immunocyt$or ucyt$or urovysion or
fish).tw. (8. cytology/9. or/4–810. 3 and 9
Cochrane Library (Issue 1 2008)URL: http://www3.interscience.wiley.com/cgi-bin/mrwhome/106568753/HOME
#1 URINARY BLADDER NEOPLASMS single term (MeSH)
#2 HEMATURIA single term (MeSH) #3 (#1 or #2) #4 ((photo* next dynamic*) or photodynamic*
or fluoresence*) #5 (hypericin or hexvix or hexyl* or ala) #6 (#4 or #5) #7 (#3 and #6) #8 marker* #9 #9 nmp22 or immunocyt or urovysion or fish#10 (#3 and (#8 or #9)) #11 (#7 or #10)
DARE and HTA databases (March 2008)NHS Centre for Reviews and DisseminationURL: http://nhscrd.york.ac.uk/welcome.htm
1 MeSH Bladder Neoplasms EXPLODE 1 2 3 4 49 # 2 MeSH Hematuria EXPLODE 1 2 15 # 4 nmp22 OR immunocyt OR ucyt OR urovysion OR fish 93 # 5 marker* or biomarker* 419 # 7 #1 or #2 63 # 8 #5 and #7 11 # 9 photo AND dynamic OR photodynamic 83 # 10 #7 and #9 2 # 12 fluorescence OR hexvix OR hexyl OR hypericin OR 5-ala 34 # 13 #1 or #2 or #4 or #8 or #10 or #12 171
Medion (March 2008)URL: www.mediondatabase.nl/
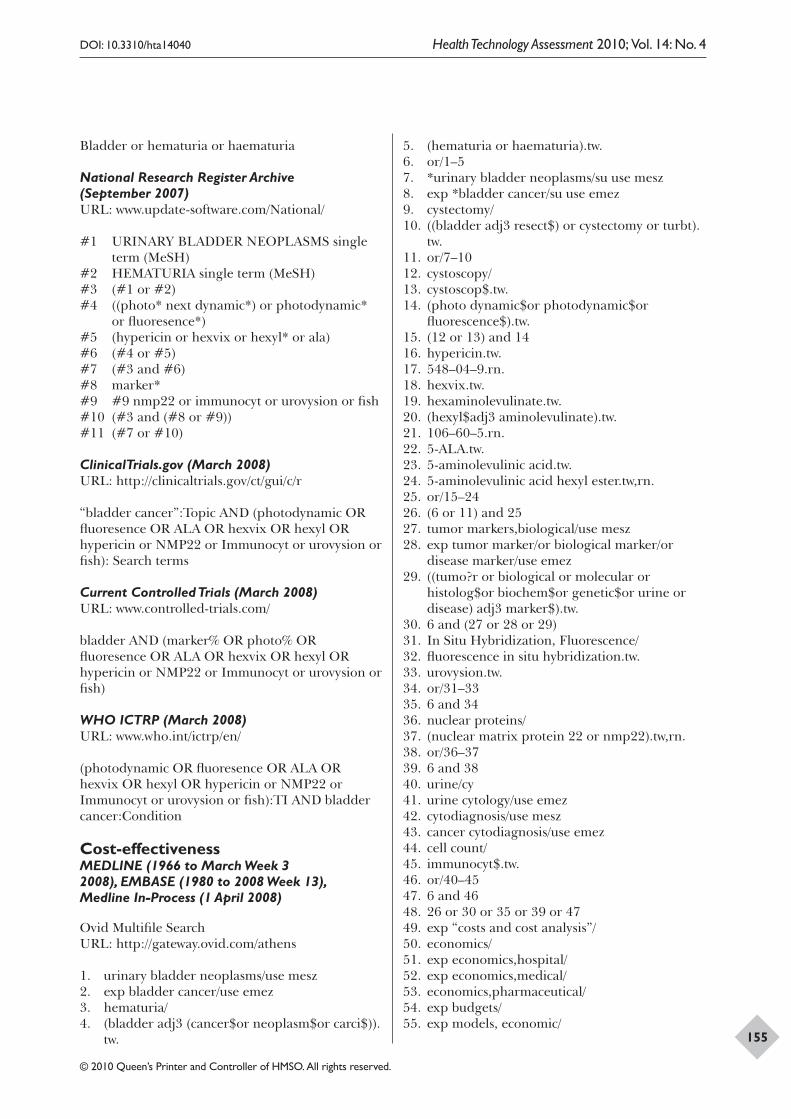
DOI: 10.3310/hta14040 Health Technology Assessment 2010; Vol. 14: No. 4
© 2010 Queen’s Printer and Controller of HMSO. All rights reserved.
155
Bladder or hematuria or haematuria
National Research Register Archive (September 2007)URL: www.update-software.com/National/
#1 URINARY BLADDER NEOPLASMS single term (MeSH)
#2 HEMATURIA single term (MeSH) #3 (#1 or #2) #4 ((photo* next dynamic*) or photodynamic*
or fluoresence*) #5 (hypericin or hexvix or hexyl* or ala) #6 (#4 or #5) #7 (#3 and #6) #8 marker* #9 #9 nmp22 or immunocyt or urovysion or fish#10 (#3 and (#8 or #9)) #11 (#7 or #10)
ClinicalTrials.gov (March 2008)URL: http://clinicaltrials.gov/ct/gui/c/r
“bladder cancer”:Topic AND (photodynamic OR fluoresence OR ALA OR hexvix OR hexyl OR hypericin or NMP22 or Immunocyt or urovysion or fish): Search terms
Current Controlled Trials (March 2008) URL: www.controlled-trials.com/
bladder AND (marker% OR photo% OR fluoresence OR ALA OR hexvix OR hexyl OR hypericin or NMP22 or Immunocyt or urovysion or fish)
WHO ICTRP (March 2008)URL: www.who.int/ictrp/en/
(photodynamic OR fluoresence OR ALA OR hexvix OR hexyl OR hypericin or NMP22 or Immunocyt or urovysion or fish):TI AND bladder cancer:Condition
Cost-effectiveness MEDLINE (1966 to March Week 3 2008), EMBASE (1980 to 2008 Week 13), Medline In-Process (1 April 2008)
Ovid Multifile SearchURL: http://gateway.ovid.com/athens
1. urinary bladder neoplasms/use mesz 2. exp bladder cancer/use emez 3. hematuria/4. (bladder adj3 (cancer$or neoplasm$or carci$)).
tw.
5. (hematuria or haematuria).tw. 6. or/1–5 7. *urinary bladder neoplasms/su use mesz 8. exp *bladder cancer/su use emez 9. cystectomy/10. ((bladder adj3 resect$) or cystectomy or turbt).
tw. 11. or/7–10 12. cystoscopy/13. cystoscop$.tw. 14. (photo dynamic$or photodynamic$or
fluorescence$).tw. 15. (12 or 13) and 14 16. hypericin.tw. 17. 548–04–9.rn.18. hexvix.tw. 19. hexaminolevulinate.tw.20. (hexyl$adj3 aminolevulinate).tw.21. 106–60–5.rn. 22. 5-ALA.tw. 23. 5-aminolevulinic acid.tw. 24. 5-aminolevulinic acid hexyl ester.tw,rn. 25. or/15–24 26. (6 or 11) and 25 27. tumor markers,biological/use mesz 28. exp tumor marker/or biological marker/or
disease marker/use emez 29. ((tumo?r or biological or molecular or
histolog$or biochem$or genetic$or urine or disease) adj3 marker$).tw.
30. 6 and (27 or 28 or 29) 31. In Situ Hybridization, Fluorescence/32. fluorescence in situ hybridization.tw.33. urovysion.tw. 34. or/31–33 35. 6 and 34 36. nuclear proteins/37. (nuclear matrix protein 22 or nmp22).tw,rn. 38. or/36–37 39. 6 and 38 40. urine/cy 41. urine cytology/use emez 42. cytodiagnosis/use mesz 43. cancer cytodiagnosis/use emez 44. cell count/45. immunocyt$.tw. 46. or/40–45 47. 6 and 46 48. 26 or 30 or 35 or 39 or 47 49. exp “costs and cost analysis”/50. economics/51. exp economics,hospital/52. exp economics,medical/53. economics,pharmaceutical/54. exp budgets/55. exp models, economic/
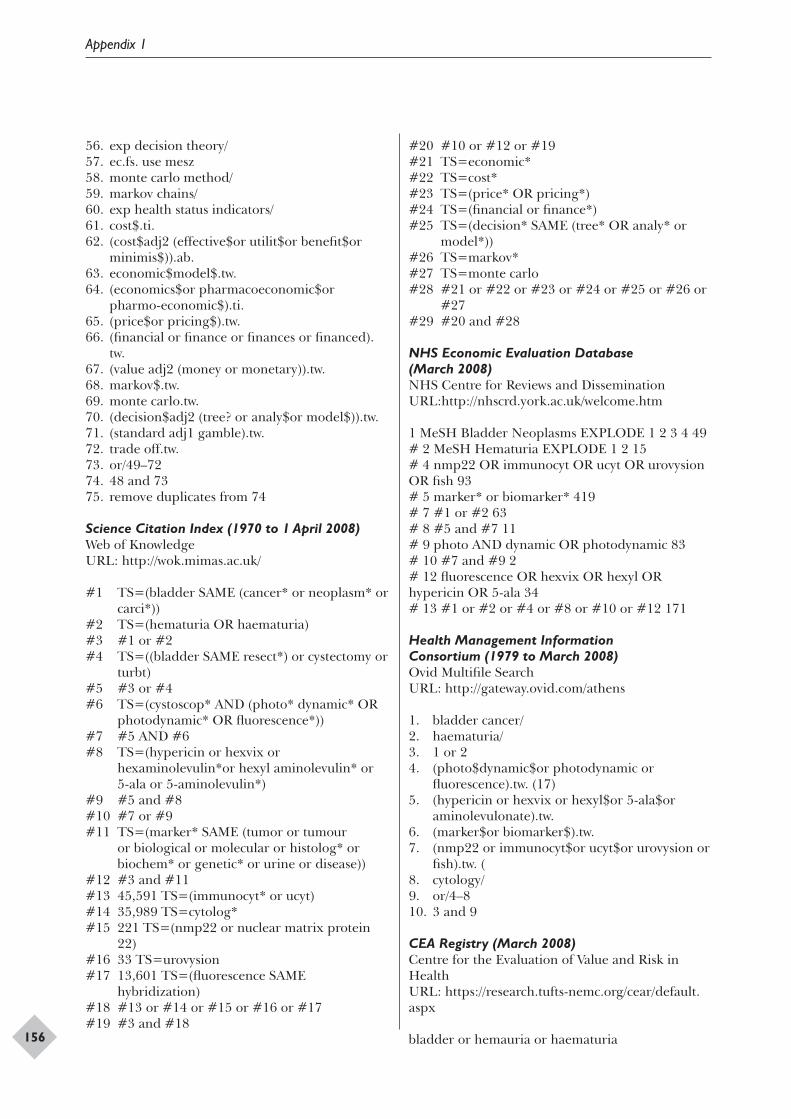
Appendix 1
156
56. exp decision theory/57. ec.fs. use mesz 58. monte carlo method/59. markov chains/60. exp health status indicators/61. cost$.ti. 62. (cost$adj2 (effective$or utilit$or benefit$or
minimis$)).ab. 63. economic$model$.tw. 64. (economics$or pharmacoeconomic$or
pharmo-economic$).ti.65. (price$or pricing$).tw. 66. (financial or finance or finances or financed).
tw. 67. (value adj2 (money or monetary)).tw.68. markov$.tw. 69. monte carlo.tw.70. (decision$adj2 (tree? or analy$or model$)).tw. 71. (standard adj1 gamble).tw.72. trade off.tw. 73. or/49–72 74. 48 and 73 75. remove duplicates from 74
Science Citation Index (1970 to 1 April 2008)Web of KnowledgeURL: http://wok.mimas.ac.uk/
#1 TS=(bladder SAME (cancer* or neoplasm* or carci*))
#2 TS=(hematuria OR haematuria)#3 #1 or #2#4 TS=((bladder SAME resect*) or cystectomy or
turbt)#5 #3 or #4#6 TS=(cystoscop* AND (photo* dynamic* OR
photodynamic* OR fluorescence*))#7 #5 AND #6#8 TS=(hypericin or hexvix or
hexaminolevulin*or hexyl aminolevulin* or 5-ala or 5-aminolevulin*)
#9 #5 and #8#10 #7 or #9#11 TS=(marker* SAME (tumor or tumour
or biological or molecular or histolog* or biochem* or genetic* or urine or disease))
#12 #3 and #11#13 45,591 TS=(immunocyt* or ucyt) #14 35,989 TS=cytolog*#15 221 TS=(nmp22 or nuclear matrix protein
22)#16 33 TS=urovysion#17 13,601 TS=(fluorescence SAME
hybridization)#18 #13 or #14 or #15 or #16 or #17#19 #3 and #18
#20 #10 or #12 or #19#21 TS=economic*#22 TS=cost*#23 TS=(price* OR pricing*)#24 TS=(financial or finance*)#25 TS=(decision* SAME (tree* OR analy* or
model*))#26 TS=markov*#27 TS=monte carlo#28 #21 or #22 or #23 or #24 or #25 or #26 or
#27#29 #20 and #28
NHS Economic Evaluation Database (March 2008)NHS Centre for Reviews and DisseminationURL:http://nhscrd.york.ac.uk/welcome.htm
1 MeSH Bladder Neoplasms EXPLODE 1 2 3 4 49 # 2 MeSH Hematuria EXPLODE 1 2 15 # 4 nmp22 OR immunocyt OR ucyt OR urovysion OR fish 93 # 5 marker* or biomarker* 419 # 7 #1 or #2 63 # 8 #5 and #7 11 # 9 photo AND dynamic OR photodynamic 83 # 10 #7 and #9 2 # 12 fluorescence OR hexvix OR hexyl OR hypericin OR 5-ala 34 # 13 #1 or #2 or #4 or #8 or #10 or #12 171
Health Management Information Consortium (1979 to March 2008) Ovid Multifile SearchURL: http://gateway.ovid.com/athens
1. bladder cancer/2. haematuria/3. 1 or 24. (photo$dynamic$or photodynamic or
fluorescence).tw. (17)5. (hypericin or hexvix or hexyl$or 5-ala$or
aminolevulonate).tw. 6. (marker$or biomarker$).tw. 7. (nmp22 or immunocyt$or ucyt$or urovysion or
fish).tw. (8. cytology/9. or/4–810. 3 and 9
CEA Registry (March 2008)Centre for the Evaluation of Value and Risk in HealthURL: https://research.tufts-nemc.org/cear/default.aspx
bladder or hemauria or haematuria
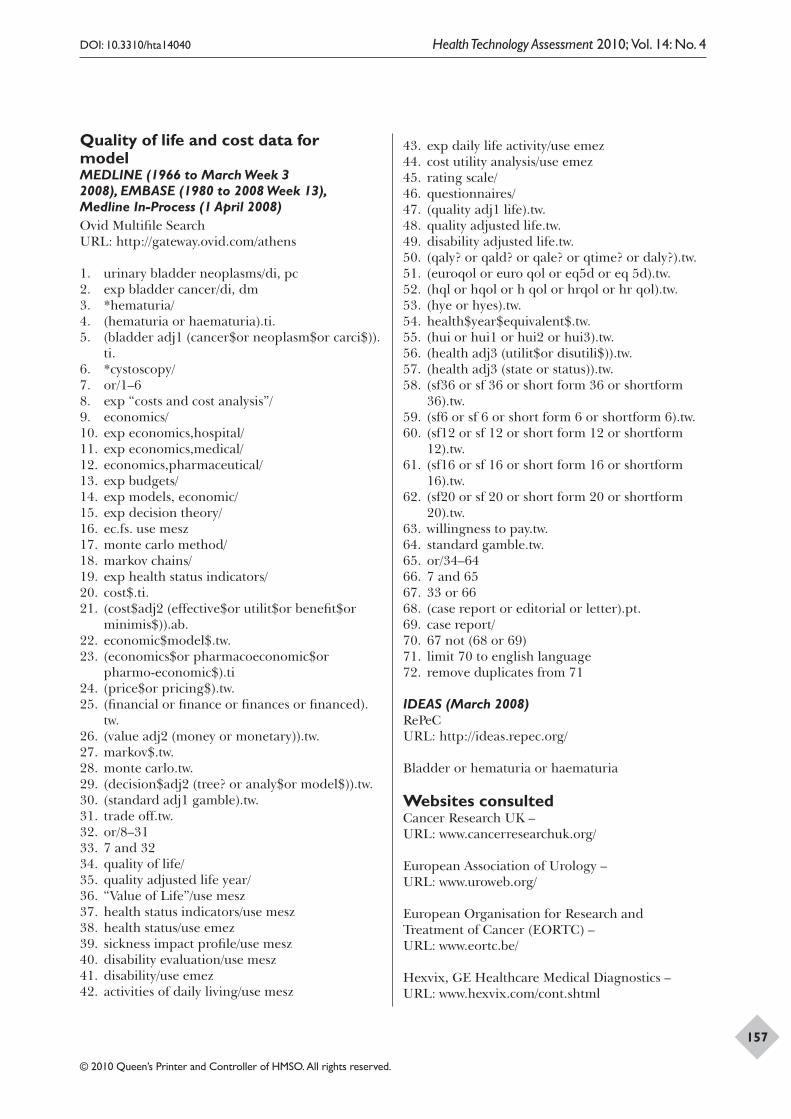
DOI: 10.3310/hta14040 Health Technology Assessment 2010; Vol. 14: No. 4
© 2010 Queen’s Printer and Controller of HMSO. All rights reserved.
157
Quality of life and cost data for modelMEDLINE (1966 to March Week 3 2008), EMBASE (1980 to 2008 Week 13), Medline In-Process (1 April 2008) Ovid Multifile SearchURL: http://gateway.ovid.com/athens
1. urinary bladder neoplasms/di, pc 2. exp bladder cancer/di, dm3. *hematuria/4. (hematuria or haematuria).ti. 5. (bladder adj1 (cancer$or neoplasm$or carci$)).
ti. 6. *cystoscopy/7. or/1–6 8. exp “costs and cost analysis”/9. economics/10. exp economics,hospital/11. exp economics,medical/12. economics,pharmaceutical/13. exp budgets/14. exp models, economic/15. exp decision theory/16. ec.fs. use mesz 17. monte carlo method/18. markov chains/19. exp health status indicators/20. cost$.ti.21. (cost$adj2 (effective$or utilit$or benefit$or
minimis$)).ab. 22. economic$model$.tw. 23. (economics$or pharmacoeconomic$or
pharmo-economic$).ti24. (price$or pricing$).tw. 25. (financial or finance or finances or financed).
tw.26. (value adj2 (money or monetary)).tw. 27. markov$.tw. 28. monte carlo.tw. 29. (decision$adj2 (tree? or analy$or model$)).tw.30. (standard adj1 gamble).tw.31. trade off.tw. 32. or/8–31 33. 7 and 3234. quality of life/35. quality adjusted life year/36. “Value of Life”/use mesz 37. health status indicators/use mesz 38. health status/use emez 39. sickness impact profile/use mesz 40. disability evaluation/use mesz 41. disability/use emez 42. activities of daily living/use mesz
43. exp daily life activity/use emez 44. cost utility analysis/use emez45. rating scale/46. questionnaires/47. (quality adj1 life).tw. 48. quality adjusted life.tw. 49. disability adjusted life.tw.50. (qaly? or qald? or qale? or qtime? or daly?).tw. 51. (euroqol or euro qol or eq5d or eq 5d).tw. 52. (hql or hqol or h qol or hrqol or hr qol).tw. 53. (hye or hyes).tw. 54. health$year$equivalent$.tw. 55. (hui or hui1 or hui2 or hui3).tw. 56. (health adj3 (utilit$or disutili$)).tw.57. (health adj3 (state or status)).tw. 58. (sf36 or sf 36 or short form 36 or shortform
36).tw. 59. (sf6 or sf 6 or short form 6 or shortform 6).tw. 60. (sf12 or sf 12 or short form 12 or shortform
12).tw. 61. (sf16 or sf 16 or short form 16 or shortform
16).tw. 62. (sf20 or sf 20 or short form 20 or shortform
20).tw. 63. willingness to pay.tw. 64. standard gamble.tw. 65. or/34–64 66. 7 and 65 67. 33 or 66 68. (case report or editorial or letter).pt.69. case report/70. 67 not (68 or 69) 71. limit 70 to english language72. remove duplicates from 71
IDEAS (March 2008)RePeCURL: http://ideas.repec.org/
Bladder or hematuria or haematuria
Websites consultedCancer Research UK – URL: www.cancerresearchuk.org/
European Association of Urology – URL: www.uroweb.org/
European Organisation for Research and Treatment of Cancer (EORTC) – URL: www.eortc.be/
Hexvix, GE Healthcare Medical Diagnostics – URL: www.hexvix.com/cont.shtml

Appendix 1
158
National Cancer Institute, US National Institutes of Health – URL: www.cancer.gov/
National Comprehensive Cancer Network – URL: www.nccn.org/default.asp
National Insitute of Diabetes and Digestive and Kidney Diseases (NIDDK) – URL: http://www2.niddk.nih.gov/Research/ScientificAreas/Urology/
NHS National Institute for Health and Clinical Excellence – URL: www.nice.org.uk/
Scottish Intercollegiate Guidelines Network, NHS Quality Improvement Scotland – URL: www.sign.ac.uk/
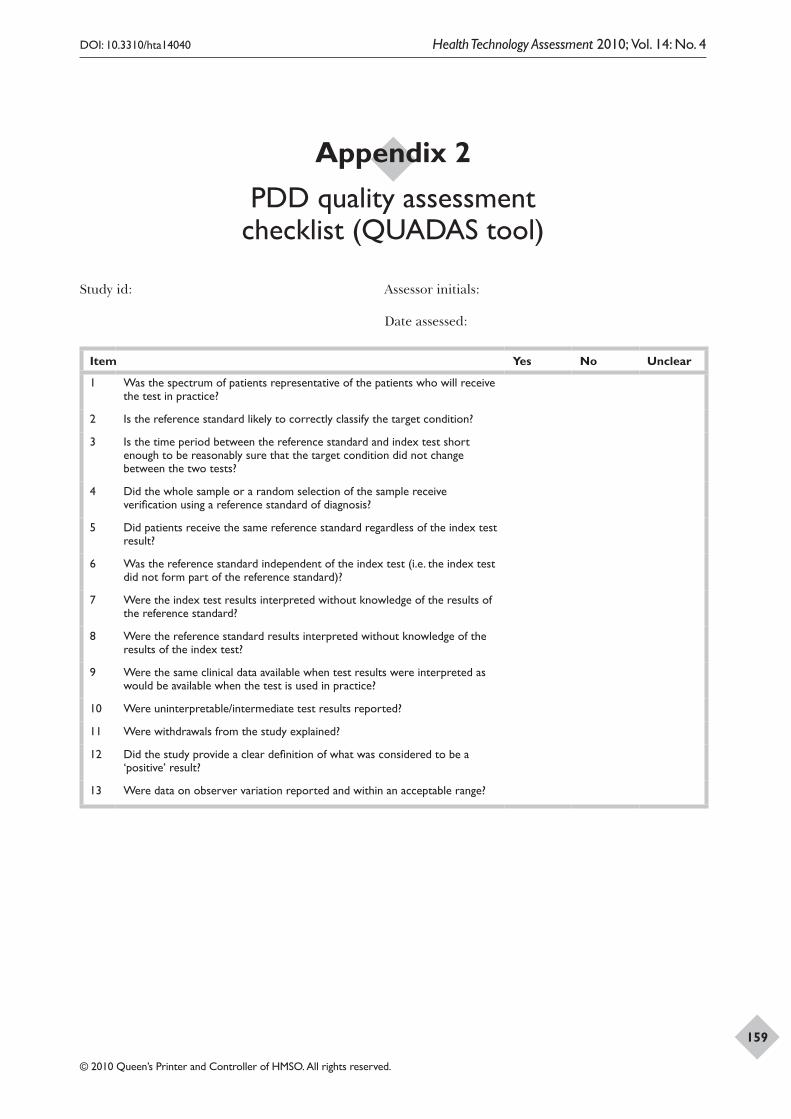
DOI: 10.3310/hta14040 Health Technology Assessment 2010; Vol. 14: No. 4
© 2010 Queen’s Printer and Controller of HMSO. All rights reserved.
159
Appendix 2 PDD quality assessment
checklist (QUADAS tool)
Study id: Assessor initials:
Date assessed:
Item Yes No Unclear
1 Was the spectrum of patients representative of the patients who will receive the test in practice?
2 Is the reference standard likely to correctly classify the target condition?
3 Is the time period between the reference standard and index test short enough to be reasonably sure that the target condition did not change between the two tests?
4 Did the whole sample or a random selection of the sample receive verification using a reference standard of diagnosis?
5 Did patients receive the same reference standard regardless of the index test result?
6 Was the reference standard independent of the index test (i.e. the index test did not form part of the reference standard)?
7 Were the index test results interpreted without knowledge of the results of the reference standard?
8 Were the reference standard results interpreted without knowledge of the results of the index test?
9 Were the same clinical data available when test results were interpreted as would be available when the test is used in practice?
10 Were uninterpretable/intermediate test results reported?
11 Were withdrawals from the study explained?
12 Did the study provide a clear definition of what was considered to be a ‘positive’ result?
13 Were data on observer variation reported and within an acceptable range?

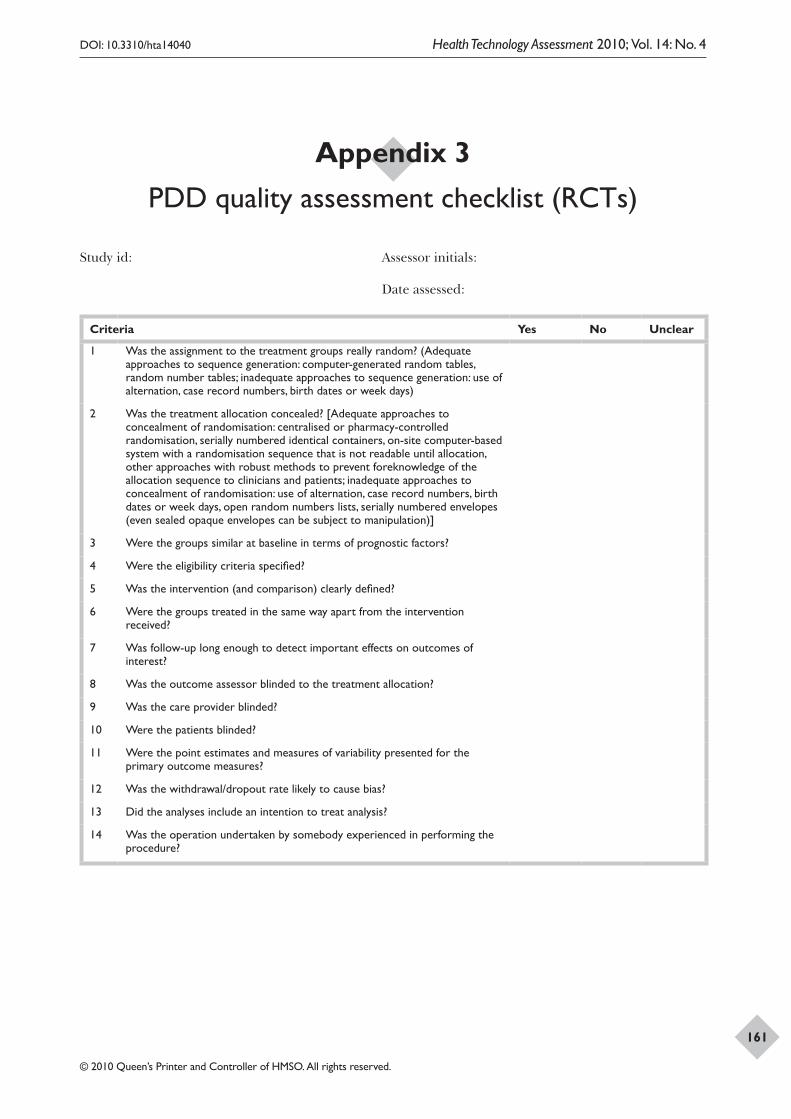
DOI: 10.3310/hta14040 Health Technology Assessment 2010; Vol. 14: No. 4
© 2010 Queen’s Printer and Controller of HMSO. All rights reserved.
161
Appendix 3 PDD quality assessment checklist (RCTs)
Study id: Assessor initials:
Date assessed:
Criteria Yes No Unclear
1 Was the assignment to the treatment groups really random? (Adequate approaches to sequence generation: computer-generated random tables, random number tables; inadequate approaches to sequence generation: use of alternation, case record numbers, birth dates or week days)
2 Was the treatment allocation concealed? [Adequate approaches to concealment of randomisation: centralised or pharmacy-controlled randomisation, serially numbered identical containers, on-site computer-based system with a randomisation sequence that is not readable until allocation, other approaches with robust methods to prevent foreknowledge of the allocation sequence to clinicians and patients; inadequate approaches to concealment of randomisation: use of alternation, case record numbers, birth dates or week days, open random numbers lists, serially numbered envelopes (even sealed opaque envelopes can be subject to manipulation)]
3 Were the groups similar at baseline in terms of prognostic factors?
4 Were the eligibility criteria specified?
5 Was the intervention (and comparison) clearly defined?
6 Were the groups treated in the same way apart from the intervention received?
7 Was follow-up long enough to detect important effects on outcomes of interest?
8 Was the outcome assessor blinded to the treatment allocation?
9 Was the care provider blinded?
10 Were the patients blinded?
11 Were the point estimates and measures of variability presented for the primary outcome measures?
12 Was the withdrawal/dropout rate likely to cause bias?
13 Did the analyses include an intention to treat analysis?
14 Was the operation undertaken by somebody experienced in performing the procedure?

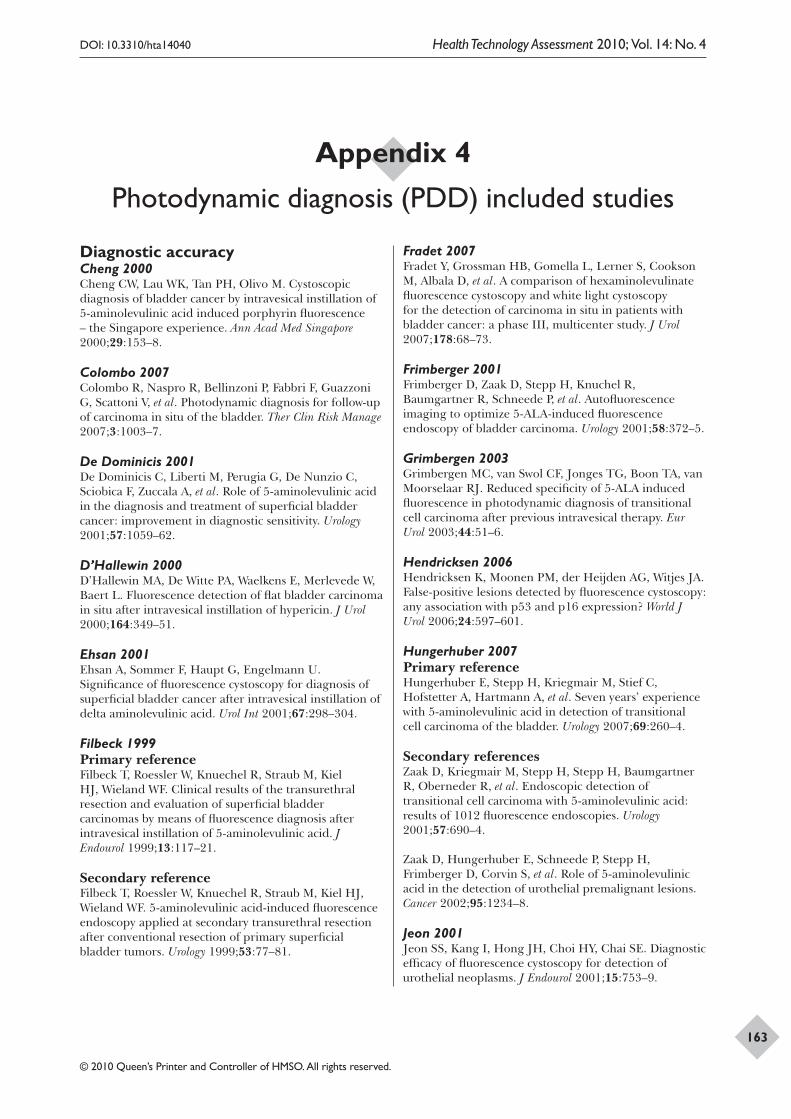
DOI: 10.3310/hta14040 Health Technology Assessment 2010; Vol. 14: No. 4
© 2010 Queen’s Printer and Controller of HMSO. All rights reserved.
163
Diagnostic accuracyCheng 2000Cheng CW, Lau WK, Tan PH, Olivo M. Cystoscopic diagnosis of bladder cancer by intravesical instillation of 5-aminolevulinic acid induced porphyrin fluorescence – the Singapore experience. Ann Acad Med Singapore 2000;29:153–8.
Colombo 2007Colombo R, Naspro R, Bellinzoni P, Fabbri F, Guazzoni G, Scattoni V, et al. Photodynamic diagnosis for follow-up of carcinoma in situ of the bladder. Ther Clin Risk Manage 2007;3:1003–7.
De Dominicis 2001De Dominicis C, Liberti M, Perugia G, De Nunzio C, Sciobica F, Zuccala A, et al. Role of 5-aminolevulinic acid in the diagnosis and treatment of superficial bladder cancer: improvement in diagnostic sensitivity. Urology 2001;57:1059–62.
D’Hallewin 2000D’Hallewin MA, De Witte PA, Waelkens E, Merlevede W, Baert L. Fluorescence detection of flat bladder carcinoma in situ after intravesical instillation of hypericin. J Urol 2000;164:349–51.
Ehsan 2001Ehsan A, Sommer F, Haupt G, Engelmann U. Significance of fluorescence cystoscopy for diagnosis of superficial bladder cancer after intravesical instillation of delta aminolevulinic acid. Urol Int 2001;67:298–304.
Filbeck 1999Primary referenceFilbeck T, Roessler W, Knuechel R, Straub M, Kiel HJ, Wieland WF. Clinical results of the transurethral resection and evaluation of superficial bladder carcinomas by means of fluorescence diagnosis after intravesical instillation of 5-aminolevulinic acid. J Endourol 1999;13:117–21.
Secondary referenceFilbeck T, Roessler W, Knuechel R, Straub M, Kiel HJ, Wieland WF. 5-aminolevulinic acid-induced fluorescence endoscopy applied at secondary transurethral resection after conventional resection of primary superficial bladder tumors. Urology 1999;53:77–81.
Fradet 2007Fradet Y, Grossman HB, Gomella L, Lerner S, Cookson M, Albala D, et al. A comparison of hexaminolevulinate fluorescence cystoscopy and white light cystoscopy for the detection of carcinoma in situ in patients with bladder cancer: a phase III, multicenter study. J Urol 2007;178:68–73.
Frimberger 2001Frimberger D, Zaak D, Stepp H, Knuchel R, Baumgartner R, Schneede P, et al. Autofluorescence imaging to optimize 5-ALA-induced fluorescence endoscopy of bladder carcinoma. Urology 2001;58:372–5.
Grimbergen 2003Grimbergen MC, van Swol CF, Jonges TG, Boon TA, van Moorselaar RJ. Reduced specificity of 5-ALA induced fluorescence in photodynamic diagnosis of transitional cell carcinoma after previous intravesical therapy. Eur Urol 2003;44:51–6.
Hendricksen 2006Hendricksen K, Moonen PM, der Heijden AG, Witjes JA. False-positive lesions detected by fluorescence cystoscopy: any association with p53 and p16 expression? World J Urol 2006;24:597–601.
Hungerhuber 2007Primary referenceHungerhuber E, Stepp H, Kriegmair M, Stief C, Hofstetter A, Hartmann A, et al. Seven years’ experience with 5-aminolevulinic acid in detection of transitional cell carcinoma of the bladder. Urology 2007;69:260–4.
Secondary referencesZaak D, Kriegmair M, Stepp H, Stepp H, Baumgartner R, Oberneder R, et al. Endoscopic detection of transitional cell carcinoma with 5-aminolevulinic acid: results of 1012 fluorescence endoscopies. Urology 2001;57:690–4.
Zaak D, Hungerhuber E, Schneede P, Stepp H, Frimberger D, Corvin S, et al. Role of 5-aminolevulinic acid in the detection of urothelial premalignant lesions. Cancer 2002;95:1234–8.
Jeon 2001Jeon SS, Kang I, Hong JH, Choi HY, Chai SE. Diagnostic efficacy of fluorescence cystoscopy for detection of urothelial neoplasms. J Endourol 2001;15:753–9.
Appendix 4 Photodynamic diagnosis (PDD) included studies
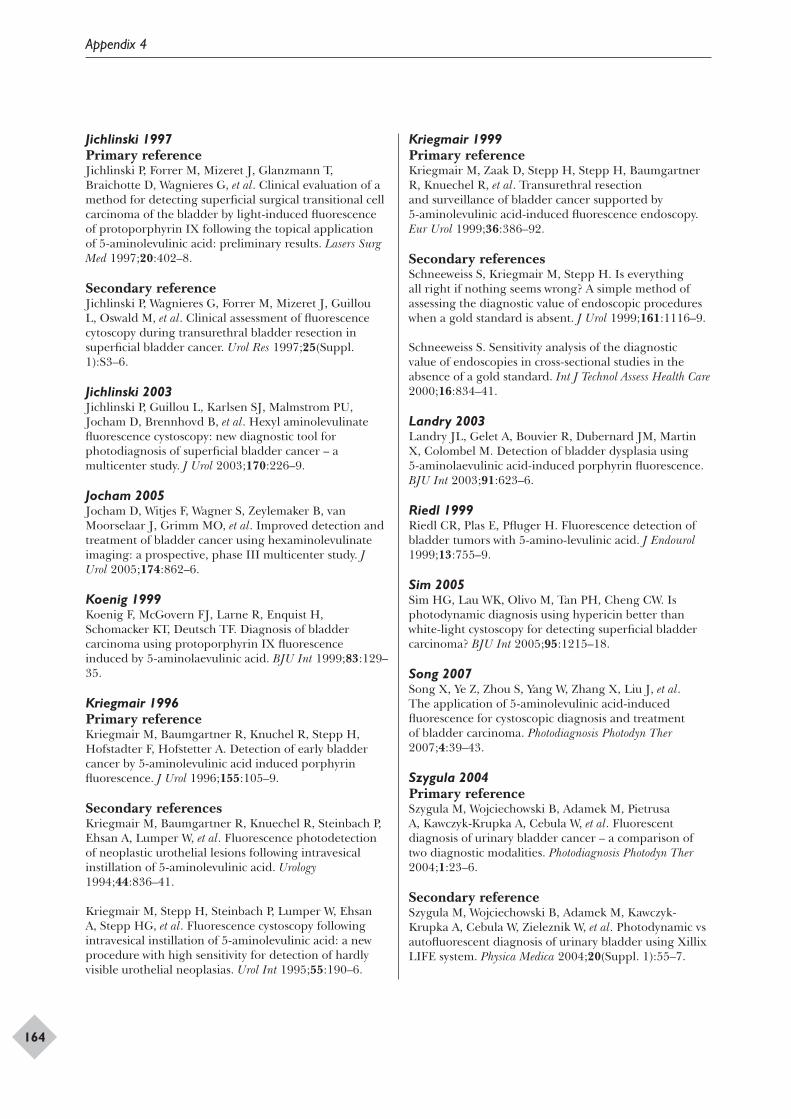
Appendix 4
164
Jichlinski 1997Primary referenceJichlinski P, Forrer M, Mizeret J, Glanzmann T, Braichotte D, Wagnieres G, et al. Clinical evaluation of a method for detecting superficial surgical transitional cell carcinoma of the bladder by light-induced fluorescence of protoporphyrin IX following the topical application of 5-aminolevulinic acid: preliminary results. Lasers Surg Med 1997;20:402–8.
Secondary referenceJichlinski P, Wagnieres G, Forrer M, Mizeret J, Guillou L, Oswald M, et al. Clinical assessment of fluorescence cytoscopy during transurethral bladder resection in superficial bladder cancer. Urol Res 1997;25(Suppl. 1):S3–6.
Jichlinski 2003Jichlinski P, Guillou L, Karlsen SJ, Malmstrom PU, Jocham D, Brennhovd B, et al. Hexyl aminolevulinate fluorescence cystoscopy: new diagnostic tool for photodiagnosis of superficial bladder cancer – a multicenter study. J Urol 2003;170:226–9.
Jocham 2005Jocham D, Witjes F, Wagner S, Zeylemaker B, van Moorselaar J, Grimm MO, et al. Improved detection and treatment of bladder cancer using hexaminolevulinate imaging: a prospective, phase III multicenter study. J Urol 2005;174:862–6.
Koenig 1999Koenig F, McGovern FJ, Larne R, Enquist H, Schomacker KT, Deutsch TF. Diagnosis of bladder carcinoma using protoporphyrin IX fluorescence induced by 5-aminolaevulinic acid. BJU Int 1999;83:129–35.
Kriegmair 1996Primary referenceKriegmair M, Baumgartner R, Knuchel R, Stepp H, Hofstadter F, Hofstetter A. Detection of early bladder cancer by 5-aminolevulinic acid induced porphyrin fluorescence. J Urol 1996;155:105–9.
Secondary referencesKriegmair M, Baumgartner R, Knuechel R, Steinbach P, Ehsan A, Lumper W, et al. Fluorescence photodetection of neoplastic urothelial lesions following intravesical instillation of 5-aminolevulinic acid. Urology 1994;44:836–41.
Kriegmair M, Stepp H, Steinbach P, Lumper W, Ehsan A, Stepp HG, et al. Fluorescence cystoscopy following intravesical instillation of 5-aminolevulinic acid: a new procedure with high sensitivity for detection of hardly visible urothelial neoplasias. Urol Int 1995;55:190–6.
Kriegmair 1999Primary referenceKriegmair M, Zaak D, Stepp H, Stepp H, Baumgartner R, Knuechel R, et al. Transurethral resection and surveillance of bladder cancer supported by 5-aminolevulinic acid-induced fluorescence endoscopy. Eur Urol 1999;36:386–92.
Secondary referencesSchneeweiss S, Kriegmair M, Stepp H. Is everything all right if nothing seems wrong? A simple method of assessing the diagnostic value of endoscopic procedures when a gold standard is absent. J Urol 1999;161:1116–9.
Schneeweiss S. Sensitivity analysis of the diagnostic value of endoscopies in cross-sectional studies in the absence of a gold standard. Int J Technol Assess Health Care 2000;16:834–41.
Landry 2003Landry JL, Gelet A, Bouvier R, Dubernard JM, Martin X, Colombel M. Detection of bladder dysplasia using 5-aminolaevulinic acid-induced porphyrin fluorescence. BJU Int 2003;91:623–6.
Riedl 1999Riedl CR, Plas E, Pfluger H. Fluorescence detection of bladder tumors with 5-amino-levulinic acid. J Endourol 1999;13:755–9.
Sim 2005Sim HG, Lau WK, Olivo M, Tan PH, Cheng CW. Is photodynamic diagnosis using hypericin better than white-light cystoscopy for detecting superficial bladder carcinoma? BJU Int 2005;95:1215–18.
Song 2007Song X, Ye Z, Zhou S, Yang W, Zhang X, Liu J, et al. The application of 5-aminolevulinic acid-induced fluorescence for cystoscopic diagnosis and treatment of bladder carcinoma. Photodiagnosis Photodyn Ther 2007;4:39–43.
Szygula 2004Primary referenceSzygula M, Wojciechowski B, Adamek M, Pietrusa A, Kawczyk-Krupka A, Cebula W, et al. Fluorescent diagnosis of urinary bladder cancer – a comparison of two diagnostic modalities. Photodiagnosis Photodyn Ther 2004;1:23–6.
Secondary referenceSzygula M, Wojciechowski B, Adamek M, Kawczyk-Krupka A, Cebula W, Zieleznik W, et al. Photodynamic vs autofluorescent diagnosis of urinary bladder using Xillix LIFE system. Physica Medica 2004;20(Suppl. 1):55–7.
DOI: 10.3310/hta14040 Health Technology Assessment 2010; Vol. 14: No. 4
© 2010 Queen’s Printer and Controller of HMSO. All rights reserved.
165
Tritschler 2007Tritschler S, Scharf S, Karl A, Tilki D, Knuechel R, Hartmann A, et al. Validation of the diagnostic value of NMP22 BladderChek test as a marker for bladder cancer by photodynamic diagnosis. Eur Urol 2007;51:403–7.
Witjes 2005Witjes JA, Moonen PM, van der Heijden AG. Comparison of hexaminolevulinate based flexible and rigid fluorescence cystoscopy with rigid white light cystoscopy in bladder cancer: results of a prospective phase II study. Eur Urol 2005;47:319–22.
Zaak 2002Zaak D, Stepp H, Baumgartner R, Schneede P, Waidelich R, Frimberger D, et al. Ultraviolet-excited (308 nm) autofluorescence for bladder cancer detection. Urology 2002;60:1029–33.
Zumbraegel 2003Zumbraegel A, Bichler KH, Krause FS, Feil G, Nelde HJ. The photodynamic diagnosis (PDD) for early detection of carcinoma and dysplasia of the bladder. Adv Exp Med Biol 2003;539:61–6.
EffectivenessBabjujk 2005Babjuk M, Soukup V, Petrik R, Jirsa M, Dvoracek J. 5-aminolaevulinic acid-induced fluorescence cystoscopy during transurethral resection reduces the risk of recurrence in stage Ta/T1 bladder cancer. BJU Int 2005;96:798–802.
Daniltchenko 2005Primary referenceDaniltchenko DI, Riedl CR, Sachs MD, Koenig F, Daha KL, Pflueger H, et al. Long-term benefit of 5-aminolevulinic acid fluorescence assisted transurethral resection of superficial bladder cancer: 5-year results of a prospective randomized study. J Urol 2005;174:2129–33.
Secondary referenceRiedl CR, Daniltchenko D, Koenig F, Simak R, Loening SA, Pflueger H. Fluorescence endoscopy with 5-aminolevulinic acid reduces early recurrence rate in superficial bladder cancer. J Urol 2001;165:1121–3.
Denzinger 2007Primary referenceDenzinger S, Burger M, Walter B, Knuechel R, Roessler W, Wieland WF, et al. Clinically relevant reduction in risk of recurrence of superficial bladder cancer using 5-aminolevulinic acid-induced fluorescence diagnosis: 8-year results of prospective randomized study. Urology 2007;69:675–9.
Secondary referencesBurger M, Zaak D, Stief CG, Filbeck T, Wieland WF, Roessler W, et al. Photodynamic diagnostics and noninvasive bladder cancer: is it cost-effective in long-term application? A Germany-based cost analysis. Eur Urol 2007;52:142–7.
Denzinger S, Wieland WF, Otto W, Filbeck T, Knuechel R, Burger M. Does photodynamic transurethral resection of bladder tumour improve the outcome of initial T1 high-grade bladder cancer? A long-term follow-up of a randomized study. BJU Int 2008;101:566–9.
Filbeck T, Pichlmeier U, Knuechel R, Wieland WF, Roessler W. Clinically relevant improvement of recurrence-free survival with 5-aminolevulinic acid induced fluorescence diagnosis in patients with superficial bladder tumors. J Urol 2002;168:67–71.
Kriegmair 2002Kriegmair M, Zaak D, Rothenberger KH, Rassweiler J, Jocham D, Eisenberger F, et al. Transurethral resection for bladder cancer using 5-aminolevulinic acid induced fluorescence endoscopy versus white light endoscopy. J Urol 2002;168:475–8.

DOI: 10.3310/hta14040 Health Technology Assessment 2010; Vol. 14: No. 4
© 2010 Queen’s Printer and Controller of HMSO. All rights reserved.
167
Required outcomes not reported (n = 12)Chin WW, Ramaswamy B, Thong PSP, Heng PWS, Gan YY, Olivo M, et al. Preclinical and pilot clinical cancer studies using fluorescence-guided photodynamic therapy with chlorin e6-polyvinylpyrrolidone and hypericin. Singapore Gen Hosp Proc 2007;16:118–26.
D’Hallewin MA, Vanherzeele H, Baert L. Fluorescence detection of flat transitional cell carcinoma after intravesical instillation of aminolevulinic acid. Am J Clin Oncol 1998;21:223–5.
D’Hallewin MA, Kamuhabwa AR, Roskams T, De Witte PA, Baert L. Hypericin-based fluorescence diagnosis of bladder carcinoma. BJU Int 2002;9:760–3.
Filbeck T, Pichlmeier U, Knuechel R, Wieland WF, Roessler W. Do patients profit from 5-aminolevulinic acid-induced fluorescence diagnosis in transurethral resection of bladder carcinoma? Urology 2002;60:1025–8.
Grossman HB, Gomella L, Fradet Y, Morales A, Presti J, Ritenour C, et al. A phase III, multicenter comparison of hexaminolevulinate fluorescence cystoscopy and white light cystoscopy for the detection of superficial papillary lesions in patients with bladder cancer. J Urol 2007;178:62–7.
Junker K, Kania K, Fiedler W, Hartmann A, Schubert J, Werner W. Molecular genetic evaluation of fluorescence diagnosis in bladder cancer. Int J Oncol 2002;20:647–53.
Kriegmair M, Zaak D, Knuechel R, Baumgartner R, Hofstetter A. 5-Aminolevulinic acid-induced fluorescence endoscopy for the detection of lower urinary tract tumors. Urol Int 1999;63:27–31.
Kriegmair M, Zaak D, Knuechel R, Baumgartner R, Hofstetter A. Photodynamic cystoscopy for detection of bladder tumors. Semin Laparosc Surg 1999;6:100–3.
Loidl W, Schmidbauer J, Susani M, Marberger M. Flexible cystoscopy assisted by hexaminolevulinate induced fluorescence: a new approach for bladder cancer detection and surveillance? Eur Urol 2005;47:323–6.
Petrik R, Jirsa M, Dvorak E, Skoda V, Stadnik B. Fluorescence cystoscopy in the diagnostics and treatment of bladder tumors. Biomed Tech (Berl) 1998;43(Suppl.):74–5.
Schmidbauer J, Witjes F, Schmeller N, Donat R, Susani M, Marberger M, et al. Improved detection of urothelial carcinoma in situ with hexaminolevulinate fluorescence cystoscopy. J Urol 2004;171:135–8.
van der Meijden APM. Does hexaminolevulinate imaging improve the detection and treatment of bladder cancer? Nature Clin Pract Urol 2006;3:22–3.
Required study design not met (n = 10)Batlle A, Peng Q. Preface: special issue of photodynamic therapy and photodetection with porphyrin precursors for the Journal of Environmental Pathology, Toxicology, and Oncology. J Env Pathol Toxicol Oncol 2007;26:ix–xii.
Chatterton K, Ray E, O’Brien TS. Fluorescence diagnosis of bladder cancer. Br J Nurs 2006;15:595–7.
Collaud S, Jichlinski P, Marti A, Aymon D, Gurny R, Lange N. An open pharmacokinetic study of hexylaminolevulinate-induced photodiagnosis after intravesical administration. Drugs R D 2006;7:173–86.
Grossman H. Re: Long-term benefit of 5-aminolevulinic acid fluorescence-assisted transurethral resection of superficial bladder cancer: 5-year results of a prospective randomised study. Eur Urol 2006;50:861–2.
Jichlinski P. Hexyl aminolevulinate in the detection of bladder cancer. Drugs 2006;66:579–80.
Koenig F, McGovern FJ. Fluorescence detection of bladder carcinoma. Urology 1997;50:778–9.
Witjes JA, Jichlinski P, Zaak D, Stief CG. Hexyl aminolevulinate in the detection of bladder cancer. Drugs 2006;66:579–80.
Zaak D, Frimberger D, Stepp H, Wagner S, Baumgartner R, Schneede P, et al. Quantification of 5-aminolevulinic acid induced fluorescence improves the specificity of bladder cancer detection. J Urol 2001;166:1665–8.
Zaak D, Stief CG. Hexyl aminolevulinate in the detection of bladder cancer. Drugs 2006;66(4).
Zlotta A. Fluorescence cystoscopy: is flexible scope as effective as rigid? Eur Urol 2005;47:318.
Appendix 5 Photodynamic diagnosis excluded studies

Appendix 5
168
Required reference standard not met (n = 2)Olivo M, Lau W, Manivasager V, Hoon TP, Christopher C. Fluorescence confocal microscopy and image analysis of bladder cancer using 5-aminolevulinic acid. Int J Oncol 2003;22:523–8.
Olivo M, Lau W, Manivasager V, Tan PH, Soo KC, Cheng C. Macro-microscopic fluorescence of human bladder cancer using hypericin fluorescence cystoscopy and laser confocal microscopy. Int J Oncol 2003;23:983–90.
Comparator test not white light cystoscopy (n = 1)Lipinski M, Jeromin L. Comparison of the bladder tumour antigen test with photodynamic diagnosis in patients with pathologically confirmed recurrent superficial urinary bladder tumours. BJU Int 2002;89:757–9.
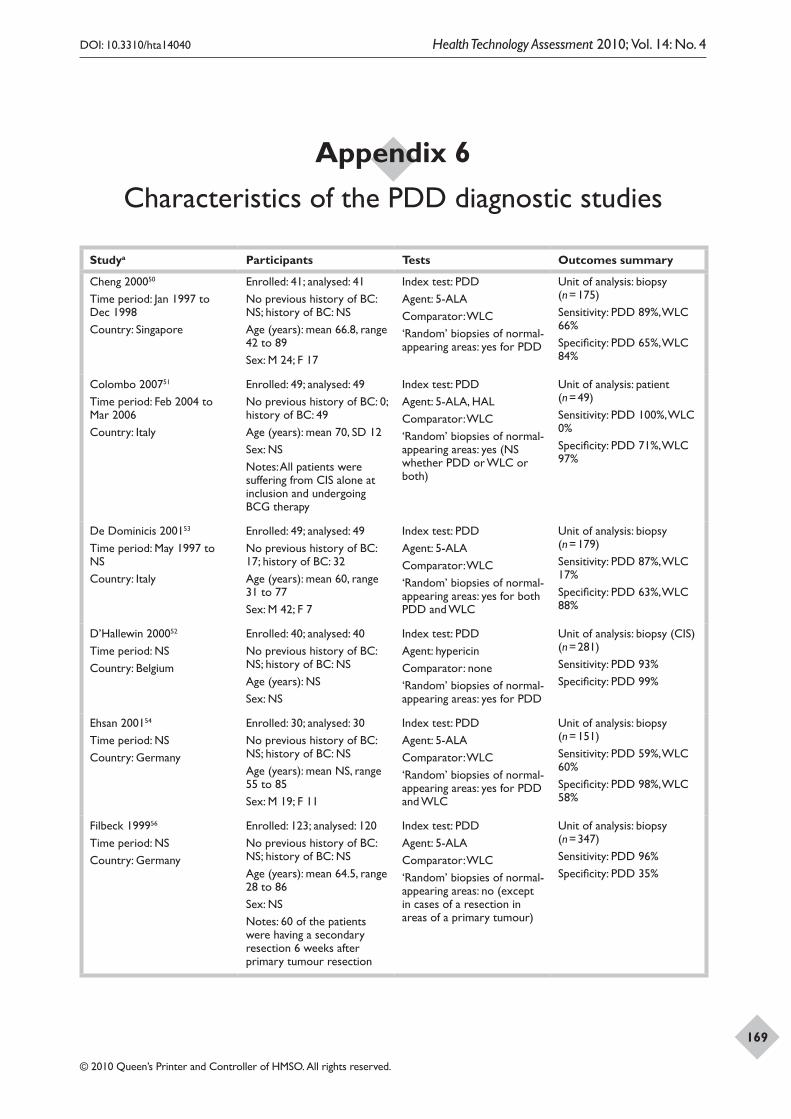
DOI: 10.3310/hta14040 Health Technology Assessment 2010; Vol. 14: No. 4
© 2010 Queen’s Printer and Controller of HMSO. All rights reserved.
169
Appendix 6 Characteristics of the PDD diagnostic studies
Studya Participants Tests Outcomes summary
Cheng 200050
Time period: Jan 1997 to Dec 1998Country: Singapore
Enrolled: 41; analysed: 41No previous history of BC: NS; history of BC: NSAge (years): mean 66.8, range 42 to 89Sex: M 24; F 17
Index test: PDDAgent: 5-ALAComparator: WLC‘Random’ biopsies of normal-appearing areas: yes for PDD
Unit of analysis: biopsy (n = 175) Sensitivity: PDD 89%, WLC 66%Specificity: PDD 65%, WLC 84%
Colombo 200751
Time period: Feb 2004 to Mar 2006Country: Italy
Enrolled: 49; analysed: 49No previous history of BC: 0; history of BC: 49Age (years): mean 70, SD 12Sex: NSNotes: All patients were suffering from CIS alone at inclusion and undergoing BCG therapy
Index test: PDDAgent: 5-ALA, HALComparator: WLC‘Random’ biopsies of normal-appearing areas: yes (NS whether PDD or WLC or both)
Unit of analysis: patient (n = 49)Sensitivity: PDD 100%, WLC 0%Specificity: PDD 71%, WLC 97%
De Dominicis 200153
Time period: May 1997 to NSCountry: Italy
Enrolled: 49; analysed: 49No previous history of BC: 17; history of BC: 32Age (years): mean 60, range 31 to 77Sex: M 42; F 7
Index test: PDDAgent: 5-ALAComparator: WLC‘Random’ biopsies of normal-appearing areas: yes for both PDD and WLC
Unit of analysis: biopsy (n = 179)Sensitivity: PDD 87%, WLC 17%Specificity: PDD 63%, WLC 88%
D’Hallewin 200052
Time period: NSCountry: Belgium
Enrolled: 40; analysed: 40No previous history of BC: NS; history of BC: NSAge (years): NSSex: NS
Index test: PDDAgent: hypericinComparator: none‘Random’ biopsies of normal-appearing areas: yes for PDD
Unit of analysis: biopsy (CIS) (n = 281)Sensitivity: PDD 93%Specificity: PDD 99%
Ehsan 200154
Time period: NSCountry: Germany
Enrolled: 30; analysed: 30No previous history of BC: NS; history of BC: NSAge (years): mean NS, range 55 to 85Sex: M 19; F 11
Index test: PDDAgent: 5-ALAComparator: WLC‘Random’ biopsies of normal-appearing areas: yes for PDD and WLC
Unit of analysis: biopsy (n = 151)Sensitivity: PDD 59%, WLC 60%Specificity: PDD 98%, WLC 58%
Filbeck 199956
Time period: NSCountry: Germany
Enrolled: 123; analysed: 120No previous history of BC: NS; history of BC: NSAge (years): mean 64.5, range 28 to 86Sex: NSNotes: 60 of the patients were having a secondary resection 6 weeks after primary tumour resection
Index test: PDDAgent: 5-ALAComparator: WLC‘Random’ biopsies of normal-appearing areas: no (except in cases of a resection in areas of a primary tumour)
Unit of analysis: biopsy (n = 347)Sensitivity: PDD 96%Specificity: PDD 35%
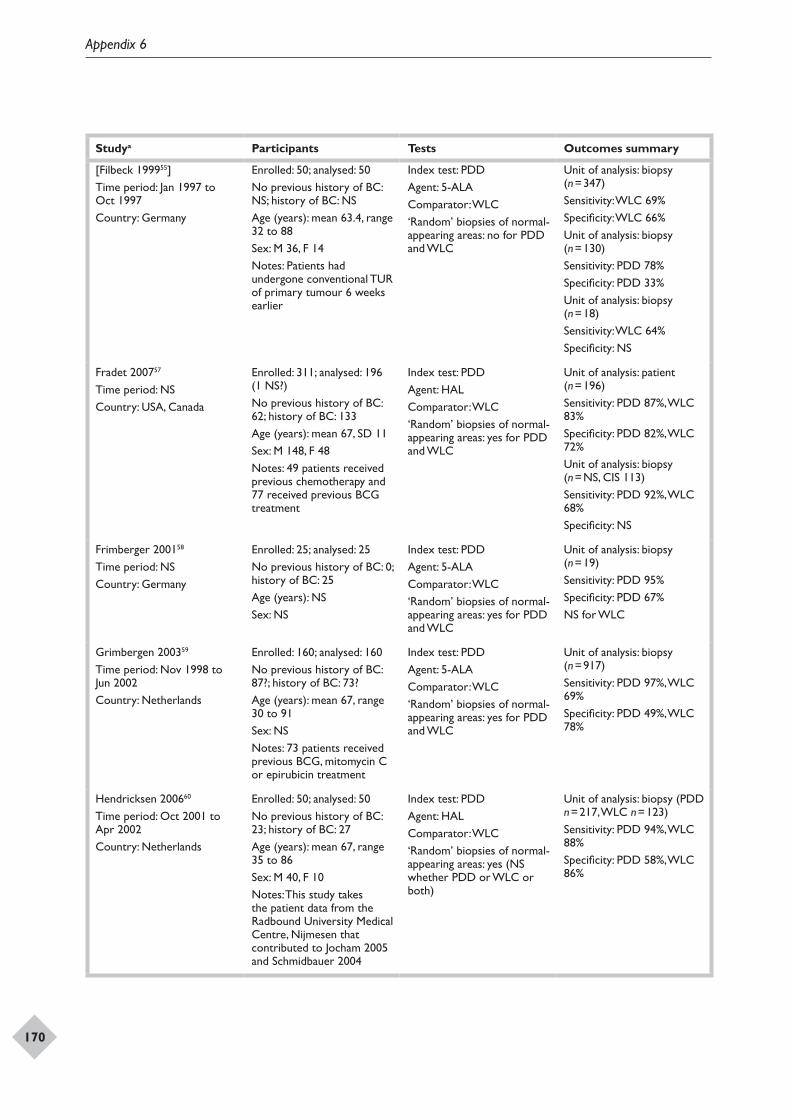
Appendix 6
170
Studya Participants Tests Outcomes summary
[Filbeck 199955]Time period: Jan 1997 to Oct 1997Country: Germany
Enrolled: 50; analysed: 50No previous history of BC: NS; history of BC: NSAge (years): mean 63.4, range 32 to 88Sex: M 36, F 14Notes: Patients had undergone conventional TUR of primary tumour 6 weeks earlier
Index test: PDDAgent: 5-ALAComparator: WLC‘Random’ biopsies of normal-appearing areas: no for PDD and WLC
Unit of analysis: biopsy (n = 347)Sensitivity: WLC 69%Specificity: WLC 66%Unit of analysis: biopsy (n = 130)Sensitivity: PDD 78% Specificity: PDD 33%Unit of analysis: biopsy (n = 18)Sensitivity: WLC 64%Specificity: NS
Fradet 200757
Time period: NSCountry: USA, Canada
Enrolled: 311; analysed: 196 (1 NS?)No previous history of BC: 62; history of BC: 133Age (years): mean 67, SD 11Sex: M 148, F 48Notes: 49 patients received previous chemotherapy and 77 received previous BCG treatment
Index test: PDDAgent: HALComparator: WLC ‘Random’ biopsies of normal-appearing areas: yes for PDD and WLC
Unit of analysis: patient (n = 196)Sensitivity: PDD 87%, WLC 83%Specificity: PDD 82%, WLC 72%Unit of analysis: biopsy (n = NS, CIS 113)Sensitivity: PDD 92%, WLC 68%Specificity: NS
Frimberger 200158
Time period: NSCountry: Germany
Enrolled: 25; analysed: 25No previous history of BC: 0; history of BC: 25Age (years): NSSex: NS
Index test: PDDAgent: 5-ALAComparator: WLC‘Random’ biopsies of normal-appearing areas: yes for PDD and WLC
Unit of analysis: biopsy (n = 19)Sensitivity: PDD 95%Specificity: PDD 67%NS for WLC
Grimbergen 200359
Time period: Nov 1998 to Jun 2002Country: Netherlands
Enrolled: 160; analysed: 160No previous history of BC: 87?; history of BC: 73?Age (years): mean 67, range 30 to 91Sex: NS Notes: 73 patients received previous BCG, mitomycin C or epirubicin treatment
Index test: PDDAgent: 5-ALAComparator: WLC‘Random’ biopsies of normal-appearing areas: yes for PDD and WLC
Unit of analysis: biopsy (n = 917)Sensitivity: PDD 97%, WLC 69%Specificity: PDD 49%, WLC 78%
Hendricksen 200660
Time period: Oct 2001 to Apr 2002Country: Netherlands
Enrolled: 50; analysed: 50No previous history of BC: 23; history of BC: 27Age (years): mean 67, range 35 to 86Sex: M 40, F 10 Notes: This study takes the patient data from the Radbound University Medical Centre, Nijmesen that contributed to Jocham 2005 and Schmidbauer 2004
Index test: PDDAgent: HALComparator: WLC ‘Random’ biopsies of normal-appearing areas: yes (NS whether PDD or WLC or both)
Unit of analysis: biopsy (PDD n = 217, WLC n = 123)Sensitivity: PDD 94%, WLC 88%Specificity: PDD 58%, WLC 86%
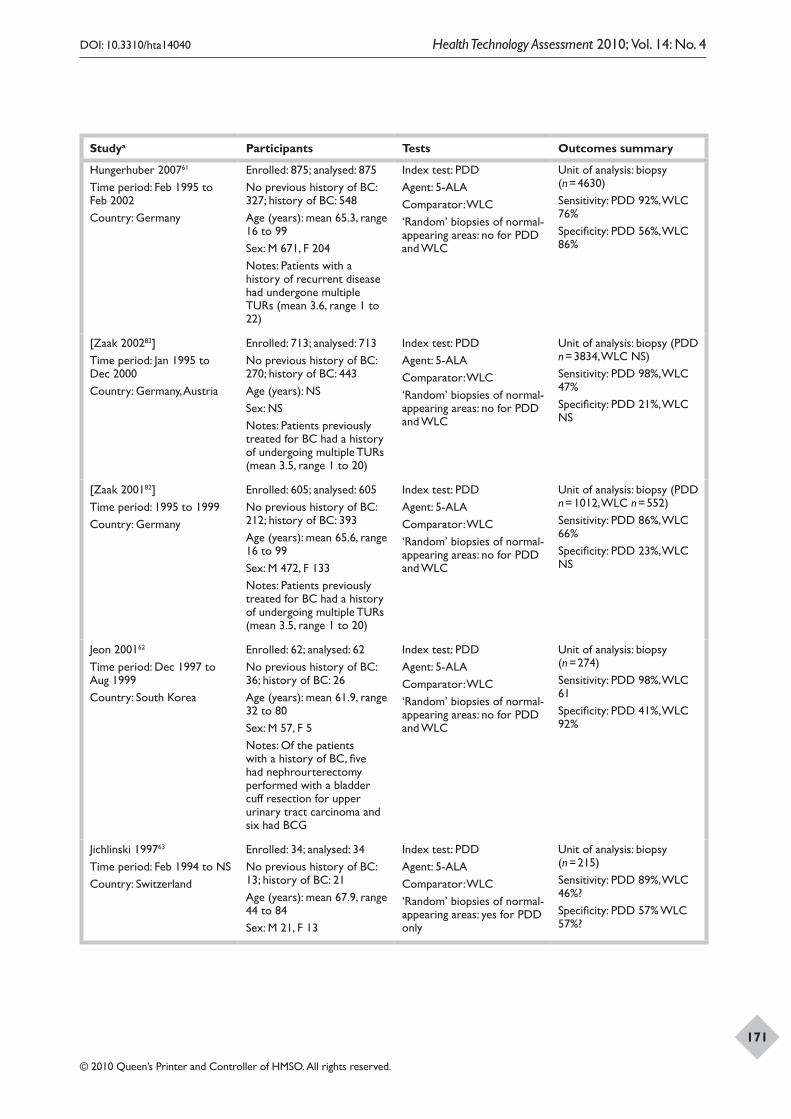
DOI: 10.3310/hta14040 Health Technology Assessment 2010; Vol. 14: No. 4
© 2010 Queen’s Printer and Controller of HMSO. All rights reserved.
171
Studya Participants Tests Outcomes summary
Hungerhuber 200761
Time period: Feb 1995 to Feb 2002Country: Germany
Enrolled: 875; analysed: 875No previous history of BC: 327; history of BC: 548Age (years): mean 65.3, range 16 to 99Sex: M 671, F 204 Notes: Patients with a history of recurrent disease had undergone multiple TURs (mean 3.6, range 1 to 22)
Index test: PDDAgent: 5-ALAComparator: WLC‘Random’ biopsies of normal-appearing areas: no for PDD and WLC
Unit of analysis: biopsy (n = 4630)Sensitivity: PDD 92%, WLC 76%Specificity: PDD 56%, WLC 86%
[Zaak 200283]Time period: Jan 1995 to Dec 2000Country: Germany, Austria
Enrolled: 713; analysed: 713No previous history of BC: 270; history of BC: 443Age (years): NSSex: NSNotes: Patients previously treated for BC had a history of undergoing multiple TURs (mean 3.5, range 1 to 20)
Index test: PDDAgent: 5-ALAComparator: WLC‘Random’ biopsies of normal-appearing areas: no for PDD and WLC
Unit of analysis: biopsy (PDD n = 3834, WLC NS)Sensitivity: PDD 98%, WLC 47%Specificity: PDD 21%, WLC NS
[Zaak 200182]Time period: 1995 to 1999Country: Germany
Enrolled: 605; analysed: 605No previous history of BC: 212; history of BC: 393Age (years): mean 65.6, range 16 to 99Sex: M 472, F 133 Notes: Patients previously treated for BC had a history of undergoing multiple TURs (mean 3.5, range 1 to 20)
Index test: PDDAgent: 5-ALAComparator: WLC‘Random’ biopsies of normal-appearing areas: no for PDD and WLC
Unit of analysis: biopsy (PDD n = 1012, WLC n = 552)Sensitivity: PDD 86%, WLC 66%Specificity: PDD 23%, WLC NS
Jeon 200162
Time period: Dec 1997 to Aug 1999Country: South Korea
Enrolled: 62; analysed: 62No previous history of BC: 36; history of BC: 26Age (years): mean 61.9, range 32 to 80Sex: M 57, F 5Notes: Of the patients with a history of BC, five had nephrourterectomy performed with a bladder cuff resection for upper urinary tract carcinoma and six had BCG
Index test: PDDAgent: 5-ALAComparator: WLC‘Random’ biopsies of normal-appearing areas: no for PDD and WLC
Unit of analysis: biopsy (n = 274)Sensitivity: PDD 98%, WLC 61Specificity: PDD 41%, WLC 92%
Jichlinski 199763
Time period: Feb 1994 to NSCountry: Switzerland
Enrolled: 34; analysed: 34No previous history of BC: 13; history of BC: 21Age (years): mean 67.9, range 44 to 84Sex: M 21, F 13
Index test: PDDAgent: 5-ALAComparator: WLC‘Random’ biopsies of normal-appearing areas: yes for PDD only
Unit of analysis: biopsy (n = 215)Sensitivity: PDD 89%, WLC 46%?Specificity: PDD 57% WLC 57%?
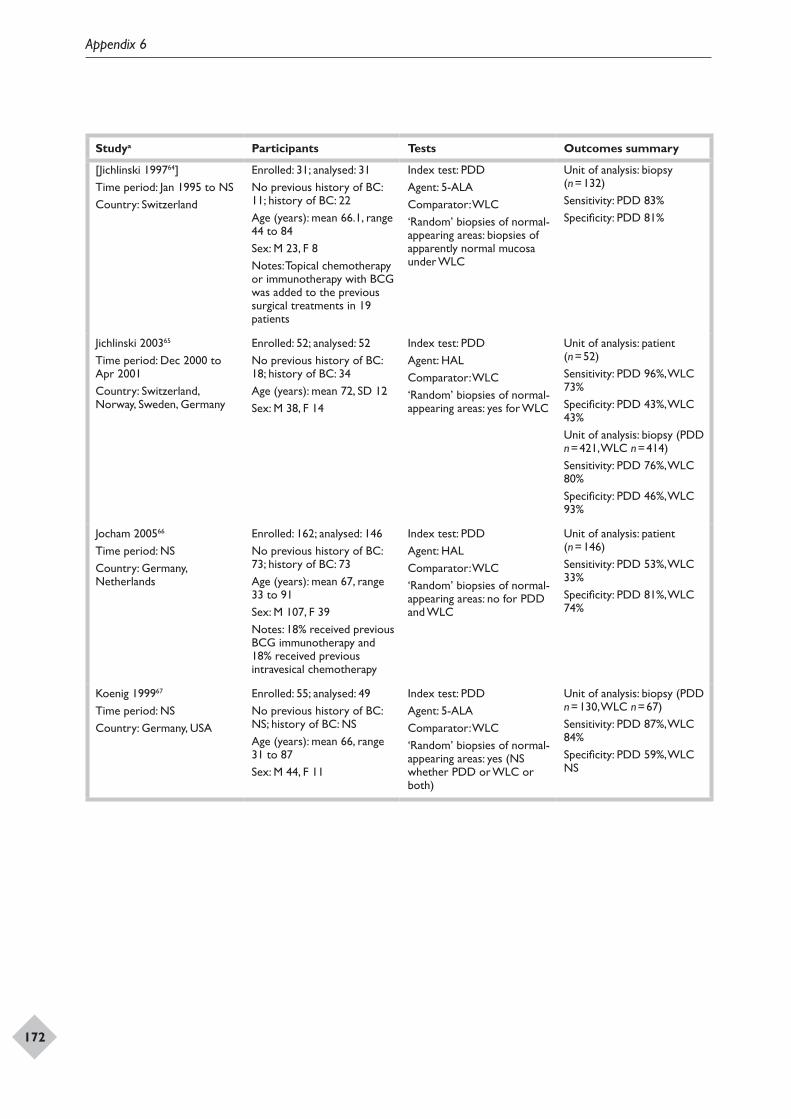
Appendix 6
172
Studya Participants Tests Outcomes summary
[Jichlinski 199764]Time period: Jan 1995 to NSCountry: Switzerland
Enrolled: 31; analysed: 31No previous history of BC: 11; history of BC: 22Age (years): mean 66.1, range 44 to 84Sex: M 23, F 8 Notes: Topical chemotherapy or immunotherapy with BCG was added to the previous surgical treatments in 19 patients
Index test: PDDAgent: 5-ALAComparator: WLC‘Random’ biopsies of normal-appearing areas: biopsies of apparently normal mucosa under WLC
Unit of analysis: biopsy (n = 132)Sensitivity: PDD 83%Specificity: PDD 81%
Jichlinski 200365
Time period: Dec 2000 to Apr 2001Country: Switzerland, Norway, Sweden, Germany
Enrolled: 52; analysed: 52No previous history of BC: 18; history of BC: 34Age (years): mean 72, SD 12Sex: M 38, F 14
Index test: PDDAgent: HALComparator: WLC ‘Random’ biopsies of normal-appearing areas: yes for WLC
Unit of analysis: patient (n = 52)Sensitivity: PDD 96%, WLC 73%Specificity: PDD 43%, WLC 43%Unit of analysis: biopsy (PDD n = 421, WLC n = 414)Sensitivity: PDD 76%, WLC 80%Specificity: PDD 46%, WLC 93%
Jocham 200566
Time period: NSCountry: Germany, Netherlands
Enrolled: 162; analysed: 146No previous history of BC: 73; history of BC: 73Age (years): mean 67, range 33 to 91Sex: M 107, F 39 Notes: 18% received previous BCG immunotherapy and 18% received previous intravesical chemotherapy
Index test: PDDAgent: HALComparator: WLC ‘Random’ biopsies of normal-appearing areas: no for PDD and WLC
Unit of analysis: patient (n = 146)Sensitivity: PDD 53%, WLC 33%Specificity: PDD 81%, WLC 74%
Koenig 199967
Time period: NS Country: Germany, USA
Enrolled: 55; analysed: 49No previous history of BC: NS; history of BC: NSAge (years): mean 66, range 31 to 87Sex: M 44, F 11
Index test: PDDAgent: 5-ALAComparator: WLC‘Random’ biopsies of normal-appearing areas: yes (NS whether PDD or WLC or both)
Unit of analysis: biopsy (PDD n = 130, WLC n = 67)Sensitivity: PDD 87%, WLC 84%Specificity: PDD 59%, WLC NS
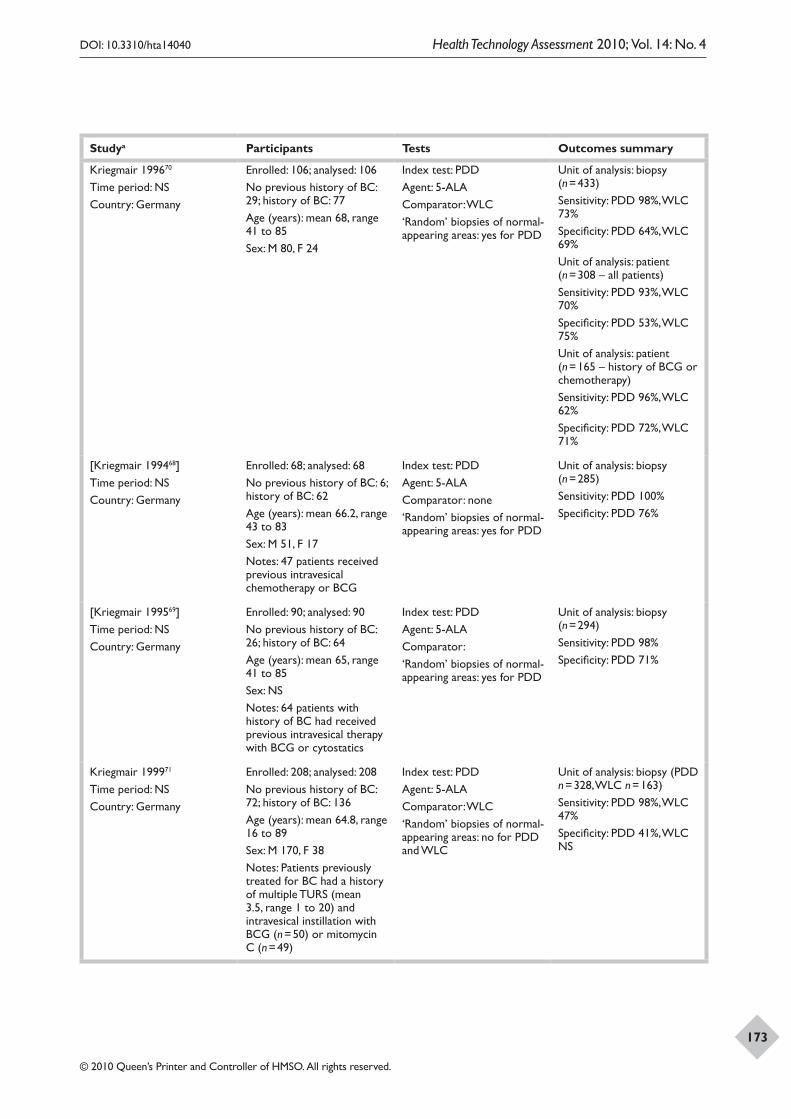
DOI: 10.3310/hta14040 Health Technology Assessment 2010; Vol. 14: No. 4
© 2010 Queen’s Printer and Controller of HMSO. All rights reserved.
173
Studya Participants Tests Outcomes summary
Kriegmair 199670
Time period: NSCountry: Germany
Enrolled: 106; analysed: 106No previous history of BC: 29; history of BC: 77Age (years): mean 68, range 41 to 85Sex: M 80, F 24
Index test: PDDAgent: 5-ALAComparator: WLC‘Random’ biopsies of normal-appearing areas: yes for PDD
Unit of analysis: biopsy (n = 433)Sensitivity: PDD 98%, WLC 73%Specificity: PDD 64%, WLC 69%Unit of analysis: patient (n = 308 – all patients)Sensitivity: PDD 93%, WLC 70%Specificity: PDD 53%, WLC 75%Unit of analysis: patient (n = 165 – history of BCG or chemotherapy)Sensitivity: PDD 96%, WLC 62%Specificity: PDD 72%, WLC 71%
[Kriegmair 199468]Time period: NSCountry: Germany
Enrolled: 68; analysed: 68No previous history of BC: 6; history of BC: 62Age (years): mean 66.2, range 43 to 83Sex: M 51, F 17Notes: 47 patients received previous intravesical chemotherapy or BCG
Index test: PDDAgent: 5-ALAComparator: none‘Random’ biopsies of normal-appearing areas: yes for PDD
Unit of analysis: biopsy (n = 285)Sensitivity: PDD 100%Specificity: PDD 76%
[Kriegmair 199569]Time period: NSCountry: Germany
Enrolled: 90; analysed: 90No previous history of BC: 26; history of BC: 64Age (years): mean 65, range 41 to 85Sex: NS Notes: 64 patients with history of BC had received previous intravesical therapy with BCG or cytostatics
Index test: PDDAgent: 5-ALAComparator: ‘Random’ biopsies of normal-appearing areas: yes for PDD
Unit of analysis: biopsy (n = 294)Sensitivity: PDD 98%Specificity: PDD 71%
Kriegmair 199971
Time period: NSCountry: Germany
Enrolled: 208; analysed: 208No previous history of BC: 72; history of BC: 136Age (years): mean 64.8, range 16 to 89Sex: M 170, F 38 Notes: Patients previously treated for BC had a history of multiple TURS (mean 3.5, range 1 to 20) and intravesical instillation with BCG (n = 50) or mitomycin C (n = 49)
Index test: PDDAgent: 5-ALAComparator: WLC‘Random’ biopsies of normal-appearing areas: no for PDD and WLC
Unit of analysis: biopsy (PDD n = 328, WLC n = 163)Sensitivity: PDD 98%, WLC 47%Specificity: PDD 41%, WLC NS
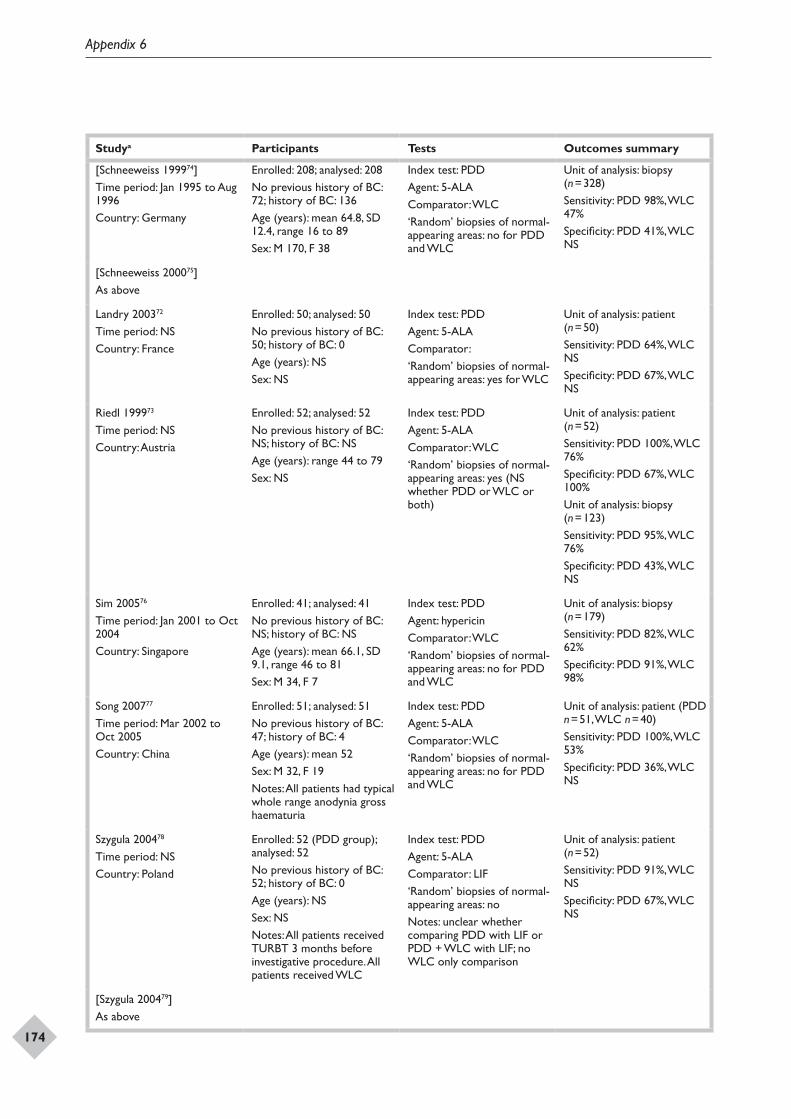
Appendix 6
174
Studya Participants Tests Outcomes summary
[Schneeweiss 199974]Time period: Jan 1995 to Aug 1996Country: Germany
Enrolled: 208; analysed: 208No previous history of BC: 72; history of BC: 136Age (years): mean 64.8, SD 12.4, range 16 to 89Sex: M 170, F 38
Index test: PDDAgent: 5-ALAComparator: WLC‘Random’ biopsies of normal-appearing areas: no for PDD and WLC
Unit of analysis: biopsy (n = 328)Sensitivity: PDD 98%, WLC 47%Specificity: PDD 41%, WLC NS
[Schneeweiss 200075]As above
Landry 200372
Time period: NSCountry: France
Enrolled: 50; analysed: 50No previous history of BC: 50; history of BC: 0Age (years): NSSex: NS
Index test: PDDAgent: 5-ALAComparator: ‘Random’ biopsies of normal-appearing areas: yes for WLC
Unit of analysis: patient (n = 50)Sensitivity: PDD 64%, WLC NSSpecificity: PDD 67%, WLC NS
Riedl 199973
Time period: NSCountry: Austria
Enrolled: 52; analysed: 52No previous history of BC: NS; history of BC: NSAge (years): range 44 to 79Sex: NS
Index test: PDDAgent: 5-ALAComparator: WLC‘Random’ biopsies of normal-appearing areas: yes (NS whether PDD or WLC or both)
Unit of analysis: patient (n = 52)Sensitivity: PDD 100%, WLC 76%Specificity: PDD 67%, WLC 100% Unit of analysis: biopsy (n = 123)Sensitivity: PDD 95%, WLC 76%Specificity: PDD 43%, WLC NS
Sim 200576
Time period: Jan 2001 to Oct 2004Country: Singapore
Enrolled: 41; analysed: 41No previous history of BC: NS; history of BC: NSAge (years): mean 66.1, SD 9.1, range 46 to 81Sex: M 34, F 7
Index test: PDDAgent: hypericinComparator: WLC‘Random’ biopsies of normal-appearing areas: no for PDD and WLC
Unit of analysis: biopsy (n = 179)Sensitivity: PDD 82%, WLC 62%Specificity: PDD 91%, WLC 98%
Song 200777
Time period: Mar 2002 to Oct 2005Country: China
Enrolled: 51; analysed: 51No previous history of BC: 47; history of BC: 4Age (years): mean 52Sex: M 32, F 19 Notes: All patients had typical whole range anodynia gross haematuria
Index test: PDDAgent: 5-ALAComparator: WLC‘Random’ biopsies of normal-appearing areas: no for PDD and WLC
Unit of analysis: patient (PDD n = 51, WLC n = 40)Sensitivity: PDD 100%, WLC 53%Specificity: PDD 36%, WLC NS
Szygula 200478
Time period: NSCountry: Poland
Enrolled: 52 (PDD group); analysed: 52No previous history of BC: 52; history of BC: 0Age (years): NSSex: NSNotes: All patients received TURBT 3 months before investigative procedure. All patients received WLC
Index test: PDDAgent: 5-ALAComparator: LIF‘Random’ biopsies of normal-appearing areas: noNotes: unclear whether comparing PDD with LIF or PDD + WLC with LIF; no WLC only comparison
Unit of analysis: patient (n = 52)Sensitivity: PDD 91%, WLC NSSpecificity: PDD 67%, WLC NS
[Szygula 200479]As above
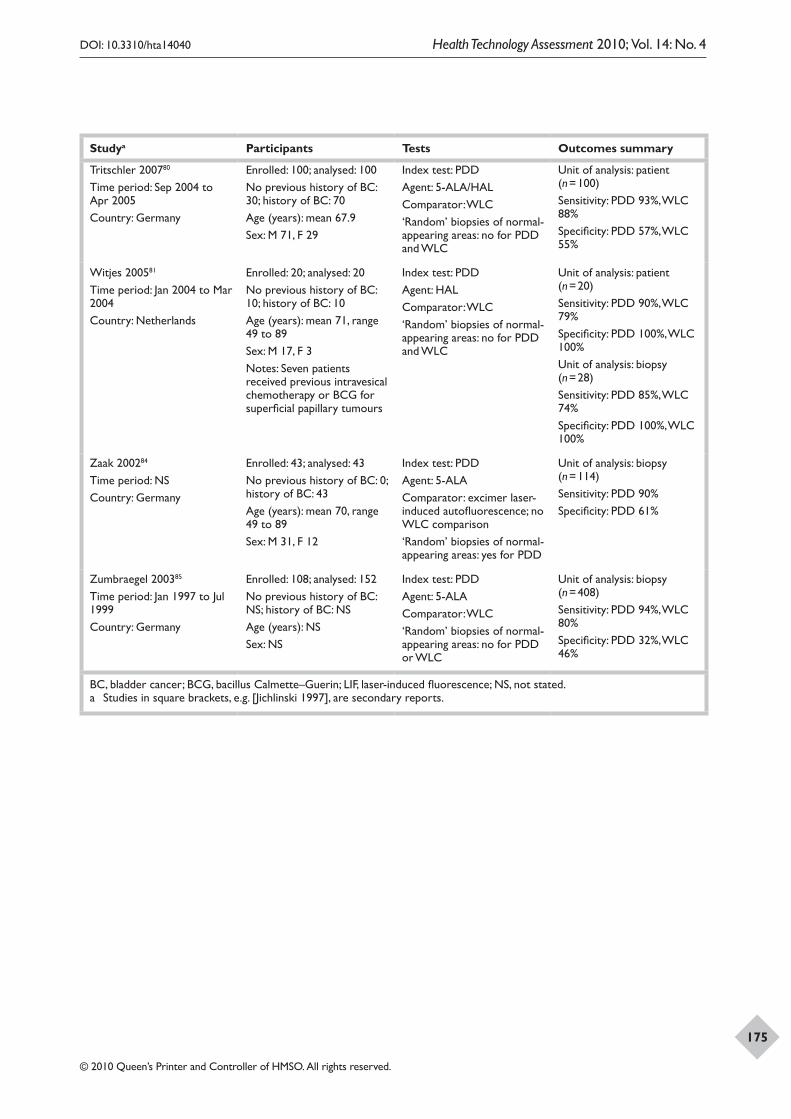
DOI: 10.3310/hta14040 Health Technology Assessment 2010; Vol. 14: No. 4
© 2010 Queen’s Printer and Controller of HMSO. All rights reserved.
175
Studya Participants Tests Outcomes summary
Tritschler 200780
Time period: Sep 2004 to Apr 2005Country: Germany
Enrolled: 100; analysed: 100No previous history of BC: 30; history of BC: 70Age (years): mean 67.9Sex: M 71, F 29
Index test: PDDAgent: 5-ALA/HALComparator: WLC‘Random’ biopsies of normal-appearing areas: no for PDD and WLC
Unit of analysis: patient (n = 100)Sensitivity: PDD 93%, WLC 88%Specificity: PDD 57%, WLC 55%
Witjes 200581
Time period: Jan 2004 to Mar 2004Country: Netherlands
Enrolled: 20; analysed: 20No previous history of BC: 10; history of BC: 10Age (years): mean 71, range 49 to 89Sex: M 17, F 3Notes: Seven patients received previous intravesical chemotherapy or BCG for superficial papillary tumours
Index test: PDDAgent: HALComparator: WLC ‘Random’ biopsies of normal-appearing areas: no for PDD and WLC
Unit of analysis: patient (n = 20)Sensitivity: PDD 90%, WLC 79%Specificity: PDD 100%, WLC 100%Unit of analysis: biopsy (n = 28)Sensitivity: PDD 85%, WLC 74%Specificity: PDD 100%, WLC 100%
Zaak 200284
Time period: NSCountry: Germany
Enrolled: 43; analysed: 43No previous history of BC: 0; history of BC: 43Age (years): mean 70, range 49 to 89Sex: M 31, F 12
Index test: PDDAgent: 5-ALAComparator: excimer laser-induced autofluorescence; no WLC comparison‘Random’ biopsies of normal-appearing areas: yes for PDD
Unit of analysis: biopsy (n = 114)Sensitivity: PDD 90%Specificity: PDD 61%
Zumbraegel 200385
Time period: Jan 1997 to Jul 1999Country: Germany
Enrolled: 108; analysed: 152No previous history of BC: NS; history of BC: NSAge (years): NSSex: NS
Index test: PDDAgent: 5-ALAComparator: WLC‘Random’ biopsies of normal-appearing areas: no for PDD or WLC
Unit of analysis: biopsy (n = 408)Sensitivity: PDD 94%, WLC 80%Specificity: PDD 32%, WLC 46%
BC, bladder cancer; BCG, bacillus Calmette–Guerin; LIF, laser-induced fluorescence; NS, not stated.a Studies in square brackets, e.g. [Jichlinski 1997], are secondary reports.


DOI: 10.3310/hta14040 Health Technology Assessment 2010; Vol. 14: No. 4
© 2010 Queen’s Printer and Controller of HMSO. All rights reserved.
177
Appendix 7 Quality assessment results for
the individual PDD studies
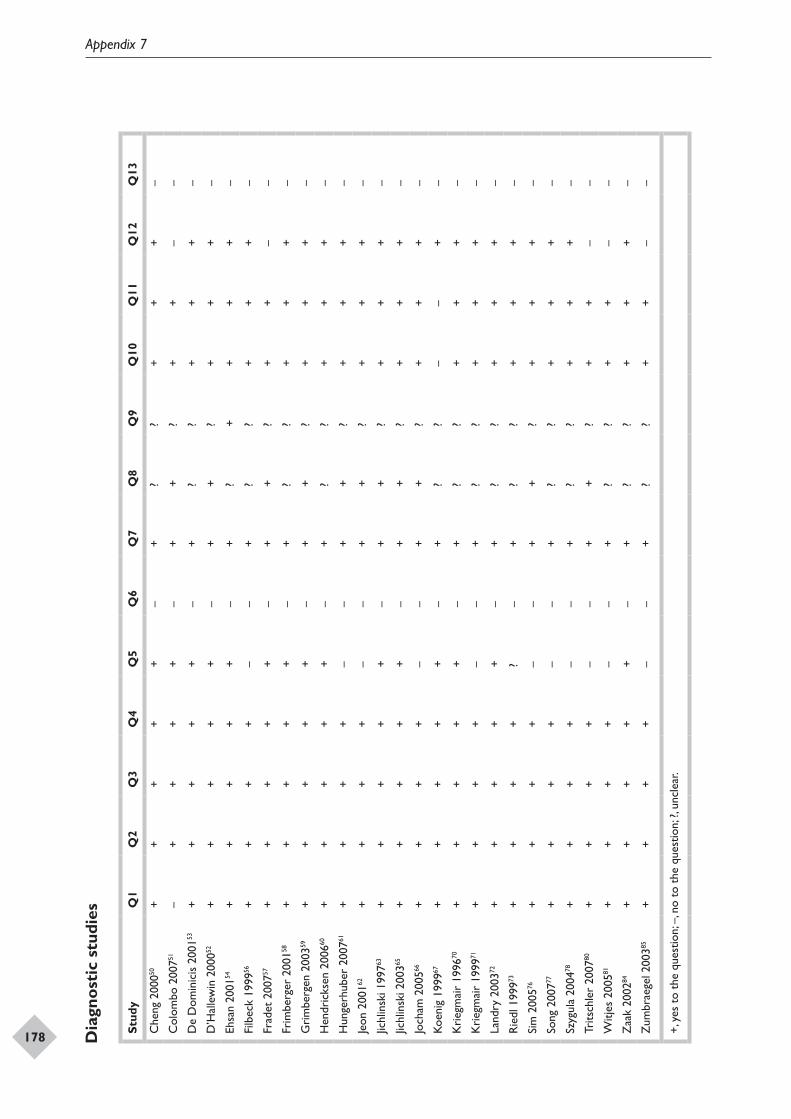
Appendix 7
178
DOI: 10.3310/hta14040 Health Technology Assessment 2010; Vol. 14: No. 4
© 2010 Queen’s Printer and Controller of HMSO. All rights reserved.
179Dia
gnos
tic
stud
ies
Stud
yQ
1Q
2Q
3Q
4Q
5Q
6Q
7Q
8Q
9Q
10Q
11Q
12Q
13
Che
ng 2
00050
++
++
+–
+?
?+
++
–
Col
ombo
200
751–
++
++
–+
+?
++
––
De
Dom
inic
is 2
00153
++
++
+–
+?
?+
++
–
D’H
alle
win
200
052+
++
++
–+
+?
++
+–
Ehsa
n 20
0154
++
++
+–
+?
++
++
–
Filb
eck
1999
56+
++
+–
–+
??
++
+–
Frad
et 2
00757
++
++
+–
++
?+
+–
–
Frim
berg
er 2
00158
++
++
+–
+?
?+
++
–
Gri
mbe
rgen
200
359+
++
++
–+
+?
++
+–
Hen
dric
ksen
200
660+
++
++
–+
??
++
+–
Hun
gerh
uber
200
761+
++
+–
–+
+?
++
+–
Jeon
200
162+
++
+–
–+
+?
++
+–
Jichl
insk
i 199
763+
++
++
–+
+?
++
+–
Jichl
insk
i 200
365+
++
++
–+
+?
++
+–
Joch
am 2
00566
++
++
––
++
?+
++
–
Koen
ig 1
99967
++
++
+–
+?
?–
–+
–
Kri
egm
air
1996
70+
++
++
–+
??
++
+–
Kri
egm
air
1999
71+
++
+–
–+
??
++
+–
Land
ry 2
00372
++
++
+–
+?
?+
++
–
Rie
dl 1
99973
++
++
?–
+?
?+
++
–
Sim
200
576+
++
+–
–+
+?
++
+–
Song
200
777+
++
+–
–+
??
++
+–
Szyg
ula
2004
78+
++
+–
–+
??
++
+–
Trits
chle
r 20
0780
++
++
––
++
?+
+–
–
Witj
es 2
00581
++
++
––
+?
?+
+–
–
Zaa
k 20
0284
++
++
+–
+?
?+
++
–
Zum
brae
gel 2
00385
++
++
––
+?
?+
+–
–
+, y
es t
o th
e qu
estio
n; –
, no
to t
he q
uest
ion;
?, u
ncle
ar.
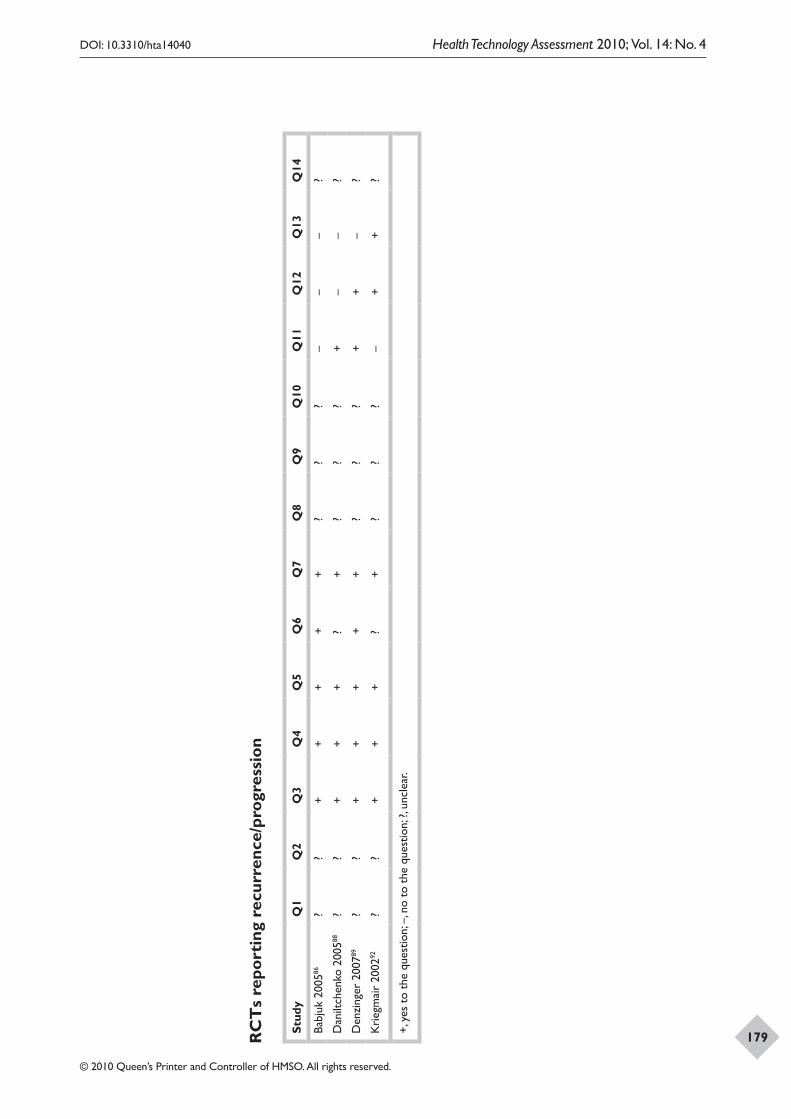
Appendix 7
178
DOI: 10.3310/hta14040 Health Technology Assessment 2010; Vol. 14: No. 4
© 2010 Queen’s Printer and Controller of HMSO. All rights reserved.
179RC
Ts
repo
rtin
g re
curr
ence
/pro
gres
sion
Stud
yQ
1Q
2Q
3Q
4Q
5Q
6Q
7Q
8Q
9Q
10Q
11Q
12Q
13Q
14
Babj
uk 2
00586
??
++
++
+?
??
––
–?
Dan
iltch
enko
200
588?
?+
++
?+
??
?+
––
?
Den
zing
er 2
00789
??
++
++
+?
??
++
–?
Kri
egm
air
2002
92?
?+
++
?+
??
?–
++
?
+, y
es t
o th
e qu
estio
n; –
, no
to t
he q
uest
ion;
?, u
ncle
ar.

DOI: 10.3310/hta14040 Health Technology Assessment 2010; Vol. 14: No. 4
© 2010 Queen’s Printer and Controller of HMSO. All rights reserved.
181
Appendix 8 Studies of PDD versus WLC included in
pooled estimates for patient- and biopsy-level analysis and also those reporting stage/grade
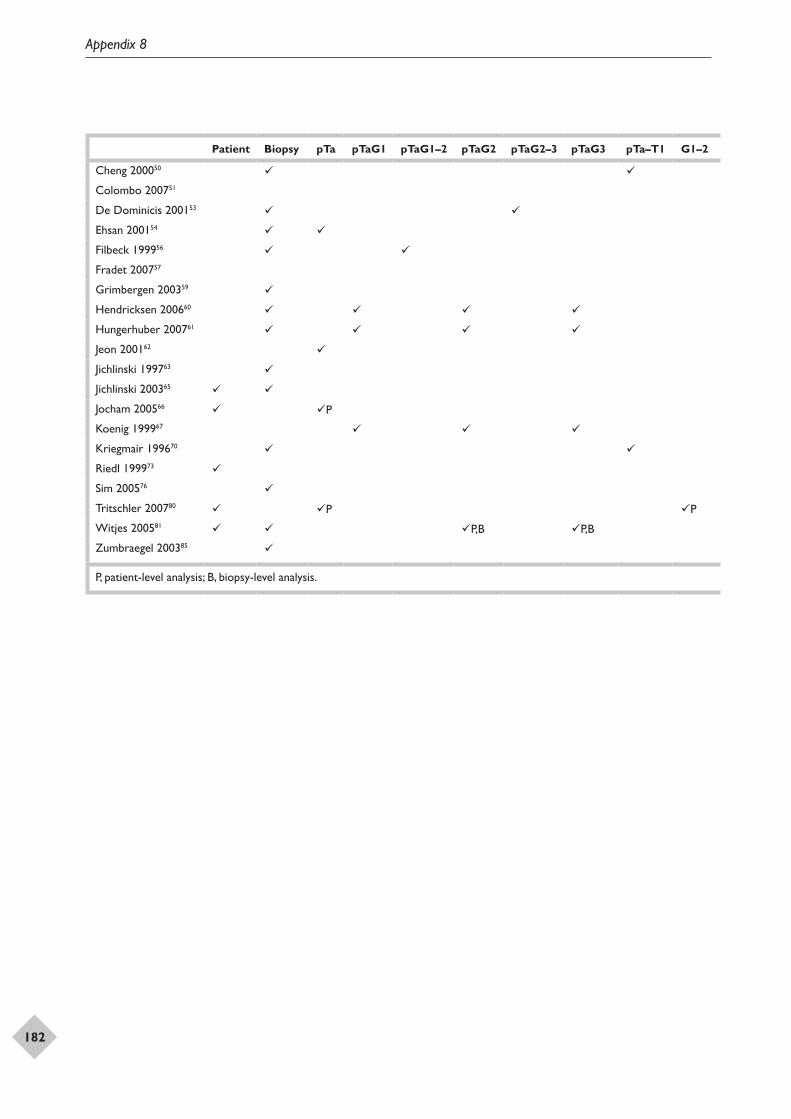
Appendix 8
182
Patient Biopsy pTa pTaG1 pTaG1–2 pTaG2 pTaG2–3 pTaG3 pTa–T1 G1–2 pT1 pT1G1 pT1G1–2 pT1G2 pT1G3 > pT1 CIS G3 pT2G2 pT2G3 ≥ pT2 ≥ pT2G3 pT4G3
Cheng 200050
Colombo 200751 P
De Dominicis 200153
Ehsan 200154
Filbeck 199956
Fradet 200757 P,B
Grimbergen 200359
Hendricksen 200660
Hungerhuber 200761
Jeon 200162
Jichlinski 199763
Jichlinski 200365 P,B
Jocham 200566 P P P P
Koenig 199967
Kriegmair 199670
Riedl 199973
Sim 200576
Tritschler 200780 P P P P P P
Witjes 200581 P,B P,B P,B P,B P,B
Zumbraegel 200385
P, patient-level analysis; B, biopsy-level analysis.
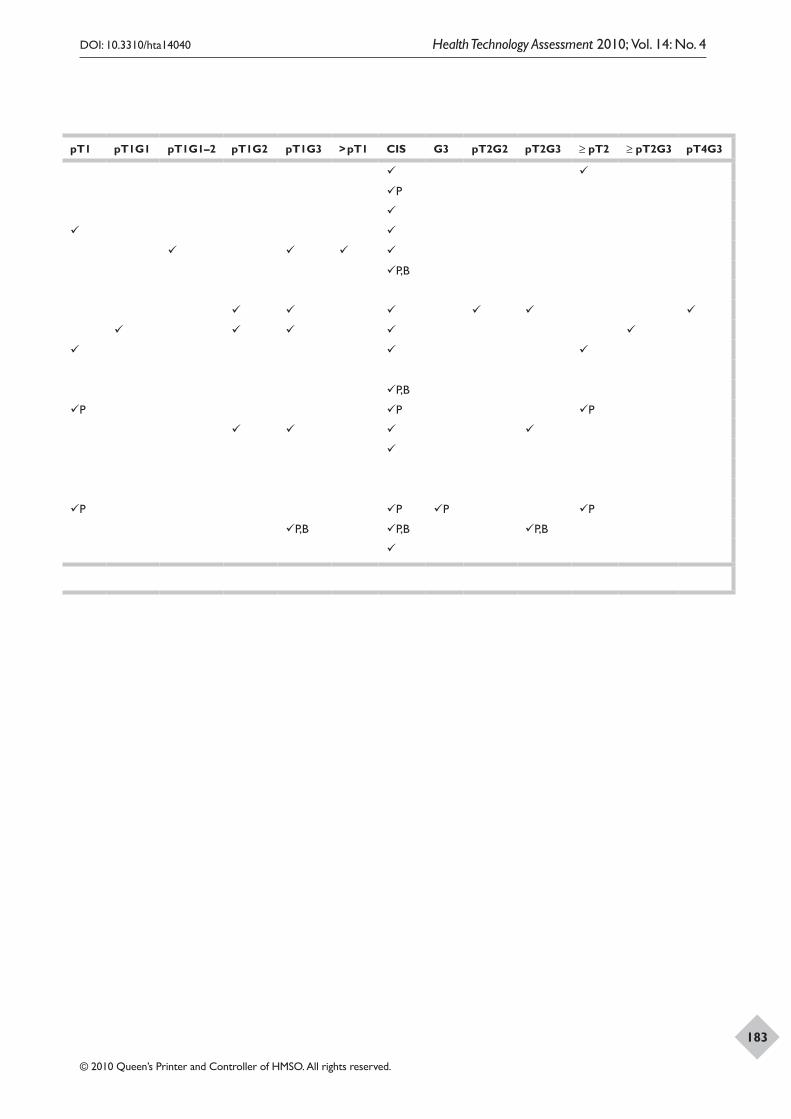
DOI: 10.3310/hta14040 Health Technology Assessment 2010; Vol. 14: No. 4
© 2010 Queen’s Printer and Controller of HMSO. All rights reserved.
183
Patient Biopsy pTa pTaG1 pTaG1–2 pTaG2 pTaG2–3 pTaG3 pTa–T1 G1–2 pT1 pT1G1 pT1G1–2 pT1G2 pT1G3 > pT1 CIS G3 pT2G2 pT2G3 ≥ pT2 ≥ pT2G3 pT4G3
Cheng 200050
Colombo 200751 P
De Dominicis 200153
Ehsan 200154
Filbeck 199956
Fradet 200757 P,B
Grimbergen 200359
Hendricksen 200660
Hungerhuber 200761
Jeon 200162
Jichlinski 199763
Jichlinski 200365 P,B
Jocham 200566 P P P P
Koenig 199967
Kriegmair 199670
Riedl 199973
Sim 200576
Tritschler 200780 P P P P P P
Witjes 200581 P,B P,B P,B P,B P,B
Zumbraegel 200385
P, patient-level analysis; B, biopsy-level analysis.

DOI: 10.3310/hta14040 Health Technology Assessment 2010; Vol. 14: No. 4
© 2010 Queen’s Printer and Controller of HMSO. All rights reserved.
185
Appendix 9 PDD and WLC test performance for detecting
bladder cancer, results table with 2 × 2 data
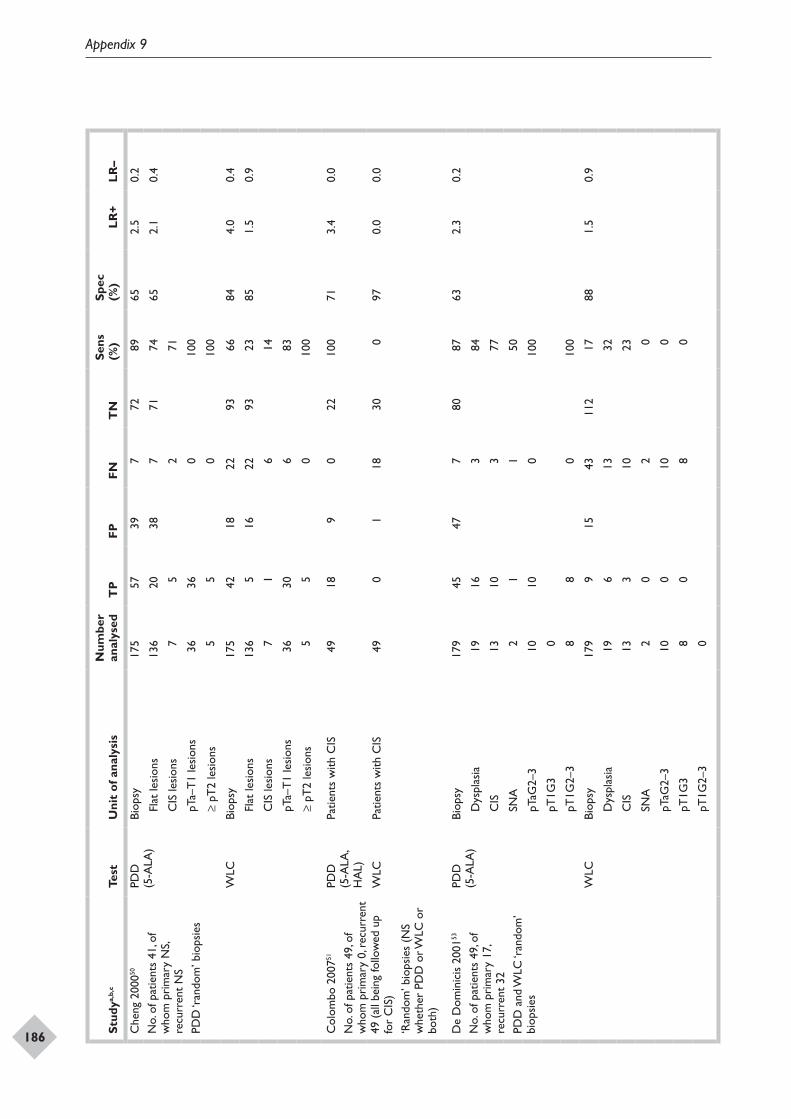
Appendix 9
186 Stud
ya,b,
cTe
stU
nit
of a
naly
sis
Num
ber
anal
ysed
TP
FPFN
TN
Sens
(%
)Sp
ec
(%)
LR+
LR–
Che
ng 2
00050
No.
of p
atie
nts
41, o
f w
hom
pri
mar
y N
S, re
curr
ent
NS
PDD
‘ran
dom
’ bio
psie
s
PDD
(5
-ALA
)Bi
opsy
175
5739
772
8965
2.5
0.2
Fl
at le
sion
s13
620
387
7174
652.
10.
4
C
IS le
sion
s7
52
71
pT
a–T
1 le
sion
s36
360
100
≥
pT2
lesi
ons
55
010
0
WLC
Biop
sy17
542
1822
9366
844.
00.
4
Fl
at le
sion
s13
65
1622
9323
851.
50.
9
C
IS le
sion
s7
16
14
pT
a–T
1 le
sion
s36
306
83
≥
pT2
lesi
ons
55
010
0
Col
ombo
200
751
No.
of p
atie
nts
49, o
f w
hom
pri
mar
y 0,
rec
urre
nt
49 (
all b
eing
follo
wed
up
for
CIS
)‘R
ando
m’ b
iops
ies
(NS
whe
ther
PD
D o
r WLC
or
both
)
PDD
(5
-ALA
, H
AL)
Patie
nts
with
CIS
4918
90
2210
071
3.4
0.0
WLC
Patie
nts
with
CIS
490
118
300
970.
00.
0
De
Dom
inic
is 2
00153
No.
of p
atie
nts
49, o
f w
hom
pri
mar
y 17
, re
curr
ent
32PD
D a
nd W
LC ‘r
ando
m’
biop
sies
PDD
(5
-ALA
)Bi
opsy
179
4547
780
8763
2.3
0.2
D
yspl
asia
1916
384
C
IS13
103
77
SN
A2
11
50
pT
aG2–
310
100
100
pT
1G3
0
pT
1G2–
38
80
100
WLC
Biop
sy17
99
1543
112
1788
1.5
0.9
D
yspl
asia
196
1332
C
IS13
310
23
SN
A2
02
0
pT
aG2–
310
010
0
pT
1G3
80
80
pT
1G2–
30
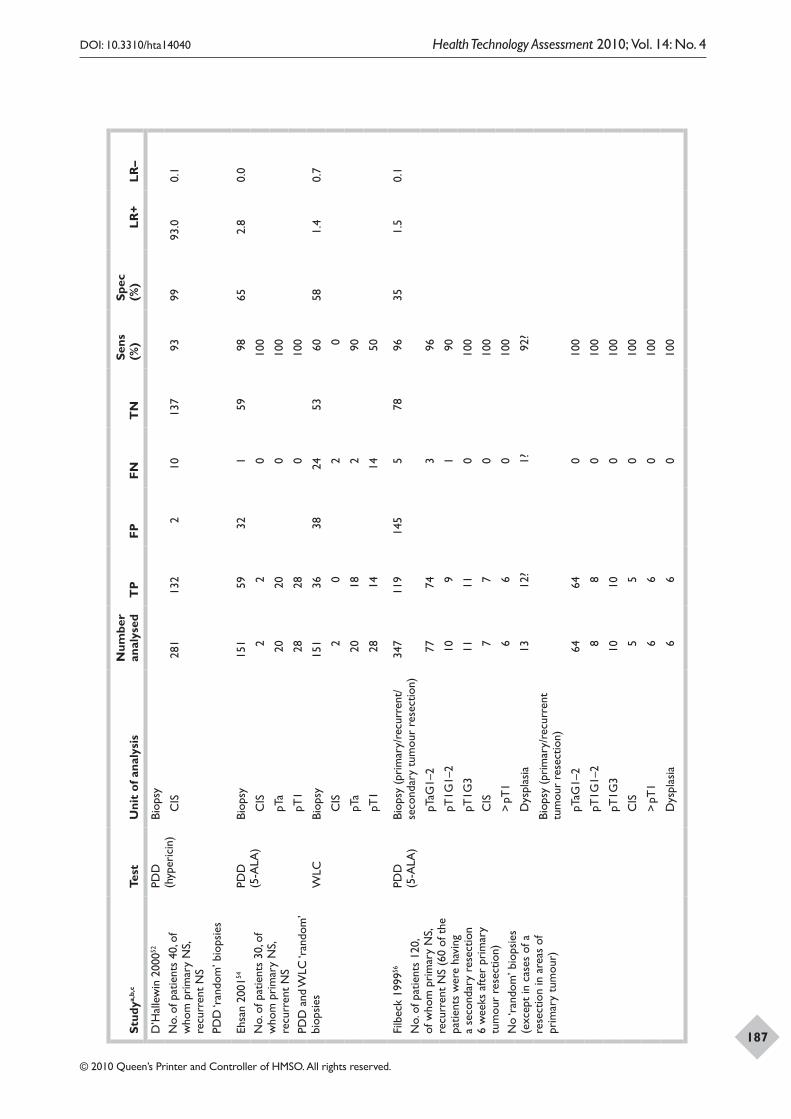
DOI: 10.3310/hta14040 Health Technology Assessment 2010; Vol. 14: No. 4
© 2010 Queen’s Printer and Controller of HMSO. All rights reserved.
187Stud
ya,b,
cTe
stU
nit
of a
naly
sis
Num
ber
anal
ysed
TP
FPFN
TN
Sens
(%
)Sp
ec
(%)
LR+
LR–
D’H
alle
win
200
052
No.
of p
atie
nts
40, o
f w
hom
pri
mar
y N
S, re
curr
ent
NS
PDD
‘ran
dom
’ bio
psie
s
PDD
(h
yper
icin
)Bi
opsy
C
IS28
113
22
1013
793
9993
.00.
1
Ehsa
n 20
0154
No.
of p
atie
nts
30, o
f w
hom
pri
mar
y N
S, re
curr
ent
NS
PDD
and
WLC
‘ran
dom
’ bi
opsi
es
PDD
(5
-ALA
)Bi
opsy
151
5932
159
9865
2.8
0.0
C
IS2
20
100
pT
a20
200
100
pT
128
280
100
WLC
Biop
sy15
136
3824
5360
581.
40.
7
C
IS2
02
0
pT
a20
182
90
pT
128
1414
50
Filb
eck
1999
56
No.
of p
atie
nts
120,
of
who
m p
rim
ary
NS,
recu
rren
t N
S (6
0 of
the
pa
tient
s w
ere
havi
ng
a se
cond
ary
rese
ctio
n 6
wee
ks a
fter
prim
ary
tum
our
rese
ctio
n)N
o ‘r
ando
m’ b
iops
ies
(exc
ept
in c
ases
of a
re
sect
ion
in a
reas
of
prim
ary
tum
our)
PDD
(5
-ALA
)Bi
opsy
(pr
imar
y/re
curr
ent/
seco
ndar
y tu
mou
r re
sect
ion)
347
119
145
578
9635
1.5
0.1
pT
aG1–
277
743
96
pT
1G1–
210
91
90
pT
1G3
1111
010
0
C
IS7
70
100
>
pT1
66
010
0
D
yspl
asia
1312
?1?
92?
Biop
sy (
prim
ary/
recu
rren
t tu
mou
r re
sect
ion)
pT
aG1–
264
640
100
pT
1G1–
28
80
100
pT
1G3
1010
010
0
C
IS5
50
100
>
pT1
66
010
0
D
yspl
asia
66
010
0
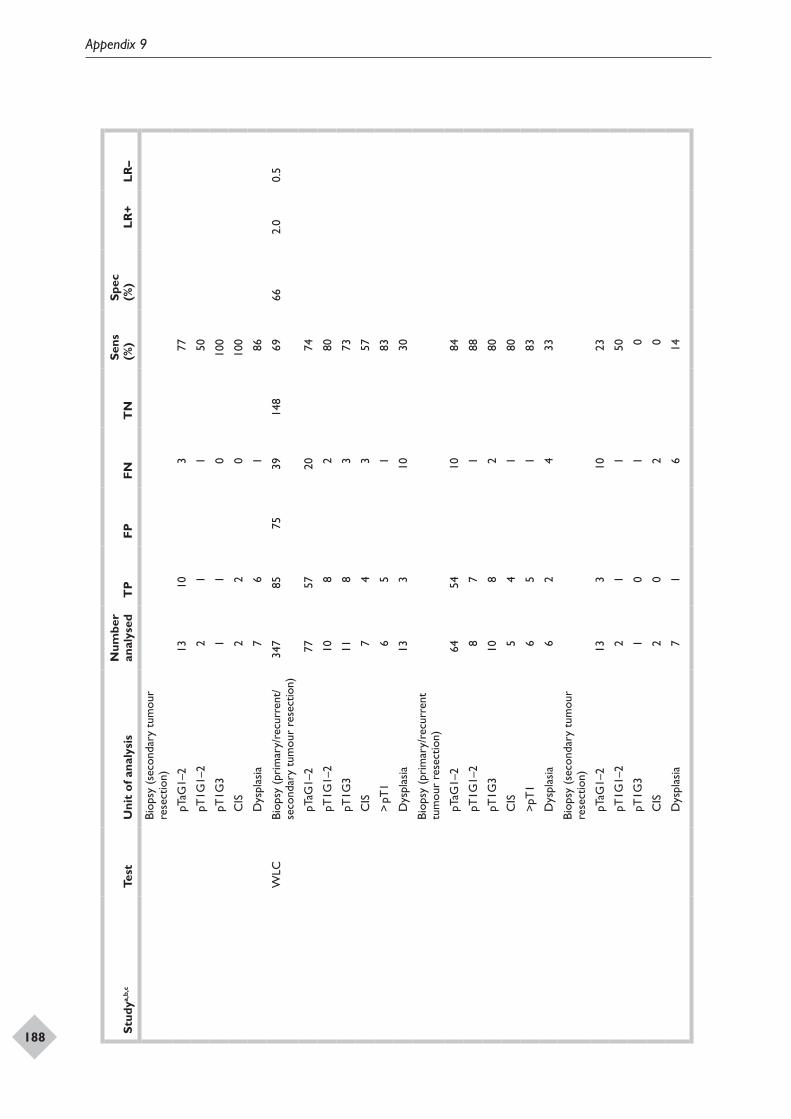
Appendix 9
188 Stud
ya,b,
cTe
stU
nit
of a
naly
sis
Num
ber
anal
ysed
TP
FPFN
TN
Sens
(%
)Sp
ec
(%)
LR+
LR–
Biop
sy (
seco
ndar
y tu
mou
r re
sect
ion)
pT
aG1–
213
103
77
pT
1G1–
22
11
50
pT
1G3
11
010
0
C
IS2
20
100
D
yspl
asia
76
186
WLC
Biop
sy (
prim
ary/
recu
rren
t/se
cond
ary
tum
our
rese
ctio
n)34
785
7539
148
6966
2.0
0.5
pT
aG1–
277
5720
74
pT
1G1–
210
82
80
pT
1G3
118
373
C
IS7
43
57
>
pT1
65
183
D
yspl
asia
133
1030
Biop
sy (
prim
ary/
recu
rren
t tu
mou
r re
sect
ion)
pT
aG1–
264
5410
84
pT
1G1–
28
71
88
pT
1G3
108
280
C
IS5
41
80
>p
T1
65
183
D
yspl
asia
62
433
Biop
sy (
seco
ndar
y tu
mou
r re
sect
ion)
pT
aG1–
213
310
23
pT
1G1–
22
11
50
pT
1G3
10
10
C
IS2
02
0
D
yspl
asia
71
614
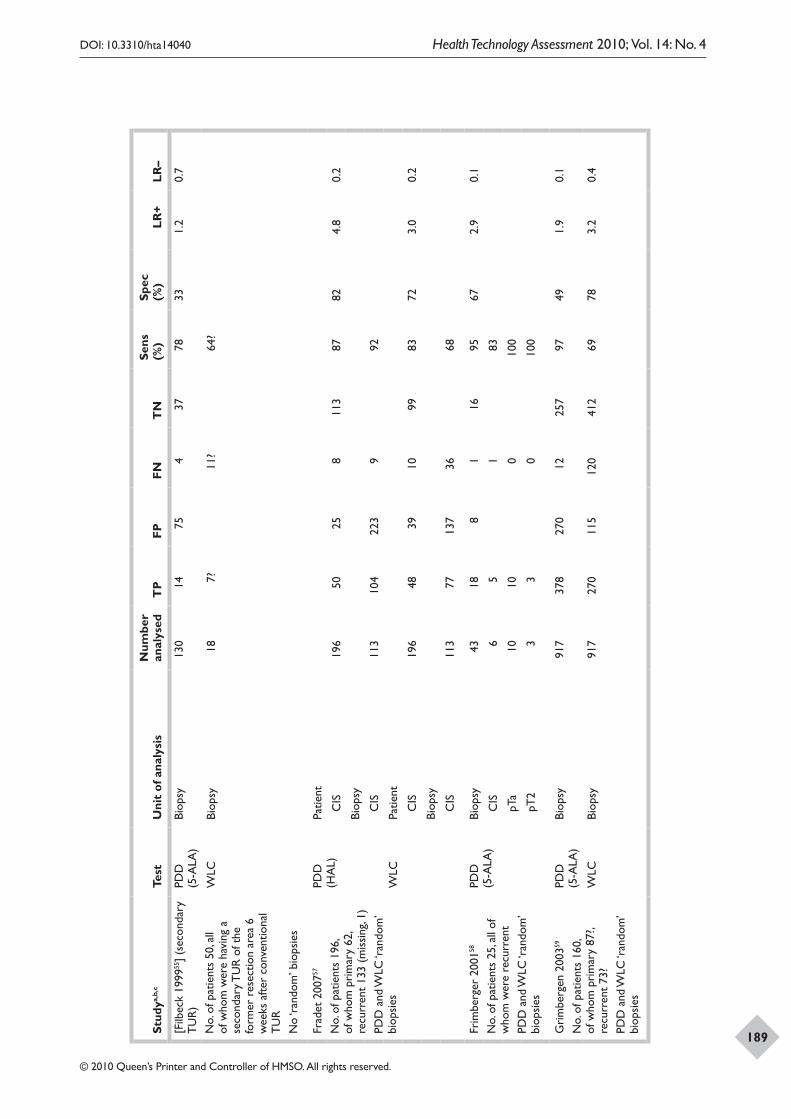
DOI: 10.3310/hta14040 Health Technology Assessment 2010; Vol. 14: No. 4
© 2010 Queen’s Printer and Controller of HMSO. All rights reserved.
189Stud
ya,b,
cTe
stU
nit
of a
naly
sis
Num
ber
anal
ysed
TP
FPFN
TN
Sens
(%
)Sp
ec
(%)
LR+
LR–
[Filb
eck
1999
55] (
seco
ndar
y T
UR
)N
o. o
f pat
ient
s 50
, all
of w
hom
wer
e ha
ving
a
seco
ndar
y TU
R o
f the
fo
rmer
res
ectio
n ar
ea 6
w
eeks
afte
r co
nven
tiona
l T
UR
No
‘ran
dom
’ bio
psie
s
PDD
(5
-ALA
)Bi
opsy
130
1475
437
7833
1.2
0.7
WLC
Biop
sy18
7?11
?64
?
Frad
et 2
00757
No.
of p
atie
nts
196,
of
who
m p
rim
ary
62,
recu
rren
t 13
3 (m
issi
ng, 1
)PD
D a
nd W
LC ‘r
ando
m’
biop
sies
PDD
(H
AL)
Patie
nt
C
IS
196
5025
811
387
824.
80.
2
Biop
sy
C
IS
113
104
223
992
WLC
Patie
nt
C
IS
196
4839
1099
8372
3.0
0.2
Biop
sy
C
IS
113
7713
736
68
Frim
berg
er 2
00158
No.
of p
atie
nts
25, a
ll of
w
hom
wer
e re
curr
ent
PDD
and
WLC
‘ran
dom
’ bi
opsi
es
PDD
(5
-ALA
)Bi
opsy
4318
81
1695
672.
90.
1
C
IS6
51
83
pT
a10
100
100
pT
23
30
100
Gri
mbe
rgen
200
359
No.
of p
atie
nts
160,
of
who
m p
rim
ary
87?,
recu
rren
t 73
? PD
D a
nd W
LC ‘r
ando
m’
biop
sies
PDD
(5
-ALA
)Bi
opsy
917
378
270
1225
797
491.
90.
1
WLC
Biop
sy91
727
011
512
041
269
783.
20.
4
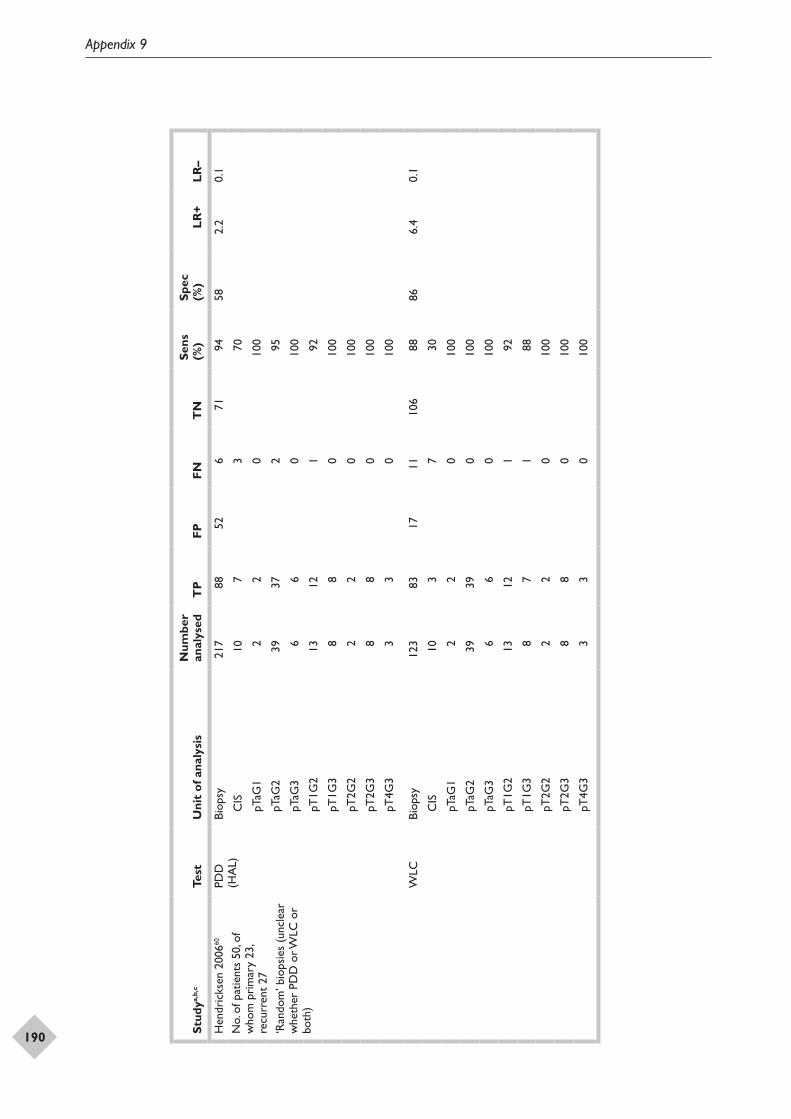
Appendix 9
190 Stud
ya,b,
cTe
stU
nit
of a
naly
sis
Num
ber
anal
ysed
TP
FPFN
TN
Sens
(%
)Sp
ec
(%)
LR+
LR–
Hen
dric
ksen
200
660
No.
of p
atie
nts
50, o
f w
hom
pri
mar
y 23
, re
curr
ent
27
‘Ran
dom
’ bio
psie
s (u
ncle
ar
whe
ther
PD
D o
r WLC
or
both
)
PDD
(H
AL)
Biop
sy21
788
526
7194
582.
20.
1
C
IS10
73
70
pT
aG1
22
010
0
pT
aG2
3937
295
pT
aG3
66
010
0
pT
1G2
1312
192
pT
1G3
88
010
0
pT
2G2
22
010
0
pT
2G3
88
010
0
pT
4G3
33
010
0
WLC
Biop
sy12
383
1711
106
8886
6.4
0.1
C
IS10
37
30
pT
aG1
22
010
0
pT
aG2
3939
010
0
pT
aG3
66
010
0
pT
1G2
1312
192
pT
1G3
87
188
pT
2G2
22
010
0
pT
2G3
88
010
0
pT
4G3
33
010
0
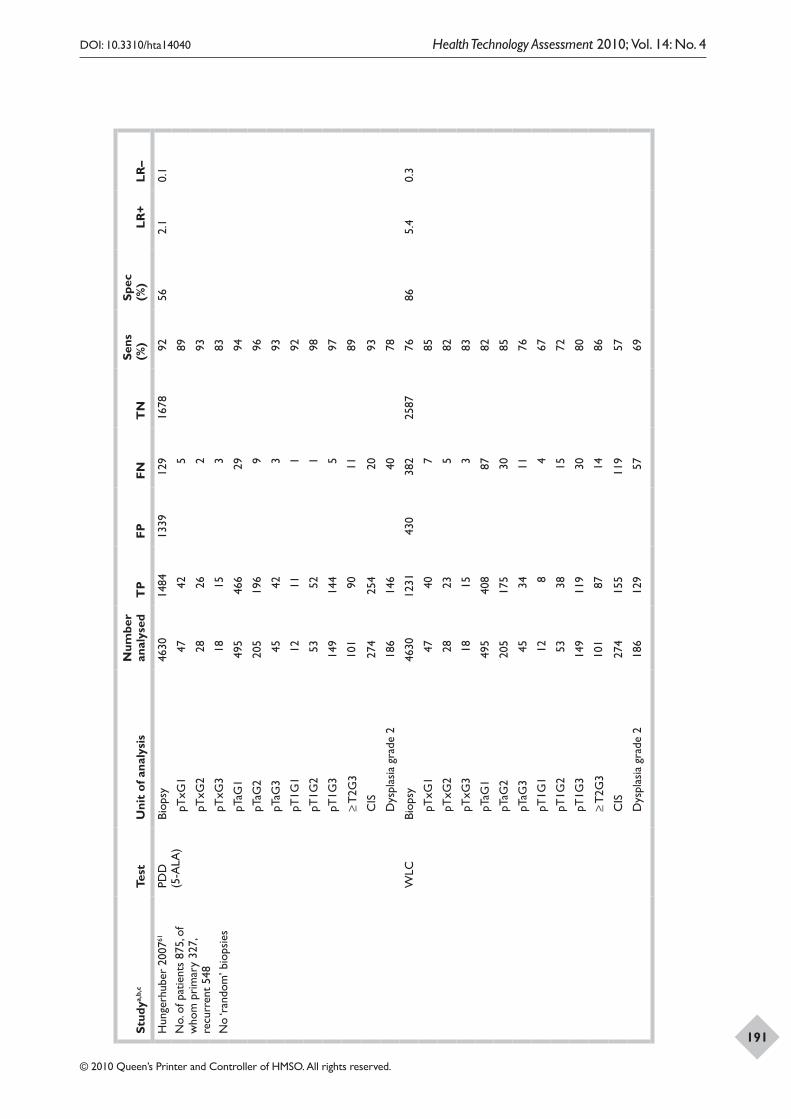
DOI: 10.3310/hta14040 Health Technology Assessment 2010; Vol. 14: No. 4
© 2010 Queen’s Printer and Controller of HMSO. All rights reserved.
191Stud
ya,b,
cTe
stU
nit
of a
naly
sis
Num
ber
anal
ysed
TP
FPFN
TN
Sens
(%
)Sp
ec
(%)
LR+
LR–
Hun
gerh
uber
200
761
No.
of p
atie
nts
875,
of
who
m p
rim
ary
327,
re
curr
ent
548
No
‘ran
dom
’ bio
psie
s
PDD
(5
-ALA
)Bi
opsy
4630
1484
1339
129
1678
9256
2.1
0.1
pT
xG1
4742
589
pT
xG2
2826
293
pT
xG3
1815
383
pT
aG1
495
466
2994
pT
aG2
205
196
996
pT
aG3
4542
393
pT
1G1
1211
192
pT
1G2
5352
198
pT
1G3
149
144
597
≥
T2G
310
190
1189
C
IS27
425
420
93
D
yspl
asia
gra
de 2
186
146
4078
WLC
Biop
sy46
3012
3143
038
225
8776
865.
40.
3
pT
xG1
4740
785
pT
xG2
2823
582
pT
xG3
1815
383
pT
aG1
495
408
8782
pT
aG2
205
175
3085
pT
aG3
4534
1176
pT
1G1
128
467
pT
1G2
5338
1572
pT
1G3
149
119
3080
≥
T2G
310
187
1486
C
IS27
415
511
957
D
yspl
asia
gra
de 2
186
129
5769
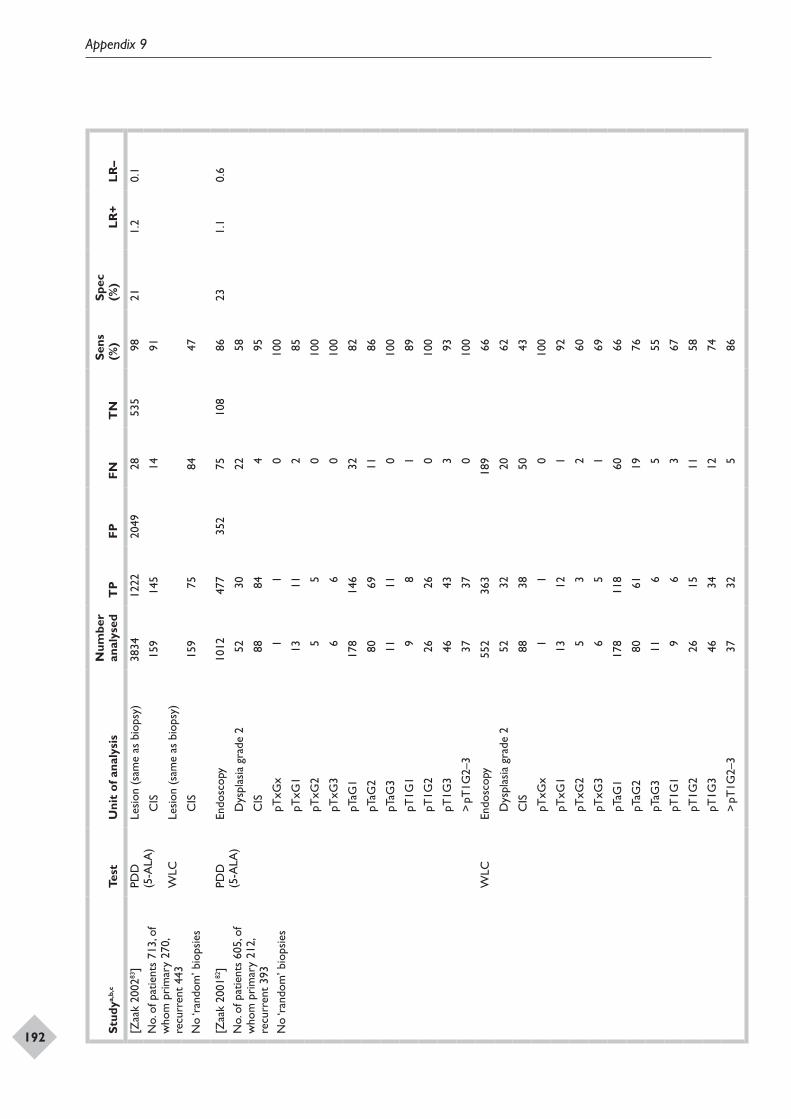
Appendix 9
192 Stud
ya,b,
cTe
stU
nit
of a
naly
sis
Num
ber
anal
ysed
TP
FPFN
TN
Sens
(%
)Sp
ec
(%)
LR+
LR–
[Zaa
k 20
0283
]N
o. o
f pat
ient
s 71
3, o
f w
hom
pri
mar
y 27
0,
recu
rren
t 44
3 N
o ‘r
ando
m’ b
iops
ies
PDD
(5
-ALA
)Le
sion
(sa
me
as b
iops
y)38
3412
2220
4928
535
9821
1.2
0.1
C
IS
159
145
1491
WLC
Lesi
on (
sam
e as
bio
psy)
C
IS15
975
8447
[Zaa
k 20
0182
]N
o. o
f pat
ient
s 60
5, o
f w
hom
pri
mar
y 21
2,
recu
rren
t 39
3 N
o ‘r
ando
m’ b
iops
ies
PDD
(5
-ALA
)En
dosc
opy
1012
477
352
7510
886
231.
10.
6
D
yspl
asia
gra
de 2
5230
2258
C
IS88
844
95
pT
xGx
11
010
0
pT
xG1
1311
285
pT
xG2
55
010
0
pT
xG3
66
010
0
pT
aG1
178
146
3282
pT
aG2
8069
1186
pT
aG3
1111
010
0
pT
1G1
98
189
pT
1G2
2626
010
0
pT
1G3
4643
393
>
pT1G
2–3
3737
010
0
WLC
Endo
scop
y55
236
318
966
D
yspl
asia
gra
de 2
5232
2062
C
IS88
3850
43
pT
xGx
11
010
0
pT
xG1
1312
192
pT
xG2
53
260
pT
xG3
65
169
pT
aG1
178
118
6066
pT
aG2
8061
1976
pT
aG3
116
555
pT
1G1
96
367
pT
1G2
2615
1158
pT
1G3
4634
1274
>
pT1G
2–3
3732
586
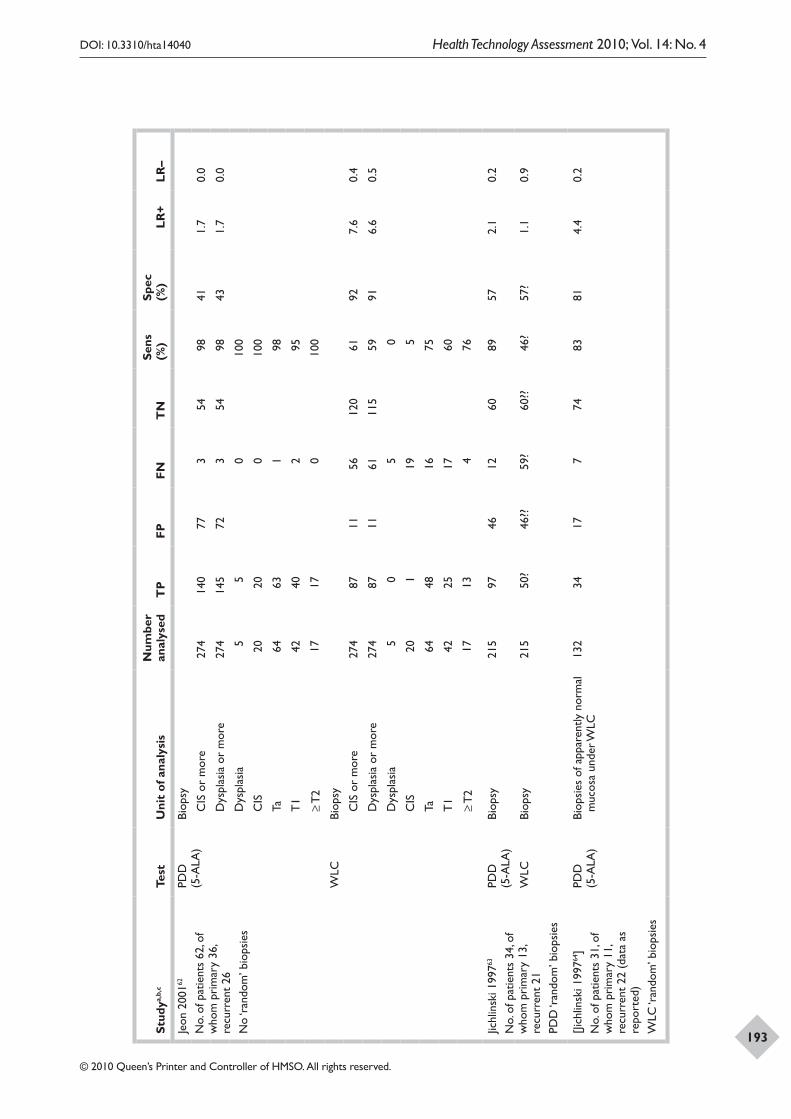
DOI: 10.3310/hta14040 Health Technology Assessment 2010; Vol. 14: No. 4
© 2010 Queen’s Printer and Controller of HMSO. All rights reserved.
193Stud
ya,b,
cTe
stU
nit
of a
naly
sis
Num
ber
anal
ysed
TP
FPFN
TN
Sens
(%
)Sp
ec
(%)
LR+
LR–
Jeon
200
162
No.
of p
atie
nts
62, o
f w
hom
pri
mar
y 36
, re
curr
ent
26
No
‘ran
dom
’ bio
psie
s
PDD
(5
-ALA
)Bi
opsy
C
IS o
r m
ore
274
140
773
5498
411.
70.
0
D
yspl
asia
or
mor
e27
414
572
354
9843
1.7
0.0
D
yspl
asia
55
010
0
C
IS20
200
100
Ta
6463
198
T
142
402
95
≥
T2
1717
010
0
WLC
Biop
sy
C
IS o
r m
ore
274
8711
5612
061
927.
60.
4
D
yspl
asia
or
mor
e27
487
1161
115
5991
6.6
0.5
D
yspl
asia
50
50
C
IS20
119
5
Ta
6448
1675
T
142
2517
60
≥
T2
1713
476
Jichl
insk
i 199
763
No.
of p
atie
nts
34, o
f w
hom
pri
mar
y 13
, re
curr
ent
21
PDD
‘ran
dom
’ bio
psie
s
PDD
(5
-ALA
)Bi
opsy
215
9746
1260
8957
2.1
0.2
WLC
Biop
sy21
550
?46
??59
?60
??46
?57
?1.
10.
9
[Jich
linsk
i 199
764]
No.
of p
atie
nts
31, o
f w
hom
pri
mar
y 11
, re
curr
ent
22 (
data
as
repo
rted
)W
LC ‘r
ando
m’ b
iops
ies
PDD
(5
-ALA
)Bi
opsi
es o
f app
aren
tly n
orm
al
muc
osa
unde
r WLC
132
3417
774
8381
4.4
0.2
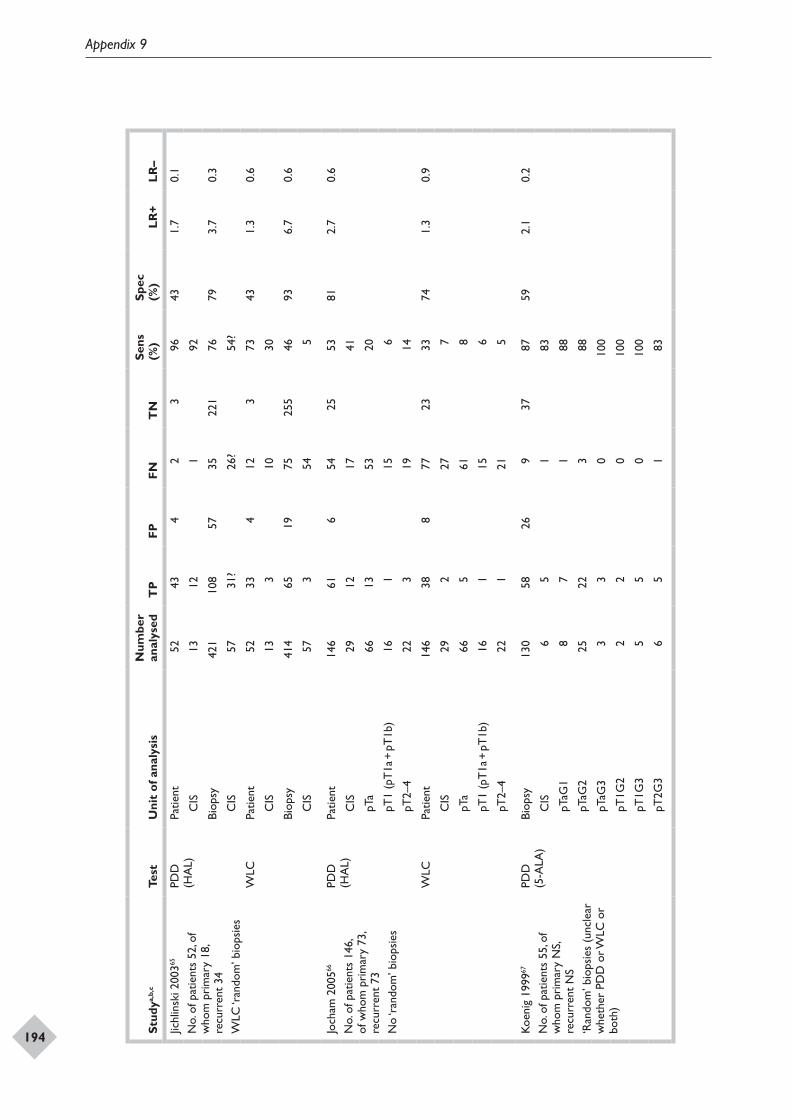
Appendix 9
194 Stud
ya,b,
cTe
stU
nit
of a
naly
sis
Num
ber
anal
ysed
TP
FPFN
TN
Sens
(%
)Sp
ec
(%)
LR+
LR–
Jichl
insk
i 200
365
No.
of p
atie
nts
52, o
f w
hom
pri
mar
y 18
, re
curr
ent
34
WLC
‘ran
dom
’ bio
psie
s
PDD
(H
AL)
Patie
nt52
434
23
9643
1.7
0.1
C
IS13
121
92
Biop
sy42
110
857
3522
176
793.
70.
3
C
IS57
31?
26?
54?
WLC
Patie
nt52
334
123
7343
1.3
0.6
C
IS13
310
30
Biop
sy41
465
1975
255
4693
6.7
0.6
C
IS57
354
5
Joch
am 2
00566
No.
of p
atie
nts
146,
of
who
m p
rim
ary
73,
recu
rren
t 73
N
o ‘r
ando
m’ b
iops
ies
PDD
(H
AL)
Patie
nt14
661
654
2553
812.
70.
6
C
IS29
1217
41
pT
a66
1353
20
pT
1 (p
T1a
+ p
T1b
)16
115
6
pT
2–4
223
1914
WLC
Patie
nt14
638
877
2333
741.
30.
9
C
IS29
227
7
pT
a66
561
8
pT
1 (p
T1a
+ p
T1b
)16
115
6
pT
2–4
221
215
Koen
ig 1
99967
No.
of p
atie
nts
55, o
f w
hom
pri
mar
y N
S, re
curr
ent
NS
‘Ran
dom
’ bio
psie
s (u
ncle
ar
whe
ther
PD
D o
r WLC
or
both
)
PDD
(5
-ALA
)Bi
opsy
130
5826
937
8759
2.1
0.2
C
IS6
51
83
pT
aG1
87
188
pT
aG2
2522
388
pT
aG3
33
010
0
pT
1G2
22
010
0
pT
1G3
55
010
0
pT
2G3
65
183
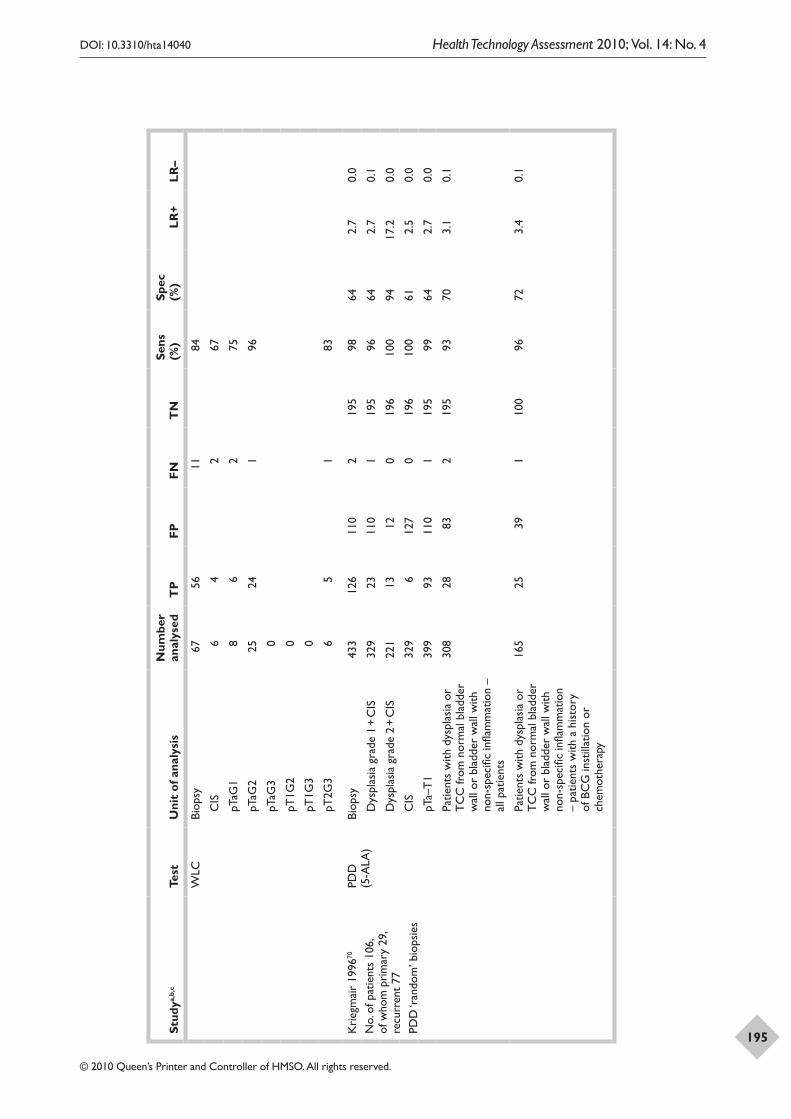
DOI: 10.3310/hta14040 Health Technology Assessment 2010; Vol. 14: No. 4
© 2010 Queen’s Printer and Controller of HMSO. All rights reserved.
195Stud
ya,b,
cTe
stU
nit
of a
naly
sis
Num
ber
anal
ysed
TP
FPFN
TN
Sens
(%
)Sp
ec
(%)
LR+
LR–
WLC
Biop
sy67
5611
84
C
IS6
42
67
pT
aG1
86
275
pT
aG2
2524
196
pT
aG3
0
pT
1G2
0
pT
1G3
0
pT
2G3
65
183
Kri
egm
air
1996
70
No.
of p
atie
nts
106,
of
who
m p
rim
ary
29,
recu
rren
t 77
PD
D ‘r
ando
m’ b
iops
ies
PDD
(5
-ALA
)Bi
opsy
433
126
110
219
598
642.
70.
0
D
yspl
asia
gra
de 1
+ C
IS32
923
110
119
596
642.
70.
1
D
yspl
asia
gra
de 2
+ C
IS22
113
120
196
100
9417
.20.
0
C
IS32
96
127
019
610
061
2.5
0.0
pT
a–T
139
993
110
119
599
642.
70.
0
Pa
tient
s w
ith d
yspl
asia
or
TC
C fr
om n
orm
al b
ladd
er
wal
l or
blad
der
wal
l with
no
n-sp
ecifi
c in
flam
mat
ion
– al
l pat
ient
s
308
2883
219
593
703.
10.
1
Pa
tient
s w
ith d
yspl
asia
or
TC
C fr
om n
orm
al b
ladd
er
wal
l or
blad
der
wal
l with
no
n-sp
ecifi
c in
flam
mat
ion
– pa
tient
s w
ith a
his
tory
of
BC
G in
still
atio
n or
ch
emot
hera
py
165
2539
110
096
723.
40.
1
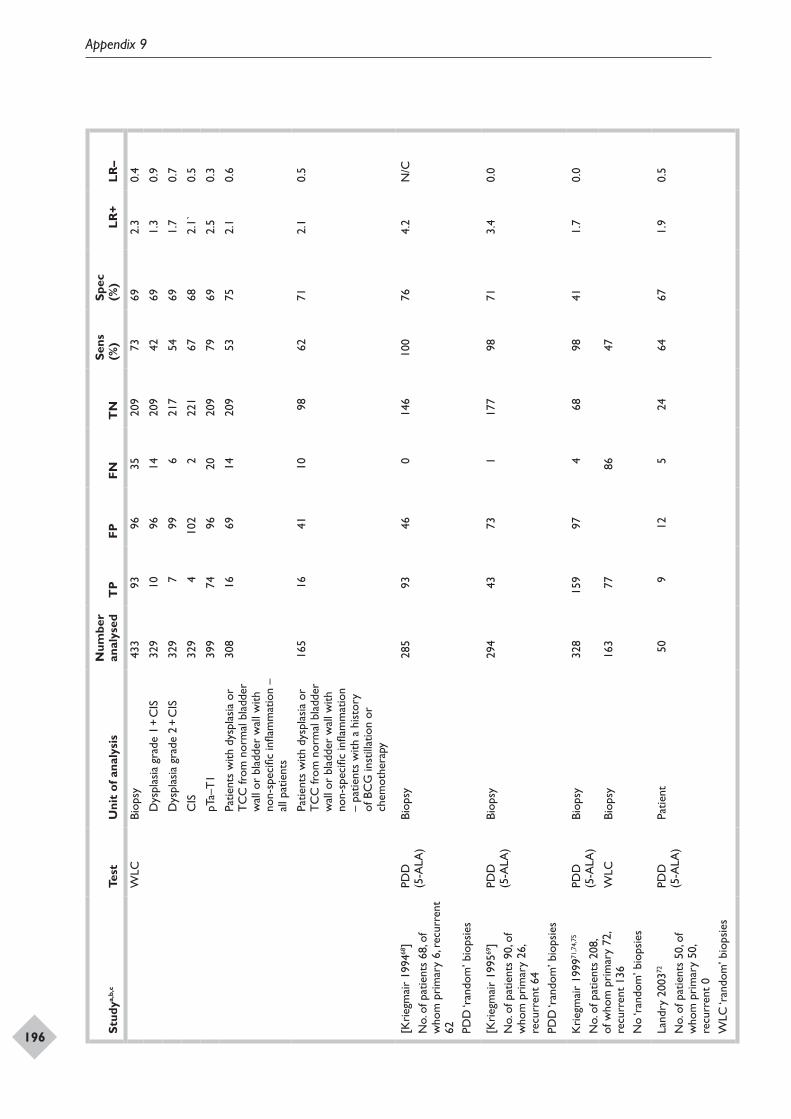
Appendix 9
196 Stud
ya,b,
cTe
stU
nit
of a
naly
sis
Num
ber
anal
ysed
TP
FPFN
TN
Sens
(%
)Sp
ec
(%)
LR+
LR–
WLC
Biop
sy43
393
9635
209
7369
2.3
0.4
D
yspl
asia
gra
de 1
+ C
IS32
910
9614
209
4269
1.3
0.9
D
yspl
asia
gra
de 2
+ C
IS32
97
996
217
5469
1.7
0.7
C
IS32
94
102
222
167
682.
1`0.
5
pT
a–T
139
974
9620
209
7969
2.5
0.3
Pa
tient
s w
ith d
yspl
asia
or
TC
C fr
om n
orm
al b
ladd
er
wal
l or
blad
der
wal
l with
no
n-sp
ecifi
c in
flam
mat
ion
– al
l pat
ient
s
308
1669
1420
953
752.
10.
6
Pa
tient
s w
ith d
yspl
asia
or
TC
C fr
om n
orm
al b
ladd
er
wal
l or
blad
der
wal
l with
no
n-sp
ecifi
c in
flam
mat
ion
– pa
tient
s w
ith a
his
tory
of
BC
G in
still
atio
n or
ch
emot
hera
py
165
1641
1098
6271
2.1
0.5
[Kri
egm
air
1994
68]
No.
of p
atie
nts
68, o
f w
hom
pri
mar
y 6,
rec
urre
nt
62
PDD
‘ran
dom
’ bio
psie
s
PDD
(5
-ALA
)Bi
opsy
285
9346
014
610
076
4.2
N/C
[Kri
egm
air
1995
69]
No.
of p
atie
nts
90, o
f w
hom
pri
mar
y 26
, re
curr
ent
64
PDD
‘ran
dom
’ bio
psie
s
PDD
(5
-ALA
)Bi
opsy
294
4373
117
798
713.
40.
0
Kri
egm
air
1999
71,7
4,75
No.
of p
atie
nts
208,
of
who
m p
rim
ary
72,
recu
rren
t 13
6N
o ‘r
ando
m’ b
iops
ies
PDD
(5
-ALA
)Bi
opsy
328
159
974
6898
411.
70.
0
WLC
Biop
sy16
377
8647
Land
ry 2
00372
No.
of p
atie
nts
50, o
f w
hom
pri
mar
y 50
, re
curr
ent
0 W
LC ‘r
ando
m’ b
iops
ies
PDD
(5
-ALA
)Pa
tient
509
125
2464
671.
90.
5
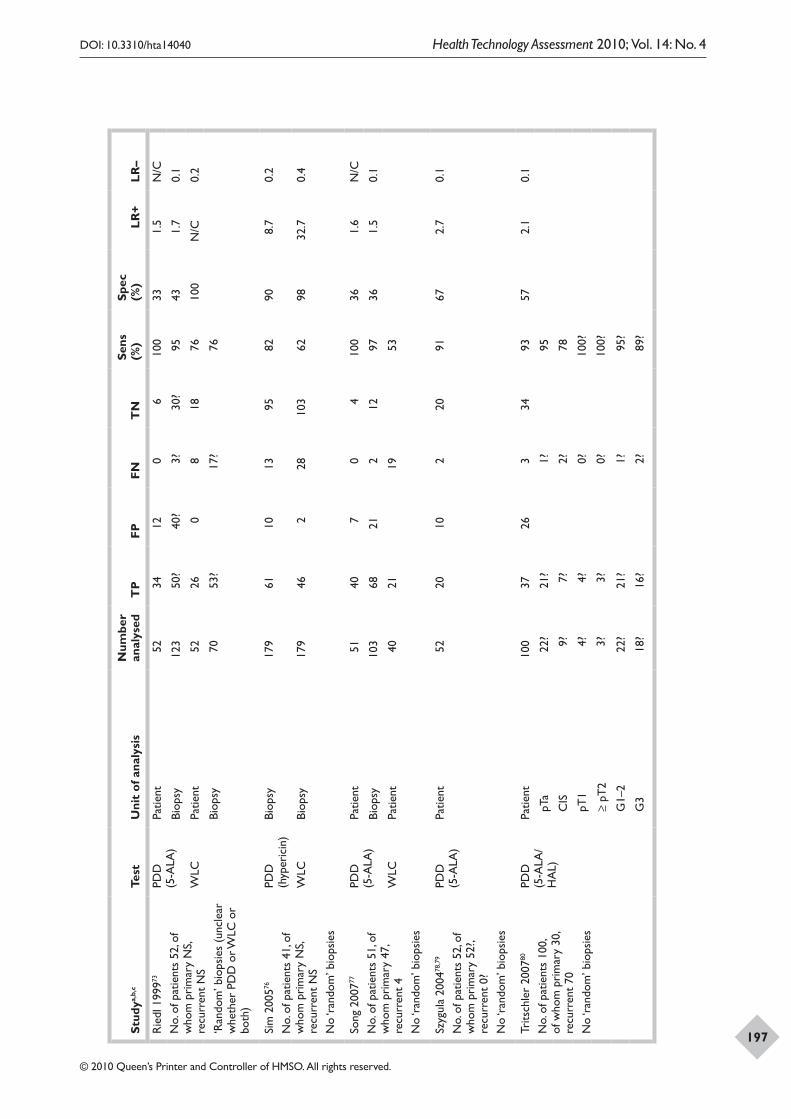
DOI: 10.3310/hta14040 Health Technology Assessment 2010; Vol. 14: No. 4
© 2010 Queen’s Printer and Controller of HMSO. All rights reserved.
197Stud
ya,b,
cTe
stU
nit
of a
naly
sis
Num
ber
anal
ysed
TP
FPFN
TN
Sens
(%
)Sp
ec
(%)
LR+
LR–
Rie
dl 1
99973
No.
of p
atie
nts
52, o
f w
hom
pri
mar
y N
S, re
curr
ent
NS
‘Ran
dom
’ bio
psie
s (u
ncle
ar
whe
ther
PD
D o
r WLC
or
both
)
PDD
(5
-ALA
)Pa
tient
5234
120
610
033
1.5
N/C
Biop
sy12
350
?40
?3?
30?
9543
1.7
0.1
WLC
Patie
nt52
260
818
7610
0N
/C0.
2
Biop
sy70
53?
17?
76
Sim
200
576
No.
of p
atie
nts
41, o
f w
hom
pri
mar
y N
S, re
curr
ent
NS
No
‘ran
dom
’ bio
psie
s
PDD
(h
yper
icin
)Bi
opsy
179
6110
1395
8290
8.7
0.2
WLC
Biop
sy17
946
228
103
6298
32.7
0.4
Song
200
777
No.
of p
atie
nts
51, o
f w
hom
pri
mar
y 47
, re
curr
ent
4 N
o ‘r
ando
m’ b
iops
ies
PDD
(5
-ALA
)Pa
tient
5140
70
410
036
1.6
N/C
Biop
sy10
368
212
1297
361.
50.
1
WLC
Patie
nt40
2119
53
Szyg
ula
2004
78,7
9
No.
of p
atie
nts
52, o
f w
hom
pri
mar
y 52
?, re
curr
ent
0?
No
‘ran
dom
’ bio
psie
s
PDD
(5
-ALA
)Pa
tient
5220
102
2091
672.
70.
1
Trits
chle
r 20
0780
No.
of p
atie
nts
100,
of
who
m p
rim
ary
30,
recu
rren
t 70
N
o ‘r
ando
m’ b
iops
ies
PDD
(5
-ALA
/H
AL)
Patie
nt10
037
263
3493
572.
10.
1
pT
a22
?21
?1?
95
C
IS9?
7?2?
78
pT
14?
4?0?
100?
≥
pT2
3?3?
0?10
0?
G
1–2
22?
21?
1?95
?
G
318
?16
?2?
89?
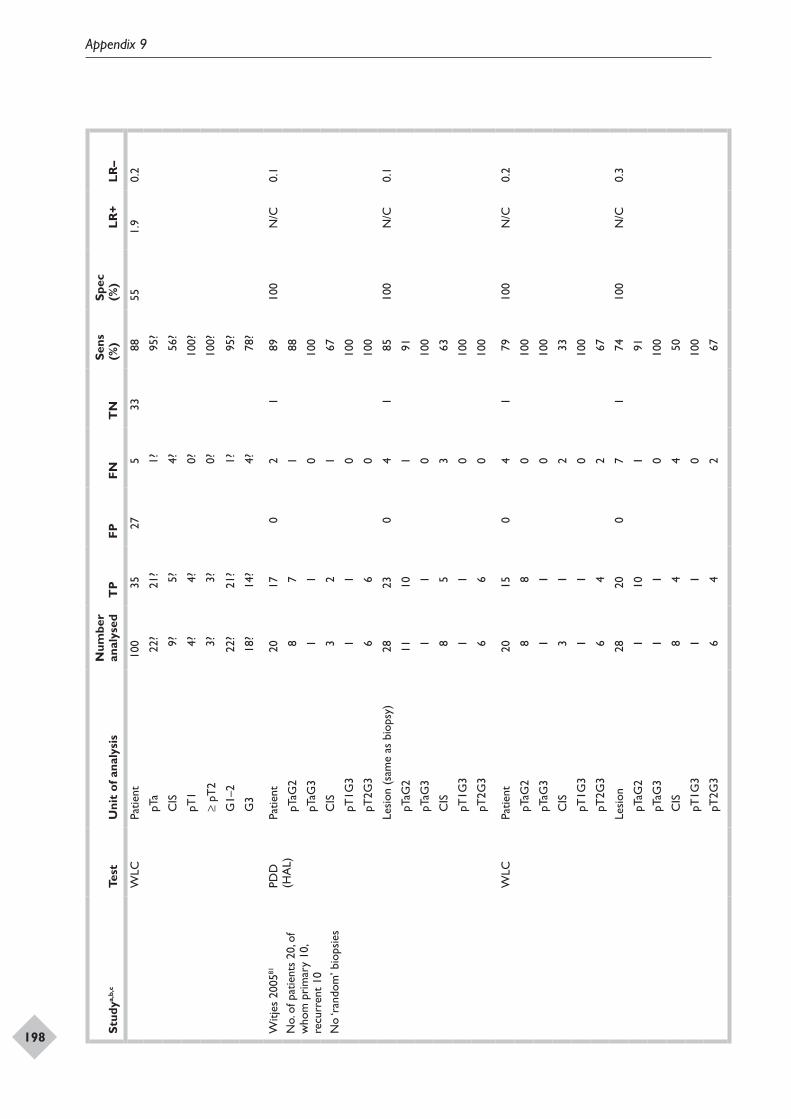
Appendix 9
198 Stud
ya,b,
cTe
stU
nit
of a
naly
sis
Num
ber
anal
ysed
TP
FPFN
TN
Sens
(%
)Sp
ec
(%)
LR+
LR–
WLC
Patie
nt10
035
275
3388
551.
90.
2
pT
a22
?21
?1?
95?
C
IS9?
5?4?
56?
pT
14?
4?0?
100?
≥
pT2
3?3?
0?10
0?
G
1–2
22?
21?
1?95
?
G
318
?14
?4?
78?
Witj
es 2
00581
No.
of p
atie
nts
20, o
f w
hom
pri
mar
y 10
, re
curr
ent
10
No
‘ran
dom
’ bio
psie
s
PDD
(H
AL)
Patie
nt20
170
21
8910
0N
/C0.
1
pT
aG2
87
188
pT
aG3
11
010
0
C
IS3
21
67
pT
1G3
11
010
0
pT
2G3
66
010
0
Lesi
on (
sam
e as
bio
psy)
2823
04
185
100
N/C
0.1
pT
aG2
1110
191
pT
aG3
11
010
0
C
IS8
53
63
pT
1G3
11
010
0
pT
2G3
66
010
0
WLC
Patie
nt20
150
41
7910
0N
/C0.
2
pT
aG2
88
010
0
pT
aG3
11
010
0
C
IS3
12
33
pT
1G3
11
010
0
pT
2G3
64
267
Lesi
on28
200
71
7410
0N
/C0.
3
pT
aG2
110
191
pT
aG3
11
010
0
C
IS8
44
50
pT
1G3
11
010
0
pT
2G3
64
267
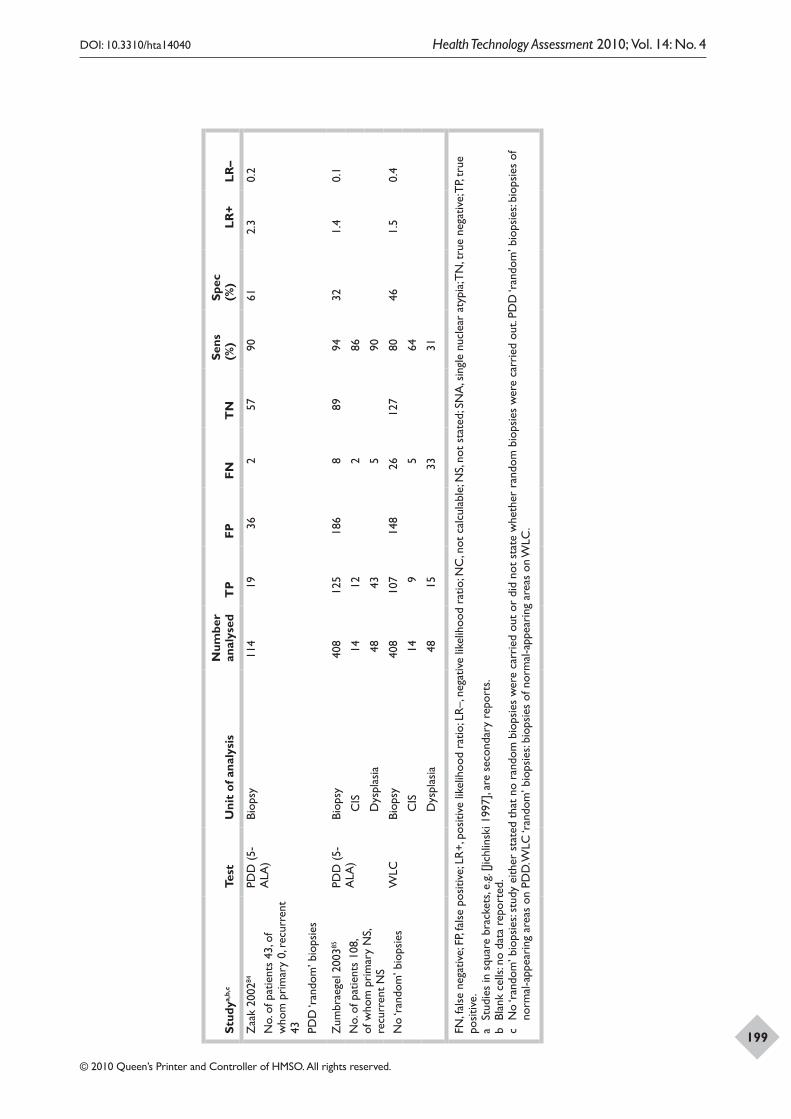
DOI: 10.3310/hta14040 Health Technology Assessment 2010; Vol. 14: No. 4
© 2010 Queen’s Printer and Controller of HMSO. All rights reserved.
199Stud
ya,b,
cTe
stU
nit
of a
naly
sis
Num
ber
anal
ysed
TP
FPFN
TN
Sens
(%
)Sp
ec
(%)
LR+
LR–
Zaa
k 20
0284
No.
of p
atie
nts
43, o
f w
hom
pri
mar
y 0,
rec
urre
nt
43
PDD
‘ran
dom
’ bio
psie
s
PDD
(5-
ALA
)Bi
opsy
114
1936
257
9061
2.3
0.2
Zum
brae
gel 2
00385
No.
of p
atie
nts
108,
of
who
m p
rim
ary
NS,
recu
rren
t N
S N
o ‘r
ando
m’ b
iops
ies
PDD
(5-
ALA
)Bi
opsy
408
125
186
889
9432
1.4
0.1
C
IS14
122
86
D
yspl
asia
4843
590
WLC
Biop
sy40
810
714
826
127
8046
1.5
0.4
C
IS14
95
64
D
yspl
asia
4815
3331
FN, f
alse
neg
ativ
e; F
P, fa
lse
posi
tive;
LR
+, p
ositi
ve li
kelih
ood
ratio
; LR
–, n
egat
ive
likel
ihoo
d ra
tio; N
C, n
ot c
alcu
labl
e; N
S, no
t st
ated
; SN
A, s
ingl
e nu
clea
r at
ypia
; TN
, tru
e ne
gativ
e; T
P, tr
ue
posi
tive.
a St
udie
s in
squ
are
brac
kets
, e.g
. [Jic
hlin
ski 1
997]
, are
sec
onda
ry r
epor
ts.
b Bl
ank
cells
: no
data
rep
orte
d.c
No
‘ran
dom
’ bio
psie
s: st
udy
eith
er s
tate
d th
at n
o ra
ndom
bio
psie
s w
ere
carr
ied
out
or d
id n
ot s
tate
whe
ther
ran
dom
bio
psie
s w
ere
carr
ied
out.
PDD
‘ran
dom
’ bio
psie
s: bi
opsi
es o
f no
rmal
-app
eari
ng a
reas
on
PDD
. WLC
‘ran
dom
’ bio
psie
s: bi
opsi
es o
f nor
mal
-app
eari
ng a
reas
on
WLC
.

DOI: 10.3310/hta14040 Health Technology Assessment 2010; Vol. 14: No. 4
© 2010 Queen’s Printer and Controller of HMSO. All rights reserved.
201
Abbate 1998Abbate I, D’Introno A, Cardo G, Marano A, Addabbo L, Musci MD, et al. Comparison of nuclear matrix protein 22 and bladder tumor antigen in urine of patients with bladder cancer. Anticancer Res 1998;18:3803–5.
Bastacky 1999Bastacky S, Ibrahim S, Wilczynski SP, Murphy WM. The accuracy of urinary cytology in daily practice. Cancer 1999;87:118–28.
Bhuiyan 2003Bhuiyan J, Akhter J, O’Kane DJ. Performance characteristics of multiple urinary tumor markers and sample collection techniques in the detection of transitional cell carcinoma of the bladder. Clin Chim Acta 2003;331:69–77.
Boman 2002Boman H, Hedelin H, Holmang S. Four bladder tumor markers have a disappointingly low sensitivity for small size and low grade recurrence. J Urol 2002;167:80–3.
Casella 2000Primary referenceCasella R, Huber P, Blochlinger A, Stoffel F, Dalquen P, Gasser TC, et al. Urinary level of nuclear matrix protein 22 in the diagnosis of bladder cancer: experience with 130 patients with biopsy confirmed tumor. J Urol 2000;164:1926–8.
Secondary referencesShariat SF, Casella R, Monoski MA, Sulser T, Gasser TC, Lerner SP. The addition of urinary urokinase-type plasminogen activator to urinary nuclear matrix protein 22 and cytology improves the detection of bladder cancer. J Urol 2003;170:2244–7.
Shariat SF, Casella R, Khoddami SM, Hernandez G, Sulser T, Gasser TC, et al. Urine detection of survivin is a sensitive marker for the noninvasive diagnosis of bladder cancer. J Urol 2004;171:626–30.
Casetta 2000Casetta G, Gontero P, Zitella A, Pelucelli G, Formiconi A, Priolo G, et al. BTA quantitative assay and NMP22 testing compared with urine cytology in the detection of transitional cell carcinoma of the bladder. Urol Int 2000;65:100–5.
Chahal 2001aChahal R, Gogoi NK, Sundaram SK. Is it necessary to perform urine cytology in screening patients with haematuria? Eur Urol 2001;39:283–6.
Chahal 2001bChahal R, Darshane A, Browning AJ, Sundaram SK. Evaluation of the clinical value of urinary NMP22 as a marker in the screening and surveillance of transitional cell carcinoma of the urinary bladder. Eur Urol 2001;40:415–20.
Chang 2004Chang YH, Wu CH, Lee YL, Huang PH, Kao YL, Shiau MY. Evaluation of nuclear matrix protein-22 as a clinical diagnostic marker for bladder cancer. Urology 2004;64:687–92.
Daniely 2007Daniely M, Rona R, Kaplan T, Olsfanger S, Elboim L, Freiberger A, et al. Combined morphologic and fluorescence in situ hybridization analysis of voided urine samples for the detection and follow-up of bladder cancer in patients with benign urine cytology. Cancer 2007;111:517–24.
Del Nero 1999Del Nero A, Esposito N, Curro A, Biasoni D, Montanari E, Mangiarotti B, et al. Evaluation of urinary level of NMP22 as a diagnostic marker for stage pTa-pT1 bladder cancer: comparison with urinary cytology and BTA test. Eur Urol 1999;35:93–7.
Friedrich 2003Primary referenceFriedrich MG, Toma MI, Hellstern A, Pantel K, Weisenberger DJ, Noldus J, et al. Comparison of multitarget fluorescence in situ hybridization in urine with other noninvasive tests for detecting bladder cancer. BJU Int 2003;92:911–4.
Secondary referenceFriedrich MG, Hellstern A, Hautmann SH, Graefen M, Conrad S, Huland E, et al. Clinical use of urinary markers for the detection and prognosis of bladder carcinoma: a comparison of immunocytology with monoclonal antibodies against Lewis X and 486p3/12 with the BTA STAT and NMP22 tests. J Urol 2002;168:470–4.
Appendix 10 Biomarker/cytology included studies
Appendix 10
202
Garbar 2007Garbar C, Mascaux C, Wespes E. Is urinary tract cytology still useful for diagnosis of bladder carcinomas? A large series of 592 bladder washings using a five-category classification of different cytological diagnoses. Cytopathology 2007;18:79–83.
Giannopoulos 2001Primary referenceGiannopoulos A, Manousakas T, Gounari A, Constantinides C, Choremi-Papadopoulou H, Dimopoulos C. Comparative evaluation of the diagnostic performance of the BTA stat test, NMP22 and urinary bladder cancer antigen for primary and recurrent bladder tumors [see comment]. J Urol 2001;166:470–5.
Secondary referenceGiannopoulos A, Manousakas T, Mitropoulos D, Botsoli-Stergiou E, Constantinides C, Giannopoulou M, et al. Comparative evaluation of the BTAstat test, NMP22, and voided urine cytology in the detection of primary and recurrent bladder tumors. Urology 2000;55:871–5.
Grossman 2005Grossman HB, Messing E, Soloway M, Tomera K, Katz G, Berger Y, et al. Detection of bladder cancer using a point-of-care proteomic assay. JAMA 2005;293:810–16.
Grossman 2006Grossman HB, Soloway M, Messing E, Katz G, Stein B, Kassabian V, et al. Surveillance for recurrent bladder cancer using a point-of-care proteomic assay. JAMA 2006;295:299–305.
Guttierez Banos 2001Gutierrez Banos JL, Rebollo Rodrigo MH, Antolin Juarez FM, Martin GB. NMP 22, BTA stat test and cytology in the diagnosis of bladder cancer: a comparative study. Urol Int 2001;66:185–90.
Hakenberg 2000Hakenberg OW, Franke P, Froehner M, Manseck A, Wirth MP. The value of conventional urine cytology in the diagnosis of residual tumour after transurethral resection of bladder carcinomas. Onkologie 2000;23:252–7.
Halling 2000Halling KC, King W, Sokolova IA, Meyer RG, Burkhardt HM, Halling AC, et al. A comparison of cytology and fluorescence in situ hybridization for the detection of urothelial carcinoma. J Urol 2000;164:1768–75.
Hughes 1999Hughes JH, Katz RL, Rodriguez-Villanueva J, Kidd L, Dinney C, Grossman HB, et al. Urinary nuclear matrix protein 22 (NMP22): a diagnostic adjunct to urine cytologic examination for the detection of recurrent transitional-cell carcinoma of the bladder. Diagn Cytopathol 1999;20:285–90.
Junker 2006Junker K, Fritsch T, Hartmann A, Schulze W, Schubert J. Multicolor fluorescence in situ hybridization (M-FISH) on cells from urine for the detection of bladder cancer. Cytogenet Genome Res 2006;114:279–83.
Karakiewicz 2006Primary referenceKarakiewicz PI, Benayoun S, Zippe C, Ludecke G, Boman H, Sanchez-Carbayo M, et al. Institutional variability in the accuracy of urinary cytology for predicting recurrence of transitional cell carcinoma of the bladder. BJU Int 2006;97:997–1001.
Secondary referenceHutterer GC, Karakiewicz PI, Zippe C, Ludecke G, Boman H, Sanchez-Carbayo M, et al. Urinary cytology and nuclear matrix protein 22 in the detection of bladder cancer recurrence other than transitional cell carcinoma. BJU Int 2008;101:561–5.
Kipp 2008Kipp BR, Halling KC, Campion MB, Wendel AJ, Karnes RJ, Zhang J, et al. Assessing the value of reflex fluorescence in situ hybridization testing in the diagnosis of bladder cancer when routine urine cytological examination is equivocal. J Urol 2008;179:1296–301.
Kowalska 2005Kowalska M, Kaminska J, Kotowicz B, Fuksiewicz M, Rysinska A, Demkow T, et al. Evaluation of the urinary nuclear matrix protein (NMP22) as a tumour marker in bladder cancer patients. Nowotwory 2005;55:300–2.
Kumar 2006Kumar A, Kumar R, Gupta NP. Comparison of NMP22 BladderChek test and urine cytology for the detection of recurrent bladder cancer. Jpn J Clin Oncol 2006;36:172–5.
Lahme 2001Primary referenceLahme S, Bichler KH, Feil G, Krause S. Comparison of cytology and nuclear matrix protein 22 for the detection and follow-up of bladder cancer. Urol Int 2001;66:72–7.
Secondary referenceLahme S, Bichler KH, Feil G, Zumbragel A, Gotz T. Comparison of cytology and nuclear matrix protein 22 (NMP 22) for the detection and follow-up of bladder-cancer. Adv Exp Med Biol 2003;539:111–19.
Lee 2001Lee KH. Evaluation of the NMP22 test and comparison with voided urine cytology in the detection of bladder cancer. Yonsei Med J 2001;42:14–18.
Lodde 2003Lodde M, Mian C, Negri G, Berner L, Maffei N, Lusuardi L, et al. Role of uCyt+ in the detection and surveillance of urothelial carcinoma. Urology 2003;61:243–7.
DOI: 10.3310/hta14040 Health Technology Assessment 2010; Vol. 14: No. 4
© 2010 Queen’s Printer and Controller of HMSO. All rights reserved.
203
Lodde 2006Lodde M, Mian C, Comploj E, Palermo S, Longhi E, Marberger M, et al. uCyt+ test: alternative to cystoscopy for less-invasive follow-up of patients with low risk of urothelial carcinoma. Urology 2006;67:950–4.
May 2007May M, Hakenberg OW, Gunia S, Pohling P, Helke C, Lubbe L, et al. Comparative diagnostic value of urine cytology, UBC-ELISA, and fluorescence in situ hybridization for detection of transitional cell carcinoma of urinary bladder in routine clinical practice. Urology 2007;70:449–53.
Meiers 2007Meiers I, Singh H, Hossain D, Lang K, Liu L, Qian JQ, et al. Improved filter method for urine sediment detection of urothelial carcinoma by fluorescence in situ hybridization. Arch Pathol Lab Med. 2007;131:1574–7.
Messing 2005Messing EM, Teot L, Korman H, Underhill E, Barker E, Stork B, et al. Performance of urine test in patients monitored for recurrence of bladder cancer: a multicenter study in the United States. J Urol 2005;174:1238–41.
Mian 1999Mian C, Pycha A, Wiener H, Haitel A, Lodde M, Marberger M. Immunocyt: a new tool for detecting transitional cell cancer of the urinary tract. J Urol 1999;161:1486–9.
Mian 2000Mian C, Lodde M, Haitel A, Vigl EE, Marberger M, Pycha A. Comparison of the monoclonal UBC-ELISA test and the NMP22 ELISA test for the detection of urothelial cell carcinoma of the bladder. Urology 2000;55:223–6.
Mian2003Mian C, Lodde M, Comploj E, Negri G, Egarter-Vigl E, Lusuardi L, et al. Liquid-based cytology as a tool for the performance of uCyt+ and Urovysion Multicolour-FISH in the detection of urothelial carcinoma. Cytopathology 2003;14:338–42.
Mian 2006Mian C, Maier K, Comploj E, Lodde M, Berner L, Lusuardi L, et al. uCyt+/ImmunoCyt in the detection of recurrent urothelial carcinoma: an update on 1991 analyses. Cancer 2006;108:60–5.
Miyanaga 1999Miyanaga N, Akaza H, Tsukamoto T, Ishikawa S, Noguchi R, Ohtani M, et al. Urinary nuclear matrix protein 22 as a new marker for the screening of urothelial cancer in patients with microscopic hematuria. Int J Urol 1999;6:173–7.
Miyanaga 2003Miyanaga N, Akaza H, Tsukamoto S, Shimazui T, Ohtani M, Ishikawa S, et al. Usefulness of urinary NMP22 to detect tumor recurrence of superficial bladder cancer after transurethral resection. Int J Clin Oncol 2003;8:369–73.
Moonen 2007Moonen PM, Merkx GF, Peelen P, Karthaus HF, Smeets DF, Witjes JA. UroVysion compared with cytology and quantitative cytology in the surveillance of non-muscle-invasive bladder cancer. Eur Urol 2007;51:1275–80.
Oge 2001Oge O, Atsu N, Kendi S, Ozen H. Evaluation of nuclear matrix protein 22 (NMP22) as a tumor marker in the detection of bladder cancer. Int Urol Nephrol 2001;32:367–70.
Olsson 2001Olsson H, Zackrisson B. ImmunoCyt a useful method in the follow-up protocol for patients with urinary bladder carcinoma. Scand J Urol Nephrol 2001;35:280–2.
Oosterhuis 2002Oosterhuis JWA, Pauwels RPE, Schapers RFM, Van Pelt J, Smeets W, Newling DWW. Detection of recurrent transitional cell carcinoma of the bladder with nuclear matrix protein-22 in a follow-up setting. UroOncology 2002;2:137–42.
Parekattil 2003Parekattil SJ, Fisher HA, Kogan BA. Neural network using combined urine nuclear matrix protein-22, monocyte chemoattractant protein-1 and urinary intercellular adhesion molecule-1 to detect bladder cancer. J Urol 2003;169:917–20.
Piaton 2003Primary referencePiaton E, Daniel L, Verriele V, Dalifard I, Zimmermann U, Renaudin K, et al., French Prospective MS. Improved detection of urothelial carcinomas with fluorescence immunocytochemistry (uCyt+ assay) and urinary cytology: results of a French Prospective Multicenter Study. Lab Invest 2003;83:845–52.
Secondary referencePfister C, Chautard D, Devonec M, Perrin P, Chopin D, Rischmann P, et al. Immunocyt test improves the diagnostic accuracy of urinary cytology: results of a French multicenter study. J Urol 2003;169:921–4.
Planz 2005Planz B, Jochims E, Deix T, Caspers HP, Jakse G, Boecking A. The role of urinary cytology for detection of bladder cancer. Eur J Surg Oncol 2005;31:304–8.
Appendix 10
204
Ponsky 2001Ponsky LE, Sharma S, Pandrangi L, Kedia S, Nelson D, Agarwal A, et al. Screening and monitoring for bladder cancer: refining the use of NMP22. J Urol 2001;166:75–8.
Potter 1999Potter JM, Quigley M, Pengelly AW, Fawcett DP, Malone PR. The role of urine cytology in the assessment of lower urinary tract symptoms. BJU Int 1999;84:30–1.
Poulakis 2001Poulakis V, Witzsch U, De Vries R, Altmannsberger HM, Manyak MJ, Becht E. A comparison of urinary nuclear matrix protein-22 and bladder tumour antigen tests with voided urinary cytology in detecting and following bladder cancer: the prognostic value of false-positive results. BJU Int 2001;88:692–701.
Raitanen 2002Primary referenceRaitanen MP, Aine RA, Kaasinen ES, Liukkonen TJ, Kylmala TM, Huhtala H, et al. Suspicious urine cytology (class III) in patients with bladder cancer: should it be considered as negative or positive? Scand J Urol Nephrol 2002;36:213–7.
Secondary referenceRaitanen M-P, Aine R, Rintala E, Kallio J, Rajala P, Juusela H, et al. Differences between local and review urinary cytology in diagnosis of bladder cancer. An interobserver multicenter analysis. Eur Urol 2002;41:284–9.
Ramakumar 1999Ramakumar S, Bhuiyan J, Besse JA, Roberts SG, Wollan PC, Blute ML, et al. Comparison of screening methods in the detection of bladder cancer. J Urol 1999;161:388–94.
Saad 2002Saad A, Hanbury DC, McNicholas TA, Boustead GB, Morgan S, Woodman AC. A study comparing various noninvasive methods of detecting bladder cancer in urine. BJU Int 2002;89:369–73.
Sanchez-Carbayo 1999Primary referenceSanchez-Carbayo M, Herrero E, Megias J, Mira A, Soria F. Comparative sensitivity of urinary CYFRA 21–1, urinary bladder cancer antigen, tissue polypeptide antigen, tissue polypeptide antigen and NMP22 to detect bladder cancer. J Urol 1999;162:1951–6.
Secondary referenceSanchez-Carbayo M, Herrero E, Megias J, Mira A, Soria F. Evaluation of nuclear matrix protein 22 as a tumour marker in the detection of transitional cell carcinoma of the bladder. BJU Int 1999;84:706–13.
Sanchez-Carbayo 2001aSanchez-Carbayo M, Urrutia M, Gonzalez de Buitrago JM, Navajo JA. Utility of serial urinary tumor markers to individualize intervals between cystoscopies in the monitoring of patients with bladder carcinoma. Cancer 2001;92:2820–8.
Sanchez-Carbayo 2001bSanchez-Carbayo M, Urrutia M, Silva JM, Romani R, De Buitrago JM, Navajo JA. Comparative predictive values of urinary cytology, urinary bladder cancer antigen, CYFRA 21–1 and NMP22 for evaluating symptomatic patients at risk for bladder cancer. J Urol 2001;165:1462–7.
Sarosdy 2002Sarosdy MF, Schellhammer P, Bokinsky G, Kahn P, Chao R, Yore L, et al. Clinical evaluation of a multi-target fluorescent in situ hybridization assay for detection of bladder cancer. J Urol 2002;168:1950–4.
Sarosdy 2006Sarosdy MF, Kahn PR, Ziffer MD, Love WR, Barkin J, Abara EO, et al. Use of a multitarget fluorescence in situ hybridization assay to diagnose bladder cancer in patients with hematuria. J Urol 2006;176:44–7.
Schmitz-Drager 2008Primary referenceSchmitz-Drager BJ, Tirsar LA, Schmitz-Drager C, Dorsam J, Mellan Z, Bismarck E, et al. Immunocytology in the assessment of patients with asymptomatic hematuria. World J Urol 2008;26:31–7.
Secondary referenceSchmitz-Drager BJ, Beiche B, Tirsar LA, Schmitz-Drager C, Bismarck E, Ebert T. Immunocytology in the assessment of patients with asymptomatic microhaematuria. Eur Urol 2007;51:1582–8.
Serretta 2000Primary referenceSerretta V, Pomara G, Rizzo I, Esposito E. Urinary BTA-stat, BTA-trak and NMP22 in surveillance after TUR of recurrent superficial transitional cell carcinoma of the bladder. Eur Urol 2000;38:419–25.
Secondary referenceSerretta V, Lo PD, Vasile P, Gange E, Esposito E, Menozzi I. Urinary NMP22 for the detection of recurrence after transurethral resection of transitional cell carcinoma of the bladder: experience on 137 patients. Urology 1998;52:793–6.
Shariat 2006Shariat SF, Marberger MJ, Lotan Y, Sanchez-Carbayo M, Zippe C, Ludecke G, et al. Variability in the performance of nuclear matrix protein 22 for the detection of bladder cancer. J Urol 2006;176:919–26.
DOI: 10.3310/hta14040 Health Technology Assessment 2010; Vol. 14: No. 4
© 2010 Queen’s Printer and Controller of HMSO. All rights reserved.
205
Sharma 1999Sharma S, Zippe CD, Pandrangi L, Nelson D, Agarwal A. Exclusion criteria enhance the specificity and positive predictive value of NMP22 and BTA stat. J Urol 1999;162:53–7.
Skacel 2003Skacel M, Fahmy M, Brainard JA, Pettay JD, Biscotti CV, Liou LS, et al. Multitarget fluorescence in situ hybridization assay detects transitional cell carcinoma in the majority of patients with bladder cancer and atypical or negative urine cytology. J Urol 2003;169:2101–5.
Sokolova 2000Sokolova IA, Halling KC, Jenkins RB, Burkhardt HM, Meyer RG, Seelig SA, et al. The development of a multitarget, multicolor fluorescence in situ hybridization assay for the detection of urothelial carcinoma in urine. J Mol Diagn 2000;2:116–23.
Sozen 1999Sozen S, Biri H, Sinik Z, Kupeli B, Alkibay T, Bozkirli I. Comparison of the nuclear matrix protein 22 with voided urine cytology and BTA stat test in the diagnosis of transitional cell carcinoma of the bladder. Eur Urol 1999;36:225–9.
Stampfer 1998Stampfer DS, Carpinito GA, Rodriguez-Villanueva J, Willsey LW, Dinney CP, Grossman HB, et al. Evaluation of NMP22 in the detection of transitional cell carcinoma of the bladder. J Urol 1998;159:394–8.
Takeuchi 2004Takeuchi Y, Sawada Y. A clinical study of urinary NMP22 in urinary epithelial cancer. J Med Soc Toho Univ 2004;516:332–8.
Talwar 2007Talwar R, Sinha T, Karan SC, Doddamani D, Sandhu A, Sethi GS, et al. Voided urinary cytology in bladder
cancer: is it time to review the indications? Urology 2007;70:267–71.
Tetu 2005Tetu B, Tiguert R, Harel F, Fradet Y. ImmunoCyt/uCyt+ improves the sensitivity of urine cytology in patients followed for urothelial carcinoma. Mod Pathol 2005;18:83–9.
Tritschler 2007Tritschler S, Scharf S, Karl A, Tilki D, Knuechel R, Hartmann A, et al. Validation of the diagnostic value of NMP22 BladderChek test as a marker for bladder cancer by photodynamic diagnosis. Eur Urol 2007;51:403–7.
Wiener 1998Wiener HG, Mian C, Haitel A, Pycha A, Schatzl G, Marberger M. Can urine bound diagnostic tests replace cystoscopy in the management of bladder cancer? J Urol 1998;159:1876–80.
Yoder 2007Yoder BJ, Skacel M, Hedgepeth R, Babineau D, Ulchaker JC, Liou LS, et al. Reflex UroVysion testing of bladder cancer surveillance patients with equivocal or negative urine cytology: a prospective study with focus on the natural history of anticipatory positive findings. Am J Clin Pathol 2007;127:295–301.
Zippe 1999Primary referenceZippe C, Pandrangi L, Agarwal A. NMP22 is a sensitive, cost-effective test in patients at risk for bladder cancer. J Urol 1999;161:62–5.
Secondary referenceZippe C, Pandrangi L, Potts JM, Kursh E, Novick A, Agarwal A. NMP22: a sensitive, cost-effective test in patients at risk for bladder cancer. Anticancer Res 1999;19:2621–3.

DOI: 10.3310/hta14040 Health Technology Assessment 2010; Vol. 14: No. 4
© 2010 Queen’s Printer and Controller of HMSO. All rights reserved.
207
Less than 100 participants included in the analysis (n = 119)Abd El Gawad IA, Moussa HS, Nasr MI, El Gemae EH, Masooud AM, Ibrahim IK, et al. Comparative study of NMP-22, telomerase, and BTA in the detection of bladder cancer. J Egypt Natl Cancer Inst 2005;17:193–202.
Atsu N, Ekici S, Oge OO, Ergen A, Hascelik G, Ozen H. False-positive results of the NMP22 test due to hematuria. J Urol 2002;167:555–8.
Bakhos R, Shankey TV, Flanigan RC, Fisher S, Wojcik EM. Comparative analysis of DNA flow cytometry and cytology of bladder washings: review of discordant cases. Diagn Cytopathol 2000;22:65–9.
Baltaci S, Suzer O, Ozer G, Beduk Y, Gou O. The efficacy of urinary cytology in the detection of recurrent bladder tumours. Int Urol Nephrol 1996;28:649–53.
Baron A, Mastroeni F, Moore PS, Bonetti F, Orlandini S, Manfrin E, et al. Detection of bladder cancer by semi-automated microsatellite analysis of urine sediment. Adv Clin Pathol 2000;4:19–24.
Bartlett JMS, White A, Stewart CJR, McNicol AM, Underwood MA. Molecular genetic screening for urine detection of bladder cancer. UroOncology 2002;2:81–5.
Bartoletti R, Dal Canto M, Cai T, Piazzini M, Travaglini F, Gavazzi A, et al. Early diagnosis and monitoring of superficial transitional cell carcinoma by microsatellite analysis on urine sediment. Oncol Rep 2005;13:531–7.
Bass RA, Hemstreet GP, III, Honker NA, Hurst RE, Doggett RS. DNA cytometry and cytology by quantitative fluorescence image analysis in symptomatic bladder cancer patients. Int J Cancer 1987;40:698–705.
Bialkowska-Hobrzanska H, Bowles L, Bukala B, Joseph MG, Fletcher R, Razvi H. Comparison of human telomerase reverse transcriptase messenger RNA and telomerase activity as urine markers for diagnosis of bladder carcinoma. Mol Diagn 2000;5:267–77.
Bianco FJ, Jr, Gervasi DC, Tiguert R, Grignon DJ, Pontes JE, Crissman JD, et al. Matrix metalloproteinase-9 expression in bladder washes from bladder cancer patients predicts pathological stage and grade. Clin Cancer Res 1998;4:3011–6.
Bollmann M, Heller H, Bankfalvi A, Griefingholt H, Bollmann R. Quantitative molecular urinary cytology by fluorescence in situ hybridization: a tool for tailoring surveillance of patients with superficial bladder cancer? BJU Int 2005;95:1219–25.
Bowles L, Bialkowska-Hobrzanska H, Bukala B, Nott L, Razvi H. A prospective evaluation of the diagnostic and potential prognostic utility of urinary human telomerase reverse transcriptase mRNA in patients with bladder cancer. Can J Urol 2004;11:2438–44.
Cajulis RS, Haines GK, III, Frias-Hidvegi D, McVary K. Interphase cytogenetics as an adjunct in the cytodiagnosis of urinary bladder carcinoma. A comparative study of cytology, flow cytometry and interphase cytogenetics in bladder washes. Anal Quant Cytol Histol 1994;16:1–10.
Cajulis RS, Haines GK, III, Frias-Hidvegi D, McVary K, Bacus JW. Cytology, flow cytometry, image analysis, and interphase cytogenetics by fluorescence in situ hybridization in the diagnosis of transitional cell carcinoma in bladder washes: a comparative study. Diagn Cytopathol 1995;13:214–23.
Chan MW, Chan LW, Tang NL, Tong JH, Lo KW, Lee TL, et al. Hypermethylation of multiple genes in tumor tissues and voided urine in urinary bladder cancer patients. Clin Cancer Res 2002;8:464–70.
Chang SH, Kim YH, Kim ME. Urinary survivin test compared to the nuclear matrix protein (NMP)-22 test and urine cytology for the diagnosis of bladder cancer. Korean J Urol 2006;47:1041–5.
Chen GL, El Gabry EA, Bagley DH. Surveillance of upper urinary tract transitional cell carcinoma: the role of ureteroscopy, retrograde pyelography, cytology and urinalysis. J Urol 2000;164:1901–4.
Cheng L, Reiter RE, Jin Y, Sharon H, Wieder J, Lane TF, et al. Immunocytochemical analysis of prostate stem cell antigen as adjunct marker for detection of urothelial transitional cell carcinoma in voided urine specimens. J Urol 2003;169:2094–100.
Chow NH, Tzai TS, Cheng HL, Chan SH, Lin JS. Urinary cytodiagnosis: can it have a different prognostic implication than a diagnostic test? Urol Int 1994;53:18–23.
Appendix 11 Biomarker/cytology excluded studies
Appendix 11
208
Constantinou M, Binka-Kowalska A, Borkowska E, Zajac E, Jalmuzna P, Matych J, et al. Application of multiplex FISH, CGH and MSSCP techniques for cytogenetic and molecular analysis of transitional cell carcinoma (TCC) cells in voided urine specimens. J Applied Genet 2006;47:273–5.
Dal Canto M, Bartoletti R, Travaglini F, Piazzini M, Lodovichi G, Rizzo M, et al. Molecular urinary sediment analysis in patients with transitional cell bladder carcinoma. Anticancer Res 2003;23:5095–100.
Dalbagni G, Han W, Zhang ZF, Cordon-Cardo C, Saigo P, Fair WR, et al. Evaluation of the telomeric repeat amplification protocol (TRAP) assay for telomerase as a diagnostic modality in recurrent bladder cancer. Clin Cancer Res 1997;3:1593–8.
Daniely M, Rona R, Kaplan T, Olsfanger S, Elboim L, Zilberstien Y, et al. Combined analysis of morphology and fluorescence in situ hybridization significantly increases accuracy of bladder cancer detection in voided urine samples. Urology 2005;66:1354–9.
Desgrippes A, Izadifar V, Assailly J, Fontaine E, Beurton D. Diagnosis and prediction of recurrence and progression in superficial bladder cancers with DNA image cytometry and urinary cytology. BJU Int 2000;85:434–6.
D’Hallewin M-A, Baert L. Initial evaluation of the bladder tumor antigen test in superficial bladder cancer. J Urol 1996;155:475–6.
Di Carlo A, Terracciano D, Mariano A, Macchia V. Urinary gelatinase activities (matrix metalloproteinases 2 and 9) in human bladder tumors. Oncol Rep 2006;15:1321–6.
Feil G, Zumbragel A, Paulgen-Nelde HJ, Hennenlotter J, Maurer S, Krause S, et al. Accuracy of the ImmunoCyt assay in the diagnosis of transitional cell carcinoma of the urinary bladder. Anticancer Res 2003;23:963–7.
Fornari D, Steven K, Hansen AB, Vibits H, Jepsen JV, Poulsen AL, et al. Microsatellite analysis of urine sediment versus urine cytology for diagnosing transitional cell tumors of the urinary bladder. APMIS 2004;112:148–52.
Frau DV, Usai P, Dettori T, Caria P, De Lisa A, Vanni R. Fluorescence in situ hybridization patterns in newly diagnosed superficial bladder lesions and corresponding bladder washings. Cancer Genet Cytogenet 2006;169:21–6.
Friedrich MG, Hellstern A, Toma MI, Hammerer P, Huland H. Are false-positive urine markers for the detection of bladder carcinoma really wrong or do they predict tumor recurrence? Eur Urol 2003;43:146–50.
Frigerio S, Padberg BC, Strebel RT, Lenggenhager DM, Messthaler A, Abdou MT, et al. Improved detection of
bladder carcinoma cells in voided urine by standardized microsatellite analysis. Int J Cancer 2007;121:329–38.
Gibanel R, Ribal MJ, Filella X, Ballesta AM, Molina R, Alcaraz A, et al. BTA TRAK urine test increases the efficacy of cytology in the diagnosis of low-grade transitional cell carcinoma of the bladder. Anticancer Res 2002;22:1157–60.
Gilbert SM, Veltri RW, Sawczuk A, Shabsigh A, Knowles DR, Bright S, et al. Evaluation of DD23 as a marker for detection of recurrent transitional cell carcinoma of the bladder in patients with a history of bladder cancer. Urology 2003;61:539–43.
Godekmerdan A, Yahsi S, Semercioz A, Ilhan F, Akpolat N, Yekeler H. Determination of nuclear matrix protein 22 levels in cystitis, urothelial dysplasia and urothelial carcinoma. Turk J Med Sci 2006;36:93–6.
Halling KC, King W, Sokolova IA, Karnes RJ, Meyer RG, Powell EL, et al. A comparison of BTA stat, hemoglobin dipstick, telomerase and Vysis UroVysion assays for the detection of urothelial carcinoma in urine. J Urol 2002;167:2001–6.
Hautmann S, Toma M, Lorenzo Gomez MF, Friedrich MG, Jaekel T, Michl U, et al. Immunocyt and the HA-HAase urine tests for the detection of bladder cancer: a side-by-side comparison. Eur Urol 2004;46:466–71.
Hoshi S, Takahashi T, Satoh M, Numahata K, Suzuki K-I, Ohyama C, et al. Telomerase activity. Simplification of assay and detection in bladder tumor and urinary exfoliated cells. Urol Oncol 2000;5:25–30.
Hwang EC, Park SH, Jung SI, Kwon DD, Park K, Ryu SB, et al. Usefulness of liquid-based preparation in urine cytology. Intl J Urol 2007;14:626–9.
Ianari A, Sternberg CN, Rossetti A, Van Rijn A, Deidda A, Giannarelli D, et al. Results of Bard BTA test in monitoring patients with a history of transitional cell cancer of the bladder. Urology 1997;49:786–9.
Inoue T, Nasu Y, Tsushima T, Miyaji Y, Murakami T, Kumon H. Chromosomal numerical aberrations of exfoliated cells in the urine detected by fluorescence in situ hybridization: clinical implication for the detection of bladder cancer. Urol Res 2000;28:57–61.
Ishiwata S, Takahashi S, Homma Y, Tanaka Y, Kameyama S, Hosaka Y, et al. Noninvasive detection and prediction of bladder cancer by fluorescence in situ hybridization analysis of exfoliated urothelial cells in voided urine. Urology 2001;57:811–15.
Kang JU, Koo SH, Jeong TE, Kwon KC, Park JW, Jeon CH. Multitarget fluorescence in situ hybridization and melanoma antigen genes analysis in primary bladder carcinoma. Cancer Genet Cytogenet 2006;164:32–8.
DOI: 10.3310/hta14040 Health Technology Assessment 2010; Vol. 14: No. 4
© 2010 Queen’s Printer and Controller of HMSO. All rights reserved.
209
Katz RL, Sinkre PA, Zhang HH, Kidd L, Johnston D. Clinical significance of negative and equivocal urinary bladder cytology alone and in combination with DNA image analysis and cystoscopy. Cancer 1997;81:354–64.
Kibar Y, Goktas S, Kilic S, Yaman H, Onguru O, Peker AF. Prognostic value of cytology, nuclear matrix protein 22 (NMP22) test, and urinary bladder cancer II (UBC II) test in early recurrent transitional cell carcinoma of the bladder. Ann Clin Lab Sci 2006;36:31–8.
Kinoshita H, Ogawa O, Kakehi Y, Mishina M, Mitsumori K, Itoh N, et al. Detection of telomerase activity in exfoliated cells in urine from patients with bladder cancer. J Natl Cancer Inst 1997;89:724–30.
Kipp BR, Karnes RJ, Brankley SM, Harwood AR, Pankratz VS, Sebo TJ, et al. Monitoring intravesical therapy for superficial bladder cancer using fluorescence in situ hybridization. J Urol 2005;173:401–4.
Kirollos MM, McDermott S, Bradbrook RA. The performance characteristics of the bladder tumour antigen test. Br J Urol 1997;80:30–4.
Konety BR, Metro MJ, Melham MF, Salup RR. Diagnostic value of voided urine and bladder barbotage cytology in detecting transitional cell carcinoma of the urinary tract. Urol Int 1999;62:26–30.
Krause FS, Rauch A, Schrott KM, Engehausen DG. Clinical decisions for treatment of different staged bladder cancer based on multitarget fluorescence in situ hybridization assays? World J Urol 2006;24:418–22.
Krupski T, Moskaluk C, Boyd JC, Theodorescu D. A prospective pilot evaluation of urinary and immunohistochemical markers as predictors of clinical stage of urothelial carcinoma of the bladder. BJU Int 2000;85:1027–32.
Kumar NU, Dey P, Mondal AK, Singh SK, Vohra H. DNA flow cytometry and bladder irrigation cytology in detection of bladder carcinoma. Diagn Cytopathol 2001;24:153–6.
Landman J, Chang Y, Kavaler E, Droller MJ, Liu BC. Sensitivity and specificity of NMP-22, telomerase, and BTA in the detection of human bladder cancer. Urology 1998;52:398–402.
Larsson PC, Beheshti B, Sampson HA, Jewett MA, Shipman R. Allelic deletion fingerprinting of urine cell sediments in bladder cancer. Mol Diagn 2001;6:181–8.
Laudadio J, Keane TE, Reeves HM, Savage SJ, Hoda RS, Lage JM, et al. Fluorescence in situ hybridization for detecting transitional cell carcinoma: implications for clinical practice. BJU Int 2005;96:1280–5.
Lee DH, Yang SC, Hong SJ, Chung BH, Kim IY. Telomerase: a potential marker of bladder transitional
cell carcinoma in bladder washes. Clin Cancer Res 1998;4:535–8.
Lekili M, Sener E, Demir MA, Temelta G, Muezzinolu T, Buyuksu C. Comparison of the nuclear matrix protein 22 with voided urine cytology in the diagnosis of transitional cell carcinoma of the bladder. Urol Res 2004;32:124–8.
Lubbe L, Nowack R, May M, Ullmann K, Gunia S, Kaufmann O, et al. FISH – a new noninvasive method for the diagnosis of urinary bladder carcinomas. Clin Lab 2004;50:395–402.
Mack D, Frick J. Diagnostic problems of urine cytology on initial follow-up after intravesical immunotherapy with Calmette-Guérin bacillus for superficial bladder cancer. Urol Int 1994;52:204–7.
Mao L, Schoenberg MP, Scicchitano M, Erozan YS, Merlo A, Schwab D, Sidransky D, et al. Molecular detection of primary bladder cancer by microsatellite analysis. Science 1996;271:659–62.
Marin-Aguilera M, Mengual L, Ribal MJ, Burset M, Arce Y, Ars E, et al. Utility of a multiprobe fluorescence in situ hybridization assay in the detection of superficial urothelial bladder cancer. Cancer Genet Cytogenet 2007;173:131–5.
Mattioli S, Seregni E, Caperna L, Botti C, Savelli G, Bombardieri E. BTA-TRAK combined with urinary cytology is a reliable urinary indicator of recurrent transitional cell carcinoma (TCC) of the bladder. Int J Biol Markers 2000;15:219–25.
Meloni AM, Peier AM, Haddad FS, Powell IJ, Block AW, Huben RP, et al. A new approach in the diagnosis and follow-up of bladder cancer. FISH analysis of urine, bladder washings, and tumors. Cancer Genet Cytogenet 1993;71:105–18.
Menendez V, Filella X, Alcover JA, Molina R, Mallafre JM, Ballesta AM, et al. Usefulness of urinary nuclear matrix protein 22 (NMP22) as a marker for transitional cell carcinoma of the bladder. Anticancer Res 2000;20:1169–72.
Menendez V, Fernandez-Suarez A, Galan JA, Perez M, Garcia-Lopez F. Diagnosis of bladder cancer by analysis of urinary fibronectin. Urology 2005;65:284–9.
Mezzelani A, Dagrada G, Alasio L, Sozzi G, Pilotti S. Detection of bladder cancer by multitarget multicolour FISH: comparative analysis on archival cytology and paraffin-embedded tissue. Cytopathology 2002;13:317–25.
Mian C, Lodde M, Comploj E, Palermo S, Mian M, Maier K, et al. The value of the ImmunoCyt/uCyt+ test in the detection and follow-up of carcinoma in situ of the urinary bladder. Anticancer Res 2005;25:3641–4.
Appendix 11
210
Minimo C, Tawfiek ER, Bagley DH, McCue PA, Bibbo M. Grading of upper urinary tract transitional cell carcinoma by computed DNA content and p53 expression. Urology 1997;50:869–74.
Misra V, Gupta SC, Tandon SP, Gupta AK, Sircar S. Cytohistological study of urinary bladder neoplasms. Ind J Pathol Microbiol 2000;43:303–9.
Mora LB, Nicosia SV, Pow-Sang JM, Ku NK, Diaz JI, Lockhart J, et al. Ancillary techniques in the followup of transitional cell carcinoma: a comparison of cytology, histology and deoxyribonucleic acid image analysis cytometry in 91 patients. J Urol 1996;156:49–55.
Mungan NA, Kulacoglu S, Basar M, Sahin M, Witjes JA. Can sensitivity of voided urinary cytology or bladder wash cytology be improved by the use of different urinary portions? Urol Int 1999;62:209–12.
Oge O, Atsu N, Sahin A, Ozen H. Comparison of BTA stat and NMP22 tests in the detection of bladder cancer. Scand J Urol Nephrol 2000;34:349–51.
Paez A, Coba JM, Murillo N, Fernandez P, de la Cal MA, Lujan M, et al. Reliability of the routine cytological diagnosis in bladder cancer. Eur Urol 1999;35:228–32.
Pajor G, Sule N, Alpar D, Kajtar B, Kneif M, Bollmann D, et al. Increased efficiency of detecting genetically aberrant cells by UroVysion test on voided urine specimens using automated immunophenotypical preselection of uroepithelial cells. Cytometry A 2008;73:259–65.
Panani AD, Kozirakis D, Anastasiou J, Babanaraki A, Malovrouvas D, Roussos C. Is aneusomy of chromosome 9 alone a valid biomarker for urinary bladder cancer screening? Anticancer Res 2006;26:1161–5.
Paoluzzi M, Cuttano MG, Mugnaini P, Salsano F, Giannotti P. Urinary dosage of nuclear matrix protein 22 (NMP22) like biologic marker of transitional cell carcinoma (TCC): a study on patients with hematuria. Arch Ital Urol Androl 1999;71:13–18.
Placer J, Espinet B, Salido M, Sole F, Gelabert-Mas A. Clinical utility of a multiprobe FISH assay in voided urine specimens for the detection of bladder cancer and its recurrences, compared with urinary cytology. Eur Urol 2002;42:547–52.
Planz B, Striepecke E, Jakse G, Bocking A. Use of Lewis X antigen and deoxyribonucleic acid image cytometry to increase sensitivity of urinary cytology in transitional cell carcinoma of the bladder. J Urol 1998;159:384–7.
Planz B, Synek C, Robben J, Bocking A, Marberger M. Diagnostic accuracy of DNA image cytometry and urinary cytology with cells from voided urine in the detection of bladder cancer. Urology 2000;56:782–6.
Planz B, Synek C, Deix T, Bocking A, Marberger M. Diagnosis of bladder cancer with urinary cytology, immunocytology and DNA-image-cytometry. Anal Cell Pathol 2001;22:103–9.
Pu YS, Tsai TC, Hsieh TS, Huang HH, Kuo SH, Hsueh WC. Role of urinary cytology and urinary deoxyribonucleic acid flow cytometry in the diagnosis of bladder cancer. J Formos Med Assoc 1994;93:216–21.
Raab SS, Lenel JC, Cohen MB. Low grade transitional cell carcinoma of the bladder. Cytologic diagnosis by key features as identified by logistic regression analysis. Cancer 1994;74:1621–6.
Raab SS, Slagel DD, Jensen CS, Teague MW, Savell VH, Ozkutlu D, et al. Transitional cell carcinoma: cytologic criteria to improve diagnostic accuracy. Modern Pathol 1996;9:225–32.
Raica M, Zylis D, Cimpean AM. Cytokeratin 20, 34betaE12 and overexpression of HER-2/neu in urine cytology as predictors of recurrences in superficial urothelial carcinoma. Romanian J Morphol Embryol 2005;46:11–15.
Rieger-Christ KM, Mourtzinos A, Lee PJ, Zagha RM, Cain J, Silverman M, et al. Identification of fibroblast growth factor receptor 3 mutations in urine sediment DNA samples complements cytology in bladder tumor detection. Cancer 2003;98:737–44.
Sadek S, Soloway MS, Hook S, Civantos F. The value of upper tract cytology after transurethral resection of bladder tumor in patients with bladder transitional cell cancer. J Urol 1999;161:77–9.
Sagerman PM, Saigo PE, Sheinfeld J, Charitonowics E, Cordon-Cardo C. Enhanced detection of bladder cancer in urine cytology with Lewis X, M344 and 19A211 antigens. Acta Cytol 1994;38:517–23.
Sanchez-Carbayo M, Urrutia M, Romani R, Herrero M, Gonzalez de Buitrago JM, Navajo JA. Serial urinary IL-2, IL-6, IL-8, TNFalpha, UBC, CYFRA 21–1 and NMP22 during follow-up of patients with bladder cancer receiving intravesical BCG. Anticancer Res 2001;21:3041–7.
Sawczuk IS, Bagiella E, Sawczuk AT, Yun EJ. Clinical application of NMP22 in the management of transitional cell carcinoma of the bladder. Cancer Detect Prevent 2000;24:364–8.
SchmittConrad M, Fornara P, Bohle A, Knipper A, Jocham D. Clinical experience with immunocytology using monoclonal antibody 486 P (Medaquic(R)) in detection of bladder cancer. Aktuelle Urol 1997;28:29–33.
Selli C, Travaglini F, Dal Canto M, Piazzini M, Frontera S, Bartoletti R. Microsatellite analysis in the detection of
DOI: 10.3310/hta14040 Health Technology Assessment 2010; Vol. 14: No. 4
© 2010 Queen’s Printer and Controller of HMSO. All rights reserved.
211
bladder carcinoma: a preliminary report. Acta Urol Ital 1999;13:117–20.
Seripa D, Parrella P, Gallucci M, Gravina C, Papa S, Fortunato P, et al. Sensitive detection of transitional cell carcinoma of the bladder by microsatellite analysis of cells exfoliated in urine. Int J Cancer 2001;95:364–9.
Serretta V, Vasile P, Gange E, Lino E, Esposito E, Menozzi I. The NMP22 (nuclear matrix protein) test for surveillance of superficial bladder transitional cell carcinoma. Experience in 84 patients. Acta Urol Ital 1998;12:201–3.
Sharkey FE, Sarosdy MF. The significance of central pathology review in clinical studies of transitional cell carcinoma in situ. J Urol 1997;157:68–71.
Soloway MS, Briggman V, Carpinito GA, Chodak GW, Church PA, Lamm DL, et al. Use of a new tumor marker, urinary NMP22, in the detection of occult or rapidly recurring transitional cell carcinoma of the urinary tract following surgical treatment. J Urol 1996;156:363–7.
Song Z, Sun X, Wu D. Significance of flow cytometry in the diagnosis and treatment of bladder tumors. Chin Med Sci J 1995;10:38–41.
Su CK, Yang CR, Horng YY, Kao YL, Ho HC, Ou YC, et al. NMP22 in transitional cell carcinoma of the urinary bladder. J Chin Med Assoc 2003;66:294–8.
Sumi S, Arai K, Kitahara S, Yoshida KI. Preliminary report of the clinical performance of a new urinary bladder cancer antigen test: comparison to voided urine cytology in the detection of transitional cell carcinoma of the bladder. Clin Chim Acta 2000;296:111–20.
Takeuchi Y, Sawada Y, Yabuki D, Masuda E, Satou D, Kuroda K, et al. Clinical study of urine NMP 22 (nuclear matrix protein 22) as a tumor marker in urinary epithelial cancer. Aktuelle Urol 2003;34:265–6.
Tang CS, Tang CM, Lau YY, Kung IT. Alcoholic carbowax prefixation and formal alcohol fixation. A new technique for urine cytology. Acta Cytol 1997;41:1183–8.
Trott PA, Edwards L. Comparison of bladder washings and urine cytology in the diagnosis of bladder cancer. J Urol 1973;110:664–6.
van Rhijn BW, Lurkin I, Kirkels WJ, van der Kwast TH, Zwarthoff EC. Microsatellite analysis – DNA test in urine competes with cystoscopy in follow-up of superficial bladder carcinoma: a phase II trial. Cancer 2001;92:768–75.
van Rhijn BW, Smit M, van Geenen D, Wijnmaalen A, Kirkels WJ, van der Kwast TH, et al. Surveillance with microsatellite analysis of urine in bladder cancer patients treated by radiotherapy. Eur Urol 2003;43:369–73.
Varella-Garcia M, Akduman B, Sunpaweravong P, Di Maria MV, Crawford ED. The UroVysion fluorescence in situ hybridization assay is an effective tool for monitoring recurrence of bladder cancer. Urol Oncol 2004;22:16–19.
Veeramachaneni R, Nordberg ML, Shi R, Herrera GA, Turbat-Herrera EA. Evaluation of fluorescence in situ hybridization as an ancillary tool to urine cytology in diagnosing urothelial carcinoma. Diagn Cytopathol 2003;28:301–7.
Vriesema JL, Atsma F, Kiemeney LA, Peelen WP, Witjes JA, Schalken JA. Diagnostic efficacy of the ImmunoCyt test to detect superficial bladder cancer recurrence. Urology 2001;58:367–71.
Walsh IK, Keane PF, Ishak LM, Flessland KA. The BTA stat test: a tumor marker for the detection of upper tract transitional cell carcinoma. Urology 2001;58:532–5.
Weikert S, Christoph F, Schrader M, Krause H, Miller K, Muller M. Quantitative analysis of survivin mRNA expression in urine and tumor tissue of bladder cancer patients and its potential relevance for disease detection and prognosis. Int J Cancer 2005;116:100–4.
Werner W, Ebert W, Wunderlich H, Schubert J, Junker K. Fluorescence in situ hybridization in the diagnosis of transitional cell carcinoma. Onkologie 1999;22:216–20.
Whisnant RE, Bastacky SI, Ohori NP. Cytologic diagnosis of low-grade papillary urothelial neoplasms (low malignant potential and low-grade carcinoma) in the context of the 1998 WHO/ISUP classification. Diagn Cytopathol 2003;28:186–90.
Witjes JA, van der Poel HG, van Balken MR, Debruyne FM, Schalken JA. Urinary NMP22 and karyometry in the diagnosis and follow-up of patients with superficial bladder cancer. Eur Urol 1998;33:387–91.
Wolman SR, Goldman B, Slovak ML, Tangen C, Persons DL, Wood D. Aneusomy for detection of bladder cancer recurrence: a Southwest Oncology Group study. Cancer Genet Cytogenet 2007;176:22–7.
Xu K, Tam PC, Hou S, Wang X, Bai W. The role of nuclear matrix protein 22 combined with bladder tumor antigen stat test in surveillance of recurring bladder cancer. Chin Med J (Engl) 2002;115:1736–8.
Yang SC, Lee DH, Hong SJ, Chung BH, Kim IY. Telomerase activity: a potential marker of bladder transitional cell carcinoma in bladder washes. Yonsei Med J 1997;38:155–9.
Yokota K, Kanda K, Inoue Y, Kanayama H, Kagawa S. Semi-quantitative analysis of telomerase activity in exfoliated human urothelial cells and bladder transitional cell carcinoma. Br J Urol 1998;82:727–32.
Appendix 11
212
Zancan M, Franceschini R, Mimmo C, Vianello M, Di Tonno F, Mazzariol C, et al. Free DNA in urine: a new marker for bladder cancer? Preliminary data. Int J Biol Markers 2005;20:134–6.
Zargar M, Soleimani M, Moslemi M. Comparative evaluation of urinary bladder cancer antigen and urine cytology in the diagnosis of bladder cancer. Urol J 2005;2:137–40.
Zhang FF, Arber DA, Wilson TG, Kawachi MH, Slovak ML. Toward the validation of aneusomy detection by fluorescence in situ hybridization in bladder cancer: comparative analysis with cytology, cytogenetics, and clinical features predicts recurrence and defines clinical testing limitations. Clin Cancer Res 1997;3:2317–28.
Zhang J, Zheng S, Fan Z, Gao Y, Di X, Wang D, et al. A comparison between microsatellite analysis and cytology of urine for the detection of bladder cancer. Cancer Lett 2001;172:55–8.
Ziaee SA, Moula SJ, Hosseini Moghaddam SM, Eskandar-Shiri D. Diagnosis of bladder cancer by urine survivin, an inhibitor of apoptosis: a preliminary report. Urol J 2006;3:150–3.
Required test(s) not reported (n = 79)The use of the bladder-tumour associated analyte test to determine the type of cystoscopy in the follow-up of patients with bladder cancer. The United Kingdom and Eire Bladder Tumour Antigen Study Group. Br J Urol 1997;79:362–6.
Akao T, Kakehi Y, Wu X-X, Kinoshita H, Takahashi T, Ogawa O, et al. Semi-quantitative analysis of telomerase activity of exfoliated cells in urine of patients with urothelial cancers: causative factors affecting sensitivity and specificity. Urol Oncol 1998;3:118–24.
Attallah AM, Sakr HA, Ismail H, Abdel-Hady E, El Dosoky I. An office-based immunodiagnostic assay for detecting urinary nuclear matrix protein 52 in patients with bladder cancer. BJU Int 2005;96:334–9.
Babjuk M, Kostirova M, Mudra K, Pecher S, Smolova H, Pecen L, et al. Qualitative and quantitative detection of urinary human complement factor H-related protein (BTA stat and BTA TRAK) and fragments of cytokeratins 8, 18 (UBC rapid and UBC IRMA) as markers for transitional cell carcinoma of the bladder. Eur Urol 2002;41:34–9.
Barlandas-Rendon E, Muller MM, Garcia-Latorre E, Heinschink A. Comparison of urine cell characteristics by flow cytometry and cytology in patients suspected of having bladder cancer. Clin Chem Lab Med 2002;40:817–23.
Bian W, Xu Z. Combined assay of CYFRA21–1, telomerase and vascular endothelial growth factor in the
detection of bladder transitional cell carcinoma. Int J Urol 2007;14:108–11.
Billerey C, Lamy B, Bittard H, Rozan S, Carbillet JP. Flow cytometry versus urinary cytology in the diagnosis and follow-up of bladder tumors: critical review of a 5-year experience. World J Urol 1993;11:156–60.
Bonner RB, Hemstreet GP, III, Fradet Y, Rao JY, Min KW, Hurst RE. Bladder cancer risk assessment with quantitative fluorescence image analysis of tumor markers in exfoliated bladder cells. Cancer 1993;72:2461–9.
Casella R, Shariat SF, Monoski MA, Lerner SP. Urinary levels of urokinase-type plasminogen activator and its receptor in the detection of bladder carcinoma. Cancer 2002;95:2494–9.
Chautard D, Daver A, Bocquillon V, Verriele V, Colls P, Bertrand G, et al. Comparison of the Bard Trak test with voided urine cytology in the diagnosis and follow-up of bladder tumors. Eur Urol 2000;38:686–90.
Chong TW, Cheng C. The role of the bladder tumour antigen test in the management of gross haematuria. Singapore Med J 1999;40:578–80.
Eissa S, Kenawy G, Swellam M, El Fadle AA, Abd El-Aal AA, El Ahmady O. Comparison of cytokeratin 20 RNA and angiogenin in voided urine samples as diagnostic tools for bladder carcinoma. Clin Biochem 2004;37:803–10.
Eissa S, Labib RA, Mourad MS, Kamel K, El Ahmady O. Comparison of telomerase activity and matrix metalloproteinase-9 in voided urine and bladder wash samples as a useful diagnostic tool for bladder cancer. Eur Urol 2003;44:687–94.
Eissa S, Kassim SK, Labib RA, El Khouly IM, Ghaffer TM, Sadek M, et al. Detection of bladder carcinoma by combined testing of urine for hyaluronidase and cytokeratin 20 RNAs. Cancer 2005;103:1356–62.
Eissa S, Swellam M, el Mosallamy H, Mourad MS, Hamdy N, Kamel K, et al. Diagnostic value of urinary molecular markers in bladder cancer. Anticancer Res 2003;23:4347–55.
Ellis WJ, Blumenstein BA, Ishak LM, Enfield DL. Clinical evaluation of the BTA TRAK assay and comparison to voided urine cytology and the Bard BTA test in patients with recurrent bladder tumors. The Multi Center Study Group. Urology 1997;50:882–7.
Fernandez-Gomez J, Rodriguez-Martinez JJ, Barmadah SE, Garcia RJ, Allende DM, Jalon A, et al. Urinary CYFRA 21.1 is not a useful marker for the detection of recurrences in the follow-up of superficial bladder cancer. Eur Urol 2007;51:1267–74.
DOI: 10.3310/hta14040 Health Technology Assessment 2010; Vol. 14: No. 4
© 2010 Queen’s Printer and Controller of HMSO. All rights reserved.
213
Fitzgerald JM, Ramchurren N, Rieger K, Levesque P, Silverman M, Libertino JA, et al. Identification of H-ras mutations in urine sediments complements cytology in the detection of bladder tumors. J Natl Cancer Inst 1995;87:129–33.
Fracasso ME, Franceschetti P, Doria D, Talamini G, Bonetti F. DNA breaks as measured by the alkaline comet assay in exfoliated cells as compared to voided urine cytology in the diagnosis of bladder cancer: a study of 105 subjects. Mutat Res 2004;564:57–64.
Frick J, Aulitzky W, Fuchs D. The value of urinary neopterin as an immunological parameter in patients with malignant tumors of the genitourinary tract. Urol Int 1985;40:155–9.
Golijanin D, Shapiro A, Pode D. Immunostaining of cytokeratin 20 in cells from voided urine for detection of bladder cancer. J Urol 2000;164:1922–5.
Gourlay W, Chan V, Gilks CB. Screening for urothelial malignancies by cytologic analysis and flow cytometry in a community urologic practice: a prospective study. Mod Pathol 1995;8:394–7.
Gregoire M, Fradet Y, Meyer F, Tetu B, Bois R, Bedard G, et al. Diagnostic accuracy of urinary cytology, and deoxyribonucleic acid flow cytometry and cytology on bladder washings during followup for bladder tumors. J Urol 1997;157:1660–4.
Gutierrez Banos JL, Henar Rebollo RM, Antolin Juarez FM, Garcia BM. Usefulness of the BTA STAT test for the diagnosis of bladder cancer. Urology 2001;57:685–9.
Guy L, Savareux L, Molinie V, Botto H, Boiteux J-P, Lebret T. Should bladder biopsies be performed routinely after bacillus Calmette-Guérin treatment for high-risk superficial transitional cell cancer of the bladder? Eur Urol 2006;50:516–20.
Hakenberg OW, Fuessel S, Richter K, Froehner M, Oehlschlaeger S, Rathert P, et al. Qualitative and quantitative assessment of urinary cytokeratin 8 and 18 fragments compared with voided urine cytology in diagnosis of bladder carcinoma. Urology 2004;64:1121–6.
Heino A, Aaltomaa S, Ala-Opas M. BTA test is superior to voided urine cytology in detecting malignant bladder tumours. Ann Chir Gynaecol 1999;88:304–7.
Jayachandran S, Unni Mooppan MM, Wax SH, Kim H. The value of urinary fibrin/fibrinogen degradation products as tumor markers in urothelial carcinoma. J Urol 1984;132:21–3.
Johnston B, Morales A, Emerson L, Lundie M. Rapid detection of bladder cancer: a comparative study of point of care tests. J Urol 1997;158:2098–101.
Kavaler E, Landman J, Chang Y, Droller MJ, Liu BC. Detecting human bladder carcinoma cells in voided urine samples by assaying for the presence of telomerase activity. Cancer 1998;82:708–14.
Khalbuss W, Goodison S. Immunohistochemical detection of hTERT in urothelial lesions: a potential adjunct to urine cytology. Cytojournal 2006;3:18.
Leyh H, Mazeman E. Bard BTA test compared with voided urine cytology in the diagnosis of recurrent bladder cancer. Eur Urol 1997;32:425–8.
Leyh H, Hall R, Mazeman E, Blumenstein BA. Comparison of the Bard BTA test with voided urine and bladder wash cytology in the diagnosis and management of cancer of the bladder. Urology 1997;50:49–53.
Leyh H, Marberger M, Conort P, Sternberg C, Pansadoro V, Pagano F, et al. Comparison of the BTA stat test with voided urine cytology and bladder wash cytology in the diagnosis and monitoring of bladder cancer. Eur Urol 1999;35:52–6.
Liedl T. Flow cytometric DNA/cytokeratin analysis of bladder lavage: methodical aspects and clinical implications. Urol Int 1995;54:22–47.
Liu J, Katz R, Shin HJ, Johnston DA, Zhang HZ, Caraway NP. Use of mailed urine specimens in diagnosing urothelial carcinoma by cytology and DNA image analysis. Acta Cytol 2005;49:157–62.
Maier U, Simak R, Neuhold N. The clinical-value of urinary cytology – 12 years of experience with 615 patients. J Clin Pathol 1995;48:314–7.
Melissourgos N, Kastrinakis NG, Davilas I, Foukas P, Farmakis A, Lykourinas M. Detection of human telomerase reverse transcriptase mRNA in urine of patients with bladder cancer: evaluation of an emerging tumor marker. Urology 2003;62:362–7.
Melissourgos ND, Kastrinakis NG, Skolarikos A, Pappa M, Vassilakis G, Gorgoulis VG, et al. Cytokeratin-20 immunocytology in voided urine exhibits greater sensitivity and reliability than standard cytology in the diagnosis of transitional cell carcinoma of the bladder. Urology 2005;66:536–41.
Miyake H, Hara I, Gohji K, Yamanaka K, Arakawa S, Kamidono S. Urinary cytology and competitive reverse transcriptase-polymerase chain reaction analysis of a specific CD44 variant to detect and monitor bladder cancer. J Urol 1998;160:2004–8.
Miyanaga N, Akaza H, Kameyama S, Hachiya T, Ozono S, Kuroda M, et al. Significance of the BTA test in bladder cancer: a multicenter trial. BTA Study Group Japan. Int J Urol 1997;4:557–60.

Appendix 11
214
Morsi MI, Youssef AI, Hassouna ME, El Sedafi AS, Ghazal AA, Zaher ER. Telomerase activity, cytokeratin 20 and cytokeratin 19 in urine cells of bladder cancer patients. J Egypt Natl Canc Inst 2006;18:82–92.
Nasuti JF, Gomella LG, Ismial M, Bibbo M. Utility of the BTA stat test kit for bladder cancer screening. Diagn Cytopathol 1999;21:27–9.
Neves M, Ciofu C, Larousserie F, Fleury J, Sibony M, Flahault A, et al. Prospective evaluation of genetic abnormalities and telomerase expression in exfoliated urinary cells for bladder cancer detection. J Urol 2002;167:1276–81.
Pode D, Shapiro A, Wald M, Nativ O, Laufer M, Kaver I. Noninvasive detection of bladder cancer with the BTA stat test. J Urol 1999;161:443–6.
Pogacnik A, Us-Krasovec M. Cytomorphology and flow cytometry in monitoring patients treated for bladder cancer; preliminary results. Radiolo Oncol 1997;31:155–7.
Priolo G, Gontero P, Martinasso G, Mengozzi G, Formiconi A, Pelucelli G, et al. Bladder tumor antigen assay as compared to voided urine cytology in the diagnosis of bladder cancer. Clin Chim Acta 2001;305:47–53.
Quek P, Chin CM, Lim PH. The role of BTA stat in clinical practice. Ann Acad Med Singapore 2002;31:212–6.
Radkhah K, Nowroozi MR, Jabalameli P. Sensitivity and specificity of urinary bladder cancer antigen for diagnosis of bladder tumor; a comparative study with urinary cytology. Acta Medica Iranica 2005;43:169–72.
Raitanen MP, Marttila T, Kaasinen E, Rintala E, Aine R, Tammela TL. Sensitivity of human complement factor H related protein (BTA stat) test and voided urine cytology in the diagnosis of bladder cancer. J Urol 2000;163:1689–92.
Raitanen MP, Hellstrom P, Marttila T, Korhonen H, Talja M, Ervasti J, et al. Effect of intravesical instillations on the human complement factor H related protein (BTA stat) test. Eur Urol 2001;40:422–6.
Raitanen MP, Kaasinen E, Lukkarinen O, Kauppinen R, Viitanen J, Liukkonen T, et al. Analysis of false-positive BTA STAT test results in patients followed up for bladder cancer. Urology 2001;57:680–4.
Raitanen MP, Leppilahti M, Tuhkanen K, Forssel T, Nylund P, Tammela T, et al. Routine follow-up cystoscopy in detection of recurrence in patients being monitored for bladder cancer. Ann Chir Gynaecol 2001;90:261–5.
Raitanen MP, Marttila T, Nurmi M, Ala-Opas M, Nieminen P, Aine R, et al. Human complement factor H related protein test for monitoring bladder cancer. J Urol 2001;165:374–7.
Saika T, Tsushima T, Nasu Y, Kumon H, Ohmori H. Epidermal growth factor in urine from patients with bladder cancer. Urol Res 2000;28:230–4.
Sanchez-Carbayo M, Urrutia M, Gonzalez de Buitrago JM, Navajo JA. Evaluation of two new urinary tumor markers: bladder tumor fibronectin and cytokeratin 18 for the diagnosis of bladder cancer. Clin Cancer Res 2000;6:3585–94.
Sanchini MA, Gunelli R, Nanni O, Bravaccini S, Fabbri C, Sermasi A, et al. Relevance of urine telomerase in the diagnosis of bladder cancer. JAMA 2005;294:2052–6.
Sarosdy MF, deVere White RW, Soloway MS, Sheinfeld J, Hudson MA, Schellhammer PF, et al. Results of a multicenter trial using the BTA test to monitor for and diagnose recurrent bladder cancer. J Urol 1995;154:379–83.
Sarosdy MF, Hudson MA, Ellis WJ, Soloway MS, deVere WR, Sheinfeld J, et al. Improved detection of recurrent bladder cancer using the Bard BTA stat test. Urology 1997;50:349–53.
Sawczuk IS, Pickens CL, Vasa UR, Ralph DA, Norris KA, Miller MC, et al. DD23 Biomarker: a prospective clinical assessment in routine urinary cytology specimens from patients being monitored for TCC. Urol Oncol 2002;7:185–90.
Schamhart DH, de Reijke TM, van der Poel HG, Witjes JA, de Boer EC, Kurth K, et al. The Bard BTA test: its mode of action, sensitivity and specificity, compared to cytology of voided urine, in the diagnosis of superficial bladder cancer. Eur Urol 1998;34:99–106.
Schmetter BS, Habicht KK, Lamm DL, Morales A, Bander NH, Grossman HB, et al. A multicenter trial evaluation of the fibrin/fibrinogen degradation products test for detection and monitoring of bladder cancer. J Urol 1997;158:801–5.
Schroeder GL, Lorenzo-Gomez MF, Hautmann SH, Friedrich MG, Ekici S, Huland H, et al. A side by side comparison of cytology and biomarkers for bladder cancer detection. J Urol 2004;172:1123–6.
Shariat SF, Herman MP, Casella R, Lotan Y, Karam JA, Stenman UH. Urinary levels of tumor-associated trypsin inhibitor (TATI) in the detection of transitional cell carcinoma of the urinary bladder. Eur Urol 2005;48:424–31.
Shariat SF, Matsumoto K, Casella R, Jian W, Lerner SP. Urinary levels of soluble e-cadherin in the detection of transitional cell carcinoma of the urinary bladder. Eur Urol 2005;48:69–76.
Slaton JW, Dinney CPN, Veltri RW, Miller MC, Liebert M, O’Dowd et al. Deoxyribonucleic acid ploidy enhances
DOI: 10.3310/hta14040 Health Technology Assessment 2010; Vol. 14: No. 4
© 2010 Queen’s Printer and Controller of HMSO. All rights reserved.
215
the cytological prediction of recurrent transitional cell carcinoma of the bladder. J Urol 1997;158:806–11.
Sole M, Alos L, Mallofre C, Romero JA, Muntane J, Cardesa A. Bladder wash flow cytometry in transitional cell carcinoma: useful or misleading? Urol Res 1995;22:361–5.
Takashi M, Schenck U, Kissel K, Leyh H, Treiber U. Use of diagnostic categories in urinary cytology in comparison with the bladder tumour antigen (BTA) test in bladder cancer patients. Int Urol Nephrol 1999;31:189–96.
Tanaka K, Takashi M, Miyake K, Koshikawa T. Immunocytochemically demonstrated expression of epithelial membrane antigen and carcinoembryonic antigen by exfoliated urinary cells in patients with bladder cancer. Urol Int 1994;52:140–4.
Tauber S, Schneede P, Liedl B, Liesmann F, Zaak D, Hofstetter A. Fluorescence cytology of the urinary bladder. Urology 2003;61:1067–71.
Thomas L, Leyh H, Marberger M, Bombardieri E, Bassi P, Pagano F, et al. Multicenter trial of the quantitative BTA TRAK assay in the detection of bladder cancer. Clin Chem 1999;45:472–7.
Topsakal M, Karadeniz T, Anac M, Donmezer S, Besisik A. Assessment of fibrin-fibrinogen degradation products (Accu-Dx) test in bladder cancer patients. Eur Urol 2001;39:287–91.
van der Poel HG, Boon ME, van Stratum P, Ooms EC, Wiener H, Debruyne FM, et al. Conventional bladder wash cytology performed by four experts versus quantitative image analysis. Mod Pathol 1997;10:976–82.
van der Poel HG, van Balken MR, Schamhart DH, Peelen P, de Reijke T, Debruyne FM, et al. Bladder wash cytology, quantitative cytology, and the qualitative BTA test in patients with superficial bladder cancer. Urology 1998;51:44–50.
van der Poel HG, van Rhijn BW, Peelen P, Debruyne FM, Boon ME, Schalken JA. Consecutive quantitative cytology in bladder cancer. Urology 2000;56:584–8.
Varaldo M, Moretti M, Malcangi B, Cichero A, Pittaluga P. Flow cytometry in the follow-up of superficial bladder cancer. Acta Urol Ital 1995;9:207–9.
Weikert S, Krause H, Wolff I, Christoph F, Schrader M, Emrich T, et al. Quantitative evaluation of telomerase subunits in urine as biomarkers for noninvasive detection of bladder cancer. Int J Cancer 2005;117:274–80.
Wu WJ, Liu LT, Huang CH, Chang SF, Chang LL. Telomerase activity in human bladder tumors and bladder washing specimens. Kaohsiung J Med Sci 2001;17:602–9.
Zhao J, He D, Yang L, He H, Nan X. The study of microsatellites alteration in diagnoses of bladder cancer. Acad J Xi’an Jiaotong Univ 2006;18:73–7.
Required study design not met (n = 14)New clinical data further supports accuracy of the Vysis UroVysion test. Expert Rev Mol Diagn 2002;2:93–4.
Akhtar M, Gallagher L, Rohan S. Survivin: role in diagnosis, prognosis, and treatment of bladder cancer. Adv Anat Pathol 2006;13:122–6.
Barak V, Goike H, Panaretakis KW, Einarsson R. Clinical utility of cytokeratins as tumor markers. Clin Biochem 2004;37:529–40.
Clarke NW, Sangar VK. Urine telomerase activity for the diagnosis of bladder cancer: commentary. Nature Clin Pract Urol 2006;3:192–3.
Delanghe J. New screening diagnostic techniques in urinalysis. Acta Clin Belg 2007;62:155–61.
Duffy MJ, O’Donovan N, Brennan DJ, Gallagher WM, Ryan BM. Survivin: a promising tumor biomarker. Cancer Lett 2007;249:49–60.
Ellwein LB. Bladder cancer screening: lessons from a biologically based model of bladder cancer progression and therapeutic intervention. J Occup Med 1990;32:806–11.
Getzenberg RH. Urine-based assays for bladder cancer. Lab Med 2003;34:613–7.
Grossman HB. Bladder cancer markers: translating discovery to the clinic. J Clin Ligand Assay 2004;26:184–6.
Grossman HB. Fluorescence in situ hybridization for detecting transitional cell carcinoma: implications for clinical practice. In: Laudadio J, Keane TE, Reeves HM, Savage SJ, Hoda RS, Lage JM, Wolff DJ, Department of Pathology and Laboratory Medicine, University of South Carolina, Charleston, SC. Urol Oncol 2006;24:270–1.
Master VA, Meng MV, Koppie TM, Carroll PR, Grossfeld GD. Origin of urothelial carcinoma after renal transplant determined by fluorescence in situ hybridization. J Urol 2002;167:2521–2.
Mellon JK. Can nomograms using urinary NMP22 predict recurrence and progression of superficial bladder cancer? Commentary. Nature Clin Pract Urol 2005;2:370–1.
Moonen PM, Kiemeney LA, Witjes JA. Urinary NMP22 BladderChek test in the diagnosis of superficial bladder cancer. Eur Urol 2005;48:951–6.
Appendix 11
216
Yossepowitch O, Herr HW, Donat SM. Use of urinary biomarkers for bladder cancer surveillance: patient perspectives. J Urol 2007;177:1277–82.
Required outcomes not reported (n = 13)Boman H, Hedelin H, Jacobsson S, Holmang S. Newly diagnosed bladder cancer: the relationship of initial symptoms, degree of microhematuria and tumor marker status. J Urol 2002;168:1955–9.
Britton JP, Dowell AC, Whelan P, Harris CM. A community study of bladder cancer screening by the detection of occult urinary bleeding. J Urol 1992;148:788–90.
Chen Y-T, Hayden CL, Marchand KJ, Makuch RW. Comparison of urine collection methods for evaluating urinary nuclear matrix protein, NMP22, as a tumor marker. J Urol 1997;158:1899–901.
Mahnert B, Tauber S, Kriegmair M, Nagel D, Holdenrieder S, Hofmann K, et al. Measurements of complement factor H-related protein (BTA-TRAK assay) and nuclear matrix protein (NMP22 assay) – useful diagnostic tools in the diagnosis of urinary bladder cancer? Clin Chem Lab Med 2003;41:104–10.
Mansoor I. Analysis of urine cytology at a community hospital. JAMC 2003;15:20–3.
Murphy WM, Rivera-Ramirez I, Medina CA, Wright NJ, Wajsman Z. The bladder tumor antigen (BTA) test compared to voided urine cytology in the detection of bladder neoplasms. J Urol 1997;158:2102–6.
Pariente JL, Bordenave L, Michel P, Latapie MJ, Ducassou D, Le Guillou M. Initial evaluation of CYFRA 21–1 diagnostic performances as a urinary marker in bladder transitional cell carcinoma. J Urol 1997;158:338–41.
Shariat SF, Zippe C, Ludecke G, Boman H, Sanchez-Carbayo M, Casella R, et al. Nomograms including nuclear matrix protein 22 for prediction of disease recurrence and progression in patients with Ta, T1 or CIS transitional cell carcinoma of the bladder. J Urol 2005;173:1518–25.
Svatek RS, Lee D, Lotan Y. Correlation of office-based cystoscopy and cytology with histologic diagnosis: how good is the reference standard? Urology 2005;66:65–8.
Toma MI, Friedrich MG, Hautmann SH, Jakel KT, Erbersdobler A, Hellstern A, et al. Comparison of the ImmunoCyt test and urinary cytology with other urine tests in the detection and surveillance of bladder cancer. World J Urol 2004;22:145–9.
Tut VM, Hildreth AJ, Kumar M, Mellon JK. Does voided urine cytology have biological significance? Br J Urol 1998;82:655–9.
Wiener HG, Vooijs GP, Hof-Grootenboer B. Accuracy of urinary cytology in the diagnosis of primary and recurrent bladder cancer. Acta Cytol 1993;37:163–9.
Wiener HG, Remkes GW, Schatzl G, Susani M, Breitenecker G. Quick-staining urinary cytology and bladder wash image analysis with an integrated risk classification: a worthwhile improvement in the follow-up of bladder cancer? Cancer 1999;87:263–9.
Criteria for control group not met (n = 10)Houskova L, Zemanova Z, Babjuk M, Melichercikova J, Pesl M, Michalova K. Molecular cytogenetic characterization and diagnostics of bladder cancer. Neoplasma 2007;54:511–16.
Junker K, Werner W, Mueller C, Ebert W, Schubert J, Claussen U. Interphase cytogenetic diagnosis of bladder cancer on cells from urine and bladder washing. Int J Oncol 1999;14:309–13.
Lee MY, Tsou MH, Cheng MH, Chang DS, Yang AL, Ko JS. Clinical application of NMP22 and urinary cytology in patients with hematuria or a history of urothelial carcinoma. World J Urol 2000;18:401–5.
Shiff C, Veltri R, Naples J, Quartey J, Otchere J, Anyan W, et al. Ultrasound verification of bladder damage is associated with known biomarkers of bladder cancer in adults chronically infected with Schistosoma haematobium in Ghana. Trans R Soc Trop Med Hygiene 2006;100:847–54.
Sun Y, He DL, Ma Q, Wan XY, Zhu GD, Li L, et al. Comparison of seven screening methods in the diagnosis of bladder cancer. Chin Med J (Engl) 2006;119:1763–71.
Svatek RS, Karam J, Karakiewicz PI, Gallina A, Casella R, Roehrborn CG, et al. Role of urinary cathepsin B and L in the detection of bladder urothelial cell carcinoma. J Urol 2008;179:478–84.
Svatek RS, Herman MP, Lotan Y, Casella R, Hsieh JT, Sagalowsky AI, et al. Soluble Fas – a promising novel urinary marker for the detection of recurrent superficial bladder cancer. Cancer 2006;106:1701–7.
Tsui KH, Chen SM, Wang TM, Juang HH, Chen CL, Sun GH, et al. Comparisons of voided urine cytology, nuclear matrix protein-22 and bladder tumor associated antigen tests for bladder cancer of geriatric male patients in Taiwan, China. Asian J Androl 2007;9:711–15.
Upendra KN, Dey P, Mondal AK, Singh SK, Vohra H. DNA flow cytometry and bladder irrigation cytology in detection of bladder carcinoma. Diagn Cytopathol 2001;24:153–6.
Zellweger T, Benz G, Cathomas G, Mihatsch MJ, Sulser T, Gasser TC, et al. Multi-target fluorescence in situ
DOI: 10.3310/hta14040 Health Technology Assessment 2010; Vol. 14: No. 4
© 2010 Queen’s Printer and Controller of HMSO. All rights reserved.
217
hybridization in bladder washings for prediction of recurrent bladder cancer. Int J Cancer 2006;119:1660–5.
Required reference standard not met (n = 3)Alishahi S, Byrne D, Goodman CM, Baxby K. Haematuria investigation based on a standard protocol: emphasis on the diagnosis of urological malignancy. J R Coll Surg Edinb 2002;47:422–7.
Hofland CA, Mariani AJ. Is cytology required for a hematuria evaluation? J Urol 2004;171:324–6.
Sanchini MA, Gunelli R, Nanni O, Bravaccini S, Fabbri C, Sermasi A, et al. Relevance of urine telomerase in the diagnosis of bladder cancer. JAMA 2005;294:2052–6.
Cytology studies predating the publication year of the earliest included biomarker study (n = 3)Loh CS, Spedding AV, Ashworth MT, Kenyon WE, Desmond AD. The value of exfoliative urine cytology in combination with flexible cystoscopy in the diagnosis of recurrent transitional cell carcinoma of the urinary bladder. Br J Urol 1996;77:655–8.
Renshaw AA, Nappi D, Weinberg DS. Cytology of grade 1 papillary transitional cell carcinoma. A comparison of cytologic, architectural and morphometric criteria in cystoscopically obtained urine. Acta Cytol 1996;40:676–82.
Sack MJ, Artymyshyn RL, Tomaszewski JE, Gupta PK. Diagnostic-value of bladder wash cytology, with special reference to low-grade urothelial neoplasms. Acta Cytol 1995;39:187–94.

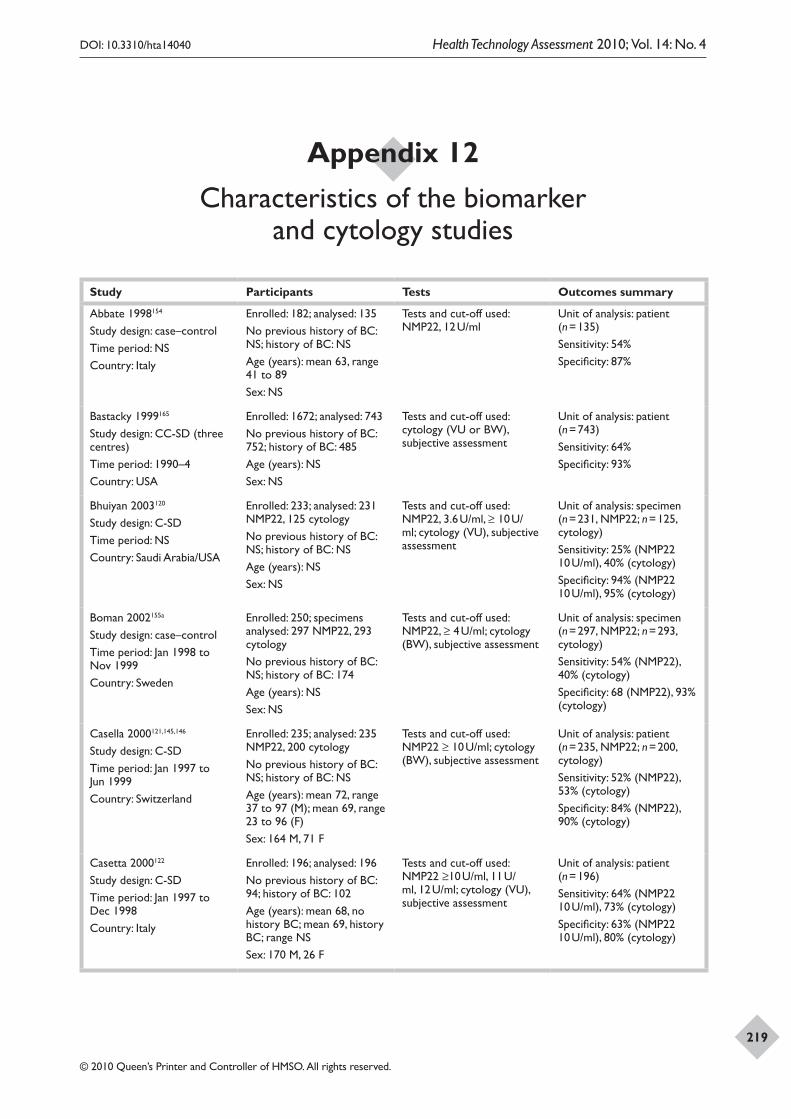
DOI: 10.3310/hta14040 Health Technology Assessment 2010; Vol. 14: No. 4
© 2010 Queen’s Printer and Controller of HMSO. All rights reserved.
219
Study Participants Tests Outcomes summary
Abbate 1998154
Study design: case–controlTime period: NSCountry: Italy
Enrolled: 182; analysed: 135No previous history of BC: NS; history of BC: NSAge (years): mean 63, range 41 to 89Sex: NS
Tests and cut-off used: NMP22, 12 U/ml
Unit of analysis: patient (n = 135) Sensitivity: 54%Specificity: 87%
Bastacky 1999165
Study design: CC-SD (three centres) Time period: 1990–4 Country: USA
Enrolled: 1672; analysed: 743No previous history of BC: 752; history of BC: 485Age (years): NSSex: NS
Tests and cut-off used: cytology (VU or BW), subjective assessment
Unit of analysis: patient (n = 743)Sensitivity: 64%Specificity: 93%
Bhuiyan 2003120
Study design: C-SD Time period: NSCountry: Saudi Arabia/USA
Enrolled: 233; analysed: 231 NMP22, 125 cytologyNo previous history of BC: NS; history of BC: NSAge (years): NSSex: NS
Tests and cut-off used: NMP22, 3.6 U/ml, ≥ 10 U/ml; cytology (VU), subjective assessment
Unit of analysis: specimen (n = 231, NMP22; n = 125, cytology)Sensitivity: 25% (NMP22 10 U/ml), 40% (cytology)Specificity: 94% (NMP22 10 U/ml), 95% (cytology)
Boman 2002155a
Study design: case–control Time period: Jan 1998 to Nov 1999Country: Sweden
Enrolled: 250; specimens analysed: 297 NMP22, 293 cytologyNo previous history of BC: NS; history of BC: 174Age (years): NSSex: NS
Tests and cut-off used: NMP22, ≥ 4 U/ml; cytology (BW), subjective assessment
Unit of analysis: specimen (n = 297, NMP22; n = 293, cytology)Sensitivity: 54% (NMP22), 40% (cytology)Specificity: 68 (NMP22), 93% (cytology)
Casella 2000121,145,146
Study design: C-SDTime period: Jan 1997 to Jun 1999Country: Switzerland
Enrolled: 235; analysed: 235 NMP22, 200 cytologyNo previous history of BC: NS; history of BC: NSAge (years): mean 72, range 37 to 97 (M); mean 69, range 23 to 96 (F)Sex: 164 M, 71 F
Tests and cut-off used: NMP22 ≥ 10 U/ml; cytology (BW), subjective assessment
Unit of analysis: patient (n = 235, NMP22; n = 200, cytology)Sensitivity: 52% (NMP22), 53% (cytology)Specificity: 84% (NMP22), 90% (cytology)
Casetta 2000122
Study design: C-SDTime period: Jan 1997 to Dec 1998Country: Italy
Enrolled: 196; analysed: 196No previous history of BC: 94; history of BC: 102Age (years): mean 68, no history BC; mean 69, history BC; range NSSex: 170 M, 26 F
Tests and cut-off used: NMP22 ≥10 U/ml, 11 U/ml, 12 U/ml; cytology (VU), subjective assessment
Unit of analysis: patient (n = 196)Sensitivity: 64% (NMP22 10 U/ml), 73% (cytology)Specificity: 63% (NMP22 10 U/ml), 80% (cytology)
Appendix 12 Characteristics of the biomarker
and cytology studies
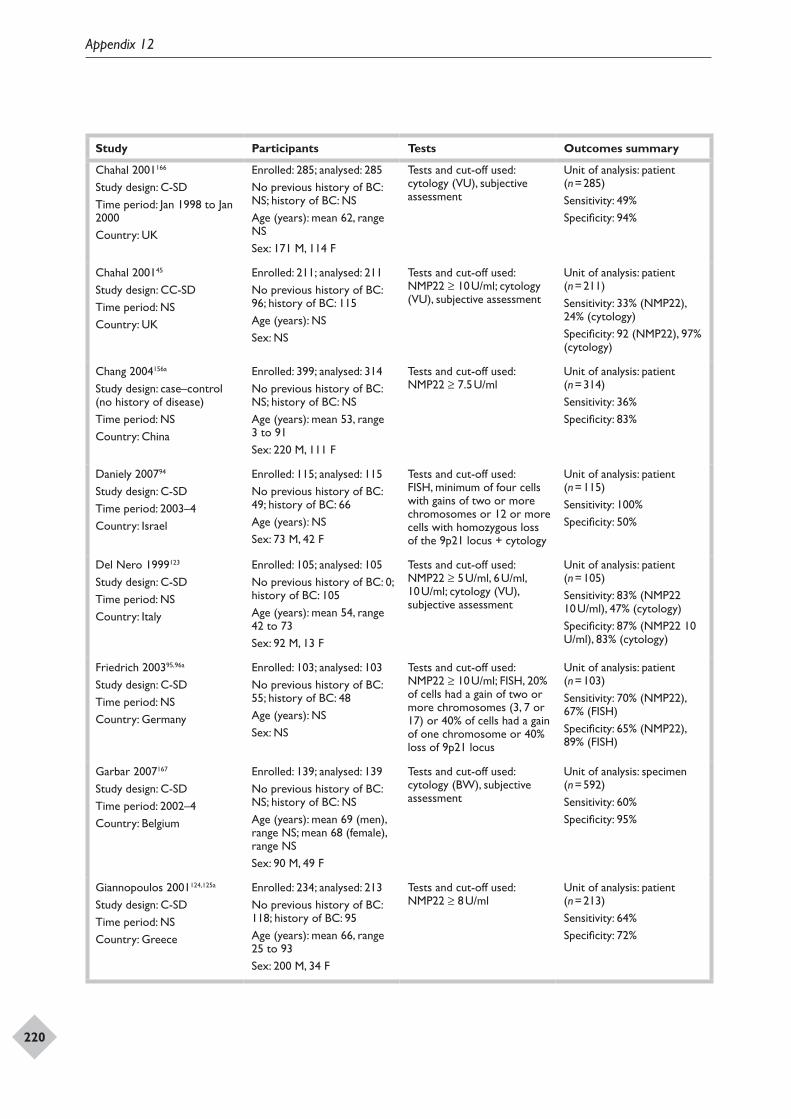
Appendix 12
220
Study Participants Tests Outcomes summary
Chahal 2001166
Study design: C-SDTime period: Jan 1998 to Jan 2000Country: UK
Enrolled: 285; analysed: 285No previous history of BC: NS; history of BC: NSAge (years): mean 62, range NSSex: 171 M, 114 F
Tests and cut-off used: cytology (VU), subjective assessment
Unit of analysis: patient (n = 285)Sensitivity: 49%Specificity: 94%
Chahal 200145
Study design: CC-SDTime period: NSCountry: UK
Enrolled: 211; analysed: 211No previous history of BC: 96; history of BC: 115Age (years): NSSex: NS
Tests and cut-off used: NMP22 ≥ 10 U/ml; cytology (VU), subjective assessment
Unit of analysis: patient (n = 211)Sensitivity: 33% (NMP22), 24% (cytology)Specificity: 92 (NMP22), 97% (cytology)
Chang 2004156a
Study design: case–control (no history of disease)Time period: NSCountry: China
Enrolled: 399; analysed: 314No previous history of BC: NS; history of BC: NSAge (years): mean 53, range 3 to 91Sex: 220 M, 111 F
Tests and cut-off used: NMP22 ≥ 7.5 U/ml
Unit of analysis: patient (n = 314)Sensitivity: 36%Specificity: 83%
Daniely 200794
Study design: C-SDTime period: 2003–4Country: Israel
Enrolled: 115; analysed: 115No previous history of BC: 49; history of BC: 66Age (years): NSSex: 73 M, 42 F
Tests and cut-off used: FISH, minimum of four cells with gains of two or more chromosomes or 12 or more cells with homozygous loss of the 9p21 locus + cytology
Unit of analysis: patient (n = 115)Sensitivity: 100% Specificity: 50%
Del Nero 1999123
Study design: C-SDTime period: NSCountry: Italy
Enrolled: 105; analysed: 105No previous history of BC: 0; history of BC: 105Age (years): mean 54, range 42 to 73Sex: 92 M, 13 F
Tests and cut-off used: NMP22 ≥ 5 U/ml, 6 U/ml, 10 U/ml; cytology (VU), subjective assessment
Unit of analysis: patient (n = 105)Sensitivity: 83% (NMP22 10 U/ml), 47% (cytology)Specificity: 87% (NMP22 10 U/ml), 83% (cytology)
Friedrich 200395,96a
Study design: C-SDTime period: NSCountry: Germany
Enrolled: 103; analysed: 103No previous history of BC: 55; history of BC: 48Age (years): NSSex: NS
Tests and cut-off used: NMP22 ≥ 10 U/ml; FISH, 20% of cells had a gain of two or more chromosomes (3, 7 or 17) or 40% of cells had a gain of one chromosome or 40% loss of 9p21 locus
Unit of analysis: patient (n = 103)Sensitivity: 70% (NMP22), 67% (FISH)Specificity: 65% (NMP22), 89% (FISH)
Garbar 2007167
Study design: C-SDTime period: 2002–4Country: Belgium
Enrolled: 139; analysed: 139No previous history of BC: NS; history of BC: NSAge (years): mean 69 (men), range NS; mean 68 (female), range NSSex: 90 M, 49 F
Tests and cut-off used: cytology (BW), subjective assessment
Unit of analysis: specimen (n = 592)Sensitivity: 60%Specificity: 95%
Giannopoulos 2001124,125a
Study design: C-SDTime period: NSCountry: Greece
Enrolled: 234; analysed: 213No previous history of BC: 118; history of BC: 95Age (years): mean 66, range 25 to 93Sex: 200 M, 34 F
Tests and cut-off used: NMP22 ≥ 8 U/ml
Unit of analysis: patient (n = 213)Sensitivity: 64%Specificity: 72%
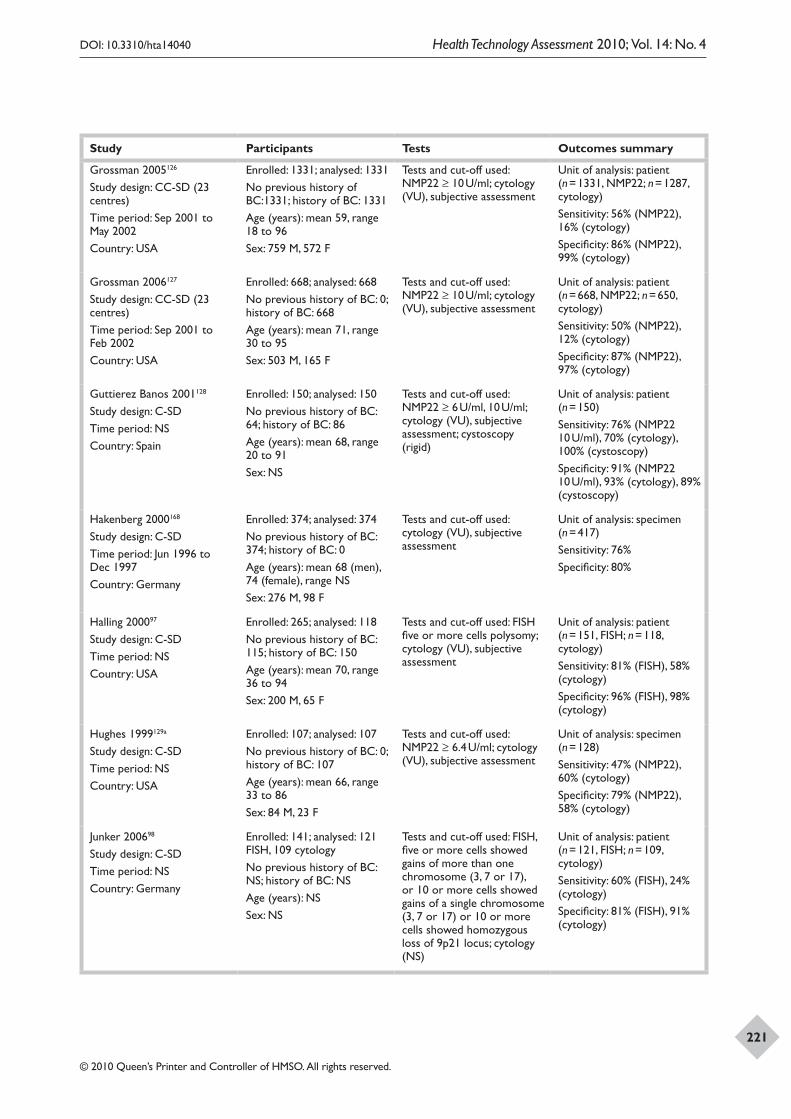
DOI: 10.3310/hta14040 Health Technology Assessment 2010; Vol. 14: No. 4
© 2010 Queen’s Printer and Controller of HMSO. All rights reserved.
221
Study Participants Tests Outcomes summary
Grossman 2005126
Study design: CC-SD (23 centres)Time period: Sep 2001 to May 2002Country: USA
Enrolled: 1331; analysed: 1331No previous history of BC:1331; history of BC: 1331Age (years): mean 59, range 18 to 96Sex: 759 M, 572 F
Tests and cut-off used: NMP22 ≥ 10 U/ml; cytology (VU), subjective assessment
Unit of analysis: patient (n = 1331, NMP22; n = 1287, cytology)Sensitivity: 56% (NMP22), 16% (cytology)Specificity: 86% (NMP22), 99% (cytology)
Grossman 2006127
Study design: CC-SD (23 centres)Time period: Sep 2001 to Feb 2002Country: USA
Enrolled: 668; analysed: 668No previous history of BC: 0; history of BC: 668Age (years): mean 71, range 30 to 95Sex: 503 M, 165 F
Tests and cut-off used: NMP22 ≥ 10 U/ml; cytology (VU), subjective assessment
Unit of analysis: patient (n = 668, NMP22; n = 650, cytology)Sensitivity: 50% (NMP22), 12% (cytology)Specificity: 87% (NMP22), 97% (cytology)
Guttierez Banos 2001128
Study design: C-SDTime period: NSCountry: Spain
Enrolled: 150; analysed: 150No previous history of BC: 64; history of BC: 86Age (years): mean 68, range 20 to 91Sex: NS
Tests and cut-off used: NMP22 ≥ 6 U/ml, 10 U/ml; cytology (VU), subjective assessment; cystoscopy (rigid)
Unit of analysis: patient (n = 150) Sensitivity: 76% (NMP22 10 U/ml), 70% (cytology), 100% (cystoscopy)Specificity: 91% (NMP22 10 U/ml), 93% (cytology), 89% (cystoscopy)
Hakenberg 2000168
Study design: C-SDTime period: Jun 1996 to Dec 1997Country: Germany
Enrolled: 374; analysed: 374No previous history of BC: 374; history of BC: 0Age (years): mean 68 (men), 74 (female), range NSSex: 276 M, 98 F
Tests and cut-off used: cytology (VU), subjective assessment
Unit of analysis: specimen (n = 417)Sensitivity: 76%Specificity: 80%
Halling 200097
Study design: C-SD Time period: NSCountry: USA
Enrolled: 265; analysed: 118No previous history of BC: 115; history of BC: 150Age (years): mean 70, range 36 to 94Sex: 200 M, 65 F
Tests and cut-off used: FISH five or more cells polysomy; cytology (VU), subjective assessment
Unit of analysis: patient (n = 151, FISH; n = 118, cytology)Sensitivity: 81% (FISH), 58% (cytology) Specificity: 96% (FISH), 98% (cytology)
Hughes 1999129a
Study design: C-SDTime period: NSCountry: USA
Enrolled: 107; analysed: 107No previous history of BC: 0; history of BC: 107Age (years): mean 66, range 33 to 86Sex: 84 M, 23 F
Tests and cut-off used: NMP22 ≥ 6.4 U/ml; cytology (VU), subjective assessment
Unit of analysis: specimen (n = 128)Sensitivity: 47% (NMP22), 60% (cytology)Specificity: 79% (NMP22), 58% (cytology)
Junker 200698
Study design: C-SDTime period: NSCountry: Germany
Enrolled: 141; analysed: 121 FISH, 109 cytologyNo previous history of BC: NS; history of BC: NSAge (years): NSSex: NS
Tests and cut-off used: FISH, five or more cells showed gains of more than one chromosome (3, 7 or 17), or 10 or more cells showed gains of a single chromosome (3, 7 or 17) or 10 or more cells showed homozygous loss of 9p21 locus; cytology (NS)
Unit of analysis: patient (n = 121, FISH; n = 109, cytology)Sensitivity: 60% (FISH), 24% (cytology)Specificity: 81% (FISH), 91% (cytology)
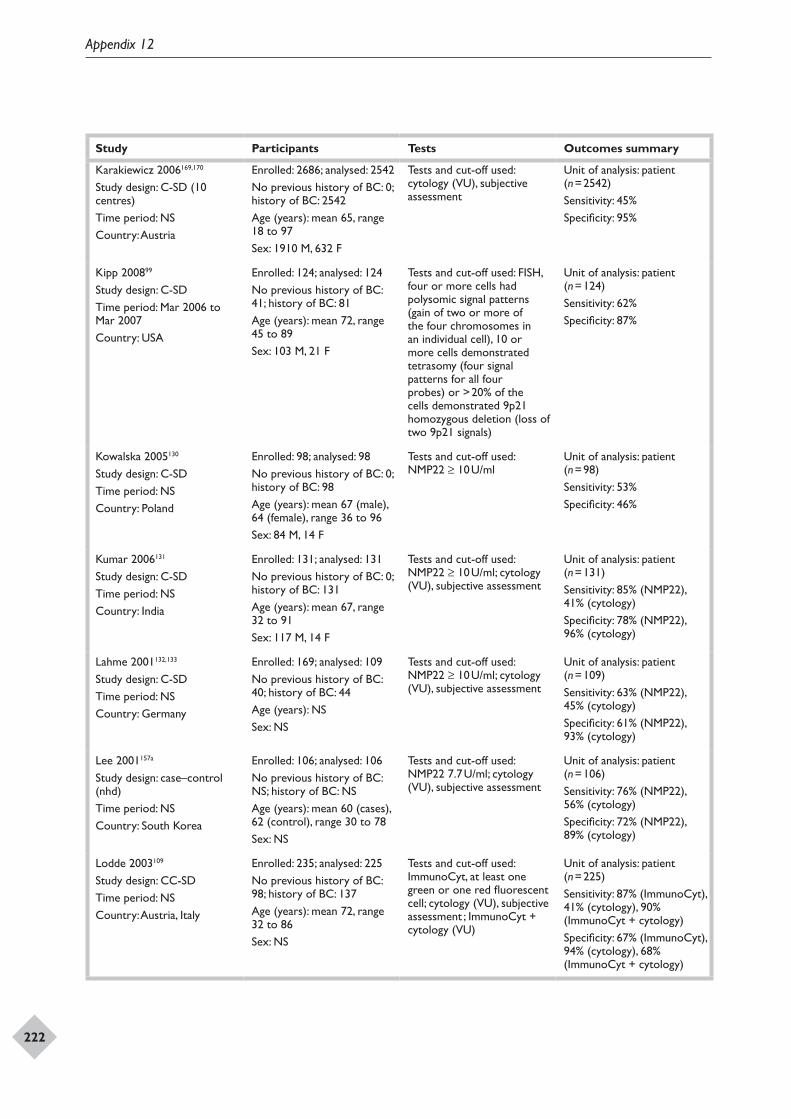
Appendix 12
222
Study Participants Tests Outcomes summary
Karakiewicz 2006169,170
Study design: C-SD (10 centres)Time period: NSCountry: Austria
Enrolled: 2686; analysed: 2542No previous history of BC: 0; history of BC: 2542 Age (years): mean 65, range 18 to 97Sex: 1910 M, 632 F
Tests and cut-off used: cytology (VU), subjective assessment
Unit of analysis: patient (n = 2542)Sensitivity: 45%Specificity: 95%
Kipp 200899
Study design: C-SDTime period: Mar 2006 to Mar 2007Country: USA
Enrolled: 124; analysed: 124No previous history of BC: 41; history of BC: 81Age (years): mean 72, range 45 to 89Sex: 103 M, 21 F
Tests and cut-off used: FISH, four or more cells had polysomic signal patterns (gain of two or more of the four chromosomes in an individual cell), 10 or more cells demonstrated tetrasomy (four signal patterns for all four probes) or > 20% of the cells demonstrated 9p21 homozygous deletion (loss of two 9p21 signals)
Unit of analysis: patient (n = 124)Sensitivity: 62%Specificity: 87%
Kowalska 2005130
Study design: C-SDTime period: NSCountry: Poland
Enrolled: 98; analysed: 98No previous history of BC: 0; history of BC: 98Age (years): mean 67 (male), 64 (female), range 36 to 96Sex: 84 M, 14 F
Tests and cut-off used: NMP22 ≥ 10 U/ml
Unit of analysis: patient (n = 98)Sensitivity: 53%Specificity: 46%
Kumar 2006131
Study design: C-SDTime period: NSCountry: India
Enrolled: 131; analysed: 131No previous history of BC: 0; history of BC: 131Age (years): mean 67, range 32 to 91Sex: 117 M, 14 F
Tests and cut-off used: NMP22 ≥ 10 U/ml; cytology (VU), subjective assessment
Unit of analysis: patient (n = 131)Sensitivity: 85% (NMP22), 41% (cytology)Specificity: 78% (NMP22), 96% (cytology)
Lahme 2001132,133
Study design: C-SDTime period: NSCountry: Germany
Enrolled: 169; analysed: 109No previous history of BC: 40; history of BC: 44Age (years): NSSex: NS
Tests and cut-off used: NMP22 ≥ 10 U/ml; cytology (VU), subjective assessment
Unit of analysis: patient (n = 109)Sensitivity: 63% (NMP22), 45% (cytology)Specificity: 61% (NMP22), 93% (cytology)
Lee 2001157a
Study design: case–control (nhd)Time period: NSCountry: South Korea
Enrolled: 106; analysed: 106No previous history of BC: NS; history of BC: NS Age (years): mean 60 (cases), 62 (control), range 30 to 78Sex: NS
Tests and cut-off used: NMP22 7.7 U/ml; cytology (VU), subjective assessment
Unit of analysis: patient (n = 106)Sensitivity: 76% (NMP22), 56% (cytology)Specificity: 72% (NMP22), 89% (cytology)
Lodde 2003109
Study design: CC-SDTime period: NSCountry: Austria, Italy
Enrolled: 235; analysed: 225No previous history of BC: 98; history of BC: 137Age (years): mean 72, range 32 to 86Sex: NS
Tests and cut-off used: ImmunoCyt, at least one green or one red fluorescent cell; cytology (VU), subjective assessment ; ImmunoCyt + cytology (VU)
Unit of analysis: patient (n = 225)Sensitivity: 87% (ImmunoCyt), 41% (cytology), 90% (ImmunoCyt + cytology)Specificity: 67% (ImmunoCyt), 94% (cytology), 68% (ImmunoCyt + cytology)
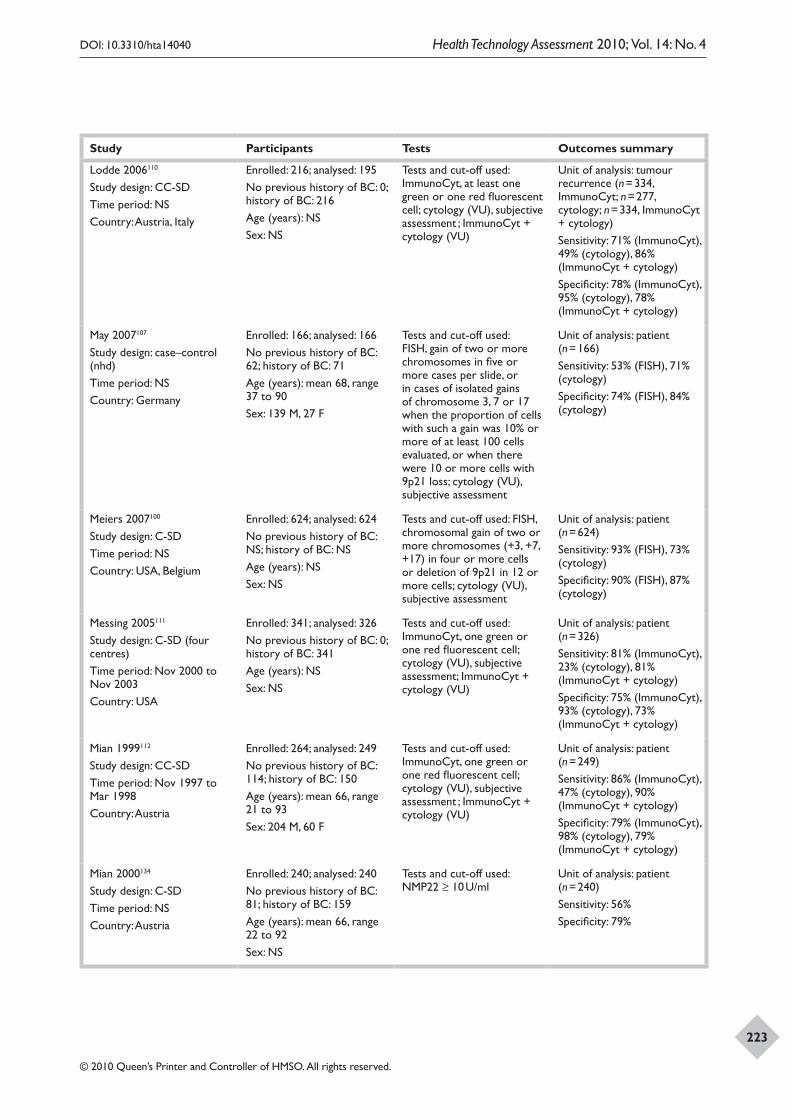
DOI: 10.3310/hta14040 Health Technology Assessment 2010; Vol. 14: No. 4
© 2010 Queen’s Printer and Controller of HMSO. All rights reserved.
223
Study Participants Tests Outcomes summary
Lodde 2006110
Study design: CC-SDTime period: NSCountry: Austria, Italy
Enrolled: 216; analysed: 195No previous history of BC: 0; history of BC: 216Age (years): NSSex: NS
Tests and cut-off used: ImmunoCyt, at least one green or one red fluorescent cell; cytology (VU), subjective assessment ; ImmunoCyt + cytology (VU)
Unit of analysis: tumour recurrence (n = 334, ImmunoCyt; n = 277, cytology; n = 334, ImmunoCyt + cytology)Sensitivity: 71% (ImmunoCyt), 49% (cytology), 86% (ImmunoCyt + cytology)Specificity: 78% (ImmunoCyt), 95% (cytology), 78% (ImmunoCyt + cytology)
May 2007107
Study design: case–control (nhd)Time period: NSCountry: Germany
Enrolled: 166; analysed: 166No previous history of BC: 62; history of BC: 71Age (years): mean 68, range 37 to 90Sex: 139 M, 27 F
Tests and cut-off used: FISH, gain of two or more chromosomes in five or more cases per slide, or in cases of isolated gains of chromosome 3, 7 or 17 when the proportion of cells with such a gain was 10% or more of at least 100 cells evaluated, or when there were 10 or more cells with 9p21 loss; cytology (VU), subjective assessment
Unit of analysis: patient (n = 166)Sensitivity: 53% (FISH), 71% (cytology)Specificity: 74% (FISH), 84% (cytology)
Meiers 2007100
Study design: C-SDTime period: NSCountry: USA, Belgium
Enrolled: 624; analysed: 624No previous history of BC: NS; history of BC: NSAge (years): NSSex: NS
Tests and cut-off used: FISH, chromosomal gain of two or more chromosomes (+3, +7, +17) in four or more cells or deletion of 9p21 in 12 or more cells; cytology (VU), subjective assessment
Unit of analysis: patient (n = 624)Sensitivity: 93% (FISH), 73% (cytology)Specificity: 90% (FISH), 87% (cytology)
Messing 2005111
Study design: C-SD (four centres)Time period: Nov 2000 to Nov 2003Country: USA
Enrolled: 341; analysed: 326No previous history of BC: 0; history of BC: 341Age (years): NSSex: NS
Tests and cut-off used: ImmunoCyt, one green or one red fluorescent cell; cytology (VU), subjective assessment; ImmunoCyt + cytology (VU)
Unit of analysis: patient (n = 326)Sensitivity: 81% (ImmunoCyt), 23% (cytology), 81% (ImmunoCyt + cytology)Specificity: 75% (ImmunoCyt), 93% (cytology), 73% (ImmunoCyt + cytology)
Mian 1999112
Study design: CC-SDTime period: Nov 1997 to Mar 1998Country: Austria
Enrolled: 264; analysed: 249No previous history of BC: 114; history of BC: 150Age (years): mean 66, range 21 to 93Sex: 204 M, 60 F
Tests and cut-off used: ImmunoCyt, one green or one red fluorescent cell; cytology (VU), subjective assessment ; ImmunoCyt + cytology (VU)
Unit of analysis: patient (n = 249)Sensitivity: 86% (ImmunoCyt), 47% (cytology), 90% (ImmunoCyt + cytology)Specificity: 79% (ImmunoCyt), 98% (cytology), 79% (ImmunoCyt + cytology)
Mian 2000134
Study design: C-SDTime period: NSCountry: Austria
Enrolled: 240; analysed: 240No previous history of BC: 81; history of BC: 159Age (years): mean 66, range 22 to 92Sex: NS
Tests and cut-off used: NMP22 ≥ 10 U/ml
Unit of analysis: patient (n = 240)Sensitivity: 56%Specificity: 79%
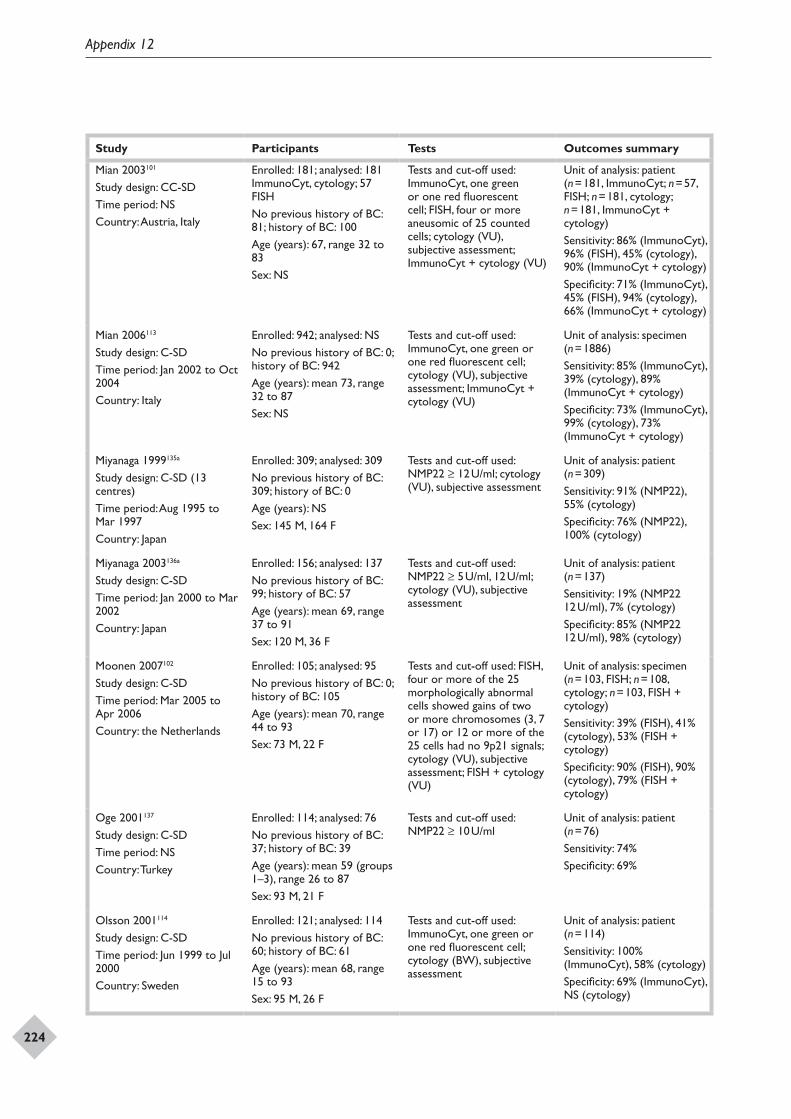
Appendix 12
224
Study Participants Tests Outcomes summary
Mian 2003101
Study design: CC-SDTime period: NSCountry: Austria, Italy
Enrolled: 181; analysed: 181 ImmunoCyt, cytology; 57 FISHNo previous history of BC: 81; history of BC: 100Age (years): 67, range 32 to 83Sex: NS
Tests and cut-off used: ImmunoCyt, one green or one red fluorescent cell; FISH, four or more aneusomic of 25 counted cells; cytology (VU), subjective assessment; ImmunoCyt + cytology (VU)
Unit of analysis: patient (n = 181, ImmunoCyt; n = 57, FISH; n = 181, cytology; n = 181, ImmunoCyt + cytology)Sensitivity: 86% (ImmunoCyt), 96% (FISH), 45% (cytology), 90% (ImmunoCyt + cytology)Specificity: 71% (ImmunoCyt), 45% (FISH), 94% (cytology), 66% (ImmunoCyt + cytology)
Mian 2006113
Study design: C-SDTime period: Jan 2002 to Oct 2004Country: Italy
Enrolled: 942; analysed: NSNo previous history of BC: 0; history of BC: 942Age (years): mean 73, range 32 to 87Sex: NS
Tests and cut-off used: ImmunoCyt, one green or one red fluorescent cell; cytology (VU), subjective assessment; ImmunoCyt + cytology (VU)
Unit of analysis: specimen (n = 1886)Sensitivity: 85% (ImmunoCyt), 39% (cytology), 89% (ImmunoCyt + cytology)Specificity: 73% (ImmunoCyt), 99% (cytology), 73% (ImmunoCyt + cytology)
Miyanaga 1999135a
Study design: C-SD (13 centres)Time period: Aug 1995 to Mar 1997Country: Japan
Enrolled: 309; analysed: 309No previous history of BC: 309; history of BC: 0Age (years): NSSex: 145 M, 164 F
Tests and cut-off used: NMP22 ≥ 12 U/ml; cytology (VU), subjective assessment
Unit of analysis: patient (n = 309)Sensitivity: 91% (NMP22), 55% (cytology)Specificity: 76% (NMP22), 100% (cytology)
Miyanaga 2003136a
Study design: C-SDTime period: Jan 2000 to Mar 2002Country: Japan
Enrolled: 156; analysed: 137No previous history of BC: 99; history of BC: 57Age (years): mean 69, range 37 to 91Sex: 120 M, 36 F
Tests and cut-off used: NMP22 ≥ 5 U/ml, 12 U/ml; cytology (VU), subjective assessment
Unit of analysis: patient (n = 137)Sensitivity: 19% (NMP22 12 U/ml), 7% (cytology)Specificity: 85% (NMP22 12 U/ml), 98% (cytology)
Moonen 2007102
Study design: C-SD Time period: Mar 2005 to Apr 2006Country: the Netherlands
Enrolled: 105; analysed: 95No previous history of BC: 0; history of BC: 105Age (years): mean 70, range 44 to 93Sex: 73 M, 22 F
Tests and cut-off used: FISH, four or more of the 25 morphologically abnormal cells showed gains of two or more chromosomes (3, 7 or 17) or 12 or more of the 25 cells had no 9p21 signals; cytology (VU), subjective assessment; FISH + cytology (VU)
Unit of analysis: specimen (n = 103, FISH; n = 108, cytology; n = 103, FISH + cytology)Sensitivity: 39% (FISH), 41% (cytology), 53% (FISH + cytology)Specificity: 90% (FISH), 90% (cytology), 79% (FISH + cytology)
Oge 2001137
Study design: C-SDTime period: NSCountry: Turkey
Enrolled: 114; analysed: 76No previous history of BC: 37; history of BC: 39Age (years): mean 59 (groups 1–3), range 26 to 87Sex: 93 M, 21 F
Tests and cut-off used: NMP22 ≥ 10 U/ml
Unit of analysis: patient (n = 76)Sensitivity: 74%Specificity: 69%
Olsson 2001114
Study design: C-SDTime period: Jun 1999 to Jul 2000Country: Sweden
Enrolled: 121; analysed: 114No previous history of BC: 60; history of BC: 61Age (years): mean 68, range 15 to 93Sex: 95 M, 26 F
Tests and cut-off used: ImmunoCyt, one green or one red fluorescent cell; cytology (BW), subjective assessment
Unit of analysis: patient (n = 114)Sensitivity: 100% (ImmunoCyt), 58% (cytology)Specificity: 69% (ImmunoCyt), NS (cytology)
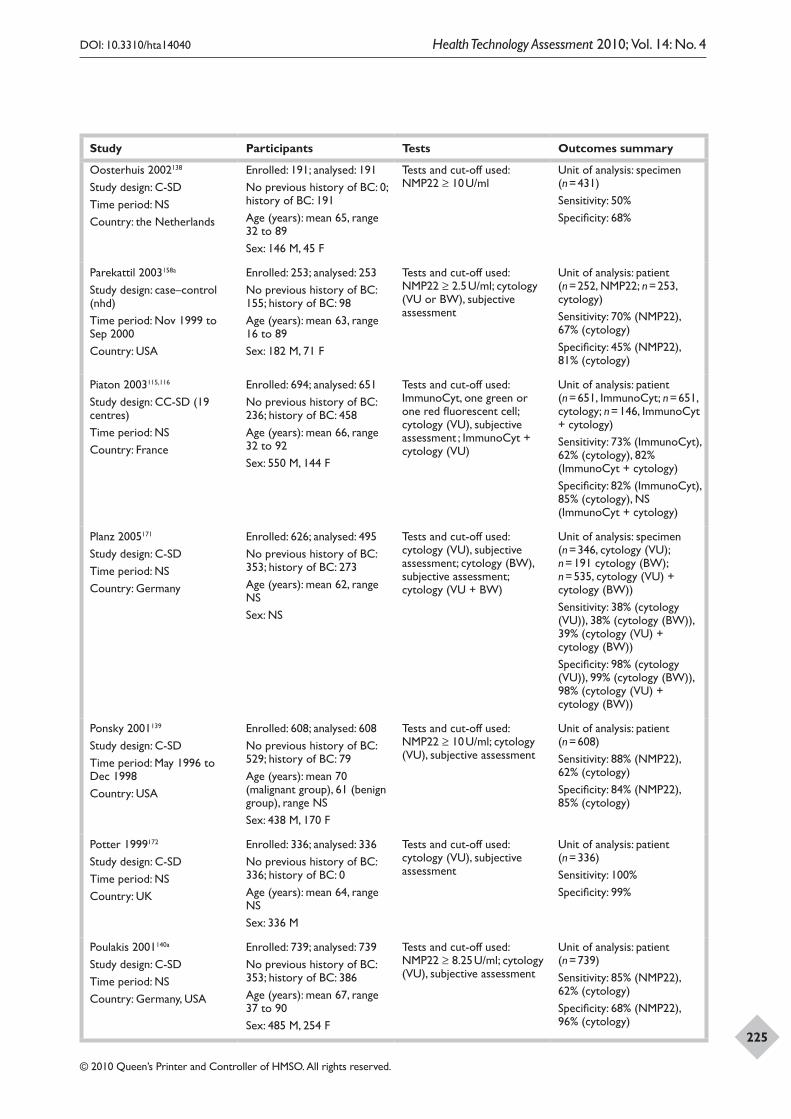
DOI: 10.3310/hta14040 Health Technology Assessment 2010; Vol. 14: No. 4
© 2010 Queen’s Printer and Controller of HMSO. All rights reserved.
225
Study Participants Tests Outcomes summary
Oosterhuis 2002138
Study design: C-SDTime period: NSCountry: the Netherlands
Enrolled: 191; analysed: 191No previous history of BC: 0; history of BC: 191Age (years): mean 65, range 32 to 89Sex: 146 M, 45 F
Tests and cut-off used: NMP22 ≥ 10 U/ml
Unit of analysis: specimen (n = 431)Sensitivity: 50%Specificity: 68%
Parekattil 2003158a
Study design: case–control (nhd)Time period: Nov 1999 to Sep 2000Country: USA
Enrolled: 253; analysed: 253No previous history of BC: 155; history of BC: 98Age (years): mean 63, range 16 to 89Sex: 182 M, 71 F
Tests and cut-off used: NMP22 ≥ 2.5 U/ml; cytology (VU or BW), subjective assessment
Unit of analysis: patient (n = 252, NMP22; n = 253, cytology)Sensitivity: 70% (NMP22), 67% (cytology)Specificity: 45% (NMP22), 81% (cytology)
Piaton 2003115,116
Study design: CC-SD (19 centres)Time period: NSCountry: France
Enrolled: 694; analysed: 651No previous history of BC: 236; history of BC: 458Age (years): mean 66, range 32 to 92Sex: 550 M, 144 F
Tests and cut-off used: ImmunoCyt, one green or one red fluorescent cell; cytology (VU), subjective assessment ; ImmunoCyt + cytology (VU)
Unit of analysis: patient (n = 651, ImmunoCyt; n = 651, cytology; n = 146, ImmunoCyt + cytology)Sensitivity: 73% (ImmunoCyt), 62% (cytology), 82% (ImmunoCyt + cytology)Specificity: 82% (ImmunoCyt), 85% (cytology), NS (ImmunoCyt + cytology)
Planz 2005171
Study design: C-SDTime period: NSCountry: Germany
Enrolled: 626; analysed: 495No previous history of BC: 353; history of BC: 273Age (years): mean 62, range NSSex: NS
Tests and cut-off used: cytology (VU), subjective assessment; cytology (BW), subjective assessment; cytology (VU + BW)
Unit of analysis: specimen (n = 346, cytology (VU); n = 191 cytology (BW); n = 535, cytology (VU) + cytology (BW))Sensitivity: 38% (cytology (VU)), 38% (cytology (BW)), 39% (cytology (VU) + cytology (BW))Specificity: 98% (cytology (VU)), 99% (cytology (BW)), 98% (cytology (VU) + cytology (BW))
Ponsky 2001139
Study design: C-SDTime period: May 1996 to Dec 1998Country: USA
Enrolled: 608; analysed: 608No previous history of BC: 529; history of BC: 79Age (years): mean 70 (malignant group), 61 (benign group), range NSSex: 438 M, 170 F
Tests and cut-off used: NMP22 ≥ 10 U/ml; cytology (VU), subjective assessment
Unit of analysis: patient (n = 608)Sensitivity: 88% (NMP22), 62% (cytology)Specificity: 84% (NMP22), 85% (cytology)
Potter 1999172
Study design: C-SDTime period: NSCountry: UK
Enrolled: 336; analysed: 336No previous history of BC: 336; history of BC: 0Age (years): mean 64, range NSSex: 336 M
Tests and cut-off used: cytology (VU), subjective assessment
Unit of analysis: patient (n = 336)Sensitivity: 100%Specificity: 99%
Poulakis 2001140a
Study design: C-SD Time period: NSCountry: Germany, USA
Enrolled: 739; analysed: 739No previous history of BC: 353; history of BC: 386Age (years): mean 67, range 37 to 90Sex: 485 M, 254 F
Tests and cut-off used: NMP22 ≥ 8.25 U/ml; cytology (VU), subjective assessment
Unit of analysis: patient (n = 739)Sensitivity: 85% (NMP22), 62% (cytology)Specificity: 68% (NMP22), 96% (cytology)
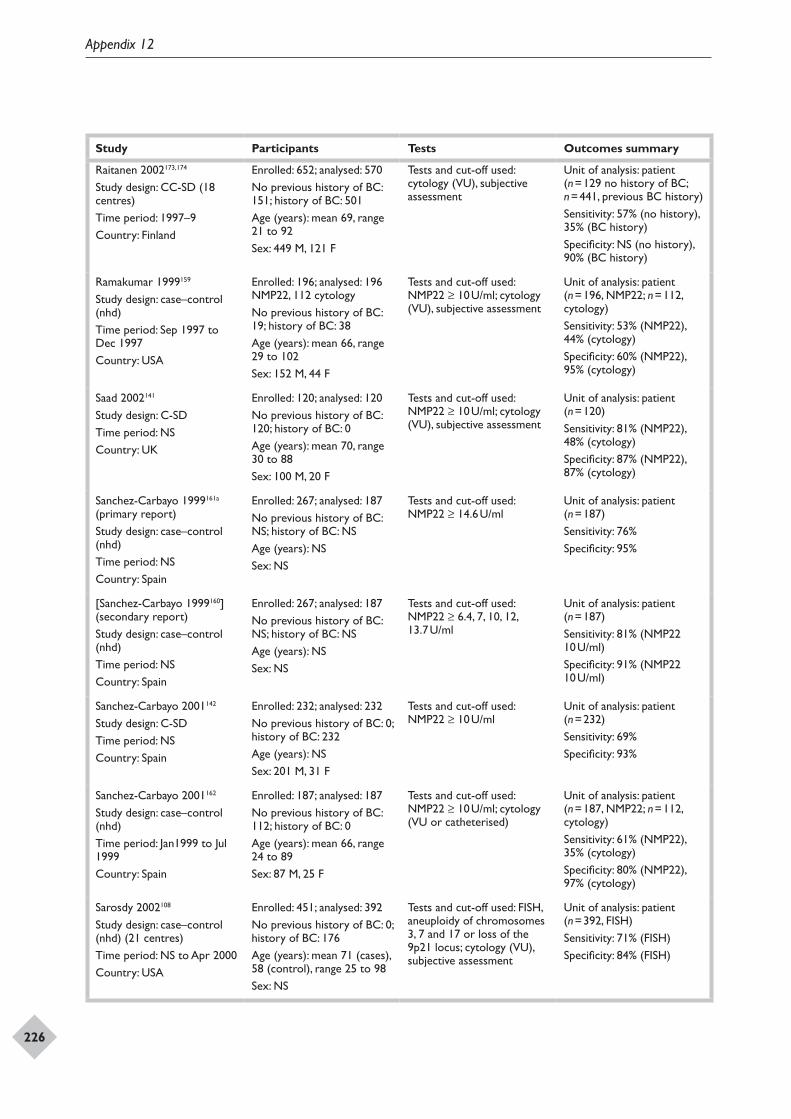
Appendix 12
226
Study Participants Tests Outcomes summary
Raitanen 2002173,174
Study design: CC-SD (18 centres)Time period: 1997–9Country: Finland
Enrolled: 652; analysed: 570No previous history of BC: 151; history of BC: 501Age (years): mean 69, range 21 to 92Sex: 449 M, 121 F
Tests and cut-off used: cytology (VU), subjective assessment
Unit of analysis: patient (n = 129 no history of BC; n = 441, previous BC history)Sensitivity: 57% (no history), 35% (BC history) Specificity: NS (no history), 90% (BC history)
Ramakumar 1999159
Study design: case–control (nhd)Time period: Sep 1997 to Dec 1997Country: USA
Enrolled: 196; analysed: 196 NMP22, 112 cytologyNo previous history of BC: 19; history of BC: 38Age (years): mean 66, range 29 to 102Sex: 152 M, 44 F
Tests and cut-off used: NMP22 ≥ 10 U/ml; cytology (VU), subjective assessment
Unit of analysis: patient (n = 196, NMP22; n = 112, cytology)Sensitivity: 53% (NMP22), 44% (cytology)Specificity: 60% (NMP22), 95% (cytology)
Saad 2002141
Study design: C-SDTime period: NSCountry: UK
Enrolled: 120; analysed: 120No previous history of BC: 120; history of BC: 0Age (years): mean 70, range 30 to 88Sex: 100 M, 20 F
Tests and cut-off used: NMP22 ≥ 10 U/ml; cytology (VU), subjective assessment
Unit of analysis: patient (n = 120)Sensitivity: 81% (NMP22), 48% (cytology)Specificity: 87% (NMP22), 87% (cytology)
Sanchez-Carbayo 1999161a (primary report)Study design: case–control (nhd)Time period: NSCountry: Spain
Enrolled: 267; analysed: 187No previous history of BC: NS; history of BC: NSAge (years): NSSex: NS
Tests and cut-off used: NMP22 ≥ 14.6 U/ml
Unit of analysis: patient (n = 187)Sensitivity: 76%Specificity: 95%
[Sanchez-Carbayo 1999160] (secondary report)Study design: case–control (nhd)Time period: NSCountry: Spain
Enrolled: 267; analysed: 187No previous history of BC: NS; history of BC: NSAge (years): NSSex: NS
Tests and cut-off used: NMP22 ≥ 6.4, 7, 10, 12, 13.7 U/ml
Unit of analysis: patient (n = 187)Sensitivity: 81% (NMP22 10 U/ml)Specificity: 91% (NMP22 10 U/ml)
Sanchez-Carbayo 2001142
Study design: C-SDTime period: NSCountry: Spain
Enrolled: 232; analysed: 232No previous history of BC: 0; history of BC: 232Age (years): NSSex: 201 M, 31 F
Tests and cut-off used: NMP22 ≥ 10 U/ml
Unit of analysis: patient (n = 232)Sensitivity: 69%Specificity: 93%
Sanchez-Carbayo 2001162
Study design: case–control (nhd)Time period: Jan1999 to Jul 1999Country: Spain
Enrolled: 187; analysed: 187No previous history of BC: 112; history of BC: 0Age (years): mean 66, range 24 to 89Sex: 87 M, 25 F
Tests and cut-off used: NMP22 ≥ 10 U/ml; cytology (VU or catheterised)
Unit of analysis: patient (n = 187, NMP22; n = 112, cytology) Sensitivity: 61% (NMP22), 35% (cytology)Specificity: 80% (NMP22), 97% (cytology)
Sarosdy 2002108
Study design: case–control (nhd) (21 centres)Time period: NS to Apr 2000Country: USA
Enrolled: 451; analysed: 392No previous history of BC: 0; history of BC: 176Age (years): mean 71 (cases), 58 (control), range 25 to 98Sex: NS
Tests and cut-off used: FISH, aneuploidy of chromosomes 3, 7 and 17 or loss of the 9p21 locus; cytology (VU), subjective assessment
Unit of analysis: patient (n = 392, FISH)Sensitivity: 71% (FISH) Specificity: 84% (FISH)
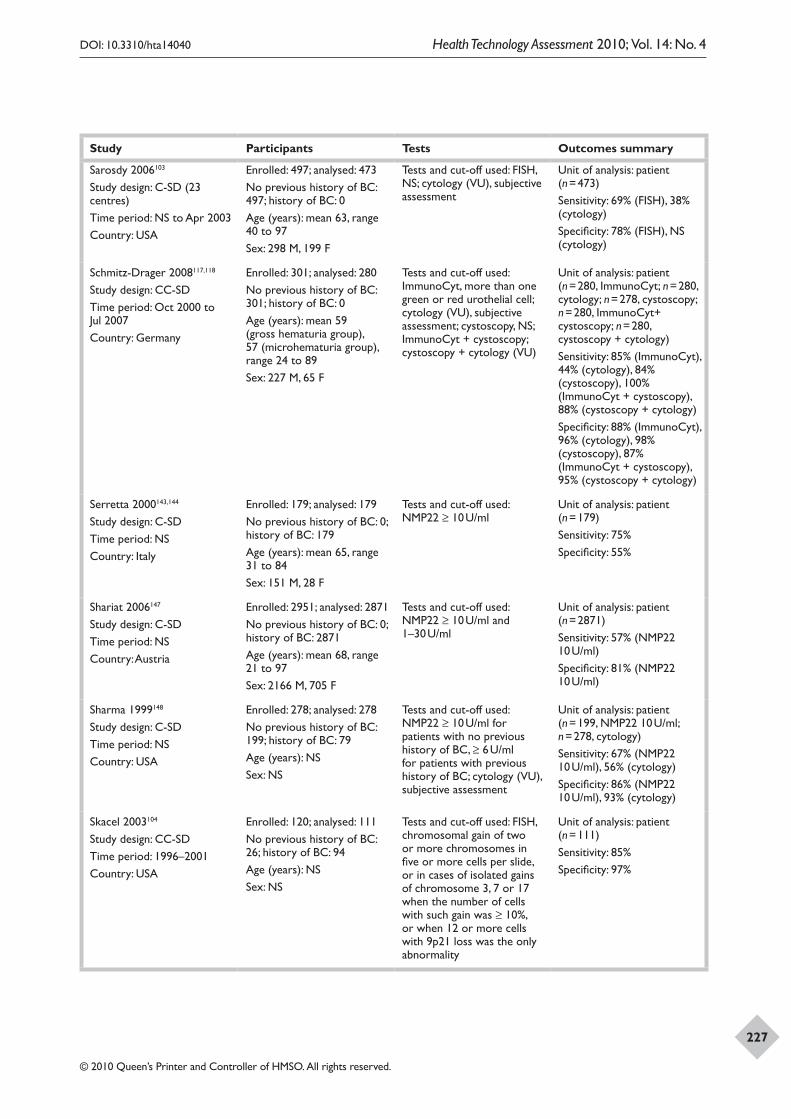
DOI: 10.3310/hta14040 Health Technology Assessment 2010; Vol. 14: No. 4
© 2010 Queen’s Printer and Controller of HMSO. All rights reserved.
227
Study Participants Tests Outcomes summary
Sarosdy 2006103
Study design: C-SD (23 centres)Time period: NS to Apr 2003Country: USA
Enrolled: 497; analysed: 473No previous history of BC: 497; history of BC: 0Age (years): mean 63, range 40 to 97Sex: 298 M, 199 F
Tests and cut-off used: FISH, NS; cytology (VU), subjective assessment
Unit of analysis: patient (n = 473)Sensitivity: 69% (FISH), 38% (cytology)Specificity: 78% (FISH), NS (cytology)
Schmitz-Drager 2008117,118
Study design: CC-SDTime period: Oct 2000 to Jul 2007Country: Germany
Enrolled: 301; analysed: 280No previous history of BC: 301; history of BC: 0Age (years): mean 59 (gross hematuria group), 57 (microhematuria group), range 24 to 89Sex: 227 M, 65 F
Tests and cut-off used: ImmunoCyt, more than one green or red urothelial cell; cytology (VU), subjective assessment; cystoscopy, NS; ImmunoCyt + cystoscopy; cystoscopy + cytology (VU)
Unit of analysis: patient (n = 280, ImmunoCyt; n = 280, cytology; n = 278, cystoscopy; n = 280, ImmunoCyt+ cystoscopy; n = 280, cystoscopy + cytology)Sensitivity: 85% (ImmunoCyt), 44% (cytology), 84% (cystoscopy), 100% (ImmunoCyt + cystoscopy), 88% (cystoscopy + cytology)Specificity: 88% (ImmunoCyt), 96% (cytology), 98% (cystoscopy), 87% (ImmunoCyt + cystoscopy), 95% (cystoscopy + cytology)
Serretta 2000143,144
Study design: C-SDTime period: NSCountry: Italy
Enrolled: 179; analysed: 179No previous history of BC: 0; history of BC: 179Age (years): mean 65, range 31 to 84Sex: 151 M, 28 F
Tests and cut-off used: NMP22 ≥ 10 U/ml
Unit of analysis: patient (n = 179)Sensitivity: 75%Specificity: 55%
Shariat 2006147
Study design: C-SDTime period: NSCountry: Austria
Enrolled: 2951; analysed: 2871No previous history of BC: 0; history of BC: 2871Age (years): mean 68, range 21 to 97Sex: 2166 M, 705 F
Tests and cut-off used: NMP22 ≥ 10 U/ml and 1–30 U/ml
Unit of analysis: patient (n = 2871)Sensitivity: 57% (NMP22 10 U/ml)Specificity: 81% (NMP22 10 U/ml)
Sharma 1999148
Study design: C-SDTime period: NSCountry: USA
Enrolled: 278; analysed: 278No previous history of BC: 199; history of BC: 79Age (years): NSSex: NS
Tests and cut-off used: NMP22 ≥ 10 U/ml for patients with no previous history of BC, ≥ 6 U/ml for patients with previous history of BC; cytology (VU), subjective assessment
Unit of analysis: patient (n = 199, NMP22 10 U/ml; n = 278, cytology)Sensitivity: 67% (NMP22 10 U/ml), 56% (cytology)Specificity: 86% (NMP22 10 U/ml), 93% (cytology)
Skacel 2003104
Study design: CC-SDTime period: 1996–2001Country: USA
Enrolled: 120; analysed: 111No previous history of BC: 26; history of BC: 94Age (years): NSSex: NS
Tests and cut-off used: FISH, chromosomal gain of two or more chromosomes in five or more cells per slide, or in cases of isolated gains of chromosome 3, 7 or 17 when the number of cells with such gain was ≥ 10%, or when 12 or more cells with 9p21 loss was the only abnormality
Unit of analysis: patient (n = 111)Sensitivity: 85%Specificity: 97%
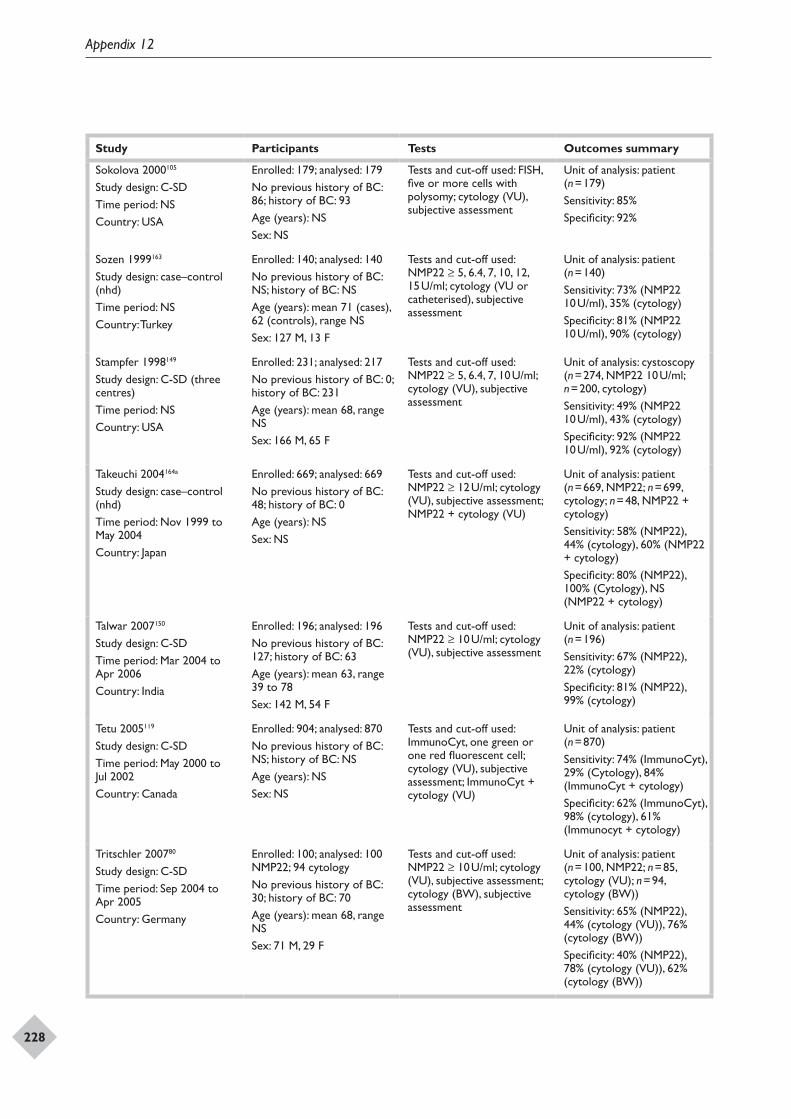
Appendix 12
228
Study Participants Tests Outcomes summary
Sokolova 2000105
Study design: C-SDTime period: NSCountry: USA
Enrolled: 179; analysed: 179No previous history of BC: 86; history of BC: 93Age (years): NSSex: NS
Tests and cut-off used: FISH, five or more cells with polysomy; cytology (VU), subjective assessment
Unit of analysis: patient (n = 179)Sensitivity: 85%Specificity: 92%
Sozen 1999163
Study design: case–control (nhd)Time period: NSCountry: Turkey
Enrolled: 140; analysed: 140No previous history of BC: NS; history of BC: NSAge (years): mean 71 (cases), 62 (controls), range NSSex: 127 M, 13 F
Tests and cut-off used: NMP22 ≥ 5, 6.4, 7, 10, 12, 15 U/ml; cytology (VU or catheterised), subjective assessment
Unit of analysis: patient (n = 140)Sensitivity: 73% (NMP22 10 U/ml), 35% (cytology)Specificity: 81% (NMP22 10 U/ml), 90% (cytology)
Stampfer 1998149
Study design: C-SD (three centres)Time period: NSCountry: USA
Enrolled: 231; analysed: 217No previous history of BC: 0; history of BC: 231Age (years): mean 68, range NSSex: 166 M, 65 F
Tests and cut-off used: NMP22 ≥ 5, 6.4, 7, 10 U/ml; cytology (VU), subjective assessment
Unit of analysis: cystoscopy (n = 274, NMP22 10 U/ml; n = 200, cytology)Sensitivity: 49% (NMP22 10 U/ml), 43% (cytology)Specificity: 92% (NMP22 10 U/ml), 92% (cytology)
Takeuchi 2004164a
Study design: case–control (nhd)Time period: Nov 1999 to May 2004Country: Japan
Enrolled: 669; analysed: 669No previous history of BC: 48; history of BC: 0Age (years): NSSex: NS
Tests and cut-off used: NMP22 ≥ 12 U/ml; cytology (VU), subjective assessment; NMP22 + cytology (VU)
Unit of analysis: patient (n = 669, NMP22; n = 699, cytology; n = 48, NMP22 + cytology)Sensitivity: 58% (NMP22), 44% (cytology), 60% (NMP22 + cytology)Specificity: 80% (NMP22), 100% (Cytology), NS (NMP22 + cytology)
Talwar 2007150
Study design: C-SDTime period: Mar 2004 to Apr 2006Country: India
Enrolled: 196; analysed: 196No previous history of BC: 127; history of BC: 63Age (years): mean 63, range 39 to 78Sex: 142 M, 54 F
Tests and cut-off used: NMP22 ≥ 10 U/ml; cytology (VU), subjective assessment
Unit of analysis: patient (n = 196)Sensitivity: 67% (NMP22), 22% (cytology)Specificity: 81% (NMP22), 99% (cytology)
Tetu 2005119
Study design: C-SDTime period: May 2000 to Jul 2002Country: Canada
Enrolled: 904; analysed: 870No previous history of BC: NS; history of BC: NSAge (years): NSSex: NS
Tests and cut-off used: ImmunoCyt, one green or one red fluorescent cell; cytology (VU), subjective assessment; ImmunoCyt + cytology (VU)
Unit of analysis: patient (n = 870)Sensitivity: 74% (ImmunoCyt), 29% (Cytology), 84% (ImmunoCyt + cytology)Specificity: 62% (ImmunoCyt), 98% (cytology), 61% (Immunocyt + cytology)
Tritschler 200780
Study design: C-SDTime period: Sep 2004 to Apr 2005Country: Germany
Enrolled: 100; analysed: 100 NMP22; 94 cytologyNo previous history of BC: 30; history of BC: 70Age (years): mean 68, range NSSex: 71 M, 29 F
Tests and cut-off used: NMP22 ≥ 10 U/ml; cytology (VU), subjective assessment; cytology (BW), subjective assessment
Unit of analysis: patient (n = 100, NMP22; n = 85, cytology (VU); n = 94, cytology (BW))Sensitivity: 65% (NMP22), 44% (cytology (VU)), 76% (cytology (BW))Specificity: 40% (NMP22), 78% (cytology (VU)), 62% (cytology (BW))
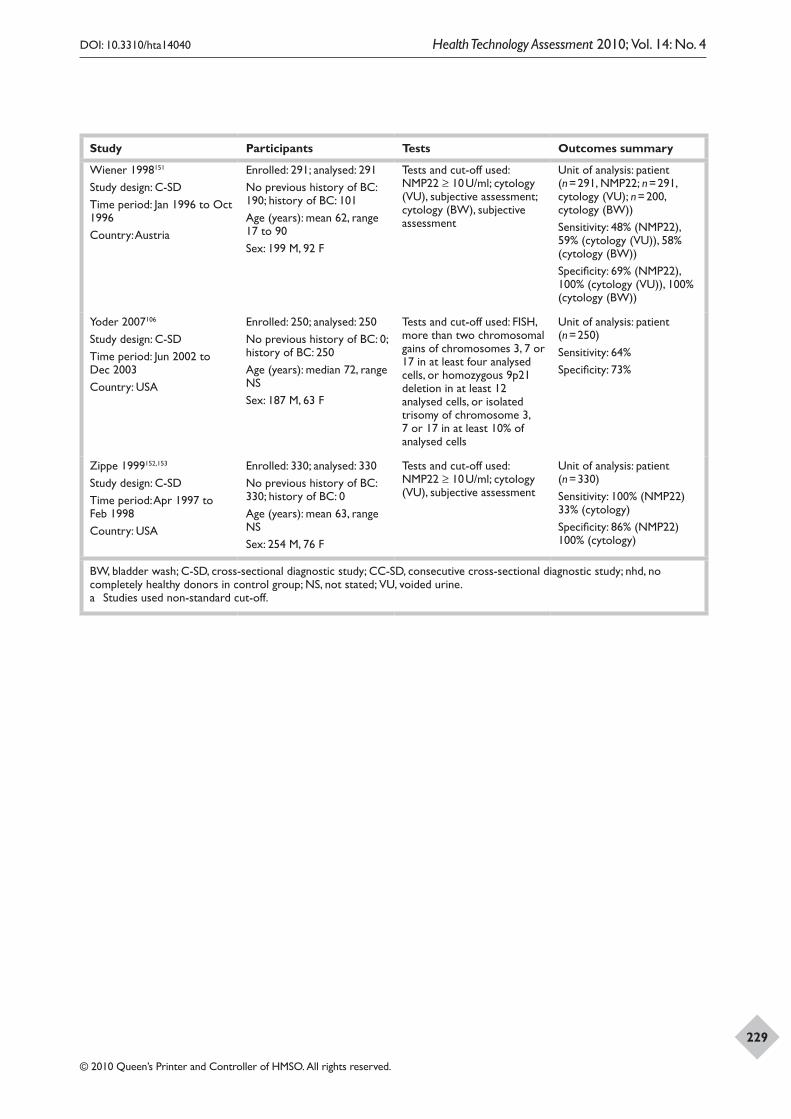
DOI: 10.3310/hta14040 Health Technology Assessment 2010; Vol. 14: No. 4
© 2010 Queen’s Printer and Controller of HMSO. All rights reserved.
229
Study Participants Tests Outcomes summary
Wiener 1998151
Study design: C-SDTime period: Jan 1996 to Oct 1996Country: Austria
Enrolled: 291; analysed: 291No previous history of BC: 190; history of BC: 101Age (years): mean 62, range 17 to 90Sex: 199 M, 92 F
Tests and cut-off used: NMP22 ≥ 10 U/ml; cytology (VU), subjective assessment; cytology (BW), subjective assessment
Unit of analysis: patient (n = 291, NMP22; n = 291, cytology (VU); n = 200, cytology (BW))Sensitivity: 48% (NMP22), 59% (cytology (VU)), 58% (cytology (BW))Specificity: 69% (NMP22), 100% (cytology (VU)), 100% (cytology (BW))
Yoder 2007106
Study design: C-SDTime period: Jun 2002 to Dec 2003Country: USA
Enrolled: 250; analysed: 250No previous history of BC: 0; history of BC: 250Age (years): median 72, range NSSex: 187 M, 63 F
Tests and cut-off used: FISH, more than two chromosomal gains of chromosomes 3, 7 or 17 in at least four analysed cells, or homozygous 9p21 deletion in at least 12 analysed cells, or isolated trisomy of chromosome 3, 7 or 17 in at least 10% of analysed cells
Unit of analysis: patient (n = 250)Sensitivity: 64%Specificity: 73%
Zippe 1999152,153
Study design: C-SDTime period: Apr 1997 to Feb 1998Country: USA
Enrolled: 330; analysed: 330No previous history of BC: 330; history of BC: 0Age (years): mean 63, range NSSex: 254 M, 76 F
Tests and cut-off used: NMP22 ≥ 10 U/ml; cytology (VU), subjective assessment
Unit of analysis: patient (n = 330)Sensitivity: 100% (NMP22) 33% (cytology)Specificity: 86% (NMP22) 100% (cytology)
BW, bladder wash; C-SD, cross-sectional diagnostic study; CC-SD, consecutive cross-sectional diagnostic study; nhd, no completely healthy donors in control group; NS, not stated; VU, voided urine.a Studies used non-standard cut-off.


DOI: 10.3310/hta14040 Health Technology Assessment 2010; Vol. 14: No. 4
© 2010 Queen’s Printer and Controller of HMSO. All rights reserved.
231
Appendix 13 Quality assessment results for the biomarker and cytology studies
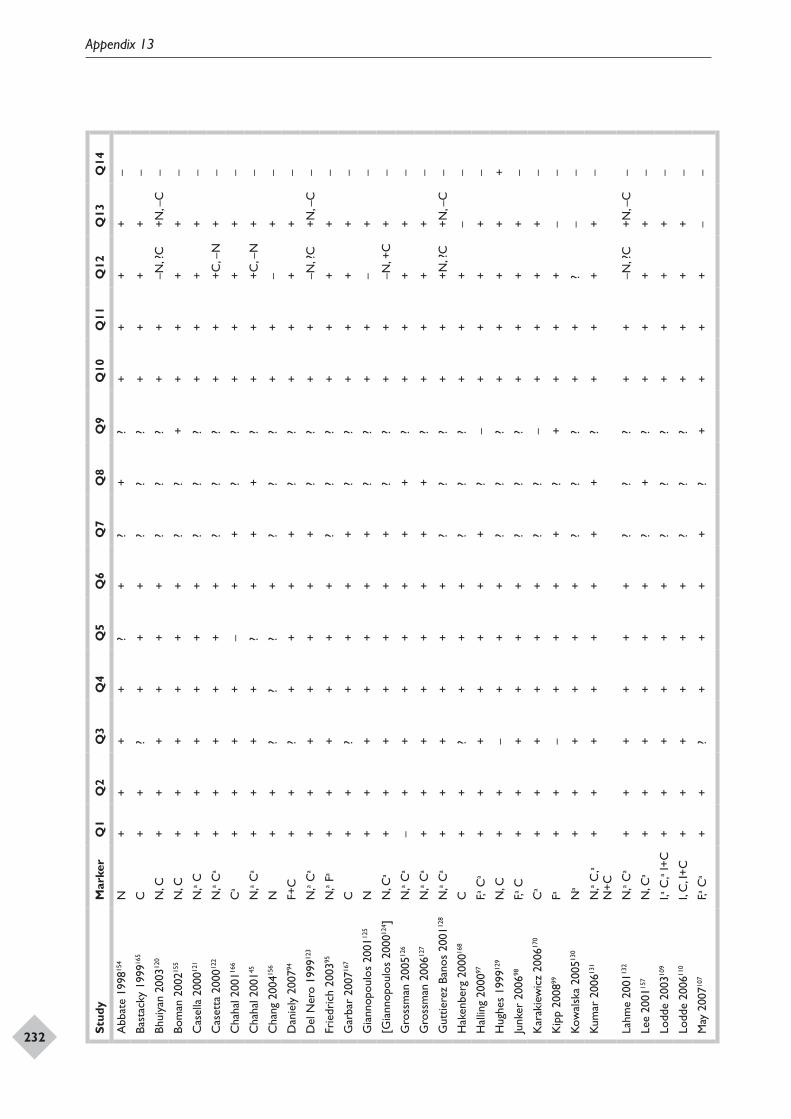
Appendix 13
232 Stud
yM
arke
rQ
1Q
2Q
3Q
4Q
5Q
6Q
7Q
8Q
9Q
10Q
11Q
12Q
13Q
14
Abb
ate
1998
154
N+
++
+?
+?
+?
++
++
–
Bast
acky
199
9165
C+
+?
++
+?
??
++
++
–
Bhui
yan
2003
120
N, C
++
++
++
??
?+
+–N
, ?C
+N, –
C–
Bom
an 2
00215
5N
, C+
++
++
+?
?+
++
++
–
Cas
ella
200
0121
N,a C
++
++
++
??
?+
++
+–
Cas
etta
200
0122
N,a C
a+
++
++
+?
??
++
+C, –
N+
–
Cha
hal 2
00116
6C
a+
++
+–
++
??
++
++
–
Cha
hal 2
00145
N,a C
a+
++
+?
++
+?
++
+C, –
N+
–
Cha
ng 2
00415
6N
++
??
?+
??
?+
+–
+–
Dan
iely
200
794F+
C+
+?
++
++
??
++
++
–
Del
Ner
o 19
9912
3N
,a Ca
++
++
++
+?
?+
+–N
, ?C
+N, –
C–
Frie
dric
h 20
0395
N,a F
a+
++
++
+?
??
++
++
–
Gar
bar
2007
167
C+
+?
++
++
??
++
++
–
Gia
nnop
oulo
s 20
0112
5N
++
++
++
+?
?+
+–
+–
[Gia
nnop
oulo
s 20
0012
4 ]N
, Ca
++
++
++
+?
?+
+–N
, +C
+–
Gro
ssm
an 2
00512
6N
,a Ca
–+
++
++
++
?+
++
+–
Gro
ssm
an 2
00612
7N
,a Ca
++
++
++
++
?+
++
+–
Gut
tiere
z Ba
nos
2001
128
N,a C
a+
++
++
+?
??
++
+N, ?
C+N
, –C
–
Hak
enbe
rg 2
00016
8C
++
?+
++
??
?+
++
––
Hal
ling
2000
97F,a C
a+
++
++
++
?–
++
++
–
Hug
hes
1999
129
N, C
++
–+
++
??
?+
++
++
Junk
er 2
00698
F,a C+
++
++
+?
??
++
++
–
Kar
akie
wic
z 20
0617
0C
a+
++
++
+?
?–
++
++
–
Kip
p 20
0899
Fa+
+–
++
++
?+
++
+–
–
Kow
alsk
a 20
0513
0N
a+
++
++
+?
??
++
?–
–
Kum
ar 2
00613
1N
,a C,a
N+C
++
++
++
++
?+
++
+–
Lahm
e 20
0113
2N
,a Ca
++
++
++
??
?+
+–N
, ?C
+N, –
C–
Lee
2001
157
N, C
a+
++
++
+?
+?
++
++
–
Lodd
e 20
0310
9I,a C
,a I+C
++
++
++
??
?+
++
+–
Lodd
e 20
0611
0I,
C, I
+C+
++
++
+?
??
++
++
–
May
200
7107
F,a Ca
++
?+
++
+?
++
++
––
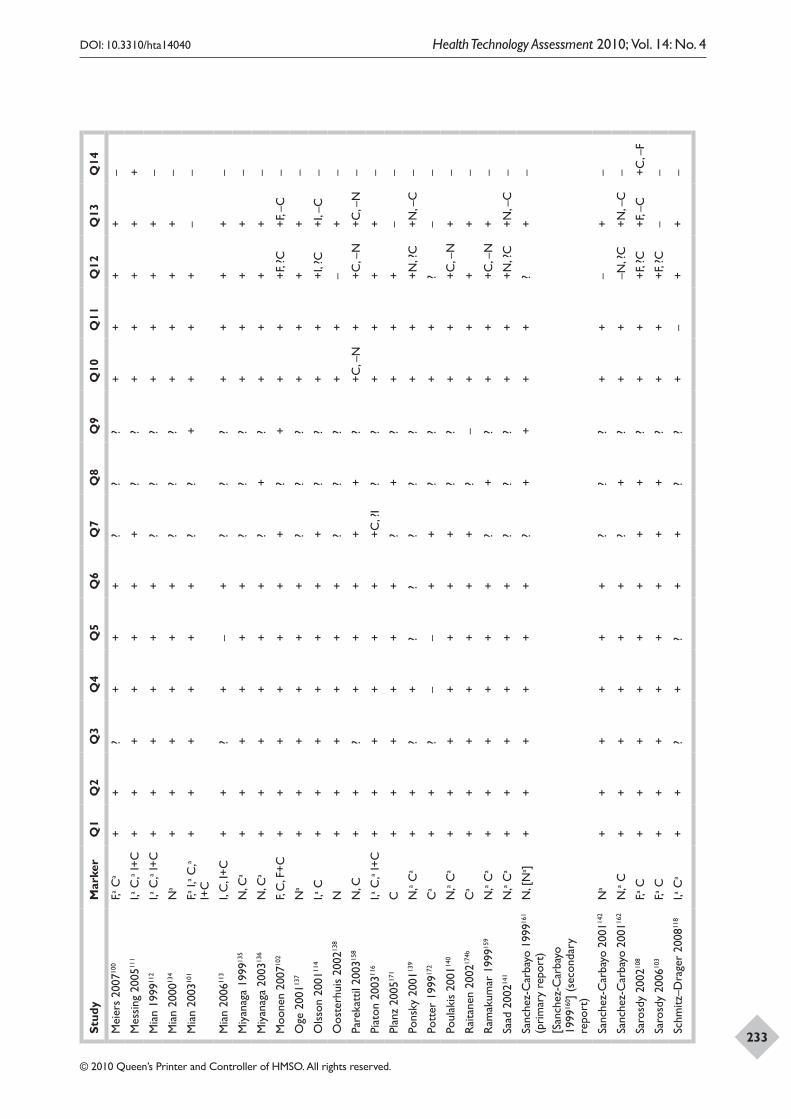
DOI: 10.3310/hta14040 Health Technology Assessment 2010; Vol. 14: No. 4
© 2010 Queen’s Printer and Controller of HMSO. All rights reserved.
233Stud
yM
arke
rQ
1Q
2Q
3Q
4Q
5Q
6Q
7Q
8Q
9Q
10Q
11Q
12Q
13Q
14
Mei
ers
2007
100
F,a Ca
++
?+
++
??
?+
++
+–
Mes
sing
200
5111
I,a C,a I
+C+
++
++
++
??
++
++
+
Mia
n 19
9911
2I,a C
,a I+C
++
++
++
??
?+
++
+–
Mia
n 20
0013
4N
a+
++
++
+?
??
++
++
–
Mia
n 20
0310
1F,a I
,a C,a
I+C
++
++
++
??
++
++
––
Mia
n 20
0611
3I,
C, I
+C+
+?
+–
+?
??
++
++
–
Miy
anag
a 19
9913
5N
, Ca
++
++
++
??
?+
++
+–
Miy
anag
a 20
0313
6N
, Ca
++
++
++
?+
?+
++
+–
Moo
nen
2007
102
F, C
, F+C
++
++
++
+?
++
++F
, ?C
+F, –
C–
Oge
200
1137
Na
++
++
++
??
?+
++
+–
Ols
son
2001
114
I,a C+
++
++
++
??
++
+I, ?
C+I
, –C
–
Oos
terh
uis
2002
138
N+
++
++
+?
??
++
–+
–
Pare
katt
il 20
0315
8N
, C+
+?
++
++
+?
+C, –
N+
+C, –
N+C
, –N
–
Piat
on 2
00311
6I,a C
,a I+C
++
++
++
+C, ?
I?
?+
++
+–
Plan
z 20
0517
1C
++
++
++
?+
?+
++
––
Pons
ky 2
00113
9N
,a Ca
++
?+
??
??
?+
++N
, ?C
+N, –
C–
Pott
er 1
99917
2C
a+
+?
––
++
??
++
?–
–
Poul
akis
200
1140
N,a C
a+
++
++
++
??
++
+C, –
N+
–
Rai
tane
n 20
0217
4bC
a+
++
++
++
?–
++
++
–
Ram
akum
ar 1
99915
9N
,a Ca
++
++
++
?+
?+
++C
, –N
+–
Saad
200
2141
N,a C
a+
++
++
+?
??
++
+N, ?
C+N
, –C
–
Sanc
hez-
Car
bayo
199
9161
(pri
mar
y re
port
)[S
anch
ez-C
arba
yo
1999
160 ]
(se
cond
ary
repo
rt)
N, [
Na ]
++
++
++
?+
++
+?
+–
Sanc
hez-
Car
bayo
200
1142
Na
++
++
++
??
?+
+–
+–
Sanc
hez-
Car
bayo
200
1162
N,a C
++
++
++
?+
?+
+–N
, ?C
+N, –
C–
Saro
sdy
2002
108
F,a C+
++
++
++
+?
++
+F, ?
C+F
, –C
+C, –
F
Saro
sdy
2006
103
F,a C+
++
++
++
+?
++
+F, ?
C–
–
Schm
itz–D
rage
r 20
0811
8I,a C
a+
+?
+?
++
??
+–
++
–
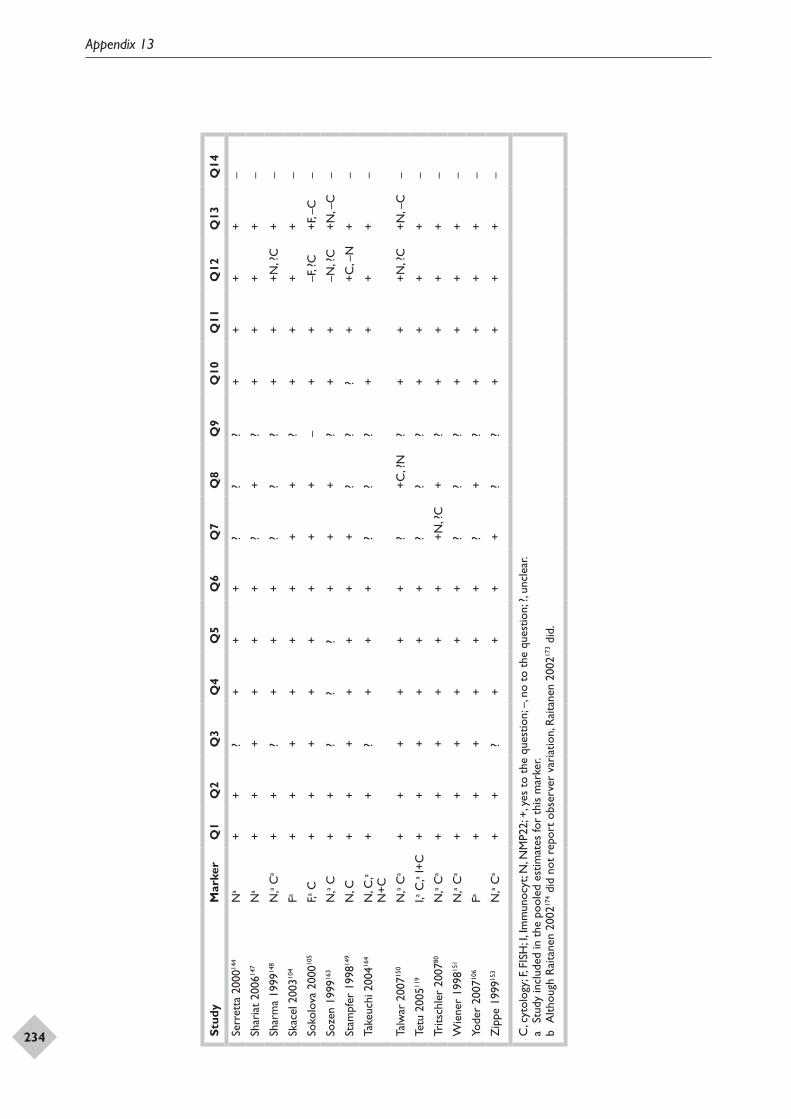
Appendix 13
234 Stud
yM
arke
rQ
1Q
2Q
3Q
4Q
5Q
6Q
7Q
8Q
9Q
10Q
11Q
12Q
13Q
14
Serr
etta
200
0144
Na
++
?+
++
??
?+
++
+–
Shar
iat
2006
147
Na
++
++
++
?+
?+
++
+–
Shar
ma
1999
148
N,a C
a+
+?
++
+?
??
++
+N, ?
C+
–
Skac
el 2
00310
4Fa
++
++
++
++
?+
++
+–
Soko
lova
200
0105
F,a C+
++
++
++
+–
++
–F, ?
C+F
, –C
–
Soze
n 19
9916
3N
,a C+
+?
??
++
+?
++
–N, ?
C+N
, –C
–
Stam
pfer
199
8149
N, C
++
++
++
+?
??
++C
, –N
+–
Take
uchi
200
4164
N, C
,a N
+C+
+?
++
+?
??
++
++
–
Talw
ar 2
00715
0N
,a Ca
++
++
++
?+C
, ?N
?+
++N
, ?C
+N, –
C–
Tetu
200
5119
I,a C,a I
+C+
++
++
+?
??
++
++
–
Trits
chle
r 20
0780
N,a C
a+
++
++
++N
, ?C
+?
++
++
–
Wie
ner
1998
151
N,a C
a+
++
++
+?
??
++
++
–
Yode
r 20
0710
6Fa
++
++
++
?+
?+
++
+–
Zip
pe 1
99915
3N
,a Ca
++
?+
++
+?
?+
++
+–
C, c
ytol
ogy;
F, FI
SH; I
, Im
mun
ocyt
; N, N
MP2
2; +
, yes
to
the
ques
tion;
–, n
o to
the
que
stio
n; ?
, unc
lear
.a
Stud
y in
clud
ed in
the
poo
led
estim
ates
for
this
mar
ker.
b A
lthou
gh R
aita
nen
2002
174 d
id n
ot r
epor
t ob
serv
er v
aria
tion,
Rai
tane
n 20
0217
3 did
.
DOI: 10.3310/hta14040 Health Technology Assessment 2010; Vol. 14: No. 4
© 2010 Queen’s Printer and Controller of HMSO. All rights reserved.
235
Appendix 14 Studies of biomarkers included in pooled
estimates for patient-level analysis and also those reporting specimen and stage/grade
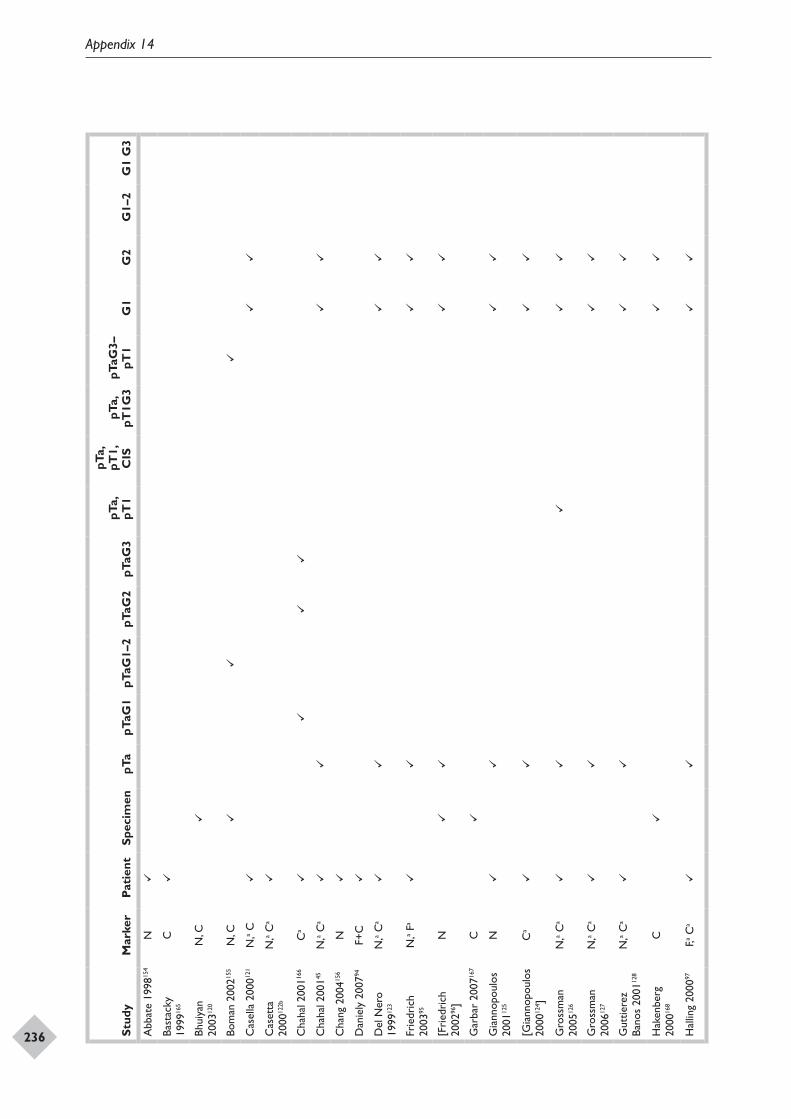
Appendix 14
236 Stud
yM
arke
rPa
tien
tSp
ecim
enpT
apT
aG1
pTaG
1–2
pTaG
2pT
aG3
pTa,
pT
1
pTa,
pT
1,
CIS
pTa,
pT
1G3
pTaG
3–pT
1G
1G
2G
1–2
G1
G3
Abb
ate
1998
154
N
Bast
acky
19
9916
5C
Bhui
yan
2003
120
N, C
Bom
an 2
00215
5N
, C
Cas
ella
200
0121
N,a C
Cas
etta
20
0012
2bN
,a Ca
Cha
hal 2
00116
6C
a
Cha
hal 2
00145
N,a C
a
Cha
ng 2
00415
6N
Dan
iely
200
794F+
C
Del
Ner
o 19
9912
3N
,a Ca
Frie
dric
h 20
0395
N,a F
a
[Fri
edri
ch
2002
96]
N
Gar
bar
2007
167
C
Gia
nnop
oulo
s 20
0112
5N
[Gia
nnop
oulo
s 20
0012
4 ]C
a
Gro
ssm
an
2005
126
N,a C
a
Gro
ssm
an
2006
127
N,a C
a
Gut
tiere
z Ba
nos
2001
128
N,a C
a
Hak
enbe
rg
2000
168
C
Hal
ling
2000
97F,a C
a
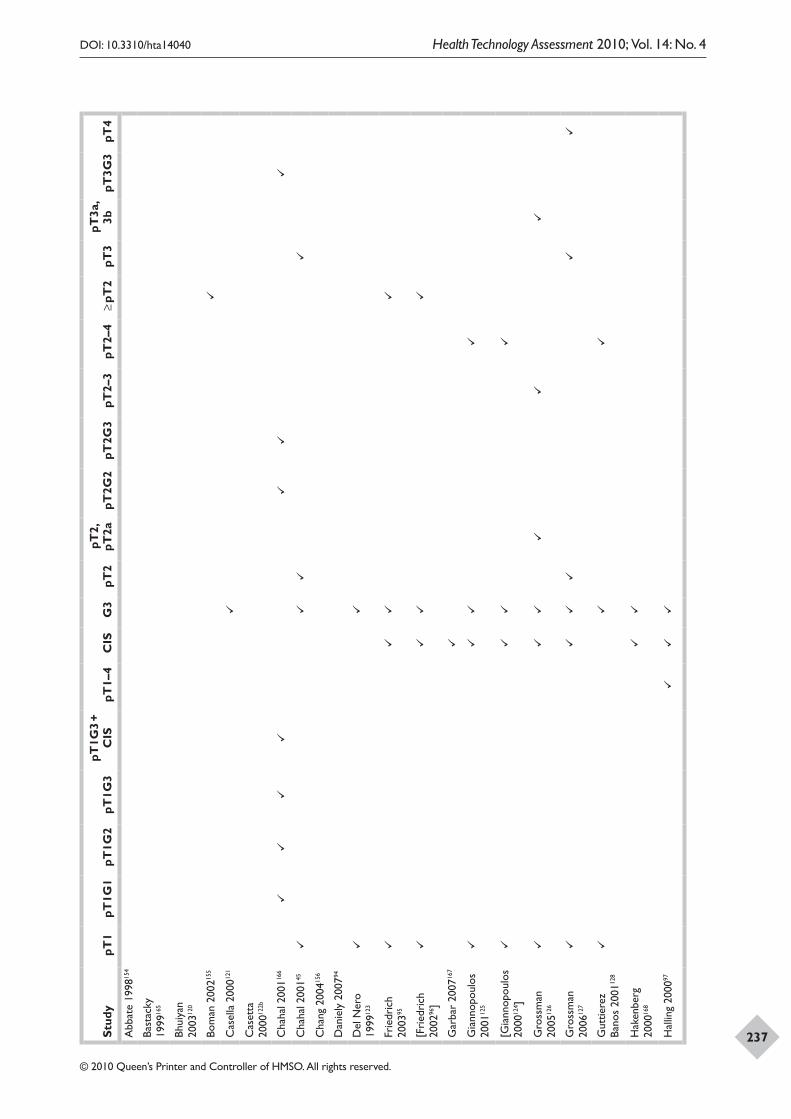
DOI: 10.3310/hta14040 Health Technology Assessment 2010; Vol. 14: No. 4
© 2010 Queen’s Printer and Controller of HMSO. All rights reserved.
237Stud
ypT
1pT
1G1
pT1G
2pT
1G3
pT1G
3 +
CIS
pT1–
4C
ISG
3pT
2pT
2,
pT2a
pT2G
2pT
2G3
pT2–
3pT
2–4
≥ pT
2pT
3pT
3a,
3bpT
3G3
pT4
Abb
ate
1998
154
Bast
acky
19
9916
5
Bhui
yan
2003
120
Bom
an 2
00215
5
Cas
ella
200
0121
Cas
etta
20
0012
2b
Cha
hal 2
00116
6
Cha
hal 2
00145
Cha
ng 2
00415
6
Dan
iely
200
794
Del
Ner
o 19
9912
3
Frie
dric
h 20
0395
[Fri
edri
ch
2002
96]
Gar
bar
2007
167
Gia
nnop
oulo
s 20
0112
5
[Gia
nnop
oulo
s 20
0012
4 ]
Gro
ssm
an
2005
126
Gro
ssm
an
2006
127
Gut
tiere
z Ba
nos
2001
128
Hak
enbe
rg
2000
168
Hal
ling
2000
97
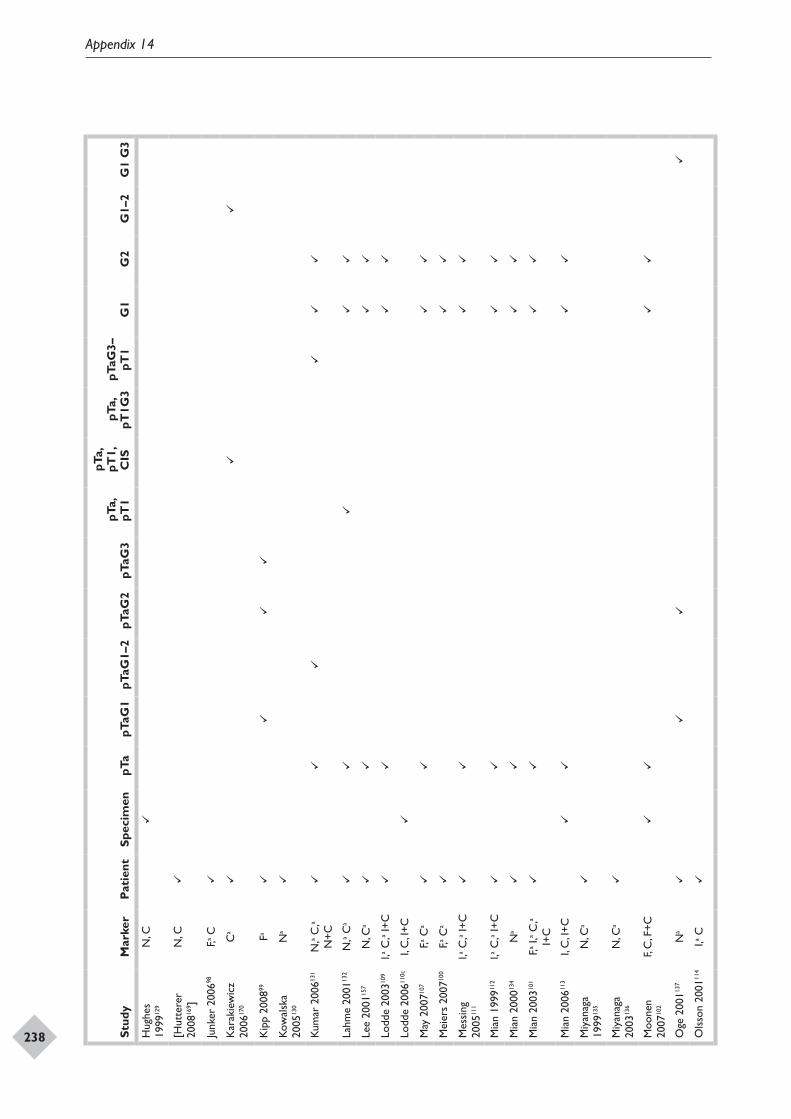
Appendix 14
238 Stud
yM
arke
rPa
tien
tSp
ecim
enpT
apT
aG1
pTaG
1–2
pTaG
2pT
aG3
pTa,
pT
1
pTa,
pT
1,
CIS
pTa,
pT
1G3
pTaG
3–pT
1G
1G
2G
1–2
G1
G3
Hug
hes
1999
129
N, C
[Hut
tere
r 20
0816
9 ]N
, C
Junk
er 2
00698
F,a C
Kar
akie
wic
z 20
0617
0C
a
Kip
p 20
0899
Fa
Kow
alsk
a 20
0513
0N
a
Kum
ar 2
00613
1N
,a C,a
N+C
Lahm
e 20
0113
2N
,a Ca
Lee
2001
157
N, C
a
Lodd
e 20
0310
9I,a C
,a I+C
Lodd
e 20
0611
0cI,
C, I
+C
May
200
7107
F,a Ca
Mei
ers
2007
100
F,a Ca
Mes
sing
20
0511
1I,a C
,a I+C
Mia
n 19
9911
2I,a C
,a I+C
Mia
n 20
0013
4N
a
Mia
n 20
0310
1F,a I
,a C,a
I+C
Mia
n 20
0611
3I,
C, I
+C
Miy
anag
a 19
9913
5N
, Ca
Miy
anag
a 20
0313
6N
, Ca
Moo
nen
2007
102
F, C
, F+C
Oge
200
1137
Na
Ols
son
2001
114
I,a C
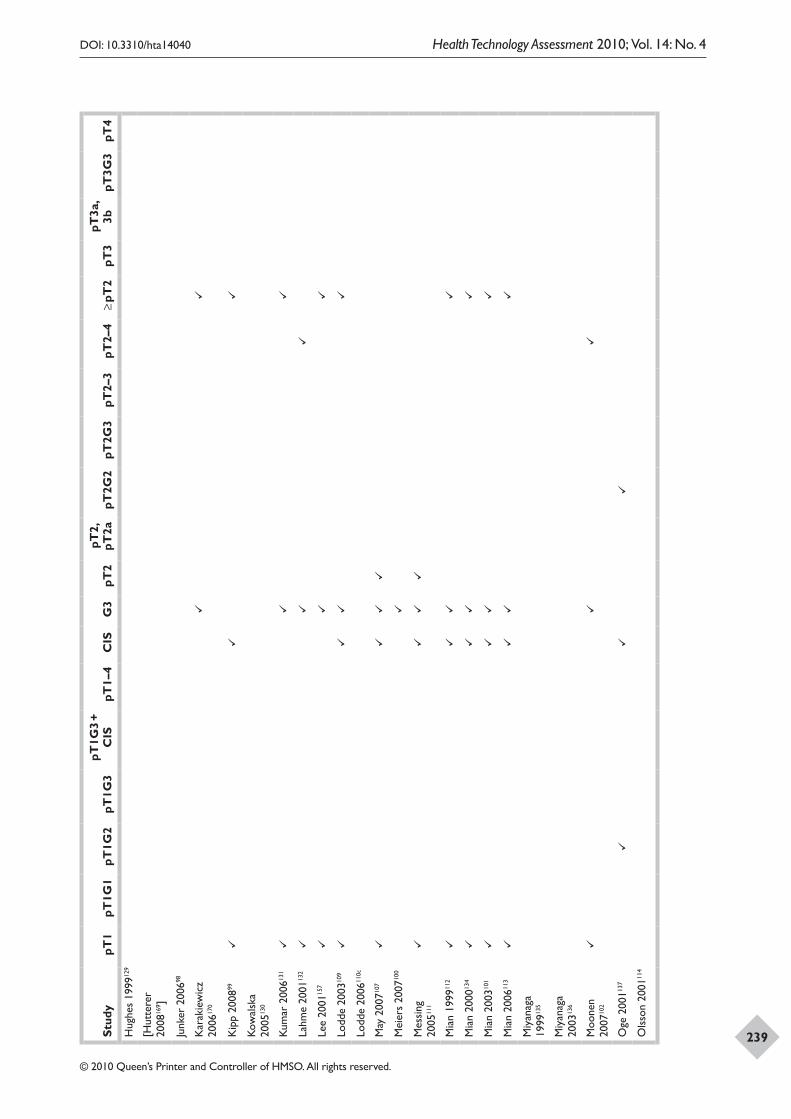
DOI: 10.3310/hta14040 Health Technology Assessment 2010; Vol. 14: No. 4
© 2010 Queen’s Printer and Controller of HMSO. All rights reserved.
239Stud
ypT
1pT
1G1
pT1G
2pT
1G3
pT1G
3 +
CIS
pT1–
4C
ISG
3pT
2pT
2,
pT2a
pT2G
2pT
2G3
pT2–
3pT
2–4
≥ pT
2pT
3pT
3a,
3bpT
3G3
pT4
Hug
hes
1999
129
[Hut
tere
r 20
0816
9 ]
Junk
er 2
00698
Kar
akie
wic
z 20
0617
0
Kip
p 20
0899
Kow
alsk
a 20
0513
0
Kum
ar 2
00613
1
Lahm
e 20
0113
2
Lee
2001
157
Lodd
e 20
0310
9
Lodd
e 20
0611
0c
May
200
7107
Mei
ers
2007
100
Mes
sing
20
0511
1
Mia
n 19
9911
2
Mia
n 20
0013
4
Mia
n 20
0310
1
Mia
n 20
0611
3
Miy
anag
a 19
9913
5
Miy
anag
a 20
0313
6
Moo
nen
2007
102
Oge
200
1137
Ols
son
2001
114
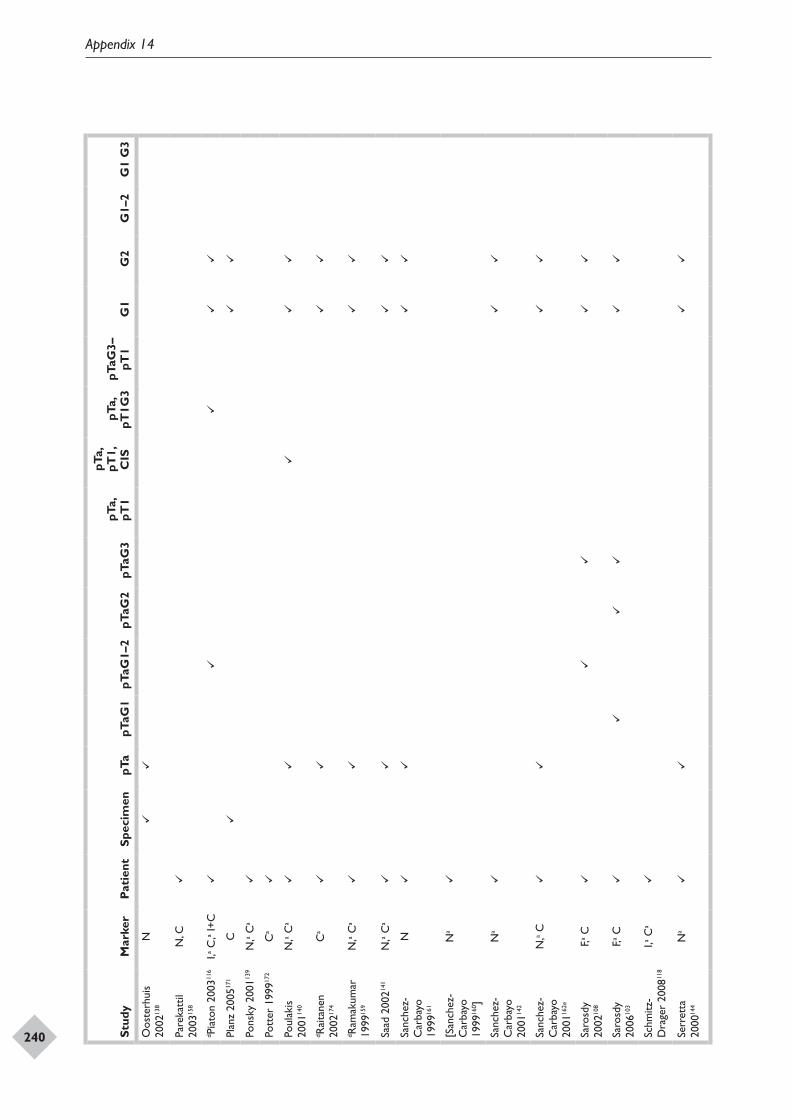
Appendix 14
240 Stud
yM
arke
rPa
tien
tSp
ecim
enpT
apT
aG1
pTaG
1–2
pTaG
2pT
aG3
pTa,
pT
1
pTa,
pT
1,
CIS
pTa,
pT
1G3
pTaG
3–pT
1G
1G
2G
1–2
G1
G3
Oos
terh
uis
2002
138
N
Pare
katt
il 20
0315
8N
, C
d Pia
ton
2003
116
I,a C,a I
+C
Plan
z 20
0517
1C
Pons
ky 2
00113
9N
,a Ca
Pott
er 1
99917
2C
a
Poul
akis
20
0114
0N
,a Ca
d Rai
tane
n 20
0217
4C
a
d Ram
akum
ar
1999
159
N,a C
a
Saad
200
2141
N,a C
a
Sanc
hez-
Car
bayo
19
9916
1
N
[San
chez
-C
arba
yo
1999
160 ]
Na
Sanc
hez-
Car
bayo
20
0114
2
Na
Sanc
hez-
Car
bayo
20
0116
2e
N,a C
Saro
sdy
2002
108
F,a C
Saro
sdy
2006
103
F,a C
Schm
itz-
Dra
ger
2008
118
I,a Ca
Serr
etta
20
0014
4N
a
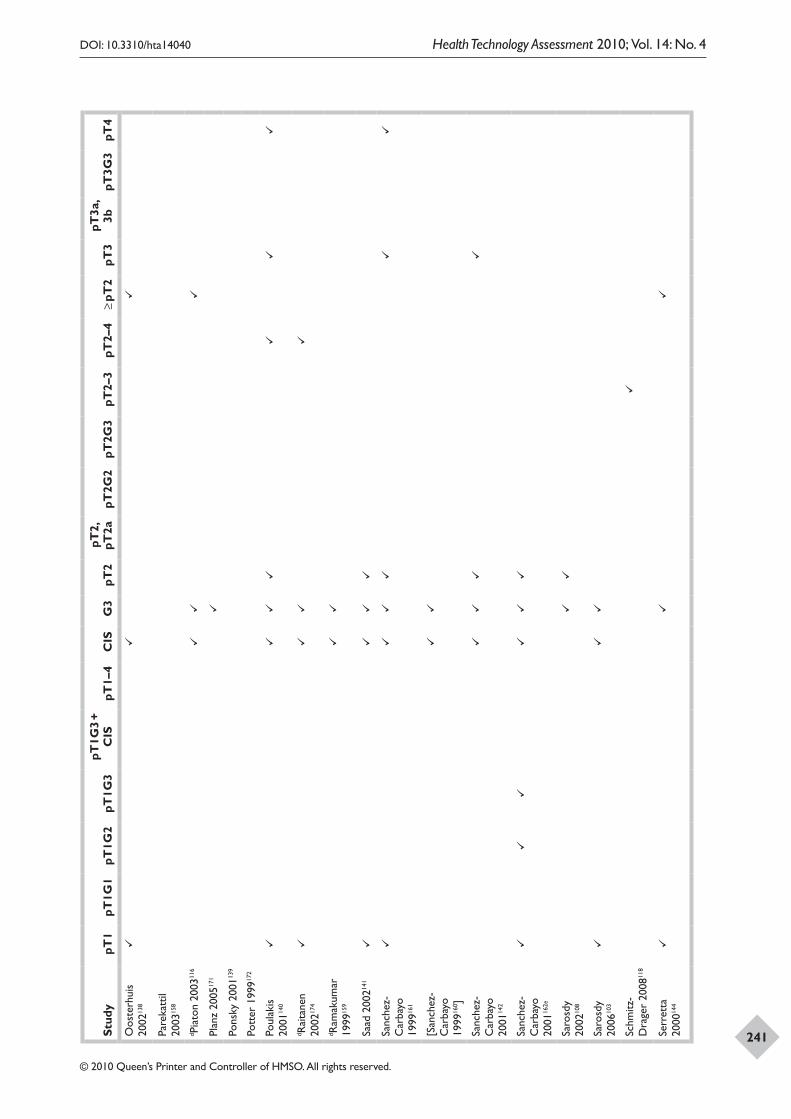
DOI: 10.3310/hta14040 Health Technology Assessment 2010; Vol. 14: No. 4
© 2010 Queen’s Printer and Controller of HMSO. All rights reserved.
241Stud
ypT
1pT
1G1
pT1G
2pT
1G3
pT1G
3 +
CIS
pT1–
4C
ISG
3pT
2pT
2,
pT2a
pT2G
2pT
2G3
pT2–
3pT
2–4
≥ pT
2pT
3pT
3a,
3bpT
3G3
pT4
Oos
terh
uis
2002
138
Pare
katt
il 20
0315
8
d Pia
ton
2003
116
Plan
z 20
0517
1
Pons
ky 2
00113
9
Pott
er 1
99917
2
Poul
akis
20
0114
0
d Rai
tane
n 20
0217
4
d Ram
akum
ar
1999
159
Saad
200
2141
Sanc
hez-
Car
bayo
19
9916
1
[San
chez
-C
arba
yo
1999
160 ]
Sanc
hez-
Car
bayo
20
0114
2
Sanc
hez-
Car
bayo
20
0116
2e
Saro
sdy
2002
108
Saro
sdy
2006
103
Schm
itz-
Dra
ger
2008
118
Serr
etta
20
0014
4
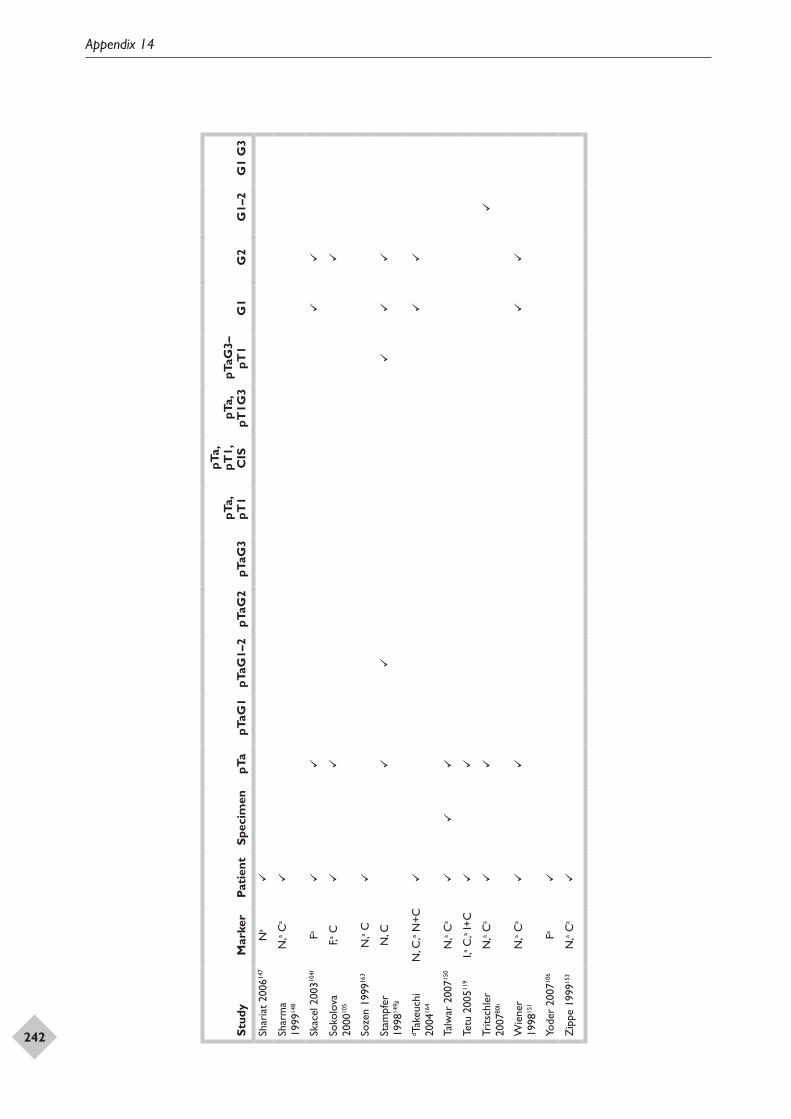
Appendix 14
242 Stud
yM
arke
rPa
tien
tSp
ecim
enpT
apT
aG1
pTaG
1–2
pTaG
2pT
aG3
pTa,
pT
1
pTa,
pT
1,
CIS
pTa,
pT
1G3
pTaG
3–pT
1G
1G
2G
1–2
G1
G3
Shar
iat
2006
147
Na
Shar
ma
1999
148
N,a C
a
Skac
el 2
00310
4fFa
Soko
lova
20
0010
5F,a C
Soze
n 19
9916
3N
,a C
Stam
pfer
19
9814
9gN
, C
d Tak
euch
i 20
0416
4N
, C,a N
+C
Talw
ar 2
00715
0N
,a Ca
Tetu
200
5119
I,a C,a I
+C
Trits
chle
r 20
0780
hN
,a Ca
Wie
ner
1998
151
N,a C
a
Yode
r 20
0710
6Fa
Zip
pe 1
99915
3N
,a Ca
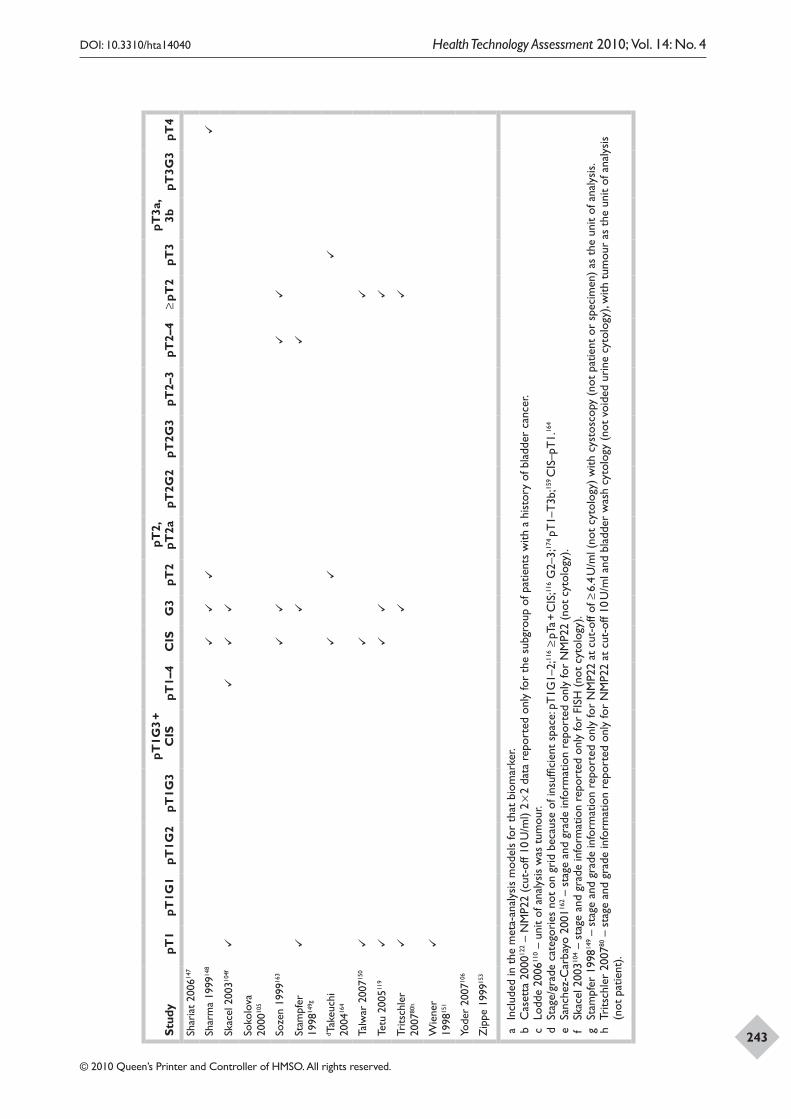
DOI: 10.3310/hta14040 Health Technology Assessment 2010; Vol. 14: No. 4
© 2010 Queen’s Printer and Controller of HMSO. All rights reserved.
243Stud
ypT
1pT
1G1
pT1G
2pT
1G3
pT1G
3 +
CIS
pT1–
4C
ISG
3pT
2pT
2,
pT2a
pT2G
2pT
2G3
pT2–
3pT
2–4
≥ pT
2pT
3pT
3a,
3bpT
3G3
pT4
Shar
iat
2006
147
Shar
ma
1999
148
Skac
el 2
00310
4f
Soko
lova
20
0010
5
Soze
n 19
9916
3
Stam
pfer
19
9814
9g
d Tak
euch
i 20
0416
4
Talw
ar 2
00715
0
Tetu
200
5119
Trits
chle
r 20
0780
h
Wie
ner
1998
151
Yode
r 20
0710
6
Zip
pe 1
99915
3
a In
clud
ed in
the
met
a-an
alys
is m
odel
s fo
r th
at b
iom
arke
r.b
Cas
etta
200
0122 –
NM
P22
(cut
-off
10 U
/ml)
2 ×
2 da
ta r
epor
ted
only
for
the
subg
roup
of p
atie
nts
with
a h
isto
ry o
f bla
dder
can
cer.
c Lo
dde
2006
110 –
uni
t of
ana
lysi
s w
as t
umou
r.d
Stag
e/gr
ade
cate
gori
es n
ot o
n gr
id b
ecau
se o
f ins
uffic
ient
spa
ce: p
T1G
1–2;
116 ≥
pTa +
CIS
;116 G
2–3;
174 pT
1–T
3b;15
9 C
IS–p
T1.
164
e Sa
nche
z-C
arba
yo 2
00116
2 – s
tage
and
gra
de in
form
atio
n re
port
ed o
nly
for
NM
P22
(not
cyt
olog
y).
f Sk
acel
200
3104 –
sta
ge a
nd g
rade
info
rmat
ion
repo
rted
onl
y fo
r FI
SH (
not
cyto
logy
).g
Stam
pfer
199
8149 –
sta
ge a
nd g
rade
info
rmat
ion
repo
rted
onl
y fo
r N
MP2
2 at
cut
-off
of ≥
6.4
U/m
l (no
t cy
tolo
gy)
with
cys
tosc
opy
(not
pat
ient
or
spec
imen
) as
the
uni
t of
ana
lysi
s.h
Trits
chle
r 20
0780
– s
tage
and
gra
de in
form
atio
n re
port
ed o
nly
for
NM
P22
at c
ut-o
ff 10
U/m
l and
bla
dder
was
h cy
tolo
gy (
not
void
ed u
rine
cyt
olog
y), w
ith t
umou
r as
the
uni
t of
ana
lysi
s (n
ot p
atie
nt).

DOI: 10.3310/hta14040 Health Technology Assessment 2010; Vol. 14: No. 4
© 2010 Queen’s Printer and Controller of HMSO. All rights reserved.
245
Appendix 15 Biomarker and cytology test
performance for detecting bladder cancer, results table with 2 × 2 data
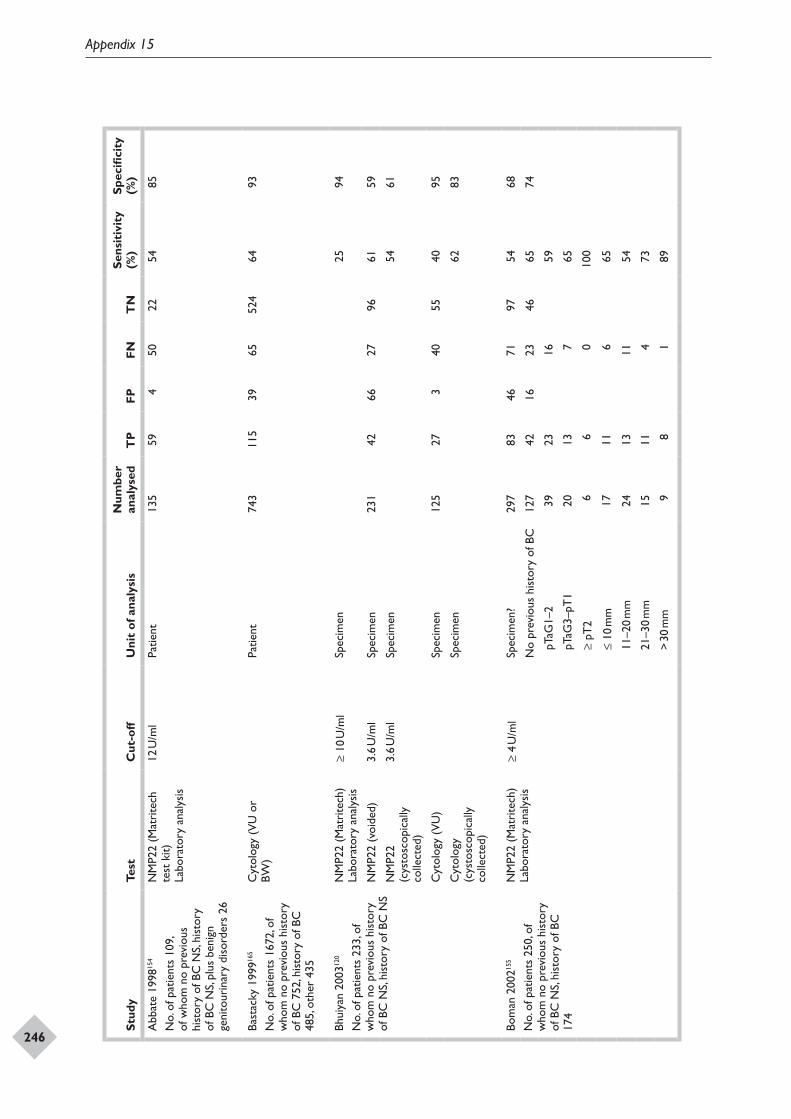
Appendix 15
246
Stud
yTe
stC
ut-o
ffU
nit
of a
naly
sis
Num
ber
anal
ysed
TP
FPFN
TN
Sens
itiv
ity
(%)
Spec
ifici
ty
(%)
Abb
ate
1998
154
No.
of p
atie
nts
109,
of
who
m n
o pr
evio
us
hist
ory
of B
C N
S, hi
stor
y of
BC
NS,
plus
ben
ign
geni
tour
inar
y di
sord
ers
26
NM
P22
(Mat
rite
ch
test
kit)
Labo
rato
ry a
naly
sis
12 U
/ml
Patie
nt13
559
450
2254
85
Bast
acky
199
9165
No.
of p
atie
nts
1672
, of
who
m n
o pr
evio
us h
isto
ry
of B
C 7
52, h
isto
ry o
f BC
48
5, o
ther
435
Cyt
olog
y (V
U o
r BW
)Pa
tient
743
115
3965
524
6493
Bhui
yan
2003
120
No.
of p
atie
nts
233,
of
who
m n
o pr
evio
us h
isto
ry
of B
C N
S, hi
stor
y of
BC
NS
NM
P22
(Mat
rite
ch)
Labo
rato
ry a
naly
sis
≥ 10
U/m
lSp
ecim
en25
94
NM
P22
(voi
ded)
3.6
U/m
lSp
ecim
en23
142
6627
9661
59
NM
P22
(cys
tosc
opic
ally
co
llect
ed)
3.6
U/m
lSp
ecim
en54
61
Cyt
olog
y (V
U)
Spec
imen
125
273
4055
4095
Cyt
olog
y (c
ysto
scop
ical
ly
colle
cted
)
Spec
imen
6283
Bom
an 2
00215
5
No.
of p
atie
nts
250,
of
who
m n
o pr
evio
us h
isto
ry
of B
C N
S, hi
stor
y of
BC
17
4
NM
P22
(Mat
rite
ch)
Labo
rato
ry a
naly
sis
≥ 4
U/m
lSp
ecim
en?
297
8346
7197
5468
No
prev
ious
his
tory
of B
C12
742
1623
4665
74
pT
aG1–
239
2316
59
pT
aG3–
pT1
2013
765
≥
pT2
66
010
0
≤
10 m
m17
116
65
11
–20
mm
2413
1154
21
–30
mm
1511
473
>
30 m
m9
81
89
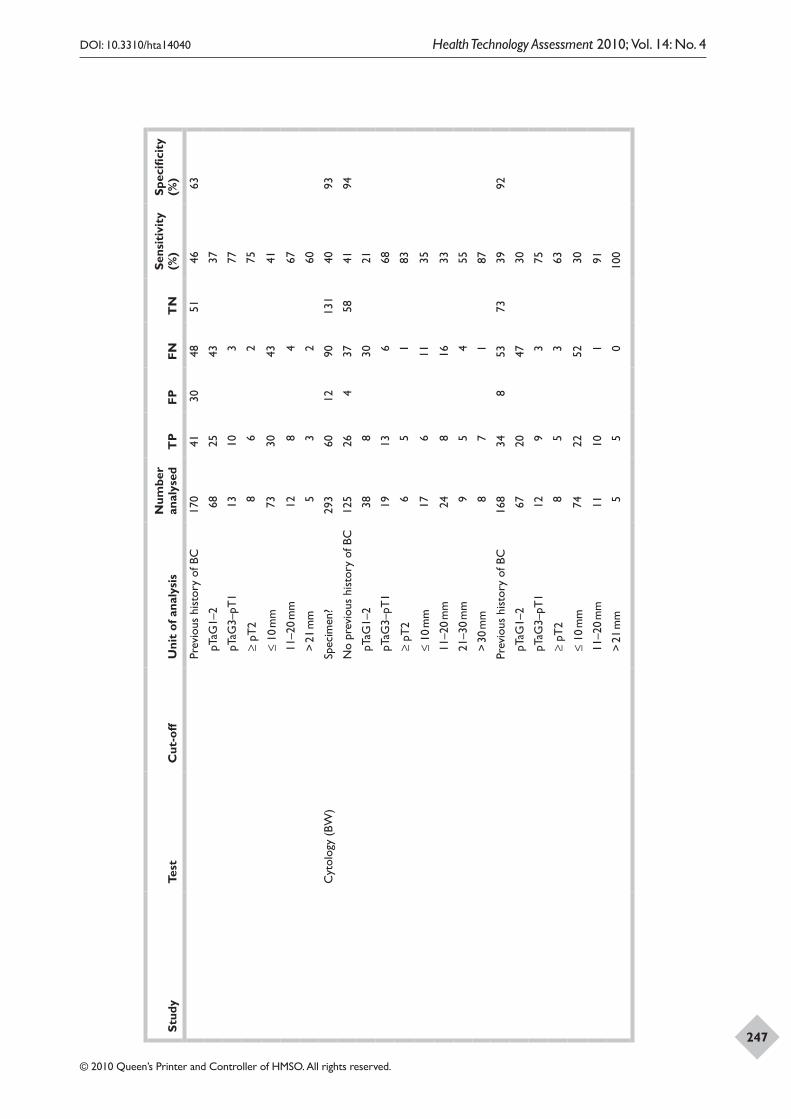
DOI: 10.3310/hta14040 Health Technology Assessment 2010; Vol. 14: No. 4
© 2010 Queen’s Printer and Controller of HMSO. All rights reserved.
247
Stud
yTe
stC
ut-o
ffU
nit
of a
naly
sis
Num
ber
anal
ysed
TP
FPFN
TN
Sens
itiv
ity
(%)
Spec
ifici
ty
(%)
Prev
ious
his
tory
of B
C17
041
3048
5146
63
pT
aG1–
268
2543
37
pT
aG3–
pT1
1310
377
≥
pT2
86
275
≤
10 m
m73
3043
41
11
–20
mm
128
467
>
21 m
m5
32
60
Cyt
olog
y (B
W)
Spec
imen
?29
360
1290
131
4093
No
prev
ious
his
tory
of B
C12
526
437
5841
94
pT
aG1–
238
830
21
pT
aG3–
pT1
1913
668
≥
pT2
65
183
≤
10 m
m17
611
35
11
–20
mm
248
1633
21
–30
mm
95
455
>
30 m
m8
71
87
Prev
ious
his
tory
of B
C16
834
853
7339
92
pT
aG1–
267
2047
30
pT
aG3–
pT1
129
375
≥
pT2
85
363
≤
10 m
m74
2252
30
11
–20
mm
1110
191
>
21 m
m5
50
100
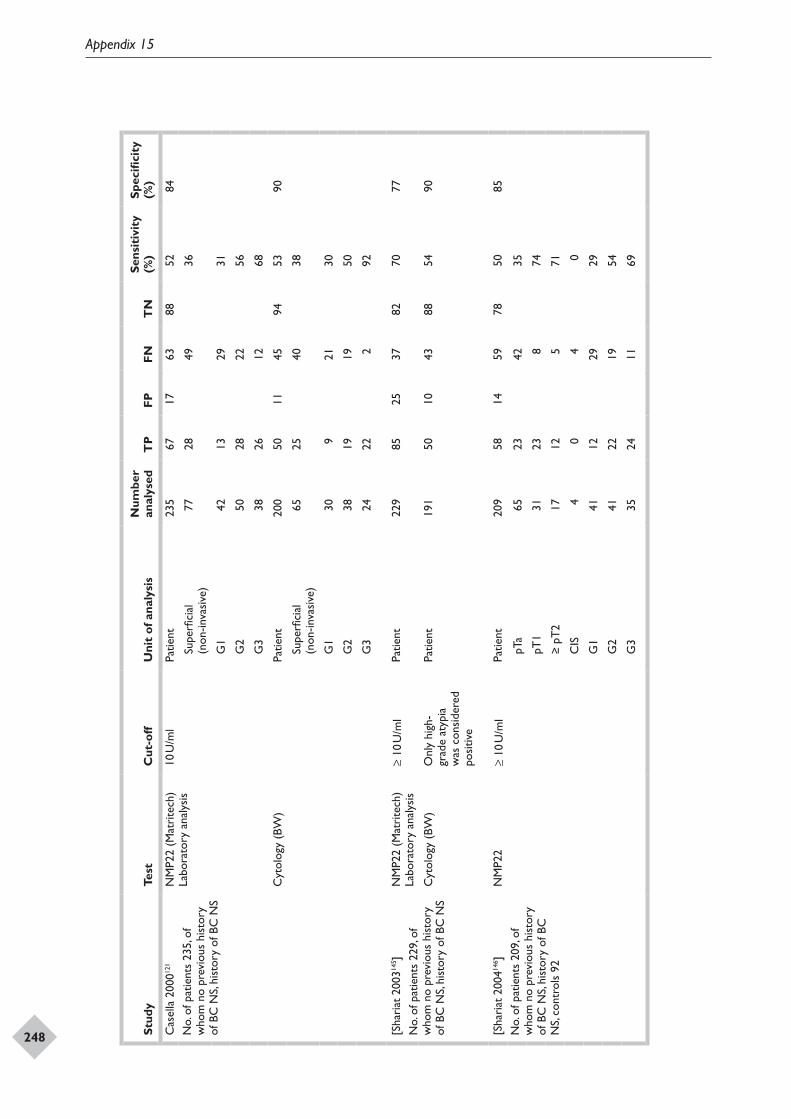
Appendix 15
248
DOI: 10.3310/hta14040 Health Technology Assessment 2010; Vol. 14: No. 4
© 2010 Queen’s Printer and Controller of HMSO. All rights reserved.
249Stud
yTe
stC
ut-o
ffU
nit
of a
naly
sis
Num
ber
anal
ysed
TP
FPFN
TN
Sens
itiv
ity
(%)
Spec
ifici
ty
(%)
Cas
ella
200
0121
No.
of p
atie
nts
235,
of
who
m n
o pr
evio
us h
isto
ry
of B
C N
S, hi
stor
y of
BC
NS
NM
P22
(Mat
rite
ch)
Labo
rato
ry a
naly
sis
10 U
/ml
Patie
nt23
567
1763
8852
84
Su
perfi
cial
(n
on-in
vasi
ve)
7728
4936
G
142
1329
31
G
250
2822
56
G
338
2612
68
Cyt
olog
y (B
W)
Patie
nt20
050
1145
9453
90
Su
perfi
cial
(n
on-in
vasi
ve)
6525
4038
G
130
921
30
G
238
1919
50
G
324
222
92
[Sha
riat
200
3145 ]
No.
of p
atie
nts
229,
of
who
m n
o pr
evio
us h
isto
ry
of B
C N
S, hi
stor
y of
BC
NS
NM
P22
(Mat
rite
ch)
Labo
rato
ry a
naly
sis
≥ 10
U/m
lPa
tient
229
8525
3782
7077
Cyt
olog
y (B
W)
Onl
y hi
gh-
grad
e at
ypia
w
as c
onsi
dere
d po
sitiv
e
Patie
nt19
150
1043
8854
90
[Sha
riat
200
4146 ]
No.
of p
atie
nts
209,
of
who
m n
o pr
evio
us h
isto
ry
of B
C N
S, hi
stor
y of
BC
N
S, co
ntro
ls 9
2
NM
P22
≥ 10
U/m
lPa
tient
209
5814
5978
5085
pT
a65
2342
35
pT
131
238
74
≥
pT2
1712
571
C
IS4
04
0
G
141
1229
29
G
241
2219
54
G
335
2411
69
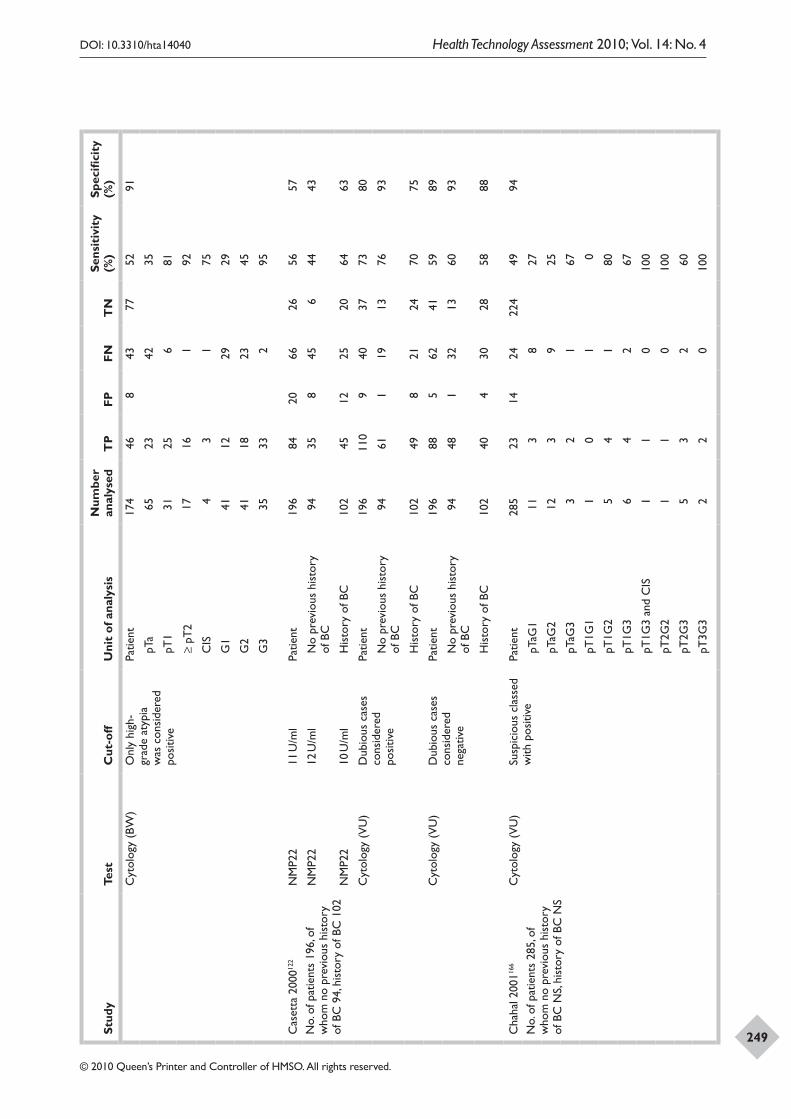
Appendix 15
248
DOI: 10.3310/hta14040 Health Technology Assessment 2010; Vol. 14: No. 4
© 2010 Queen’s Printer and Controller of HMSO. All rights reserved.
249Stud
yTe
stC
ut-o
ffU
nit
of a
naly
sis
Num
ber
anal
ysed
TP
FPFN
TN
Sens
itiv
ity
(%)
Spec
ifici
ty
(%)
Cyt
olog
y (B
W)
Onl
y hi
gh-
grad
e at
ypia
w
as c
onsi
dere
d po
sitiv
e
Patie
nt17
446
843
7752
91
pT
a65
2342
35
pT
131
256
81
≥
pT2
1716
192
C
IS4
31
75
G
141
1229
29
G
241
1823
45
G
335
332
95
Cas
etta
200
0122
No.
of p
atie
nts
196,
of
who
m n
o pr
evio
us h
isto
ry
of B
C 9
4, h
isto
ry o
f BC
102
NM
P22
11 U
/ml
Patie
nt19
684
2066
2656
57
NM
P22
12 U
/ml
N
o pr
evio
us h
isto
ry
of B
C94
358
456
4443
NM
P22
10 U
/ml
H
isto
ry o
f BC
102
4512
2520
6463
Cyt
olog
y (V
U)
Dub
ious
cas
es
cons
ider
ed
posi
tive
Patie
nt19
611
09
4037
7380
N
o pr
evio
us h
isto
ry
of B
C94
611
1913
7693
H
isto
ry o
f BC
102
498
2124
7075
Cyt
olog
y (V
U)
Dub
ious
cas
es
cons
ider
ed
nega
tive
Patie
nt19
688
562
4159
89
N
o pr
evio
us h
isto
ry
of B
C94
481
3213
6093
H
isto
ry o
f BC
102
404
3028
5888
Cha
hal 2
00116
6
No.
of p
atie
nts
285,
of
who
m n
o pr
evio
us h
isto
ry
of B
C N
S, hi
stor
y of
BC
NS
Cyt
olog
y (V
U)
Susp
icio
us c
lass
ed
with
pos
itive
Patie
nt28
523
1424
224
4994
pT
aG1
113
827
pT
aG2
123
925
pT
aG3
32
167
pT
1G1
10
10
pT
1G2
54
180
pT
1G3
64
267
pT
1G3
and
CIS
11
010
0
pT
2G2
11
010
0
pT
2G3
53
260
pT
3G3
22
010
0
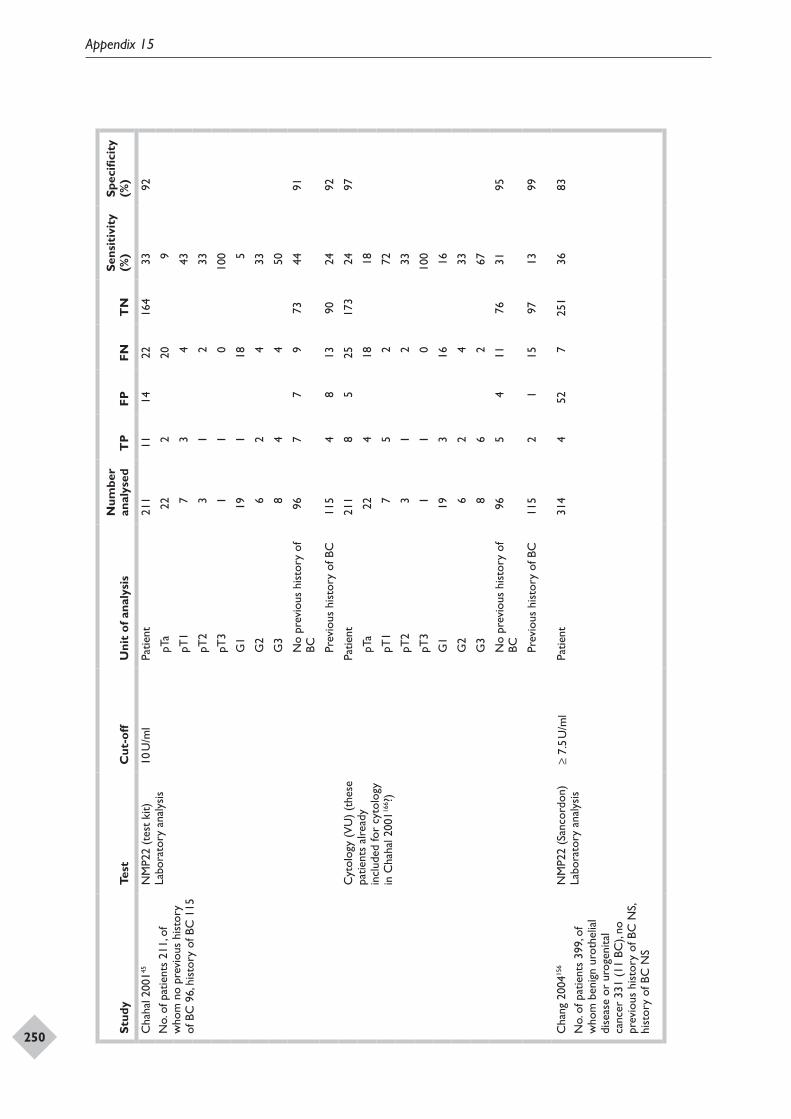
Appendix 15
250
DOI: 10.3310/hta14040 Health Technology Assessment 2010; Vol. 14: No. 4
© 2010 Queen’s Printer and Controller of HMSO. All rights reserved.
251Stud
yTe
stC
ut-o
ffU
nit
of a
naly
sis
Num
ber
anal
ysed
TP
FPFN
TN
Sens
itiv
ity
(%)
Spec
ifici
ty
(%)
Cha
hal 2
00145
No.
of p
atie
nts
211,
of
who
m n
o pr
evio
us h
isto
ry
of B
C 9
6, h
isto
ry o
f BC
115
NM
P22
(tes
t ki
t)La
bora
tory
ana
lysi
s10
U/m
lPa
tient
211
1114
2216
433
92
pT
a22
220
9
pT
17
34
43
pT
23
12
33
pT
31
10
100
G
119
118
5
G
26
24
33
G
38
44
50
N
o pr
evio
us h
isto
ry o
f BC
967
79
7344
91
Pr
evio
us h
isto
ry o
f BC
115
48
1390
2492
Cyt
olog
y (V
U)
(the
se
patie
nts
alre
ady
incl
uded
for
cyto
logy
in
Cha
hal 2
00116
6 ?)
Patie
nt21
18
525
173
2497
pT
a22
418
18
pT
17
52
72
pT
23
12
33
pT
31
10
100
G
119
316
16
G
26
24
33
G
38
62
67
N
o pr
evio
us h
isto
ry o
f BC
965
411
7631
95
Pr
evio
us h
isto
ry o
f BC
115
21
1597
1399
Cha
ng 2
00415
6
No.
of p
atie
nts
399,
of
who
m b
enig
n ur
othe
lial
dise
ase
or u
roge
nita
l ca
ncer
331
(11
BC
), no
pr
evio
us h
isto
ry o
f BC
NS,
hist
ory
of B
C N
S
NM
P22
(San
cord
on)
Labo
rato
ry a
naly
sis
≥ 7.
5 U
/ml
Patie
nt31
44
527
251
3683
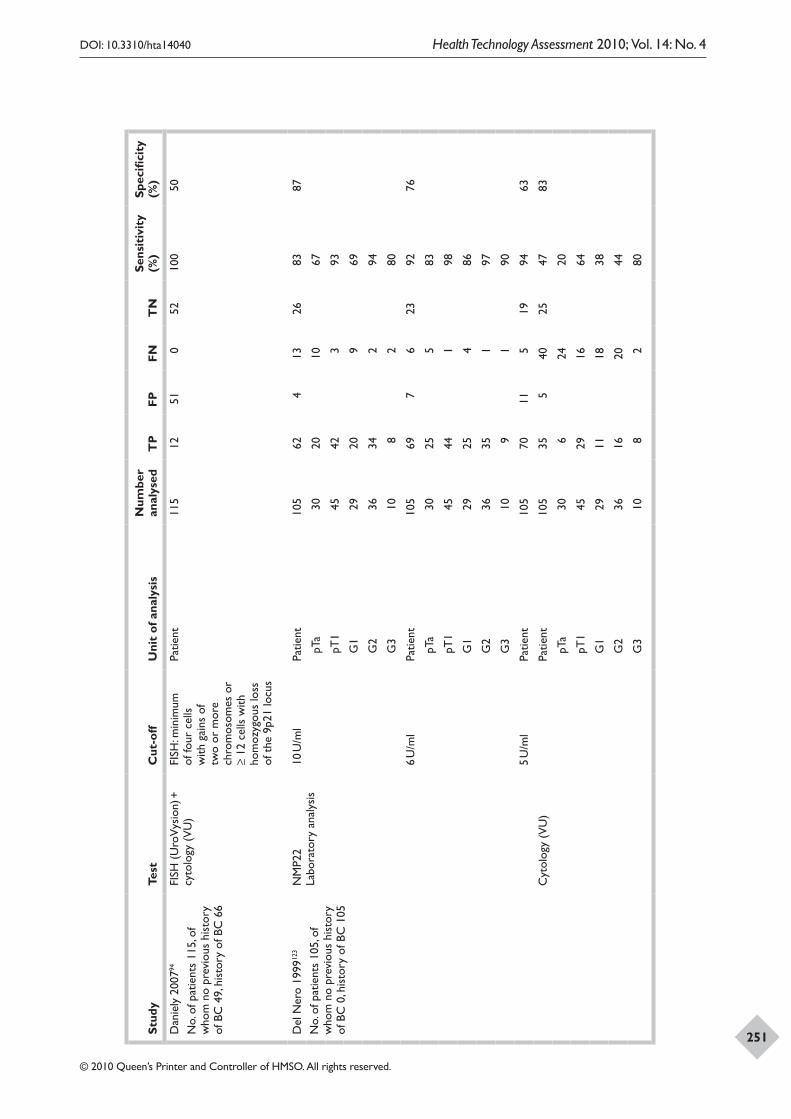
Appendix 15
250
DOI: 10.3310/hta14040 Health Technology Assessment 2010; Vol. 14: No. 4
© 2010 Queen’s Printer and Controller of HMSO. All rights reserved.
251Stud
yTe
stC
ut-o
ffU
nit
of a
naly
sis
Num
ber
anal
ysed
TP
FPFN
TN
Sens
itiv
ity
(%)
Spec
ifici
ty
(%)
Dan
iely
200
794
No.
of p
atie
nts
115,
of
who
m n
o pr
evio
us h
isto
ry
of B
C 4
9, h
isto
ry o
f BC
66
FISH
(U
roV
ysio
n) +
cy
tolo
gy (
VU
)FI
SH: m
inim
um
of fo
ur c
ells
w
ith g
ains
of
two
or m
ore
chro
mos
omes
or
≥ 12
cel
ls w
ith
hom
ozyg
ous
loss
of
the
9p2
1 lo
cus
Patie
nt11
512
510
5210
050
Del
Ner
o 19
9912
3
No.
of p
atie
nts
105,
of
who
m n
o pr
evio
us h
isto
ry
of B
C 0
, his
tory
of B
C 1
05
NM
P22
Labo
rato
ry a
naly
sis
10 U
/ml
Patie
nt10
562
413
2683
87
pT
a30
2010
67
pT
145
423
93
G
129
209
69
G
236
342
94
G
310
82
80
6 U
/ml
Patie
nt10
569
76
2392
76
pT
a30
255
83
pT
145
441
98
G
129
254
86
G
236
351
97
G
310
91
90
5 U
/ml
Patie
nt10
570
115
1994
63
Cyt
olog
y (V
U)
Patie
nt10
535
540
2547
83
pT
a30
624
20
pT
145
2916
64
G
129
1118
38
G
236
1620
44
G
310
82
80
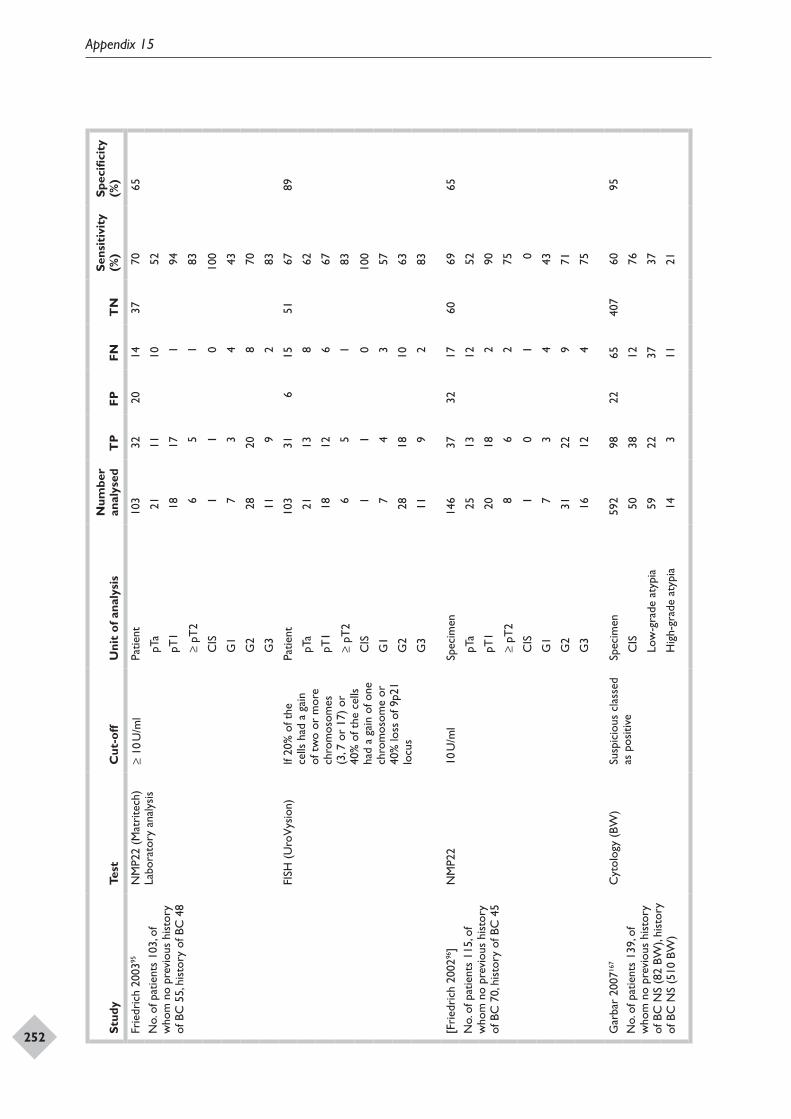
Appendix 15
252
DOI: 10.3310/hta14040 Health Technology Assessment 2010; Vol. 14: No. 4
© 2010 Queen’s Printer and Controller of HMSO. All rights reserved.
253Stud
yTe
stC
ut-o
ffU
nit
of a
naly
sis
Num
ber
anal
ysed
TP
FPFN
TN
Sens
itiv
ity
(%)
Spec
ifici
ty
(%)
Frie
dric
h 20
0395
No.
of p
atie
nts
103,
of
who
m n
o pr
evio
us h
isto
ry
of B
C 5
5, h
isto
ry o
f BC
48
NM
P22
(Mat
rite
ch)
Labo
rato
ry a
naly
sis
≥ 10
U/m
lPa
tient
103
3220
1437
7065
pT
a21
1110
52
pT
118
171
94
≥
pT2
65
183
C
IS1
10
100
G
17
34
43
G
228
208
70
G
311
92
83
FISH
(U
roV
ysio
n)If
20%
of t
he
cells
had
a g
ain
of t
wo
or m
ore
chro
mos
omes
(3
, 7 o
r 17
) or
40
% o
f the
cel
ls
had
a ga
in o
f one
ch
rom
osom
e or
40
% lo
ss o
f 9p2
1 lo
cus
Patie
nt10
331
615
5167
89
pT
a21
138
62
pT
118
126
67
≥
pT2
65
183
C
IS1
10
100
G
17
43
57
G
228
1810
63
G
311
92
83
[Fri
edri
ch 2
00296
]N
o. o
f pat
ient
s 11
5, o
f w
hom
no
prev
ious
his
tory
of
BC
70,
his
tory
of B
C 4
5
NM
P22
10 U
/ml
Spec
imen
146
3732
1760
6965
pT
a25
1312
52
pT
120
182
90
≥
pT2
86
275
C
IS1
01
0
G
17
34
43
G
231
229
71
G
316
124
75
Gar
bar
2007
167
No.
of p
atie
nts
139,
of
who
m n
o pr
evio
us h
isto
ry
of B
C N
S (8
2 BW
), hi
stor
y of
BC
NS
(510
BW
)
Cyt
olog
y (B
W)
Susp
icio
us c
lass
ed
as p
ositi
veSp
ecim
en59
298
2265
407
6095
C
IS50
3812
76
Lo
w-g
rade
aty
pia
5922
3737
H
igh-
grad
e at
ypia
143
1121
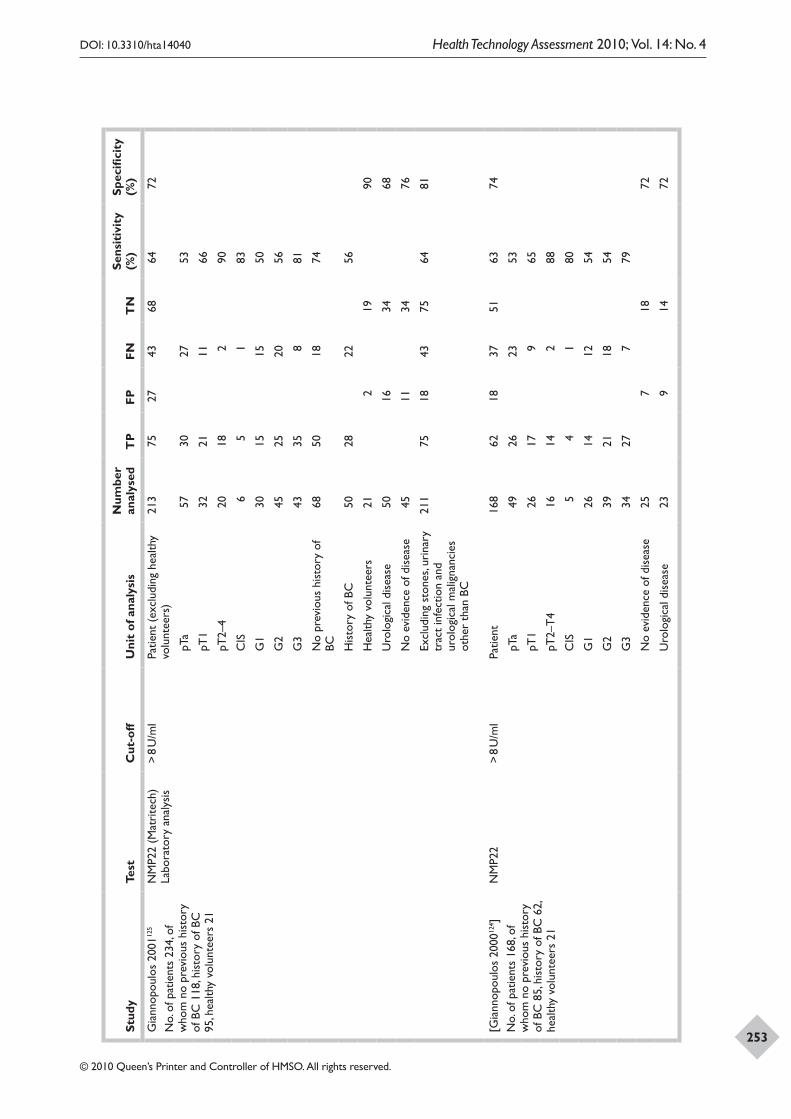
Appendix 15
252
DOI: 10.3310/hta14040 Health Technology Assessment 2010; Vol. 14: No. 4
© 2010 Queen’s Printer and Controller of HMSO. All rights reserved.
253
Stud
yTe
stC
ut-o
ffU
nit
of a
naly
sis
Num
ber
anal
ysed
TP
FPFN
TN
Sens
itiv
ity
(%)
Spec
ifici
ty
(%)
Gia
nnop
oulo
s 20
0112
5
No.
of p
atie
nts
234,
of
who
m n
o pr
evio
us h
isto
ry
of B
C 1
18, h
isto
ry o
f BC
95
, hea
lthy
volu
ntee
rs 2
1
NM
P22
(Mat
rite
ch)
Labo
rato
ry a
naly
sis
> 8
U/m
lPa
tient
(ex
clud
ing
heal
thy
volu
ntee
rs)
213
7527
4368
6472
pT
a57
3027
53
pT
132
2111
66
pT
2–4
2018
290
C
IS6
51
83
G
130
1515
50
G
245
2520
56
G
343
358
81
N
o pr
evio
us h
isto
ry o
f BC
6850
1874
H
isto
ry o
f BC
5028
2256
H
ealth
y vo
lunt
eers
212
1990
U
rolo
gica
l dis
ease
5016
3468
N
o ev
iden
ce o
f dis
ease
4511
3476
Ex
clud
ing
ston
es, u
rina
ry
trac
t in
fect
ion
and
urol
ogic
al m
alig
nanc
ies
othe
r th
an B
C
211
7518
4375
6481
[Gia
nnop
oulo
s 20
0012
4 ]
No.
of p
atie
nts
168,
of
who
m n
o pr
evio
us h
isto
ry
of B
C 8
5, h
isto
ry o
f BC
62,
he
alth
y vo
lunt
eers
21
NM
P22
> 8
U/m
lPa
tient
168
6218
3751
6374
pT
a49
2623
53
pT
126
179
65
pT
2–T
416
142
88
C
IS5
41
80
G
126
1412
54
G
239
2118
54
G
334
277
79
N
o ev
iden
ce o
f dis
ease
257
1872
U
rolo
gica
l dis
ease
239
1472
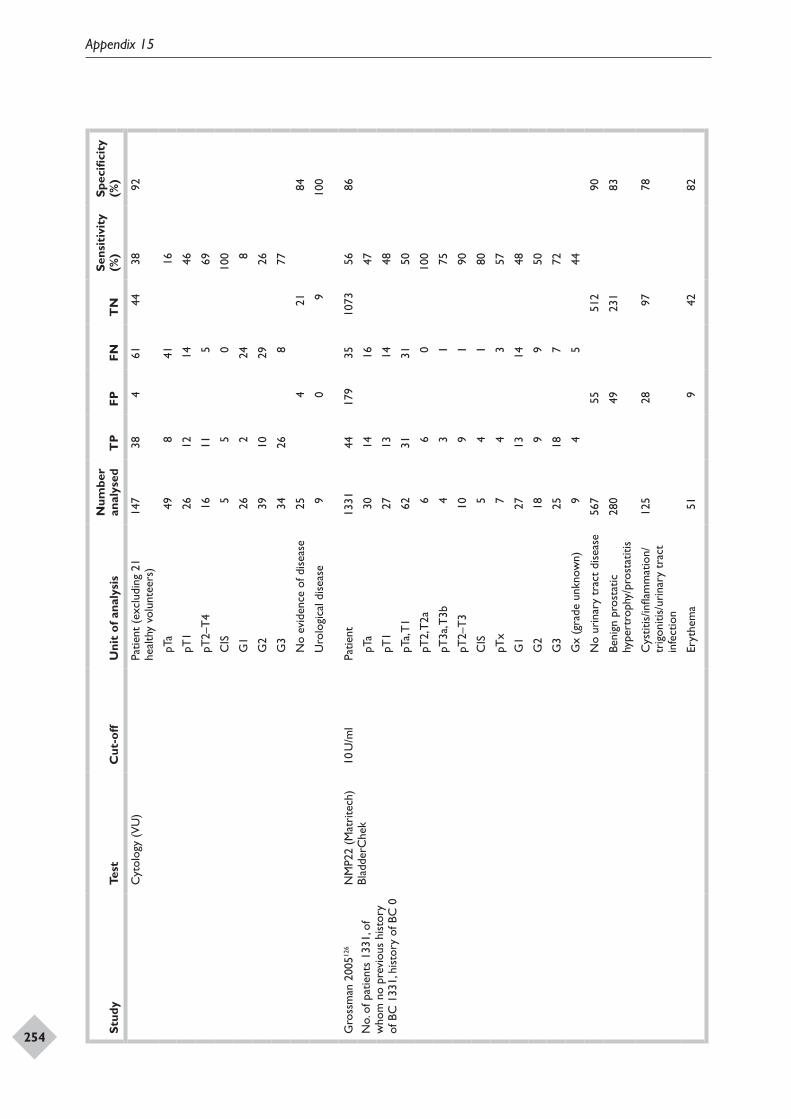
Appendix 15
254
DOI: 10.3310/hta14040 Health Technology Assessment 2010; Vol. 14: No. 4
© 2010 Queen’s Printer and Controller of HMSO. All rights reserved.
255Stud
yTe
stC
ut-o
ffU
nit
of a
naly
sis
Num
ber
anal
ysed
TP
FPFN
TN
Sens
itiv
ity
(%)
Spec
ifici
ty
(%)
Cyt
olog
y (V
U)
Patie
nt (
excl
udin
g 21
he
alth
y vo
lunt
eers
)14
738
461
4438
92
pT
a49
841
16
pT
126
1214
46
pT
2–T
416
115
69
C
IS5
50
100
G
126
224
8
G
239
1029
26
G
334
268
77
N
o ev
iden
ce o
f dis
ease
254
2184
U
rolo
gica
l dis
ease
90
910
0
Gro
ssm
an 2
00512
6
No.
of p
atie
nts
1331
, of
who
m n
o pr
evio
us h
isto
ry
of B
C 1
331,
his
tory
of B
C 0
NM
P22
(Mat
rite
ch)
Blad
derC
hek
10 U
/ml
Patie
nt13
3144
179
3510
7356
86
pT
a30
1416
47
pT
127
1314
48
pT
a, T
162
3131
50
pT
2, T
2a6
60
100
pT
3a, T
3b4
31
75
pT
2–T
310
91
90
C
IS5
41
80
pT
x7
43
57
G
127
1314
48
G
218
99
50
G
325
187
72
G
x (g
rade
unk
now
n)9
45
44
N
o ur
inar
y tr
act
dise
ase
567
5551
290
Be
nign
pro
stat
ic
hype
rtro
phy/
pros
tatit
is28
049
231
83
C
ystit
is/in
flam
mat
ion/
trig
oniti
s/ur
inar
y tr
act
infe
ctio
n
125
2897
78
Er
ythe
ma
519
4282
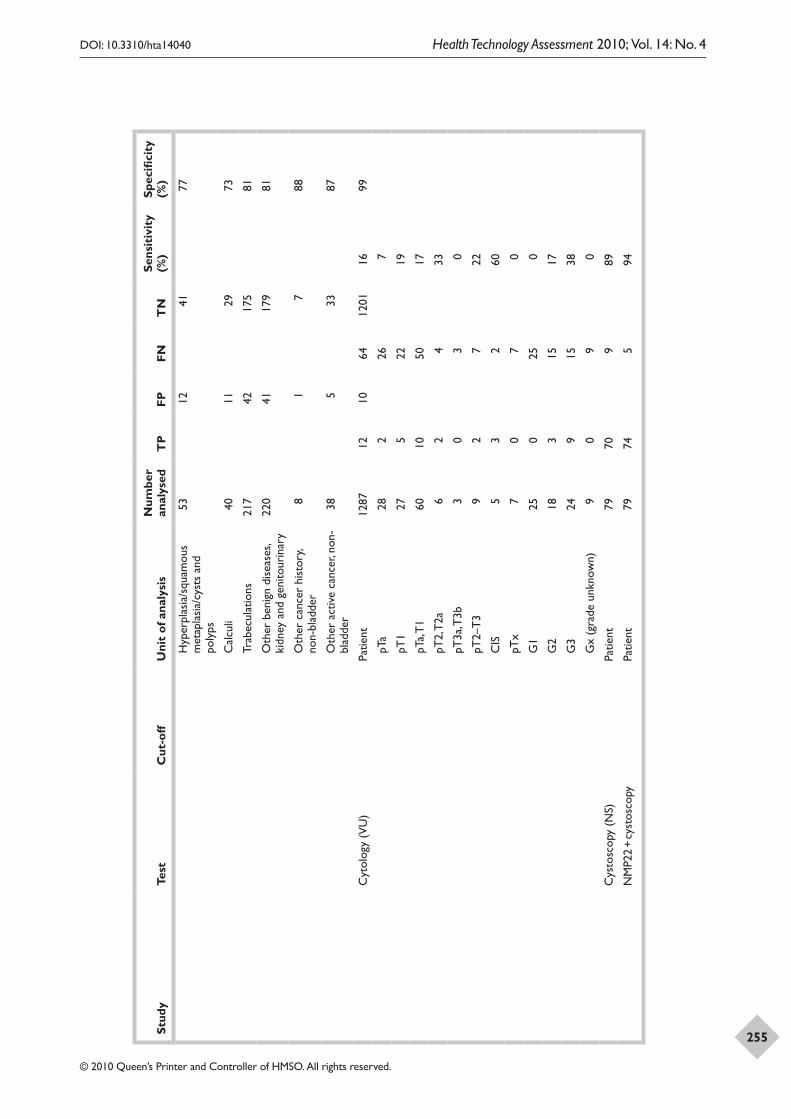
Appendix 15
254
DOI: 10.3310/hta14040 Health Technology Assessment 2010; Vol. 14: No. 4
© 2010 Queen’s Printer and Controller of HMSO. All rights reserved.
255Stud
yTe
stC
ut-o
ffU
nit
of a
naly
sis
Num
ber
anal
ysed
TP
FPFN
TN
Sens
itiv
ity
(%)
Spec
ifici
ty
(%)
H
yper
plas
ia/s
quam
ous
met
apla
sia/
cyst
s an
d po
lyps
5312
4177
C
alcu
li40
1129
73
Tr
abec
ulat
ions
217
4217
581
O
ther
ben
ign
dise
ases
, ki
dney
and
gen
itour
inar
y22
041
179
81
O
ther
can
cer
hist
ory,
non-
blad
der
81
788
O
ther
act
ive
canc
er, n
on-
blad
der
385
3387
Cyt
olog
y (V
U)
Patie
nt12
8712
1064
1201
1699
pT
a28
226
7
pT
127
522
19
pT
a, T
160
1050
17
pT
2, T
2a6
24
33
pT
3a, T
3b3
03
0
pT
2–T
39
27
22
C
IS5
32
60
pT
x7
07
0
G
125
025
0
G
218
315
17
G
324
915
38
G
x (g
rade
unk
now
n)9
09
0
Cys
tosc
opy
(NS)
Patie
nt79
709
89
NM
P22
+ cy
stos
copy
Patie
nt79
745
94
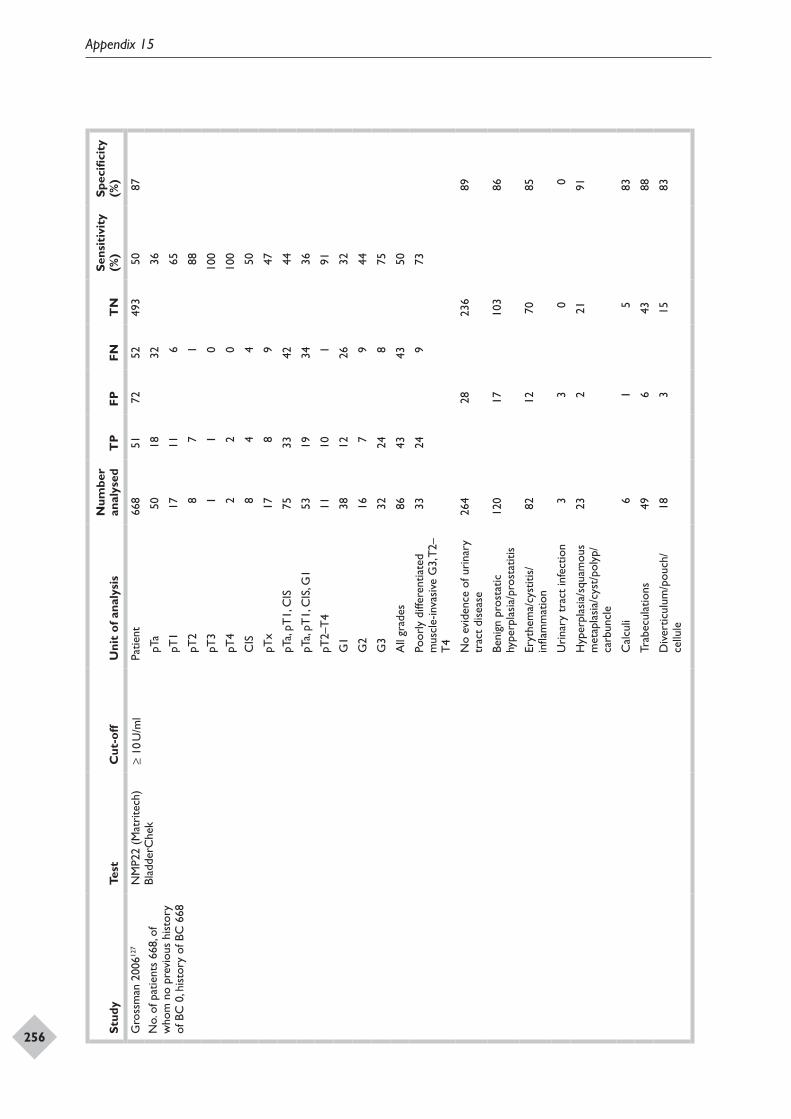
Appendix 15
256
DOI: 10.3310/hta14040 Health Technology Assessment 2010; Vol. 14: No. 4
© 2010 Queen’s Printer and Controller of HMSO. All rights reserved.
257Stud
yTe
stC
ut-o
ffU
nit
of a
naly
sis
Num
ber
anal
ysed
TP
FPFN
TN
Sens
itiv
ity
(%)
Spec
ifici
ty
(%)
Gro
ssm
an 2
00612
7
No.
of p
atie
nts
668,
of
who
m n
o pr
evio
us h
isto
ry
of B
C 0
, his
tory
of B
C 6
68
NM
P22
(Mat
rite
ch)
Blad
derC
hek
≥ 10
U/m
lPa
tient
668
5172
5249
350
87
pT
a50
1832
36
pT
117
116
65
pT
28
71
88
pT
31
10
100
pT
42
20
100
C
IS8
44
50
pT
x17
89
47
pT
a, pT
1, C
IS75
3342
44
pT
a, pT
1, C
IS, G
153
1934
36
pT
2–T
411
101
91
G
138
1226
32
G
216
79
44
G
332
248
75
A
ll gr
ades
8643
4350
Po
orly
diff
eren
tiate
d m
uscl
e-in
vasi
ve G
3, T
2–T
4
3324
973
N
o ev
iden
ce o
f uri
nary
tr
act
dise
ase
264
2823
689
Be
nign
pro
stat
ic
hype
rpla
sia/
pros
tatit
is12
017
103
86
Er
ythe
ma/
cyst
itis/
infla
mm
atio
n82
1270
85
U
rina
ry t
ract
infe
ctio
n3
30
0
H
yper
plas
ia/s
quam
ous
met
apla
sia/
cyst
/pol
yp/
carb
uncl
e
232
2191
C
alcu
li6
15
83
Tr
abec
ulat
ions
496
4388
D
iver
ticul
um/p
ouch
/ce
llule
183
1583
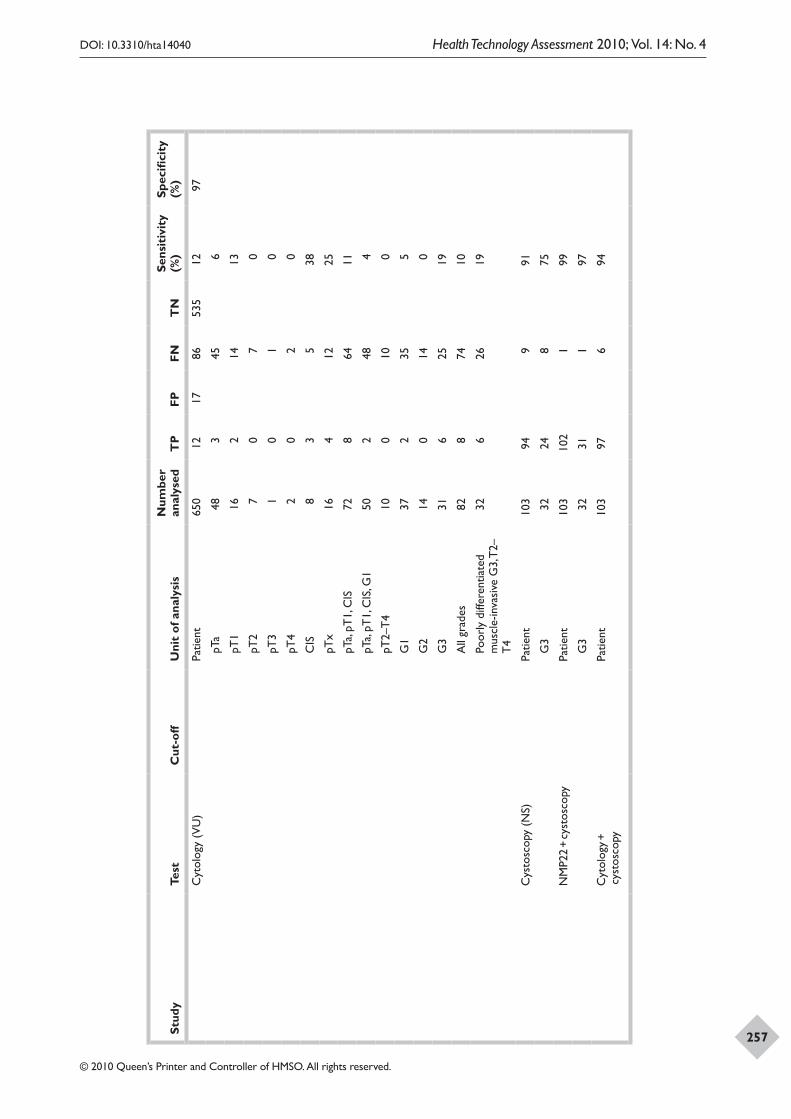
Appendix 15
256
DOI: 10.3310/hta14040 Health Technology Assessment 2010; Vol. 14: No. 4
© 2010 Queen’s Printer and Controller of HMSO. All rights reserved.
257Stud
yTe
stC
ut-o
ffU
nit
of a
naly
sis
Num
ber
anal
ysed
TP
FPFN
TN
Sens
itiv
ity
(%)
Spec
ifici
ty
(%)
Cyt
olog
y (V
U)
Patie
nt65
012
1786
535
1297
pT
a48
345
6
pT
116
214
13
pT
27
07
0
pT
31
01
0
pT
42
02
0
C
IS8
35
38
pT
x16
412
25
pT
a, pT
1, C
IS72
864
11
pT
a, pT
1, C
IS, G
150
248
4
pT
2–T
410
010
0
G
137
235
5
G
214
014
0
G
331
625
19
A
ll gr
ades
828
7410
Po
orly
diff
eren
tiate
d m
uscl
e-in
vasi
ve G
3, T
2–T
4
326
2619
Cys
tosc
opy
(NS)
Patie
nt10
394
991
G
332
248
75
NM
P22
+ cy
stos
copy
Patie
nt10
310
21
99
G
332
311
97
Cyt
olog
y +
cyst
osco
pyPa
tient
103
976
94
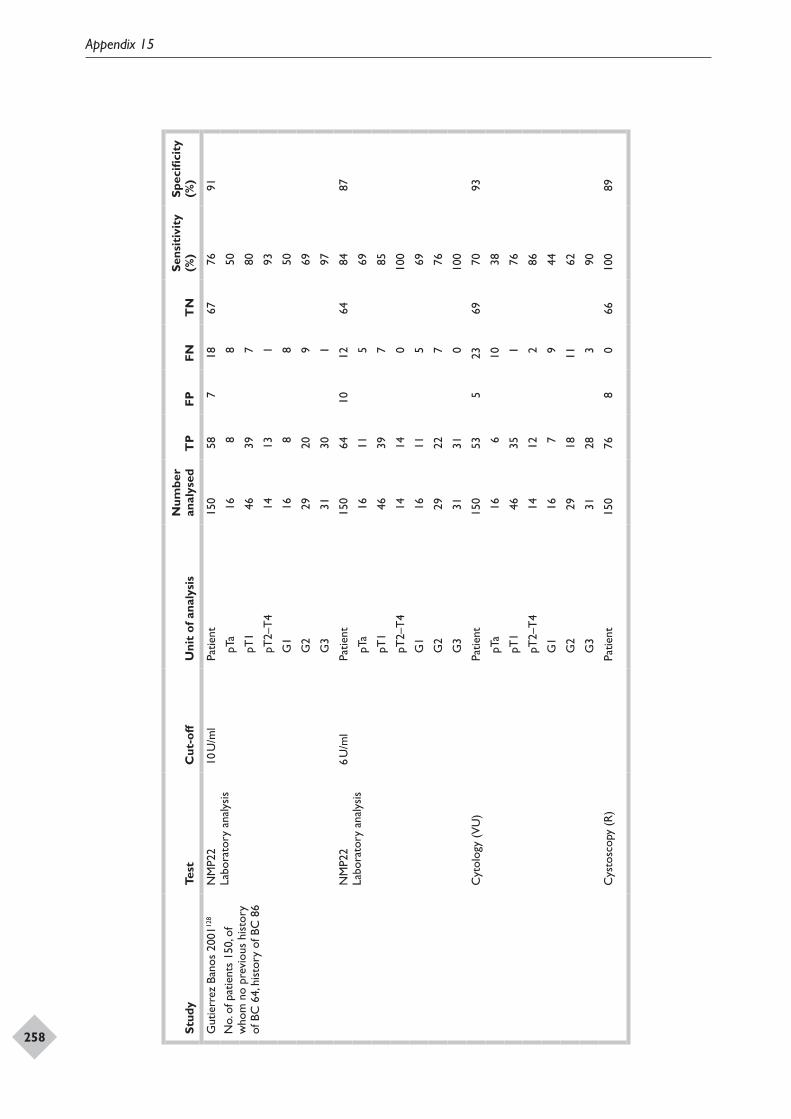
Appendix 15
258
DOI: 10.3310/hta14040 Health Technology Assessment 2010; Vol. 14: No. 4
© 2010 Queen’s Printer and Controller of HMSO. All rights reserved.
259Stud
yTe
stC
ut-o
ffU
nit
of a
naly
sis
Num
ber
anal
ysed
TP
FPFN
TN
Sens
itiv
ity
(%)
Spec
ifici
ty
(%)
Gut
ierr
ez B
anos
200
1128
No.
of p
atie
nts
150,
of
who
m n
o pr
evio
us h
isto
ry
of B
C 6
4, h
isto
ry o
f BC
86
NM
P22
Labo
rato
ry a
naly
sis
10 U
/ml
Patie
nt15
058
718
6776
91
pT
a16
88
50
pT
146
397
80
pT
2–T
414
131
93
G
116
88
50
G
229
209
69
G
331
301
97
NM
P22
Labo
rato
ry a
naly
sis
6 U
/ml
Patie
nt15
064
1012
6484
87
pT
a16
115
69
pT
146
397
85
pT
2–T
414
140
100
G
116
115
69
G
229
227
76
G
331
310
100
Cyt
olog
y (V
U)
Patie
nt15
053
523
6970
93
pT
a16
610
38
pT
146
351
76
pT
2–T
414
122
86
G
116
79
44
G
229
1811
62
G
331
283
90
Cys
tosc
opy
(R)
Patie
nt15
076
80
6610
089
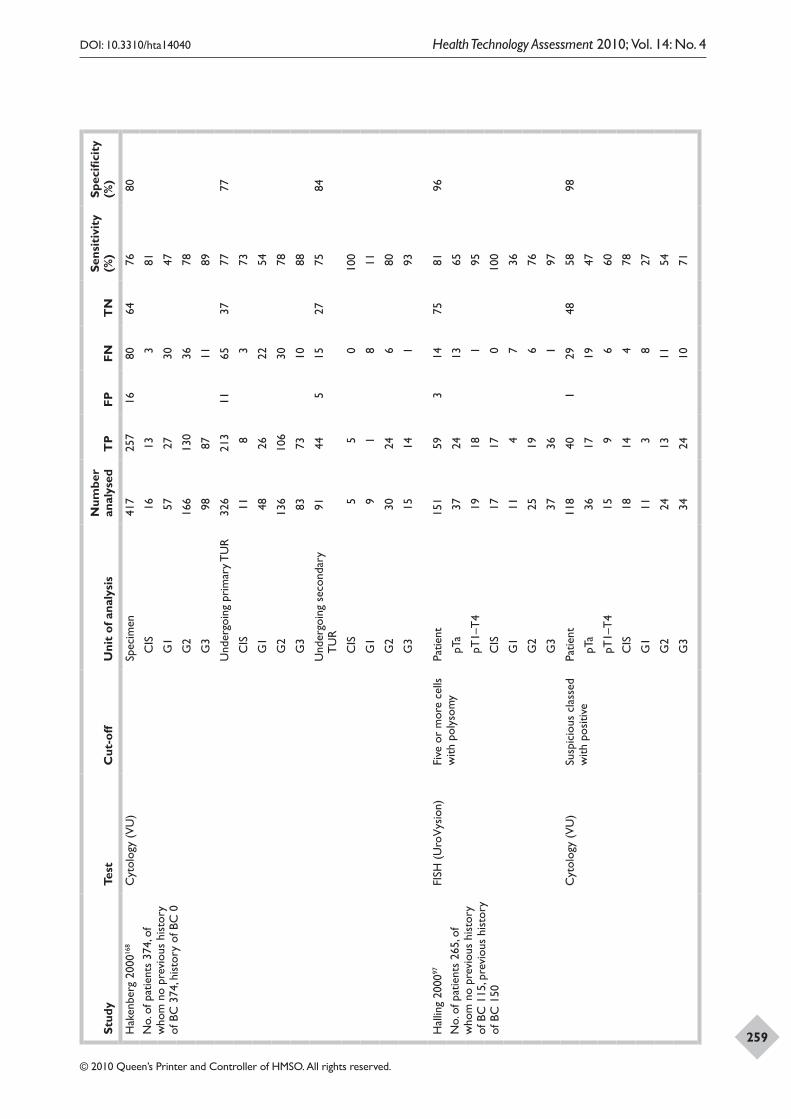
Appendix 15
258
DOI: 10.3310/hta14040 Health Technology Assessment 2010; Vol. 14: No. 4
© 2010 Queen’s Printer and Controller of HMSO. All rights reserved.
259Stud
yTe
stC
ut-o
ffU
nit
of a
naly
sis
Num
ber
anal
ysed
TP
FPFN
TN
Sens
itiv
ity
(%)
Spec
ifici
ty
(%)
Hak
enbe
rg 2
00016
8
No.
of p
atie
nts
374,
of
who
m n
o pr
evio
us h
isto
ry
of B
C 3
74, h
isto
ry o
f BC
0
Cyt
olog
y (V
U)
Spec
imen
417
257
1680
6476
80
C
IS16
133
81
G
157
2730
47
G
216
613
036
78
G
398
8711
89
Und
ergo
ing
prim
ary T
UR
326
213
1165
3777
77
C
IS11
83
73
G
148
2622
54
G
213
610
630
78
G
383
7310
88
Und
ergo
ing
seco
ndar
y T
UR
9144
515
2775
84
C
IS5
50
100
G
19
18
11
G
230
246
80
G
315
141
93
Hal
ling
2000
97
No.
of p
atie
nts
265,
of
who
m n
o pr
evio
us h
isto
ry
of B
C 1
15, p
revi
ous
hist
ory
of B
C 1
50
FISH
(U
roV
ysio
n)Fi
ve o
r m
ore
cells
w
ith p
olys
omy
Patie
nt15
159
314
7581
96
pT
a37
2413
65
pT
1–T
419
181
95
C
IS17
170
100
G
111
47
36
G
225
196
76
G
337
361
97
Cyt
olog
y (V
U)
Susp
icio
us c
lass
ed
with
pos
itive
Patie
nt11
840
129
4858
98
pT
a36
1719
47
pT
1–T
415
96
60
C
IS18
144
78
G
111
38
27
G
224
1311
54
G
334
2410
71
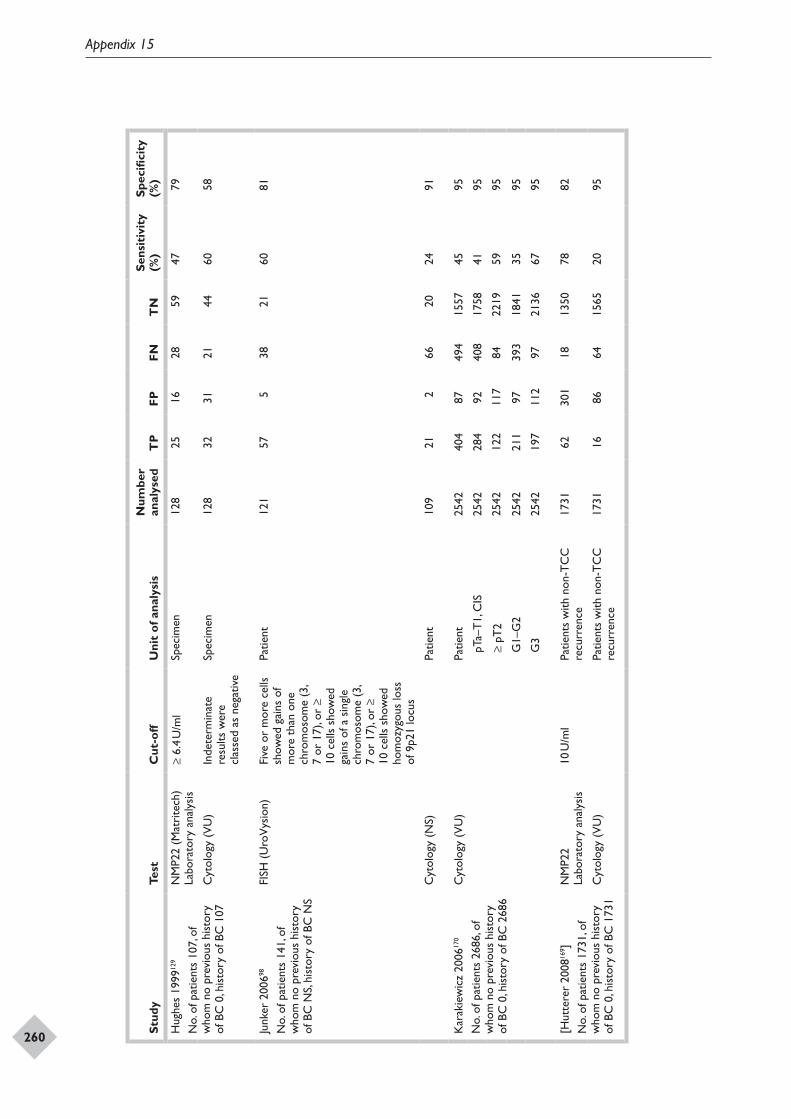
Appendix 15
260
DOI: 10.3310/hta14040 Health Technology Assessment 2010; Vol. 14: No. 4
© 2010 Queen’s Printer and Controller of HMSO. All rights reserved.
261Stud
yTe
stC
ut-o
ffU
nit
of a
naly
sis
Num
ber
anal
ysed
TP
FPFN
TN
Sens
itiv
ity
(%)
Spec
ifici
ty
(%)
Hug
hes
1999
129
No.
of p
atie
nts
107,
of
who
m n
o pr
evio
us h
isto
ry
of B
C 0
, his
tory
of B
C 1
07
NM
P22
(Mat
rite
ch)
Labo
rato
ry a
naly
sis
≥ 6.
4 U
/ml
Spec
imen
128
2516
2859
4779
Cyt
olog
y (V
U)
Inde
term
inat
e re
sults
wer
e cl
asse
d as
neg
ativ
e
Spec
imen
128
3231
2144
6058
Junk
er 2
00698
No.
of p
atie
nts
141,
of
who
m n
o pr
evio
us h
isto
ry
of B
C N
S, hi
stor
y of
BC
NS
FISH
(U
roV
ysio
n)Fi
ve o
r m
ore
cells
sh
owed
gai
ns o
f m
ore
than
one
ch
rom
osom
e (3
, 7
or 1
7), o
r ≥
10 c
ells
sho
wed
ga
ins
of a
sin
gle
chro
mos
ome
(3,
7 or
17)
, or
≥ 10
cel
ls s
how
ed
hom
ozyg
ous
loss
of
9p2
1 lo
cus
Patie
nt12
157
538
2160
81
Cyt
olog
y (N
S)Pa
tient
109
212
6620
2491
Kar
akie
wic
z 20
0617
0
No.
of p
atie
nts
2686
, of
who
m n
o pr
evio
us h
isto
ry
of B
C 0
, his
tory
of B
C 2
686
Cyt
olog
y (V
U)
Patie
nt25
4240
487
494
1557
4595
pT
a–T
1, C
IS25
4228
492
408
1758
4195
≥
pT2
2542
122
117
8422
1959
95
G
1–G
225
4221
197
393
1841
3595
G
325
4219
711
297
2136
6795
[Hut
tere
r 20
0816
9 ]N
o. o
f pat
ient
s 17
31, o
f w
hom
no
prev
ious
his
tory
of
BC
0, h
isto
ry o
f BC
173
1
NM
P22
Labo
rato
ry a
naly
sis
10 U
/ml
Patie
nts
with
non
-TC
C
recu
rren
ce17
3162
301
1813
5078
82
Cyt
olog
y (V
U)
Patie
nts
with
non
-TC
C
recu
rren
ce17
3116
8664
1565
2095
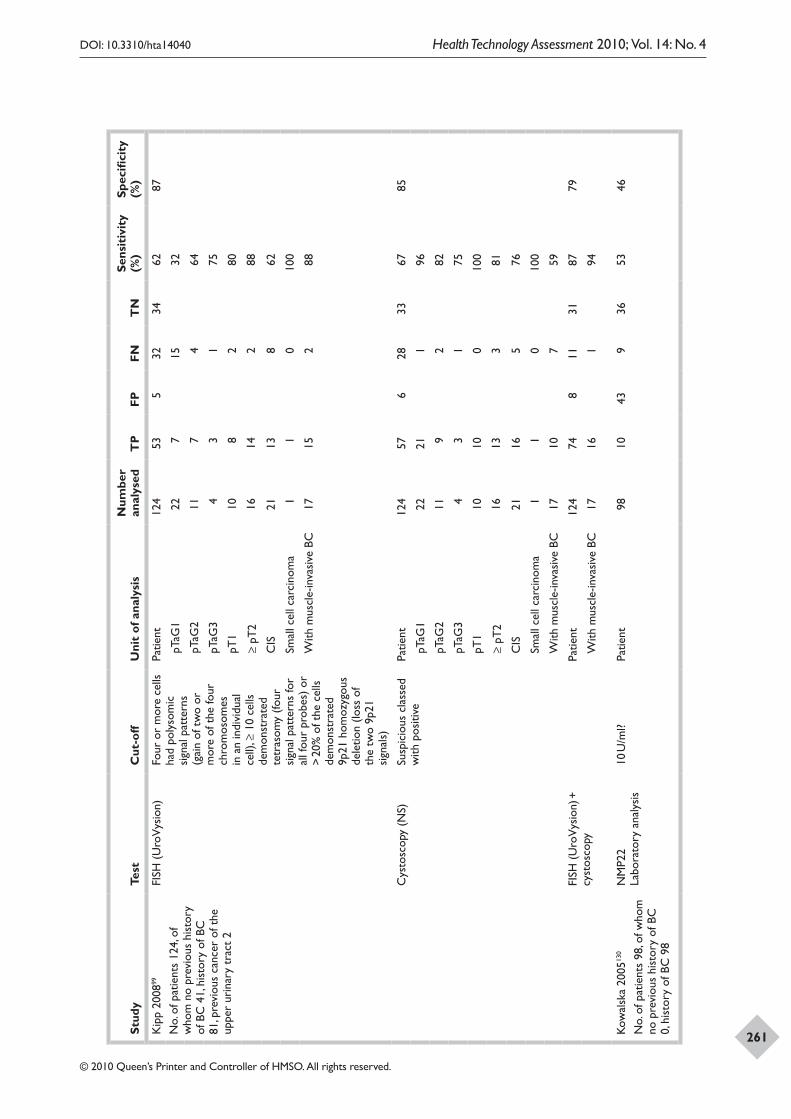
Appendix 15
260
DOI: 10.3310/hta14040 Health Technology Assessment 2010; Vol. 14: No. 4
© 2010 Queen’s Printer and Controller of HMSO. All rights reserved.
261Stud
yTe
stC
ut-o
ffU
nit
of a
naly
sis
Num
ber
anal
ysed
TP
FPFN
TN
Sens
itiv
ity
(%)
Spec
ifici
ty
(%)
Kip
p 20
0899
No.
of p
atie
nts
124,
of
who
m n
o pr
evio
us h
isto
ry
of B
C 4
1, h
isto
ry o
f BC
81
, pre
viou
s ca
ncer
of t
he
uppe
r ur
inar
y tr
act
2
FISH
(U
roV
ysio
n)Fo
ur o
r m
ore
cells
ha
d po
lyso
mic
si
gnal
pat
tern
s (g
ain
of t
wo
or
mor
e of
the
four
ch
rom
osom
es
in a
n in
divi
dual
ce
ll), ≥
10
cells
de
mon
stra
ted
tetr
asom
y (fo
ur
sign
al p
atte
rns
for
all f
our
prob
es)
or
> 20
% o
f the
cel
ls
dem
onst
rate
d 9p
21 h
omoz
ygou
s de
letio
n (lo
ss o
f th
e tw
o 9p
21
sign
als)
Patie
nt12
453
532
3462
87
pT
aG1
227
1532
pT
aG2
117
464
pT
aG3
43
175
pT
110
82
80
≥
pT2
1614
288
C
IS21
138
62
Sm
all c
ell c
arci
nom
a1
10
100
W
ith m
uscl
e-in
vasi
ve B
C17
152
88
Cys
tosc
opy
(NS)
Susp
icio
us c
lass
ed
with
pos
itive
Patie
nt12
457
628
3367
85
pT
aG1
2221
196
pT
aG2
119
282
pT
aG3
43
175
pT
110
100
100
≥
pT2
1613
381
C
IS21
165
76
Sm
all c
ell c
arci
nom
a1
10
100
W
ith m
uscl
e-in
vasi
ve B
C17
107
59
FISH
(U
roV
ysio
n) +
cy
stos
copy
Patie
nt12
474
811
3187
79
W
ith m
uscl
e-in
vasi
ve B
C
1716
194
Kow
alsk
a 20
0513
0
No.
of p
atie
nts
98, o
f who
m
no p
revi
ous
hist
ory
of B
C
0, h
isto
ry o
f BC
98
NM
P22
Labo
rato
ry a
naly
sis
10 U
/ml?
Patie
nt98
1043
936
5346
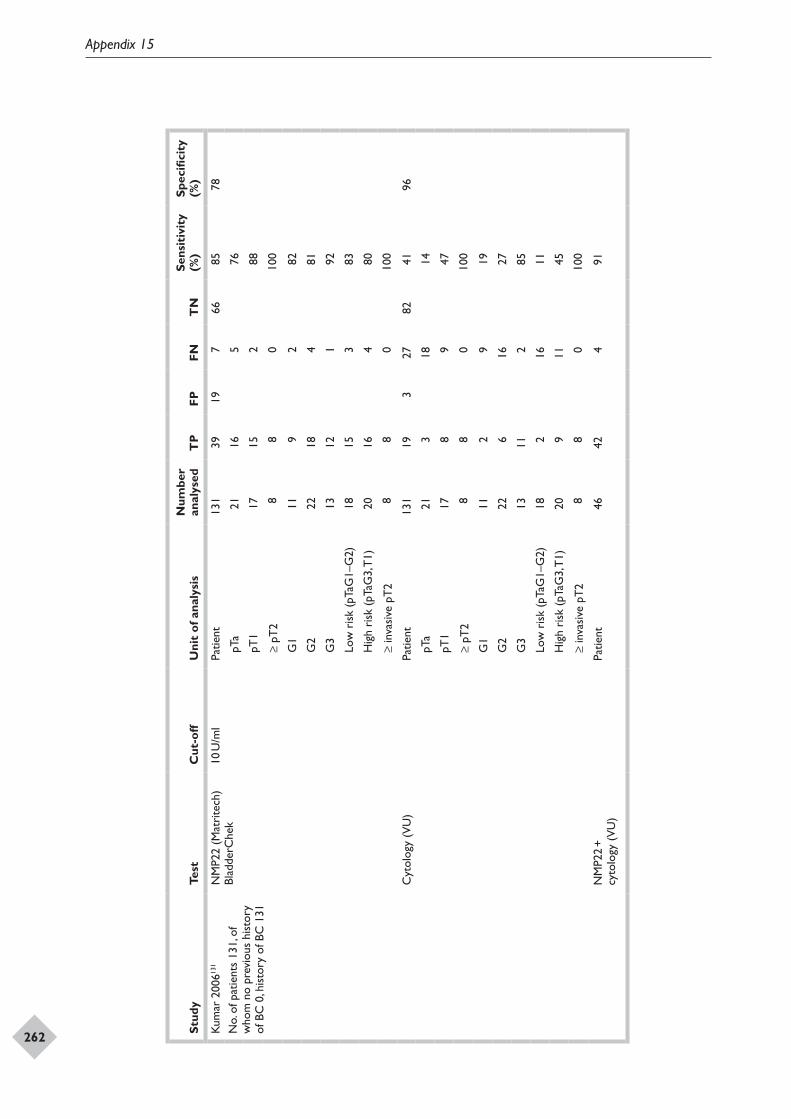
Appendix 15
262
DOI: 10.3310/hta14040 Health Technology Assessment 2010; Vol. 14: No. 4
© 2010 Queen’s Printer and Controller of HMSO. All rights reserved.
263Stud
yTe
stC
ut-o
ffU
nit
of a
naly
sis
Num
ber
anal
ysed
TP
FPFN
TN
Sens
itiv
ity
(%)
Spec
ifici
ty
(%)
Kum
ar 2
00613
1
No.
of p
atie
nts
131,
of
who
m n
o pr
evio
us h
isto
ry
of B
C 0
, his
tory
of B
C 1
31
NM
P22
(Mat
rite
ch)
Blad
derC
hek
10 U
/ml
Patie
nt13
139
197
6685
78
pT
a21
165
76
pT
117
152
88
≥
pT2
88
010
0
G
111
92
82
G
222
184
81
G
313
121
92
Lo
w r
isk
(pTa
G1–
G2)
1815
383
H
igh
risk
(pT
aG3,
T1)
2016
480
≥
inva
sive
pT
28
80
100
Cyt
olog
y (V
U)
Patie
nt13
119
327
8241
96
pT
a21
318
14
pT
117
89
47
≥
pT2
88
010
0
G
111
29
19
G
222
616
27
G
313
112
85
Lo
w r
isk
(pTa
G1–
G2)
182
1611
H
igh
risk
(pT
aG3,
T1)
209
1145
≥
inva
sive
pT
28
80
100
NM
P22
+
cyto
logy
(V
U)
Patie
nt46
424
91
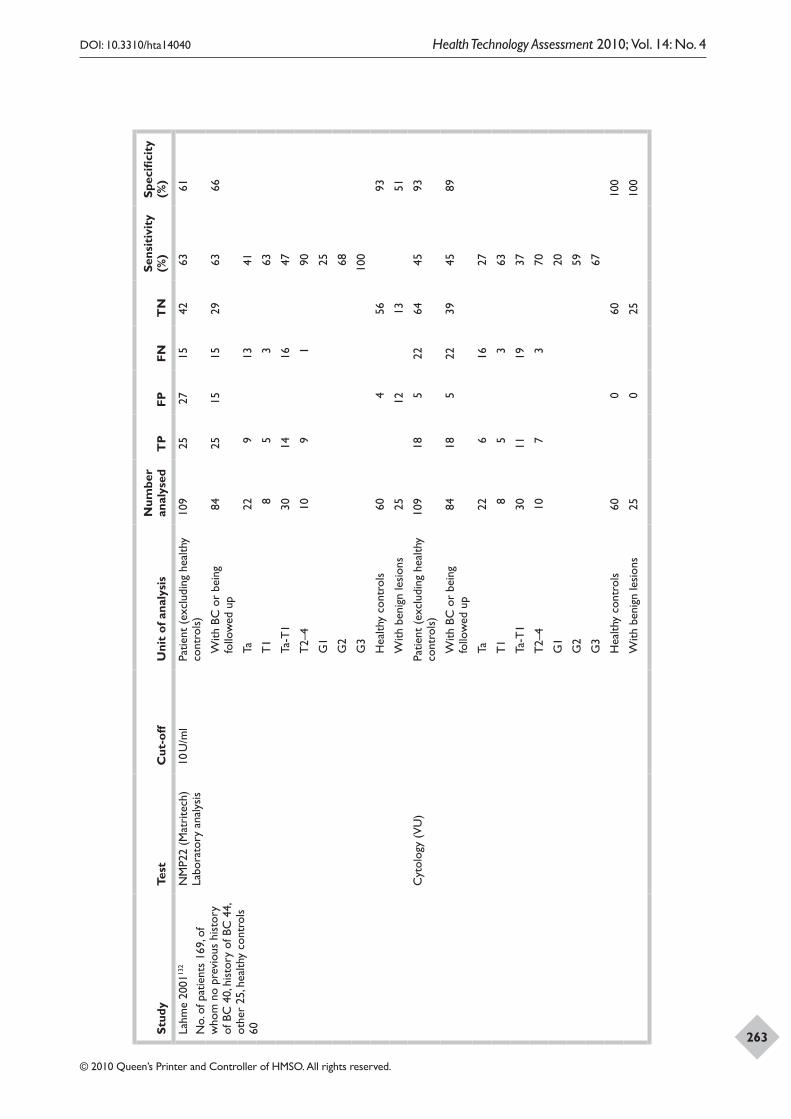
Appendix 15
262
DOI: 10.3310/hta14040 Health Technology Assessment 2010; Vol. 14: No. 4
© 2010 Queen’s Printer and Controller of HMSO. All rights reserved.
263Stud
yTe
stC
ut-o
ffU
nit
of a
naly
sis
Num
ber
anal
ysed
TP
FPFN
TN
Sens
itiv
ity
(%)
Spec
ifici
ty
(%)
Lahm
e 20
0113
2
No.
of p
atie
nts
169,
of
who
m n
o pr
evio
us h
isto
ry
of B
C 4
0, h
isto
ry o
f BC
44,
ot
her
25, h
ealth
y co
ntro
ls
60
NM
P22
(Mat
rite
ch)
Labo
rato
ry a
naly
sis
10 U
/ml
Patie
nt (
excl
udin
g he
alth
y co
ntro
ls)
109
2527
1542
6361
W
ith B
C o
r be
ing
follo
wed
up
8425
1515
2963
66
Ta
229
1341
T
18
53
63
Ta
-T1
3014
1647
T
2–4
109
190
G
125
G
268
G
310
0
H
ealth
y co
ntro
ls60
456
93
W
ith b
enig
n le
sion
s25
1213
51
Cyt
olog
y (V
U)
Patie
nt (
excl
udin
g he
alth
y co
ntro
ls)
109
185
2264
4593
W
ith B
C o
r be
ing
follo
wed
up
8418
522
3945
89
Ta
226
1627
T
18
53
63
Ta
-T1
3011
1937
T
2–4
107
370
G
120
G
259
G
367
H
ealth
y co
ntro
ls60
060
100
W
ith b
enig
n le
sion
s25
025
100
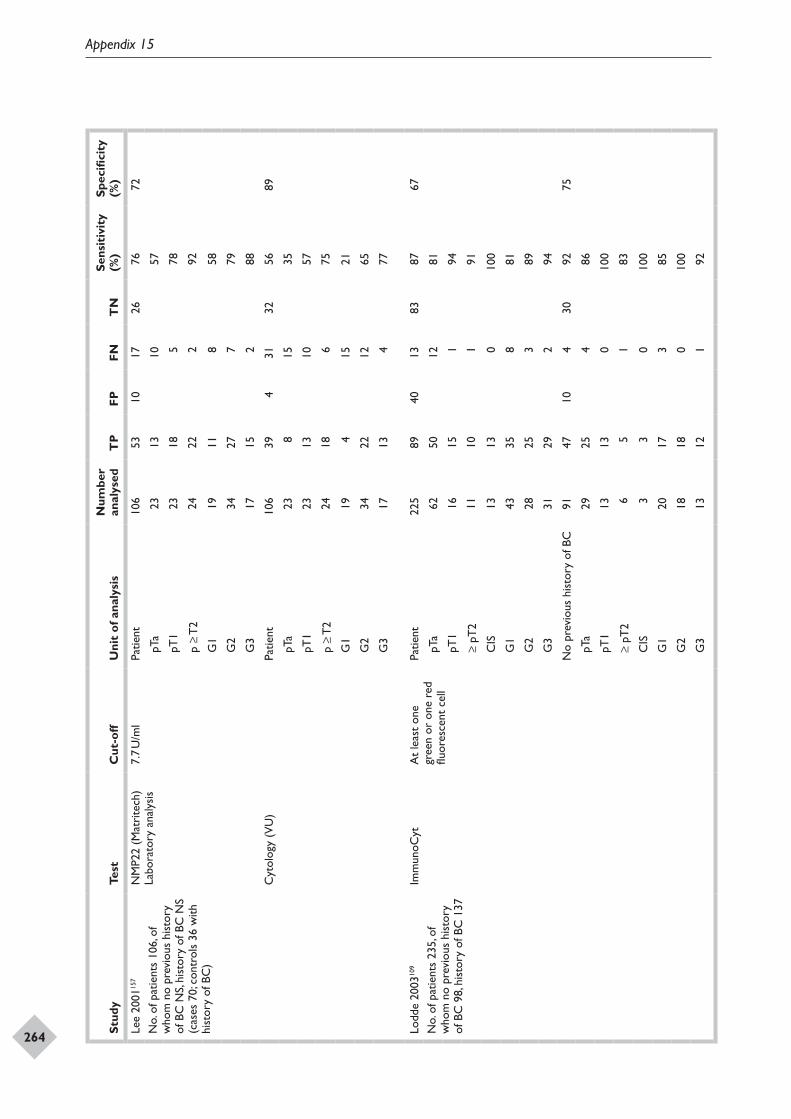
Appendix 15
264
DOI: 10.3310/hta14040 Health Technology Assessment 2010; Vol. 14: No. 4
© 2010 Queen’s Printer and Controller of HMSO. All rights reserved.
265Stud
yTe
stC
ut-o
ffU
nit
of a
naly
sis
Num
ber
anal
ysed
TP
FPFN
TN
Sens
itiv
ity
(%)
Spec
ifici
ty
(%)
Lee
2001
157
No.
of p
atie
nts
106,
of
who
m n
o pr
evio
us h
isto
ry
of B
C N
S, hi
stor
y of
BC
NS
(cas
es 7
0; c
ontr
ols
36 w
ith
hist
ory
of B
C)
NM
P22
(Mat
rite
ch)
Labo
rato
ry a
naly
sis
7.7
U/m
lPa
tient
106
5310
1726
7672
pT
a23
1310
57
pT
123
185
78
p
≥ T
224
222
92
G
119
118
58
G
234
277
79
G
317
152
88
Cyt
olog
y (V
U)
Patie
nt10
639
431
3256
89
pT
a23
815
35
pT
123
1310
57
p
≥ T
224
186
75
G
119
415
21
G
234
2212
65
G
317
134
77
Lodd
e 20
0310
9
No.
of p
atie
nts
235,
of
who
m n
o pr
evio
us h
isto
ry
of B
C 9
8, h
isto
ry o
f BC
137
Imm
unoC
ytA
t le
ast
one
gree
n or
one
red
flu
ores
cent
cel
l
Patie
nt22
589
4013
8387
67
pT
a62
5012
81
pT
116
151
94
≥
pT2
1110
191
C
IS13
130
100
G
143
358
81
G
228
253
89
G
331
292
94
No
prev
ious
his
tory
of B
C91
4710
430
9275
pT
a29
254
86
pT
113
130
100
≥
pT2
65
183
C
IS3
30
100
G
120
173
85
G
218
180
100
G
313
121
92
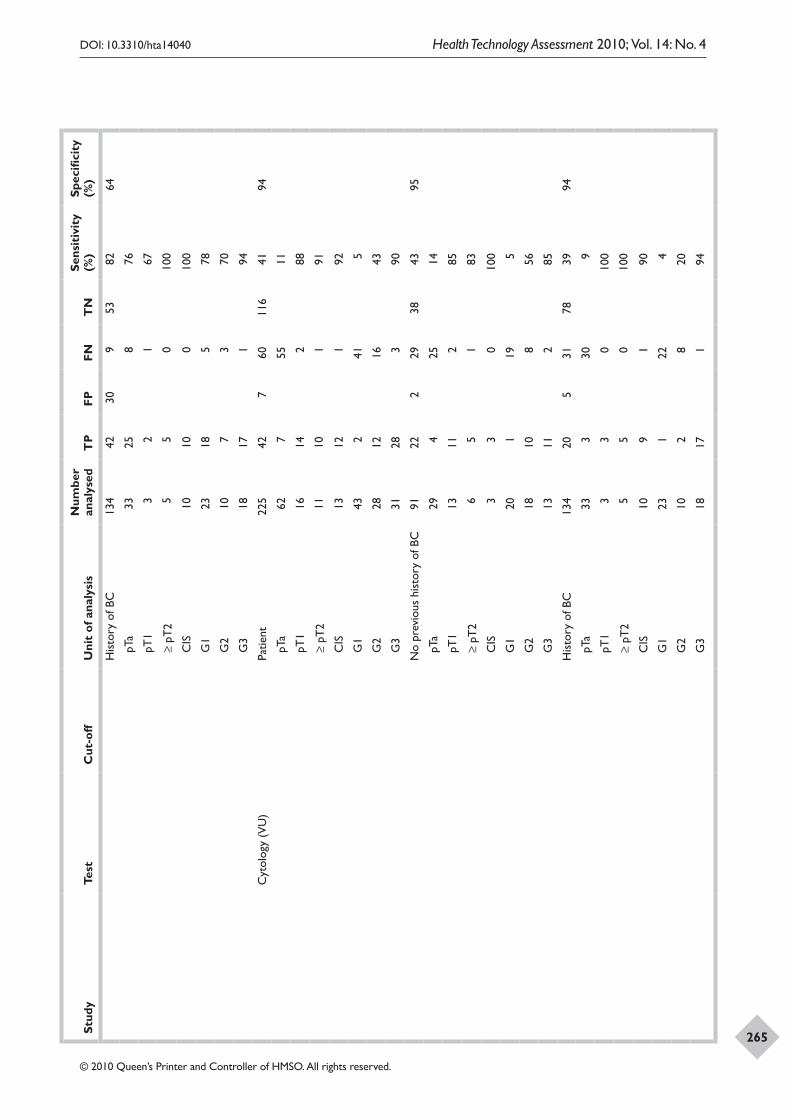
Appendix 15
264
DOI: 10.3310/hta14040 Health Technology Assessment 2010; Vol. 14: No. 4
© 2010 Queen’s Printer and Controller of HMSO. All rights reserved.
265Stud
yTe
stC
ut-o
ffU
nit
of a
naly
sis
Num
ber
anal
ysed
TP
FPFN
TN
Sens
itiv
ity
(%)
Spec
ifici
ty
(%)
His
tory
of B
C13
442
309
5382
64
pT
a33
258
76
pT
13
21
67
≥
pT2
55
010
0
C
IS10
100
100
G
123
185
78
G
210
73
70
G
318
171
94
Cyt
olog
y (V
U)
Patie
nt22
542
760
116
4194
pT
a62
755
11
pT
116
142
88
≥
pT2
1110
191
C
IS13
121
92
G
143
241
5
G
228
1216
43
G
331
283
90
No
prev
ious
his
tory
of B
C91
222
2938
4395
pT
a29
425
14
pT
113
112
85
≥
pT2
65
183
C
IS3
30
100
G
120
119
5
G
218
108
56
G
313
112
85
His
tory
of B
C13
420
531
7839
94
pT
a33
330
9
pT
13
30
100
≥
pT2
55
010
0
C
IS10
91
90
G
123
122
4
G
210
28
20
G
318
171
94
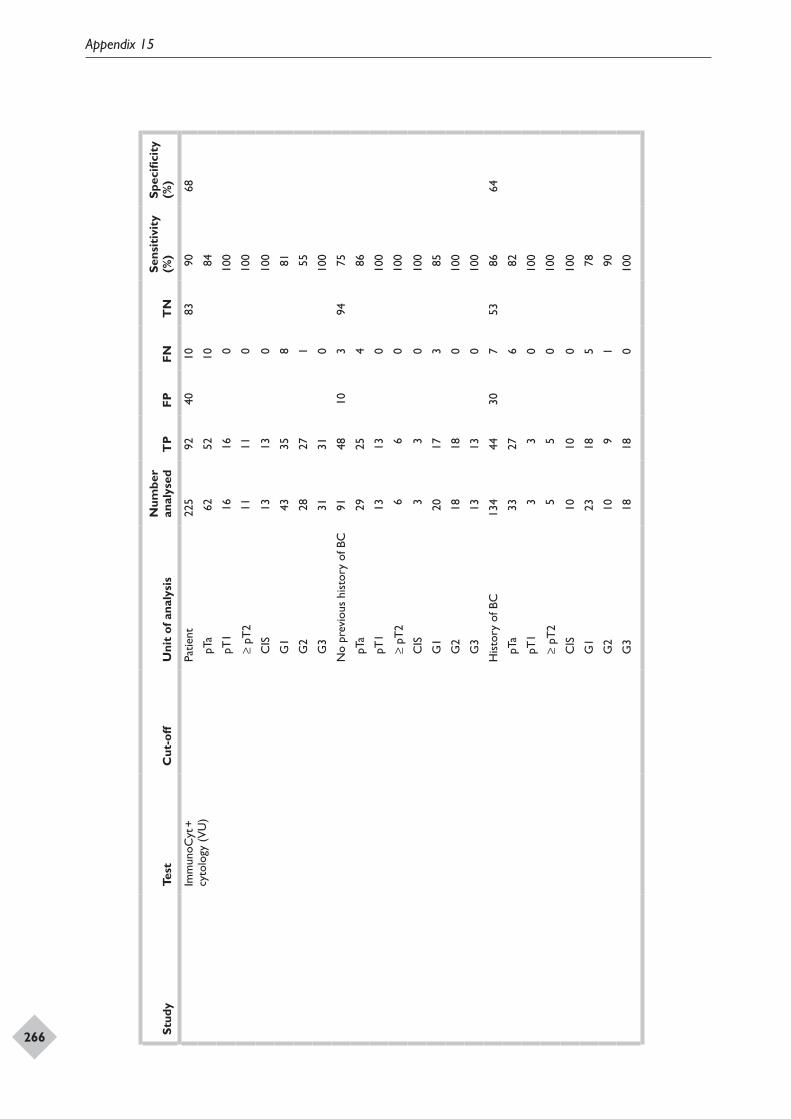
Appendix 15
266
DOI: 10.3310/hta14040 Health Technology Assessment 2010; Vol. 14: No. 4
© 2010 Queen’s Printer and Controller of HMSO. All rights reserved.
267Stud
yTe
stC
ut-o
ffU
nit
of a
naly
sis
Num
ber
anal
ysed
TP
FPFN
TN
Sens
itiv
ity
(%)
Spec
ifici
ty
(%)
Imm
unoC
yt +
cy
tolo
gy (
VU
)Pa
tient
225
9240
1083
9068
pT
a62
5210
84
pT
116
160
100
≥
pT2
1111
010
0
C
IS13
130
100
G
143
358
81
G
228
271
55
G
331
310
100
No
prev
ious
his
tory
of B
C91
4810
394
75
pT
a29
254
86
pT
113
130
100
≥
pT2
66
010
0
C
IS3
30
100
G
120
173
85
G
218
180
100
G
313
130
100
His
tory
of B
C13
444
307
5386
64
pT
a33
276
82
pT
13
30
100
≥
pT2
55
010
0
C
IS10
100
100
G
123
185
78
G
210
91
90
G
318
180
100
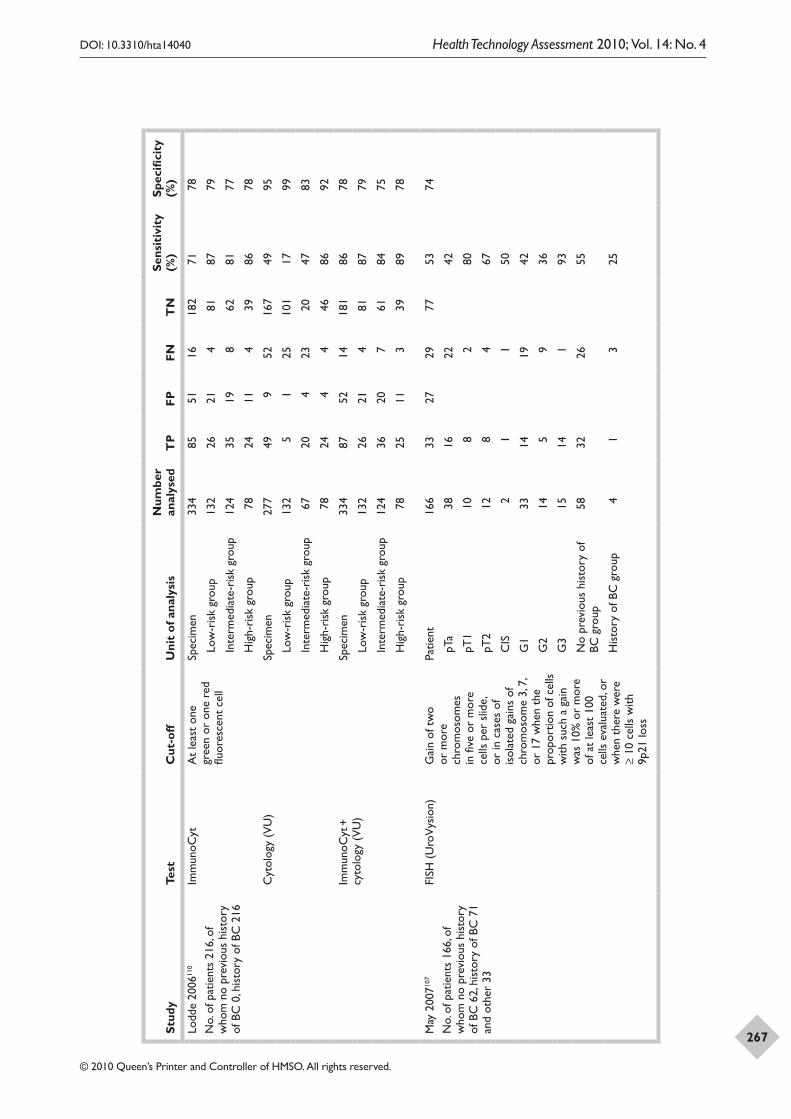
Appendix 15
266
DOI: 10.3310/hta14040 Health Technology Assessment 2010; Vol. 14: No. 4
© 2010 Queen’s Printer and Controller of HMSO. All rights reserved.
267Stud
yTe
stC
ut-o
ffU
nit
of a
naly
sis
Num
ber
anal
ysed
TP
FPFN
TN
Sens
itiv
ity
(%)
Spec
ifici
ty
(%)
Lodd
e 20
0611
0
No.
of p
atie
nts
216,
of
who
m n
o pr
evio
us h
isto
ry
of B
C 0
, his
tory
of B
C 2
16
Imm
unoC
ytA
t le
ast
one
gree
n or
one
red
flu
ores
cent
cel
l
Spec
imen
334
8551
1618
271
78
Lo
w-r
isk
grou
p 13
226
214
8187
79
In
term
edia
te-r
isk
grou
p 12
435
198
6281
77
H
igh-
risk
gro
up
7824
114
3986
78
Cyt
olog
y (V
U)
Spec
imen
277
499
5216
749
95
Lo
w-r
isk
grou
p 13
25
125
101
1799
In
term
edia
te-r
isk
grou
p 67
204
2320
4783
H
igh-
risk
gro
up
7824
44
4686
92
Imm
unoC
yt +
cy
tolo
gy (
VU
)Sp
ecim
en33
487
5214
181
8678
Lo
w-r
isk
grou
p 13
226
214
8187
79
In
term
edia
te-r
isk
grou
p 12
436
207
6184
75
H
igh-
risk
gro
up
7825
113
3989
78
May
200
7107
No.
of p
atie
nts
166,
of
who
m n
o pr
evio
us h
isto
ry
of B
C 6
2, h
isto
ry o
f BC
71
and
othe
r 33
FISH
(U
roV
ysio
n)G
ain
of t
wo
or m
ore
chro
mos
omes
in
five
or
mor
e ce
lls p
er s
lide,
or
in c
ases
of
isol
ated
gai
ns o
f ch
rom
osom
e 3,
7,
or 1
7 w
hen
the
prop
ortio
n of
cel
ls
with
suc
h a
gain
w
as 1
0% o
r m
ore
of a
t le
ast
100
cells
eva
luat
ed, o
r w
hen
ther
e w
ere
≥ 10
cel
ls w
ith
9p21
loss
Patie
nt16
633
2729
7753
74
pT
a38
1622
42
pT
110
82
80
pT
212
84
67
C
IS2
11
50
G
133
1419
42
G
214
59
36
G
315
141
93
N
o pr
evio
us h
isto
ry o
f BC
gro
up58
3226
55
H
isto
ry o
f BC
gro
up4
13
25
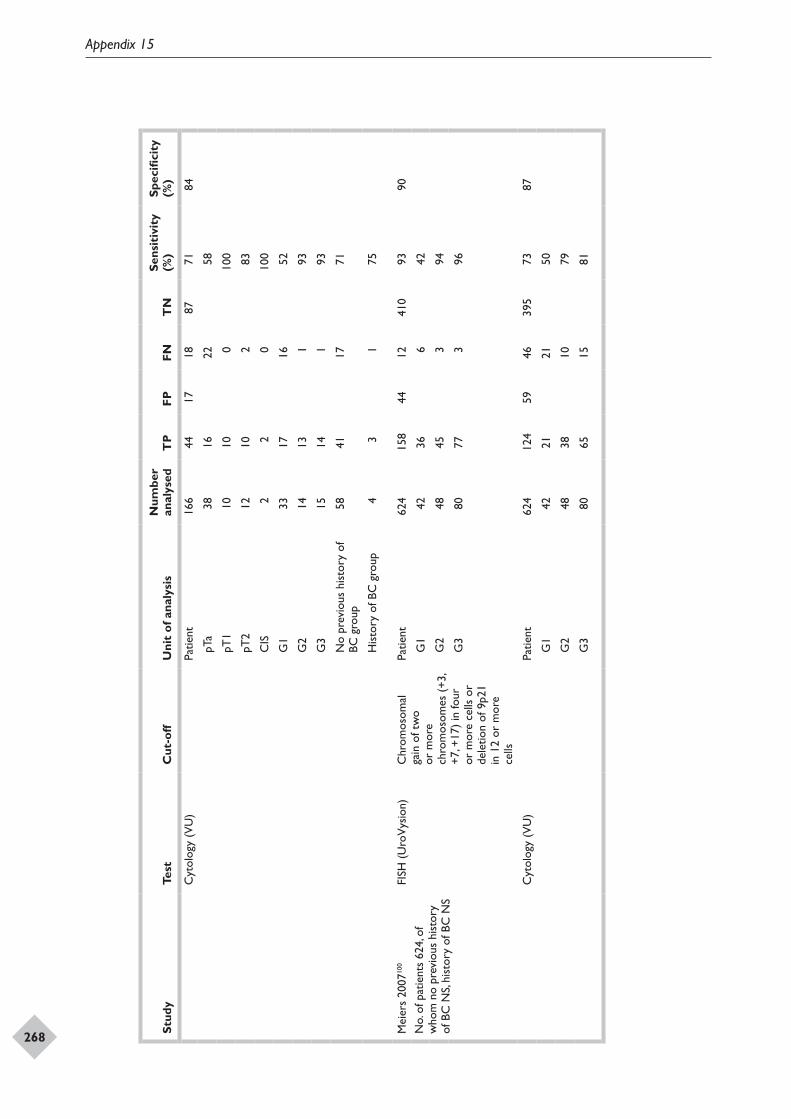
Appendix 15
268
DOI: 10.3310/hta14040 Health Technology Assessment 2010; Vol. 14: No. 4
© 2010 Queen’s Printer and Controller of HMSO. All rights reserved.
269Stud
yTe
stC
ut-o
ffU
nit
of a
naly
sis
Num
ber
anal
ysed
TP
FPFN
TN
Sens
itiv
ity
(%)
Spec
ifici
ty
(%)
Cyt
olog
y (V
U)
Patie
nt16
644
1718
8771
84
pT
a38
1622
58
pT
110
100
100
pT
212
102
83
C
IS2
20
100
G
133
1716
52
G
214
131
93
G
315
141
93
N
o pr
evio
us h
isto
ry o
f BC
gro
up58
4117
71
H
isto
ry o
f BC
gro
up4
31
75
Mei
ers
2007
100
No.
of p
atie
nts
624,
of
who
m n
o pr
evio
us h
isto
ry
of B
C N
S, hi
stor
y of
BC
NS
FISH
(U
roV
ysio
n)C
hrom
osom
al
gain
of t
wo
or m
ore
chro
mos
omes
(+3
, +7
, +17
) in
four
or
mor
e ce
lls o
r de
letio
n of
9p2
1 in
12
or m
ore
cells
Patie
nt62
415
844
1241
093
90
G
142
366
42
G
248
453
94
G
380
773
96
Cyt
olog
y (V
U)
Patie
nt62
412
459
4639
573
87
G
142
2121
50
G
248
3810
79
G
380
6515
81
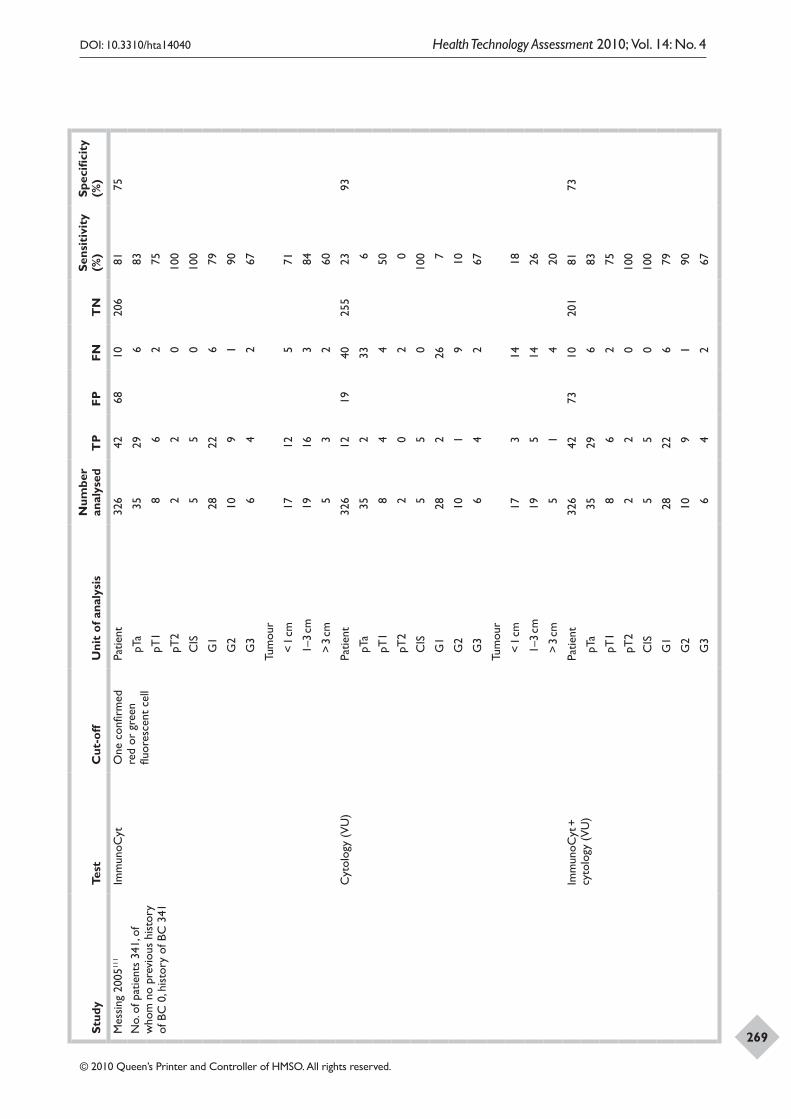
Appendix 15
268
DOI: 10.3310/hta14040 Health Technology Assessment 2010; Vol. 14: No. 4
© 2010 Queen’s Printer and Controller of HMSO. All rights reserved.
269Stud
yTe
stC
ut-o
ffU
nit
of a
naly
sis
Num
ber
anal
ysed
TP
FPFN
TN
Sens
itiv
ity
(%)
Spec
ifici
ty
(%)
Mes
sing
200
5111
No.
of p
atie
nts
341,
of
who
m n
o pr
evio
us h
isto
ry
of B
C 0
, his
tory
of B
C 3
41
Imm
unoC
ytO
ne c
onfir
med
re
d or
gre
en
fluor
esce
nt c
ell
Patie
nt32
642
6810
206
8175
pT
a35
296
83
pT
18
62
75
pT
22
20
100
C
IS5
50
100
G
128
226
79
G
210
91
90
G
36
42
67
Tum
our
<
1 cm
1712
571
1–
3 cm
1916
384
>
3 cm
53
260
Cyt
olog
y (V
U)
Patie
nt32
612
1940
255
2393
pT
a35
233
6
pT
18
44
50
pT
22
02
0
C
IS5
50
100
G
128
226
7
G
210
19
10
G
36
42
67
Tum
our
<
1 cm
173
1418
1–
3 cm
195
1426
>
3 cm
51
420
Imm
unoC
yt +
cy
tolo
gy (
VU
)Pa
tient
326
4273
1020
181
73
pT
a35
296
83
pT
18
62
75
pT
22
20
100
C
IS5
50
100
G
128
226
79
G
210
91
90
G
36
42
67
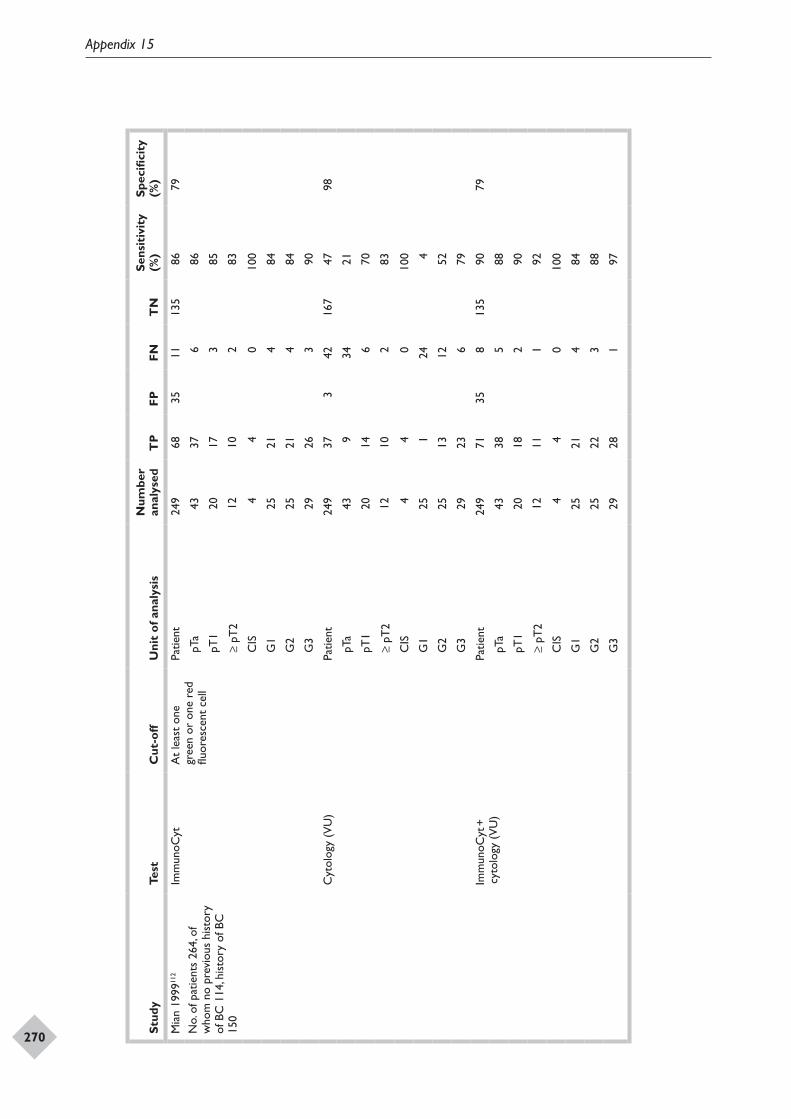
Appendix 15
270
DOI: 10.3310/hta14040 Health Technology Assessment 2010; Vol. 14: No. 4
© 2010 Queen’s Printer and Controller of HMSO. All rights reserved.
271Stud
yTe
stC
ut-o
ffU
nit
of a
naly
sis
Num
ber
anal
ysed
TP
FPFN
TN
Sens
itiv
ity
(%)
Spec
ifici
ty
(%)
Mia
n 19
9911
2
No.
of p
atie
nts
264,
of
who
m n
o pr
evio
us h
isto
ry
of B
C 1
14, h
isto
ry o
f BC
15
0
Imm
unoC
ytA
t le
ast
one
gree
n or
one
red
flu
ores
cent
cel
l
Patie
nt24
968
3511
135
8679
pT
a43
376
86
pT
120
173
85
≥
pT2
1210
283
C
IS4
40
100
G
125
214
84
G
225
214
84
G
329
263
90
Cyt
olog
y (V
U)
Patie
nt24
937
342
167
4798
pT
a43
934
21
pT
120
146
70
≥
pT2
1210
283
C
IS4
40
100
G
125
124
4
G
225
1312
52
G
329
236
79
Imm
unoC
yt +
cy
tolo
gy (
VU
)Pa
tient
249
7135
813
590
79
pT
a43
385
88
pT
120
182
90
≥
pT2
1211
192
C
IS4
40
100
G
125
214
84
G
225
223
88
G
329
281
97
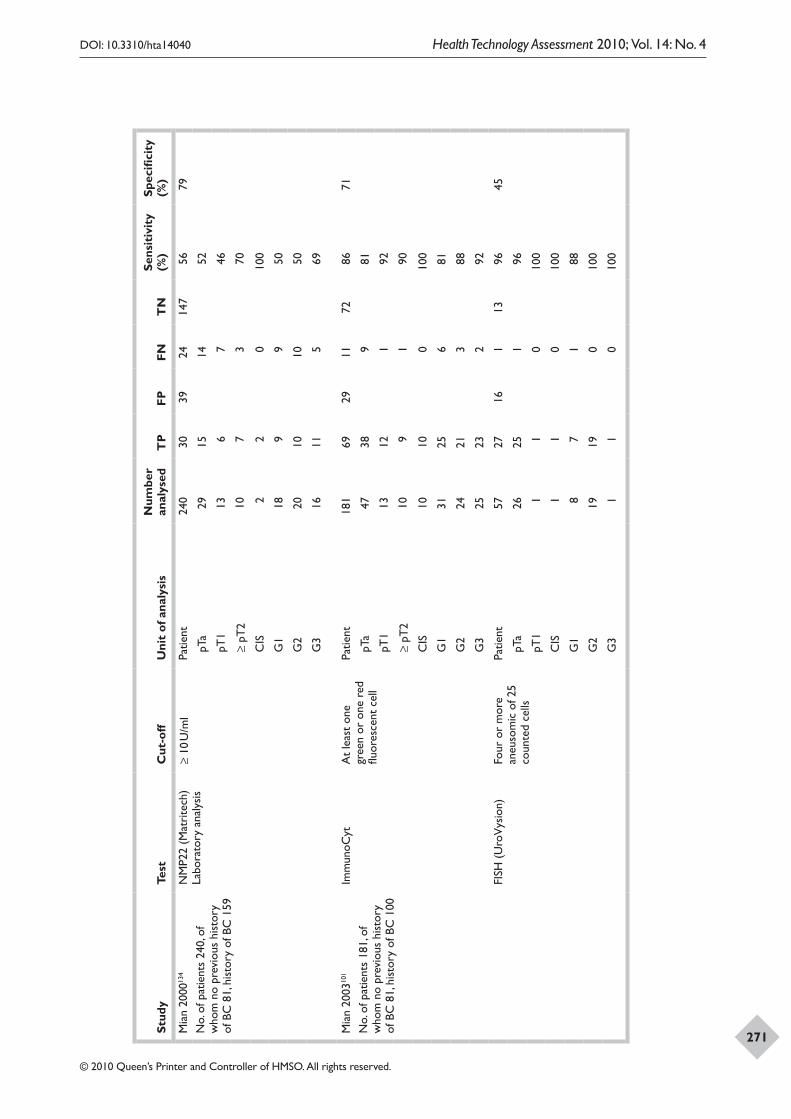
Appendix 15
270
DOI: 10.3310/hta14040 Health Technology Assessment 2010; Vol. 14: No. 4
© 2010 Queen’s Printer and Controller of HMSO. All rights reserved.
271Stud
yTe
stC
ut-o
ffU
nit
of a
naly
sis
Num
ber
anal
ysed
TP
FPFN
TN
Sens
itiv
ity
(%)
Spec
ifici
ty
(%)
Mia
n 20
0013
4
No.
of p
atie
nts
240,
of
who
m n
o pr
evio
us h
isto
ry
of B
C 8
1, h
isto
ry o
f BC
159
NM
P22
(Mat
rite
ch)
Labo
rato
ry a
naly
sis
≥ 10
U/m
lPa
tient
240
3039
2414
756
79
pT
a29
1514
52
pT
113
67
46
≥
pT2
107
370
C
IS2
20
100
G
118
99
50
G
220
1010
50
G
316
115
69
Mia
n 20
0310
1
No.
of p
atie
nts
181,
of
who
m n
o pr
evio
us h
isto
ry
of B
C 8
1, h
isto
ry o
f BC
100
Imm
unoC
ytA
t le
ast
one
gree
n or
one
red
flu
ores
cent
cel
l
Patie
nt18
169
2911
7286
71
pT
a47
389
81
pT
113
121
92
≥
pT2
109
190
C
IS10
100
100
G
131
256
81
G
224
213
88
G
325
232
92
FISH
(U
roV
ysio
n)Fo
ur o
r m
ore
aneu
som
ic o
f 25
coun
ted
cells
Patie
nt57
2716
113
9645
pT
a26
251
96
pT
11
10
100
C
IS1
10
100
G
18
71
88
G
219
190
100
G
31
10
100
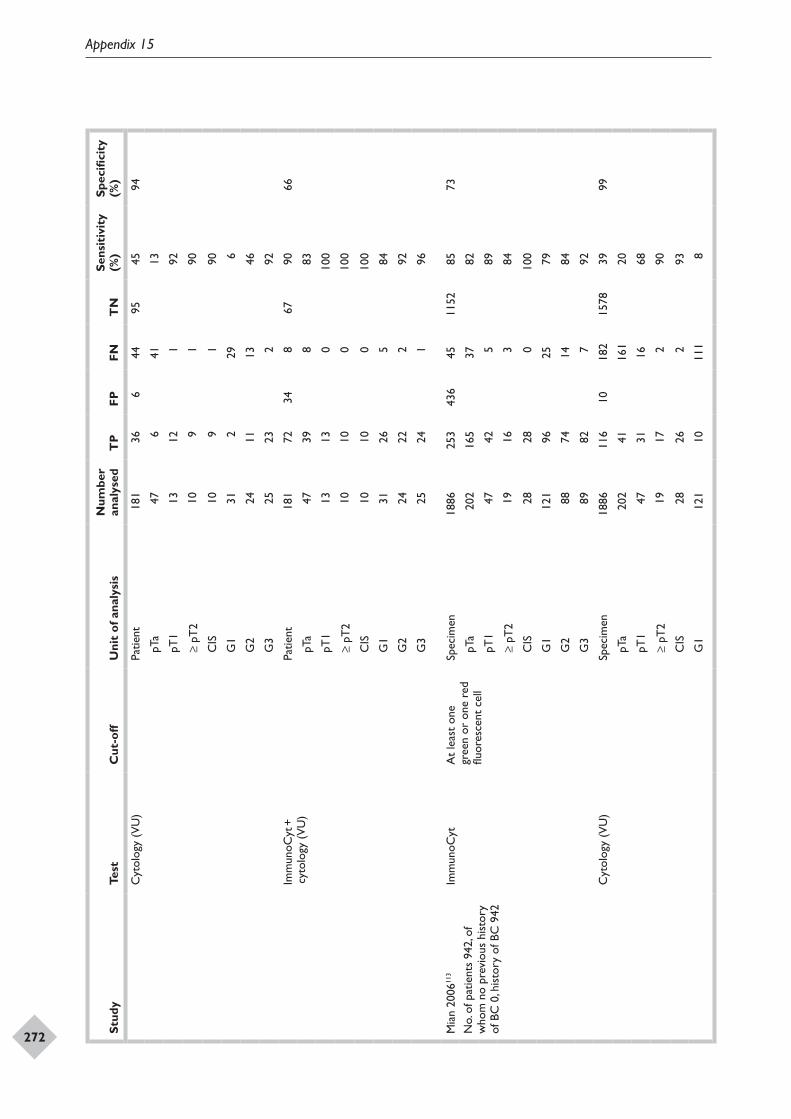
Appendix 15
272
DOI: 10.3310/hta14040 Health Technology Assessment 2010; Vol. 14: No. 4
© 2010 Queen’s Printer and Controller of HMSO. All rights reserved.
273Stud
yTe
stC
ut-o
ffU
nit
of a
naly
sis
Num
ber
anal
ysed
TP
FPFN
TN
Sens
itiv
ity
(%)
Spec
ifici
ty
(%)
Cyt
olog
y (V
U)
Patie
nt18
136
644
9545
94
pT
a47
641
13
pT
113
121
92
≥
pT2
109
190
C
IS10
91
90
G
131
229
6
G
224
1113
46
G
325
232
92
Imm
unoC
yt +
cy
tolo
gy (
VU
)Pa
tient
181
7234
867
9066
pT
a47
398
83
pT
113
130
100
≥
pT2
1010
010
0
C
IS10
100
100
G
131
265
84
G
224
222
92
G
325
241
96
Mia
n 20
0611
3
No.
of p
atie
nts
942,
of
who
m n
o pr
evio
us h
isto
ry
of B
C 0
, his
tory
of B
C 9
42
Imm
unoC
ytA
t le
ast
one
gree
n or
one
red
flu
ores
cent
cel
l
Spec
imen
1886
253
436
4511
5285
73
pT
a20
216
537
82
pT
147
425
89
≥
pT2
1916
384
C
IS28
280
100
G
112
196
2579
G
288
7414
84
G
389
827
92
Cyt
olog
y (V
U)
Spec
imen
1886
116
1018
215
7839
99
pT
a20
241
161
20
pT
147
3116
68
≥
pT2
1917
290
C
IS28
262
93
G
112
110
111
8
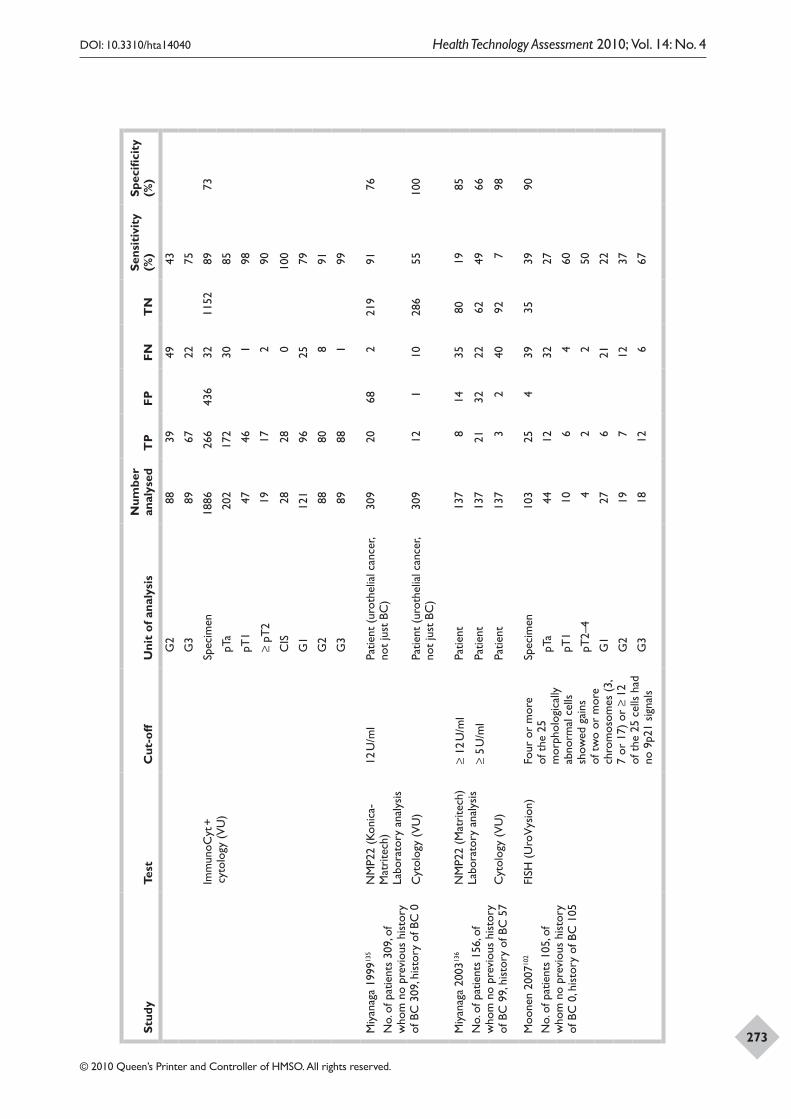
Appendix 15
272
DOI: 10.3310/hta14040 Health Technology Assessment 2010; Vol. 14: No. 4
© 2010 Queen’s Printer and Controller of HMSO. All rights reserved.
273Stud
yTe
stC
ut-o
ffU
nit
of a
naly
sis
Num
ber
anal
ysed
TP
FPFN
TN
Sens
itiv
ity
(%)
Spec
ifici
ty
(%)
G
288
3949
43
G
389
6722
75
Imm
unoC
yt +
cy
tolo
gy (
VU
)Sp
ecim
en18
8626
643
632
1152
8973
pT
a20
217
230
85
pT
147
461
98
≥
pT2
1917
290
C
IS28
280
100
G
112
196
2579
G
288
808
91
G
389
881
99
Miy
anag
a 19
9913
5
No.
of p
atie
nts
309,
of
who
m n
o pr
evio
us h
isto
ry
of B
C 3
09, h
isto
ry o
f BC
0
NM
P22
(Kon
ica-
Mat
rite
ch)
Labo
rato
ry a
naly
sis
12 U
/ml
Patie
nt (
urot
helia
l can
cer,
not
just
BC
)30
920
682
219
9176
Cyt
olog
y (V
U)
Patie
nt (
urot
helia
l can
cer,
not
just
BC
)30
912
110
286
5510
0
Miy
anag
a 20
0313
6
No.
of p
atie
nts
156,
of
who
m n
o pr
evio
us h
isto
ry
of B
C 9
9, h
isto
ry o
f BC
57
NM
P22
(Mat
rite
ch)
Labo
rato
ry a
naly
sis
≥ 12
U/m
lPa
tient
137
814
3580
1985
≥ 5
U/m
lPa
tient
137
2132
2262
4966
Cyt
olog
y (V
U)
Patie
nt13
73
240
927
98
Moo
nen
2007
102
No.
of p
atie
nts
105,
of
who
m n
o pr
evio
us h
isto
ry
of B
C 0
, his
tory
of B
C 1
05
FISH
(U
roV
ysio
n)Fo
ur o
r m
ore
of t
he 2
5 m
orph
olog
ical
ly
abno
rmal
cel
ls
show
ed g
ains
of
tw
o or
mor
e ch
rom
osom
es (
3,
7 or
17)
or
≥ 12
of
the
25
cells
had
no
9p2
1 si
gnal
s
Spec
imen
103
254
3935
3990
pT
a44
1232
27
pT
110
64
60
pT
2–4
42
250
G
127
621
22
G
219
712
37
G
318
126
67
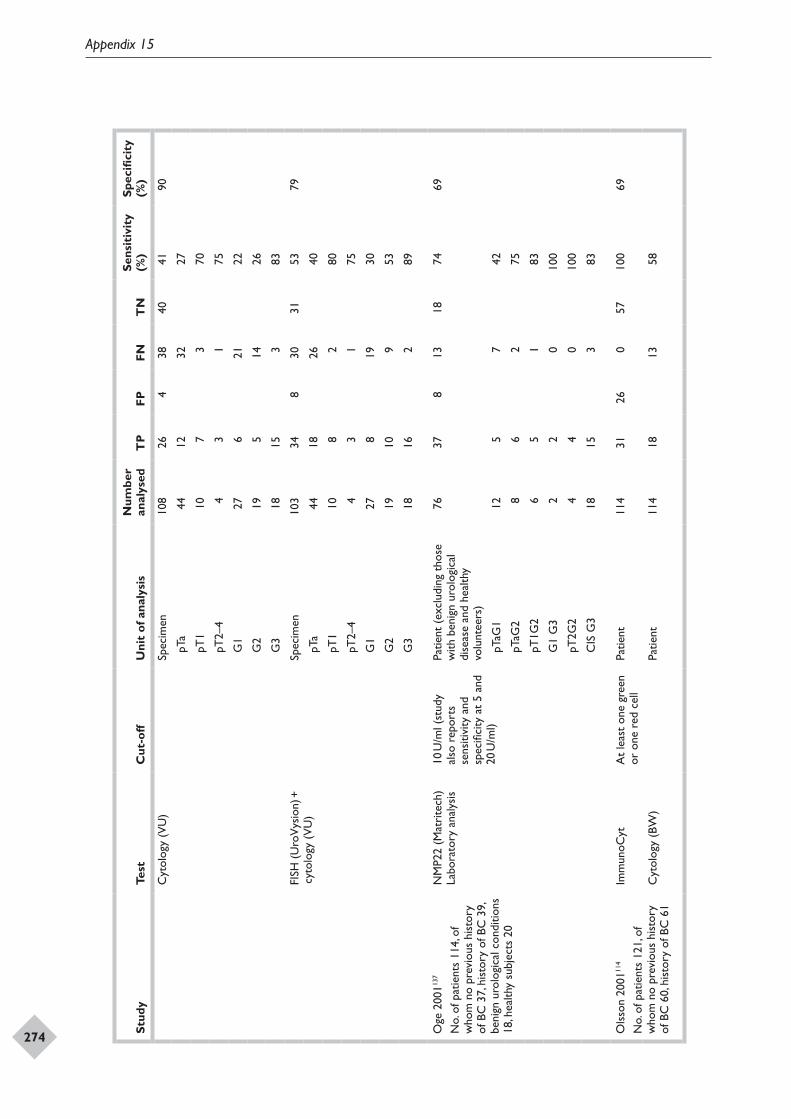
Appendix 15
274
DOI: 10.3310/hta14040 Health Technology Assessment 2010; Vol. 14: No. 4
© 2010 Queen’s Printer and Controller of HMSO. All rights reserved.
275Stud
yTe
stC
ut-o
ffU
nit
of a
naly
sis
Num
ber
anal
ysed
TP
FPFN
TN
Sens
itiv
ity
(%)
Spec
ifici
ty
(%)
Cyt
olog
y (V
U)
Spec
imen
108
264
3840
4190
pT
a44
1232
27
pT
110
73
70
pT
2–4
43
175
G
127
621
22
G
219
514
26
G
318
153
83
FISH
(U
roV
ysio
n) +
cy
tolo
gy (
VU
)Sp
ecim
en10
334
830
3153
79
pT
a44
1826
40
pT
110
82
80
pT
2–4
43
175
G
127
819
30
G
219
109
53
G
318
162
89
Oge
200
1137
No.
of p
atie
nts
114,
of
who
m n
o pr
evio
us h
isto
ry
of B
C 3
7, h
isto
ry o
f BC
39,
be
nign
uro
logi
cal c
ondi
tions
18
, hea
lthy
subj
ects
20
NM
P22
(Mat
rite
ch)
Labo
rato
ry a
naly
sis
10 U
/ml (
stud
y al
so r
epor
ts
sens
itivi
ty a
nd
spec
ifici
ty a
t 5
and
20 U
/ml)
Patie
nt (
excl
udin
g th
ose
with
ben
ign
urol
ogic
al
dise
ase
and
heal
thy
volu
ntee
rs)
7637
813
1874
69
pT
aG1
125
742
pT
aG2
86
275
pT
1G2
65
183
G
1 G
32
20
100
pT
2G2
44
010
0
C
IS G
318
153
83
Ols
son
2001
114
No.
of p
atie
nts
121,
of
who
m n
o pr
evio
us h
isto
ry
of B
C 6
0, h
isto
ry o
f BC
61
Imm
unoC
ytA
t le
ast
one
gree
n or
one
red
cel
lPa
tient
114
3126
057
100
69
Cyt
olog
y (B
W)
Patie
nt11
418
1358
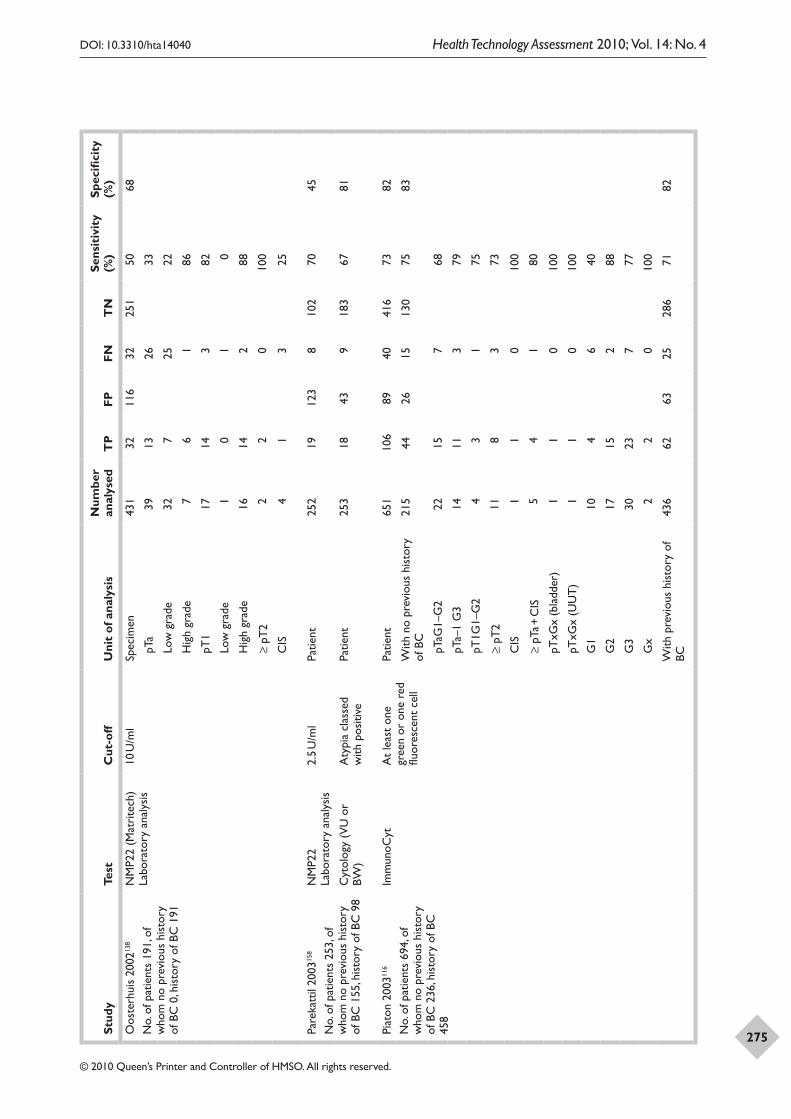
Appendix 15
274
DOI: 10.3310/hta14040 Health Technology Assessment 2010; Vol. 14: No. 4
© 2010 Queen’s Printer and Controller of HMSO. All rights reserved.
275Stud
yTe
stC
ut-o
ffU
nit
of a
naly
sis
Num
ber
anal
ysed
TP
FPFN
TN
Sens
itiv
ity
(%)
Spec
ifici
ty
(%)
Oos
terh
uis
2002
138
No.
of p
atie
nts
191,
of
who
m n
o pr
evio
us h
isto
ry
of B
C 0
, his
tory
of B
C 1
91
NM
P22
(Mat
rite
ch)
Labo
rato
ry a
naly
sis
10 U
/ml
Spec
imen
431
3211
632
251
5068
pT
a39
1326
33
Lo
w g
rade
327
2522
H
igh
grad
e7
61
86
pT
117
143
82
Lo
w g
rade
10
10
H
igh
grad
e16
142
88
≥
pT2
22
010
0
C
IS4
13
25
Pare
katt
il 20
0315
8
No.
of p
atie
nts
253,
of
who
m n
o pr
evio
us h
isto
ry
of B
C 1
55, h
isto
ry o
f BC
98
NM
P22
Labo
rato
ry a
naly
sis
2.5
U/m
lPa
tient
252
1912
38
102
7045
Cyt
olog
y (V
U o
r BW
)A
typi
a cl
asse
d w
ith p
ositi
vePa
tient
253
1843
918
367
81
Piat
on 2
00311
6
No.
of p
atie
nts
694,
of
who
m n
o pr
evio
us h
isto
ry
of B
C 2
36, h
isto
ry o
f BC
45
8
Imm
unoC
ytA
t le
ast
one
gree
n or
one
red
flu
ores
cent
cel
l
Patie
nt65
110
689
4041
673
82
With
no
prev
ious
his
tory
of
BC
215
4426
1513
075
83
pT
aG1–
G2
2215
768
pT
a–1
G3
1411
379
pT
1G1–
G2
43
175
≥
pT2
118
373
C
IS1
10
100
≥
pTa +
CIS
54
180
pT
xGx
(bla
dder
)1
10
100
pT
xGx
(UU
T)
11
010
0
G
110
46
40
G
217
152
88
G
330
237
77
G
x2
20
100
With
pre
viou
s hi
stor
y of
BC
436
6263
2528
671
82
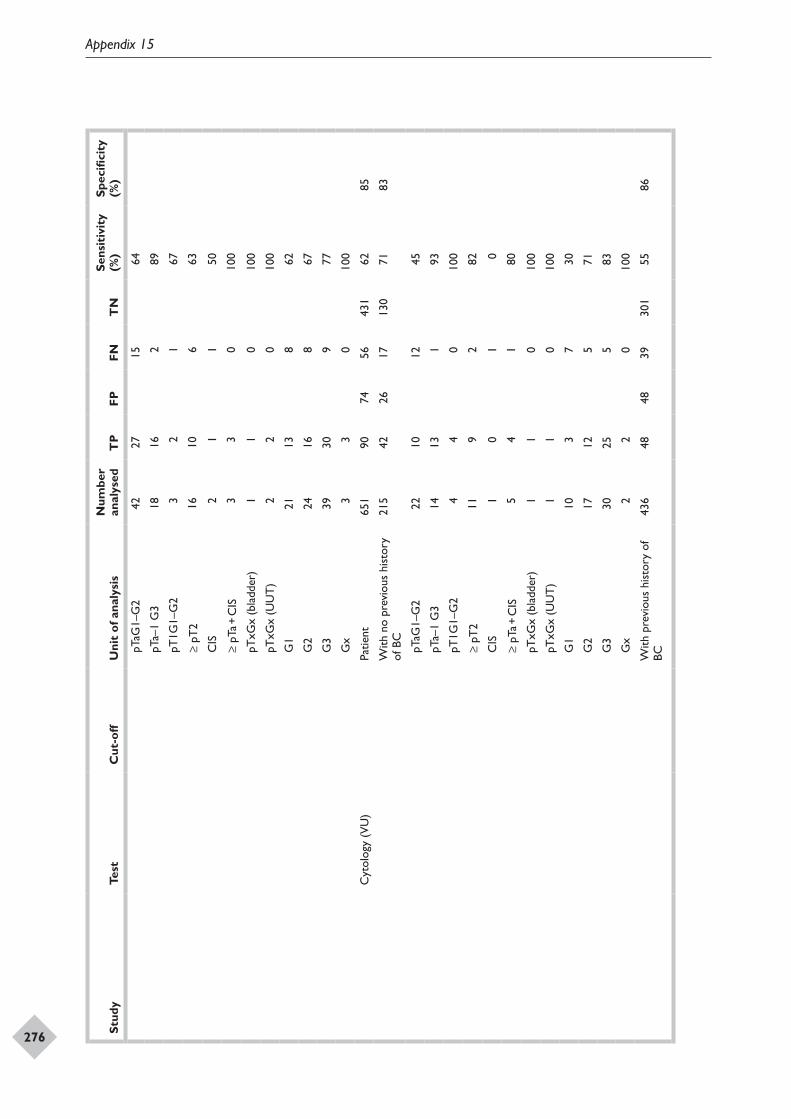
Appendix 15
276
DOI: 10.3310/hta14040 Health Technology Assessment 2010; Vol. 14: No. 4
© 2010 Queen’s Printer and Controller of HMSO. All rights reserved.
277Stud
yTe
stC
ut-o
ffU
nit
of a
naly
sis
Num
ber
anal
ysed
TP
FPFN
TN
Sens
itiv
ity
(%)
Spec
ifici
ty
(%)
pT
aG1–
G2
4227
1564
pT
a–1
G3
1816
289
pT
1G1–
G2
32
167
≥
pT2
1610
663
C
IS2
11
50
≥
pTa +
CIS
33
010
0
pT
xGx
(bla
dder
)1
10
100
pT
xGx
(UU
T)
22
010
0
G
121
138
62
G
224
168
67
G
339
309
77
G
x3
30
100
Cyt
olog
y (V
U)
Patie
nt65
190
7456
431
6285
With
no
prev
ious
his
tory
of
BC
215
4226
1713
071
83
pT
aG1–
G2
2210
1245
pT
a–1
G3
1413
193
pT
1G1–
G2
44
010
0
≥
pT2
119
282
C
IS1
01
0
≥
pTa +
CIS
54
180
pT
xGx
(bla
dder
)1
10
100
pT
xGx
(UU
T)
11
010
0
G
110
37
30
G
217
125
71
G
330
255
83
G
x2
20
100
With
pre
viou
s hi
stor
y of
BC
436
4848
3930
155
86
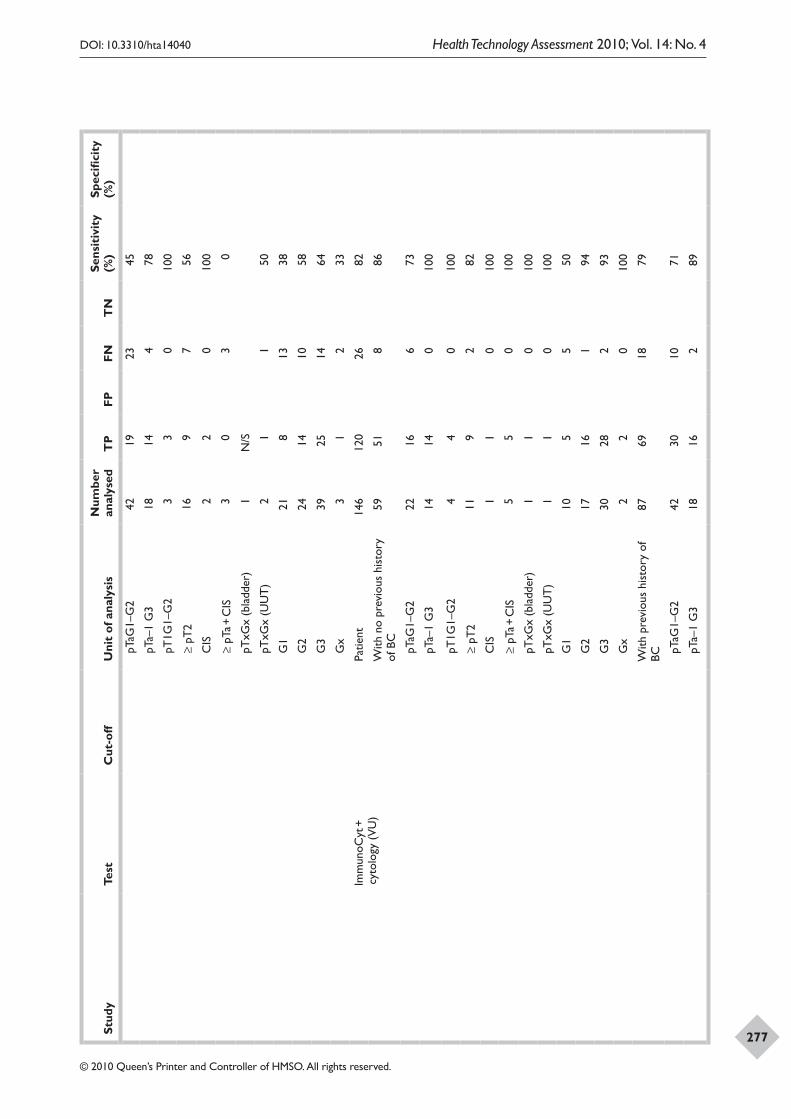
Appendix 15
276
DOI: 10.3310/hta14040 Health Technology Assessment 2010; Vol. 14: No. 4
© 2010 Queen’s Printer and Controller of HMSO. All rights reserved.
277Stud
yTe
stC
ut-o
ffU
nit
of a
naly
sis
Num
ber
anal
ysed
TP
FPFN
TN
Sens
itiv
ity
(%)
Spec
ifici
ty
(%)
pT
aG1–
G2
4219
2345
pT
a–1
G3
1814
478
pT
1G1–
G2
33
010
0
≥
pT2
169
756
C
IS2
20
100
≥
pTa +
CIS
30
30
pT
xGx
(bla
dder
)1
N/S
pT
xGx
(UU
T)
21
150
G
121
813
38
G
224
1410
58
G
339
2514
64
G
x3
12
33
Imm
unoC
yt +
cy
tolo
gy (
VU
)Pa
tient
146
120
2682
With
no
prev
ious
his
tory
of
BC
5951
886
pT
aG1–
G2
2216
673
pT
a–1
G3
1414
010
0
pT
1G1–
G2
44
010
0
≥
pT2
119
282
C
IS1
10
100
≥
pTa +
CIS
55
010
0
pT
xGx
(bla
dder
)1
10
100
pT
xGx
(UU
T)
11
010
0
G
110
55
50
G
217
161
94
G
330
282
93
G
x2
20
100
With
pre
viou
s hi
stor
y of
BC
8769
1879
pT
aG1–
G2
4230
1071
pT
a–1
G3
1816
289
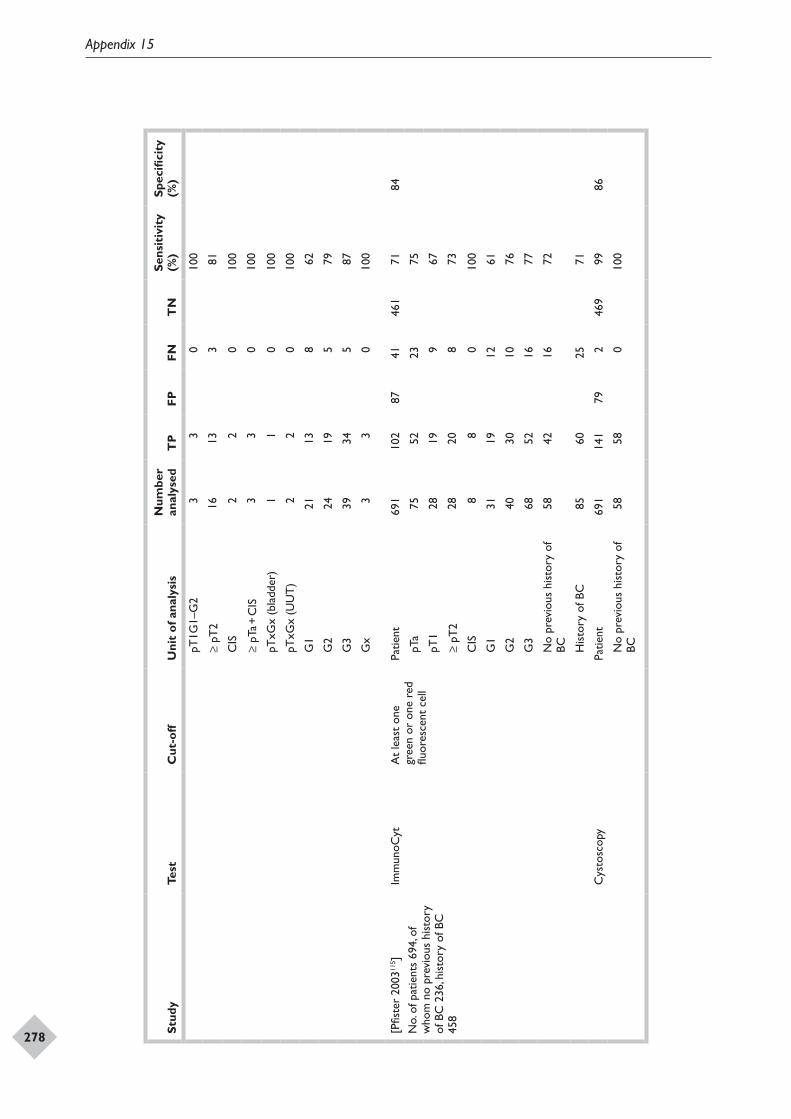
Appendix 15
278
DOI: 10.3310/hta14040 Health Technology Assessment 2010; Vol. 14: No. 4
© 2010 Queen’s Printer and Controller of HMSO. All rights reserved.
279Stud
yTe
stC
ut-o
ffU
nit
of a
naly
sis
Num
ber
anal
ysed
TP
FPFN
TN
Sens
itiv
ity
(%)
Spec
ifici
ty
(%)
pT
1G1–
G2
33
010
0
≥
pT2
1613
381
C
IS2
20
100
≥
pTa +
CIS
33
010
0
pT
xGx
(bla
dder
)1
10
100
pT
xGx
(UU
T)
22
010
0
G
121
138
62
G
224
195
79
G
339
345
87
G
x3
30
100
[Pfis
ter
2003
115 ]
No.
of p
atie
nts
694,
of
who
m n
o pr
evio
us h
isto
ry
of B
C 2
36, h
isto
ry o
f BC
45
8
Imm
unoC
ytA
t le
ast
one
gree
n or
one
red
flu
ores
cent
cel
l
Patie
nt69
110
287
4146
171
84
pT
a75
5223
75
pT
128
199
67
≥
pT2
2820
873
C
IS8
80
100
G
131
1912
61
G
240
3010
76
G
368
5216
77
N
o pr
evio
us h
isto
ry o
f BC
5842
1672
H
isto
ry o
f BC
8560
2571
Cys
tosc
opy
Patie
nt69
114
179
246
999
86
N
o pr
evio
us h
isto
ry o
f BC
5858
010
0
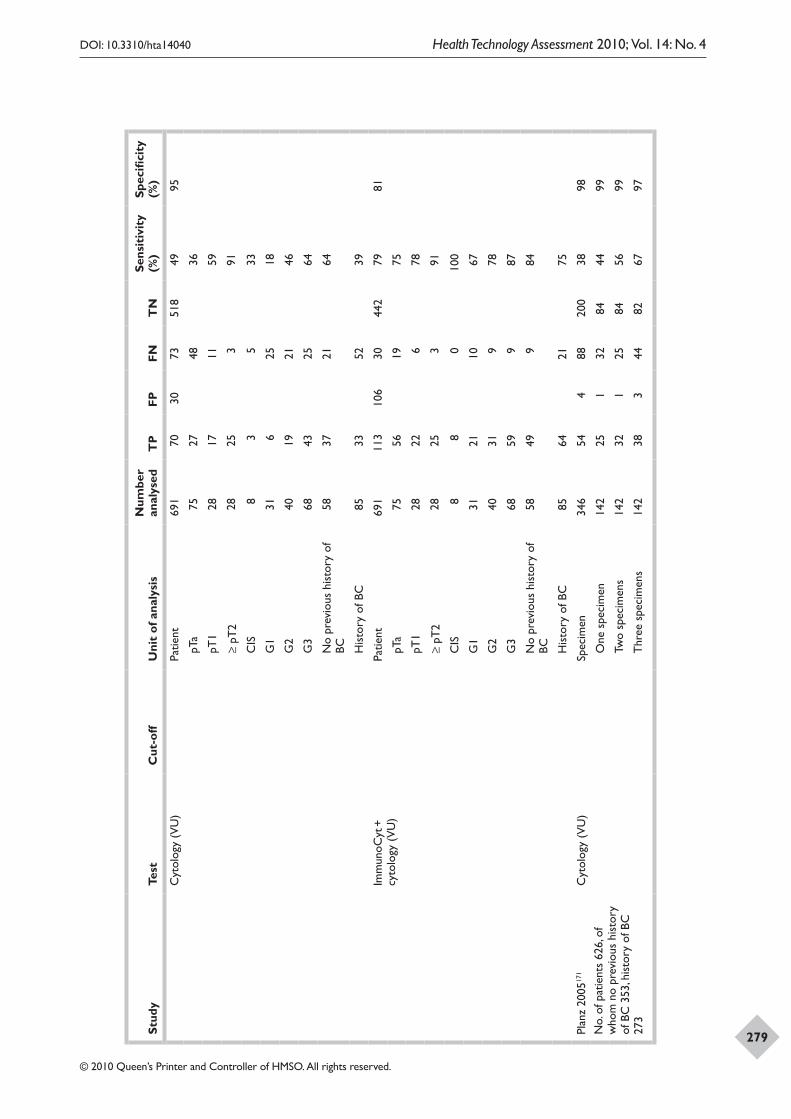
Appendix 15
278
DOI: 10.3310/hta14040 Health Technology Assessment 2010; Vol. 14: No. 4
© 2010 Queen’s Printer and Controller of HMSO. All rights reserved.
279Stud
yTe
stC
ut-o
ffU
nit
of a
naly
sis
Num
ber
anal
ysed
TP
FPFN
TN
Sens
itiv
ity
(%)
Spec
ifici
ty
(%)
Cyt
olog
y (V
U)
Patie
nt69
170
3073
518
4995
pT
a75
2748
36
pT
128
1711
59
≥
pT2
2825
391
C
IS8
35
33
G
131
625
18
G
240
1921
46
G
368
4325
64
N
o pr
evio
us h
isto
ry o
f BC
5837
2164
H
isto
ry o
f BC
8533
5239
Imm
unoC
yt +
cy
tolo
gy (
VU
)Pa
tient
691
113
106
3044
279
81
pT
a75
5619
75
pT
128
226
78
≥
pT2
2825
391
C
IS8
80
100
G
131
2110
67
G
240
319
78
G
368
599
87
N
o pr
evio
us h
isto
ry o
f BC
5849
984
H
isto
ry o
f BC
8564
2175
Plan
z 20
0517
1
No.
of p
atie
nts
626,
of
who
m n
o pr
evio
us h
isto
ry
of B
C 3
53, h
isto
ry o
f BC
27
3
Cyt
olog
y (V
U)
Spec
imen
346
544
8820
038
98
O
ne s
peci
men
142
251
3284
4499
Tw
o sp
ecim
ens
142
321
2584
5699
T
hree
spe
cim
ens
142
383
4482
6797
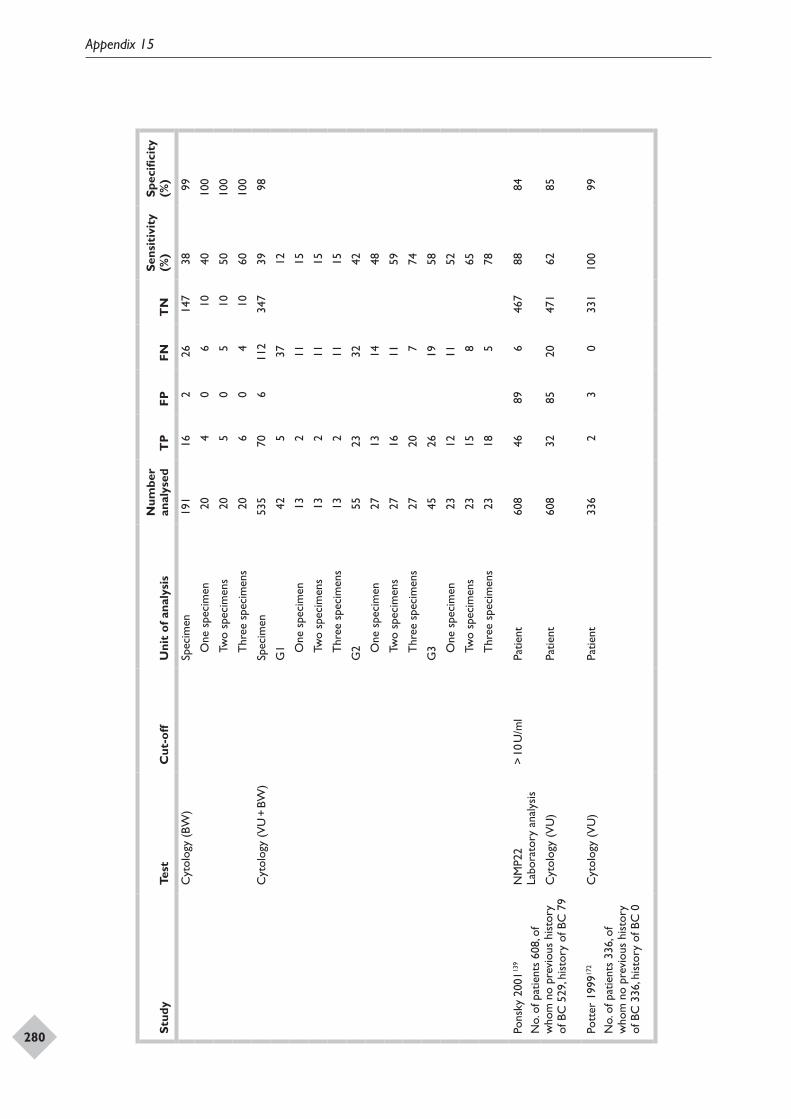
Appendix 15
280
DOI: 10.3310/hta14040 Health Technology Assessment 2010; Vol. 14: No. 4
© 2010 Queen’s Printer and Controller of HMSO. All rights reserved.
281Stud
yTe
stC
ut-o
ffU
nit
of a
naly
sis
Num
ber
anal
ysed
TP
FPFN
TN
Sens
itiv
ity
(%)
Spec
ifici
ty
(%)
Cyt
olog
y (B
W)
Spec
imen
191
162
2614
738
99
O
ne s
peci
men
204
06
1040
100
Tw
o sp
ecim
ens
205
05
1050
100
T
hree
spe
cim
ens
206
04
1060
100
Cyt
olog
y (V
U +
BW
)Sp
ecim
en53
570
611
234
739
98
G1
425
3712
O
ne s
peci
men
132
1115
Tw
o sp
ecim
ens
132
1115
T
hree
spe
cim
ens
132
1115
G2
5523
3242
O
ne s
peci
men
2713
1448
Tw
o sp
ecim
ens
2716
1159
T
hree
spe
cim
ens
2720
774
G3
4526
1958
O
ne s
peci
men
2312
1152
Tw
o sp
ecim
ens
2315
865
T
hree
spe
cim
ens
2318
578
Pons
ky 2
00113
9
No.
of p
atie
nts
608,
of
who
m n
o pr
evio
us h
isto
ry
of B
C 5
29, h
isto
ry o
f BC
79
NM
P22
Labo
rato
ry a
naly
sis
> 10
U/m
lPa
tient
608
4689
646
788
84
Cyt
olog
y (V
U)
Patie
nt60
832
8520
471
6285
Pott
er 1
99917
2
No.
of p
atie
nts
336,
of
who
m n
o pr
evio
us h
isto
ry
of B
C 3
36, h
isto
ry o
f BC
0
Cyt
olog
y (V
U)
Patie
nt33
62
30
331
100
99
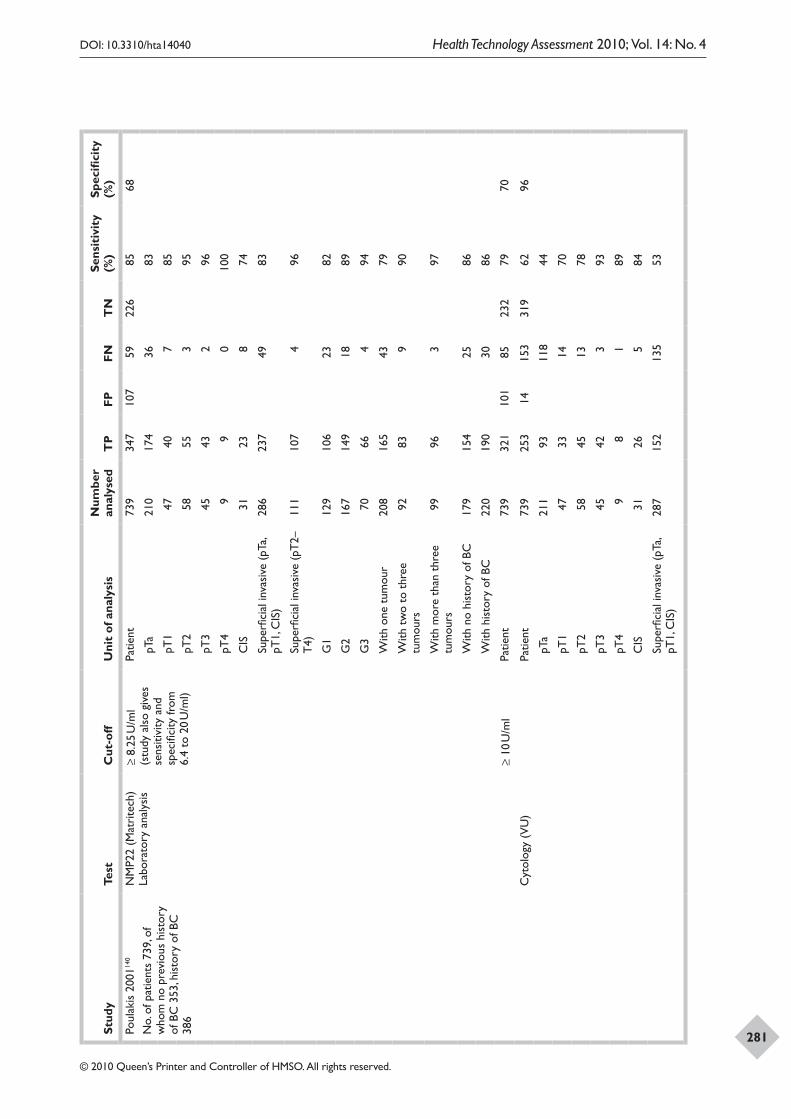
Appendix 15
280
DOI: 10.3310/hta14040 Health Technology Assessment 2010; Vol. 14: No. 4
© 2010 Queen’s Printer and Controller of HMSO. All rights reserved.
281Stud
yTe
stC
ut-o
ffU
nit
of a
naly
sis
Num
ber
anal
ysed
TP
FPFN
TN
Sens
itiv
ity
(%)
Spec
ifici
ty
(%)
Poul
akis
200
1140
No.
of p
atie
nts
739,
of
who
m n
o pr
evio
us h
isto
ry
of B
C 3
53, h
isto
ry o
f BC
38
6
NM
P22
(Mat
rite
ch)
Labo
rato
ry a
naly
sis
≥ 8.
25 U
/ml
(stu
dy a
lso
give
s se
nsiti
vity
and
sp
ecifi
city
from
6.
4 to
20
U/m
l)
Patie
nt73
934
710
759
226
8568
pT
a21
017
436
83
pT
147
407
85
pT
258
553
95
pT
345
432
96
pT
49
90
100
C
IS31
238
74
Su
perfi
cial
inva
sive
(pT
a, pT
1, C
IS)
286
237
4983
Su
perfi
cial
inva
sive
(pT
2–T
4)11
110
74
96
G
112
910
623
82
G
216
714
918
89
G
370
664
94
W
ith o
ne t
umou
r20
816
543
79
W
ith t
wo
to t
hree
tu
mou
rs92
839
90
W
ith m
ore
than
thr
ee
tum
ours
9996
397
W
ith n
o hi
stor
y of
BC
179
154
2586
W
ith h
isto
ry o
f BC
220
190
3086
≥ 10
U/m
lPa
tient
739
321
101
8523
279
70
Cyt
olog
y (V
U)
Patie
nt73
925
314
153
319
6296
pT
a21
193
118
44
pT
147
3314
70
pT
258
4513
78
pT
345
423
93
pT
49
81
89
C
IS31
265
84
Su
perfi
cial
inva
sive
(pT
a, pT
1, C
IS)
287
152
135
53
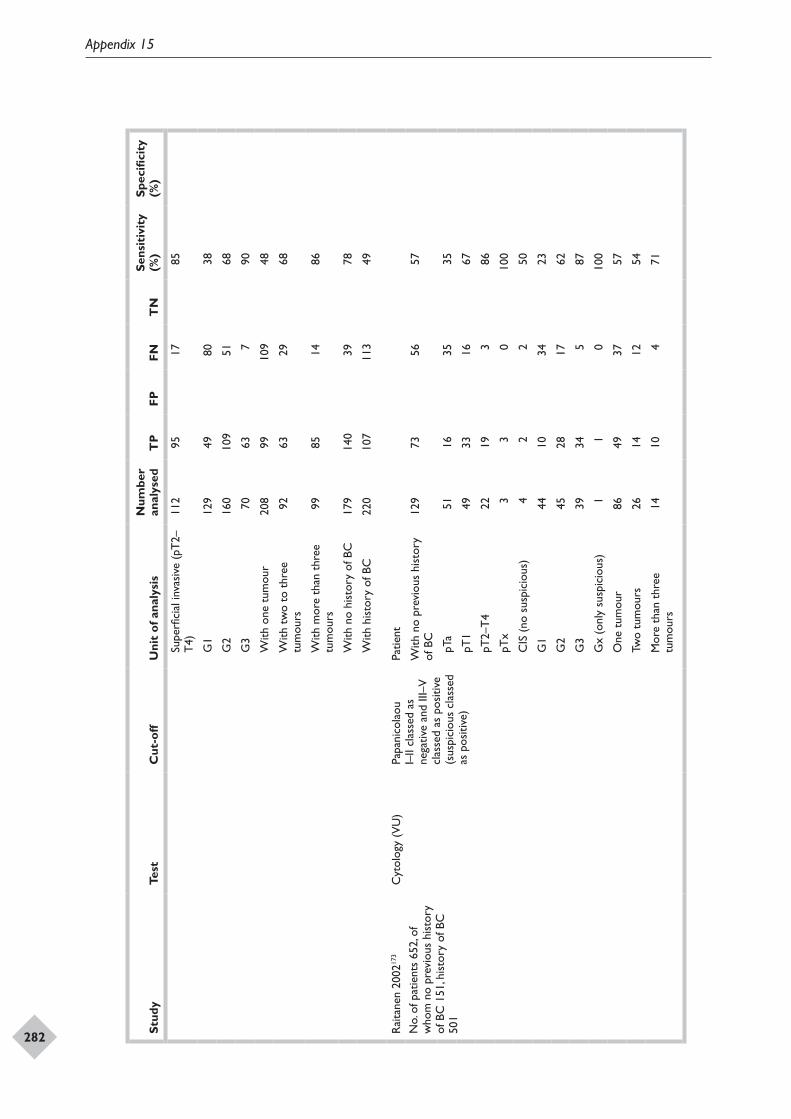
Appendix 15
282
DOI: 10.3310/hta14040 Health Technology Assessment 2010; Vol. 14: No. 4
© 2010 Queen’s Printer and Controller of HMSO. All rights reserved.
283Stud
yTe
stC
ut-o
ffU
nit
of a
naly
sis
Num
ber
anal
ysed
TP
FPFN
TN
Sens
itiv
ity
(%)
Spec
ifici
ty
(%)
Su
perfi
cial
inva
sive
(pT
2–T
4)11
295
1785
G
112
949
8038
G
216
010
951
68
G
370
637
90
W
ith o
ne t
umou
r20
899
109
48
W
ith t
wo
to t
hree
tu
mou
rs92
6329
68
W
ith m
ore
than
thr
ee
tum
ours
9985
1486
W
ith n
o hi
stor
y of
BC
179
140
3978
W
ith h
isto
ry o
f BC
220
107
113
49
Rai
tane
n 20
0217
3
No.
of p
atie
nts
652,
of
who
m n
o pr
evio
us h
isto
ry
of B
C 1
51, h
isto
ry o
f BC
50
1
Cyt
olog
y (V
U)
Papa
nico
laou
I–
II cl
asse
d as
ne
gativ
e an
d III
–V
clas
sed
as p
ositi
ve
(sus
pici
ous
clas
sed
as p
ositi
ve)
Patie
nt
With
no
prev
ious
his
tory
of
BC
129
7356
57
pT
a51
1635
35
pT
149
3316
67
pT
2–T
422
193
86
pT
x3
30
100
C
IS (
no s
uspi
ciou
s)4
22
50
G
144
1034
23
G
245
2817
62
G
339
345
87
G
x (o
nly
susp
icio
us)
11
010
0
O
ne t
umou
r86
4937
57
Tw
o tu
mou
rs26
1412
54
M
ore
than
thr
ee
tum
ours
1410
471
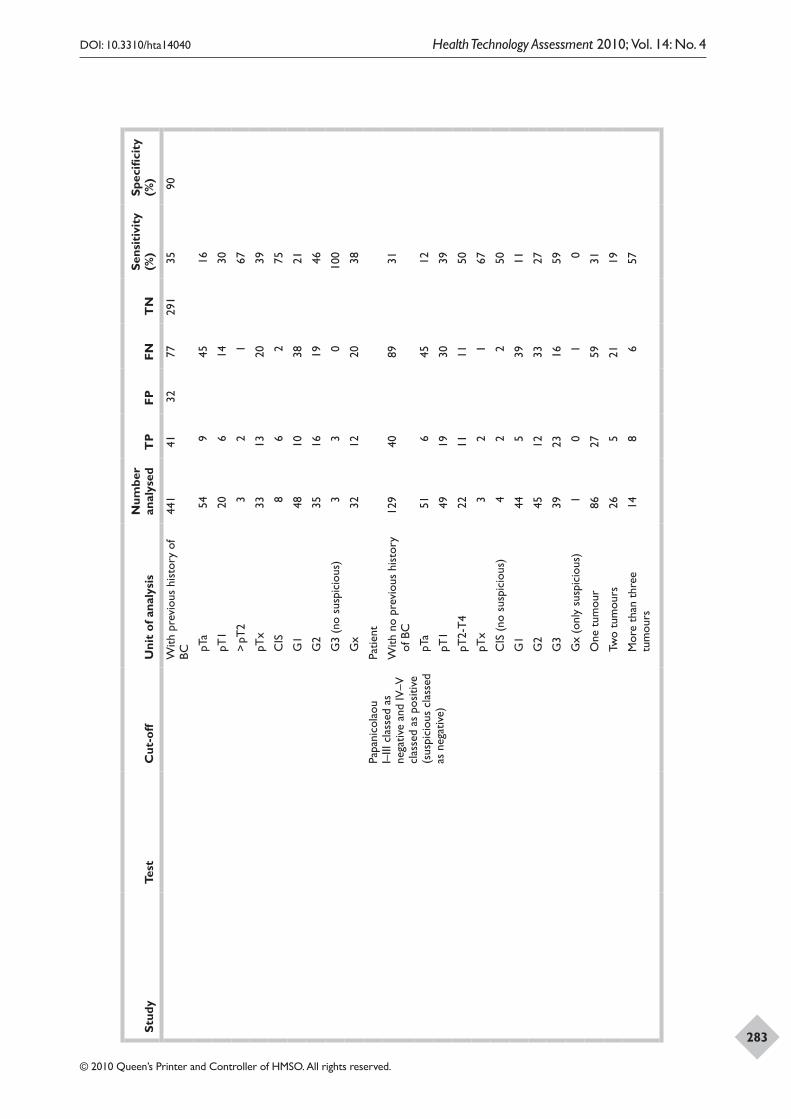
Appendix 15
282
DOI: 10.3310/hta14040 Health Technology Assessment 2010; Vol. 14: No. 4
© 2010 Queen’s Printer and Controller of HMSO. All rights reserved.
283
Stud
yTe
stC
ut-o
ffU
nit
of a
naly
sis
Num
ber
anal
ysed
TP
FPFN
TN
Sens
itiv
ity
(%)
Spec
ifici
ty
(%)
With
pre
viou
s hi
stor
y of
BC
441
4132
7729
135
90
pT
a54
945
16
pT
120
614
30
>
pT2
32
167
pT
x33
1320
39
C
IS8
62
75
G
148
1038
21
G
235
1619
46
G
3 (n
o su
spic
ious
)3
30
100
G
x32
1220
38
Papa
nico
laou
I–
III c
lass
ed a
s ne
gativ
e an
d IV
–V
clas
sed
as p
ositi
ve
(sus
pici
ous
clas
sed
as n
egat
ive)
Patie
nt
With
no
prev
ious
his
tory
of
BC
129
4089
31
pT
a51
645
12
pT
149
1930
39
pT
2-T
422
1111
50
pT
x3
21
67
C
IS (
no s
uspi
ciou
s)4
22
50
G
144
539
11
G
245
1233
27
G
339
2316
59
G
x (o
nly
susp
icio
us)
10
10
O
ne t
umou
r86
2759
31
Tw
o tu
mou
rs26
521
19
M
ore
than
thr
ee
tum
ours
148
657
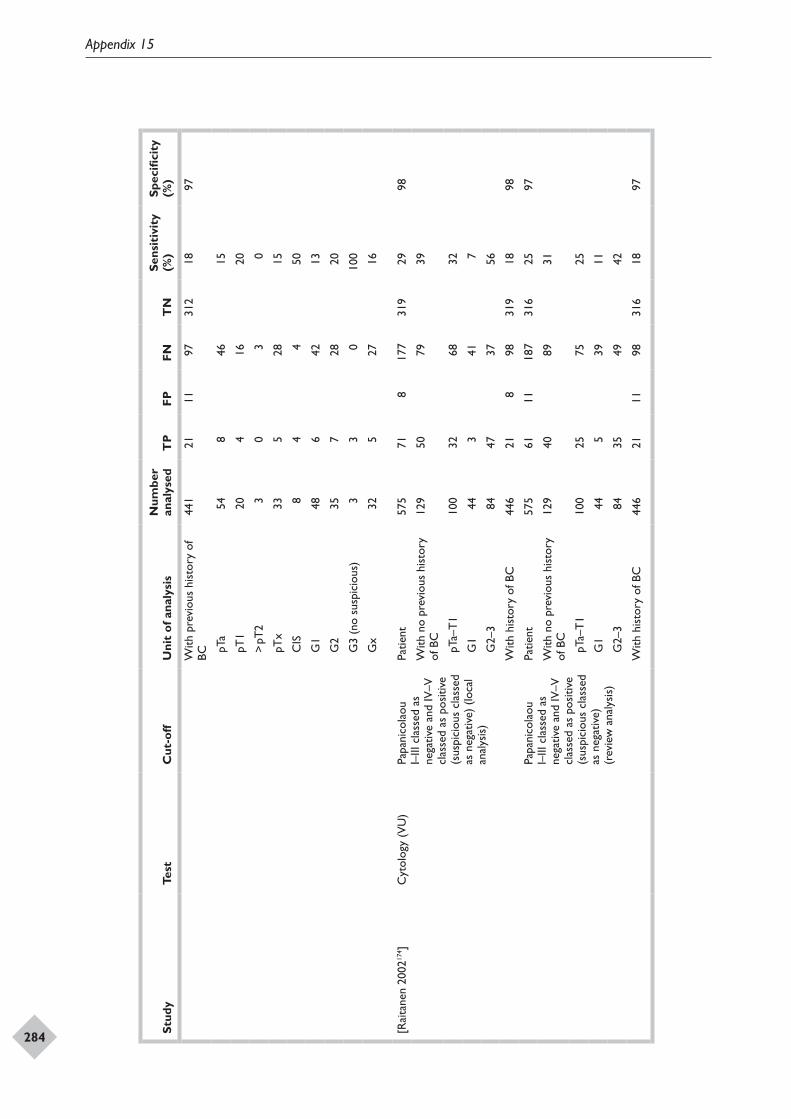
Appendix 15
284
DOI: 10.3310/hta14040 Health Technology Assessment 2010; Vol. 14: No. 4
© 2010 Queen’s Printer and Controller of HMSO. All rights reserved.
285Stud
yTe
stC
ut-o
ffU
nit
of a
naly
sis
Num
ber
anal
ysed
TP
FPFN
TN
Sens
itiv
ity
(%)
Spec
ifici
ty
(%)
With
pre
viou
s hi
stor
y of
BC
441
2111
9731
218
97
pT
a54
846
15
pT
120
416
20
>
pT2
30
30
pT
x33
528
15
C
IS8
44
50
G
148
642
13
G
235
728
20
G
3 (n
o su
spic
ious
)3
30
100
G
x32
527
16
[Rai
tane
n 20
0217
4 ]C
ytol
ogy
(VU
)Pa
pani
cola
ou
I–III
cla
ssed
as
nega
tive
and
IV–V
cl
asse
d as
pos
itive
(s
uspi
ciou
s cl
asse
d as
neg
ativ
e) (
loca
l an
alys
is)
Patie
nt57
571
817
731
929
98
With
no
prev
ious
his
tory
of
BC
129
5079
39
pT
a–T
110
032
6832
G
144
341
7
G
2–3
8447
3756
With
his
tory
of B
C44
621
898
319
1898
Papa
nico
laou
I–
III c
lass
ed a
s ne
gativ
e an
d IV
–V
clas
sed
as p
ositi
ve
(sus
pici
ous
clas
sed
as n
egat
ive)
(r
evie
w a
naly
sis)
Patie
nt57
561
1118
731
625
97
With
no
prev
ious
his
tory
of
BC
129
4089
31
pT
a–T
110
025
7525
G
144
539
11
G
2–3
8435
4942
With
his
tory
of B
C44
621
1198
316
1897
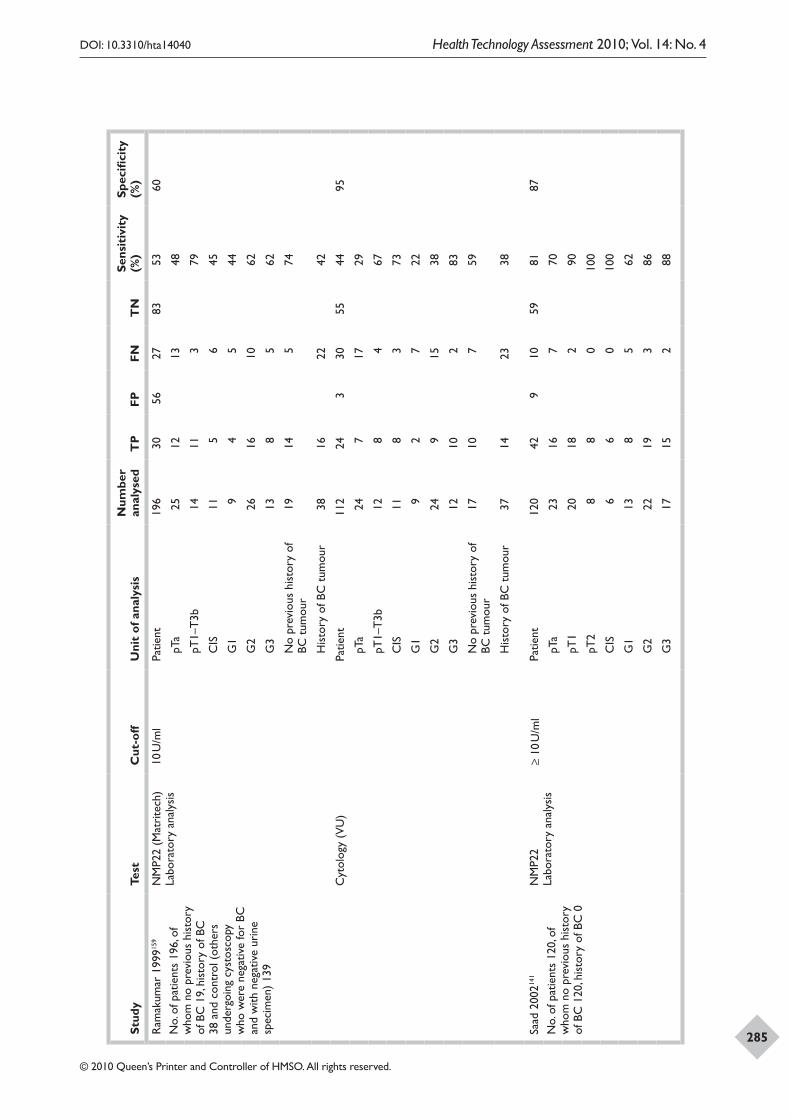
Appendix 15
284
DOI: 10.3310/hta14040 Health Technology Assessment 2010; Vol. 14: No. 4
© 2010 Queen’s Printer and Controller of HMSO. All rights reserved.
285Stud
yTe
stC
ut-o
ffU
nit
of a
naly
sis
Num
ber
anal
ysed
TP
FPFN
TN
Sens
itiv
ity
(%)
Spec
ifici
ty
(%)
Ram
akum
ar 1
99915
9
No.
of p
atie
nts
196,
of
who
m n
o pr
evio
us h
isto
ry
of B
C 1
9, h
isto
ry o
f BC
38
and
con
trol
(ot
hers
un
derg
oing
cys
tosc
opy
who
wer
e ne
gativ
e fo
r BC
an
d w
ith n
egat
ive
urin
e sp
ecim
en)
139
NM
P22
(Mat
rite
ch)
Labo
rato
ry a
naly
sis
10 U
/ml
Patie
nt19
630
5627
8353
60
pT
a25
1213
48
pT
1–T
3b14
113
79
C
IS11
56
45
G
19
45
44
G
226
1610
62
G
313
85
62
N
o pr
evio
us h
isto
ry o
f BC
tum
our
1914
574
H
isto
ry o
f BC
tum
our
3816
2242
Cyt
olog
y (V
U)
Patie
nt11
224
330
5544
95
pT
a24
717
29
pT
1–T
3b12
84
67
C
IS11
83
73
G
19
27
22
G
224
915
38
G
312
102
83
N
o pr
evio
us h
isto
ry o
f BC
tum
our
1710
759
H
isto
ry o
f BC
tum
our
3714
2338
Saad
200
2141
No.
of p
atie
nts
120,
of
who
m n
o pr
evio
us h
isto
ry
of B
C 1
20, h
isto
ry o
f BC
0
NM
P22
Labo
rato
ry a
naly
sis
≥ 10
U/m
lPa
tient
120
429
1059
8187
pT
a23
167
70
pT
120
182
90
pT
28
80
100
C
IS6
60
100
G
113
85
62
G
222
193
86
G
317
152
88
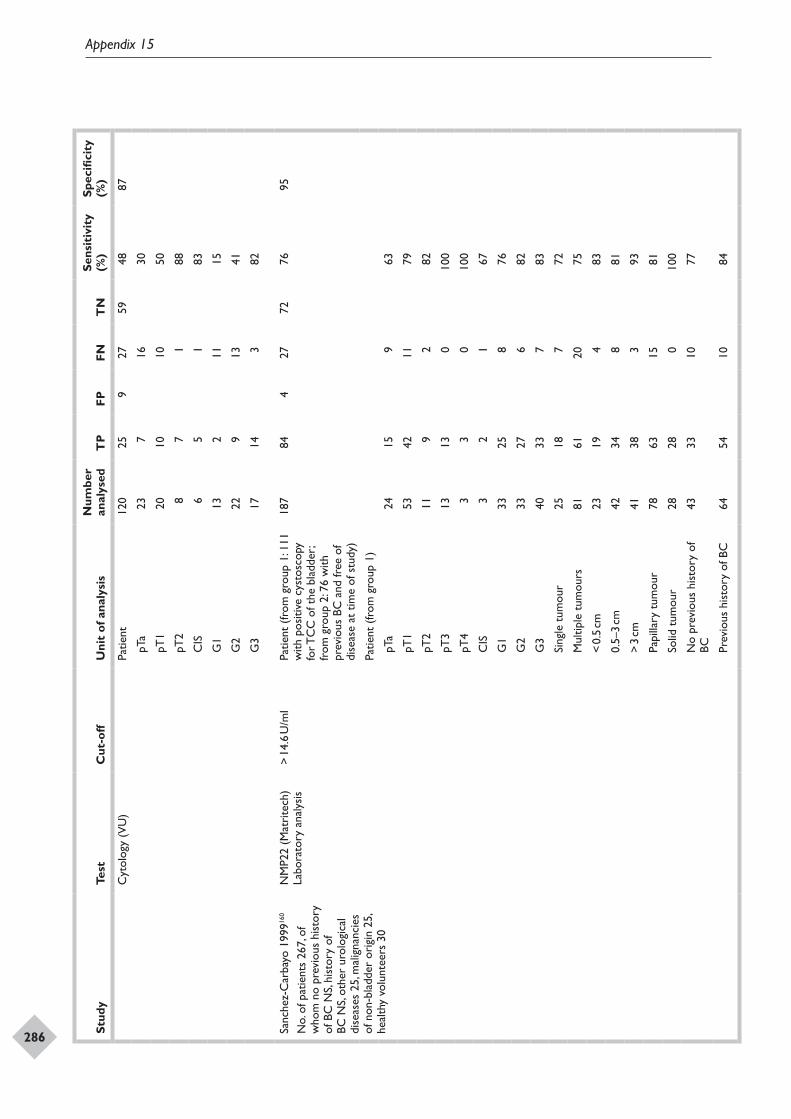
Appendix 15
286
DOI: 10.3310/hta14040 Health Technology Assessment 2010; Vol. 14: No. 4
© 2010 Queen’s Printer and Controller of HMSO. All rights reserved.
287Stud
yTe
stC
ut-o
ffU
nit
of a
naly
sis
Num
ber
anal
ysed
TP
FPFN
TN
Sens
itiv
ity
(%)
Spec
ifici
ty
(%)
Cyt
olog
y (V
U)
Patie
nt12
025
927
5948
87
pT
a23
716
30
pT
120
1010
50
pT
28
71
88
C
IS6
51
83
G
113
211
15
G
222
913
41
G
317
143
82
Sanc
hez-
Car
bayo
199
9160
No.
of p
atie
nts
267,
of
who
m n
o pr
evio
us h
isto
ry
of B
C N
S, hi
stor
y of
BC
NS,
othe
r ur
olog
ical
di
seas
es 2
5, m
alig
nanc
ies
of n
on-b
ladd
er o
rigi
n 25
, he
alth
y vo
lunt
eers
30
NM
P22
(Mat
rite
ch)
Labo
rato
ry a
naly
sis
> 14
.6 U
/ml
Patie
nt (
from
gro
up 1
: 111
w
ith p
ositi
ve c
ysto
scop
y fo
r TC
C o
f the
bla
dder
; fr
om g
roup
2: 7
6 w
ith
prev
ious
BC
and
free
of
dise
ase
at t
ime
of s
tudy
)
187
844
2772
7695
Patie
nt (
from
gro
up 1
)
pT
a24
159
63
pT
153
4211
79
pT
211
92
82
pT
313
130
100
pT
43
30
100
C
IS3
21
67
G
133
258
76
G
233
276
82
G
340
337
83
Si
ngle
tum
our
2518
772
M
ultip
le t
umou
rs81
6120
75
<
0.5
cm23
194
83
0.
5–3
cm42
348
81
>
3 cm
4138
393
Pa
pilla
ry t
umou
r78
6315
81
So
lid t
umou
r28
280
100
N
o pr
evio
us h
isto
ry o
f BC
4333
1077
Pr
evio
us h
isto
ry o
f BC
6454
1084
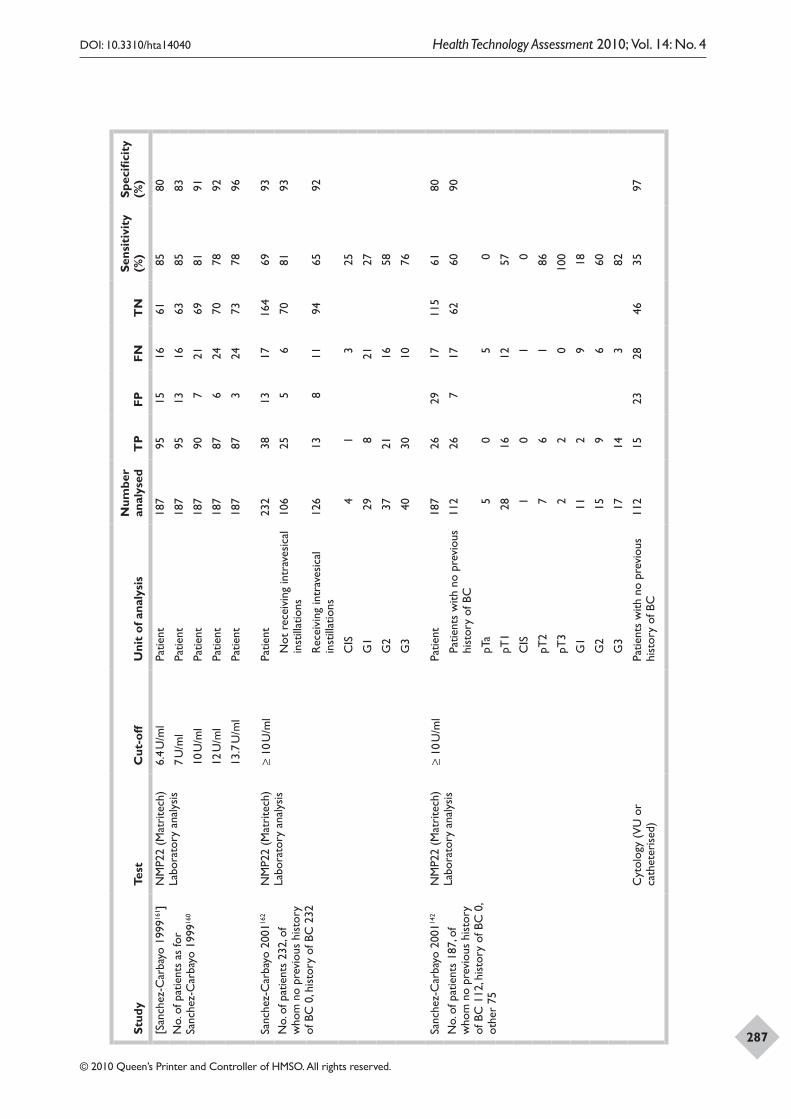
Appendix 15
286
DOI: 10.3310/hta14040 Health Technology Assessment 2010; Vol. 14: No. 4
© 2010 Queen’s Printer and Controller of HMSO. All rights reserved.
287Stud
yTe
stC
ut-o
ffU
nit
of a
naly
sis
Num
ber
anal
ysed
TP
FPFN
TN
Sens
itiv
ity
(%)
Spec
ifici
ty
(%)
[San
chez
-Car
bayo
199
9161 ]
No.
of p
atie
nts
as fo
r Sa
nche
z-C
arba
yo 1
99916
0
NM
P22
(Mat
rite
ch)
Labo
rato
ry a
naly
sis
6.4
U/m
lPa
tient
187
9515
1661
8580
7 U
/ml
Patie
nt18
795
1316
6385
83
10 U
/ml
Patie
nt18
790
721
6981
91
12 U
/ml
Patie
nt18
787
624
7078
92
13.7
U/m
lPa
tient
187
873
2473
7896
Sanc
hez-
Car
bayo
200
1162
No.
of p
atie
nts
232,
of
who
m n
o pr
evio
us h
isto
ry
of B
C 0
, his
tory
of B
C 2
32
NM
P22
(Mat
rite
ch)
Labo
rato
ry a
naly
sis
≥ 10
U/m
lPa
tient
232
3813
1716
469
93
N
ot r
ecei
ving
intr
aves
ical
in
still
atio
ns10
625
56
7081
93
R
ecei
ving
intr
aves
ical
in
still
atio
ns12
613
811
9465
92
C
IS4
13
25
G
129
821
27
G
237
2116
58
G
340
3010
76
Sanc
hez-
Car
bayo
200
1142
No.
of p
atie
nts
187,
of
who
m n
o pr
evio
us h
isto
ry
of B
C 1
12, h
isto
ry o
f BC
0,
othe
r 75
NM
P22
(Mat
rite
ch)
Labo
rato
ry a
naly
sis
≥ 10
U/m
lPa
tient
187
2629
1711
561
80
Pa
tient
s w
ith n
o pr
evio
us
hist
ory
of B
C11
226
717
6260
90
pT
a5
05
0
pT
128
1612
57
C
IS1
01
0
pT
27
61
86
pT
32
20
100
G
111
29
18
G
215
96
60
G
317
143
82
Cyt
olog
y (V
U o
r ca
thet
eris
ed)
Patie
nts
with
no
prev
ious
hi
stor
y of
BC
112
1523
2846
3597
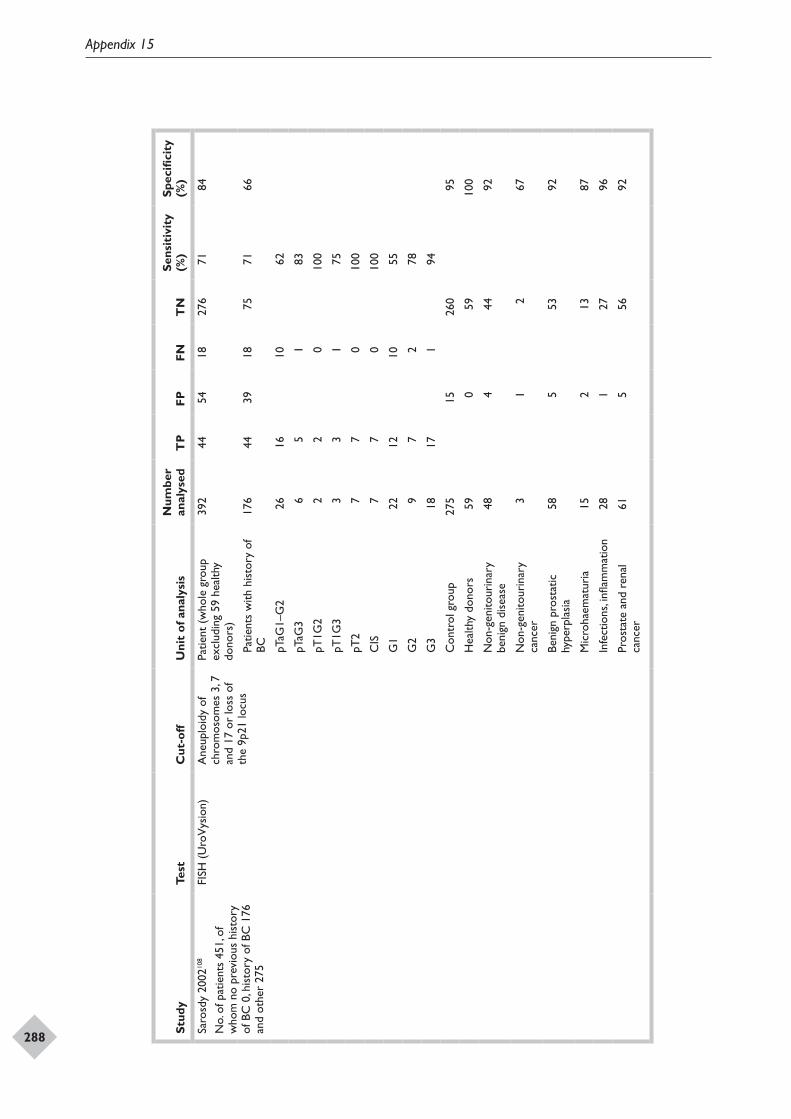
Appendix 15
288
DOI: 10.3310/hta14040 Health Technology Assessment 2010; Vol. 14: No. 4
© 2010 Queen’s Printer and Controller of HMSO. All rights reserved.
289Stud
yTe
stC
ut-o
ffU
nit
of a
naly
sis
Num
ber
anal
ysed
TP
FPFN
TN
Sens
itiv
ity
(%)
Spec
ifici
ty
(%)
Saro
sdy
2002
108
No.
of p
atie
nts
451,
of
who
m n
o pr
evio
us h
isto
ry
of B
C 0
, his
tory
of B
C 1
76
and
othe
r 27
5
FISH
(U
roV
ysio
n)A
neup
loid
y of
ch
rom
osom
es 3
, 7
and
17 o
r lo
ss o
f th
e 9p
21 lo
cus
Patie
nt (
who
le g
roup
ex
clud
ing
59 h
ealth
y do
nors
)
392
4454
1827
671
84
Pa
tient
s w
ith h
isto
ry o
f BC
176
4439
1875
7166
pT
aG1–
G2
2616
1062
pT
aG3
65
183
pT
1G2
22
010
0
pT
1G3
33
175
pT
27
70
100
C
IS7
70
100
G
122
1210
55
G
29
72
78
G
318
171
94
C
ontr
ol g
roup
275
1526
095
H
ealth
y do
nors
590
5910
0
N
on-g
enito
urin
ary
beni
gn d
isea
se48
444
92
N
on-g
enito
urin
ary
canc
er3
12
67
Be
nign
pro
stat
ic
hype
rpla
sia
585
5392
M
icro
haem
atur
ia15
213
87
In
fect
ions
, infl
amm
atio
n28
127
96
Pr
osta
te a
nd r
enal
ca
ncer
615
5692
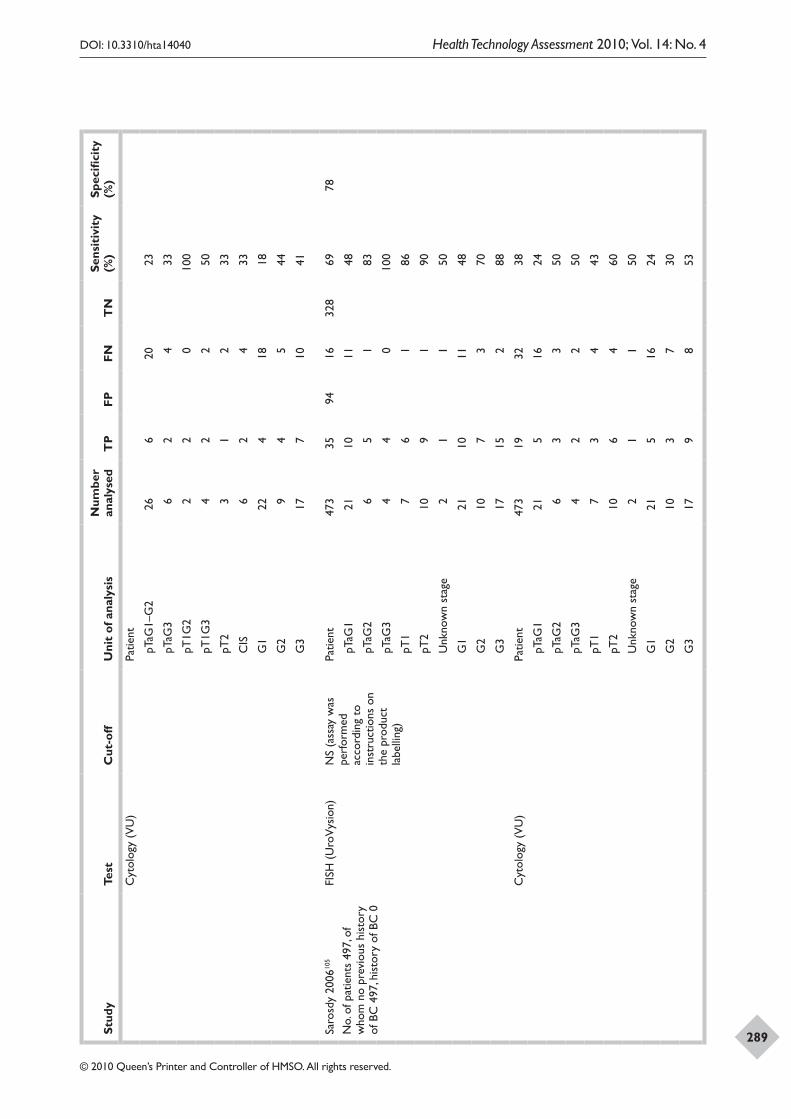
Appendix 15
288
DOI: 10.3310/hta14040 Health Technology Assessment 2010; Vol. 14: No. 4
© 2010 Queen’s Printer and Controller of HMSO. All rights reserved.
289Stud
yTe
stC
ut-o
ffU
nit
of a
naly
sis
Num
ber
anal
ysed
TP
FPFN
TN
Sens
itiv
ity
(%)
Spec
ifici
ty
(%)
Cyt
olog
y (V
U)
Patie
nt
pT
aG1–
G2
266
2023
pT
aG3
62
433
pT
1G2
22
010
0
pT
1G3
42
250
pT
23
12
33
C
IS6
24
33
G
122
418
18
G
29
45
44
G
317
710
41
Saro
sdy
2006
105
No.
of p
atie
nts
497,
of
who
m n
o pr
evio
us h
isto
ry
of B
C 4
97, h
isto
ry o
f BC
0
FISH
(U
roV
ysio
n)N
S (a
ssay
was
pe
rfor
med
ac
cord
ing
to
inst
ruct
ions
on
the
prod
uct
labe
lling
)
Patie
nt47
335
9416
328
6978
pT
aG1
2110
1148
pT
aG2
65
183
pT
aG3
44
010
0
pT
17
61
86
pT
210
91
90
U
nkno
wn
stag
e2
11
50
G
121
1011
48
G
210
73
70
G
317
152
88
Cyt
olog
y (V
U)
Patie
nt47
319
3238
pT
aG1
215
1624
pT
aG2
63
350
pT
aG3
42
250
pT
17
34
43
pT
210
64
60
U
nkno
wn
stag
e2
11
50
G
121
516
24
G
210
37
30
G
317
98
53
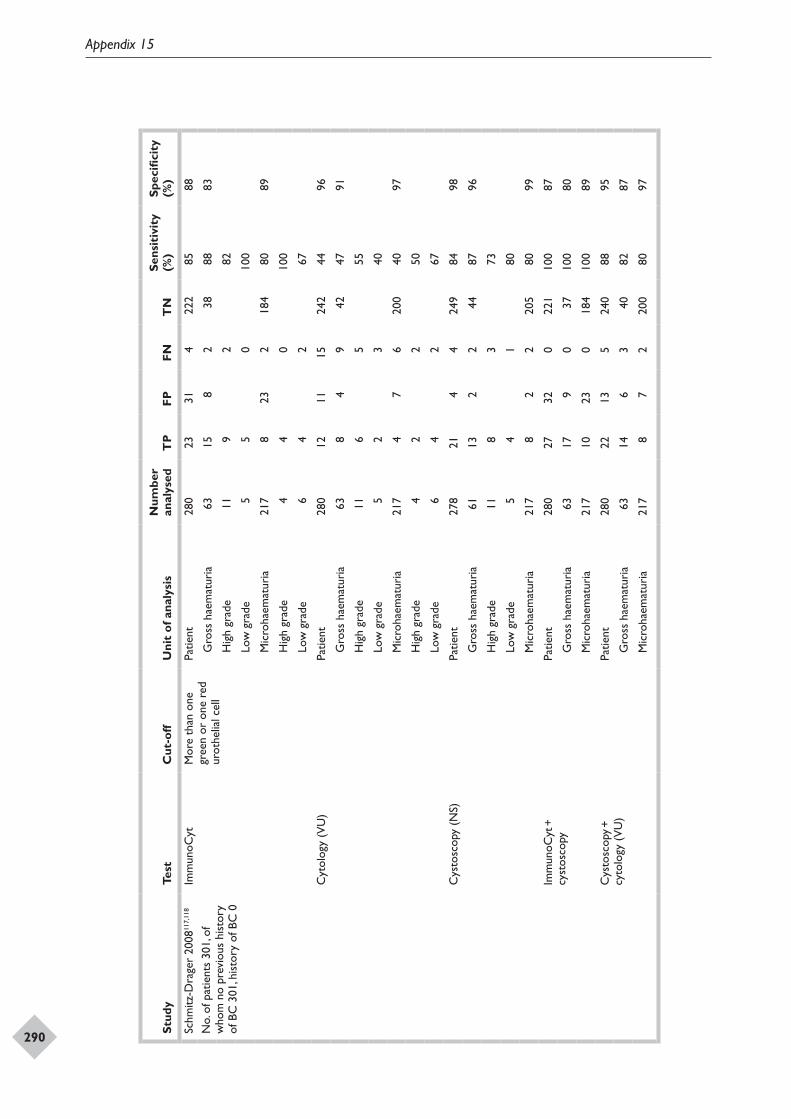
Appendix 15
290
DOI: 10.3310/hta14040 Health Technology Assessment 2010; Vol. 14: No. 4
© 2010 Queen’s Printer and Controller of HMSO. All rights reserved.
291Stud
yTe
stC
ut-o
ffU
nit
of a
naly
sis
Num
ber
anal
ysed
TP
FPFN
TN
Sens
itiv
ity
(%)
Spec
ifici
ty
(%)
Schm
itz-D
rage
r 20
0811
7,11
8
No.
of p
atie
nts
301,
of
who
m n
o pr
evio
us h
isto
ry
of B
C 3
01, h
isto
ry o
f BC
0
Imm
unoC
ytM
ore
than
one
gr
een
or o
ne r
ed
urot
helia
l cel
l
Patie
nt28
023
314
222
8588
G
ross
hae
mat
uria
6315
82
3888
83
H
igh
grad
e11
92
82
Lo
w g
rade
55
010
0
M
icro
haem
atur
ia21
78
232
184
8089
H
igh
grad
e4
40
100
Lo
w g
rade
64
267
Cyt
olog
y (V
U)
Patie
nt28
012
1115
242
4496
G
ross
hae
mat
uria
638
49
4247
91
H
igh
grad
e11
65
55
Lo
w g
rade
52
340
M
icro
haem
atur
ia21
74
76
200
4097
H
igh
grad
e4
22
50
Lo
w g
rade
64
267
Cys
tosc
opy
(NS)
Patie
nt27
821
44
249
8498
G
ross
hae
mat
uria
6113
22
4487
96
H
igh
grad
e11
83
73
Lo
w g
rade
54
180
M
icro
haem
atur
ia21
78
22
205
8099
Imm
unoC
yt +
cy
stos
copy
Patie
nt28
027
320
221
100
87
G
ross
hae
mat
uria
6317
90
3710
080
M
icro
haem
atur
ia21
710
230
184
100
89
Cys
tosc
opy +
cy
tolo
gy (
VU
)Pa
tient
280
2213
524
088
95
G
ross
hae
mat
uria
6314
63
4082
87
M
icro
haem
atur
ia21
78
72
200
8097
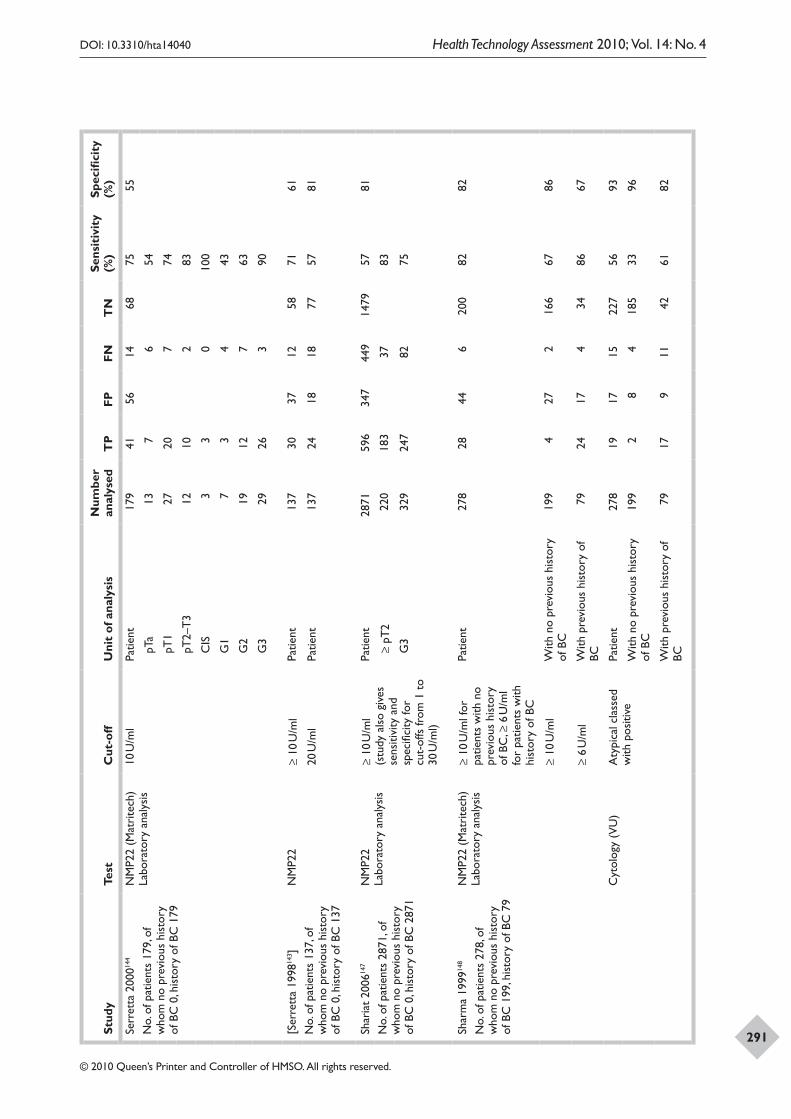
Appendix 15
290
DOI: 10.3310/hta14040 Health Technology Assessment 2010; Vol. 14: No. 4
© 2010 Queen’s Printer and Controller of HMSO. All rights reserved.
291Stud
yTe
stC
ut-o
ffU
nit
of a
naly
sis
Num
ber
anal
ysed
TP
FPFN
TN
Sens
itiv
ity
(%)
Spec
ifici
ty
(%)
Serr
etta
200
0144
No.
of p
atie
nts
179,
of
who
m n
o pr
evio
us h
isto
ry
of B
C 0
, his
tory
of B
C 1
79
NM
P22
(Mat
rite
ch)
Labo
rato
ry a
naly
sis
10 U
/ml
Patie
nt17
941
5614
6875
55
pT
a13
76
54
pT
127
207
74
pT
2–T
312
102
83
C
IS3
30
100
G
17
34
43
G
219
127
63
G
329
263
90
[Ser
rett
a 19
9814
3 ]N
o. o
f pat
ient
s 13
7, o
f w
hom
no
prev
ious
his
tory
of
BC
0, h
isto
ry o
f BC
137
NM
P22
≥ 10
U/m
lPa
tient
137
3037
1258
7161
20 U
/ml
Patie
nt13
724
1818
7757
81
Shar
iat
2006
147
No.
of p
atie
nts
2871
, of
who
m n
o pr
evio
us h
isto
ry
of B
C 0
, his
tory
of B
C 2
871
NM
P22
Labo
rato
ry a
naly
sis
≥ 10
U/m
l (s
tudy
als
o gi
ves
sens
itivi
ty a
nd
spec
ifici
ty fo
r cu
t-of
fs fr
om 1
to
30 U
/ml)
Patie
nt28
7159
634
744
914
7957
81
≥
pT2
220
183
3783
G
332
924
782
75
Shar
ma
1999
148
No.
of p
atie
nts
278,
of
who
m n
o pr
evio
us h
isto
ry
of B
C 1
99, h
isto
ry o
f BC
79
NM
P22
(Mat
rite
ch)
Labo
rato
ry a
naly
sis
≥ 10
U/m
l for
pa
tient
s w
ith n
o pr
evio
us h
isto
ry
of B
C, ≥
6 U
/ml
for
patie
nts
with
hi
stor
y of
BC
Patie
nt27
828
446
200
8282
≥ 10
U/m
l W
ith n
o pr
evio
us h
isto
ry
of B
C19
94
272
166
6786
≥ 6
U/m
lW
ith p
revi
ous
hist
ory
of
BC79
2417
434
8667
Cyt
olog
y (V
U)
Aty
pica
l cla
ssed
w
ith p
ositi
vePa
tient
278
1917
1522
756
93
With
no
prev
ious
his
tory
of
BC
199
28
418
533
96
With
pre
viou
s hi
stor
y of
BC
7917
911
4261
82
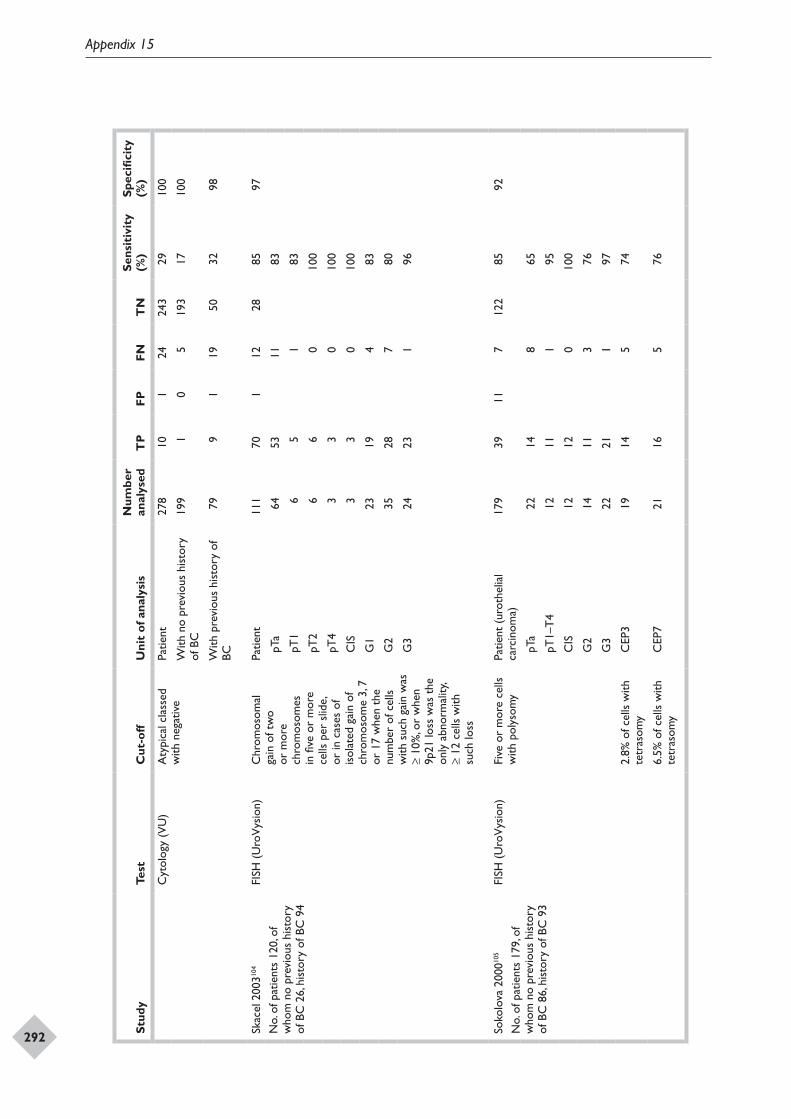
Appendix 15
292
DOI: 10.3310/hta14040 Health Technology Assessment 2010; Vol. 14: No. 4
© 2010 Queen’s Printer and Controller of HMSO. All rights reserved.
293Stud
yTe
stC
ut-o
ffU
nit
of a
naly
sis
Num
ber
anal
ysed
TP
FPFN
TN
Sens
itiv
ity
(%)
Spec
ifici
ty
(%)
Cyt
olog
y (V
U)
Aty
pica
l cla
ssed
w
ith n
egat
ive
Patie
nt27
810
124
243
2910
0
With
no
prev
ious
his
tory
of
BC
199
10
519
317
100
With
pre
viou
s hi
stor
y of
BC
799
119
5032
98
Skac
el 2
00310
4
No.
of p
atie
nts
120,
of
who
m n
o pr
evio
us h
isto
ry
of B
C 2
6, h
isto
ry o
f BC
94
FISH
(U
roV
ysio
n)C
hrom
osom
al
gain
of t
wo
or m
ore
chro
mos
omes
in
five
or
mor
e ce
lls p
er s
lide,
or
in c
ases
of
isol
ated
gai
n of
ch
rom
osom
e 3,
7
or 1
7 w
hen
the
num
ber
of c
ells
w
ith s
uch
gain
was
≥
10%
, or
whe
n 9p
21 lo
ss w
as t
he
only
abn
orm
ality
, ≥
12 c
ells
with
su
ch lo
ss
Patie
nt11
170
112
2885
97
pT
a64
5311
83
pT
16
51
83
pT
26
60
100
pT
43
30
100
C
IS3
30
100
G
123
194
83
G
235
287
80
G
324
231
96
Soko
lova
200
0105
No.
of p
atie
nts
179,
of
who
m n
o pr
evio
us h
isto
ry
of B
C 8
6, h
isto
ry o
f BC
93
FISH
(U
roV
ysio
n)Fi
ve o
r m
ore
cells
w
ith p
olys
omy
Patie
nt (
urot
helia
l ca
rcin
oma)
179
3911
712
285
92
pT
a22
148
65
pT
1–T
412
111
95
C
IS12
120
100
G
214
113
76
G
322
211
97
2.8%
of c
ells
with
te
tras
omy
C
EP3
1914
574
6.5%
of c
ells
with
te
tras
omy
C
EP7
2116
576
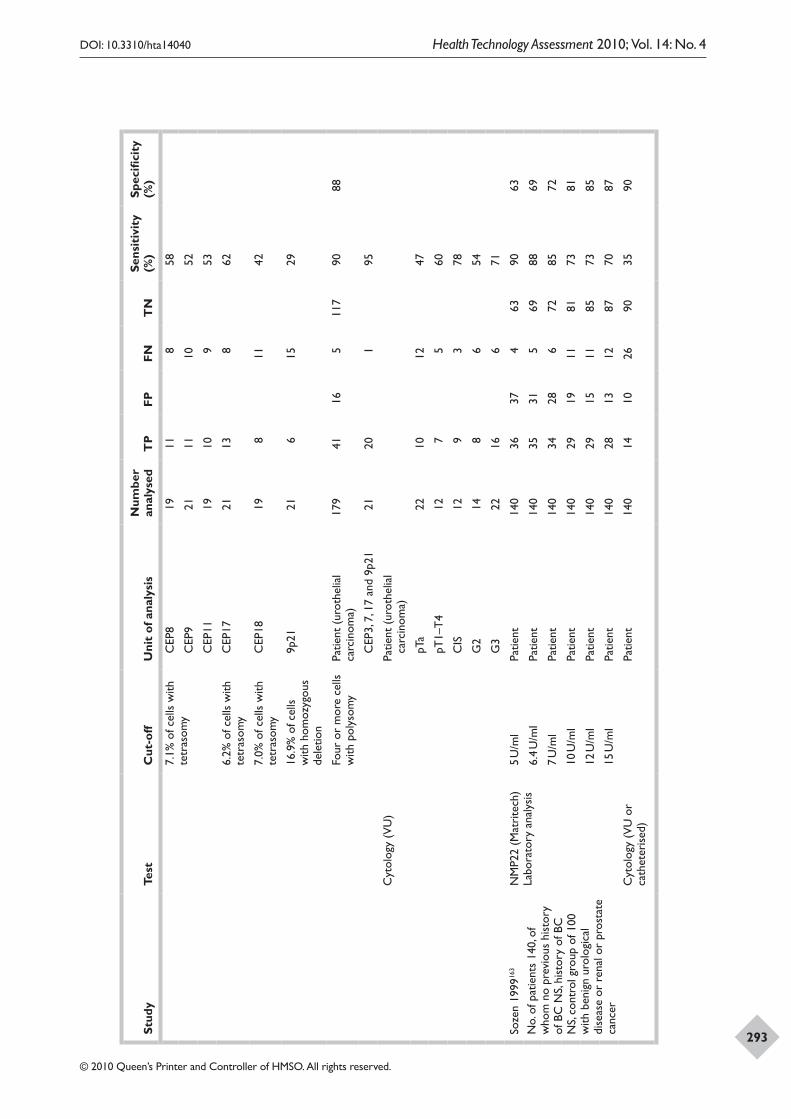
Appendix 15
292
DOI: 10.3310/hta14040 Health Technology Assessment 2010; Vol. 14: No. 4
© 2010 Queen’s Printer and Controller of HMSO. All rights reserved.
293Stud
yTe
stC
ut-o
ffU
nit
of a
naly
sis
Num
ber
anal
ysed
TP
FPFN
TN
Sens
itiv
ity
(%)
Spec
ifici
ty
(%)
7.1%
of c
ells
with
te
tras
omy
C
EP8
1911
858
C
EP9
2111
1052
C
EP11
1910
953
6.2%
of c
ells
with
te
tras
omy
C
EP17
2113
862
7.0%
of c
ells
with
te
tras
omy
C
EP18
198
1142
16.9
% o
f cel
ls
with
hom
ozyg
ous
dele
tion
9p
2121
615
29
Four
or
mor
e ce
lls
with
pol
ysom
yPa
tient
(ur
othe
lial
carc
inom
a)17
941
165
117
9088
C
EP3,
7, 1
7 an
d 9p
2121
201
95
Cyt
olog
y (V
U)
Patie
nt (
urot
helia
l ca
rcin
oma)
pT
a22
1012
47
pT
1–T
412
75
60
C
IS12
93
78
G
214
86
54
G
322
166
71
Soze
n 19
9916
3
No.
of p
atie
nts
140,
of
who
m n
o pr
evio
us h
isto
ry
of B
C N
S, hi
stor
y of
BC
N
S, co
ntro
l gro
up o
f 100
w
ith b
enig
n ur
olog
ical
di
seas
e or
ren
al o
r pr
osta
te
canc
er
NM
P22
(Mat
rite
ch)
Labo
rato
ry a
naly
sis
5 U
/ml
Patie
nt14
036
374
6390
63
6.4
U/m
lPa
tient
140
3531
569
8869
7 U
/ml
Patie
nt14
034
286
7285
72
10 U
/ml
Patie
nt14
029
1911
8173
81
12 U
/ml
Patie
nt14
029
1511
8573
85
15 U
/ml
Patie
nt14
028
1312
8770
87
Cyt
olog
y (V
U o
r ca
thet
eris
ed)
Patie
nt14
014
1026
9035
90
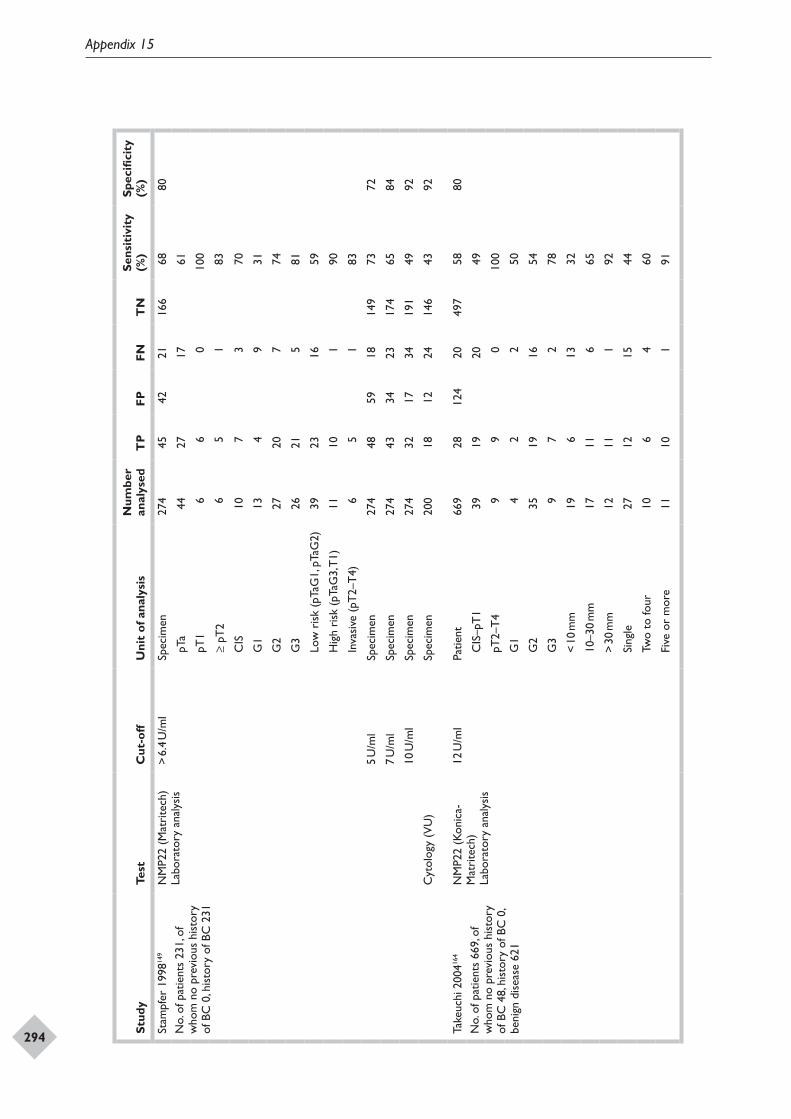
Appendix 15
294
DOI: 10.3310/hta14040 Health Technology Assessment 2010; Vol. 14: No. 4
© 2010 Queen’s Printer and Controller of HMSO. All rights reserved.
295Stud
yTe
stC
ut-o
ffU
nit
of a
naly
sis
Num
ber
anal
ysed
TP
FPFN
TN
Sens
itiv
ity
(%)
Spec
ifici
ty
(%)
Stam
pfer
199
8149
No.
of p
atie
nts
231,
of
who
m n
o pr
evio
us h
isto
ry
of B
C 0
, his
tory
of B
C 2
31
NM
P22
(Mat
rite
ch)
Labo
rato
ry a
naly
sis
> 6.
4 U
/ml
Spec
imen
274
4542
2116
668
80
pT
a44
2717
61
pT
16
60
100
≥
pT2
65
183
C
IS10
73
70
G
113
49
31
G
227
207
74
G
326
215
81
Lo
w r
isk
(pTa
G1,
pTa
G2)
3923
1659
H
igh
risk
(pT
aG3,
T1)
1110
190
In
vasi
ve (
pT2–
T4)
65
183
5 U
/ml
Spec
imen
274
4859
1814
973
72
7 U
/ml
Spec
imen
274
4334
2317
465
84
10 U
/ml
Spec
imen
274
3217
3419
149
92
Cyt
olog
y (V
U)
Spec
imen
200
1812
2414
643
92
Take
uchi
200
4164
No.
of p
atie
nts
669,
of
who
m n
o pr
evio
us h
isto
ry
of B
C 4
8, h
isto
ry o
f BC
0,
beni
gn d
isea
se 6
21
NM
P22
(Kon
ica-
Mat
rite
ch)
Labo
rato
ry a
naly
sis
12 U
/ml
Patie
nt66
928
124
2049
758
80
C
IS–p
T1
3919
2049
pT
2–T
49
90
100
G
14
22
50
G
235
1916
54
G
39
72
78
<
10 m
m19
613
32
10
–30
mm
1711
665
>
30 m
m12
111
92
Si
ngle
2712
1544
Tw
o to
four
106
460
Fi
ve o
r m
ore
1110
191
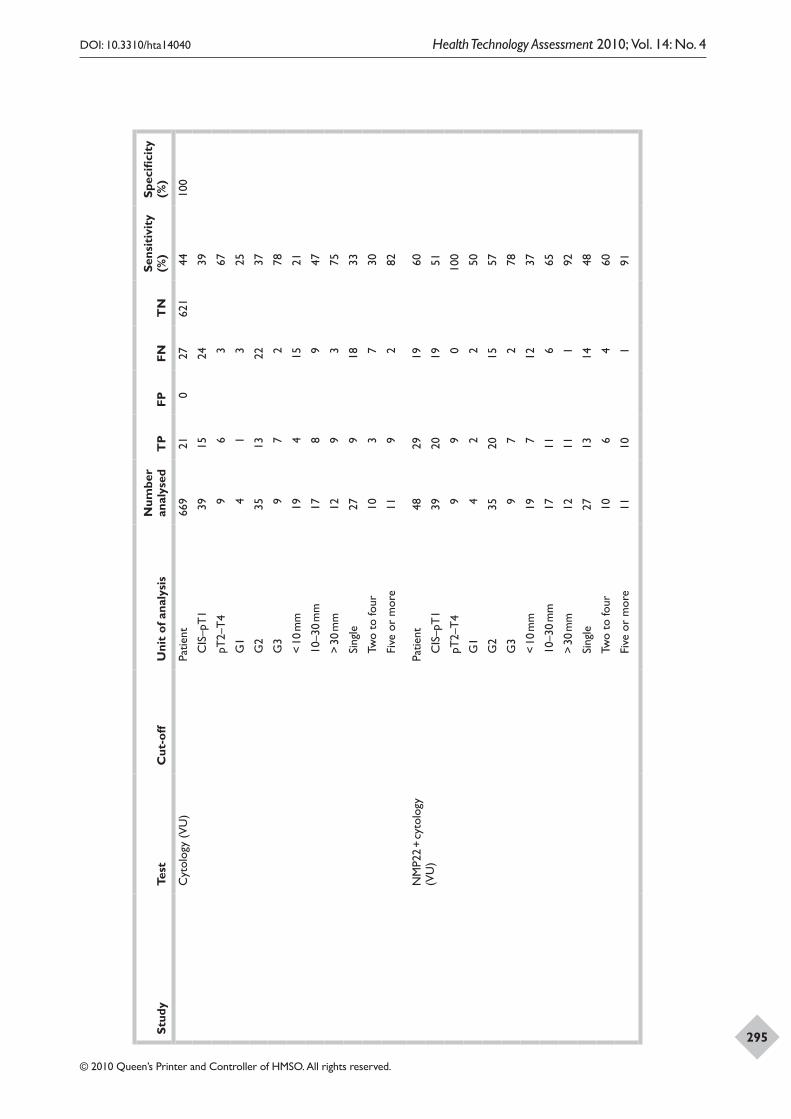
Appendix 15
294
DOI: 10.3310/hta14040 Health Technology Assessment 2010; Vol. 14: No. 4
© 2010 Queen’s Printer and Controller of HMSO. All rights reserved.
295Stud
yTe
stC
ut-o
ffU
nit
of a
naly
sis
Num
ber
anal
ysed
TP
FPFN
TN
Sens
itiv
ity
(%)
Spec
ifici
ty
(%)
Cyt
olog
y (V
U)
Patie
nt66
921
027
621
4410
0
C
IS–p
T1
3915
2439
pT
2–T
49
63
67
G
14
13
25
G
235
1322
37
G
39
72
78
<
10 m
m19
415
21
10
–30
mm
178
947
>
30 m
m12
93
75
Si
ngle
279
1833
Tw
o to
four
103
730
Fi
ve o
r m
ore
119
282
NM
P22
+ cy
tolo
gy
(VU
)Pa
tient
4829
1960
C
IS–p
T1
3920
1951
pT
2–T
49
90
100
G
14
22
50
G
235
2015
57
G
39
72
78
<
10 m
m19
712
37
10
–30
mm
1711
665
>
30 m
m12
111
92
Si
ngle
2713
1448
Tw
o to
four
106
460
Fi
ve o
r m
ore
1110
191
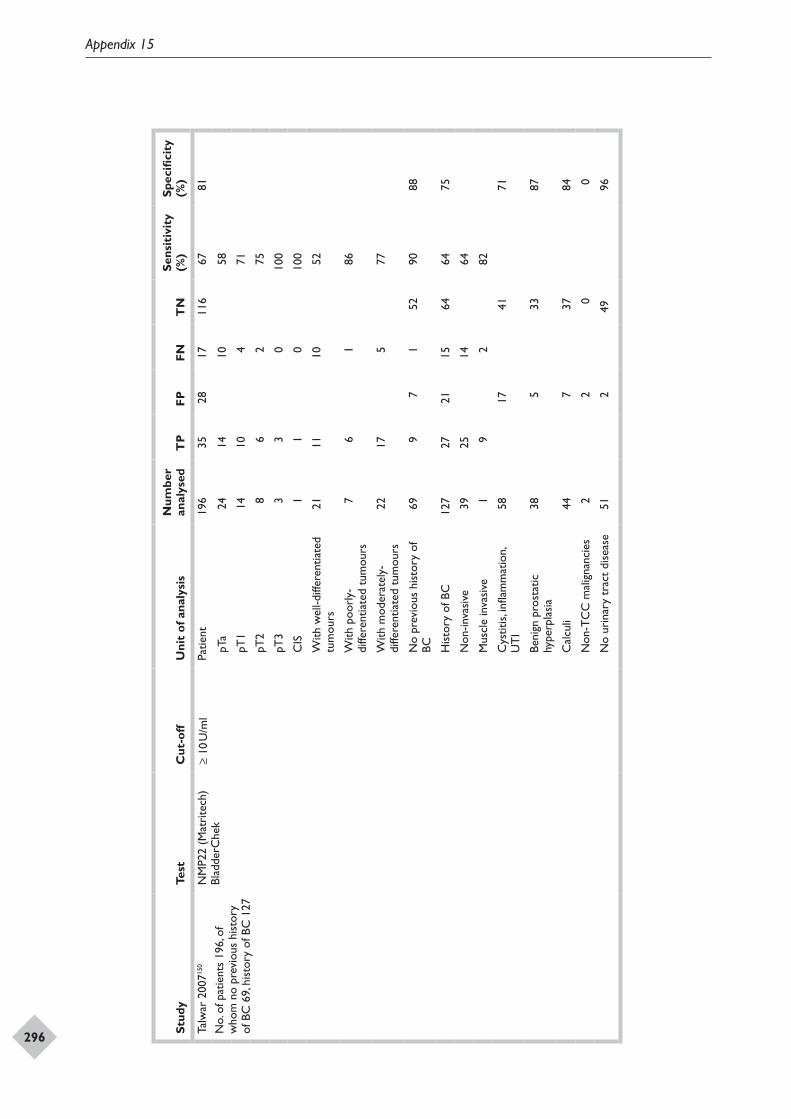
Appendix 15
296
DOI: 10.3310/hta14040 Health Technology Assessment 2010; Vol. 14: No. 4
© 2010 Queen’s Printer and Controller of HMSO. All rights reserved.
297Stud
yTe
stC
ut-o
ffU
nit
of a
naly
sis
Num
ber
anal
ysed
TP
FPFN
TN
Sens
itiv
ity
(%)
Spec
ifici
ty
(%)
Talw
ar 2
00715
0
No.
of p
atie
nts
196,
of
who
m n
o pr
evio
us h
isto
ry
of B
C 6
9, h
isto
ry o
f BC
127
NM
P22
(Mat
rite
ch)
Blad
derC
hek
≥ 10
U/m
lPa
tient
196
3528
1711
667
81
pT
a24
1410
58
pT
114
104
71
pT
28
62
75
pT
33
30
100
C
IS1
10
100
W
ith w
ell-d
iffer
entia
ted
tum
ours
2111
1052
W
ith p
oorl
y-di
ffere
ntia
ted
tum
ours
76
186
W
ith m
oder
atel
y-di
ffere
ntia
ted
tum
ours
2217
577
N
o pr
evio
us h
isto
ry o
f BC
699
71
5290
88
H
isto
ry o
f BC
127
2721
1564
6475
N
on-in
vasi
ve39
2514
64
M
uscl
e in
vasi
ve1
92
82
C
ystit
is, i
nflam
mat
ion,
U
TI
5817
4171
Be
nign
pro
stat
ic
hype
rpla
sia
385
3387
C
alcu
li44
737
84
N
on-T
CC
mal
igna
ncie
s2
20
0
N
o ur
inar
y tr
act
dise
ase
512
4996
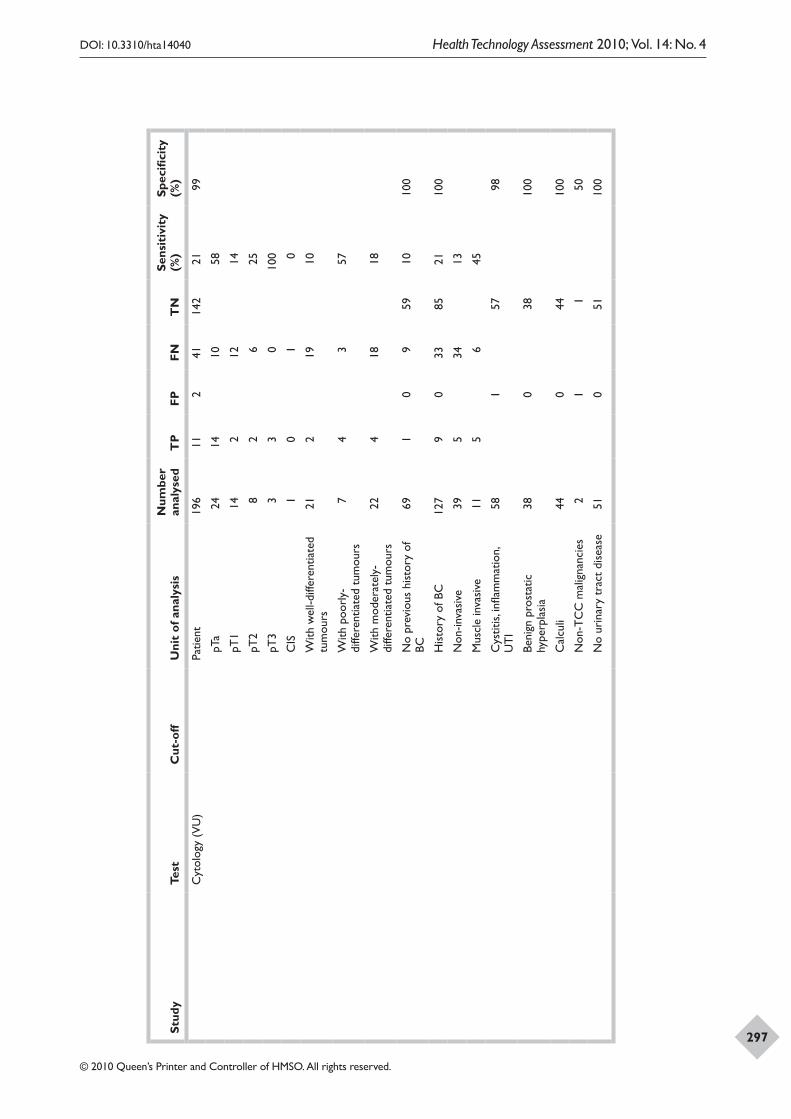
Appendix 15
296
DOI: 10.3310/hta14040 Health Technology Assessment 2010; Vol. 14: No. 4
© 2010 Queen’s Printer and Controller of HMSO. All rights reserved.
297Stud
yTe
stC
ut-o
ffU
nit
of a
naly
sis
Num
ber
anal
ysed
TP
FPFN
TN
Sens
itiv
ity
(%)
Spec
ifici
ty
(%)
Cyt
olog
y (V
U)
Patie
nt19
611
241
142
2199
pT
a24
1410
58
pT
114
212
14
pT
28
26
25
pT
33
30
100
C
IS1
01
0
W
ith w
ell-d
iffer
entia
ted
tum
ours
212
1910
W
ith p
oorl
y-di
ffere
ntia
ted
tum
ours
74
357
W
ith m
oder
atel
y-di
ffere
ntia
ted
tum
ours
224
1818
N
o pr
evio
us h
isto
ry o
f BC
691
09
5910
100
H
isto
ry o
f BC
127
90
3385
2110
0
N
on-in
vasi
ve39
534
13
M
uscl
e in
vasi
ve11
56
45
C
ystit
is, i
nflam
mat
ion,
U
TI
581
5798
Be
nign
pro
stat
ic
hype
rpla
sia
380
3810
0
C
alcu
li44
044
100
N
on-T
CC
mal
igna
ncie
s2
11
50
N
o ur
inar
y tr
act
dise
ase
510
5110
0
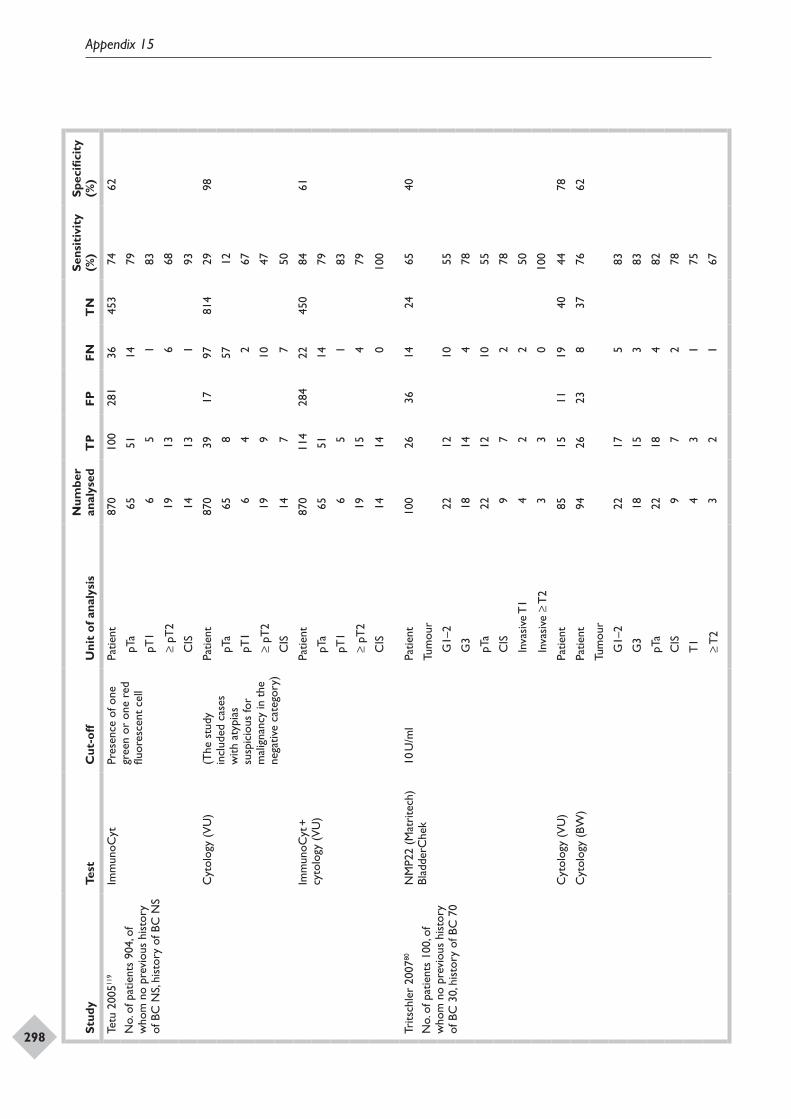
Appendix 15
298
DOI: 10.3310/hta14040 Health Technology Assessment 2010; Vol. 14: No. 4
© 2010 Queen’s Printer and Controller of HMSO. All rights reserved.
299Stud
yTe
stC
ut-o
ffU
nit
of a
naly
sis
Num
ber
anal
ysed
TP
FPFN
TN
Sens
itiv
ity
(%)
Spec
ifici
ty
(%)
Tetu
200
5119
No.
of p
atie
nts
904,
of
who
m n
o pr
evio
us h
isto
ry
of B
C N
S, hi
stor
y of
BC
NS
Imm
unoC
ytPr
esen
ce o
f one
gr
een
or o
ne r
ed
fluor
esce
nt c
ell
Patie
nt87
010
028
136
453
7462
pT
a65
5114
79
pT
16
51
83
≥
pT2
1913
668
C
IS14
131
93
Cyt
olog
y (V
U)
(The
stu
dy
incl
uded
cas
es
with
aty
pias
su
spic
ious
for
mal
igna
ncy
in t
he
nega
tive
cate
gory
)
Patie
nt87
039
1797
814
2998
pT
a65
857
12
pT
16
42
67
≥
pT2
199
1047
C
IS14
77
50
Imm
unoC
yt +
cy
tolo
gy (
VU
)Pa
tient
870
114
284
2245
084
61
pT
a65
5114
79
pT
16
51
83
≥
pT2
1915
479
C
IS14
140
100
Trits
chle
r 20
0780
No.
of p
atie
nts
100,
of
who
m n
o pr
evio
us h
isto
ry
of B
C 3
0, h
isto
ry o
f BC
70
NM
P22
(Mat
rite
ch)
Blad
derC
hek
10 U
/ml
Patie
nt10
026
3614
2465
40
Tum
our
G
1–2
2212
1055
G
318
144
78
pT
a22
1210
55
C
IS9
72
78
In
vasi
ve T
14
22
50
In
vasi
ve ≥
T2
33
010
0
Cyt
olog
y (V
U)
Patie
nt85
1511
1940
4478
Cyt
olog
y (B
W)
Patie
nt94
2623
837
7662
Tum
our
G
1–2
2217
583
G
318
153
83
pT
a22
184
82
C
IS9
72
78
T
14
31
75
≥
T2
32
167
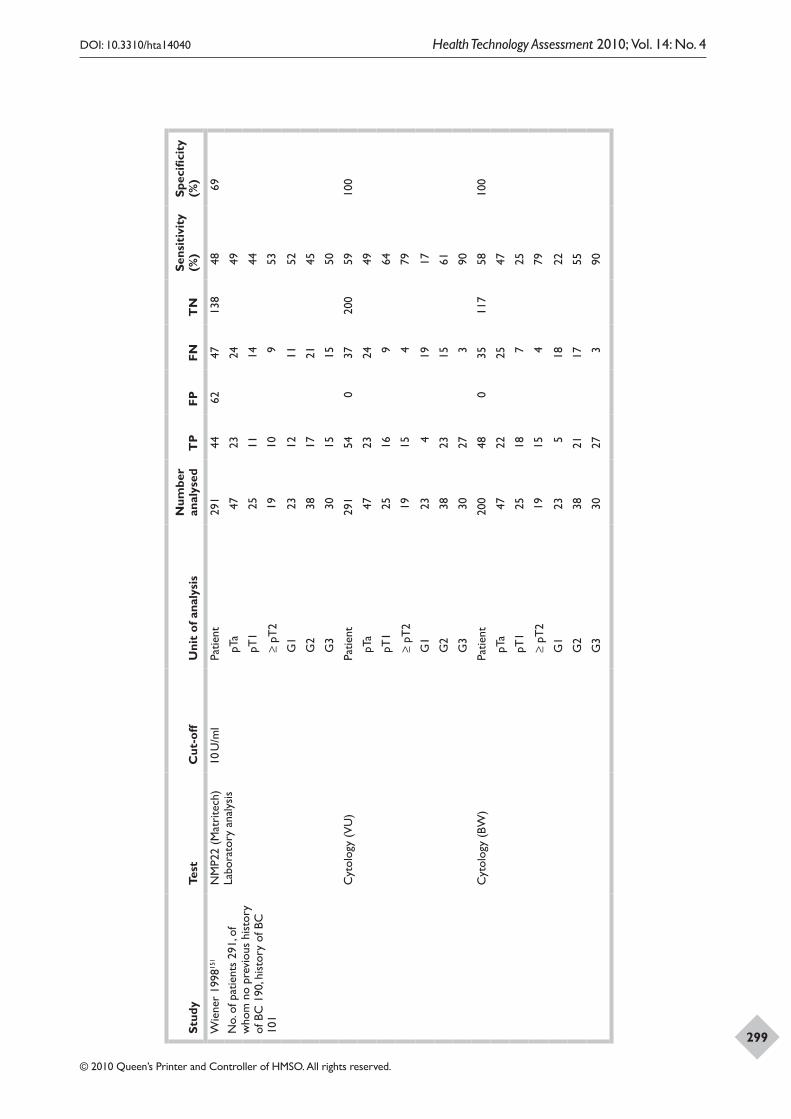
Appendix 15
298
DOI: 10.3310/hta14040 Health Technology Assessment 2010; Vol. 14: No. 4
© 2010 Queen’s Printer and Controller of HMSO. All rights reserved.
299Stud
yTe
stC
ut-o
ffU
nit
of a
naly
sis
Num
ber
anal
ysed
TP
FPFN
TN
Sens
itiv
ity
(%)
Spec
ifici
ty
(%)
Wie
ner
1998
151
No.
of p
atie
nts
291,
of
who
m n
o pr
evio
us h
isto
ry
of B
C 1
90, h
isto
ry o
f BC
10
1
NM
P22
(Mat
rite
ch)
Labo
rato
ry a
naly
sis
10 U
/ml
Patie
nt29
144
6247
138
4869
pT
a47
2324
49
pT
125
1114
44
≥
pT2
1910
953
G
123
1211
52
G
238
1721
45
G
330
1515
50
Cyt
olog
y (V
U)
Patie
nt29
154
037
200
5910
0
pT
a47
2324
49
pT
125
169
64
≥
pT2
1915
479
G
123
419
17
G
238
2315
61
G
330
273
90
Cyt
olog
y (B
W)
Patie
nt20
048
035
117
5810
0
pT
a47
2225
47
pT
125
187
25
≥
pT2
1915
479
G
123
518
22
G
238
2117
55
G
330
273
90
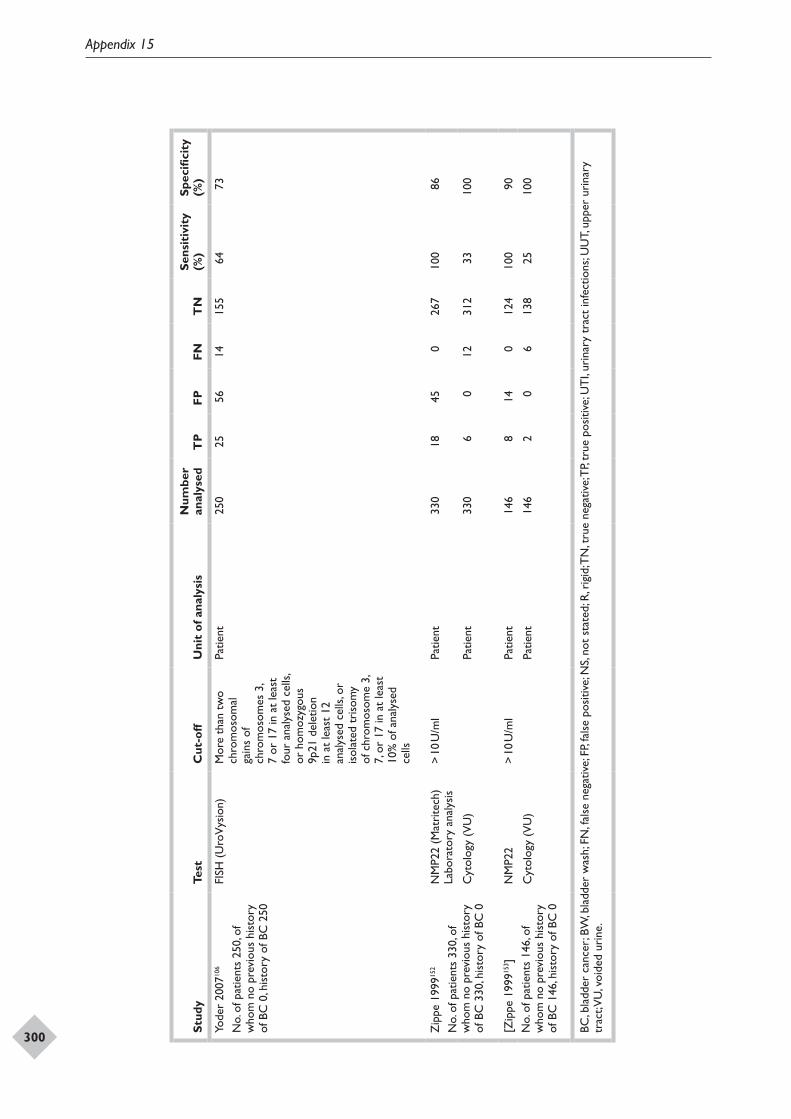
Appendix 15
300
Stud
yTe
stC
ut-o
ffU
nit
of a
naly
sis
Num
ber
anal
ysed
TP
FPFN
TN
Sens
itiv
ity
(%)
Spec
ifici
ty
(%)
Yode
r 20
0710
6
No.
of p
atie
nts
250,
of
who
m n
o pr
evio
us h
isto
ry
of B
C 0
, his
tory
of B
C 2
50
FISH
(U
roV
ysio
n)M
ore
than
tw
o ch
rom
osom
al
gain
s of
ch
rom
osom
es 3
, 7
or 1
7 in
at
leas
t fo
ur a
naly
sed
cells
, or
hom
ozyg
ous
9p21
del
etio
n in
at
leas
t 12
an
alys
ed c
ells
, or
isol
ated
tri
som
y of
chr
omos
ome
3,
7, o
r 17
in a
t le
ast
10%
of a
naly
sed
cells
Patie
nt25
025
5614
155
6473
Zip
pe 1
99915
2
No.
of p
atie
nts
330,
of
who
m n
o pr
evio
us h
isto
ry
of B
C 3
30, h
isto
ry o
f BC
0
NM
P22
(Mat
rite
ch)
Labo
rato
ry a
naly
sis
> 10
U/m
lPa
tient
330
1845
026
710
086
Cyt
olog
y (V
U)
Patie
nt33
06
012
312
3310
0
[Zip
pe 1
99915
3 ]N
o. o
f pat
ient
s 14
6, o
f w
hom
no
prev
ious
his
tory
of
BC
146
, his
tory
of B
C 0
NM
P22
> 10
U/m
lPa
tient
146
814
012
410
090
Cyt
olog
y (V
U)
Patie
nt14
62
06
138
2510
0
BC, b
ladd
er c
ance
r; BW
, bla
dder
was
h; F
N, f
alse
neg
ativ
e; F
P, fa
lse
posi
tive;
NS,
not
stat
ed; R
, rig
id; T
N, t
rue
nega
tive;
TP,
true
pos
itive
; UT
I, ur
inar
y tr
act
infe
ctio
ns; U
UT,
uppe
r ur
inar
y tr
act; V
U, v
oide
d ur
ine.
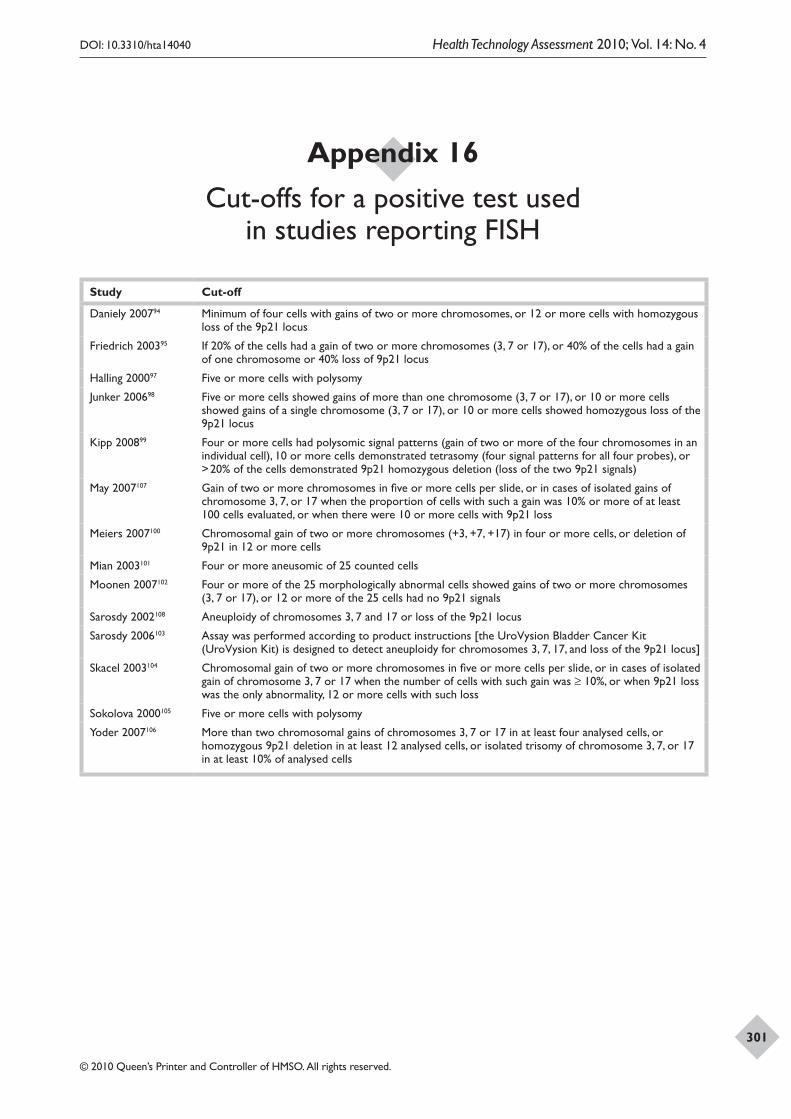
DOI: 10.3310/hta14040 Health Technology Assessment 2010; Vol. 14: No. 4
© 2010 Queen’s Printer and Controller of HMSO. All rights reserved.
301
Appendix 16 Cut-offs for a positive test used
in studies reporting FISH
Study Cut-off
Daniely 200794 Minimum of four cells with gains of two or more chromosomes, or 12 or more cells with homozygous loss of the 9p21 locus
Friedrich 200395 If 20% of the cells had a gain of two or more chromosomes (3, 7 or 17), or 40% of the cells had a gain of one chromosome or 40% loss of 9p21 locus
Halling 200097 Five or more cells with polysomy
Junker 200698 Five or more cells showed gains of more than one chromosome (3, 7 or 17), or 10 or more cells showed gains of a single chromosome (3, 7 or 17), or 10 or more cells showed homozygous loss of the 9p21 locus
Kipp 200899 Four or more cells had polysomic signal patterns (gain of two or more of the four chromosomes in an individual cell), 10 or more cells demonstrated tetrasomy (four signal patterns for all four probes), or > 20% of the cells demonstrated 9p21 homozygous deletion (loss of the two 9p21 signals)
May 2007107 Gain of two or more chromosomes in five or more cells per slide, or in cases of isolated gains of chromosome 3, 7, or 17 when the proportion of cells with such a gain was 10% or more of at least 100 cells evaluated, or when there were 10 or more cells with 9p21 loss
Meiers 2007100 Chromosomal gain of two or more chromosomes (+3, +7, +17) in four or more cells, or deletion of 9p21 in 12 or more cells
Mian 2003101 Four or more aneusomic of 25 counted cells
Moonen 2007102 Four or more of the 25 morphologically abnormal cells showed gains of two or more chromosomes (3, 7 or 17), or 12 or more of the 25 cells had no 9p21 signals
Sarosdy 2002108 Aneuploidy of chromosomes 3, 7 and 17 or loss of the 9p21 locus
Sarosdy 2006103 Assay was performed according to product instructions [the UroVysion Bladder Cancer Kit (UroVysion Kit) is designed to detect aneuploidy for chromosomes 3, 7, 17, and loss of the 9p21 locus]
Skacel 2003104 Chromosomal gain of two or more chromosomes in five or more cells per slide, or in cases of isolated gain of chromosome 3, 7 or 17 when the number of cells with such gain was ≥ 10%, or when 9p21 loss was the only abnormality, 12 or more cells with such loss
Sokolova 2000105 Five or more cells with polysomy
Yoder 2007106 More than two chromosomal gains of chromosomes 3, 7 or 17 in at least four analysed cells, or homozygous 9p21 deletion in at least 12 analysed cells, or isolated trisomy of chromosome 3, 7, or 17 in at least 10% of analysed cells

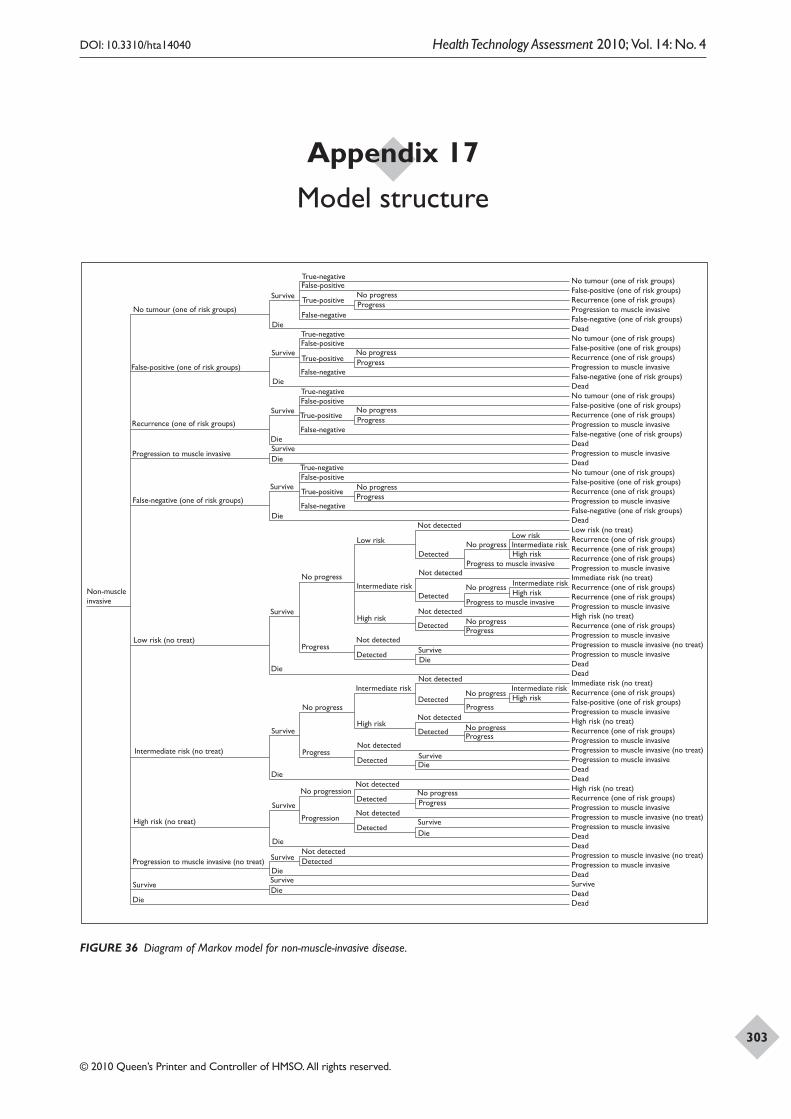
DOI: 10.3310/hta14040 Health Technology Assessment 2010; Vol. 14: No. 4
© 2010 Queen’s Printer and Controller of HMSO. All rights reserved.
303
Appendix 17 Model structure
Recurrence (one of risk groups)
No tumour (one of risk groups)
False-positive (one of risk groups)
False-negative (one of risk groups)
False-positiveTrue-negative
ProgressNo progress
ProgressNo progress
ProgressNo progress
ProgressNo progress
Progress to muscle invasive
No progress
No tumour (one of risk groups)False-positive (one of risk groups)Recurrence (one of risk groups)Progression to muscle invasiveFalse-negative (one of risk groups)DeadNo tumour (one of risk groups)False-positive (one of risk groups)Recurrence (one of risk groups)Progression to muscle invasiveFalse-negative (one of risk groups)DeadNo tumour (one of risk groups)False-positive (one of risk groups)Recurrence (one of risk groups)Progression to muscle invasiveFalse-negative (one of risk groups)DeadProgression to muscle invasiveDeadNo tumour (one of risk groups)False-positive (one of risk groups)Recurrence (one of risk groups)Progression to muscle invasiveFalse-negative (one of risk groups)DeadLow risk (no treat)Recurrence (one of risk groups)Recurrence (one of risk groups)Recurrence (one of risk groups)Progression to muscle invasiveImmediate risk (no treat)Recurrence (one of risk groups)Recurrence (one of risk groups)Progression to muscle invasiveHigh risk (no treat)Recurrence (one of risk groups)Progression to muscle invasiveProgression to muscle invasive (no treat)Progression to muscle invasiveDeadDeadImmediate risk (no treat)Recurrence (one of risk groups)False-positive (one of risk groups)Progression to muscle invasiveHigh risk (no treat)Recurrence (one of risk groups)Progression to muscle invasiveProgression to muscle invasive (no treat)Progression to muscle invasiveDeadDeadHigh risk (no treat)Recurrence (one of risk groups)Progression to muscle invasiveProgression to muscle invasive (no treat)Progression to muscle invasiveDeadDeadProgression to muscle invasive (no treat)Progression to muscle invasiveDeadSurviveDeadDead
Progress to muscle invasive
No progress
ProgressNo progress
Progress
No progress
ProgressNo progress
ProgressNo progress
False-negative
True-positive
False-positiveTrue-negative
False-negative
True-positive
False-positiveTrue-negative
False-negative
True-positive
False-positiveTrue-negative
False-negative
No progress
Progress
No progress
Progress
No progression
Progression
Not detectedDetected
Not detected
Detected
Not detected
Detected
Not detected
Detected
Not detected
Detected
Not detected
Detected
Not detected
Detected
Not detected
Detected
Not detected
Detected
Not detected
Detected
SurviveDie
SurviveDie
SurviveDie
True-positive
Low risk (no treat)
Low riskLow risk
Intermediate risk (no treat)
Intermediate risk
Intermediate risk
Intermediate risk
Intermediate riskIntermediate risk
High risk (no treat)
High risk
High risk
High risk
High risk
High risk
Survive
Die
Survive
Die
Survive
Die
Survive
DieSurviveDie
Survive
Die
Survive
Die
Survive
Die
Survive
Die
Survive
SurviveDie
Die
Non-muscleinvasive
Progression to muscle invasive
Progression to muscle invasive (no treat)
FIGURE 36 Diagram of Markov model for non-muscle-invasive disease.
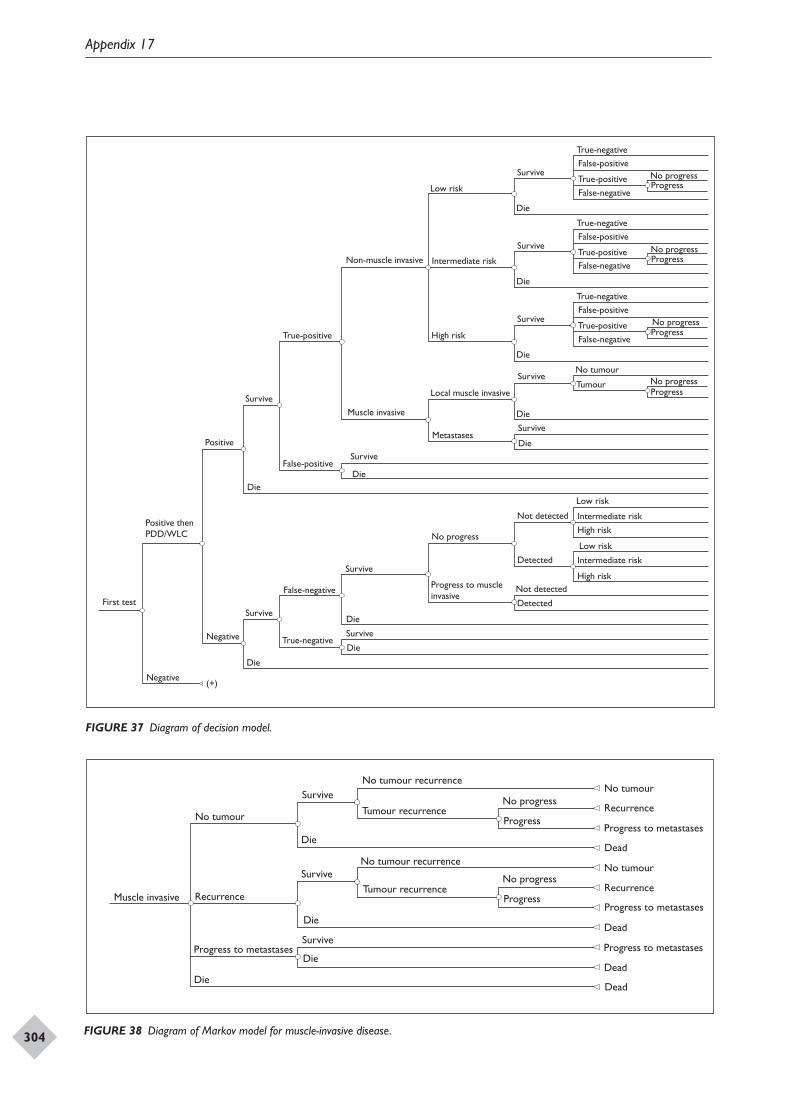
Appendix 17
304
First test
(+)
Positive thenPDD/WLC
Negative
Positive
True-positive
True-positive
Non-muscle invasive
Muscle invasive
Local muscle invasive
Metastases
No progress
No progress
Progress to muscleinvasive
Progress
False-positive
False-positive
False-negative
False-negative
Low risk
Intermediate riskHigh risk
Low risk
Intermediate risk
High risk
True-negative
True-negative
Survive
Die
Survive
Die
Low risk
Intermediate risk
High risk
Survive
Die
Survive
Survive
Die
Die
Survive
Die
Not detected
Not detected
Detected
Detected
Negative
True-positive No progressProgress
False-positive
False-negative
True-negative
Survive
Die
True-positive No progressProgress
False-positive
False-negative
True-negative
Survive
Survive
Die
Die
No progressProgress
Survive
Die
No tumour
Tumour
Muscle invasive
Progress to metastases
Progress to metastases
No progress
Progress
No progress
Progress
Die
Dead
No tumour
No tumour recurrence
Tumour recurrence Recurrence
No tumour recurrence
No tumour
Progress to metastases
Progress to metastases
Dead
Dead
Dead
Recurrence
No tumour
Tumour recurrenceRecurrence
Survive
Die
Survive
Die
Survive
Die
FIGURE 37 Diagram of decision model.
FIGURE 38 Diagram of Markov model for muscle-invasive disease.

DOI: 10.3310/hta14040 Health Technology Assessment 2010; Vol. 14: No. 4
© 2010 Queen’s Printer and Controller of HMSO. All rights reserved.
305
Appendix 18 Summary of studies reporting prognosis and all-cause mortality rates for the UK
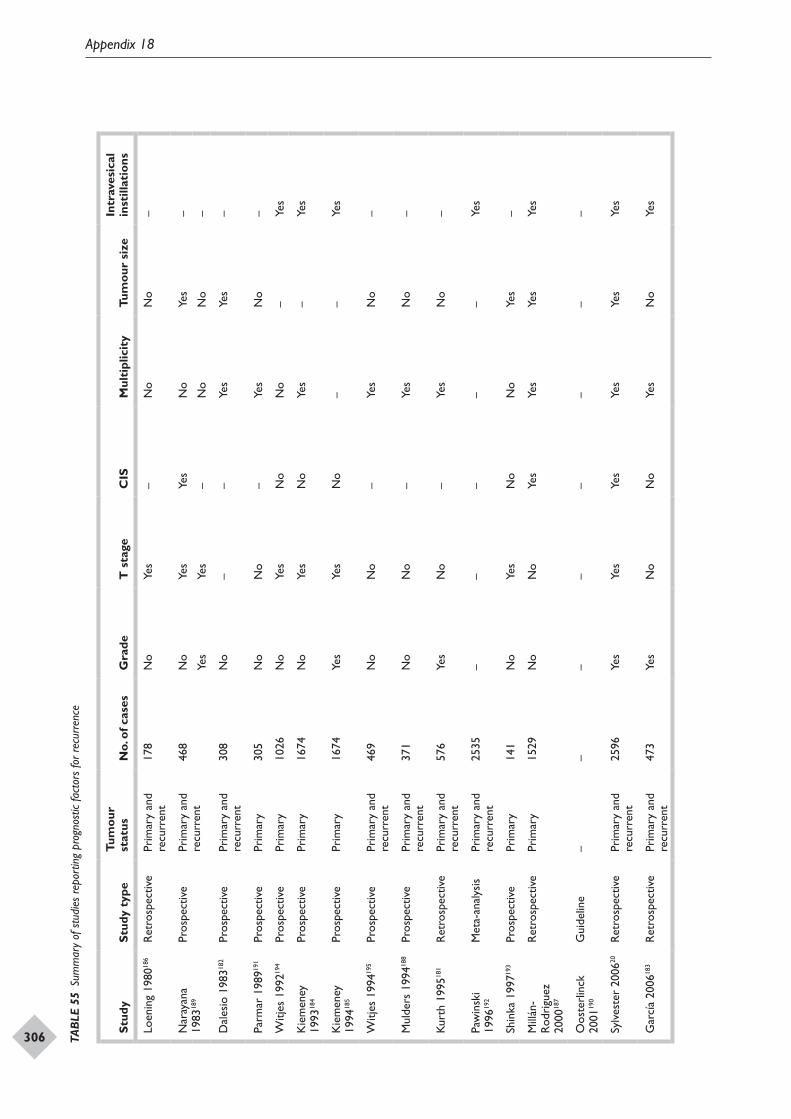
Appendix 18
306
DOI: 10.3310/hta14040 Health Technology Assessment 2010; Vol. 14: No. 4
© 2010 Queen’s Printer and Controller of HMSO. All rights reserved.
307TAB
LE 5
5 Su
mm
ary
of s
tudi
es re
port
ing
prog
nost
ic fa
ctor
s fo
r rec
urre
nce
Stud
ySt
udy
type
Tum
our
stat
usN
o. o
f cas
esG
rade
T s
tage
CIS
Mul
tipl
icit
yTu
mou
r si
zeIn
trav
esic
al
inst
illat
ions
Loen
ing
1980
186
Ret
rosp
ectiv
ePr
imar
y an
d re
curr
ent
178
No
Yes
–N
oN
o–
Nar
ayan
a 19
8318
9Pr
ospe
ctiv
ePr
imar
y an
d re
curr
ent
468
No
Yes
Yes
No
Yes
–
Yes
Yes
–N
oN
o–
Dal
esio
198
3182
Pros
pect
ive
Prim
ary
and
recu
rren
t30
8N
o–
–Ye
sYe
s–
Parm
ar 1
98919
1Pr
ospe
ctiv
ePr
imar
y30
5N
oN
o–
Yes
No
–
Witj
es 1
99219
4Pr
ospe
ctiv
ePr
imar
y10
26N
oYe
sN
oN
o–
Yes
Kie
men
ey
1993
184
Pros
pect
ive
Prim
ary
1674
No
Yes
No
Yes
–Ye
s
Kie
men
ey
1994
185
Pros
pect
ive
Prim
ary
1674
Yes
Yes
No
––
Yes
Witj
es 1
99419
5Pr
ospe
ctiv
ePr
imar
y an
d re
curr
ent
469
No
No
–Ye
sN
o–
Mul
ders
199
4188
Pros
pect
ive
Prim
ary
and
recu
rren
t37
1N
oN
o–
Yes
No
–
Kur
th 1
99518
1R
etro
spec
tive
Prim
ary
and
recu
rren
t57
6Ye
sN
o–
Yes
No
–
Paw
insk
i 19
9619
2M
eta-
anal
ysis
Prim
ary
and
recu
rren
t25
35–
––
––
Yes
Shin
ka 1
99719
3Pr
ospe
ctiv
ePr
imar
y14
1N
oYe
sN
oN
oYe
s–
Mill
án-
Rod
rigu
ez
2000
187
Ret
rosp
ectiv
ePr
imar
y15
29N
oN
oYe
sYe
sYe
sYe
s
Oos
terl
inck
20
0119
0G
uide
line
––
––
––
––
Sylv
este
r 20
0620
Ret
rosp
ectiv
ePr
imar
y an
d re
curr
ent
2596
Yes
Yes
Yes
Yes
Yes
Yes
Gar
cía
2006
183
Ret
rosp
ectiv
ePr
imar
y an
d re
curr
ent
473
Yes
No
No
Yes
No
Yes
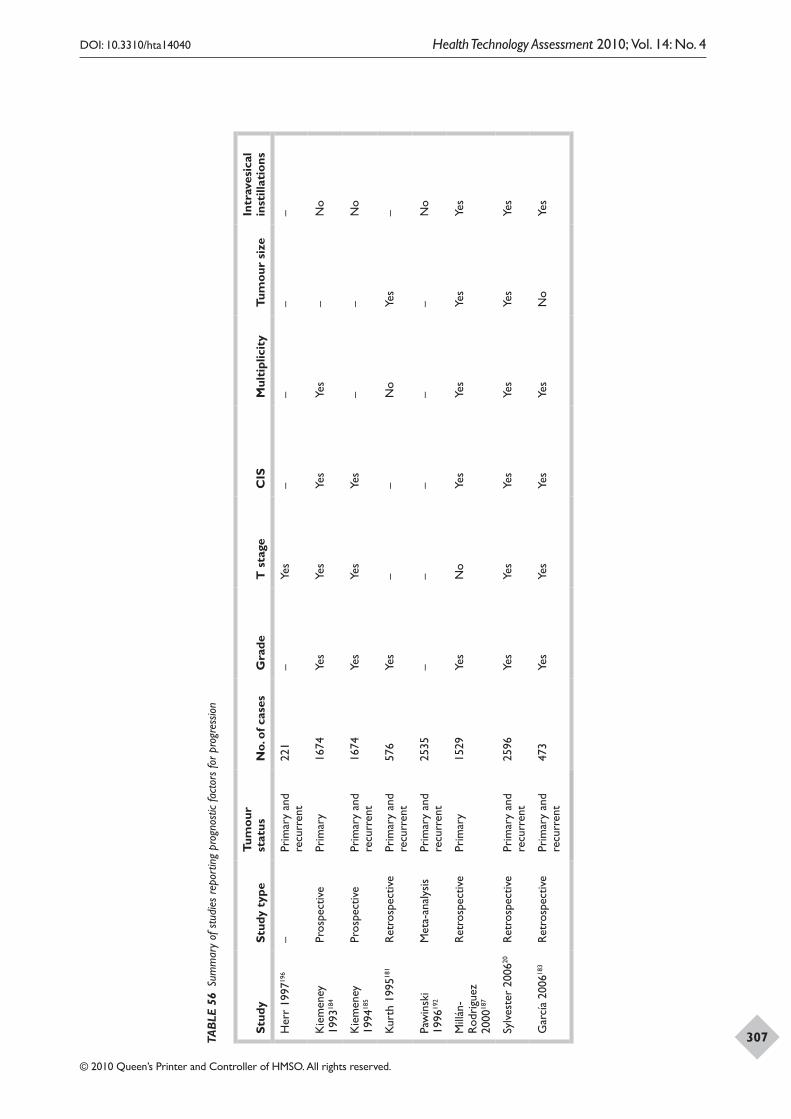
Appendix 18
306
DOI: 10.3310/hta14040 Health Technology Assessment 2010; Vol. 14: No. 4
© 2010 Queen’s Printer and Controller of HMSO. All rights reserved.
307TAB
LE 5
6 Su
mm
ary
of s
tudi
es re
port
ing
prog
nost
ic fa
ctor
s fo
r pro
gres
sion
Stud
ySt
udy
type
Tum
our
stat
usN
o. o
f cas
esG
rade
T s
tage
CIS
Mul
tipl
icit
yTu
mou
r si
zeIn
trav
esic
al
inst
illat
ions
Her
r 19
9719
6–
Prim
ary
and
recu
rren
t22
1–
Yes
––
––
Kie
men
ey
1993
184
Pros
pect
ive
Prim
ary
1674
Yes
Yes
Yes
Yes
–N
o
Kie
men
ey
1994
185
Pros
pect
ive
Prim
ary
and
recu
rren
t16
74Ye
sYe
sYe
s–
–N
o
Kur
th 1
99518
1 R
etro
spec
tive
Prim
ary
and
recu
rren
t57
6Ye
s–
–N
oYe
s–
Paw
insk
i 19
9619
2M
eta-
anal
ysis
Prim
ary
and
recu
rren
t25
35–
––
––
No
Mill
án-
Rod
rigu
ez
2000
187
Ret
rosp
ectiv
ePr
imar
y15
29Ye
sN
oYe
sYe
sYe
sYe
s
Sylv
este
r 20
0620
Ret
rosp
ectiv
ePr
imar
y an
d re
curr
ent
2596
Yes
Yes
Yes
Yes
Yes
Yes
Gar
cía
2006
183
Ret
rosp
ectiv
ePr
imar
y an
d re
curr
ent
473
Yes
Yes
Yes
Yes
No
Yes
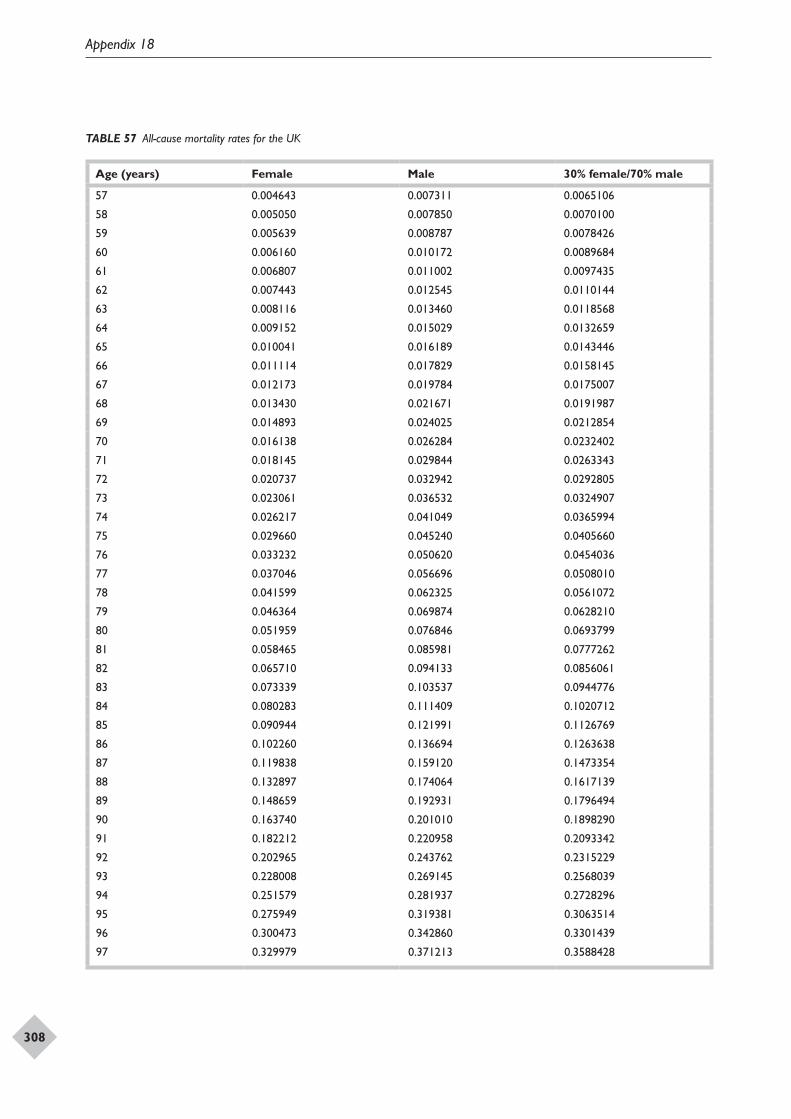
Appendix 18
308
TABLE 57 All-cause mortality rates for the UK
Age (years) Female Male 30% female/70% male
57 0.004643 0.007311 0.0065106
58 0.005050 0.007850 0.0070100
59 0.005639 0.008787 0.0078426
60 0.006160 0.010172 0.0089684
61 0.006807 0.011002 0.0097435
62 0.007443 0.012545 0.0110144
63 0.008116 0.013460 0.0118568
64 0.009152 0.015029 0.0132659
65 0.010041 0.016189 0.0143446
66 0.011114 0.017829 0.0158145
67 0.012173 0.019784 0.0175007
68 0.013430 0.021671 0.0191987
69 0.014893 0.024025 0.0212854
70 0.016138 0.026284 0.0232402
71 0.018145 0.029844 0.0263343
72 0.020737 0.032942 0.0292805
73 0.023061 0.036532 0.0324907
74 0.026217 0.041049 0.0365994
75 0.029660 0.045240 0.0405660
76 0.033232 0.050620 0.0454036
77 0.037046 0.056696 0.0508010
78 0.041599 0.062325 0.0561072
79 0.046364 0.069874 0.0628210
80 0.051959 0.076846 0.0693799
81 0.058465 0.085981 0.0777262
82 0.065710 0.094133 0.0856061
83 0.073339 0.103537 0.0944776
84 0.080283 0.111409 0.1020712
85 0.090944 0.121991 0.1126769
86 0.102260 0.136694 0.1263638
87 0.119838 0.159120 0.1473354
88 0.132897 0.174064 0.1617139
89 0.148659 0.192931 0.1796494
90 0.163740 0.201010 0.1898290
91 0.182212 0.220958 0.2093342
92 0.202965 0.243762 0.2315229
93 0.228008 0.269145 0.2568039
94 0.251579 0.281937 0.2728296
95 0.275949 0.319381 0.3063514
96 0.300473 0.342860 0.3301439
97 0.329979 0.371213 0.3588428
DOI: 10.3310/hta14040 Health Technology Assessment 2010; Vol. 14: No. 4
© 2010 Queen’s Printer and Controller of HMSO. All rights reserved.
309
Appendix 19 Results of cost–consequence analysis
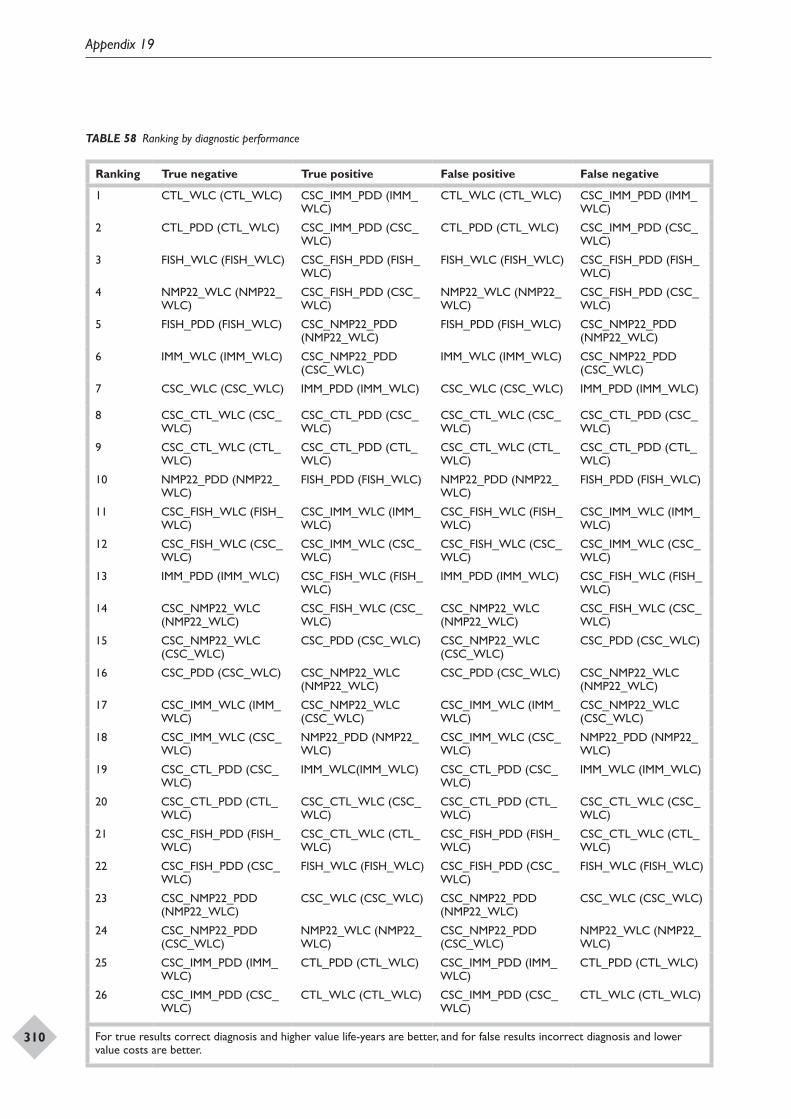
Appendix 19
310
TABLE 58 Ranking by diagnostic performance
Ranking True negative True positive False positive False negative
1 CTL_WLC (CTL_WLC) CSC_IMM_PDD (IMM_WLC)
CTL_WLC (CTL_WLC) CSC_IMM_PDD (IMM_WLC)
2 CTL_PDD (CTL_WLC) CSC_IMM_PDD (CSC_WLC)
CTL_PDD (CTL_WLC) CSC_IMM_PDD (CSC_WLC)
3 FISH_WLC (FISH_WLC) CSC_FISH_PDD (FISH_WLC)
FISH_WLC (FISH_WLC) CSC_FISH_PDD (FISH_WLC)
4 NMP22_WLC (NMP22_WLC)
CSC_FISH_PDD (CSC_WLC)
NMP22_WLC (NMP22_WLC)
CSC_FISH_PDD (CSC_WLC)
5 FISH_PDD (FISH_WLC) CSC_NMP22_PDD (NMP22_WLC)
FISH_PDD (FISH_WLC) CSC_NMP22_PDD (NMP22_WLC)
6 IMM_WLC (IMM_WLC) CSC_NMP22_PDD (CSC_WLC)
IMM_WLC (IMM_WLC) CSC_NMP22_PDD (CSC_WLC)
7 CSC_WLC (CSC_WLC) IMM_PDD (IMM_WLC) CSC_WLC (CSC_WLC) IMM_PDD (IMM_WLC)
8 CSC_CTL_WLC (CSC_WLC)
CSC_CTL_PDD (CSC_WLC)
CSC_CTL_WLC (CSC_WLC)
CSC_CTL_PDD (CSC_WLC)
9 CSC_CTL_WLC (CTL_WLC)
CSC_CTL_PDD (CTL_WLC)
CSC_CTL_WLC (CTL_WLC)
CSC_CTL_PDD (CTL_WLC)
10 NMP22_PDD (NMP22_WLC)
FISH_PDD (FISH_WLC) NMP22_PDD (NMP22_WLC)
FISH_PDD (FISH_WLC)
11 CSC_FISH_WLC (FISH_WLC)
CSC_IMM_WLC (IMM_WLC)
CSC_FISH_WLC (FISH_WLC)
CSC_IMM_WLC (IMM_WLC)
12 CSC_FISH_WLC (CSC_WLC)
CSC_IMM_WLC (CSC_WLC)
CSC_FISH_WLC (CSC_WLC)
CSC_IMM_WLC (CSC_WLC)
13 IMM_PDD (IMM_WLC) CSC_FISH_WLC (FISH_WLC)
IMM_PDD (IMM_WLC) CSC_FISH_WLC (FISH_WLC)
14 CSC_NMP22_WLC (NMP22_WLC)
CSC_FISH_WLC (CSC_WLC)
CSC_NMP22_WLC (NMP22_WLC)
CSC_FISH_WLC (CSC_WLC)
15 CSC_NMP22_WLC (CSC_WLC)
CSC_PDD (CSC_WLC) CSC_NMP22_WLC (CSC_WLC)
CSC_PDD (CSC_WLC)
16 CSC_PDD (CSC_WLC) CSC_NMP22_WLC (NMP22_WLC)
CSC_PDD (CSC_WLC) CSC_NMP22_WLC (NMP22_WLC)
17 CSC_IMM_WLC (IMM_WLC)
CSC_NMP22_WLC (CSC_WLC)
CSC_IMM_WLC (IMM_WLC)
CSC_NMP22_WLC (CSC_WLC)
18 CSC_IMM_WLC (CSC_WLC)
NMP22_PDD (NMP22_WLC)
CSC_IMM_WLC (CSC_WLC)
NMP22_PDD (NMP22_WLC)
19 CSC_CTL_PDD (CSC_WLC)
IMM_WLC(IMM_WLC) CSC_CTL_PDD (CSC_WLC)
IMM_WLC (IMM_WLC)
20 CSC_CTL_PDD (CTL_WLC)
CSC_CTL_WLC (CSC_WLC)
CSC_CTL_PDD (CTL_WLC)
CSC_CTL_WLC (CSC_WLC)
21 CSC_FISH_PDD (FISH_WLC)
CSC_CTL_WLC (CTL_WLC)
CSC_FISH_PDD (FISH_WLC)
CSC_CTL_WLC (CTL_WLC)
22 CSC_FISH_PDD (CSC_WLC)
FISH_WLC (FISH_WLC) CSC_FISH_PDD (CSC_WLC)
FISH_WLC (FISH_WLC)
23 CSC_NMP22_PDD (NMP22_WLC)
CSC_WLC (CSC_WLC) CSC_NMP22_PDD (NMP22_WLC)
CSC_WLC (CSC_WLC)
24 CSC_NMP22_PDD (CSC_WLC)
NMP22_WLC (NMP22_WLC)
CSC_NMP22_PDD (CSC_WLC)
NMP22_WLC (NMP22_WLC)
25 CSC_IMM_PDD (IMM_WLC)
CTL_PDD (CTL_WLC) CSC_IMM_PDD (IMM_WLC)
CTL_PDD (CTL_WLC)
26 CSC_IMM_PDD (CSC_WLC)
CTL_WLC (CTL_WLC) CSC_IMM_PDD (CSC_WLC)
CTL_WLC (CTL_WLC)
For true results correct diagnosis and higher value life-years are better, and for false results incorrect diagnosis and lower value costs are better.
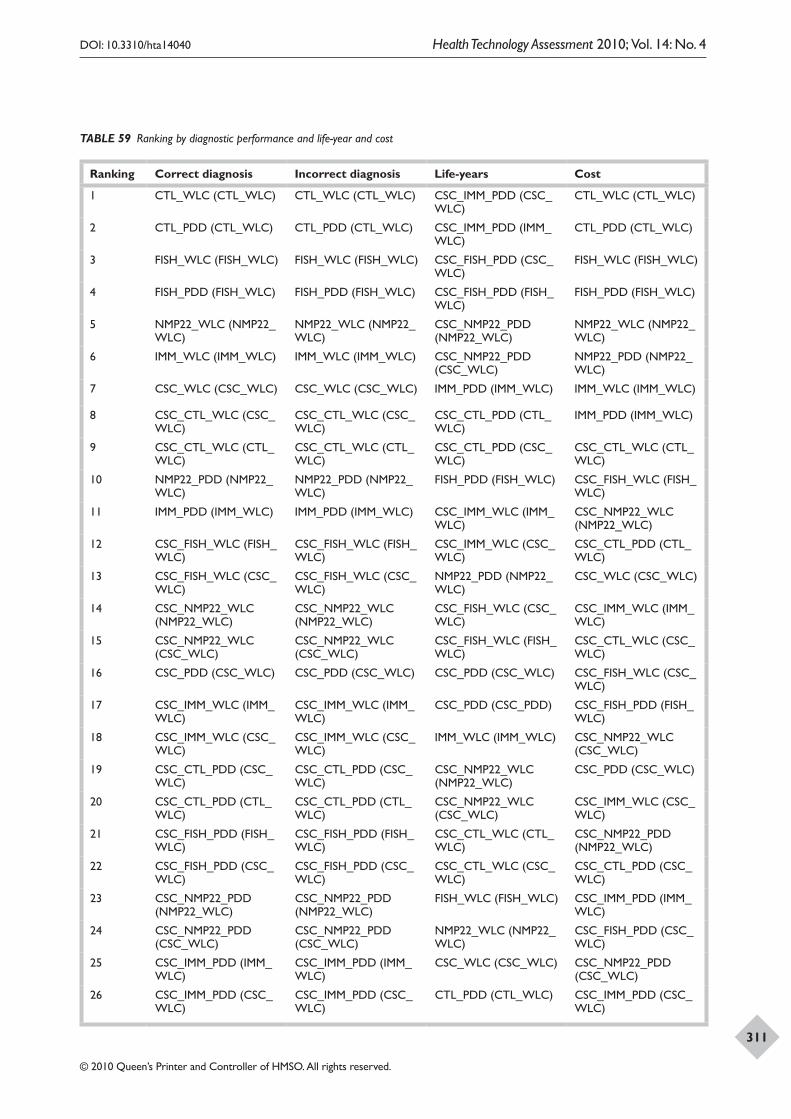
DOI: 10.3310/hta14040 Health Technology Assessment 2010; Vol. 14: No. 4
© 2010 Queen’s Printer and Controller of HMSO. All rights reserved.
311
TABLE 59 Ranking by diagnostic performance and life-year and cost
Ranking Correct diagnosis Incorrect diagnosis Life-years Cost
1 CTL_WLC (CTL_WLC) CTL_WLC (CTL_WLC) CSC_IMM_PDD (CSC_WLC)
CTL_WLC (CTL_WLC)
2 CTL_PDD (CTL_WLC) CTL_PDD (CTL_WLC) CSC_IMM_PDD (IMM_WLC)
CTL_PDD (CTL_WLC)
3 FISH_WLC (FISH_WLC) FISH_WLC (FISH_WLC) CSC_FISH_PDD (CSC_WLC)
FISH_WLC (FISH_WLC)
4 FISH_PDD (FISH_WLC) FISH_PDD (FISH_WLC) CSC_FISH_PDD (FISH_WLC)
FISH_PDD (FISH_WLC)
5 NMP22_WLC (NMP22_WLC)
NMP22_WLC (NMP22_WLC)
CSC_NMP22_PDD (NMP22_WLC)
NMP22_WLC (NMP22_WLC)
6 IMM_WLC (IMM_WLC) IMM_WLC (IMM_WLC) CSC_NMP22_PDD (CSC_WLC)
NMP22_PDD (NMP22_WLC)
7 CSC_WLC (CSC_WLC) CSC_WLC (CSC_WLC) IMM_PDD (IMM_WLC) IMM_WLC (IMM_WLC)
8 CSC_CTL_WLC (CSC_WLC)
CSC_CTL_WLC (CSC_WLC)
CSC_CTL_PDD (CTL_WLC)
IMM_PDD (IMM_WLC)
9 CSC_CTL_WLC (CTL_WLC)
CSC_CTL_WLC (CTL_WLC)
CSC_CTL_PDD (CSC_WLC)
CSC_CTL_WLC (CTL_WLC)
10 NMP22_PDD (NMP22_WLC)
NMP22_PDD (NMP22_WLC)
FISH_PDD (FISH_WLC) CSC_FISH_WLC (FISH_WLC)
11 IMM_PDD (IMM_WLC) IMM_PDD (IMM_WLC) CSC_IMM_WLC (IMM_WLC)
CSC_NMP22_WLC (NMP22_WLC)
12 CSC_FISH_WLC (FISH_WLC)
CSC_FISH_WLC (FISH_WLC)
CSC_IMM_WLC (CSC_WLC)
CSC_CTL_PDD (CTL_WLC)
13 CSC_FISH_WLC (CSC_WLC)
CSC_FISH_WLC (CSC_WLC)
NMP22_PDD (NMP22_WLC)
CSC_WLC (CSC_WLC)
14 CSC_NMP22_WLC (NMP22_WLC)
CSC_NMP22_WLC (NMP22_WLC)
CSC_FISH_WLC (CSC_WLC)
CSC_IMM_WLC (IMM_WLC)
15 CSC_NMP22_WLC (CSC_WLC)
CSC_NMP22_WLC (CSC_WLC)
CSC_FISH_WLC (FISH_WLC)
CSC_CTL_WLC (CSC_WLC)
16 CSC_PDD (CSC_WLC) CSC_PDD (CSC_WLC) CSC_PDD (CSC_WLC) CSC_FISH_WLC (CSC_WLC)
17 CSC_IMM_WLC (IMM_WLC)
CSC_IMM_WLC (IMM_WLC)
CSC_PDD (CSC_PDD) CSC_FISH_PDD (FISH_WLC)
18 CSC_IMM_WLC (CSC_WLC)
CSC_IMM_WLC (CSC_WLC)
IMM_WLC (IMM_WLC) CSC_NMP22_WLC (CSC_WLC)
19 CSC_CTL_PDD (CSC_WLC)
CSC_CTL_PDD (CSC_WLC)
CSC_NMP22_WLC (NMP22_WLC)
CSC_PDD (CSC_WLC)
20 CSC_CTL_PDD (CTL_WLC)
CSC_CTL_PDD (CTL_WLC)
CSC_NMP22_WLC (CSC_WLC)
CSC_IMM_WLC (CSC_WLC)
21 CSC_FISH_PDD (FISH_WLC)
CSC_FISH_PDD (FISH_WLC)
CSC_CTL_WLC (CTL_WLC)
CSC_NMP22_PDD (NMP22_WLC)
22 CSC_FISH_PDD (CSC_WLC)
CSC_FISH_PDD (CSC_WLC)
CSC_CTL_WLC (CSC_WLC)
CSC_CTL_PDD (CSC_WLC)
23 CSC_NMP22_PDD (NMP22_WLC)
CSC_NMP22_PDD (NMP22_WLC)
FISH_WLC (FISH_WLC) CSC_IMM_PDD (IMM_WLC)
24 CSC_NMP22_PDD (CSC_WLC)
CSC_NMP22_PDD (CSC_WLC)
NMP22_WLC (NMP22_WLC)
CSC_FISH_PDD (CSC_WLC)
25 CSC_IMM_PDD (IMM_WLC)
CSC_IMM_PDD (IMM_WLC)
CSC_WLC (CSC_WLC) CSC_NMP22_PDD (CSC_WLC)
26 CSC_IMM_PDD (CSC_WLC)
CSC_IMM_PDD (CSC_WLC)
CTL_PDD (CTL_WLC) CSC_IMM_PDD (CSC_WLC)

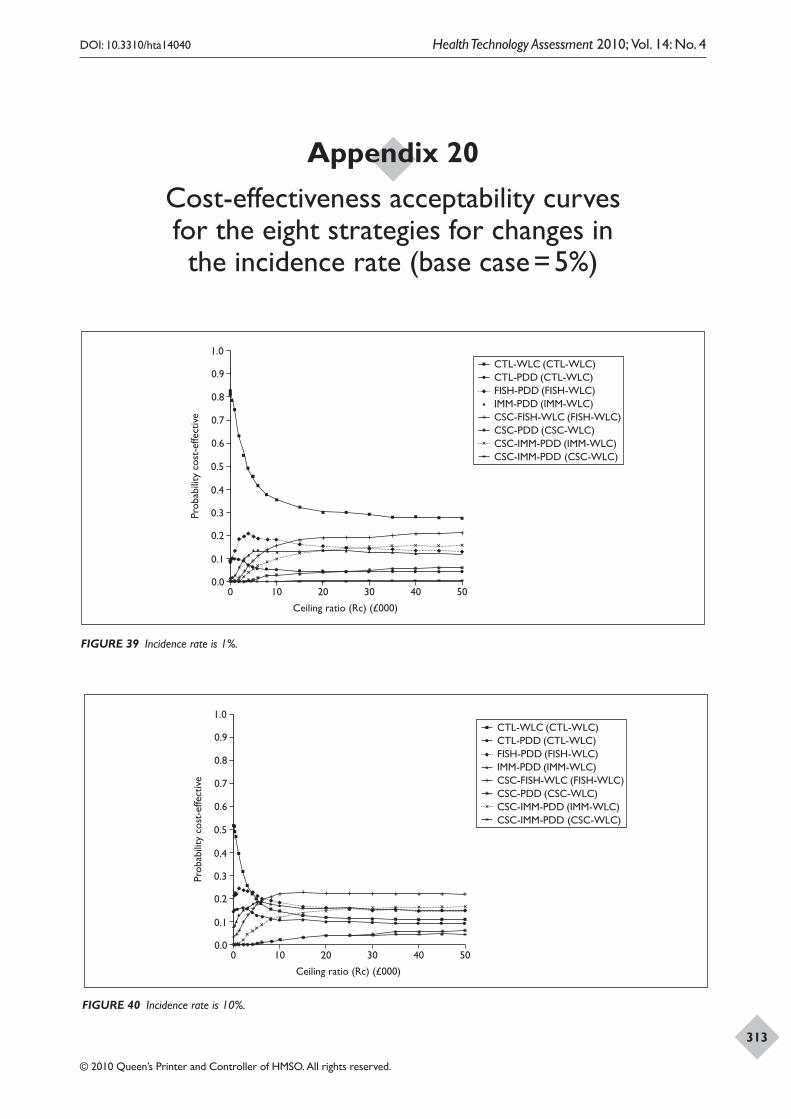
DOI: 10.3310/hta14040 Health Technology Assessment 2010; Vol. 14: No. 4
© 2010 Queen’s Printer and Controller of HMSO. All rights reserved.
313
Appendix 20 Cost-effectiveness acceptability curves for the eight strategies for changes in the incidence rate (base case = 5%)
+
+ +
+ +
+
+ + + + + + + +
+ + +
+ +
+
+ + + + + + + + + + + + + + + + + + + + + + + + + + + + + + + + + + + + + + +
+ + + + +
+ + + + + + + +
Prob
abili
ty c
ost-
effe
ctiv
e
Ceiling ratio (Rc) (£000)
0 10 20 30 40 50
CTL-WLC (CTL-WLC)CTL-PDD (CTL-WLC)FISH-PDD (FISH-WLC)IMM-PDD (IMM-WLC)CSC-FISH-WLC (FISH-WLC)CSC-PDD (CSC-WLC)CSC-IMM-PDD (IMM-WLC)CSC-IMM-PDD (CSC-WLC)
0.0
0.2
0.1
0.3
0.4
0.5
0.9
0.8
0.7
0.6
1.0
+
+ + + +
+ + + + + + + + + + + + + +
+ +
+
+ + + + + + + + + + + + + + + + + + + + + + + + + + + + + + + + + +
+ + + + + + +
+ + + + + + + + + + +
Prob
abili
ty c
ost-
effe
ctiv
e
Ceiling ratio (Rc) (£000)
0 10 20 30 40 50
CTL-WLC (CTL-WLC)CTL-PDD (CTL-WLC)FISH-PDD (FISH-WLC)IMM-PDD (IMM-WLC)CSC-FISH-WLC (FISH-WLC)CSC-PDD (CSC-WLC)CSC-IMM-PDD (IMM-WLC)CSC-IMM-PDD (CSC-WLC)
0.0
0.2
0.1
0.3
0.4
0.5
0.9
0.8
0.7
0.6
1.0
FIGURE 39 Incidence rate is 1%.
FIGURE 40 Incidence rate is 10%.
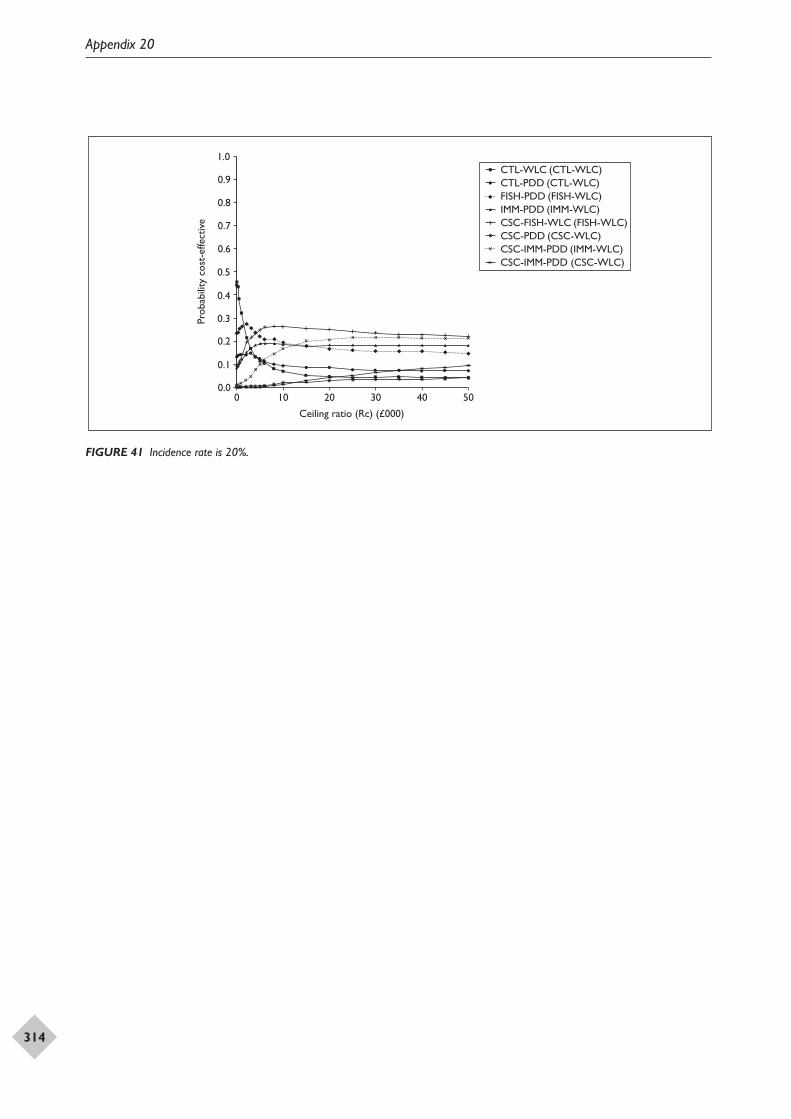
Appendix 20
314
+
+ + + +
+ + + + + + + + + + + + + + +
+ +
+
+ + + + + + + + + + + + + + + + + + + + + + + + + + + + + + + + + + + + + + + + +
+ +
+ +
+ + + + + + + + +
Prob
abili
ty c
ost-
effe
ctiv
e
Ceiling ratio (Rc) (£000)
0 10 20 30 40 50
CTL-WLC (CTL-WLC)CTL-PDD (CTL-WLC)FISH-PDD (FISH-WLC)IMM-PDD (IMM-WLC)CSC-FISH-WLC (FISH-WLC)CSC-PDD (CSC-WLC)CSC-IMM-PDD (IMM-WLC)CSC-IMM-PDD (CSC-WLC)
0.0
0.2
0.1
0.3
0.4
0.5
0.9
0.8
0.7
0.6
1.0
FIGURE 41 Incidence rate is 20%.
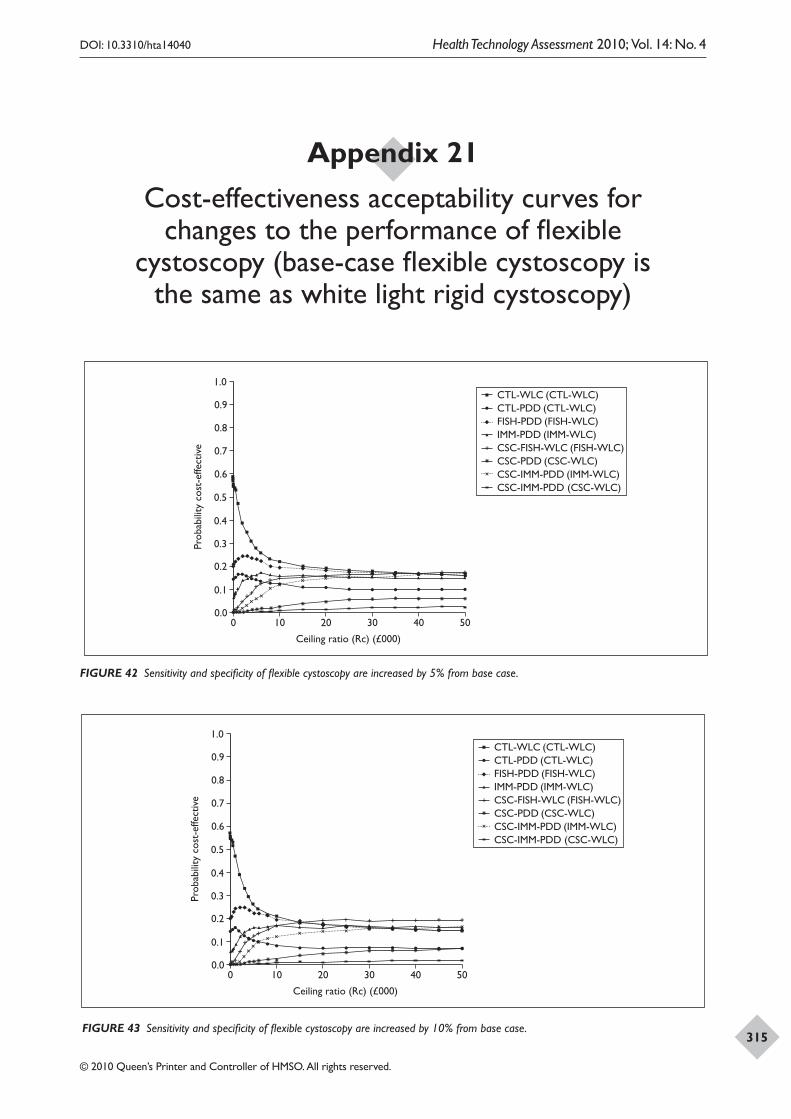
DOI: 10.3310/hta14040 Health Technology Assessment 2010; Vol. 14: No. 4
© 2010 Queen’s Printer and Controller of HMSO. All rights reserved.
315
Appendix 21 Cost-effectiveness acceptability curves for
changes to the performance of flexible cystoscopy (base-case flexible cystoscopy is
the same as white light rigid cystoscopy)
+
+ + + +
+ + + + + + + + + + + + + +
+ +
+
+ + + + + + + + + + + + + + + + + +
+ + + + + + + + + + + + + + + + + +
+ + + + + + + + +
+ + + + + + + + + +
Prob
abili
ty c
ost-
effe
ctiv
e
Ceiling ratio (Rc) (£000)
0 10 20 30 40 50
CTL-WLC (CTL-WLC)CTL-PDD (CTL-WLC)FISH-PDD (FISH-WLC)IMM-PDD (IMM-WLC)CSC-FISH-WLC (FISH-WLC)CSC-PDD (CSC-WLC)CSC-IMM-PDD (IMM-WLC)CSC-IMM-PDD (CSC-WLC)
0.0
0.2
0.1
0.3
0.4
0.5
0.9
0.8
0.7
0.6
1.0
+
+ + + +
+ + + + + + + + + + + + + + +
+ +
+
+ + + + + + + + + + + + + + + + + +
+ + + + + + + + + + + + + + + + + +
+ + + + + + + + +
+ + + +
+ + + + + +
Prob
abili
ty c
ost-
effe
ctiv
e
Ceiling ratio (Rc) (£000)
0 10 20 30 40 50
CTL-WLC (CTL-WLC)CTL-PDD (CTL-WLC)FISH-PDD (FISH-WLC)IMM-PDD (IMM-WLC)CSC-FISH-WLC (FISH-WLC)CSC-PDD (CSC-WLC)CSC-IMM-PDD (IMM-WLC)CSC-IMM-PDD (CSC-WLC)
0.0
0.2
0.1
0.3
0.4
0.5
0.9
0.8
0.7
0.6
1.0
FIGURE 42 Sensitivity and specificity of flexible cystoscopy are increased by 5% from base case.
FIGURE 43 Sensitivity and specificity of flexible cystoscopy are increased by 10% from base case.

Appendix 21
316
+
+ + + + + + + + + + + + + + +
+ + +
+ +
+
+ + + + + + + + + + + + + + + + + + + + + + + + + + + +
+ + + + + + + +
+ + + + + +
+ + + + + + + + + + + +
Prob
abili
ty c
ost-
effe
ctiv
e
Ceiling ratio (Rc) (£000)
0 10 20 30 40 50
CTL-WLC (CTL-WLC)CTL-PDD (CTL-WLC)FISH-PDD (FISH-WLC)IMM-PDD (IMM-WLC)CSC-FISH-WLC (FISH-WLC)CSC-PDD (CSC-WLC)CSC-IMM-PDD (IMM-WLC)CSC-IMM-PDD (CSC-WLC)
0.0
0.2
0.1
0.3
0.4
0.5
0.9
0.8
0.7
0.6
1.0
FIGURE 44 Sensitivity and specificity of flexible cystoscopy are increased by 25% from base case.
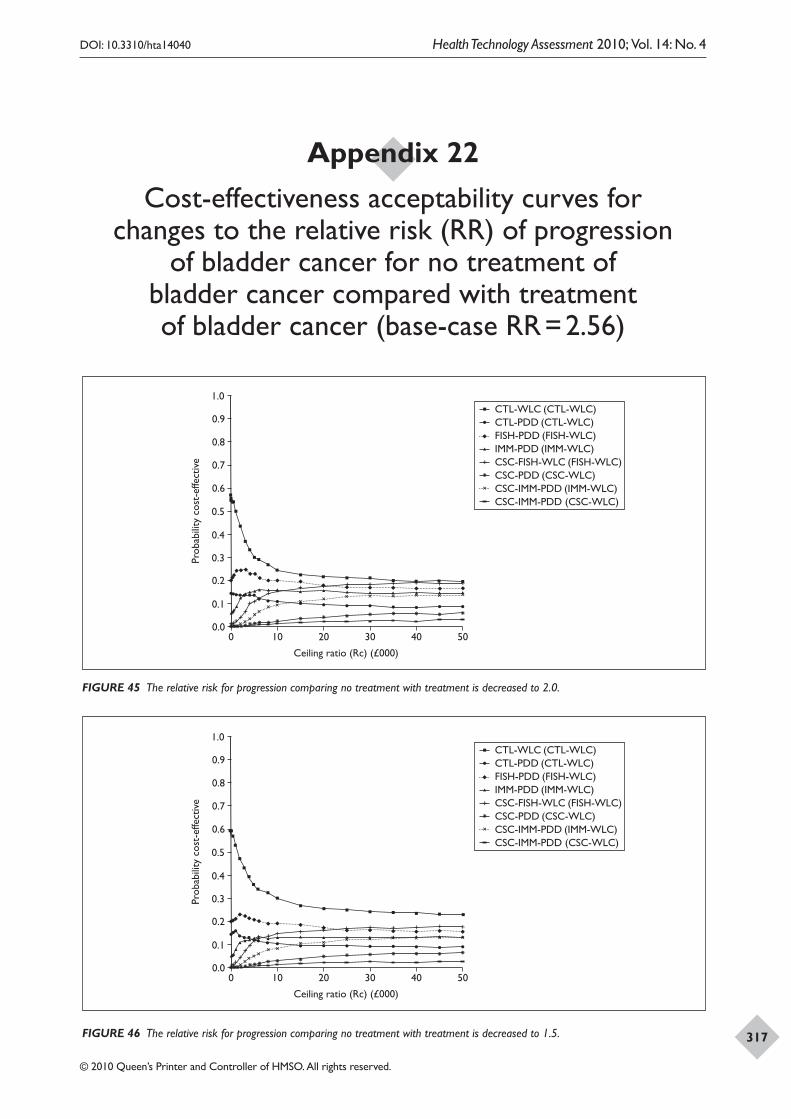
DOI: 10.3310/hta14040 Health Technology Assessment 2010; Vol. 14: No. 4
© 2010 Queen’s Printer and Controller of HMSO. All rights reserved.
317
Appendix 22 Cost-effectiveness acceptability curves for
changes to the relative risk (RR) of progression of bladder cancer for no treatment of
bladder cancer compared with treatment of bladder cancer (base-case RR = 2.56)
+
+ + + + + + + + +
+ + + + + + + + + +
+ +
+
+ + + + + + + + + + + + + + + + + +
+ + + + + + + + + + + + + + + + + +
+ + + + + + + + +
+ + + + + + + + + +
Prob
abili
ty c
ost-
effe
ctiv
e
Ceiling ratio (Rc) (£000)
0 10 20 30 40 50
CTL-WLC (CTL-WLC)CTL-PDD (CTL-WLC)FISH-PDD (FISH-WLC)IMM-PDD (IMM-WLC)CSC-FISH-WLC (FISH-WLC)CSC-PDD (CSC-WLC)CSC-IMM-PDD (IMM-WLC)CSC-IMM-PDD (CSC-WLC)
0.0
0.2
0.1
0.3
0.4
0.5
0.9
0.8
0.7
0.6
1.0
+
+ + + +
+ +
+ + + + + + + + + + +
+ +
+ +
+
+ + + + + + + + + + + + + + + + + + + + + + + + + + + + + + + + + + + +
+ + + + + + + + +
+ + + + + + + + + +
Prob
abili
ty c
ost-
effe
ctiv
e
Ceiling ratio (Rc) (£000)
0 10 20 30 40 50
CTL-WLC (CTL-WLC)CTL-PDD (CTL-WLC)FISH-PDD (FISH-WLC)IMM-PDD (IMM-WLC)CSC-FISH-WLC (FISH-WLC)CSC-PDD (CSC-WLC)CSC-IMM-PDD (IMM-WLC)CSC-IMM-PDD (CSC-WLC)
0.0
0.2
0.1
0.3
0.4
0.5
0.9
0.8
0.7
0.6
1.0
FIGURE 45 The relative risk for progression comparing no treatment with treatment is decreased to 2.0.
FIGURE 46 The relative risk for progression comparing no treatment with treatment is decreased to 1.5.
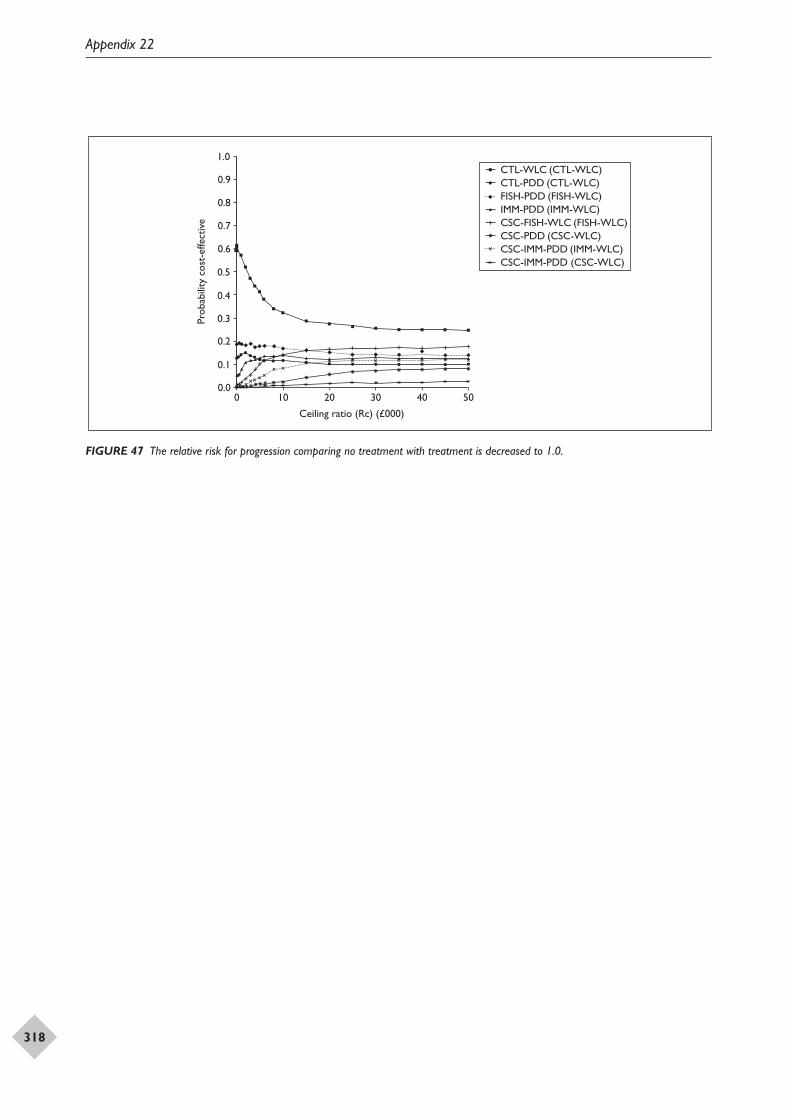
Appendix 22
318
+
+ + + + + + +
+ + +
+ + + + + + + +
+ +
+
+ + + + + + + + + + + + + + + + + +
+ + + + + + + + + + + + + + + + + +
+ + + + + + + + +
+ + + + + + + + + +
Prob
abili
ty c
ost-
effe
ctiv
e
Ceiling ratio (Rc) (£000)
0 10 20 30 40 50
CTL-WLC (CTL-WLC)CTL-PDD (CTL-WLC)FISH-PDD (FISH-WLC)IMM-PDD (IMM-WLC)CSC-FISH-WLC (FISH-WLC)CSC-PDD (CSC-WLC)CSC-IMM-PDD (IMM-WLC)CSC-IMM-PDD (CSC-WLC)
0.0
0.2
0.1
0.3
0.4
0.5
0.9
0.8
0.7
0.6
1.0
FIGURE 47 The relative risk for progression comparing no treatment with treatment is decreased to 1.0.

DOI: 10.3310/hta14040 Health Technology Assessment 2010; Vol. 14: No. 4
© 2010 Queen’s Printer and Controller of HMSO. All rights reserved.
319
Appendix 23 Cost-effectiveness acceptability curves
for the eight strategies for changes in the relative risk (RR) for recurrence comparing
PDD with WLC (base-case RR = 1)
+
+ + + +
+ +
+ + +
+ + + + + + + + +
+ +
+
+ + + + + + + + + + + + + + + + + + + + + + + + + + + + + + + + + + + +
+ + + + + + + + +
+ + + + + + + + + + +
Prob
abili
ty c
ost-
effe
ctiv
e
Ceiling ratio (Rc) (£000)
0 10 20 30 40 50
CTL-WLC (CTL-WLC)CTL-PDD (CTL-WLC)FISH-PDD (FISH-WLC)IMM-PDD (IMM-WLC)CSC-FISH-WLC (FISH-WLC)CSC-PDD (CSC-WLC)CSC-IMM-PDD (IMM-WLC)CSC-IMM-PDD (CSC-WLC)
0.0
0.2
0.1
0.3
0.4
0.5
0.9
0.8
0.7
0.6
1.0
+
+ + + +
+ +
+ + + + + + + + +
+ +
+
+ + + + + + + + + + + + + + + + + + + + + + + + + + + + + + + + + + + +
+ + + + + + + + +
+ + + + + + + + + + +
Prob
abili
ty c
ost-
effe
ctiv
e
Ceiling ratio (Rc) (£000)
0 10 20 30 40 50
CTL-WLC (CTL-WLC)CTL-PDD (CTL-WLC)FISH-PDD (FISH-WLC)IMM-PDD (IMM-WLC)CSC-FISH-WLC (FISH-WLC)CSC-PDD (CSC-WLC)CSC-IMM-PDD (IMM-WLC)CSC-IMM-PDD (CSC-WLC)
0.0
0.2
0.1
0.3
0.4
0.5
0.9
0.8
0.7
0.6
1.0
FIGURE 49 The relative risk for recurrence for the comparison of PDD with WLC is 0.8.
FIGURE 48 The relative risk for recurrence for the comparison of PDD with WLC is 0.9.
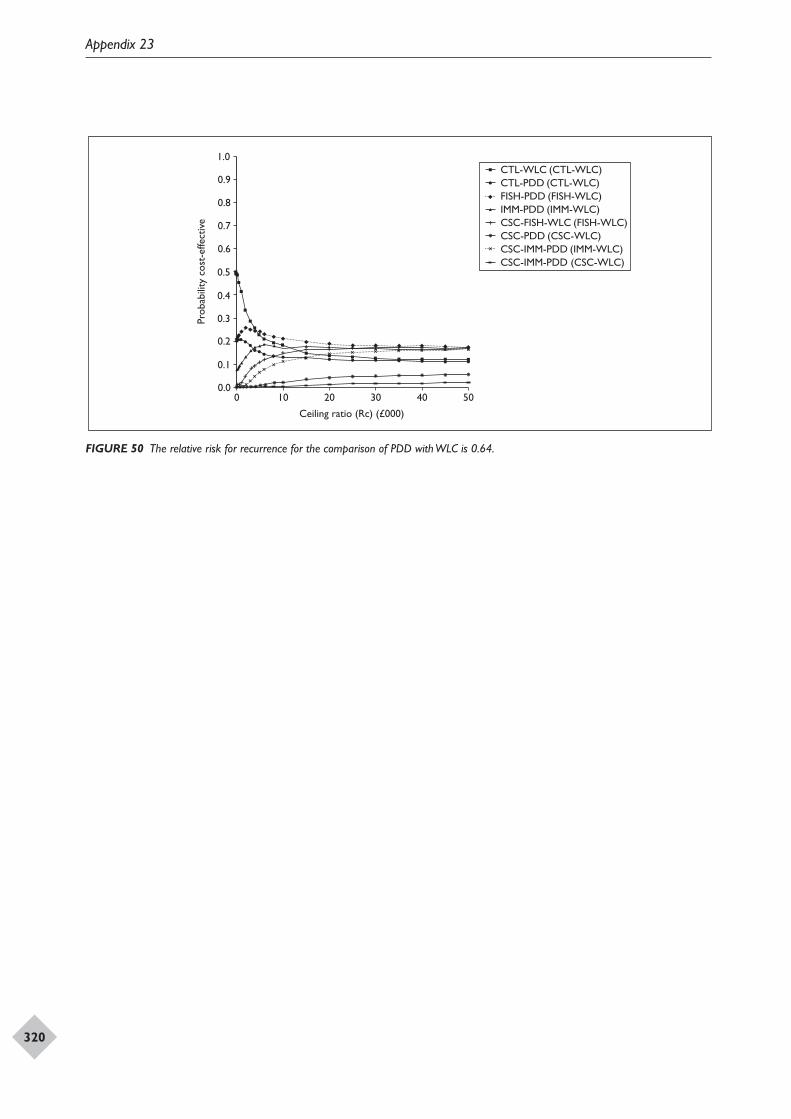
Appendix 23
320
+
+ + + +
+ + + + + + + + + + + + + +
+ +
+
+ + + + + + + + + + + + + + + + + + + + + + + + + + + + + + + + + + + +
+ + + + + + + + +
+ + + + + + + + + +
Prob
abili
ty c
ost-
effe
ctiv
e
Ceiling ratio (Rc) (£000)
0 10 20 30 40 50
CTL-WLC (CTL-WLC)CTL-PDD (CTL-WLC)FISH-PDD (FISH-WLC)IMM-PDD (IMM-WLC)CSC-FISH-WLC (FISH-WLC)CSC-PDD (CSC-WLC)CSC-IMM-PDD (IMM-WLC)CSC-IMM-PDD (CSC-WLC)
0.0
0.2
0.1
0.3
0.4
0.5
0.9
0.8
0.7
0.6
1.0
FIGURE 50 The relative risk for recurrence for the comparison of PDD with WLC is 0.64.
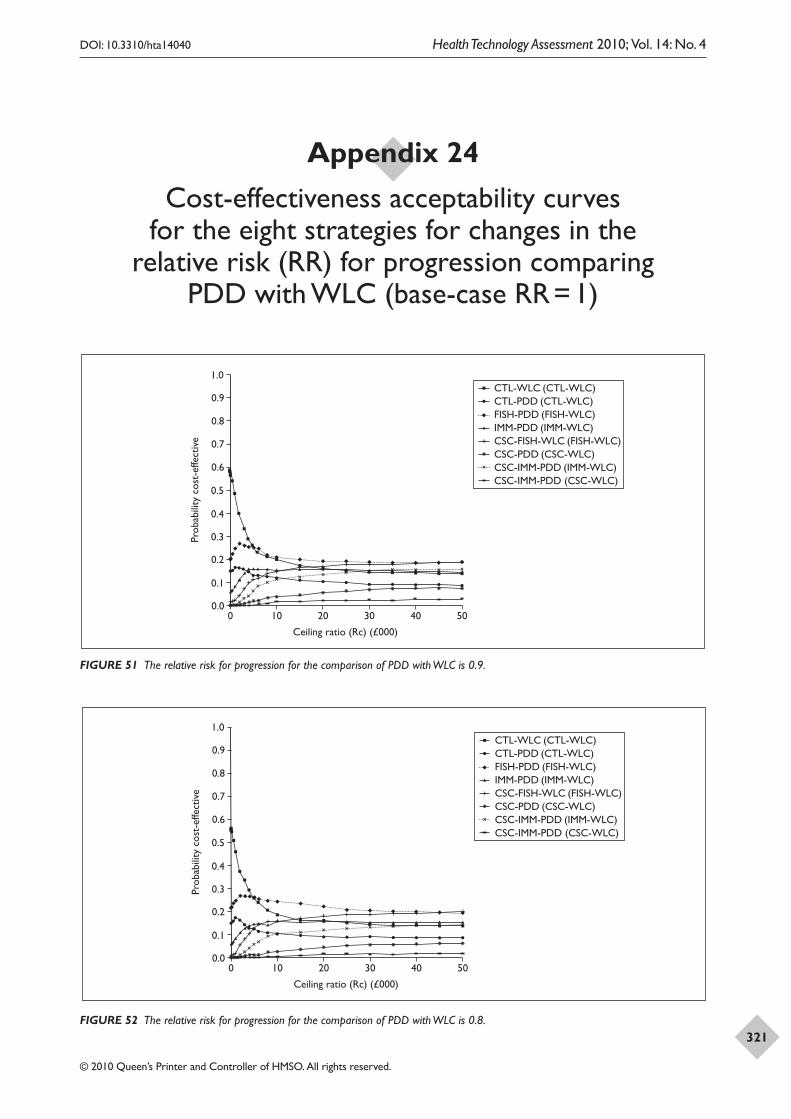
DOI: 10.3310/hta14040 Health Technology Assessment 2010; Vol. 14: No. 4
© 2010 Queen’s Printer and Controller of HMSO. All rights reserved.
321
Appendix 24 Cost-effectiveness acceptability curves
for the eight strategies for changes in the relative risk (RR) for progression comparing
PDD with WLC (base-case RR = 1)
+
+ + + + + + + +
+ + + + + + + +
+ +
+ +
+
+ + + + + + + + + + + + + + + + + +
+ + + + + + + + + + + + + + + + + +
+ + + + + + + + +
+ + +
+ + + + + + +
Prob
abili
ty c
ost-
effe
ctiv
e
Ceiling ratio (Rc) (£000)
0 10 20 30 40 50
CTL-WLC (CTL-WLC)CTL-PDD (CTL-WLC)FISH-PDD (FISH-WLC)IMM-PDD (IMM-WLC)CSC-FISH-WLC (FISH-WLC)CSC-PDD (CSC-WLC)CSC-IMM-PDD (IMM-WLC)CSC-IMM-PDD (CSC-WLC)
0.0
0.2
0.1
0.3
0.4
0.5
0.9
0.8
0.7
0.6
1.0
+
+ + + +
+ + + + + +
+ + + + + + + +
+ +
+
+ + + + + + + + + + + + + + + + + + + + + + + + + + + + + + + + + + + +
+ + + + + + + + +
+ + + + + + + + + +
Prob
abili
ty c
ost-
effe
ctiv
e
Ceiling ratio (Rc) (£000)
0 10 20 30 40 50
CTL-WLC (CTL-WLC)CTL-PDD (CTL-WLC)FISH-PDD (FISH-WLC)IMM-PDD (IMM-WLC)CSC-FISH-WLC (FISH-WLC)CSC-PDD (CSC-WLC)CSC-IMM-PDD (IMM-WLC)CSC-IMM-PDD (CSC-WLC)
0.0
0.2
0.1
0.3
0.4
0.5
0.9
0.8
0.7
0.6
1.0
FIGURE 51 The relative risk for progression for the comparison of PDD with WLC is 0.9.
FIGURE 52 The relative risk for progression for the comparison of PDD with WLC is 0.8.
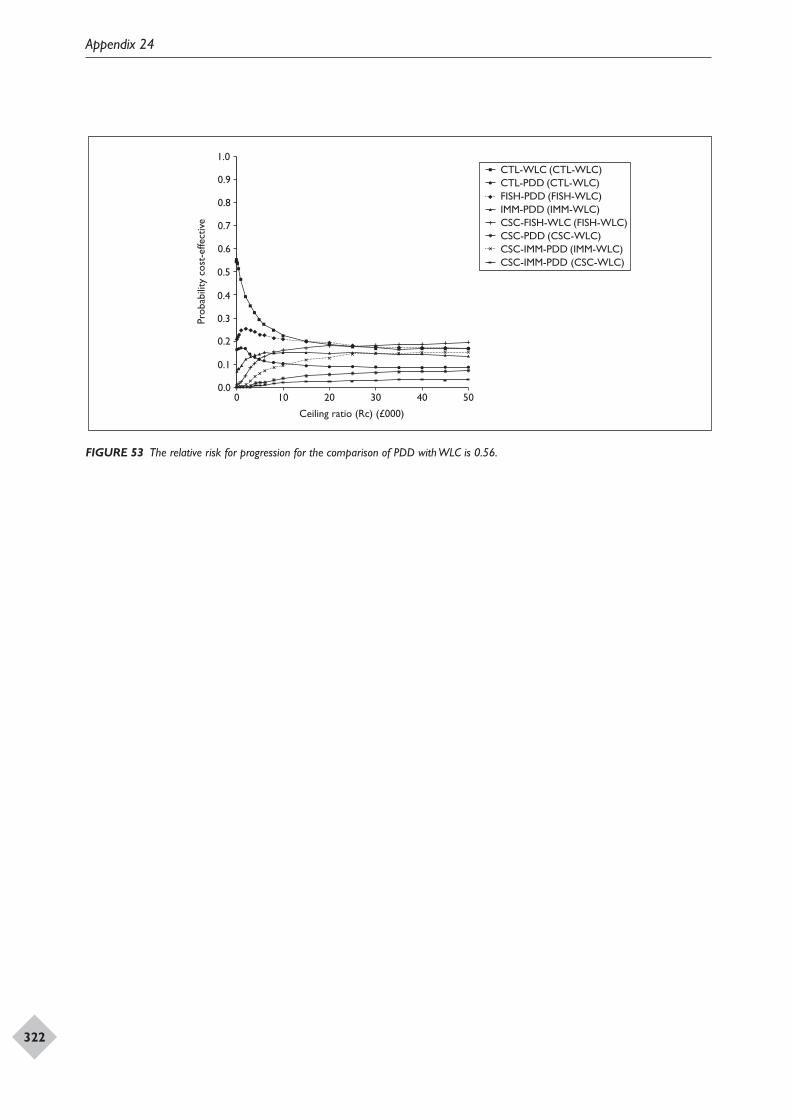
Appendix 24
322
+
+ + + +
+ + + + + + + + + + + +
+ +
+ +
+
+ + + + + + + + + + + + + + + + + + + + + + + + + + + + + + + + + + + +
+ + + + + + + + +
+ + + + + + + + + +
Prob
abili
ty c
ost-
effe
ctiv
e
Ceiling ratio (Rc) (£000)
0 10 20 30 40 50
CTL-WLC (CTL-WLC)CTL-PDD (CTL-WLC)FISH-PDD (FISH-WLC)IMM-PDD (IMM-WLC)CSC-FISH-WLC (FISH-WLC)CSC-PDD (CSC-WLC)CSC-IMM-PDD (IMM-WLC)CSC-IMM-PDD (CSC-WLC)
0.0
0.2
0.1
0.3
0.4
0.5
0.9
0.8
0.7
0.6
1.0
FIGURE 53 The relative risk for progression for the comparison of PDD with WLC is 0.56.
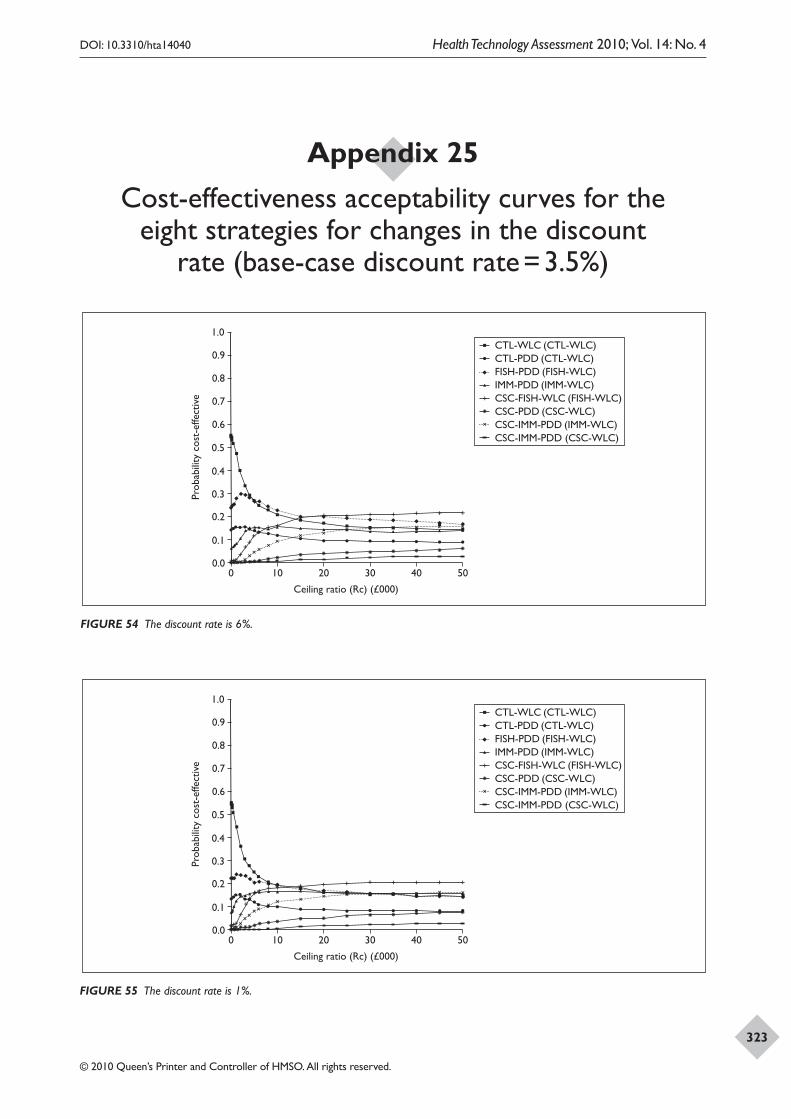
DOI: 10.3310/hta14040 Health Technology Assessment 2010; Vol. 14: No. 4
© 2010 Queen’s Printer and Controller of HMSO. All rights reserved.
323
Appendix 25 Cost-effectiveness acceptability curves for the
eight strategies for changes in the discount rate (base-case discount rate = 3.5%)
+
+ + + +
+ + + +
+ + + + + + + +
+ +
+ +
+
+ + + + + + + + + + + + + + + + + +
+ + + + + + + + + + + + + + + + + +
+ + + + + + + + +
+ + + + + + + + + +
Prob
abili
ty c
ost-
effe
ctiv
e
Ceiling ratio (Rc) (£000)
0 10 20 30 40 50
CTL-WLC (CTL-WLC)CTL-PDD (CTL-WLC)FISH-PDD (FISH-WLC)IMM-PDD (IMM-WLC)CSC-FISH-WLC (FISH-WLC)CSC-PDD (CSC-WLC)CSC-IMM-PDD (IMM-WLC)CSC-IMM-PDD (CSC-WLC)
0.0
0.2
0.1
0.3
0.4
0.5
0.9
0.8
0.7
0.6
1.0
+
+ + + + + +
+ +
+ + + + + + + + + + + +
+ +
+
+ + + + + + + + + + + + + + + + + +
+ + + + + + + + + + + + + + + + + +
+ + + + + + + + +
+ + + +
+ +
+ + + + + +
Prob
abili
ty c
ost-
effe
ctiv
e
Ceiling ratio (Rc) (£000)
0 10 20 30 40 50
CTL-WLC (CTL-WLC)CTL-PDD (CTL-WLC)FISH-PDD (FISH-WLC)IMM-PDD (IMM-WLC)CSC-FISH-WLC (FISH-WLC)CSC-PDD (CSC-WLC)CSC-IMM-PDD (IMM-WLC)CSC-IMM-PDD (CSC-WLC)
0.0
0.2
0.1
0.3
0.4
0.5
0.9
0.8
0.7
0.6
1.0
FIGURE 54 The discount rate is 6%.
FIGURE 55 The discount rate is 1%.
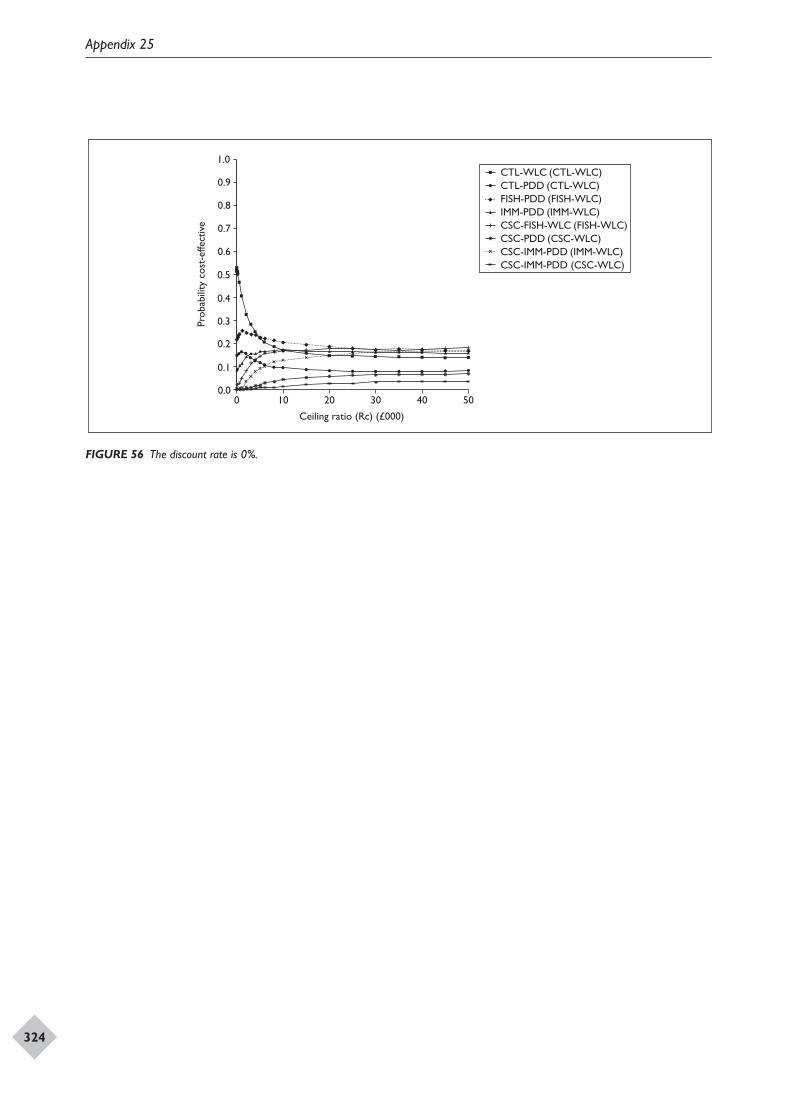
Appendix 25
324
+
+ + + +
+ + + + + + + + + + + + + +
+ +
+
+ + + + + + + + + + + + + + + + + + + + + + + + + + + + + + + + + + + +
+ + + + + + + + +
+ + +
+
+ + + + + + +
Prob
abili
ty c
ost-
effe
ctiv
e
Ceiling ratio (Rc) (£000)
0 10 20 30 40 50
CTL-WLC (CTL-WLC)CTL-PDD (CTL-WLC)FISH-PDD (FISH-WLC)IMM-PDD (IMM-WLC)CSC-FISH-WLC (FISH-WLC)CSC-PDD (CSC-WLC)CSC-IMM-PDD (IMM-WLC)CSC-IMM-PDD (CSC-WLC)
0.0
0.2
0.1
0.3
0.4
0.5
0.9
0.8
0.7
0.6
1.0
FIGURE 56 The discount rate is 0%.
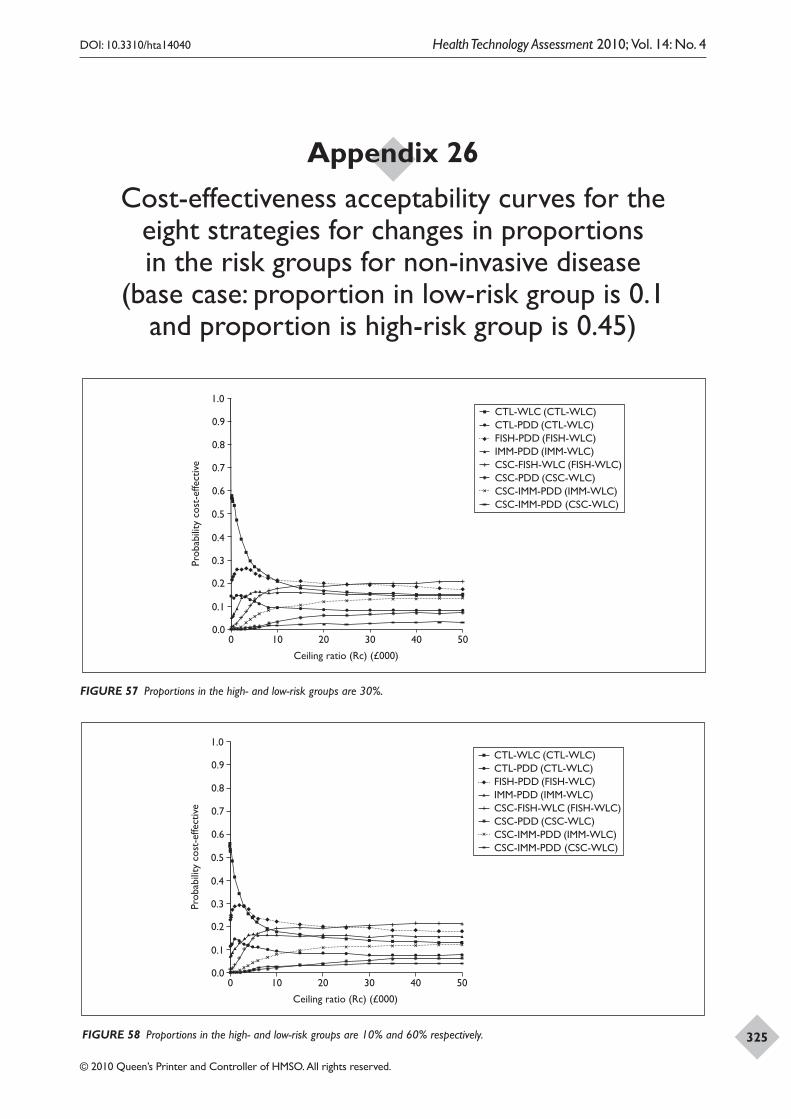
DOI: 10.3310/hta14040 Health Technology Assessment 2010; Vol. 14: No. 4
© 2010 Queen’s Printer and Controller of HMSO. All rights reserved.
325
Appendix 26 Cost-effectiveness acceptability curves for the
eight strategies for changes in proportions in the risk groups for non-invasive disease
(base case: proportion in low-risk group is 0.1 and proportion is high-risk group is 0.45)
+
+ + + +
+ +
+ + + + + + + + + + + +
+ +
+
+ + + + + + + + + + + + + + + + + +
+ + + + + + + + + + + + + + + + + +
+ + + + + + + + +
+ + + + + + + + + +
Prob
abili
ty c
ost-
effe
ctiv
e
Ceiling ratio (Rc) (£000)
0 10 20 30 40 50
CTL-WLC (CTL-WLC)CTL-PDD (CTL-WLC)FISH-PDD (FISH-WLC)IMM-PDD (IMM-WLC)CSC-FISH-WLC (FISH-WLC)CSC-PDD (CSC-WLC)CSC-IMM-PDD (IMM-WLC)CSC-IMM-PDD (CSC-WLC)
0.0
0.2
0.1
0.3
0.4
0.5
0.9
0.8
0.7
0.6
1.0
+
+ + + + +
+ + + + + + + + + + + + + +
+ +
+
+ + + + + + + + + + + + + + + + + +
+ + + + + + + + + + + + + + + + + +
+ + + + + + + + +
+ + + + + + + + + +
Prob
abili
ty c
ost-
effe
ctiv
e
Ceiling ratio (Rc) (£000)
0 10 20 30 40 50
CTL-WLC (CTL-WLC)CTL-PDD (CTL-WLC)FISH-PDD (FISH-WLC)IMM-PDD (IMM-WLC)CSC-FISH-WLC (FISH-WLC)CSC-PDD (CSC-WLC)CSC-IMM-PDD (IMM-WLC)CSC-IMM-PDD (CSC-WLC)
0.0
0.2
0.1
0.3
0.4
0.5
0.9
0.8
0.7
0.6
1.0
FIGURE 57 Proportions in the high- and low-risk groups are 30%.
FIGURE 58 Proportions in the high- and low-risk groups are 10% and 60% respectively.

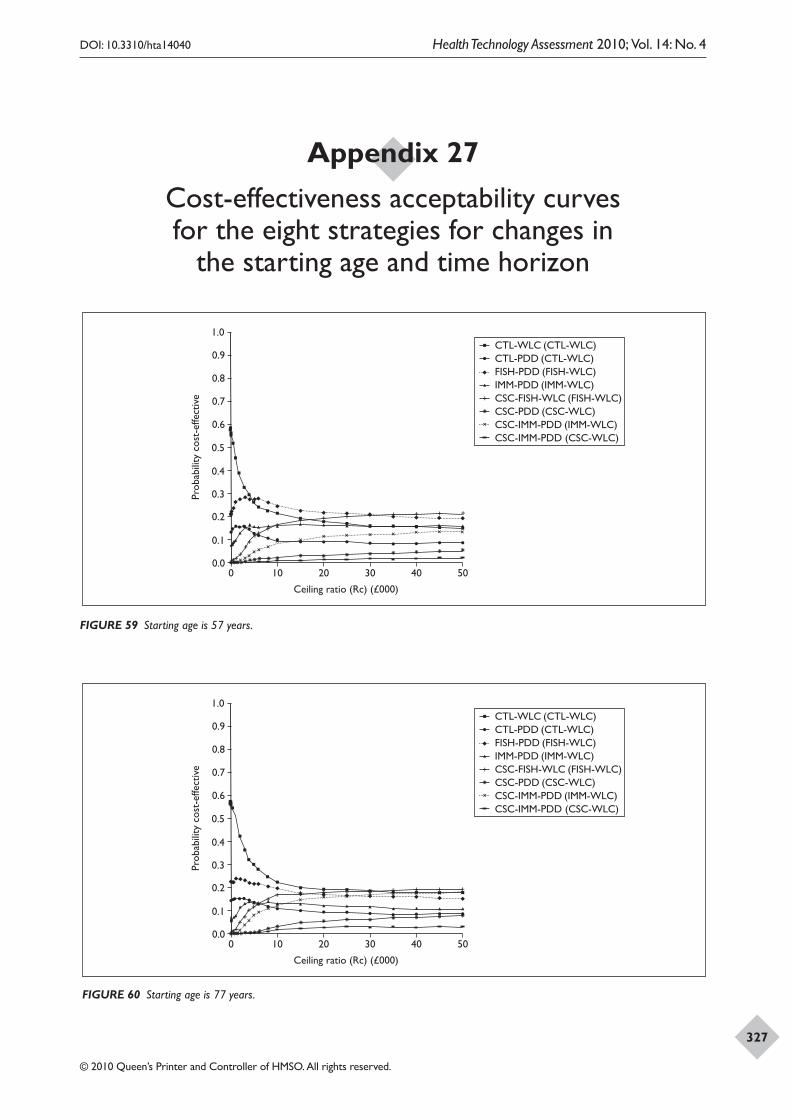
DOI: 10.3310/hta14040 Health Technology Assessment 2010; Vol. 14: No. 4
© 2010 Queen’s Printer and Controller of HMSO. All rights reserved.
327
Appendix 27 Cost-effectiveness acceptability curves for the eight strategies for changes in
the starting age and time horizon
+
+ + + + + +
+ + +
+ + + + + + + +
+
+ +
+
+ + + + + + + + + + + + + + + + + + + + + + + + + + + + + + + + + + + +
+ + + + + + + + +
+ + + + + + + + + +
Prob
abili
ty c
ost-
effe
ctiv
e
Ceiling ratio (Rc) (£000)
0 10 20 30 40 50
CTL-WLC (CTL-WLC)CTL-PDD (CTL-WLC)FISH-PDD (FISH-WLC)IMM-PDD (IMM-WLC)CSC-FISH-WLC (FISH-WLC)CSC-PDD (CSC-WLC)CSC-IMM-PDD (IMM-WLC)CSC-IMM-PDD (CSC-WLC)
0.0
0.2
0.1
0.3
0.4
0.5
0.9
0.8
0.7
0.6
1.0
+
+ + + +
+ + + + + + + + + + + + + + +
+ +
+
+ + + + + + + + + + + + + + + + + +
+ + + + + + + + + + + + + + + + + +
+ + + + + + + + +
+ + + + +
+ + + + +
Prob
abili
ty c
ost-
effe
ctiv
e
Ceiling ratio (Rc) (£000)
0 10 20 30 40 50
CTL-WLC (CTL-WLC)CTL-PDD (CTL-WLC)FISH-PDD (FISH-WLC)IMM-PDD (IMM-WLC)CSC-FISH-WLC (FISH-WLC)CSC-PDD (CSC-WLC)CSC-IMM-PDD (IMM-WLC)CSC-IMM-PDD (CSC-WLC)
0.0
0.2
0.1
0.3
0.4
0.5
0.9
0.8
0.7
0.6
1.0
FIGURE 59 Starting age is 57 years.
FIGURE 60 Starting age is 77 years.
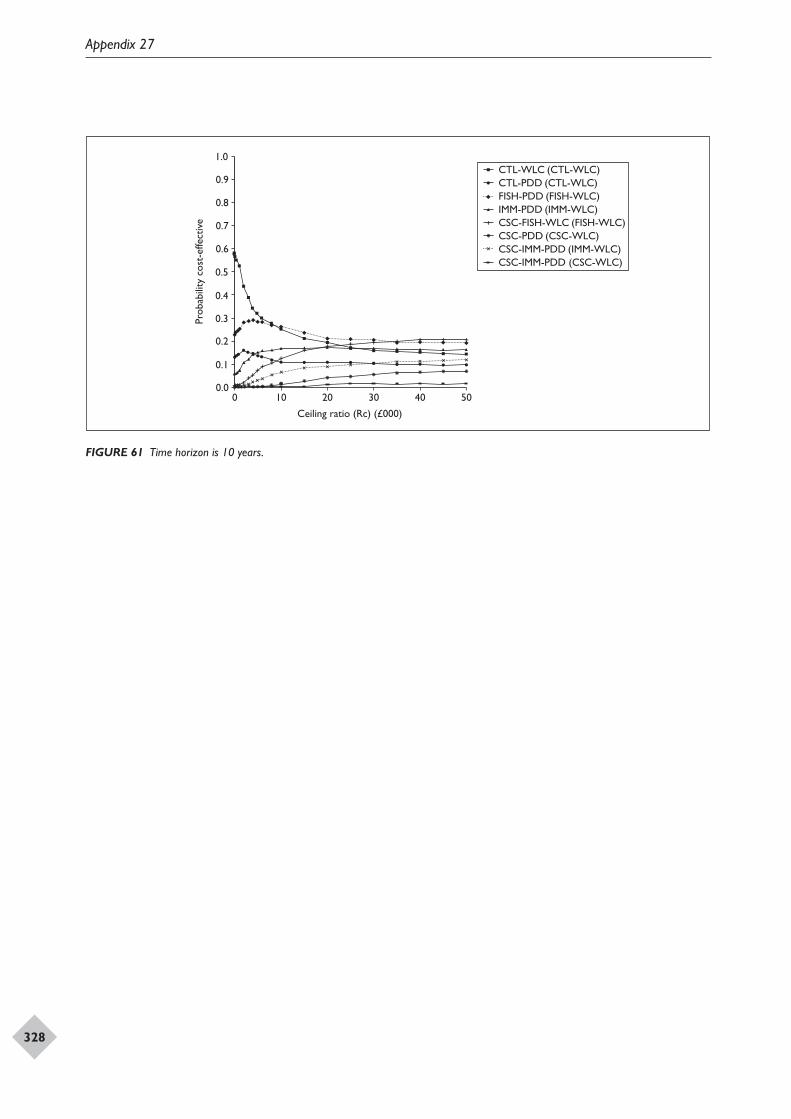
Appendix 27
328
+
+ + + + + + + + + + +
+ + + + + + + +
+ +
+
+ + + + + + + + + + + + + + + + + +
+ + + + + + + + + + + + + + + + + + + + + + + + + + + + +
+ + + + + + + + + +
Prob
abili
ty c
ost-
effe
ctiv
e
Ceiling ratio (Rc) (£000)
0 10 20 30 40 50
CTL-WLC (CTL-WLC)CTL-PDD (CTL-WLC)FISH-PDD (FISH-WLC)IMM-PDD (IMM-WLC)CSC-FISH-WLC (FISH-WLC)CSC-PDD (CSC-WLC)CSC-IMM-PDD (IMM-WLC)CSC-IMM-PDD (CSC-WLC)
0.0
0.2
0.1
0.3
0.4
0.5
0.9
0.8
0.7
0.6
1.0
FIGURE 61 Time horizon is 10 years.
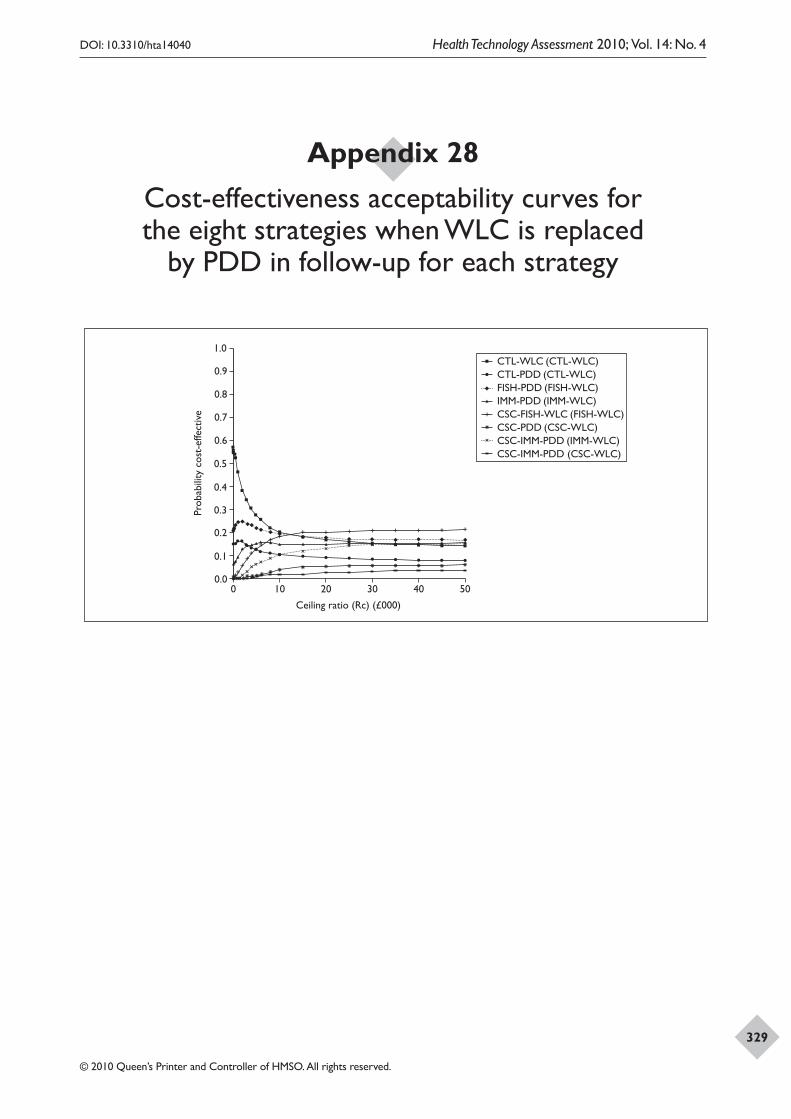
DOI: 10.3310/hta14040 Health Technology Assessment 2010; Vol. 14: No. 4
© 2010 Queen’s Printer and Controller of HMSO. All rights reserved.
329
Appendix 28 Cost-effectiveness acceptability curves for the eight strategies when WLC is replaced
by PDD in follow-up for each strategy
+
+ + + + +
+ + + +
+ + + + + + + + + +
+ +
+
+ + + + + + + + + + + + + + + + + + + + + + + + + + + + + + + + + + + +
+ + + + + + + + +
+ + + + + + + + + +
Prob
abili
ty c
ost-
effe
ctiv
e
Ceiling ratio (Rc) (£000)
0 10 20 30 40 50
CTL-WLC (CTL-WLC)CTL-PDD (CTL-WLC)FISH-PDD (FISH-WLC)IMM-PDD (IMM-WLC)CSC-FISH-WLC (FISH-WLC)CSC-PDD (CSC-WLC)CSC-IMM-PDD (IMM-WLC)CSC-IMM-PDD (CSC-WLC)
0.0
0.2
0.1
0.3
0.4
0.5
0.9
0.8
0.7
0.6
1.0

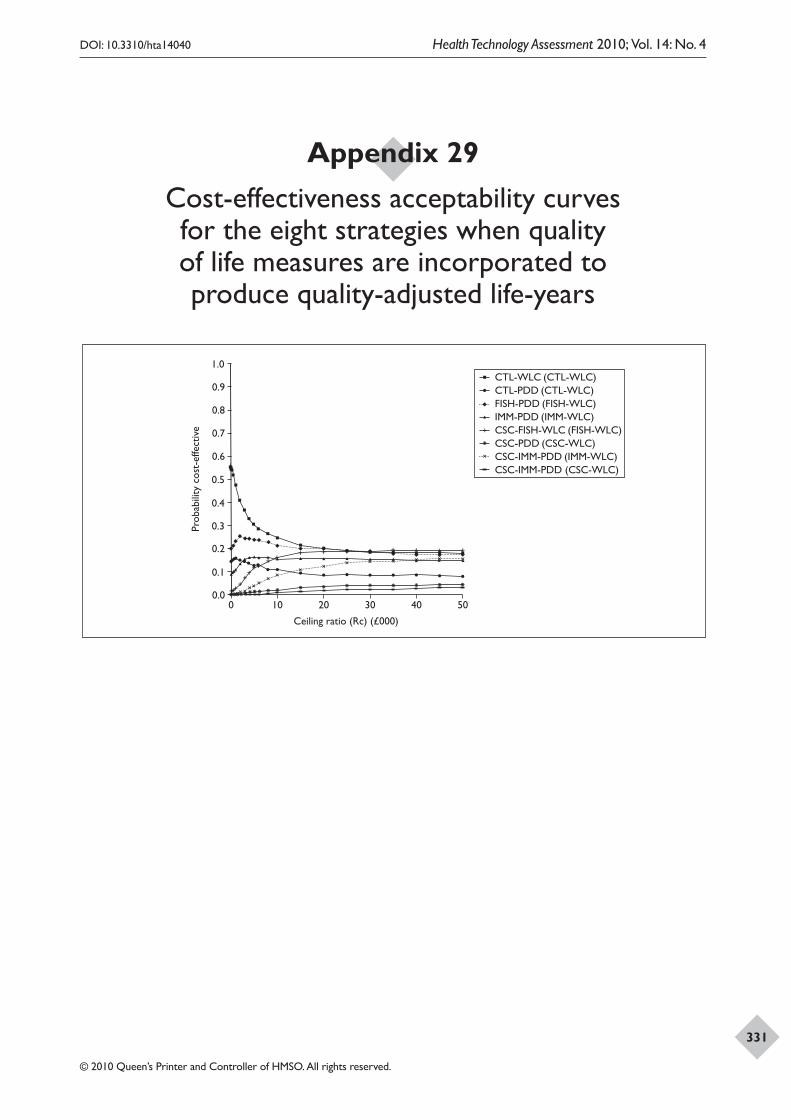
DOI: 10.3310/hta14040 Health Technology Assessment 2010; Vol. 14: No. 4
© 2010 Queen’s Printer and Controller of HMSO. All rights reserved.
331
Appendix 29 Cost-effectiveness acceptability curves for the eight strategies when quality of life measures are incorporated to produce quality-adjusted life-years
+
+ + + + +
+ +
+
+ + + +
+ + + + + + + +
+ +
+
+ + + + + + + + + + + + + + + + + + + + + + + + + + + + + + + + + + +
+ + + + + + + + +
+ + + + + + + + + + +
Prob
abili
ty c
ost-
effe
ctiv
e
Ceiling ratio (Rc) (£000)
0 10 20 30 40 50
CTL-WLC (CTL-WLC)CTL-PDD (CTL-WLC)FISH-PDD (FISH-WLC)IMM-PDD (IMM-WLC)CSC-FISH-WLC (FISH-WLC)CSC-PDD (CSC-WLC)CSC-IMM-PDD (IMM-WLC)CSC-IMM-PDD (CSC-WLC)
0.0
0.2
0.1
0.3
0.4
0.5
0.9
0.8
0.7
0.6
1.0

DOI: 10.3310/hta14040 Health Technology Assessment 2010; Vol. 14: No. 4
© 2010 Queen’s Printer and Controller of HMSO. All rights reserved.
333
Health Technology Assessment reports published to date
Volume 1, 1997
No. 1Home parenteral nutrition: a systematic review.
By Richards DM, Deeks JJ, Sheldon TA, Shaffer JL.
No. 2Diagnosis, management and screening of early localised prostate cancer.
A review by Selley S, Donovan J, Faulkner A, Coast J, Gillatt D.
No. 3The diagnosis, management, treatment and costs of prostate cancer in England and Wales.
A review by Chamberlain J, Melia J, Moss S, Brown J.
No. 4Screening for fragile X syndrome.
A review by Murray J, Cuckle H, Taylor G, Hewison J.
No. 5A review of near patient testing in primary care.
By Hobbs FDR, Delaney BC, Fitzmaurice DA, Wilson S, Hyde CJ, Thorpe GH, et al.
No. 6Systematic review of outpatient services for chronic pain control.
By McQuay HJ, Moore RA, Eccleston C, Morley S, de C Williams AC.
No. 7Neonatal screening for inborn errors of metabolism: cost, yield and outcome.
A review by Pollitt RJ, Green A, McCabe CJ, Booth A, Cooper NJ, Leonard JV, et al.
No. 8Preschool vision screening.
A review by Snowdon SK, Stewart-Brown SL.
No. 9Implications of socio-cultural contexts for the ethics of clinical trials.
A review by Ashcroft RE, Chadwick DW, Clark SRL, Edwards RHT, Frith L, Hutton JL.
No. 10A critical review of the role of neonatal hearing screening in the detection of congenital hearing impairment.
By Davis A, Bamford J, Wilson I, Ramkalawan T, Forshaw M, Wright S.
No. 11Newborn screening for inborn errors of metabolism: a systematic review.
By Seymour CA, Thomason MJ, Chalmers RA, Addison GM, Bain MD, Cockburn F, et al.
No. 12Routine preoperative testing: a systematic review of the evidence.
By Munro J, Booth A, Nicholl J.
No. 13Systematic review of the effectiveness of laxatives in the elderly.
By Petticrew M, Watt I, Sheldon T.
No. 14When and how to assess fast-changing technologies: a comparative study of medical applications of four generic technologies.
A review by Mowatt G, Bower DJ, Brebner JA, Cairns JA, Grant AM, McKee L.
Volume 2, 1998
No. 1Antenatal screening for Down’s syndrome.
A review by Wald NJ, Kennard A, Hackshaw A, McGuire A.
No. 2Screening for ovarian cancer: a systematic review.
By Bell R, Petticrew M, Luengo S, Sheldon TA.
No. 3Consensus development methods, and their use in clinical guideline development.
A review by Murphy MK, Black NA, Lamping DL, McKee CM, Sanderson CFB, Askham J, et al.
No. 4A cost–utility analysis of interferon beta for multiple sclerosis.
By Parkin D, McNamee P, Jacoby A, Miller P, Thomas S, Bates D.
No. 5Effectiveness and efficiency of methods of dialysis therapy for end-stage renal disease: systematic reviews.
By MacLeod A, Grant A, Donaldson C, Khan I, Campbell M, Daly C, et al.
No. 6Effectiveness of hip prostheses in primary total hip replacement: a critical review of evidence and an economic model.
By Faulkner A, Kennedy LG, Baxter K, Donovan J, Wilkinson M, Bevan G.
No. 7Antimicrobial prophylaxis in colorectal surgery: a systematic review of randomised controlled trials.
By Song F, Glenny AM.
No. 8Bone marrow and peripheral blood stem cell transplantation for malignancy.
A review by Johnson PWM, Simnett SJ, Sweetenham JW, Morgan GJ, Stewart LA.
No. 9Screening for speech and language delay: a systematic review of the literature.
By Law J, Boyle J, Harris F, Harkness A, Nye C.
No. 10Resource allocation for chronic stable angina: a systematic review of effectiveness, costs and cost-effectiveness of alternative interventions.
By Sculpher MJ, Petticrew M, Kelland JL, Elliott RA, Holdright DR, Buxton MJ.
No. 11Detection, adherence and control of hypertension for the prevention of stroke: a systematic review.
By Ebrahim S.
No. 12Postoperative analgesia and vomiting, with special reference to day-case surgery: a systematic review.
By McQuay HJ, Moore RA.
No. 13Choosing between randomised and nonrandomised studies: a systematic review.
By Britton A, McKee M, Black N, McPherson K, Sanderson C, Bain C.
No. 14Evaluating patient-based outcome measures for use in clinical trials.
A review by Fitzpatrick R, Davey C, Buxton MJ, Jones DR.
Health Technology Assessment reports published to date
334
No. 15Ethical issues in the design and conduct of randomised controlled trials.
A review by Edwards SJL, Lilford RJ, Braunholtz DA, Jackson JC, Hewison J, Thornton J.
No. 16Qualitative research methods in health technology assessment: a review of the literature.
By Murphy E, Dingwall R, Greatbatch D, Parker S, Watson P.
No. 17The costs and benefits of paramedic skills in pre-hospital trauma care.
By Nicholl J, Hughes S, Dixon S, Turner J, Yates D.
No. 18Systematic review of endoscopic ultrasound in gastro-oesophageal cancer.
By Harris KM, Kelly S, Berry E, Hutton J, Roderick P, Cullingworth J, et al.
No. 19Systematic reviews of trials and other studies.
By Sutton AJ, Abrams KR, Jones DR, Sheldon TA, Song F.
No. 20Primary total hip replacement surgery: a systematic review of outcomes and modelling of cost-effectiveness associated with different prostheses.
A review by Fitzpatrick R, Shortall E, Sculpher M, Murray D, Morris R, Lodge M, et al.
Volume 3, 1999
No. 1Informed decision making: an annotated bibliography and systematic review.
By Bekker H, Thornton JG, Airey CM, Connelly JB, Hewison J, Robinson MB, et al.
No. 2Handling uncertainty when performing economic evaluation of healthcare interventions.
A review by Briggs AH, Gray AM.
No. 3The role of expectancies in the placebo effect and their use in the delivery of health care: a systematic review.
By Crow R, Gage H, Hampson S, Hart J, Kimber A, Thomas H.
No. 4A randomised controlled trial of different approaches to universal antenatal HIV testing: uptake and acceptability. Annex: Antenatal HIV testing – assessment of a routine voluntary approach.
By Simpson WM, Johnstone FD, Boyd FM, Goldberg DJ, Hart GJ, Gormley SM, et al.
No. 5Methods for evaluating area-wide and organisation-based interventions in health and health care: a systematic review.
By Ukoumunne OC, Gulliford MC, Chinn S, Sterne JAC, Burney PGJ.
No. 6Assessing the costs of healthcare technologies in clinical trials.
A review by Johnston K, Buxton MJ, Jones DR, Fitzpatrick R.
No. 7Cooperatives and their primary care emergency centres: organisation and impact.
By Hallam L, Henthorne K.
No. 8Screening for cystic fibrosis.
A review by Murray J, Cuckle H, Taylor G, Littlewood J, Hewison J.
No. 9A review of the use of health status measures in economic evaluation.
By Brazier J, Deverill M, Green C, Harper R, Booth A.
No. 10Methods for the analysis of quality-of-life and survival data in health technology assessment.
A review by Billingham LJ, Abrams KR, Jones DR.
No. 11Antenatal and neonatal haemoglobinopathy screening in the UK: review and economic analysis.
By Zeuner D, Ades AE, Karnon J, Brown J, Dezateux C, Anionwu EN.
No. 12Assessing the quality of reports of randomised trials: implications for the conduct of meta-analyses.
A review by Moher D, Cook DJ, Jadad AR, Tugwell P, Moher M, Jones A, et al.
No. 13‘Early warning systems’ for identifying new healthcare technologies.
By Robert G, Stevens A, Gabbay J.
No. 14A systematic review of the role of human papillomavirus testing within a cervical screening programme.
By Cuzick J, Sasieni P, Davies P, Adams J, Normand C, Frater A, et al.
No. 15Near patient testing in diabetes clinics: appraising the costs and outcomes.
By Grieve R, Beech R, Vincent J,Mazurkiewicz J.
No. 16Positron emission tomography: establishing priorities for health technology assessment.
A review by Robert G, Milne R.
No. 17 (Pt 1)The debridement of chronic wounds: a systematic review.
By Bradley M, Cullum N, Sheldon T.
No. 17 (Pt 2)Systematic reviews of wound care management: (2) Dressings and topical agents used in the healing of chronic wounds.
By Bradley M, Cullum N, Nelson EA, Petticrew M, Sheldon T, Torgerson D.
No. 18A systematic literature review of spiral and electron beam computed tomography: with particular reference to clinical applications in hepatic lesions, pulmonary embolus and coronary artery disease.
By Berry E, Kelly S, Hutton J, Harris KM, Roderick P, Boyce JC, et al.
No. 19What role for statins? A review and economic model.
By Ebrahim S, Davey Smith G, McCabe C, Payne N, Pickin M, Sheldon TA, et al.
No. 20Factors that limit the quality, number and progress of randomised controlled trials.
A review by Prescott RJ, Counsell CE, Gillespie WJ, Grant AM, Russell IT, Kiauka S, et al.
No. 21Antimicrobial prophylaxis in total hip replacement: a systematic review.
By Glenny AM, Song F.
No. 22Health promoting schools and health promotion in schools: two systematic reviews.
By Lister-Sharp D, Chapman S, Stewart-Brown S, Sowden A.
No. 23Economic evaluation of a primary care-based education programme for patients with osteoarthritis of the knee.
A review by Lord J, Victor C, Littlejohns P, Ross FM, Axford JS.
DOI: 10.3310/hta14040 Health Technology Assessment 2010; Vol. 14: No. 4
© 2010 Queen’s Printer and Controller of HMSO. All rights reserved.
335
Volume 4, 2000
No. 1The estimation of marginal time preference in a UK-wide sample (TEMPUS) project.
A review by Cairns JA, van der Pol MM.
No. 2Geriatric rehabilitation following fractures in older people: a systematic review.
By Cameron I, Crotty M, Currie C, Finnegan T, Gillespie L, Gillespie W, et al.
No. 3Screening for sickle cell disease and thalassaemia: a systematic review with supplementary research.
By Davies SC, Cronin E, Gill M, Greengross P, Hickman M, Normand C.
No. 4Community provision of hearing aids and related audiology services.
A review by Reeves DJ, Alborz A, Hickson FS, Bamford JM.
No. 5False-negative results in screening programmes: systematic review of impact and implications.
By Petticrew MP, Sowden AJ, Lister-Sharp D, Wright K.
No. 6Costs and benefits of community postnatal support workers: a randomised controlled trial.
By Morrell CJ, Spiby H, Stewart P, Walters S, Morgan A.
No. 7Implantable contraceptives (subdermal implants and hormonally impregnated intrauterine systems) versus other forms of reversible contraceptives: two systematic reviews to assess relative effectiveness, acceptability, tolerability and cost-effectiveness.
By French RS, Cowan FM, Mansour DJA, Morris S, Procter T, Hughes D, et al.
No. 8An introduction to statistical methods for health technology assessment.
A review by White SJ, Ashby D, Brown PJ.
No. 9Disease-modifying drugs for multiple sclerosis: a rapid and systematic review.
By Clegg A, Bryant J, Milne R.
No. 10Publication and related biases.
A review by Song F, Eastwood AJ, Gilbody S, Duley L, Sutton AJ.
No. 11Cost and outcome implications of the organisation of vascular services.
By Michaels J, Brazier J, Palfreyman S, Shackley P, Slack R.
No. 12Monitoring blood glucose control in diabetes mellitus: a systematic review.
By Coster S, Gulliford MC, Seed PT, Powrie JK, Swaminathan R.
No. 13The effectiveness of domiciliary health visiting: a systematic review of international studies and a selective review of the British literature.
By Elkan R, Kendrick D, Hewitt M, Robinson JJA, Tolley K, Blair M, et al.
No. 14The determinants of screening uptake and interventions for increasing uptake: a systematic review.
By Jepson R, Clegg A, Forbes C, Lewis R, Sowden A, Kleijnen J.
No. 15The effectiveness and cost-effectiveness of prophylactic removal of wisdom teeth.
A rapid review by Song F, O’Meara S, Wilson P, Golder S, Kleijnen J.
No. 16Ultrasound screening in pregnancy: a systematic review of the clinical effectiveness, cost-effectiveness and women’s views.
By Bricker L, Garcia J, Henderson J, Mugford M, Neilson J, Roberts T, et al.
No. 17A rapid and systematic review of the effectiveness and cost-effectiveness of the taxanes used in the treatment of advanced breast and ovarian cancer.
By Lister-Sharp D, McDonagh MS, Khan KS, Kleijnen J.
No. 18Liquid-based cytology in cervical screening: a rapid and systematic review.
By Payne N, Chilcott J, McGoogan E.
No. 19Randomised controlled trial of non-directive counselling, cognitive–behaviour therapy and usual general practitioner care in the management of depression as well as mixed anxiety and depression in primary care.
By King M, Sibbald B, Ward E, Bower P, Lloyd M, Gabbay M, et al.
No. 20Routine referral for radiography of patients presenting with low back pain: is patients’ outcome influenced by GPs’ referral for plain radiography?
By Kerry S, Hilton S, Patel S, Dundas D, Rink E, Lord J.
No. 21Systematic reviews of wound care management: (3) antimicrobial agents for chronic wounds; (4) diabetic foot ulceration.
By O’Meara S, Cullum N, Majid M, Sheldon T.
No. 22Using routine data to complement and enhance the results of randomised controlled trials.
By Lewsey JD, Leyland AH, Murray GD, Boddy FA.
No. 23Coronary artery stents in the treatment of ischaemic heart disease: a rapid and systematic review.
By Meads C, Cummins C, Jolly K, Stevens A, Burls A, Hyde C.
No. 24Outcome measures for adult critical care: a systematic review.
By Hayes JA, Black NA, Jenkinson C, Young JD, Rowan KM, Daly K, et al.
No. 25A systematic review to evaluate the effectiveness of interventions to promote the initiation of breastfeeding.
By Fairbank L, O’Meara S, Renfrew MJ, Woolridge M, Sowden AJ, Lister-Sharp D.
No. 26Implantable cardioverter defibrillators: arrhythmias. A rapid and systematic review.
By Parkes J, Bryant J, Milne R.
No. 27Treatments for fatigue in multiple sclerosis: a rapid and systematic review.
By Brañas P, Jordan R, Fry-Smith A, Burls A, Hyde C.
No. 28Early asthma prophylaxis, natural history, skeletal development and economy (EASE): a pilot randomised controlled trial.
By Baxter-Jones ADG, Helms PJ, Russell G, Grant A, Ross S, Cairns JA, et al.
No. 29Screening for hypercholesterolaemia versus case finding for familial hypercholesterolaemia: a systematic review and cost-effectiveness analysis.
By Marks D, Wonderling D, Thorogood M, Lambert H, Humphries SE, Neil HAW.
No. 30A rapid and systematic review of the clinical effectiveness and cost-effectiveness of glycoprotein IIb/IIIa antagonists in the medical management of unstable angina.
By McDonagh MS, Bachmann LM, Golder S, Kleijnen J, ter Riet G.
Health Technology Assessment reports published to date
336
No. 31A randomised controlled trial of prehospital intravenous fluid replacement therapy in serious trauma.
By Turner J, Nicholl J, Webber L, Cox H, Dixon S, Yates D.
No. 32Intrathecal pumps for giving opioids in chronic pain: a systematic review.
By Williams JE, Louw G, Towlerton G.
No. 33Combination therapy (interferon alfa and ribavirin) in the treatment of chronic hepatitis C: a rapid and systematic review.
By Shepherd J, Waugh N, Hewitson P.
No. 34A systematic review of comparisons of effect sizes derived from randomised and non-randomised studies.
By MacLehose RR, Reeves BC, Harvey IM, Sheldon TA, Russell IT, Black AMS.
No. 35Intravascular ultrasound-guided interventions in coronary artery disease: a systematic literature review, with decision-analytic modelling, of outcomes and cost-effectiveness.
By Berry E, Kelly S, Hutton J, Lindsay HSJ, Blaxill JM, Evans JA, et al.
No. 36A randomised controlled trial to evaluate the effectiveness and cost-effectiveness of counselling patients with chronic depression.
By Simpson S, Corney R, Fitzgerald P, Beecham J.
No. 37Systematic review of treatments for atopic eczema.
By Hoare C, Li Wan Po A, Williams H.
No. 38Bayesian methods in health technology assessment: a review.
By Spiegelhalter DJ, Myles JP, Jones DR, Abrams KR.
No. 39The management of dyspepsia: a systematic review.
By Delaney B, Moayyedi P, Deeks J, Innes M, Soo S, Barton P, et al.
No. 40A systematic review of treatments for severe psoriasis.
By Griffiths CEM, Clark CM, Chalmers RJG, Li Wan Po A, Williams HC.
Volume 5, 2001
No. 1Clinical and cost-effectiveness of donepezil, rivastigmine and galantamine for Alzheimer’s disease: a rapid and systematic review.
By Clegg A, Bryant J, Nicholson T, McIntyre L, De Broe S, Gerard K, et al.
No. 2The clinical effectiveness and cost-effectiveness of riluzole for motor neurone disease: a rapid and systematic review.
By Stewart A, Sandercock J, Bryan S, Hyde C, Barton PM, Fry-Smith A, et al.
No. 3Equity and the economic evaluation of healthcare.
By Sassi F, Archard L, Le Grand J.
No. 4Quality-of-life measures in chronic diseases of childhood.
By Eiser C, Morse R.
No. 5Eliciting public preferences for healthcare: a systematic review oftechniques.
By Ryan M, Scott DA, Reeves C, Bate A, van Teijlingen ER, Russell EM, et al.
No. 6General health status measures for people with cognitive impairment: learning disability and acquired brain injury.
By Riemsma RP, Forbes CA, Glanville JM, Eastwood AJ, Kleijnen J.
No. 7An assessment of screening strategies for fragile X syndrome in the UK.
By Pembrey ME, Barnicoat AJ, Carmichael B, Bobrow M, Turner G.
No. 8Issues in methodological research: perspectives from researchers and commissioners.
By Lilford RJ, Richardson A, Stevens A, Fitzpatrick R, Edwards S, Rock F, et al.
No. 9Systematic reviews of wound care management: (5) beds; (6) compression; (7) laser therapy, therapeutic ultrasound, electrotherapy and electromagnetic therapy.
By Cullum N, Nelson EA, Flemming K, Sheldon T.
No. 10Effects of educational and psychosocial interventions for adolescents with diabetes mellitus: a systematic review.
By Hampson SE, Skinner TC, Hart J, Storey L, Gage H, Foxcroft D, et al.
No. 11Effectiveness of autologous chondrocyte transplantation for hyaline cartilage defects in knees: a rapid and systematic review.
By Jobanputra P, Parry D, Fry-Smith A, Burls A.
No. 12Statistical assessment of the learning curves of health technologies.
By Ramsay CR, Grant AM, Wallace SA, Garthwaite PH, Monk AF, Russell IT.
No. 13The effectiveness and cost-effectiveness of temozolomide for the treatment of recurrent malignant glioma: a rapid and systematic review.
By Dinnes J, Cave C, Huang S, Major K, Milne R.
No. 14A rapid and systematic review of the clinical effectiveness and cost-effectiveness of debriding agents in treating surgical wounds healing by secondary intention.
By Lewis R, Whiting P, ter Riet G, O’Meara S, Glanville J.
No. 15Home treatment for mental health problems: a systematic review.
By Burns T, Knapp M, Catty J, Healey A, Henderson J, Watt H, et al.
No. 16How to develop cost-conscious guidelines.
By Eccles M, Mason J.
No. 17The role of specialist nurses in multiple sclerosis: a rapid and systematic review.
By De Broe S, Christopher F, Waugh N.
No. 18A rapid and systematic review of the clinical effectiveness and cost-effectiveness of orlistat in the management of obesity.
By O’Meara S, Riemsma R, Shirran L, Mather L, ter Riet G.
No. 19The clinical effectiveness and cost-effectiveness of pioglitazone for type 2 diabetes mellitus: a rapid and systematic review.
By Chilcott J, Wight J, Lloyd Jones M, Tappenden P.
No. 20Extended scope of nursing practice: a multicentre randomised controlled trial of appropriately trained nurses and preregistration house officers in preoperative assessment in elective general surgery.
By Kinley H, Czoski-Murray C, George S, McCabe C, Primrose J, Reilly C, et al.
DOI: 10.3310/hta14040 Health Technology Assessment 2010; Vol. 14: No. 4
© 2010 Queen’s Printer and Controller of HMSO. All rights reserved.
337
No. 21Systematic reviews of the effectiveness of day care for people with severe mental disorders: (1) Acute day hospital versus admission; (2) Vocational rehabilitation; (3) Day hospital versus outpatient care.
By Marshall M, Crowther R, Almaraz- Serrano A, Creed F, Sledge W, Kluiter H, et al.
No. 22The measurement and monitoring of surgical adverse events.
By Bruce J, Russell EM, Mollison J, Krukowski ZH.
No. 23Action research: a systematic review and guidance for assessment.
By Waterman H, Tillen D, Dickson R, de Koning K.
No. 24A rapid and systematic review of the clinical effectiveness and cost-effectiveness of gemcitabine for the treatment of pancreatic cancer.
By Ward S, Morris E, Bansback N, Calvert N, Crellin A, Forman D, et al.
No. 25A rapid and systematic review of the evidence for the clinical effectiveness and cost-effectiveness of irinotecan, oxaliplatin and raltitrexed for the treatment of advanced colorectal cancer.
By Lloyd Jones M, Hummel S, Bansback N, Orr B, Seymour M.
No. 26Comparison of the effectiveness of inhaler devices in asthma and chronic obstructive airways disease: a systematic review of the literature.
By Brocklebank D, Ram F, Wright J, Barry P, Cates C, Davies L, et al.
No. 27The cost-effectiveness of magnetic resonance imaging for investigation of the knee joint.
By Bryan S, Weatherburn G, Bungay H, Hatrick C, Salas C, Parry D, et al.
No. 28A rapid and systematic review of the clinical effectiveness and cost-effectiveness of topotecan for ovarian cancer.
By Forbes C, Shirran L, Bagnall A-M, Duffy S, ter Riet G.
No. 29Superseded by a report published in a later volume.
No. 30The role of radiography in primary care patients with low back pain of at least 6 weeks duration: a randomised (unblinded) controlled trial.
By Kendrick D, Fielding K, Bentley E, Miller P, Kerslake R, Pringle M.
No. 31Design and use of questionnaires: a review of best practice applicable to surveys of health service staff and patients.
By McColl E, Jacoby A, Thomas L, Soutter J, Bamford C, Steen N, et al.
No. 32A rapid and systematic review of the clinical effectiveness and cost-effectiveness of paclitaxel, docetaxel, gemcitabine and vinorelbine in non-small-cell lung cancer.
By Clegg A, Scott DA, Sidhu M, Hewitson P, Waugh N.
No. 33Subgroup analyses in randomised controlled trials: quantifying the risks of false-positives and false-negatives.
By Brookes ST, Whitley E, Peters TJ, Mulheran PA, Egger M, Davey Smith G.
No. 34Depot antipsychotic medication in the treatment of patients with schizophrenia: (1) Meta-review; (2) Patient and nurse attitudes.
By David AS, Adams C.
No. 35A systematic review of controlled trials of the effectiveness and cost-effectiveness of brief psychological treatments for depression.
By Churchill R, Hunot V, Corney R, Knapp M, McGuire H, Tylee A, et al.
No. 36Cost analysis of child health surveillance.
By Sanderson D, Wright D, Acton C, Duree D.
Volume 6, 2002
No. 1A study of the methods used to select review criteria for clinical audit.
By Hearnshaw H, Harker R, Cheater F, Baker R, Grimshaw G.
No. 2Fludarabine as second-line therapy for B cell chronic lymphocytic leukaemia: a technology assessment.
By Hyde C, Wake B, Bryan S, Barton P, Fry-Smith A, Davenport C, et al.
No. 3Rituximab as third-line treatment for refractory or recurrent Stage III or IV follicular non-Hodgkin’s lymphoma: a systematic review and economic evaluation.
By Wake B, Hyde C, Bryan S, Barton P, Song F, Fry-Smith A, et al.
No. 4A systematic review of discharge arrangements for older people.
By Parker SG, Peet SM, McPherson A, Cannaby AM, Baker R, Wilson A, et al.
No. 5The clinical effectiveness and cost-effectiveness of inhaler devices used in the routine management of chronic asthma in older children: a systematic review and economic evaluation.
By Peters J, Stevenson M, Beverley C, Lim J, Smith S.
No. 6The clinical effectiveness and cost-effectiveness of sibutramine in the management of obesity: a technology assessment.
By O’Meara S, Riemsma R, Shirran L, Mather L, ter Riet G.
No. 7The cost-effectiveness of magnetic resonance angiography for carotid artery stenosis and peripheral vascular disease: a systematic review.
By Berry E, Kelly S, Westwood ME, Davies LM, Gough MJ, Bamford JM, et al.
No. 8Promoting physical activity in South Asian Muslim women through ‘exercise on prescription’.
By Carroll B, Ali N, Azam N.
No. 9Zanamivir for the treatment of influenza in adults: a systematic review and economic evaluation.
By Burls A, Clark W, Stewart T, Preston C, Bryan S, Jefferson T, et al.
No. 10A review of the natural history and epidemiology of multiple sclerosis: implications for resource allocation and health economic models.
By Richards RG, Sampson FC, Beard SM, Tappenden P.
No. 11Screening for gestational diabetes: a systematic review and economic evaluation.
By Scott DA, Loveman E, McIntyre L, Waugh N.
No. 12The clinical effectiveness and cost-effectiveness of surgery for people with morbid obesity: a systematic review and economic evaluation.
By Clegg AJ, Colquitt J, Sidhu MK, Royle P, Loveman E, Walker A.
No. 13The clinical effectiveness of trastuzumab for breast cancer: a systematic review.
By Lewis R, Bagnall A-M, Forbes C, Shirran E, Duffy S, Kleijnen J, et al.
No. 14The clinical effectiveness and cost-effectiveness of vinorelbine for breast cancer: a systematic review and economic evaluation.
By Lewis R, Bagnall A-M, King S, Woolacott N, Forbes C, Shirran L, et al.
Health Technology Assessment reports published to date
338
No. 15A systematic review of the effectiveness and cost-effectiveness of metal-on-metal hip resurfacing arthroplasty for treatment of hip disease.
By Vale L, Wyness L, McCormack K, McKenzie L, Brazzelli M, Stearns SC.
No. 16The clinical effectiveness and cost-effectiveness of bupropion and nicotine replacement therapy for smoking cessation: a systematic review and economic evaluation.
By Woolacott NF, Jones L, Forbes CA, Mather LC, Sowden AJ, Song FJ, et al.
No. 17A systematic review of effectiveness and economic evaluation of new drug treatments for juvenile idiopathic arthritis: etanercept.
By Cummins C, Connock M, Fry-Smith A, Burls A.
No. 18Clinical effectiveness and cost-effectiveness of growth hormone in children: a systematic review and economic evaluation.
By Bryant J, Cave C, Mihaylova B, Chase D, McIntyre L, Gerard K, et al.
No. 19Clinical effectiveness and cost-effectiveness of growth hormone in adults in relation to impact on quality of life: a systematic review and economic evaluation.
By Bryant J, Loveman E, Chase D, Mihaylova B, Cave C, Gerard K, et al.
No. 20Clinical medication review by a pharmacist of patients on repeat prescriptions in general practice: a randomised controlled trial.
By Zermansky AG, Petty DR, Raynor DK, Lowe CJ, Freementle N, Vail A.
No. 21The effectiveness of infliximab and etanercept for the treatment of rheumatoid arthritis: a systematic review and economic evaluation.
By Jobanputra P, Barton P, Bryan S, Burls A.
No. 22A systematic review and economic evaluation of computerised cognitive behaviour therapy for depression and anxiety.
By Kaltenthaler E, Shackley P, Stevens K, Beverley C, Parry G, Chilcott J.
No. 23A systematic review and economic evaluation of pegylated liposomal doxorubicin hydrochloride for ovarian cancer.
By Forbes C, Wilby J, Richardson G, Sculpher M, Mather L, Reimsma R.
No. 24A systematic review of the effectiveness of interventions based on a stages-of-change approach to promote individual behaviour change.
By Riemsma RP, Pattenden J, Bridle C, Sowden AJ, Mather L, Watt IS, et al.
No. 25A systematic review update of the clinical effectiveness and cost-effectiveness of glycoprotein IIb/IIIa antagonists.
By Robinson M, Ginnelly L, Sculpher M, Jones L, Riemsma R, Palmer S, et al.
No. 26A systematic review of the effectiveness, cost-effectiveness and barriers to implementation of thrombolytic and neuroprotective therapy for acute ischaemic stroke in the NHS.
By Sandercock P, Berge E, Dennis M, Forbes J, Hand P, Kwan J, et al.
No. 27A randomised controlled crossover trial of nurse practitioner versus doctor-led outpatient care in a bronchiectasis clinic.
By Caine N, Sharples LD, Hollingworth W, French J, Keogan M, Exley A, et al.
No. 28Clinical effectiveness and cost – consequences of selective serotonin reuptake inhibitors in the treatment of sex offenders.
By Adi Y, Ashcroft D, Browne K, Beech A, Fry-Smith A, Hyde C.
No. 29Treatment of established osteoporosis: a systematic review and cost–utility analysis.
By Kanis JA, Brazier JE, Stevenson M, Calvert NW, Lloyd Jones M.
No. 30Which anaesthetic agents are cost-effective in day surgery? Literature review, national survey of practice and randomised controlled trial.
By Elliott RA Payne K, Moore JK, Davies LM, Harper NJN, St Leger AS, et al.
No. 31Screening for hepatitis C among injecting drug users and in genitourinary medicine clinics: systematic reviews of effectiveness, modelling study and national survey of current practice.
By Stein K, Dalziel K, Walker A, McIntyre L, Jenkins B, Horne J, et al.
No. 32The measurement of satisfaction with healthcare: implications for practice from a systematic review of the literature.
By Crow R, Gage H, Hampson S, Hart J, Kimber A, Storey L, et al.
No. 33The effectiveness and cost-effectiveness of imatinib in chronic myeloid leukaemia: a systematic review.
By Garside R, Round A, Dalziel K, Stein K, Royle R.
No. 34A comparative study of hypertonic saline, daily and alternate-day rhDNase in children with cystic fibrosis.
By Suri R, Wallis C, Bush A, Thompson S, Normand C, Flather M, et al.
No. 35A systematic review of the costs and effectiveness of different models of paediatric home care.
By Parker G, Bhakta P, Lovett CA, Paisley S, Olsen R, Turner D, et al.
Volume 7, 2003
No. 1How important are comprehensive literature searches and the assessment of trial quality in systematic reviews? Empirical study.
By Egger M, Juni P, Bartlett C, Holenstein F, Sterne J.
No. 2Systematic review of the effectiveness and cost-effectiveness, and economic evaluation, of home versus hospital or satellite unit haemodialysis for people with end-stage renal failure.
By Mowatt G, Vale L, Perez J, Wyness L, Fraser C, MacLeod A, et al.
No. 3Systematic review and economic evaluation of the effectiveness of infliximab for the treatment of Crohn’s disease.
By Clark W, Raftery J, Barton P, Song F, Fry-Smith A, Burls A.
No. 4A review of the clinical effectiveness and cost-effectiveness of routine anti-D prophylaxis for pregnant women who are rhesus negative.
By Chilcott J, Lloyd Jones M, Wight J, Forman K, Wray J, Beverley C, et al.
No. 5Systematic review and evaluation of the use of tumour markers in paediatric oncology: Ewing’s sarcoma and neuroblastoma.
By Riley RD, Burchill SA, Abrams KR, Heney D, Lambert PC, Jones DR, et al.
No. 6The cost-effectiveness of screening for Helicobacter pylori to reduce mortality and morbidity from gastric cancer and peptic ulcer disease: a discrete-event simulation model.
By Roderick P, Davies R, Raftery J, Crabbe D, Pearce R, Bhandari P, et al.
DOI: 10.3310/hta14040 Health Technology Assessment 2010; Vol. 14: No. 4
© 2010 Queen’s Printer and Controller of HMSO. All rights reserved.
339
No. 7The clinical effectiveness and cost-effectiveness of routine dental checks: a systematic review and economic evaluation.
By Davenport C, Elley K, Salas C, Taylor-Weetman CL, Fry-Smith A, Bryan S, et al.
No. 8A multicentre randomised controlled trial assessing the costs and benefits of using structured information and analysis of women’s preferences in the management of menorrhagia.
By Kennedy ADM, Sculpher MJ, Coulter A, Dwyer N, Rees M, Horsley S, et al.
No. 9Clinical effectiveness and cost–utility of photodynamic therapy for wet age-related macular degeneration: a systematic review and economic evaluation.
By Meads C, Salas C, Roberts T, Moore D, Fry-Smith A, Hyde C.
No. 10Evaluation of molecular tests for prenatal diagnosis of chromosome abnormalities.
By Grimshaw GM, Szczepura A, Hultén M, MacDonald F, Nevin NC, Sutton F, et al.
No. 11First and second trimester antenatal screening for Down’s syndrome: the results of the Serum, Urine and Ultrasound Screening Study (SURUSS).
By Wald NJ, Rodeck C, Hackshaw AK, Walters J, Chitty L, Mackinson AM.
No. 12The effectiveness and cost-effectiveness of ultrasound locating devices for central venous access: a systematic review and economic evaluation.
By Calvert N, Hind D, McWilliams RG, Thomas SM, Beverley C, Davidson A.
No. 13A systematic review of atypical antipsychotics in schizophrenia.
By Bagnall A-M, Jones L, Lewis R, Ginnelly L, Glanville J, Torgerson D,et al.
No. 14Prostate Testing for Cancer and Treatment (ProtecT) feasibility study.
By Donovan J, Hamdy F, Neal D, Peters T, Oliver S, Brindle L, et al.
No. 15Early thrombolysis for the treatment of acute myocardial infarction: a systematic review and economic evaluation.
By Boland A, Dundar Y, Bagust A, Haycox A, Hill R, Mujica Mota R, et al.
No. 16Screening for fragile X syndrome: a literature review and modelling.
By Song FJ, Barton P, Sleightholme V, Yao GL, Fry-Smith A.
No. 17Systematic review of endoscopic sinus surgery for nasal polyps.
By Dalziel K, Stein K, Round A, Garside R, Royle P.
No. 18Towards efficient guidelines: how to monitor guideline use in primary care.
By Hutchinson A, McIntosh A, Cox S, Gilbert C.
No. 19Effectiveness and cost-effectiveness of acute hospital-based spinal cord injuries services: systematic review.
By Bagnall A-M, Jones L, Richardson G, Duffy S, Riemsma R.
No. 20Prioritisation of health technology assessment. The PATHS model: methods and case studies.
By Townsend J, Buxton M, Harper G.
No. 21Systematic review of the clinical effectiveness and cost-effectiveness of tension-free vaginal tape for treatment of urinary stress incontinence.
By Cody J, Wyness L, Wallace S, Glazener C, Kilonzo M, Stearns S, et al.
No. 22The clinical and cost-effectiveness of patient education models for diabetes: a systematic review and economic evaluation.
By Loveman E, Cave C, Green C, Royle P, Dunn N, Waugh N.
No. 23The role of modelling in prioritising and planning clinical trials.
By Chilcott J, Brennan A, Booth A, Karnon J, Tappenden P.
No. 24Cost–benefit evaluation of routine influenza immunisation in people 65–74 years of age.
By Allsup S, Gosney M, Haycox A, Regan M.
No. 25The clinical and cost-effectiveness of pulsatile machine perfusion versus cold storage of kidneys for transplantation retrieved from heart-beating and non-heart-beating donors.
By Wight J, Chilcott J, Holmes M, Brewer N.
No. 26Can randomised trials rely on existing electronic data? A feasibility study to explore the value of routine data in health technology assessment.
By Williams JG, Cheung WY, Cohen DR, Hutchings HA, Longo MF, Russell IT.
No. 27Evaluating non-randomised intervention studies.
By Deeks JJ, Dinnes J, D’Amico R, Sowden AJ, Sakarovitch C, Song F, et al.
No. 28A randomised controlled trial to assess the impact of a package comprising a patient-orientated, evidence-based self- help guidebook and patient-centred consultations on disease management and satisfaction in inflammatory bowel disease.
By Kennedy A, Nelson E, Reeves D, Richardson G, Roberts C, Robinson A, et al.
No. 29The effectiveness of diagnostic tests for the assessment of shoulder pain due to soft tissue disorders: a systematic review.
By Dinnes J, Loveman E, McIntyre L, Waugh N.
No. 30The value of digital imaging in diabetic retinopathy.
By Sharp PF, Olson J, Strachan F, Hipwell J, Ludbrook A, O’Donnell M, et al.
No. 31Lowering blood pressure to prevent myocardial infarction and stroke: a new preventive strategy.
By Law M, Wald N, Morris J.
No. 32Clinical and cost-effectiveness of capecitabine and tegafur with uracil for the treatment of metastatic colorectal cancer: systematic review and economic evaluation.
By Ward S, Kaltenthaler E, Cowan J, Brewer N.
No. 33Clinical and cost-effectiveness of new and emerging technologies for early localised prostate cancer: a systematic review.
By Hummel S, Paisley S, Morgan A, Currie E, Brewer N.
No. 34Literature searching for clinical and cost-effectiveness studies used in health technology assessment reports carried out for the National Institute for Clinical Excellence appraisal system.
By Royle P, Waugh N.
Health Technology Assessment reports published to date
340
No. 35Systematic review and economic decision modelling for the prevention and treatment of influenza A and B.
By Turner D, Wailoo A, Nicholson K, Cooper N, Sutton A, Abrams K.
No. 36A randomised controlled trial to evaluate the clinical and cost-effectiveness of Hickman line insertions in adult cancer patients by nurses.
By Boland A, Haycox A, Bagust A, Fitzsimmons L.
No. 37Redesigning postnatal care: a randomised controlled trial of protocol-based midwifery-led care focused on individual women’s physical and psychological health needs.
By MacArthur C, Winter HR, Bick DE, Lilford RJ, Lancashire RJ, Knowles H, et al.
No. 38Estimating implied rates of discount in healthcare decision-making.
By West RR, McNabb R, Thompson AGH, Sheldon TA, Grimley Evans J.
No. 39Systematic review of isolation policies in the hospital management of methicillin-resistant Staphylococcus aureus: a review of the literature with epidemiological and economic modelling.
By Cooper BS, Stone SP, Kibbler CC, Cookson BD, Roberts JA, Medley GF, et al.
No. 40Treatments for spasticity and pain in multiple sclerosis: a systematic review.
By Beard S, Hunn A, Wight J.
No. 41The inclusion of reports of randomised trials published in languages other than English in systematic reviews.
By Moher D, Pham B, Lawson ML, Klassen TP.
No. 42The impact of screening on future health-promoting behaviours and health beliefs: a systematic review.
By Bankhead CR, Brett J, Bukach C, Webster P, Stewart-Brown S, Munafo M, et al.
Volume 8, 2004
No. 1What is the best imaging strategy for acute stroke?
By Wardlaw JM, Keir SL, Seymour J, Lewis S, Sandercock PAG, Dennis MS, et al.
No. 2Systematic review and modelling of the investigation of acute and chronic chest pain presenting in primary care.
By Mant J, McManus RJ, Oakes RAL, Delaney BC, Barton PM, Deeks JJ, et al.
No. 3The effectiveness and cost-effectiveness of microwave and thermal balloon endometrial ablation for heavy menstrual bleeding: a systematic review and economic modelling.
By Garside R, Stein K, Wyatt K, Round A, Price A.
No. 4A systematic review of the role of bisphosphonates in metastatic disease.
By Ross JR, Saunders Y, Edmonds PM, Patel S, Wonderling D, Normand C, et al.
No. 5Systematic review of the clinical effectiveness and cost-effectiveness of capecitabine (Xeloda®) for locally advanced and/or metastatic breast cancer.
By Jones L, Hawkins N, Westwood M, Wright K, Richardson G, Riemsma R.
No. 6Effectiveness and efficiency of guideline dissemination and implementation strategies.
By Grimshaw JM, Thomas RE, MacLennan G, Fraser C, Ramsay CR, Vale L, et al.
No. 7Clinical effectiveness and costs of the Sugarbaker procedure for the treatment of pseudomyxoma peritonei.
By Bryant J, Clegg AJ, Sidhu MK, Brodin H, Royle P, Davidson P.
No. 8Psychological treatment for insomnia in the regulation of long-term hypnotic drug use.
By Morgan K, Dixon S, Mathers N, Thompson J, Tomeny M.
No. 9Improving the evaluation of therapeutic interventions in multiple sclerosis: development of a patient-based measure of outcome.
By Hobart JC, Riazi A, Lamping DL, Fitzpatrick R, Thompson AJ.
No. 10A systematic review and economic evaluation of magnetic resonance cholangiopancreatography compared with diagnostic endoscopic retrograde cholangiopancreatography.
By Kaltenthaler E, Bravo Vergel Y, Chilcott J, Thomas S, Blakeborough T, Walters SJ, et al.
No. 11The use of modelling to evaluate new drugs for patients with a chronic condition: the case of antibodies against tumour necrosis factor in rheumatoid arthritis.
By Barton P, Jobanputra P, Wilson J, Bryan S, Burls A.
No. 12Clinical effectiveness and cost-effectiveness of neonatal screening for inborn errors of metabolism using tandem mass spectrometry: a systematic review.
By Pandor A, Eastham J, Beverley C, Chilcott J, Paisley S.
No. 13Clinical effectiveness and cost-effectiveness of pioglitazone and rosiglitazone in the treatment of type 2 diabetes: a systematic review and economic evaluation.
By Czoski-Murray C, Warren E, Chilcott J, Beverley C, Psyllaki MA, Cowan J.
No. 14Routine examination of the newborn: the EMREN study. Evaluation of an extension of the midwife role including a randomised controlled trial of appropriately trained midwives and paediatric senior house officers.
By Townsend J, Wolke D, Hayes J, Davé S, Rogers C, Bloomfield L, et al.
No. 15Involving consumers in research and development agenda setting for the NHS: developing an evidence-based approach.
By Oliver S, Clarke-Jones L, Rees R, Milne R, Buchanan P, Gabbay J, et al.
No. 16A multi-centre randomised controlled trial of minimally invasive direct coronary bypass grafting versus percutaneous transluminal coronary angioplasty with stenting for proximal stenosis of the left anterior descending coronary artery.
By Reeves BC, Angelini GD, Bryan AJ, Taylor FC, Cripps T, Spyt TJ, et al.
No. 17Does early magnetic resonance imaging influence management or improve outcome in patients referred to secondary care with low back pain? A pragmatic randomised controlled trial.
By Gilbert FJ, Grant AM, Gillan MGC, Vale L, Scott NW, Campbell MK, et al.
No. 18The clinical and cost-effectiveness of anakinra for the treatment of rheumatoid arthritis in adults: a systematic review and economic analysis.
By Clark W, Jobanputra P, Barton P, Burls A.
DOI: 10.3310/hta14040 Health Technology Assessment 2010; Vol. 14: No. 4
© 2010 Queen’s Printer and Controller of HMSO. All rights reserved.
341
No. 19A rapid and systematic review and economic evaluation of the clinical and cost-effectiveness of newer drugs for treatment of mania associated with bipolar affective disorder.
By Bridle C, Palmer S, Bagnall A-M, Darba J, Duffy S, Sculpher M, et al.
No. 20Liquid-based cytology in cervical screening: an updated rapid and systematic review and economic analysis.
By Karnon J, Peters J, Platt J, Chilcott J, McGoogan E, Brewer N.
No. 21Systematic review of the long-term effects and economic consequences of treatments for obesity and implications for health improvement.
By Avenell A, Broom J, Brown TJ, Poobalan A, Aucott L, Stearns SC, et al.
No. 22Autoantibody testing in children with newly diagnosed type 1 diabetes mellitus.
By Dretzke J, Cummins C, Sandercock J, Fry-Smith A, Barrett T, Burls A.
No. 23Clinical effectiveness and cost-effectiveness of prehospital intravenous fluids in trauma patients.
By Dretzke J, Sandercock J, Bayliss S, Burls A.
No. 24Newer hypnotic drugs for the short-term management of insomnia: a systematic review and economic evaluation.
By Dundar Y, Boland A, Strobl J, Dodd S, Haycox A, Bagust A, et al.
No. 25Development and validation of methods for assessing the quality of diagnostic accuracy studies.
By Whiting P, Rutjes AWS, Dinnes J, Reitsma JB, Bossuyt PMM, Kleijnen J.
No. 26EVALUATE hysterectomy trial: a multicentre randomised trial comparing abdominal, vaginal and laparoscopic methods of hysterectomy.
By Garry R, Fountain J, Brown J, Manca A, Mason S, Sculpher M, et al.
No. 27Methods for expected value of information analysis in complex health economic models: developments on the health economics of interferon-β and glatiramer acetate for multiple sclerosis.
By Tappenden P, Chilcott JB, Eggington S, Oakley J, McCabe C.
No. 28Effectiveness and cost-effectiveness of imatinib for first-line treatment of chronic myeloid leukaemia in chronic phase: a systematic review and economic analysis.
By Dalziel K, Round A, Stein K, Garside R, Price A.
No. 29VenUS I: a randomised controlled trial of two types of bandage for treating venous leg ulcers.
By Iglesias C, Nelson EA, Cullum NA, Torgerson DJ, on behalf of the VenUS Team.
No. 30Systematic review of the effectiveness and cost-effectiveness, and economic evaluation, of myocardial perfusion scintigraphy for the diagnosis and management of angina and myocardial infarction.
By Mowatt G, Vale L, Brazzelli M, Hernandez R, Murray A, Scott N, et al.
No. 31A pilot study on the use of decision theory and value of information analysis as part of the NHS Health Technology Assessment programme.
By Claxton K, Ginnelly L, Sculpher M, Philips Z, Palmer S.
No. 32The Social Support and Family Health Study: a randomised controlled trial and economic evaluation of two alternative forms of postnatal support for mothers living in disadvantaged inner-city areas.
By Wiggins M, Oakley A, Roberts I, Turner H, Rajan L, Austerberry H, et al.
No. 33Psychosocial aspects of genetic screening of pregnant women and newborns: a systematic review.
By Green JM, Hewison J, Bekker HL, Bryant, Cuckle HS.
No. 34Evaluation of abnormal uterine bleeding: comparison of three outpatient procedures within cohorts defined by age and menopausal status.
By Critchley HOD, Warner P, Lee AJ, Brechin S, Guise J, Graham B.
No. 35Coronary artery stents: a rapid systematic review and economic evaluation.
By Hill R, Bagust A, Bakhai A, Dickson R, Dundar Y, Haycox A, et al.
No. 36Review of guidelines for good practice in decision-analytic modelling in health technology assessment.
By Philips Z, Ginnelly L, Sculpher M, Claxton K, Golder S, Riemsma R, et al.
No. 37Rituximab (MabThera®) for aggressive non-Hodgkin’s lymphoma: systematic review and economic evaluation.
By Knight C, Hind D, Brewer N, Abbott V.
No. 38Clinical effectiveness and cost-effectiveness of clopidogrel and modified-release dipyridamole in the secondary prevention of occlusive vascular events: a systematic review and economic evaluation.
By Jones L, Griffin S, Palmer S, Main C, Orton V, Sculpher M, et al.
No. 39Pegylated interferon α-2a and -2b in combination with ribavirin in the treatment of chronic hepatitis C: a systematic review and economic evaluation.
By Shepherd J, Brodin H, Cave C, Waugh N, Price A, Gabbay J.
No. 40Clopidogrel used in combination with aspirin compared with aspirin alone in the treatment of non-ST-segment- elevation acute coronary syndromes: a systematic review and economic evaluation.
By Main C, Palmer S, Griffin S, Jones L, Orton V, Sculpher M, et al.
No. 41Provision, uptake and cost of cardiac rehabilitation programmes: improving services to under-represented groups.
By Beswick AD, Rees K, Griebsch I, Taylor FC, Burke M, West RR, et al.
No. 42Involving South Asian patients in clinical trials.
By Hussain-Gambles M, Leese B, Atkin K, Brown J, Mason S, Tovey P.
No. 43Clinical and cost-effectiveness of continuous subcutaneous insulin infusion for diabetes.
By Colquitt JL, Green C, Sidhu MK, Hartwell D, Waugh N.
No. 44Identification and assessment of ongoing trials in health technology assessment reviews.
By Song FJ, Fry-Smith A, Davenport C, Bayliss S, Adi Y, Wilson JS, et al.
No. 45Systematic review and economic evaluation of a long-acting insulin analogue, insulin glargine
By Warren E, Weatherley-Jones E, Chilcott J, Beverley C.
Health Technology Assessment reports published to date
342
No. 46Supplementation of a home-based exercise programme with a class-based programme for people with osteoarthritis of the knees: a randomised controlled trial and health economic analysis.
By McCarthy CJ, Mills PM, Pullen R, Richardson G, Hawkins N, Roberts CR, et al.
No. 47Clinical and cost-effectiveness of once-daily versus more frequent use of same potency topical corticosteroids for atopic eczema: a systematic review and economic evaluation.
By Green C, Colquitt JL, Kirby J, Davidson P, Payne E.
No. 48Acupuncture of chronic headache disorders in primary care: randomised controlled trial and economic analysis.
By Vickers AJ, Rees RW, Zollman CE, McCarney R, Smith CM, Ellis N, et al.
No. 49Generalisability in economic evaluation studies in healthcare: a review and case studies.
By Sculpher MJ, Pang FS, Manca A, Drummond MF, Golder S, Urdahl H, et al.
No. 50Virtual outreach: a randomised controlled trial and economic evaluation of joint teleconferenced medical consultations.
By Wallace P, Barber J, Clayton W, Currell R, Fleming K, Garner P, et al.
Volume 9, 2005
No. 1Randomised controlled multiple treatment comparison to provide a cost-effectiveness rationale for the selection of antimicrobial therapy in acne.
By Ozolins M, Eady EA, Avery A, Cunliffe WJ, O’Neill C, Simpson NB, et al.
No. 2Do the findings of case series studies vary significantly according to methodological characteristics?
By Dalziel K, Round A, Stein K, Garside R, Castelnuovo E, Payne L.
No. 3Improving the referral process for familial breast cancer genetic counselling: findings of three randomised controlled trials of two interventions.
By Wilson BJ, Torrance N, Mollison J, Wordsworth S, Gray JR, Haites NE, et al.
No. 4Randomised evaluation of alternative electrosurgical modalities to treat bladder outflow obstruction in men with benign prostatic hyperplasia.
By Fowler C, McAllister W, Plail R, Karim O, Yang Q.
No. 5A pragmatic randomised controlled trial of the cost-effectiveness of palliative therapies for patients with inoperable oesophageal cancer.
By Shenfine J, McNamee P, Steen N, Bond J, Griffin SM.
No. 6Impact of computer-aided detection prompts on the sensitivity and specificity of screening mammography.
By Taylor P, Champness J, Given- Wilson R, Johnston K, Potts H.
No. 7Issues in data monitoring and interim analysis of trials.
By Grant AM, Altman DG, Babiker AB, Campbell MK, Clemens FJ, Darbyshire JH, et al.
No. 8Lay public’s understanding of equipoise and randomisation in randomised controlled trials.
By Robinson EJ, Kerr CEP, Stevens AJ, Lilford RJ, Braunholtz DA, Edwards SJ, et al.
No. 9Clinical and cost-effectiveness of electroconvulsive therapy for depressive illness, schizophrenia, catatonia and mania: systematic reviews and economic modelling studies.
By Greenhalgh J, Knight C, Hind D, Beverley C, Walters S.
No. 10Measurement of health-related quality of life for people with dementia: development of a new instrument (DEMQOL) and an evaluation of current methodology.
By Smith SC, Lamping DL, Banerjee S, Harwood R, Foley B, Smith P, et al.
No. 11Clinical effectiveness and cost-effectiveness of drotrecogin alfa (activated) (Xigris®) for the treatment of severe sepsis in adults: a systematic review and economic evaluation.
By Green C, Dinnes J, Takeda A, Shepherd J, Hartwell D, Cave C, et al.
No. 12A methodological review of how heterogeneity has been examined in systematic reviews of diagnostic test accuracy.
By Dinnes J, Deeks J, Kirby J, Roderick P.
No. 13Cervical screening programmes: can automation help? Evidence from systematic reviews, an economic analysis and a simulation modelling exercise applied to the UK.
By Willis BH, Barton P, Pearmain P, Bryan S, Hyde C.
No. 14Laparoscopic surgery for inguinal hernia repair: systematic review of effectiveness and economic evaluation.
By McCormack K, Wake B, Perez J, Fraser C, Cook J, McIntosh E, et al.
No. 15Clinical effectiveness, tolerability and cost-effectiveness of newer drugs for epilepsy in adults: a systematic review and economic evaluation.
By Wilby J, Kainth A, Hawkins N, Epstein D, McIntosh H, McDaid C, et al.
No. 16A randomised controlled trial to compare the cost-effectiveness of tricyclic antidepressants, selective serotonin reuptake inhibitors and lofepramine.
By Peveler R, Kendrick T, Buxton M, Longworth L, Baldwin D, Moore M, et al.
No. 17Clinical effectiveness and cost-effectiveness of immediate angioplasty for acute myocardial infarction: systematic review and economic evaluation.
By Hartwell D, Colquitt J, Loveman E, Clegg AJ, Brodin H, Waugh N, et al.
No. 18A randomised controlled comparison of alternative strategies in stroke care.
By Kalra L, Evans A, Perez I, Knapp M, Swift C, Donaldson N.
No. 19The investigation and analysis of critical incidents and adverse events in healthcare.
By Woloshynowych M, Rogers S, Taylor-Adams S, Vincent C.
No. 20Potential use of routine databases in health technology assessment.
By Raftery J, Roderick P, Stevens A.
No. 21Clinical and cost-effectiveness of newer immunosuppressive regimens in renal transplantation: a systematic review and modelling study.
By Woodroffe R, Yao GL, Meads C, Bayliss S, Ready A, Raftery J, et al.
No. 22A systematic review and economic evaluation of alendronate, etidronate, risedronate, raloxifene and teriparatide for the prevention and treatment of postmenopausal osteoporosis.
By Stevenson M, Lloyd Jones M, De Nigris E, Brewer N, Davis S, Oakley J.
DOI: 10.3310/hta14040 Health Technology Assessment 2010; Vol. 14: No. 4
© 2010 Queen’s Printer and Controller of HMSO. All rights reserved.
343
No. 23A systematic review to examine the impact of psycho-educational interventions on health outcomes and costs in adults and children with difficult asthma.
By Smith JR, Mugford M, Holland R, Candy B, Noble MJ, Harrison BDW, et al.
No. 24An evaluation of the costs, effectiveness and quality of renal replacement therapy provision in renal satellite units in England and Wales.
By Roderick P, Nicholson T, Armitage A, Mehta R, Mullee M, Gerard K, et al.
No. 25Imatinib for the treatment of patients with unresectable and/or metastatic gastrointestinal stromal tumours: systematic review and economic evaluation.
By Wilson J, Connock M, Song F, Yao G, Fry-Smith A, Raftery J, et al.
No. 26Indirect comparisons of competing interventions.
By Glenny AM, Altman DG, Song F, Sakarovitch C, Deeks JJ, D’Amico R, et al.
No. 27Cost-effectiveness of alternative strategies for the initial medical management of non-ST elevation acute coronary syndrome: systematic review and decision-analytical modelling.
By Robinson M, Palmer S, Sculpher M, Philips Z, Ginnelly L, Bowens A, et al.
No. 28Outcomes of electrically stimulated gracilis neosphincter surgery.
By Tillin T, Chambers M, Feldman R.
No. 29The effectiveness and cost-effectiveness of pimecrolimus and tacrolimus for atopic eczema: a systematic review and economic evaluation.
By Garside R, Stein K, Castelnuovo E, Pitt M, Ashcroft D, Dimmock P, et al.
No. 30Systematic review on urine albumin testing for early detection of diabetic complications.
By Newman DJ, Mattock MB, Dawnay ABS, Kerry S, McGuire A, Yaqoob M, et al.
No. 31Randomised controlled trial of the cost-effectiveness of water-based therapy for lower limb osteoarthritis.
By Cochrane T, Davey RC, Matthes Edwards SM.
No. 32Longer term clinical and economic benefits of offering acupuncture care to patients with chronic low back pain.
By Thomas KJ, MacPherson H, Ratcliffe J, Thorpe L, Brazier J, Campbell M, et al.
No. 33Cost-effectiveness and safety of epidural steroids in the management of sciatica.
By Price C, Arden N, Coglan L, Rogers P.
No. 34The British Rheumatoid Outcome Study Group (BROSG) randomised controlled trial to compare the effectiveness and cost-effectiveness of aggressive versus symptomatic therapy in established rheumatoid arthritis.
By Symmons D, Tricker K, Roberts C, Davies L, Dawes P, Scott DL.
No. 35Conceptual framework and systematic review of the effects of participants’ and professionals’ preferences in randomised controlled trials.
By King M, Nazareth I, Lampe F, Bower P, Chandler M, Morou M, et al.
No. 36The clinical and cost-effectiveness of implantable cardioverter defibrillators: a systematic review.
By Bryant J, Brodin H, Loveman E, Payne E, Clegg A.
No. 37A trial of problem-solving by community mental health nurses for anxiety, depression and life difficulties among general practice patients. The CPN-GP study.
By Kendrick T, Simons L, Mynors-Wallis L, Gray A, Lathlean J, Pickering R, et al.
No. 38The causes and effects of socio-demographic exclusions from clinical trials.
By Bartlett C, Doyal L, Ebrahim S, Davey P, Bachmann M, Egger M, et al.
No. 39Is hydrotherapy cost-effective? A randomised controlled trial of combined hydrotherapy programmes compared with physiotherapy land techniques in children with juvenile idiopathic arthritis.
By Epps H, Ginnelly L, Utley M, Southwood T, Gallivan S, Sculpher M, et al.
No. 40A randomised controlled trial and cost-effectiveness study of systematic screening (targeted and total population screening) versus routine practice for the detection of atrial fibrillation in people aged 65 and over. The SAFE study.
By Hobbs FDR, Fitzmaurice DA, Mant J, Murray E, Jowett S, Bryan S, et al.
No. 41Displaced intracapsular hip fractures in fit, older people: a randomised comparison of reduction and fixation, bipolar hemiarthroplasty and total hip arthroplasty.
By Keating JF, Grant A, Masson M, Scott NW, Forbes JF.
No. 42Long-term outcome of cognitive behaviour therapy clinical trials in central Scotland.
By Durham RC, Chambers JA, Power KG, Sharp DM, Macdonald RR, Major KA, et al.
No. 43The effectiveness and cost-effectiveness of dual-chamber pacemakers compared with single-chamber pacemakers for bradycardia due to atrioventricular block or sick sinus syndrome: systematic review and economic evaluation.
By Castelnuovo E, Stein K, Pitt M, Garside R, Payne E.
No. 44Newborn screening for congenital heart defects: a systematic review and cost-effectiveness analysis.
By Knowles R, Griebsch I, Dezateux C, Brown J, Bull C, Wren C.
No. 45The clinical and cost-effectiveness of left ventricular assist devices for end-stage heart failure: a systematic review and economic evaluation.
By Clegg AJ, Scott DA, Loveman E, Colquitt J, Hutchinson J, Royle P, et al.
No. 46The effectiveness of the Heidelberg Retina Tomograph and laser diagnostic glaucoma scanning system (GDx) in detecting and monitoring glaucoma.
By Kwartz AJ, Henson DB, Harper RA, Spencer AF, McLeod D.
No. 47Clinical and cost-effectiveness of autologous chondrocyte implantation for cartilage defects in knee joints: systematic review and economic evaluation.
By Clar C, Cummins E, McIntyre L, Thomas S, Lamb J, Bain L, et al.
Health Technology Assessment reports published to date
344
No. 48Systematic review of effectiveness of different treatments for childhood retinoblastoma.
By McDaid C, Hartley S, Bagnall A-M, Ritchie G, Light K, Riemsma R.
No. 49Towards evidence-based guidelines for the prevention of venous thromboembolism: systematic reviews of mechanical methods, oral anticoagulation, dextran and regional anaesthesia as thromboprophylaxis.
By Roderick P, Ferris G, Wilson K, Halls H, Jackson D, Collins R, et al.
No. 50The effectiveness and cost-effectiveness of parent training/education programmes for the treatment of conduct disorder, including oppositional defiant disorder, in children.
By Dretzke J, Frew E, Davenport C, Barlow J, Stewart-Brown S, Sandercock J, et al.
Volume 10, 2006
No. 1The clinical and cost-effectiveness of donepezil, rivastigmine, galantamine and memantine for Alzheimer’s disease.
By Loveman E, Green C, Kirby J, Takeda A, Picot J, Payne E, et al.
No. 2FOOD: a multicentre randomised trial evaluating feeding policies in patients admitted to hospital with a recent stroke.
By Dennis M, Lewis S, Cranswick G, Forbes J.
No. 3The clinical effectiveness and cost-effectiveness of computed tomography screening for lung cancer: systematic reviews.
By Black C, Bagust A, Boland A, Walker S, McLeod C, De Verteuil R, et al.
No. 4A systematic review of the effectiveness and cost-effectiveness of neuroimaging assessments used to visualise the seizure focus in people with refractory epilepsy being considered for surgery.
By Whiting P, Gupta R, Burch J, Mujica Mota RE, Wright K, Marson A, et al.
No. 5Comparison of conference abstracts and presentations with full-text articles in the health technology assessments of rapidly evolving technologies.
By Dundar Y, Dodd S, Dickson R, Walley T, Haycox A, Williamson PR.
No. 6Systematic review and evaluation of methods of assessing urinary incontinence.
By Martin JL, Williams KS, Abrams KR, Turner DA, Sutton AJ, Chapple C, et al.
No. 7The clinical effectiveness and cost-effectiveness of newer drugs for children with epilepsy. A systematic review.
By Connock M, Frew E, Evans B-W, Bryan S, Cummins C, Fry-Smith A, et al.
No. 8Surveillance of Barrett’s oesophagus: exploring the uncertainty through systematic review, expert workshop and economic modelling.
By Garside R, Pitt M, Somerville M, Stein K, Price A, Gilbert N.
No. 9Topotecan, pegylated liposomal doxorubicin hydrochloride and paclitaxel for second-line or subsequent treatment of advanced ovarian cancer: a systematic review and economic evaluation.
By Main C, Bojke L, Griffin S, Norman G, Barbieri M, Mather L, et al.
No. 10Evaluation of molecular techniques in prediction and diagnosis of cytomegalovirus disease in immunocompromised patients.
By Szczepura A, Westmoreland D, Vinogradova Y, Fox J, Clark M.
No. 11Screening for thrombophilia in high-risk situations: systematic review and cost-effectiveness analysis. The Thrombosis: Risk and Economic Assessment of Thrombophilia Screening (TREATS) study.
By Wu O, Robertson L, Twaddle S, Lowe GDO, Clark P, Greaves M, et al.
No. 12A series of systematic reviews to inform a decision analysis for sampling and treating infected diabetic foot ulcers.
By Nelson EA, O’Meara S, Craig D, Iglesias C, Golder S, Dalton J, et al.
No. 13Randomised clinical trial, observational study and assessment of cost-effectiveness of the treatment of varicose veins (REACTIV trial).
By Michaels JA, Campbell WB, Brazier JE, MacIntyre JB, Palfreyman SJ, Ratcliffe J, et al.
No. 14The cost-effectiveness of screening for oral cancer in primary care.
By Speight PM, Palmer S, Moles DR, Downer MC, Smith DH, Henriksson M, et al.
No. 15Measurement of the clinical and cost-effectiveness of non-invasive diagnostic testing strategies for deep vein thrombosis.
By Goodacre S, Sampson F, Stevenson M, Wailoo A, Sutton A, Thomas S, et al.
No. 16Systematic review of the effectiveness and cost-effectiveness of HealOzone®
for the treatment of occlusal pit/fissure caries and root caries.
By Brazzelli M, McKenzie L, Fielding S, Fraser C, Clarkson J, Kilonzo M, et al.
No. 17Randomised controlled trials of conventional antipsychotic versus new atypical drugs, and new atypical drugs versus clozapine, in people with schizophrenia responding poorly to, or intolerant of, current drug treatment.
By Lewis SW, Davies L, Jones PB, Barnes TRE, Murray RM, Kerwin R, et al.
No. 18Diagnostic tests and algorithms used in the investigation of haematuria: systematic reviews and economic evaluation.
By Rodgers M, Nixon J, Hempel S, Aho T, Kelly J, Neal D, et al.
No. 19Cognitive behavioural therapy in addition to antispasmodic therapy for irritable bowel syndrome in primary care: randomised controlled trial.
By Kennedy TM, Chalder T, McCrone P, Darnley S, Knapp M, Jones RH, et al.
No. 20A systematic review of the clinical effectiveness and cost-effectiveness of enzyme replacement therapies for Fabry’s disease and mucopolysaccharidosis type 1.
By Connock M, Juarez-Garcia A, Frew E, Mans A, Dretzke J, Fry-Smith A, et al.
No. 21Health benefits of antiviral therapy for mild chronic hepatitis C: randomised controlled trial and economic evaluation.
By Wright M, Grieve R, Roberts J, Main J, Thomas HC, on behalf of the UK Mild Hepatitis C Trial Investigators.
No. 22Pressure relieving support surfaces: a randomised evaluation.
By Nixon J, Nelson EA, Cranny G, Iglesias CP, Hawkins K, Cullum NA, et al.
DOI: 10.3310/hta14040 Health Technology Assessment 2010; Vol. 14: No. 4
© 2010 Queen’s Printer and Controller of HMSO. All rights reserved.
345
No. 23A systematic review and economic model of the effectiveness and cost-effectiveness of methylphenidate, dexamfetamine and atomoxetine for the treatment of attention deficit hyperactivity disorder in children and adolescents.
By King S, Griffin S, Hodges Z, Weatherly H, Asseburg C, Richardson G, et al.
No. 24The clinical effectiveness and cost-effectiveness of enzyme replacement therapy for Gaucher’s disease: a systematic review.
By Connock M, Burls A, Frew E, Fry-Smith A, Juarez-Garcia A, McCabe C, et al.
No. 25Effectiveness and cost-effectiveness of salicylic acid and cryotherapy for cutaneous warts. An economic decision model.
By Thomas KS, Keogh-Brown MR, Chalmers JR, Fordham RJ, Holland RC, Armstrong SJ, et al.
No. 26A systematic literature review of the effectiveness of non-pharmacological interventions to prevent wandering in dementia and evaluation of the ethical implications and acceptability of their use.
By Robinson L, Hutchings D, Corner L, Beyer F, Dickinson H, Vanoli A, et al.
No. 27A review of the evidence on the effects and costs of implantable cardioverter defibrillator therapy in different patient groups, and modelling of cost-effectiveness and cost–utility for these groups in a UK context.
By Buxton M, Caine N, Chase D, Connelly D, Grace A, Jackson C, et al.
No. 28Adefovir dipivoxil and pegylated interferon alfa-2a for the treatment of chronic hepatitis B: a systematic review and economic evaluation.
By Shepherd J, Jones J, Takeda A, Davidson P, Price A.
No. 29An evaluation of the clinical and cost-effectiveness of pulmonary artery catheters in patient management in intensive care: a systematic review and a randomised controlled trial.
By Harvey S, Stevens K, Harrison D, Young D, Brampton W, McCabe C, et al.
No. 30Accurate, practical and cost-effective assessment of carotid stenosis in the UK.
By Wardlaw JM, Chappell FM, Stevenson M, De Nigris E, Thomas S, Gillard J, et al.
No. 31Etanercept and infliximab for the treatment of psoriatic arthritis: a systematic review and economic evaluation.
By Woolacott N, Bravo Vergel Y, Hawkins N, Kainth A, Khadjesari Z, Misso K, et al.
No. 32The cost-effectiveness of testing for hepatitis C in former injecting drug users.
By Castelnuovo E, Thompson-Coon J, Pitt M, Cramp M, Siebert U, Price A, et al.
No. 33Computerised cognitive behaviour therapy for depression and anxiety update: a systematic review and economic evaluation.
By Kaltenthaler E, Brazier J, De Nigris E, Tumur I, Ferriter M, Beverley C, et al.
No. 34Cost-effectiveness of using prognostic information to select women with breast cancer for adjuvant systemic therapy.
By Williams C, Brunskill S, Altman D, Briggs A, Campbell H, Clarke M, et al.
No. 35Psychological therapies including dialectical behaviour therapy for borderline personality disorder: a systematic review and preliminary economic evaluation.
By Brazier J, Tumur I, Holmes M, Ferriter M, Parry G, Dent-Brown K, et al.
No. 36Clinical effectiveness and cost-effectiveness of tests for the diagnosis and investigation of urinary tract infection in children: a systematic review and economic model.
By Whiting P, Westwood M, Bojke L, Palmer S, Richardson G, Cooper J, et al.
No. 37Cognitive behavioural therapy in chronic fatigue syndrome: a randomised controlled trial of an outpatient group programme.
By O’Dowd H, Gladwell P, Rogers CA, Hollinghurst S, Gregory A.
No. 38A comparison of the cost-effectiveness of five strategies for the prevention of nonsteroidal anti-inflammatory drug-induced gastrointestinal toxicity: a systematic review with economic modelling.
By Brown TJ, Hooper L, Elliott RA, Payne K, Webb R, Roberts C, et al.
No. 39The effectiveness and cost-effectiveness of computed tomography screening for coronary artery disease: systematic review.
By Waugh N, Black C, Walker S, McIntyre L, Cummins E, Hillis G.
No. 40What are the clinical outcome and cost-effectiveness of endoscopy undertaken by nurses when compared with doctors? A Multi-Institution Nurse Endoscopy Trial (MINuET).
By Williams J, Russell I, Durai D, Cheung W-Y, Farrin A, Bloor K, et al.
No. 41The clinical and cost-effectiveness of oxaliplatin and capecitabine for the adjuvant treatment of colon cancer: systematic review and economic evaluation.
By Pandor A, Eggington S, Paisley S, Tappenden P, Sutcliffe P.
No. 42A systematic review of the effectiveness of adalimumab, etanercept and infliximab for the treatment of rheumatoid arthritis in adults and an economic evaluation of their cost-effectiveness.
By Chen Y-F, Jobanputra P, Barton P, Jowett S, Bryan S, Clark W, et al.
No. 43Telemedicine in dermatology: a randomised controlled trial.
By Bowns IR, Collins K, Walters SJ, McDonagh AJG.
No. 44Cost-effectiveness of cell salvage and alternative methods of minimising perioperative allogeneic blood transfusion: a systematic review and economic model.
By Davies L, Brown TJ, Haynes S, Payne K, Elliott RA, McCollum C.
No. 45Clinical effectiveness and cost-effectiveness of laparoscopic surgery for colorectal cancer: systematic reviews and economic evaluation.
By Murray A, Lourenco T, de Verteuil R, Hernandez R, Fraser C, McKinley A, et al.
No. 46Etanercept and efalizumab for the treatment of psoriasis: a systematic review.
By Woolacott N, Hawkins N, Mason A, Kainth A, Khadjesari Z, Bravo Vergel Y, et al.
No. 47Systematic reviews of clinical decision tools for acute abdominal pain.
By Liu JLY, Wyatt JC, Deeks JJ, Clamp S, Keen J, Verde P, et al.
No. 48Evaluation of the ventricular assist device programme in the UK.
By Sharples L, Buxton M, Caine N, Cafferty F, Demiris N, Dyer M, et al.
Health Technology Assessment reports published to date
346
No. 49A systematic review and economic model of the clinical and cost-effectiveness of immunosuppressive therapy for renal transplantation in children.
By Yao G, Albon E, Adi Y, Milford D, Bayliss S, Ready A, et al.
No. 50Amniocentesis results: investigation of anxiety. The ARIA trial.
By Hewison J, Nixon J, Fountain J, Cocks K, Jones C, Mason G, et al.
Volume 11, 2007
No. 1Pemetrexed disodium for the treatment of malignant pleural mesothelioma: a systematic review and economic evaluation.
By Dundar Y, Bagust A, Dickson R, Dodd S, Green J, Haycox A, et al.
No. 2A systematic review and economic model of the clinical effectiveness and cost-effectiveness of docetaxel in combination with prednisone or prednisolone for the treatment of hormone-refractory metastatic prostate cancer.
By Collins R, Fenwick E, Trowman R, Perard R, Norman G, Light K, et al.
No. 3A systematic review of rapid diagnostic tests for the detection of tuberculosis infection.
By Dinnes J, Deeks J, Kunst H, Gibson A, Cummins E, Waugh N, et al.
No. 4The clinical effectiveness and cost-effectiveness of strontium ranelate for the prevention of osteoporotic fragility fractures in postmenopausal women.
By Stevenson M, Davis S, Lloyd-Jones M, Beverley C.
No. 5A systematic review of quantitative and qualitative research on the role and effectiveness of written information available to patients about individual medicines.
By Raynor DK, Blenkinsopp A, Knapp P, Grime J, Nicolson DJ, Pollock K, et al.
No. 6Oral naltrexone as a treatment for relapse prevention in formerly opioid-dependent drug users: a systematic review and economic evaluation.
By Adi Y, Juarez-Garcia A, Wang D, Jowett S, Frew E, Day E, et al.
No. 7Glucocorticoid-induced osteoporosis: a systematic review and cost–utility analysis.
By Kanis JA, Stevenson M, McCloskey EV, Davis S, Lloyd-Jones M.
No. 8Epidemiological, social, diagnostic and economic evaluation of population screening for genital chlamydial infection.
By Low N, McCarthy A, Macleod J, Salisbury C, Campbell R, Roberts TE, et al.
No. 9Methadone and buprenorphine for the management of opioid dependence: a systematic review and economic evaluation.
By Connock M, Juarez-Garcia A, Jowett S, Frew E, Liu Z, Taylor RJ, et al.
No. 10Exercise Evaluation Randomised Trial (EXERT): a randomised trial comparing GP referral for leisure centre-based exercise, community-based walking and advice only.
By Isaacs AJ, Critchley JA, See Tai S, Buckingham K, Westley D, Harridge SDR, et al.
No. 11Interferon alfa (pegylated and non-pegylated) and ribavirin for the treatment of mild chronic hepatitis C: a systematic review and economic evaluation.
By Shepherd J, Jones J, Hartwell D, Davidson P, Price A, Waugh N.
No. 12Systematic review and economic evaluation of bevacizumab and cetuximab for the treatment of metastatic colorectal cancer.
By Tappenden P, Jones R, Paisley S, Carroll C.
No. 13A systematic review and economic evaluation of epoetin alfa, epoetin beta and darbepoetin alfa in anaemia associated with cancer, especially that attributable to cancer treatment.
By Wilson J, Yao GL, Raftery J, Bohlius J, Brunskill S, Sandercock J, et al.
No. 14A systematic review and economic evaluation of statins for the prevention of coronary events.
By Ward S, Lloyd Jones M, Pandor A, Holmes M, Ara R, Ryan A, et al.
No. 15A systematic review of the effectiveness and cost-effectiveness of different models of community-based respite care for frail older people and their carers.
By Mason A, Weatherly H, Spilsbury K, Arksey H, Golder S, Adamson J, et al.
No. 16Additional therapy for young children with spastic cerebral palsy: a randomised controlled trial.
By Weindling AM, Cunningham CC, Glenn SM, Edwards RT, Reeves DJ.
No. 17Screening for type 2 diabetes: literature review and economic modelling.
By Waugh N, Scotland G, McNamee P, Gillett M, Brennan A, Goyder E, et al.
No. 18The effectiveness and cost-effectiveness of cinacalcet for secondary hyperparathyroidism in end-stage renal disease patients on dialysis: a systematic review and economic evaluation.
By Garside R, Pitt M, Anderson R, Mealing S, Roome C, Snaith A, et al.
No. 19The clinical effectiveness and cost-effectiveness of gemcitabine for metastatic breast cancer: a systematic review and economic evaluation.
By Takeda AL, Jones J, Loveman E, Tan SC, Clegg AJ.
No. 20A systematic review of duplex ultrasound, magnetic resonance angiography and computed tomography angiography for the diagnosis and assessment of symptomatic, lower limb peripheral arterial disease.
By Collins R, Cranny G, Burch J, Aguiar-Ibáñez R, Craig D, Wright K, et al.
No. 21The clinical effectiveness and cost-effectiveness of treatments for children with idiopathic steroid-resistant nephrotic syndrome: a systematic review.
By Colquitt JL, Kirby J, Green C, Cooper K, Trompeter RS.
No. 22A systematic review of the routine monitoring of growth in children of primary school age to identify growth-related conditions.
By Fayter D, Nixon J, Hartley S, Rithalia A, Butler G, Rudolf M, et al.
No. 23Systematic review of the effectiveness of preventing and treating Staphylococcus aureus carriage in reducing peritoneal catheter-related infections.
By McCormack K, Rabindranath K, Kilonzo M, Vale L, Fraser C, McIntyre L, et al.
DOI: 10.3310/hta14040 Health Technology Assessment 2010; Vol. 14: No. 4
© 2010 Queen’s Printer and Controller of HMSO. All rights reserved.
347
No. 24The clinical effectiveness and cost of repetitive transcranial magnetic stimulation versus electroconvulsive therapy in severe depression: a multicentre pragmatic randomised controlled trial and economic analysis.
By McLoughlin DM, Mogg A, Eranti S, Pluck G, Purvis R, Edwards D, et al.
No. 25A randomised controlled trial and economic evaluation of direct versus indirect and individual versus group modes of speech and language therapy for children with primary language impairment.
By Boyle J, McCartney E, Forbes J, O’Hare A.
No. 26Hormonal therapies for early breast cancer: systematic review and economic evaluation.
By Hind D, Ward S, De Nigris E, Simpson E, Carroll C, Wyld L.
No. 27Cardioprotection against the toxic effects of anthracyclines given to children with cancer: a systematic review.
By Bryant J, Picot J, Levitt G, Sullivan I, Baxter L, Clegg A.
No. 28Adalimumab, etanercept and infliximab for the treatment of ankylosing spondylitis: a systematic review and economic evaluation.
By McLeod C, Bagust A, Boland A, Dagenais P, Dickson R, Dundar Y, et al.
No. 29Prenatal screening and treatment strategies to prevent group B streptococcal and other bacterial infections in early infancy: cost-effectiveness and expected value of information analyses.
By Colbourn T, Asseburg C, Bojke L, Philips Z, Claxton K, Ades AE, et al.
No. 30Clinical effectiveness and cost-effectiveness of bone morphogenetic proteins in the non-healing of fractures and spinal fusion: a systematic review.
By Garrison KR, Donell S, Ryder J, Shemilt I, Mugford M, Harvey I, et al.
No. 31A randomised controlled trial of postoperative radiotherapy following breast-conserving surgery in a minimum-risk older population. The PRIME trial.
By Prescott RJ, Kunkler IH, Williams LJ, King CC, Jack W, van der Pol M, et al.
No. 32Current practice, accuracy, effectiveness and cost-effectiveness of the school entry hearing screen.
By Bamford J, Fortnum H, Bristow K, Smith J, Vamvakas G, Davies L, et al.
No. 33The clinical effectiveness and cost-effectiveness of inhaled insulin in diabetes mellitus: a systematic review and economic evaluation.
By Black C, Cummins E, Royle P, Philip S, Waugh N.
No. 34Surveillance of cirrhosis for hepatocellular carcinoma: systematic review and economic analysis.
By Thompson Coon J, Rogers G, Hewson P, Wright D, Anderson R, Cramp M, et al.
No. 35The Birmingham Rehabilitation Uptake Maximisation Study (BRUM). Homebased compared with hospital-based cardiac rehabilitation in a multi-ethnic population: cost-effectiveness and patient adherence.
By Jolly K, Taylor R, Lip GYH, Greenfield S, Raftery J, Mant J, et al.
No. 36A systematic review of the clinical, public health and cost-effectiveness of rapid diagnostic tests for the detection and identification of bacterial intestinal pathogens in faeces and food.
By Abubakar I, Irvine L, Aldus CF, Wyatt GM, Fordham R, Schelenz S, et al.
No. 37A randomised controlled trial examining the longer-term outcomes of standard versus new antiepileptic drugs. The SANAD trial.
By Marson AG, Appleton R, Baker GA, Chadwick DW, Doughty J, Eaton B, et al.
No. 38Clinical effectiveness and cost-effectiveness of different models of managing long-term oral anti-coagulation therapy: a systematic review and economic modelling.
By Connock M, Stevens C, Fry-Smith A, Jowett S, Fitzmaurice D, Moore D, et al.
No. 39A systematic review and economic model of the clinical effectiveness and cost-effectiveness of interventions for preventing relapse in people with bipolar disorder.
By Soares-Weiser K, Bravo Vergel Y, Beynon S, Dunn G, Barbieri M, Duffy S, et al.
No. 40Taxanes for the adjuvant treatment of early breast cancer: systematic review and economic evaluation.
By Ward S, Simpson E, Davis S, Hind D, Rees A, Wilkinson A.
No. 41The clinical effectiveness and cost-effectiveness of screening for open angle glaucoma: a systematic review and economic evaluation.
By Burr JM, Mowatt G, Hernández R, Siddiqui MAR, Cook J, Lourenco T, et al.
No. 42Acceptability, benefit and costs of early screening for hearing disability: a study of potential screening tests and models.
By Davis A, Smith P, Ferguson M, Stephens D, Gianopoulos I.
No. 43Contamination in trials of educational interventions.
By Keogh-Brown MR, Bachmann MO, Shepstone L, Hewitt C, Howe A, Ramsay CR, et al.
No. 44Overview of the clinical effectiveness of positron emission tomography imaging in selected cancers.
By Facey K, Bradbury I, Laking G, Payne E.
No. 45The effectiveness and cost-effectiveness of carmustine implants and temozolomide for the treatment of newly diagnosed high-grade glioma: a systematic review and economic evaluation.
By Garside R, Pitt M, Anderson R, Rogers G, Dyer M, Mealing S, et al.
No. 46Drug-eluting stents: a systematic review and economic evaluation.
By Hill RA, Boland A, Dickson R, Dundar Y, Haycox A, McLeod C, et al.
No. 47The clinical effectiveness and cost-effectiveness of cardiac resynchronisation (biventricular pacing) for heart failure: systematic review and economic model.
By Fox M, Mealing S, Anderson R, Dean J, Stein K, Price A, et al.
No. 48Recruitment to randomised trials: strategies for trial enrolment and participation study. The STEPS study.
By Campbell MK, Snowdon C, Francis D, Elbourne D, McDonald AM, Knight R, et al.
Health Technology Assessment reports published to date
348
No. 49Cost-effectiveness of functional cardiac testing in the diagnosis and management of coronary artery disease: a randomised controlled trial. The CECaT trial.
By Sharples L, Hughes V, Crean A, Dyer M, Buxton M, Goldsmith K, et al.
No. 50Evaluation of diagnostic tests when there is no gold standard. A review of methods.
By Rutjes AWS, Reitsma JB, Coomarasamy A, Khan KS, Bossuyt PMM.
No. 51Systematic reviews of the clinical effectiveness and cost-effectiveness of proton pump inhibitors in acute upper gastrointestinal bleeding.
By Leontiadis GI, Sreedharan A, Dorward S, Barton P, Delaney B, Howden CW, et al.
No. 52A review and critique of modelling in prioritising and designing screening programmes.
By Karnon J, Goyder E, Tappenden P, McPhie S, Towers I, Brazier J, et al.
No. 53An assessment of the impact of the NHS Health Technology Assessment Programme.
By Hanney S, Buxton M, Green C, Coulson D, Raftery J.
Volume 12, 2008
No. 1A systematic review and economic model of switching from nonglycopeptide to glycopeptide antibiotic prophylaxis for surgery.
By Cranny G, Elliott R, Weatherly H, Chambers D, Hawkins N, Myers L, et al.
No. 2‘Cut down to quit’ with nicotine replacement therapies in smoking cessation: a systematic review of effectiveness and economic analysis.
By Wang D, Connock M, Barton P, Fry-Smith A, Aveyard P, Moore D.
No. 3A systematic review of the effectiveness of strategies for reducing fracture risk in children with juvenile idiopathic arthritis with additional data on long-term risk of fracture and cost of disease management.
By Thornton J, Ashcroft D, O’Neill T, Elliott R, Adams J, Roberts C, et al.
No. 4Does befriending by trained lay workers improve psychological well-being and quality of life for carers of people with dementia, and at what cost? A randomised controlled trial.
By Charlesworth G, Shepstone L, Wilson E, Thalanany M, Mugford M, Poland F.
No. 5A multi-centre retrospective cohort study comparing the efficacy, safety and cost-effectiveness of hysterectomy and uterine artery embolisation for the treatment of symptomatic uterine fibroids. The HOPEFUL study.
By Hirst A, Dutton S, Wu O, Briggs A, Edwards C, Waldenmaier L, et al.
No. 6Methods of prediction and prevention of pre-eclampsia: systematic reviews of accuracy and effectiveness literature with economic modelling.
By Meads CA, Cnossen JS, Meher S, Juarez-Garcia A, ter Riet G, Duley L, et al.
No. 7The use of economic evaluations in NHS decision-making: a review and empirical investigation.
By Williams I, McIver S, Moore D, Bryan S.
No. 8Stapled haemorrhoidectomy (haemorrhoidopexy) for the treatment of haemorrhoids: a systematic review and economic evaluation.
By Burch J, Epstein D, Baba-Akbari A, Weatherly H, Fox D, Golder S, et al.
No. 9The clinical effectiveness of diabetes education models for Type 2 diabetes: a systematic review.
By Loveman E, Frampton GK, Clegg AJ.
No. 10Payment to healthcare professionals for patient recruitment to trials: systematic review and qualitative study.
By Raftery J, Bryant J, Powell J, Kerr C, Hawker S.
No. 11Cyclooxygenase-2 selective non-steroidal anti-inflammatory drugs (etodolac, meloxicam, celecoxib, rofecoxib, etoricoxib, valdecoxib and lumiracoxib) for osteoarthritis and rheumatoid arthritis: a systematic review and economic evaluation.
By Chen Y-F, Jobanputra P, Barton P, Bryan S, Fry-Smith A, Harris G, et al.
No. 12The clinical effectiveness and cost-effectiveness of central venous catheters treated with anti-infective agents in preventing bloodstream infections: a systematic review and economic evaluation.
By Hockenhull JC, Dwan K, Boland A, Smith G, Bagust A, Dundar Y, et al.
No. 13Stepped treatment of older adults on laxatives. The STOOL trial.
By Mihaylov S, Stark C, McColl E, Steen N, Vanoli A, Rubin G, et al.
No. 14A randomised controlled trial of cognitive behaviour therapy in adolescents with major depression treated by selective serotonin reuptake inhibitors. The ADAPT trial.
By Goodyer IM, Dubicka B, Wilkinson P, Kelvin R, Roberts C, Byford S, et al.
No. 15The use of irinotecan, oxaliplatin and raltitrexed for the treatment of advanced colorectal cancer: systematic review and economic evaluation.
By Hind D, Tappenden P, Tumur I, Eggington E, Sutcliffe P, Ryan A.
No. 16Ranibizumab and pegaptanib for the treatment of age-related macular degeneration: a systematic review and economic evaluation.
By Colquitt JL, Jones J, Tan SC, Takeda A, Clegg AJ, Price A.
No. 17Systematic review of the clinical effectiveness and cost-effectiveness of 64-slice or higher computed tomography angiography as an alternative to invasive coronary angiography in the investigation of coronary artery disease.
By Mowatt G, Cummins E, Waugh N, Walker S, Cook J, Jia X, et al.
No. 18Structural neuroimaging in psychosis: a systematic review and economic evaluation.
By Albon E, Tsourapas A, Frew E, Davenport C, Oyebode F, Bayliss S, et al.
No. 19Systematic review and economic analysis of the comparative effectiveness of different inhaled corticosteroids and their usage with long-acting beta2 agonists for the treatment of chronic asthma in adults and children aged 12 years and over.
By Shepherd J, Rogers G, Anderson R, Main C, Thompson-Coon J, Hartwell D, et al.
DOI: 10.3310/hta14040 Health Technology Assessment 2010; Vol. 14: No. 4
© 2010 Queen’s Printer and Controller of HMSO. All rights reserved.
349
No. 20Systematic review and economic analysis of the comparative effectiveness of different inhaled corticosteroids and their usage with long-acting beta2 agonists for the treatment of chronic asthma in children under the age of 12 years.
By Main C, Shepherd J, Anderson R, Rogers G, Thompson-Coon J, Liu Z, et al.
No. 21Ezetimibe for the treatment of hypercholesterolaemia: a systematic review and economic evaluation.
By Ara R, Tumur I, Pandor A, Duenas A, Williams R, Wilkinson A, et al.
No. 22Topical or oral ibuprofen for chronic knee pain in older people. The TOIB study.
By Underwood M, Ashby D, Carnes D, Castelnuovo E, Cross P, Harding G, et al.
No. 23A prospective randomised comparison of minor surgery in primary and secondary care. The MiSTIC trial.
By George S, Pockney P, Primrose J, Smith H, Little P, Kinley H, et al.
No. 24A review and critical appraisal of measures of therapist–patient interactions in mental health settings.
By Cahill J, Barkham M, Hardy G, Gilbody S, Richards D, Bower P, et al.
No. 25The clinical effectiveness and cost-effectiveness of screening programmes for amblyopia and strabismus in children up to the age of 4–5 years: a systematic review and economic evaluation.
By Carlton J, Karnon J, Czoski-Murray C, Smith KJ, Marr J.
No. 26A systematic review of the clinical effectiveness and cost-effectiveness and economic modelling of minimal incision total hip replacement approaches in the management of arthritic disease of the hip.
By de Verteuil R, Imamura M, Zhu S, Glazener C, Fraser C, Munro N, et al.
No. 27A preliminary model-based assessment of the cost–utility of a screening programme for early age-related macular degeneration.
By Karnon J, Czoski-Murray C, Smith K, Brand C, Chakravarthy U, Davis S, et al.
No. 28Intravenous magnesium sulphate and sotalol for prevention of atrial fibrillation after coronary artery bypass surgery: a systematic review and economic evaluation.
By Shepherd J, Jones J, Frampton GK, Tanajewski L, Turner D, Price A.
No. 29Absorbent products for urinary/faecal incontinence: a comparative evaluation of key product categories.
By Fader M, Cottenden A, Getliffe K, Gage H, Clarke-O’Neill S, Jamieson K, et al.
No. 30A systematic review of repetitive functional task practice with modelling of resource use, costs and effectiveness.
By French B, Leathley M, Sutton C, McAdam J, Thomas L, Forster A, et al.
No. 31The effectiveness and cost-effectivness of minimal access surgery amongst people with gastro-oesophageal reflux disease – a UK collaborative study. The reflux trial.
By Grant A, Wileman S, Ramsay C, Bojke L, Epstein D, Sculpher M, et al.
No. 32Time to full publication of studies of anti-cancer medicines for breast cancer and the potential for publication bias: a short systematic review.
By Takeda A, Loveman E, Harris P, Hartwell D, Welch K.
No. 33Performance of screening tests for child physical abuse in accident and emergency departments.
By Woodman J, Pitt M, Wentz R, Taylor B, Hodes D, Gilbert RE.
No. 34Curative catheter ablation in atrial fibrillation and typical atrial flutter: systematic review and economic evaluation.
By Rodgers M, McKenna C, Palmer S, Chambers D, Van Hout S, Golder S, et al.
No. 35Systematic review and economic modelling of effectiveness and cost utility of surgical treatments for men with benign prostatic enlargement.
By Lourenco T, Armstrong N, N’Dow J, Nabi G, Deverill M, Pickard R, et al.
No. 36Immunoprophylaxis against respiratory syncytial virus (RSV) with palivizumab in children: a systematic review and economic evaluation.
By Wang D, Cummins C, Bayliss S, Sandercock J, Burls A.
Volume 13, 2009
No. 1Deferasirox for the treatment of iron overload associated with regular blood transfusions (transfusional haemosiderosis) in patients suffering with chronic anaemia: a systematic review and economic evaluation.
By McLeod C, Fleeman N, Kirkham J, Bagust A, Boland A, Chu P, et al.
No. 2Thrombophilia testing in people with venous thromboembolism: systematic review and cost-effectiveness analysis.
By Simpson EL, Stevenson MD, Rawdin A, Papaioannou D.
No. 3Surgical procedures and non-surgical devices for the management of non-apnoeic snoring: a systematic review of clinical effects and associated treatment costs.
By Main C, Liu Z, Welch K, Weiner G, Quentin Jones S, Stein K.
No. 4Continuous positive airway pressure devices for the treatment of obstructive sleep apnoea–hypopnoea syndrome: a systematic review and economic analysis.
By McDaid C, Griffin S, Weatherly H, Durée K, van der Burgt M, van Hout S, Akers J, et al.
No. 5Use of classical and novel biomarkers as prognostic risk factors for localised prostate cancer: a systematic review.
By Sutcliffe P, Hummel S, Simpson E, Young T, Rees A, Wilkinson A, et al.
No. 6The harmful health effects of recreational ecstasy: a systematic review of observational evidence.
By Rogers G, Elston J, Garside R, Roome C, Taylor R, Younger P, et al.
No. 7Systematic review of the clinical effectiveness and cost-effectiveness of oesophageal Doppler monitoring in critically ill and high-risk surgical patients.
By Mowatt G, Houston G, Hernández R, de Verteuil R, Fraser C, Cuthbertson B, et al.
No. 8The use of surrogate outcomes in model-based cost-effectiveness analyses: a survey of UK Health Technology Assessment reports.
By Taylor RS, Elston J.
No. 9Controlling Hypertension and Hypotension Immediately Post Stroke (CHHIPS) – a randomised controlled trial.
By Potter J, Mistri A, Brodie F, Chernova J, Wilson E, Jagger C, et al.
Health Technology Assessment reports published to date
350
No. 10Routine antenatal anti-D prophylaxis for RhD-negative women: a systematic review and economic evaluation.
By Pilgrim H, Lloyd-Jones M, Rees A.
No. 11Amantadine, oseltamivir and zanamivir for the prophylaxis of influenza (including a review of existing guidance no. 67): a systematic review and economic evaluation.
By Tappenden P, Jackson R, Cooper K, Rees A, Simpson E, Read R, et al.
No. 12Improving the evaluation of therapeutic interventions in multiple sclerosis: the role of new psychometric methods.
By Hobart J, Cano S.
No. 13Treatment of severe ankle sprain: a pragmatic randomised controlled trial comparing the clinical effectiveness and cost-effectiveness of three types of mechanical ankle support with tubular bandage. The CAST trial.
By Cooke MW, Marsh JL, Clark M, Nakash R, Jarvis RM, Hutton JL, et al., on behalf of the CAST trial group.
No. 14Non-occupational postexposure prophylaxis for HIV: a systematic review.
By Bryant J, Baxter L, Hird S.
No. 15Blood glucose self-monitoring in type 2 diabetes: a randomised controlled trial.
By Farmer AJ, Wade AN, French DP, Simon J, Yudkin P, Gray A, et al.
No. 16How far does screening women for domestic (partner) violence in different health-care settings meet criteria for a screening programme? Systematic reviews of nine UK National Screening Committee criteria.
By Feder G, Ramsay J, Dunne D, Rose M, Arsene C, Norman R, et al.
No. 17Spinal cord stimulation for chronic pain of neuropathic or ischaemic origin: systematic review and economic evaluation.
By Simpson, EL, Duenas A, Holmes MW, Papaioannou D, Chilcott J.
No. 18The role of magnetic resonance imaging in the identification of suspected acoustic neuroma: a systematic review of clinical and cost-effectiveness and natural history.
By Fortnum H, O’Neill C, Taylor R, Lenthall R, Nikolopoulos T, Lightfoot G, et al.
No. 19Dipsticks and diagnostic algorithms in urinary tract infection: development and validation, randomised trial, economic analysis, observational cohort and qualitative study.
By Little P, Turner S, Rumsby K, Warner G, Moore M, Lowes JA, et al.
No. 20Systematic review of respite care in the frail elderly.
By Shaw C, McNamara R, Abrams K, Cannings-John R, Hood K, Longo M, et al.
No. 21Neuroleptics in the treatment of aggressive challenging behaviour for people with intellectual disabilities: a randomised controlled trial (NACHBID).
By Tyrer P, Oliver-Africano P, Romeo R, Knapp M, Dickens S, Bouras N, et al.
No. 22Randomised controlled trial to determine the clinical effectiveness and cost-effectiveness of selective serotonin reuptake inhibitors plus supportive care, versus supportive care alone, for mild to moderate depression with somatic symptoms in primary care: the THREAD (THREshold for AntiDepressant response) study.
By Kendrick T, Chatwin J, Dowrick C, Tylee A, Morriss R, Peveler R, et al.
No. 23Diagnostic strategies using DNA testing for hereditary haemochromatosis in at-risk populations: a systematic review and economic evaluation.
By Bryant J, Cooper K, Picot J, Clegg A, Roderick P, Rosenberg W, et al.
No. 24Enhanced external counterpulsation for the treatment of stable angina and heart failure: a systematic review and economic analysis.
By McKenna C, McDaid C, Suekarran S, Hawkins N, Claxton K, Light K, et al.
No. 25Development of a decision support tool for primary care management of patients with abnormal liver function tests without clinically apparent liver disease: a record-linkage population cohort study and decision analysis (ALFIE).
By Donnan PT, McLernon D, Dillon JF, Ryder S, Roderick P, Sullivan F, et al.
No. 26A systematic review of presumed consent systems for deceased organ donation.
By Rithalia A, McDaid C, Suekarran S, Norman G, Myers L, Sowden A.
No. 27Paracetamol and ibuprofen for the treatment of fever in children: the PITCH randomised controlled trial.
By Hay AD, Redmond NM, Costelloe C, Montgomery AA, Fletcher M, Hollinghurst S, et al.
No. 28A randomised controlled trial to compare minimally invasive glucose monitoring devices with conventional monitoring in the management of insulin-treated diabetes mellitus (MITRE).
By Newman SP, Cooke D, Casbard A, Walker S, Meredith S, Nunn A, et al.
No. 29Sensitivity analysis in economic evaluation: an audit of NICE current practice and a review of its use and value in decision-making.
By Andronis L, Barton P, Bryan S.
Suppl. 1Trastuzumab for the treatment of primary breast cancer in HER2-positive women: a single technology appraisal.
By Ward S, Pilgrim H, Hind D.
Docetaxel for the adjuvant treatment of early node-positive breast cancer: a single technology appraisal.
By Chilcott J, Lloyd Jones M, Wilkinson A.
The use of paclitaxel in the management of early stage breast cancer.
By Griffin S, Dunn G, Palmer S, Macfarlane K, Brent S, Dyker A, et al.
Rituximab for the first-line treatment of stage III/IV follicular non-Hodgkin’s lymphoma.
By Dundar Y, Bagust A, Hounsome J, McLeod C, Boland A, Davis H, et al.
Bortezomib for the treatment of multiple myeloma patients.
By Green C, Bryant J, Takeda A, Cooper K, Clegg A, Smith A, et al.
Fludarabine phosphate for the first-line treatment of chronic lymphocytic leukaemia.
By Walker S, Palmer S, Erhorn S, Brent S, Dyker A, Ferrie L, et al.
Erlotinib for the treatment of relapsed non-small cell lung cancer.
By McLeod C, Bagust A, Boland A, Hockenhull J, Dundar Y, Proudlove C, et al.
Cetuximab plus radiotherapy for the treatment of locally advanced squamous cell carcinoma of the head and neck.
By Griffin S, Walker S, Sculpher M, White S, Erhorn S, Brent S, et al.
Infliximab for the treatment of adults with psoriasis.
By Loveman E, Turner D, Hartwell D, Cooper K, Clegg A.
DOI: 10.3310/hta14040 Health Technology Assessment 2010; Vol. 14: No. 4
© 2010 Queen’s Printer and Controller of HMSO. All rights reserved.
351
No. 30Psychological interventions for postnatal depression: cluster randomised trial and economic evaluation. The PoNDER trial.
By Morrell CJ, Warner R, Slade P, Dixon S, Walters S, Paley G, et al.
No. 31The effect of different treatment durations of clopidogrel in patients with non-ST-segment elevation acute coronary syndromes: a systematic review and value of information analysis.
By Rogowski R, Burch J, Palmer S, Craigs C, Golder S, Woolacott N.
No. 32Systematic review and individual patient data meta-analysis of diagnosis of heart failure, with modelling of implications of different diagnostic strategies in primary care.
By Mant J, Doust J, Roalfe A, Barton P, Cowie MR, Glasziou P, et al.
No. 33A multicentre randomised controlled trial of the use of continuous positive airway pressure and non-invasive positive pressure ventilation in the early treatment of patients presenting to the emergency department with severe acute cardiogenic pulmonary oedema: the 3CPO trial.
By Gray AJ, Goodacre S, Newby DE, Masson MA, Sampson F, Dixon S, et al., on behalf of the 3CPO study investigators.
No. 34Early high-dose lipid-lowering therapy to avoid cardiac events: a systematic review and economic evaluation.
By Ara R, Pandor A, Stevens J, Rees A, Rafia R.
No. 35Adefovir dipivoxil and pegylated interferon alpha for the treatment of chronic hepatitis B: an updated systematic review and economic evaluation.
By Jones J, Shepherd J, Baxter L, Gospodarevskaya E, Hartwell D, Harris P, et al.
No. 36Methods to identify postnatal depression in primary care: an integrated evidence synthesis and value of information analysis.
By Hewitt CE, Gilbody SM, Brealey S, Paulden M, Palmer S, Mann R, et al.
No. 37A double-blind randomised placebo-controlled trial of topical intranasal corticosteroids in 4- to 11-year-old children with persistent bilateral otitis media with effusion in primary care.
By Williamson I, Benge S, Barton S, Petrou S, Letley L, Fasey N, et al.
No. 38The effectiveness and cost-effectiveness of methods of storing donated kidneys from deceased donors: a systematic review and economic model.
By Bond M, Pitt M, Akoh J, Moxham T, Hoyle M, Anderson R.
No. 39Rehabilitation of older patients: day hospital compared with rehabilitation at home. A randomised controlled trial.
By Parker SG, Oliver P, Pennington M, Bond J, Jagger C, Enderby PM, et al.
No. 40Breastfeeding promotion for infants in neonatal units: a systematic review and economic analysis
By Renfrew MJ, Craig D, Dyson L, McCormick F, Rice S, King SE, et al.
No. 41The clinical effectiveness and cost-effectiveness of bariatric (weight loss) surgery for obesity: a systematic review and economic evaluation.
By Picot J, Jones J, Colquitt JL, Gospodarevskaya E, Loveman E, Baxter L, et al.
No. 42Rapid testing for group B streptococcus during labour: a test accuracy study with evaluation of acceptability and cost-effectiveness.
By Daniels J, Gray J, Pattison H, Roberts T, Edwards E, Milner P, et al.
No. 43Screening to prevent spontaneous preterm birth: systematic reviews of accuracy and effectiveness literature with economic modelling.
By Honest H, Forbes CA, Durée KH, Norman G, Duffy SB, Tsourapas A, et al.
No. 44The effectiveness and cost-effectiveness of cochlear implants for severe to profound deafness in children and adults: a systematic review and economic model.
By Bond M, Mealing S, Anderson R, Elston J, Weiner G, Taylor RS, et al.
Suppl. 2Gemcitabine for the treatment of metastatic breast cancer.
By Jones J, Takeda A, Tan SC, Cooper K, Loveman E, Clegg A.
Varenicline in the management of smoking cessation: a single technology appraisal.
By Hind D, Tappenden P, Peters J, Kenjegalieva K.
Alteplase for the treatment of acute ischaemic stroke: a single technology appraisal.
By Lloyd Jones M, Holmes M.
Rituximab for the treatment of rheumatoid arthritis.
By Bagust A, Boland A, Hockenhull J, Fleeman N, Greenhalgh J, Dundar Y, et al.
Omalizumab for the treatment of severe persistent allergic asthma.
By Jones J, Shepherd J, Hartwell D, Harris P, Cooper K, Takeda A, et al.
Rituximab for the treatment of relapsed or refractory stage III or IV follicular non-Hodgkin’s lymphoma.
By Boland A, Bagust A, Hockenhull J, Davis H, Chu P, Dickson R.
Adalimumab for the treatment of psoriasis.
By Turner D, Picot J, Cooper K, Loveman E.
Dabigatran etexilate for the prevention of venous thromboembolism in patients undergoing elective hip and knee surgery: a single technology appraisal.
By Holmes M, C Carroll C, Papaioannou D.
Romiplostim for the treatment of chronic immune or idiopathic thrombocytopenic purpura: a single technology appraisal.
By Mowatt G, Boachie C, Crowther M, Fraser C, Hernández R, Jia X, et al.
Sunitinib for the treatment of gastrointestinal stromal tumours: a critique of the submission from Pfizer.
By Bond M, Hoyle M, Moxham T, Napier M, Anderson R.
No. 45Vitamin K to prevent fractures in older women: systematic review and economic evaluation.
By Stevenson M, Lloyd-Jones M, Papaioannou D.
No. 46The effects of biofeedback for the treatment of essential hypertension: a systematic review.
By Greenhalgh J, Dickson R, Dundar Y.
No. 47A randomised controlled trial of the use of aciclovir and/or prednisolone for the early treatment of Bell’s palsy: the BELLS study.
By Sullivan FM, Swan IRC, Donnan PT, Morrison JM, Smith BH, McKinstry B, et al.
Suppl. 3Lapatinib for the treatment of HER2-overexpressing breast cancer.
By Jones J, Takeda A, Picot J, von Keyserlingk C, Clegg A.
Infliximab for the treatment of ulcerative colitis.
By Hyde C, Bryan S, Juarez-Garcia A, Andronis L, Fry-Smith A.
Health Technology Assessment reports published to date
352
Rimonabant for the treatment of overweight and obese people.
By Burch J, McKenna C, Palmer S, Norman G, Glanville J, Sculpher M, et al.
Telbivudine for the treatment of chronic hepatitis B infection.
By Hartwell D, Jones J, Harris P, Cooper K.
Entecavir for the treatment of chronic hepatitis B infection.
By Shepherd J, Gospodarevskaya E, Frampton G, Cooper, K.
Febuxostat for the treatment of hyperuricaemia in people with gout: a single technology appraisal.
By Stevenson M, Pandor A.
Rivaroxaban for the prevention of venous thromboembolism: a single technology appraisal.
By Stevenson M, Scope A, Holmes M, Rees A, Kaltenthaler E.
Cetuximab for the treatment of recurrent and/or metastatic squamous cell carcinoma of the head and neck.
By Greenhalgh J, Bagust A, Boland A, Fleeman N, McLeod C, Dundar Y, et al.
Mifamurtide for the treatment of osteosarcoma: a single technology appraisal.
By Pandor A, Fitzgerald P, Stevenson M, Papaioannou D.
Ustekinumab for the treatment of moderate to severe psoriasis.
By Gospodarevskaya E, Picot J, Cooper K, Loveman E, Takeda A.
No. 48Endovascular stents for abdominal aortic aneurysms: a systematic review and economic model.
By Chambers D, Epstein D, Walker S, Fayter D, Paton F, Wright K, et al.
No. 49Clinical and cost-effectiveness of epoprostenol, iloprost, bosentan, sitaxentan and sildenafil for pulmonary arterial hypertension within their licensed indications: a systematic review and economic evaluation.
By Chen Y-F, Jowett S, Barton P, Malottki K, Hyde C, Gibbs JSR, et al.
No. 50Cessation of attention deficit hyperactivity disorder drugs in the young (CADDY) – a pharmacoepidemiological and qualitative study.
By Wong ICK, Asherson P, Bilbow A, Clifford S, Coghill D, R DeSoysa R, et al.
No. 51ARTISTIC: a randomised trial of human papillomavirus (HPV) testing in primary cervical screening.
By Kitchener HC, Almonte M, Gilham C, Dowie R, Stoykova B, Sargent A, et al.
No. 52The clinical effectiveness of glucosamine and chondroitin supplements in slowing or arresting progression of osteoarthritis of the knee: a systematic review and economic evaluation.
By Black C, Clar C, Henderson R, MacEachern C, McNamee P, Quayyum Z, et al.
No. 53Randomised preference trial of medical versus surgical termination of pregnancy less than 14 weeks’ gestation (TOPS).
By Robson SC, Kelly T, Howel D, Deverill M, Hewison J, Lie MLS, et al.
No. 54Randomised controlled trial of the use of three dressing preparations in the management of chronic ulceration of the foot in diabetes.
By Jeffcoate WJ, Price PE, Phillips CJ, Game FL, Mudge E, Davies S, et al.
No. 55VenUS II: a randomised controlled trial of larval therapy in the management of leg ulcers.
By Dumville JC, Worthy G, Soares MO, Bland JM, Cullum N, Dowson C, et al.
No. 56A prospective randomised controlled trial and economic modelling of antimicrobial silver dressings versus non-adherent control dressings for venous leg ulcers: the VULCAN trial
By Michaels JA, Campbell WB, King BM, MacIntyre J, Palfreyman SJ, Shackley P, et al.
No. 57Communication of carrier status information following universal newborn screening for sickle cell disorders and cystic fibrosis: qualitative study of experience and practice.
By Kai J, Ulph F, Cullinan T, Qureshi N.
No. 58Antiviral drugs for the treatment of influenza: a systematic review and economic evaluation.
By Burch J, Paulden M, Conti S, Stock C, Corbett M, Welton NJ, et al.
No. 59Development of a toolkit and glossary to aid in the adaptation of health technology assessment (HTA) reports for use in different contexts.
By Chase D, Rosten C, Turner S, Hicks N, Milne R.
No. 60Colour vision testing for diabetic retinopathy: a systematic review of diagnostic accuracy and economic evaluation.
By Rodgers M, Hodges R, Hawkins J, Hollingworth W, Duffy S, McKibbin M, et al.
No. 61Systematic review of the effectiveness and cost-effectiveness of weight management schemes for the under fives: a short report.
By Bond M, Wyatt K, Lloyd J, Welch K, Taylor R.
No. 62Are adverse effects incorporated in economic models? An initial review of current practice.
By Craig D, McDaid C, Fonseca T, Stock C, Duffy S, Woolacott N.
Volume 14, 2010
No. 1Multicentre randomised controlled trial examining the cost-effectiveness of contrast-enhanced high field magnetic resonance imaging in women with primary breast cancer scheduled for wide local excision (COMICE).
By Turnbull LW, Brown SR, Olivier C, Harvey I, Brown J, Drew P, et al.
No. 2Bevacizumab, sorafenib tosylate, sunitinib and temsirolimus for renal cell carcinoma: a systematic review and economic evaluation.
By Thompson Coon J, Hoyle M, Green C, Liu Z, Welch K, Moxham T, et al.
No. 3The clinical effectiveness and cost-effectiveness of testing for cytochrome P450 polymorphisms in patients with schizophrenia treated with antipsychotics: a systematic review and economic evaluation.
By Fleeman N, McLeod C, Bagust A, Beale S, Boland A, Dundar Y, et al.
DOI: 10.3310/hta14040 Health Technology Assessment 2010; Vol. 14: No. 4
© 2010 Queen’s Printer and Controller of HMSO. All rights reserved.
353
Health Technology Assessment programme
Director,Professor Tom Walley,Director, NIHR HTA programme, Professor of Clinical Pharmacology, University of Liverpool
Deputy Director,Professor Jon Nicholl,Director, Medical Care Research Unit, University of Sheffield
Prioritisation Strategy GroupMembers
Chair,Professor Tom Walley,Director, NIHR HTA programme, Professor of Clinical Pharmacology, University of Liverpool
Deputy Chair,Professor Jon Nicholl,Director, Medical Care Research Unit, University of Sheffield
Dr Bob Coates,Consultant Advisor, NETSCC, HTA
Dr Andrew Cook,Consultant Advisor, NETSCC, HTA
Dr Peter Davidson,Director of Science Support, NETSCC, HTA
Professor Robin E Ferner, Consultant Physician and Director, West Midlands Centre for Adverse Drug Reactions, City Hospital NHS Trust, Birmingham
Professor Paul Glasziou, Professor of Evidence-Based Medicine, University of Oxford
Dr Nick Hicks,Director of NHS Support, NETSCC, HTA
Dr Edmund Jessop,Medical Adviser, National Specialist, National Commissioning Group (NCG), Department of Health, London
Ms Lynn Kerridge,Chief Executive Officer, NETSCC and NETSCC, HTA
Dr Ruairidh Milne,Director of Strategy and Development, NETSCC
Ms Kay Pattison,Section Head, NHS R&D Programme, Department of Health
Ms Pamela Young,Specialist Programme Manager, NETSCC, HTA
HTA Commissioning BoardMembers
Programme Director,Professor Tom Walley,Director, NIHR HTA programme, Professor of Clinical Pharmacology, University of Liverpool
Chair,Professor Jon Nicholl,Director, Medical Care Research Unit, University of Sheffield
Deputy Chair,Dr Andrew Farmer,Senior Lecturer in General Practice, Department of Primary Health Care, University of Oxford
Professor Ann Ashburn,Professor of Rehabilitation and Head of Research, Southampton General Hospital
Professor Deborah Ashby,Professor of Medical Statistics, Queen Mary, University of London
Professor John Cairns,Professor of Health Economics, London School of Hygiene and Tropical Medicine
Professor Peter Croft,Director of Primary Care Sciences Research Centre, Keele University
Professor Nicky Cullum,Director of Centre for Evidence-Based Nursing, University of York
Professor Jenny Donovan,Professor of Social Medicine, University of Bristol
Professor Steve Halligan,Professor of Gastrointestinal Radiology, University College Hospital, London
Professor Freddie Hamdy,Professor of Urology,University of Sheffield
Professor Allan House,Professor of Liaison Psychiatry, University of Leeds
Dr Martin J Landray,Reader in Epidemiology, Honorary Consultant Physician, Clinical Trial Service Unit, University of Oxford
Professor Stuart Logan,Director of Health & Social Care Research, The Peninsula Medical School, Universities of Exeter and Plymouth
Dr Rafael Perera,Lecturer in Medical Statisitics, Department of Primary Health Care, Univeristy of Oxford
Professor Ian Roberts, Professor of Epidemiology & Public Health, London School of Hygiene and Tropical Medicine
Professor Mark Sculpher,Professor of Health Economics, University of York
Professor Helen Smith,Professor of Primary Care, University of Brighton
Professor Kate Thomas,Professor of Complementary & Alternative Medicine Research, University of Leeds
Professor David John Torgerson,Director of York Trials Unit, University of York
Professor Hywel Williams,Professor of Dermato-Epidemiology, University of Nottingham
Observers
Ms Kay Pattison,Section Head, NHS R&D Programme, Department of Health
Dr Morven Roberts,Clinical Trials Manager, Medical Research Council
Health Technology Assessment programme
354
Current and past membership details of all HTA programme ‘committees’ are available from the HTA website (www.hta.ac.uk)
Diagnostic Technologies & Screening PanelMembers
Chair,Professor Paul Glasziou,Professor of Evidence-Based Medicine, University of Oxford
Deputy Chair,Dr David Elliman,Consultant Paediatrician and Honorary Senior Lecturer, Great Ormond Street Hospital, London
Professor Judith E Adams, Consultant Radiologist, Manchester Royal Infirmary, Central Manchester & Manchester Children’s University Hospitals NHS Trust, and Professor of Diagnostic Radiology, Imaging Science and Biomedical Engineering, Cancer & Imaging Sciences, University of Manchester
Ms Jane Bates,Consultant Ultrasound Practitioner, Ultrasound Department, Leeds Teaching Hospital NHS Trust
Dr Stephanie Dancer,Consultant Microbiologist, Hairmyres Hospital, East Kilbride
Professor Glyn Elwyn,Primary Medical Care Research Group, Swansea Clinical School, University of Wales
Dr Ron Gray,Consultant Clinical Epidemiologist, Department of Public Health, University of Oxford
Professor Paul D Griffiths, Professor of Radiology, University of Sheffield
Dr Jennifer J Kurinczuk,Consultant Clinical Epidemiologist, National Perinatal Epidemiology Unit, Oxford
Dr Susanne M Ludgate,Medical Director, Medicines & Healthcare Products Regulatory Agency, London
Dr Anne Mackie,Director of Programmes, UK National Screening Committee
Dr Michael Millar, Consultant Senior Lecturer in Microbiology, Barts and The London NHS Trust, Royal London Hospital
Mr Stephen Pilling,Director, Centre for Outcomes, Research & Effectiveness, Joint Director, National Collaborating Centre for Mental Health, University College London
Mrs Una Rennard,Service User Representative
Dr Phil Shackley,Senior Lecturer in Health Economics, School of Population and Health Sciences, University of Newcastle upon Tyne
Observers
Dr Tim Elliott,Team Leader, Cancer Screening, Department of Health
Dr Catherine Moody,Programme Manager, Neuroscience and Mental Health Board
Dr Ursula Wells,Principal Research Officer, Department of Health
Dr W Stuart A Smellie,Consultant in Chemical Pathology, Bishop Auckland General Hospital
Dr Nicholas Summerton, Consultant Clinical and Public Health Advisor, NICE
Ms Dawn Talbot,Service User Representative
Dr Graham Taylor,Scientific Advisor, Regional DNA Laboratory, St James’s University Hospital, Leeds
Professor Lindsay Wilson Turnbull,Scientific Director of the Centre for Magnetic Resonance Investigations and YCR Professor of Radiology, Hull Royal Infirmary
Pharmaceuticals PanelMembers
Chair,Professor Robin Ferner,Consultant Physician and Director, West Midlands Centre for Adverse Drug Reactions, City Hospital NHS Trust, Birmingham
Deputy Chair,Professor Imti Choonara,Professor in Child Health, University of Nottingham
Mrs Nicola Carey,Senior Research Fellow, School of Health and Social Care, The University of Reading
Mr John Chapman,Service User Representative
Dr Peter Elton,Director of Public Health,Bury Primary Care Trust
Dr Ben Goldacre,Research Fellow, Division of Psychological Medicine and Psychiatry, King’s College London
Mrs Barbara Greggains,Service User Representative
Dr Bill Gutteridge,Medical Adviser, London Strategic Health Authority
Dr Dyfrig Hughes,Reader in Pharmacoeconomics and Deputy Director, Centre for Economics and Policy in Health, IMSCaR, Bangor University
Professor Jonathan Ledermann,Professor of Medical Oncology and Director of the Cancer Research UK and University College London Cancer Trials Centre
Dr Yoon K Loke,Senior Lecturer in Clinical Pharmacology, University of East Anglia
Professor Femi Oyebode,Consultant Psychiatrist and Head of Department, University of Birmingham
Dr Andrew Prentice,Senior Lecturer and Consultant Obstetrician and Gynaecologist, The Rosie Hospital, University of Cambridge
Dr Martin Shelly,General Practitioner, Leeds, and Associate Director, NHS Clinical Governance Support Team, Leicester
Dr Gillian Shepherd,Director, Health and Clinical Excellence, Merck Serono Ltd
Mrs Katrina Simister,Assistant Director New Medicines, National Prescribing Centre, Liverpool
Mr David Symes,Service User Representative
Dr Lesley Wise,Unit Manager, Pharmacoepidemiology Research Unit, VRMM, Medicines & Healthcare Products Regulatory Agency
Observers
Ms Kay Pattison,Section Head, NHS R&D Programme, Department of Health
Mr Simon Reeve,Head of Clinical and Cost-Effectiveness, Medicines, Pharmacy and Industry Group, Department of Health
Dr Heike Weber,Programme Manager, Medical Research Council
Dr Ursula Wells,Principal Research Officer, Department of Health
DOI: 10.3310/hta14040 Health Technology Assessment 2010; Vol. 14: No. 4
© 2010 Queen’s Printer and Controller of HMSO. All rights reserved.
355
Therapeutic Procedures PanelMembers
Chair,Dr John C Pounsford,Consultant Physician, North Bristol NHS Trust
Deputy Chair,Professor Scott Weich,Professor of Psychiatry, Division of Health in the Community, University of Warwick, Coventry
Professor Jane Barlow,Professor of Public Health in the Early Years, Health Sciences Research Institute, Warwick Medical School, Coventry
Ms Maree Barnett,Acting Branch Head of Vascular Programme, Department of Health
Mrs Val Carlill,Service User Representative
Mrs Anthea De Barton-Watson,Service User Representative
Mr Mark Emberton,Senior Lecturer in Oncological Urology, Institute of Urology, University College Hospital, London
Professor Steve Goodacre,Professor of Emergency Medicine, University of Sheffield
Professor Christopher Griffiths,Professor of Primary Care, Barts and The London School of Medicine and Dentistry
Mr Paul Hilton,Consultant Gynaecologist and Urogynaecologist, Royal Victoria Infirmary, Newcastle upon Tyne
Professor Nicholas James, Professor of Clinical Oncology, University of Birmingham, and Consultant in Clinical Oncology, Queen Elizabeth Hospital
Dr Peter Martin,Consultant Neurologist, Addenbrooke’s Hospital, Cambridge
Dr Kate Radford,Senior Lecturer (Research), Clinical Practice Research Unit, University of Central Lancashire, Preston
Mr Jim ReeceService User Representative
Dr Karen Roberts,Nurse Consultant, Dunston Hill Hospital Cottages
Observers
Dr Phillip Leech,Principal Medical Officer for Primary Care, Department of Health
Ms Kay Pattison,Section Head, NHS R&D Programme, Department of Health
Dr Morven Roberts,Clinical Trials Manager, Medical Research Council
Professor Tom Walley,Director, NIHR HTA programme, Professor of Clinical Pharmacology, University of Liverpool
Disease Prevention PanelMembers
Chair,Dr Edmund Jessop,Medical Adviser, National Specialist, National Commissioning Group (NCG), London
Deputy Chair,Dr David Pencheon,Director, NHS Sustainable Development Unit, Cambridge
Dr Elizabeth Fellow-Smith,Medical Director, West London Mental Health Trust, Middlesex
Dr John Jackson,General Practitioner, Parkway Medical Centre, Newcastle upon Tyne
Professor Mike Kelly,Director, Centre for Public Health Excellence, NICE, London
Dr Chris McCall,General Practitioner, The Hadleigh Practice, Corfe Mullen, Dorset
Ms Jeanett Martin,Director of Nursing, BarnDoc Limited, Lewisham Primary Care Trust
Dr Julie Mytton,Locum Consultant in Public Health Medicine, Bristol Primary Care Trust
Miss Nicky Mullany,Service User Representative
Professor Ian Roberts,Professor of Epidemiology and Public Health, London School of Hygiene & Tropical Medicine
Professor Ken Stein,Senior Clinical Lecturer in Public Health, University of Exeter
Observers
Ms Christine McGuire,Research & Development, Department of Health
Dr Caroline Stone,Programme Manager, Medical Research Council
Dr Ursula Wells,Principal Research Officer, Department of Health
Dr Kieran Sweeney,Honorary Clinical Senior Lecturer, Peninsula College of Medicine and Dentistry, Universities of Exeter and Plymouth
Professor Carol Tannahill,Glasgow Centre for Population Health
Professor Margaret Thorogood,Professor of Epidemiology, University of Warwick Medical School, Coventry
Health Technology Assessment programme
356
Current and past membership details of all HTA programme ‘committees’ are available from the HTA website (www.hta.ac.uk)
Expert Advisory NetworkMembers
Professor Douglas Altman,Professor of Statistics in Medicine, Centre for Statistics in Medicine, University of Oxford
Professor John Bond,Professor of Social Gerontology & Health Services Research, University of Newcastle upon Tyne
Professor Andrew Bradbury,Professor of Vascular Surgery, Solihull Hospital, Birmingham
Mr Shaun Brogan,Chief Executive, Ridgeway Primary Care Group, Aylesbury
Mrs Stella Burnside OBE,Chief Executive, Regulation and Improvement Authority, Belfast
Ms Tracy Bury,Project Manager, World Confederation for Physical Therapy, London
Professor Iain T Cameron,Professor of Obstetrics and Gynaecology and Head of the School of Medicine, University of Southampton
Dr Christine Clark,Medical Writer and Consultant Pharmacist, Rossendale
Professor Collette Clifford,Professor of Nursing and Head of Research, The Medical School, University of Birmingham
Professor Barry Cookson,Director, Laboratory of Hospital Infection, Public Health Laboratory Service, London
Dr Carl Counsell,Clinical Senior Lecturer in Neurology, University of Aberdeen
Professor Howard Cuckle,Professor of Reproductive Epidemiology, Department of Paediatrics, Obstetrics & Gynaecology, University of Leeds
Dr Katherine Darton,Information Unit, MIND – The Mental Health Charity, London
Professor Carol Dezateux,Professor of Paediatric Epidemiology, Institute of Child Health, London
Mr John Dunning, Consultant Cardiothoracic Surgeon, Papworth Hospital NHS Trust, Cambridge
Mr Jonothan Earnshaw,Consultant Vascular Surgeon, Gloucestershire Royal Hospital, Gloucester
Professor Martin Eccles,Professor of Clinical Effectiveness, Centre for Health Services Research, University of Newcastle upon Tyne
Professor Pam Enderby,Dean of Faculty of Medicine, Institute of General Practice and Primary Care, University of Sheffield
Professor Gene Feder,Professor of Primary Care Research & Development, Centre for Health Sciences, Barts and The London School of Medicine and Dentistry
Mr Leonard R Fenwick,Chief Executive, Freeman Hospital, Newcastle upon Tyne
Mrs Gillian Fletcher,Antenatal Teacher and Tutor and President, National Childbirth Trust, Henfield
Professor Jayne Franklyn,Professor of Medicine, University of Birmingham
Mr Tam Fry,Honorary Chairman, Child Growth Foundation, London
Professor Fiona Gilbert,Consultant Radiologist and NCRN Member, University of Aberdeen
Professor Paul Gregg,Professor of Orthopaedic Surgical Science, South Tees Hospital NHS Trust
Bec Hanley,Co-director, TwoCan Associates, West Sussex
Dr Maryann L Hardy,Senior Lecturer, University of Bradford
Mrs Sharon Hart,Healthcare Management Consultant, Reading
Professor Robert E Hawkins,CRC Professor and Director of Medical Oncology, Christie CRC Research Centre, Christie Hospital NHS Trust, Manchester
Professor Richard Hobbs,Head of Department of Primary Care & General Practice, University of Birmingham
Professor Alan Horwich,Dean and Section Chairman, The Institute of Cancer Research, London
Professor Allen Hutchinson,Director of Public Health and Deputy Dean of ScHARR, University of Sheffield
Professor Peter Jones,Professor of Psychiatry, University of Cambridge, Cambridge
Professor Stan Kaye,Cancer Research UK Professor of Medical Oncology, Royal Marsden Hospital and Institute of Cancer Research, Surrey
Dr Duncan Keeley,General Practitioner (Dr Burch & Ptnrs), The Health Centre, Thame
Dr Donna Lamping,Research Degrees Programme Director and Reader in Psychology, Health Services Research Unit, London School of Hygiene and Tropical Medicine, London
Mr George Levvy,Chief Executive, Motor Neurone Disease Association, Northampton
Professor James Lindesay,Professor of Psychiatry for the Elderly, University of Leicester
Professor Julian Little,Professor of Human Genome Epidemiology, University of Ottawa
Professor Alistaire McGuire,Professor of Health Economics, London School of Economics
Professor Rajan Madhok,Medical Director and Director of Public Health, Directorate of Clinical Strategy & Public Health, North & East Yorkshire & Northern Lincolnshire Health Authority, York
Professor Alexander Markham,Director, Molecular Medicine Unit, St James’s University Hospital, Leeds
Dr Peter Moore,Freelance Science Writer, Ashtead
Dr Andrew Mortimore,Public Health Director, Southampton City Primary Care Trust
Dr Sue Moss,Associate Director, Cancer Screening Evaluation Unit, Institute of Cancer Research, Sutton
Professor Miranda Mugford,Professor of Health Economics and Group Co-ordinator, University of East Anglia
Professor Jim Neilson,Head of School of Reproductive & Developmental Medicine and Professor of Obstetrics and Gynaecology, University of Liverpool
Mrs Julietta Patnick,National Co-ordinator, NHS Cancer Screening Programmes, Sheffield
Professor Robert Peveler,Professor of Liaison Psychiatry, Royal South Hants Hospital, Southampton
Professor Chris Price,Director of Clinical Research, Bayer Diagnostics Europe, Stoke Poges
Professor William Rosenberg,Professor of Hepatology and Consultant Physician, University of Southampton
Professor Peter Sandercock,Professor of Medical Neurology, Department of Clinical Neurosciences, University of Edinburgh
Dr Susan Schonfield,Consultant in Public Health, Hillingdon Primary Care Trust, Middlesex
Dr Eamonn Sheridan,Consultant in Clinical Genetics, St James’s University Hospital, Leeds
Dr Margaret Somerville,Director of Public Health Learning, Peninsula Medical School, University of Plymouth
Professor Sarah Stewart-Brown,Professor of Public Health, Division of Health in the Community, University of Warwick, Coventry
Professor Ala Szczepura,Professor of Health Service Research, Centre for Health Services Studies, University of Warwick, Coventry
Mrs Joan Webster,Consumer Member, Southern Derbyshire Community Health Council
Professor Martin Whittle,Clinical Co-director, National Co-ordinating Centre for Women’s and Children’s Health, Lymington

NETSCC, Health Technology AssessmentAlpha HouseUniversity of Southampton Science ParkSouthampton SO16 7NS, UKEmail: [email protected] ISSN 1366-5278
FeedbackThe HTA programme and the authors would like to know
your views about this report.
The Correspondence Page on the HTA website (www.hta.ac.uk) is a convenient way to publish
your comments. If you prefer, you can send your comments to the address below, telling us whether you would like
us to transfer them to the website.
We look forward to hearing from you.