Embed Size (px)
DESCRIPTION
Systematic Review Module 10: Quantitative Synthesis II. Thomas Trikalinos, MD, PhD Joseph Lau, MD Tufts EPC. CER Process Overview. Learning objectives of this module. Dealing with between-study heterogeneity Promise and danger of subgroup analyses Meta-regression - PowerPoint PPT Presentation
Citation preview

Systematic Review Module 10: Systematic Review Module 10: Quantitative Synthesis IIQuantitative Synthesis II
Thomas Trikalinos, MD, PhDThomas Trikalinos, MD, PhDJoseph Lau, MDJoseph Lau, MD
Tufts EPCTufts EPC

CER Process OverviewCER Process Overview
Prepare topic:
· Refine key questions
· Develop analytic frameworks
Search for and select
studies:
· Identify eligibility criteria
· Search for relevant studies
· Select evidence for inclusion
Abstract data:
· Extract evidence from studies
· Construct evidence tables
Analyze and synthesize data:
· Assess quality of studies
· Assess applicability of studies
· Apply qualitative methods
· Apply quantitative methods (meta-analyses)
· Rate the strength of a body of evidence
Present findings

Learning objectives of this moduleLearning objectives of this module
Dealing with between-study Dealing with between-study heterogeneityheterogeneity
Promise and danger of subgroup Promise and danger of subgroup analysesanalyses
Meta-regression Meta-regression Control rate meta-regressionControl rate meta-regression

HomogeneityHomogeneity
From Cochrane Database Syst Rev. 2000;(2):CD000505

Heterogeneity: Patellar resurfacing Heterogeneity: Patellar resurfacing in total knee arthroplasty for painin total knee arthroplasty for pain
J Bone Joint Surg Am. 2005;87(7):1438-45

HeterogeneityHeterogeneity
Diversity of studies in a meta-analysis Diversity of studies in a meta-analysis Typically abundant Typically abundant Arguably the most important role of meta-Arguably the most important role of meta-
analytic methodologies is to quantify, analytic methodologies is to quantify, explore, and explain between-study explore, and explain between-study heterogeneity heterogeneity

HeterogeneityHeterogeneity
Methodological heterogeneityMethodological heterogeneity Pertains to specifics of study design and analysisPertains to specifics of study design and analysis
(e.g., type of study, length of follow-up, proportion of (e.g., type of study, length of follow-up, proportion of dropouts and handling thereof)dropouts and handling thereof)
Clinical heterogeneityClinical heterogeneity Pertains to differences in the populations, intervention and Pertains to differences in the populations, intervention and
co-interventions, outcomes co-interventions, outcomes

Statistical heterogeneityStatistical heterogeneity
Statistical heterogeneity exists when the Statistical heterogeneity exists when the results of the individual studies are not results of the individual studies are not “consistent” among themselves“consistent” among themselves
Clinical heterogeneity
Methodological heterogeneity
Biases
Chance
Statistical heterogeneity

Clinical vs. statistical Clinical vs. statistical heterogeneityheterogeneity
Clinical and methodological heterogeneity is Clinical and methodological heterogeneity is abundant. Our aim is to abundant. Our aim is to exploreexplore it, and use these it, and use these observations to formulate interesting hypotheses.observations to formulate interesting hypotheses.
Often, but not always, clinical and methodological Often, but not always, clinical and methodological heterogeneity will result in a statistically significant testheterogeneity will result in a statistically significant test
Chance, technical issues or biases may result in Chance, technical issues or biases may result in statistically significant results in heterogeneity tests statistically significant results in heterogeneity tests
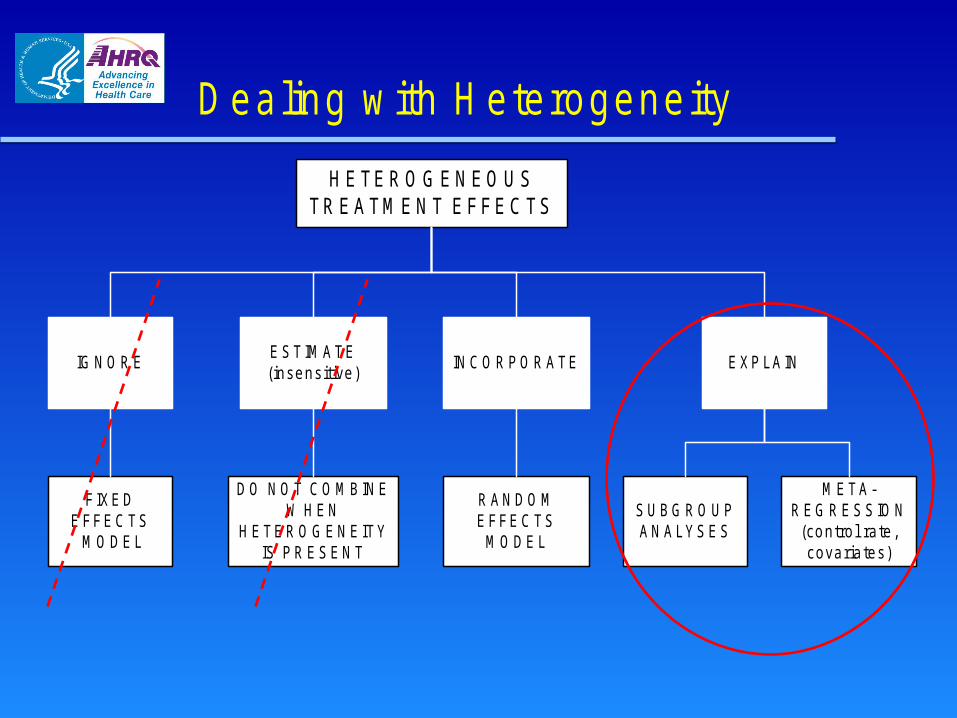
D ealing w ith H eterogeneity
H E TE R O G E N E O U STR E A TM E N T E F F E C TS
IGNORE INCORPORATEESTIMATE(insensitive)
EXPLAIN
FIXEDEFFECTS MODEL
DO NOT COMBINEW HEN
HETEROGENEITYIS PRESENT
RANDOMEFFECTS
MODEL
SUBGROUPANALYSES
META-REGRESSION
(control rate,covariates)

Tre
atm
ent
effe
ct
Tre
atm
en
t e
ffect
variable of interest
META-REGRESSION modeling summary data
OVERALL ESTIMATE combining summary data
RESPONSE SURFACE modeling individual patient data
Tre
atm
ent
effe
ct
SUBGROUP ANALYSES differentiating effects in subgroups

Promises of subgroup Promises of subgroup analysesanalyses
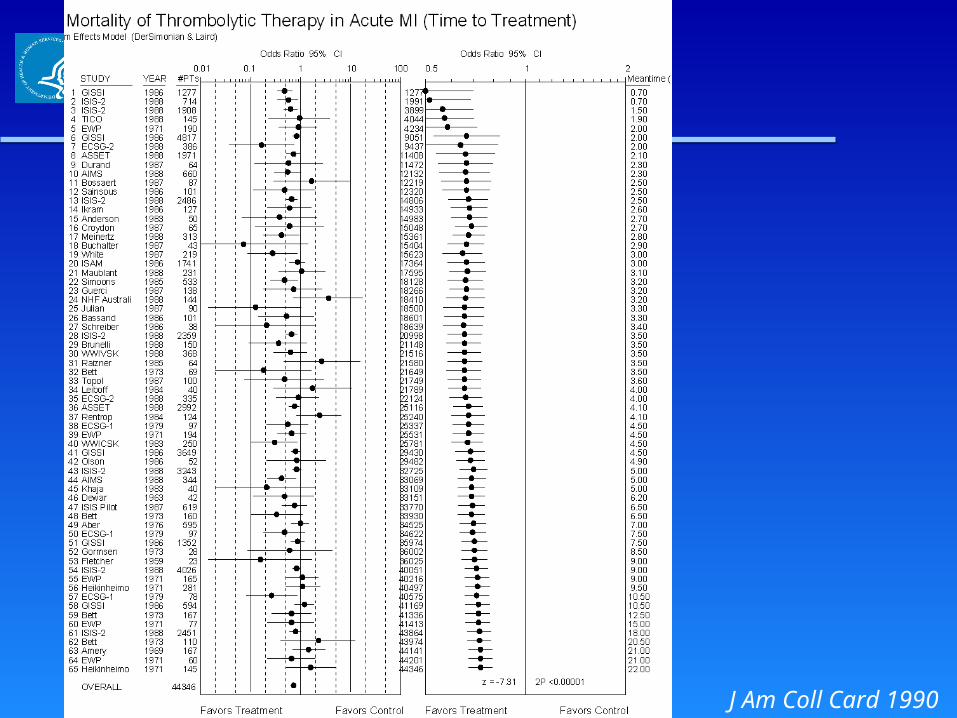
J Am Coll Card 1990

Mortality of thrombolytic therapy for AMI Mortality of thrombolytic therapy for AMI meantime to treatment (0-3 hours)meantime to treatment (0-3 hours)

Mortality of thrombolytic therapy for AMI Mortality of thrombolytic therapy for AMI meantime to treatment (3.1-5 hours)meantime to treatment (3.1-5 hours)

Mortality of thrombolytic therapy for AMI Mortality of thrombolytic therapy for AMI meantime to treatment (5.1-10 hours)meantime to treatment (5.1-10 hours)

Mortality of thrombolytic therapy for AMI Mortality of thrombolytic therapy for AMI meantime to treatment (> 10 hours)meantime to treatment (> 10 hours)

Vit E and all cause mortalityVit E and all cause mortality
Ann Intern Med. 2005;142(1):37-46.

Hazards of subgroup analysesHazards of subgroup analyses

From Fibrinolytic Therapy Trialists’ Collaborative Group: Indications for Fibrinolytic Therapy Lancet 343: 311,1994

ISIS-2. Lancet 1988;ii:349-60.ISIS-2. Lancet 1988;ii:349-60.Subgroup analysesSubgroup analyses

ISIS-2. Lancet 1988;ii:349-60.ISIS-2. Lancet 1988;ii:349-60.Subgroup analysesSubgroup analyses
Beyond subgroup analyses:Beyond subgroup analyses:meta-regressionmeta-regression

Subgroup analysisSubgroup analysis
Ann Intern Med. 2005;142(1):37-46.

Univariate meta-regressionUnivariate meta-regression
Ann Intern Med. 2005;142(1):37-46.
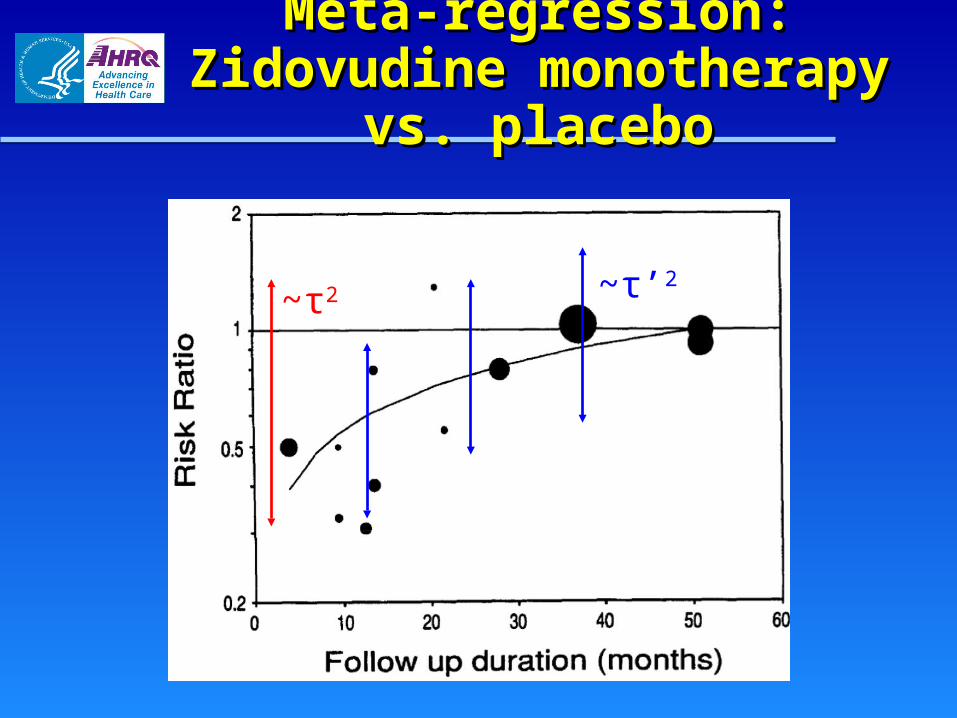
Meta-regression: Zidovudine Meta-regression: Zidovudine monotherapy vs. placebomonotherapy vs. placebo
~τ2 ~τ’2

# Studies: 40 Var.Btw 23.96 beta se.beta p values Net Change -4.56 9.33 Dose.iso -0.024 0.028 0.40 Dose.prot -0.085 0.080 0.30 Base 0.017 0.062 0.79 Quality 3.10 2.91 0.29 # Studies: 52 Var.Btw 19.08 Net Change -2.16 2.01 Dose.prot -0.096 0.053 0.08 # Studies: 45 Var.Btw 26.80 Net Change 17.20 11.72 Baseline LDL (LDL>130)
-0.138 0.072 0.06
Multivariate meta-regression: Effect of Soy on LDL
Covariate
Ne
t C
ha
ng
e
140 150 160 170 180 190 200
-30
-20
-10
01
0
Covariate
Ne
t C
ha
ng
e
0 20 40 60 80 100
-30
-20
-10
01
0
Dose Baseline LDL

Control Rate Meta-RegressionControl Rate Meta-Regression
Single covariate included is event rate in Single covariate included is event rate in the control group (control rate)the control group (control rate)– Control rate is surrogate for all baseline Control rate is surrogate for all baseline
differences between the studies, in terms differences between the studies, in terms of baseline risk for the event of interest.of baseline risk for the event of interest.
– Can show that underlying risk of event Can show that underlying risk of event (severity of illness) may explain differences (severity of illness) may explain differences in the treatment effect across studiesin the treatment effect across studies


Control rate meta-regression Control rate meta-regression in the streptokinase examplein the streptokinase example
Stat Med. 1998;17(17):1923-42.

Two types of covariates in meta-Two types of covariates in meta-regressionsregressions
Study level covariates vs. participant level Study level covariates vs. participant level covariates covariates
Study level: presence/absence of Study level: presence/absence of blinding, intervention dose (in blinding, intervention dose (in experimental studies)experimental studies)
Participant level: mean age, proportion Participant level: mean age, proportion of diabetics, mean intake of vitamin D (in of diabetics, mean intake of vitamin D (in observational studies)observational studies)

Spurious associations in meta-Spurious associations in meta-regressions and subgroup analysesregressions and subgroup analyses
Meta-regressions that use participant-level Meta-regressions that use participant-level covariates can mislead, as they are covariates can mislead, as they are susceptible to ecological fallacy susceptible to ecological fallacy
Associations of treatment effect and Associations of treatment effect and participant-level covariates should be participant-level covariates should be interpreted with cautioninterpreted with caution
See the quizSee the quiz

SummarySummary
Subgroup analyses, meta-regressions Subgroup analyses, meta-regressions and control-rate meta-regressions are and control-rate meta-regressions are tools to explore between-study tools to explore between-study heterogeneity. Do use them to heterogeneity. Do use them to understand your data. understand your data.
They are mostly hypothesis forming They are mostly hypothesis forming tools. Especially for meta-regressions tools. Especially for meta-regressions on patient-level covariates, ecological on patient-level covariates, ecological fallacy may mislead.fallacy may mislead.
Beware when interpreting their results.Beware when interpreting their results.