Embed Size (px)
Citation preview

1
Systematic kinetic studies on mixed gas hydrates by Raman spectroscopy and powder X-ray
diffraction
Manja Luzia, b, *, Judith M. Schicksb, Rudolf Naumannb and Joerg Erzingerb
aIASS Institute for Advanced Sustainability Studies Potsdam
Berliner Straße 130, D-14467 Potsdam
Germany
bGerman Research Centre for Geosciences GFZ
Telegrafenberg, D-14473 Potsdam
Section 4.2
Germany
*corresponding author. Tel.: +49 331 288 22416; fax: +49 331 288 22404
E-mail address: [email protected] (Manja Luzi)
ABSTRACT
This study presents results from systematic time-resolved experiments regarding the guest mole-
cule geometry. The in situ observations of formation and dissociation processes of multicompo-
nent hydrates were performed by means of Raman spectroscopy and a newly designed experi-
mental setup including powder X-ray diffraction (PXRD) whose capabilities will be presented
here in more detail. Both experimental setups allow investigating hydrate kinetics as a function of
pressure, temperature and feed gas composition. The unique feature of both setups is the continu-
ous gas flow providing a constant composition of the gas phase during the whole experiment. This
is crucial for the formation of mixed hydrates formed from feed gas mixtures that contain one or
more components in low concentrations. The formation of structure II hydrates including C3H8,
iso-C4H10, n-C4H10 or neo-C5H12 besides CH4 was analysed according to a multi-step model. For
the initial phase it turned out that hydrates grown from the gas mixture containing 2% n-C4H10 and
98% CH4 have the highest formation rate at defined p,T conditions in comparison to other hy-
drates formed from gas mixtures containing about 2 vol% of the above mentioned hydrocarbons
besides CH4. But the reaction mechanisms for each hydrate system emerged to be different. Fur-

2
thermore, time-resolved Raman and PXRD experiments were performed to study the formation of
structure H hydrates with a low-concentrated large hydrocarbon guest molecule. In case of a gas
mixture containing 1% iso-C5H12 and 99% CH4 the formation of a simple structure I CH4 hydrate
was observed at first. Later on, structure H CH4 + iso-C5H12 hydrate was formed resulting in a
coexistence of both structures.
Keywords: gas hydrates, kinetics, mixed hydrates, Raman spectroscopy, PXRD
1. Introduction
The knowledge of hydrate formation and dissociation kinetics is pivotal for the gas production
from hydrate reservoirs, the selective hydrate formation for the transport of natural gas or for the
containment of hydrate plug formation in pipelines. Kinetic data may also be used for numerical
simulations regarding the occurrence and composition of natural gas hydrates.
In the past, various kinetic studies on gas hydrate formation and growth processes as well as disso-
ciation processes were performed using a wide range of techniques such as neutron and X-ray dif-
fraction, NMR and Raman spectroscopy. Thereby, hydrate formation processes were mainly stud-
ied using ice [1].
The formation of hydrate from ice is a solid-state reaction and therefore takes place at the ice-gas
or ice-liquid hydrocarbon interface [2]. In recent years, different models were developed that de-
scribe the nucleation and growth process and consider, for instance, the dependency of the for-
mation rate on the surface area of the ice-gas interface [3]. Most of the proposed models have in
common that the hydrate formation process proceeds in two to three steps: During the initial stage
a hydrate film covers the ice surface. To maintain the hydrate formation either gas molecules or
water molecules have to diffuse through the growing hydrate layer. The inward/outward diffusion
of gas/water molecules is the rate-limiting second step of the formation process. This mechanism
was confirmed by experimental data presented by Takeya et al. [4] and Henning et al. [5]. Henning
et al. [5] applied a simple shrinking core model that was originally developed to describe the hy-
dration of cement grains to fit the diffusion-controlled stage. In 2002, Wang et al. [6] extended this
model to a third stage, which is controlled by the reaction of the guest molecules with residual ice.
However, the authors claim that their model can be reduced to the rate-limiting second stage and
modelled the second stage with an approach of Levenspiel [7] that was developed for gas-solid
reactions such as tarnishing reactions. Kuhs and co-workers have developed and continuously ed-

3
ited an own complex mathematical description for the formation of structure I gas hydrates from
ice powder based on the finding that some hydrate crystals showed a porous microstructure in the
nanoscale [8-13]. From the attempt to treat hydrate formation and decomposition in similar ways
Genov [11] suggested a combined Avrami-Erofeev and Ginstling-Brounshtein model. Hydrate
formation was again divided into a two-stage process with formation and growth of hydrate nuclei
at the beginning modelled by means of the Avrami-Erofeev theory and a diffusion-controlled se-
cond stage, which was fitted using the Ginstling-Brounshtein theory.
A similar approach for modelling the formation of structure H hydrates from ice was favoured by
Susilo et al. [14]. The authors state that the initial reaction is controlled by intrinsic kinetics and
can be therefore fitted with the Avrami equation. The second diffusion-limited stage is described
with a simple shrinking-core model based on the Jander equation.
However, the influence of the guest molecules on the kinetics of hydrate formation or dissociation
is rarely studied. Recently, it was shown that depending on the formation conditions the chemical
nature of the guest molecule (e.g. water solubility) as well as its geometry strongly influence the
composition of the hydrate phase. To come close to natural conditions gas mixtures containing
small amounts of higher hydrocarbons from C4 to C5 were used [15]. Thereby, it turned out that
shape and conformation of the guest molecule and hydrate structure cause each other [16].
This work presents a new experimental technique, which allows studying the formation of gas hy-
drates in situ. The goal is to give a first insight into the influence of typical structure II forming
hydrocarbons on hydrate formation kinetics based on a three-step hydrate formation model under
the aspect of their molecular size and shape. In addition, the same experimental setups were used
to study the formation of structure H hydrates from low iso-C5H12 concentrations.
2. Experimental
Experiments were performed with two different experimental setups, which are both supplied with
a continuous gas flow. For instance, one pressure cell is integrated into a setup including a confo-
cal Raman spectrometer (LABRAM, Horiba Jobin Yvon). The Raman sample cell is made from
Hastelloy and has a volume of 0.4 cm3. It can be run in a temperature range between 246 K and
353 K and a pressure range between 0.1 MPa and 10 MPa. A thermostat carries out the cooling of
the sample cell while the temperature is determined with a Pt 100 temperature sensor with a preci-
sion of 0.1 K. The pressure is regulated with an ER 3000 pressure regulator (Tescom Corp.) with a

4
precision of 2% (rel.). The sample cell is operated with a continuous gas flow of 1 mL/min. There-
fore, the incoming gas needs 17 s to pass the cell body before it enters the sample chamber. During
this time the incoming gas adjusts to the cell temperature. Furthermore, the pressure cell is
equipped with a quartz window. This allows a visual observation of the phases present in the cell
as well as the collection of Raman spectra during formation, decomposition or transformation pro-
cesses of the gas hydrate crystals. For further details regarding the experimental setup the reader is
directed to the publication of Schicks et al. [17].
To determine the phase boundary conditions of the mixed hydrates the pressure cell is filled with
150 µL deionized, degassed water. Next, the sample cell is sealed and flushed with the respective
gas mixture before pressurization. Then, the sample cell is cooled down with ca. 2 K/min until a
spontaneous crystallization occurs that was mostly observed below 263 K. As indicated from Ra-
man measurements a mixture of ice and hydrate forms at this time. In the next step, the cell is care-
fully warmed up until at first ice crystals and later on gas hydrate crystals start to dissociate. By
the time only a few crystals are left the sample cell is cooled down to ca. 0.5 K below the decom-
position limit of the hydrate crystals. At this point, euhedral gas hydrate crystals are allowed to
grow. The phase boundary conditions are determined by heating the sample cell slowly until the
first crystals start to dissociate.
In order to study formation kinetics the sample cell is filled to one third with powdered ice. There-
fore, ice was generated from deionised water that was frozen in a liquid nitrogen bath. Afterwards
the ice was powdered in a 6750 freezer mill (Spex CertiPrep) that was also cooled with liquid ni-
trogen. By means of scanning electron microscopy the diameter of these ice particles was account-
ed to be in between 10 to 20 µm. Figure 1 shows a SEM image of freshly prepared ice powder. As
the ice particles are exposed to ambient air frost may form on their surface. Once filled into the
pressure cell the ice was kept until it attained the cell temperature of 271 K. Afterwards, the sam-
ple cell was pressurized and data acquisition was started.
Time-dependent PXRD measurements were performed with a low-temperature-high-pressure cell
that was integrated into a Bruker AXS Discover diffractometer. The concept of this experimental
setup is similar to the pressure cell, which is combined with the Raman spectrometer that was de-
scribed before. The pressure cell is made from stainless steel with a hole of 0.5 cm diameter in its
centre and has a volume of 250 µL. Both sides of the cell body are sealed with beryllium plates
and tightened with O-rings. The cell can be operated in a pressure range between 0.1 to 4.0 MPa.

5
The pressure is also regulated with an ER 3000 pressure regulator. The temperature is controlled
by means of a Peltier-cooling device (Kryotherm model TB-119-1.4-1.15CH) that also contains a
hole of 0.5 cm. The Peltier-cooling provides quick temperature changes and a precise temperature
control of ± 1.0 K by use of an adjustable power source and a controlling device (West 4200, West
Instruments Ltd). The cell can be run in a temperature range between 253 K and 288 K. The cell
was designed for the use in combination with a Bruker AXS D8 Discover microdiffractometer
with Cu-Kα -radiation generated at 40 kV and 40 mA. The diffractometer has parallel beam optics
(Goebel mirror) to optimize the beam intensity that enables the analysis of powder samples with a
non-planar surface. A mono-capillary, which narrows the beam to a diameter of 300 µm, was ap-
plied. In consequence, small sample areas and consequently small sample amounts of gas hydrate
powder can be investigated in the micrometer range. The detection of the diffracted X-rays is car-
ried out with GADDS (General Area Detection Diffraction System), which includes a High Star
area detector. A more detailed description of the experimental setup can be found by Luzi et al.
[18]. For a typical kinetic experiment the precooled sample cell is filled with approximately 100
µL powdered ice, carefully sealed and mounted on the XYZ stage of the diffractometer. Thereby,
the ice sticks on the beryllium window, which is situated on the side of the Peltier cooling device.
Next, the sample cell is pressurized with the respective gas mixture and the data acquisition is
commenced and lasts for at least 8 h. The frequency of data collection depends on the transfor-
mation rate of ice into hydrate. Due to the narrow beam various positions within the sample can be
measured in a short sequence. Commonly, five defined measuring points, which are randomly dis-
tributed within the sample cell, are chosen for analysis. A list of the gas mixtures used in this study
is given in table 1.
3. Results and discussion
3.1 Guest molecule diameter
Although the large hydrocarbon guest molecules used in this study are known structure II formers
their ability to fill the hydrate cage in a proper way is different and depends to a great extent on the
molecular shape and diameter [1]. The van der Waals diameter of the guest molecules was calcu-
lated by summation of the molecular diameter, which was determined using the software CS
Chem3D Pro Version 7.0 from Cambridge Soft, and the van der Waals radius of the outer hydro-

6
gen atoms. The utilized van der Waals radius of the hydrogen atoms is 110 pm and was obtained
from Mantina et al. [19]. This procedure is obeyed as an approximation. Table 2 provides an over-
view of the van der Waals diameters of the large hydrocarbon guest molecules. As is known n-
C4H10 has more than one conformation. The respective van der Waals diameters of the three con-
formers are also given in table 2. Effectively, the trans conformer would be too large to fit into the
51264 cavity of structure II [1]. But as n-butane was verified as structure II former the shape of the
molecule must also play a certain role. From dielectric [20] and Raman measurements [21] and
recently single crystal X-ray diffraction [16] it was shown that n-butane is incorporated into the
hydrate cage as its gauche conformer.
3.2 Phase equilibria data
Time-dependent PXRD experiments were performed at defined p,T conditions within the stability
field of the mixed hydrates. In order to evaluate the influence of the large hydrocarbon guest mole-
cule the experiments were conducted at the same temperature (267 K) and 75% above the equilib-
rium pressure regarding each gas mixture. Therefore, the phase boundaries for the mixed hydrates
had to be determined both experimentally and by means of the software CSMGem [22]. Figure 2
shows the phase diagram for the mixed hydrates containing C3H8, iso-C4H10, n-C4H10 or neo-
C5H12 besides CH4. The experimental data (displayed as squares) are compared with modelled data
(displayed as lines), which were determined by means of CSMGem [22]. Apparently, experi-
mental and modelled data show a good agreement. Hydrate phase equilibria were not only mod-
elled for the liquid water-hydrate-vapour (LW-H-V) region but also for the ice-hydrate-vapour (I-
H-V) region because these data were required for the kinetic experiments. CH4 + neo-C5H12 hy-
drate is the only system whose phase equilibria could not be modelled with CSMGem because the
guest molecule neo-C5H12 is not integrated in the program. Therefore, the decomposition line was
derived from an exponential fit (R2 > 0.99) of the experimental data obtained in the LW-H-V region
and extended into the I-H-V region. Obviously, this is a mistake because the change of the slope of
the decomposition line at the quadruple point (approximately at 273 K) where the four phases (I-
LW-H-V) coexist is not obeyed. However, in terms of absolute values the mistake is supposed to be
rather low because the equilibrium pressure for CH4 + neo-C5H12 hydrate at 273 K is ca. 0.6 MPa.

7
Table 3 shows the p,T conditions for the time-dependent PXRD experiments. The measurements
were conducted at the same temperature and a (composition-related) pressure of 75% above the
respective equilibrium pressure.
3.3 Analysis of time-dependent PXRD data
Figure 3 presents the results of a time-resolved PXRD experiment showing the conversion of hex-
agonal ice into a cubic structure II hydrate that was formed from gas mixture GM_nC4. The hy-
drate was grown at 2.36 MPa and 267 K. The transformation process is shown for one out of five
measuring points. The prominent diffraction peaks from the ice and the hydrate phase are labelled
by the Miller indices of the respective crystal planes. At the beginning of the experiment only the
four ice reflections occur (see figure 3 at t = 0 min). After 8 min hydrate crystal formation starts
which is expressed with the occurrence of the hydrate reflections. In the course of the experiment
the hydrate reflections increase while the intensities of the ice reflections decrease. This leads to
the conclusion that the ice phase is converted into a structure II gas hydrate. The integrated intensi-
ty of a reflection is proportional to the crystal volume. A change of the integrated intensity is
therefore associated with a volume change of the hydrate or ice phase. The rate of change provides
information about formation, dissociation or transformation rates of the hydrate crystals [4].
Unfortunately, the diffraction data could not be quantified by the typically used Rietveld refine-
ment method. Therefore, the diffraction data were analysed in a semi-quantitative way that includ-
ed a single line analysis. In order to estimate the progress of the transformation process between
the two crystal structures a representative reflection for each phase was chosen. In case of hexago-
nal ice the reflection for the (100) crystal plane at circa 22.8° 2θ was used, and for structure II the
reflection for the (531) crystal plane at circa 30.3° 2θ was used. This reflection was chosen be-
cause it does not overlap with reflections from the ice phase. From both values the relative intensi-
ty ratio between the hydrate phase and the ice phase was calculated, which is considered as total
reaction constant α. The calculation of the peak areas is done by means of the Bruker AXS
TOPAS program. As data from five measuring points are obtained a mean value for the intensity
ratio can be determined. The error is the standard deviation. Figure 4 shows the total reaction ex-
tent α (resulting from the semi-quantitative analysis) for the formation of CH4 + n-C4H10 hydrate
starting from a pure ice phase for the first 8 h.

8
3.4 Description of the hydrate formation model
Based on the above described literature findings the hydrate formation process from ice was divid-
ed into three stages. During the first step hydrate crystals start to nuclei and grow on the surface of
an ice particle. The incipient hydrate growth occurs on various active sites on the surface resulting
in a thin hydrate film that spreads around the ice particle. At this time the formation rate is sup-
posed to be basically limited by the enclathration reaction. Once a hydrate film has formed the
growth rate is assumed to be mainly controlled by the inward diffusion of the gas molecules
through the hydrate layer to the unreacted ice core or the outward transport of water molecules to
the hydrate-gas interface. But the appearance of ice imperfections such as lattice defects, cracks
and pores may influence the start and the progress of the second step distinctly [12, 23]. At con-
version rates above 90% a third step was observed. At this point, the hydrate formation rate slows
down markedly and seems to be no longer controlled by diffusion but by the reaction of depleting
unreacted ice particles with the gas molecules. Naturally, this step of hydrate formation was ob-
served for only a low number of systems and also incompletely. Therefore, a mathematical de-
scription of this process is not done.
The initial hydrate formation step controlled by the enclathration reaction is modelled using the
Avrami rate law. Lots of solid-state reactions such as crystalline growth can be described by rela-
tions that are based on the process of nucleation. Random nucleation followed by the growth of the
nuclei is often modelled using the Avrami rate law (also known as Avrami-Erofeev or Johnson-
Mehl-Avrami-Kolmogorow equation) [23, 24]. This equation has been successfully used before to
fit data from hydrate formation experiments [2, 11, 14]. The reaction extent α can be given by a
general expression of the Avrami rate law being
! = 1− exp (−!"!), (1)
whereby k is the formation rate constant, n is the Avrami exponent and t is the time. Taking twice
the logarithm of equation 1 results in the following form
ln − ln 1− ! = ln ! + ! ln !. (2)
9
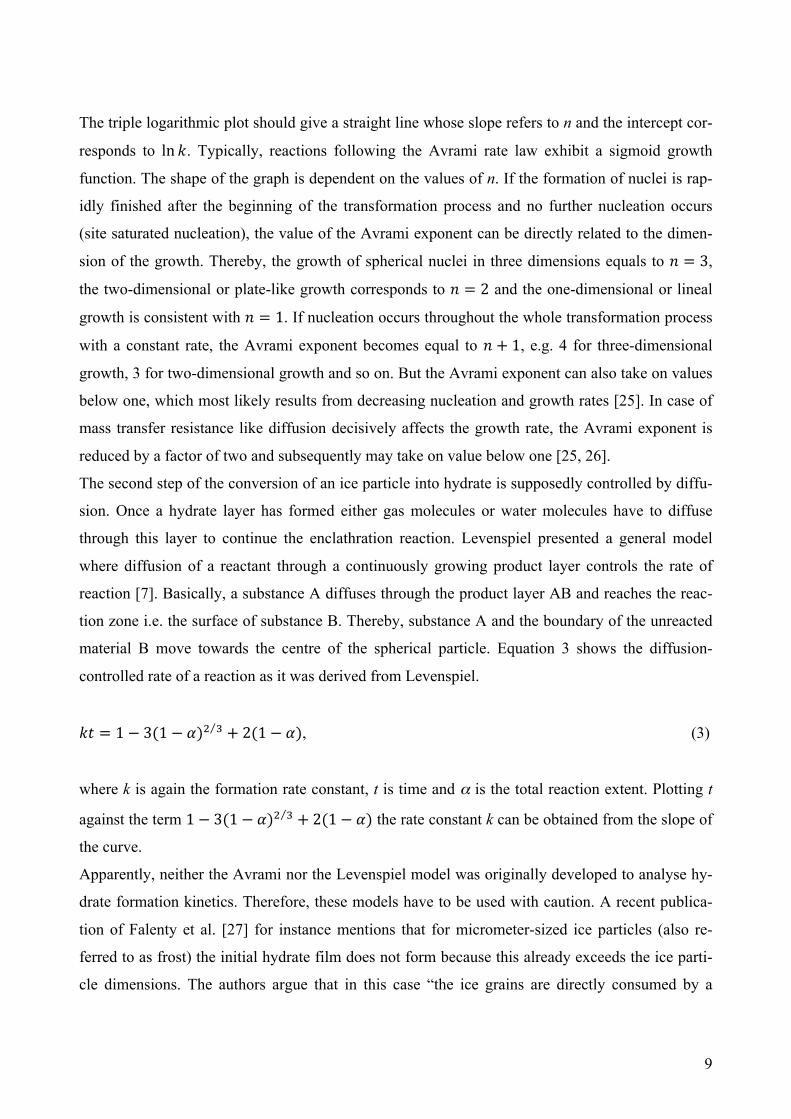
The triple logarithmic plot should give a straight line whose slope refers to n and the intercept cor-
responds to ln !. Typically, reactions following the Avrami rate law exhibit a sigmoid growth
function. The shape of the graph is dependent on the values of n. If the formation of nuclei is rap-
idly finished after the beginning of the transformation process and no further nucleation occurs
(site saturated nucleation), the value of the Avrami exponent can be directly related to the dimen-
sion of the growth. Thereby, the growth of spherical nuclei in three dimensions equals to ! = 3,
the two-dimensional or plate-like growth corresponds to ! = 2 and the one-dimensional or lineal
growth is consistent with ! = 1. If nucleation occurs throughout the whole transformation process
with a constant rate, the Avrami exponent becomes equal to ! + 1, e.g. 4 for three-dimensional
growth, 3 for two-dimensional growth and so on. But the Avrami exponent can also take on values
below one, which most likely results from decreasing nucleation and growth rates [25]. In case of
mass transfer resistance like diffusion decisively affects the growth rate, the Avrami exponent is
reduced by a factor of two and subsequently may take on value below one [25, 26].
The second step of the conversion of an ice particle into hydrate is supposedly controlled by diffu-
sion. Once a hydrate layer has formed either gas molecules or water molecules have to diffuse
through this layer to continue the enclathration reaction. Levenspiel presented a general model
where diffusion of a reactant through a continuously growing product layer controls the rate of
reaction [7]. Basically, a substance A diffuses through the product layer AB and reaches the reac-
tion zone i.e. the surface of substance B. Thereby, substance A and the boundary of the unreacted
material B move towards the centre of the spherical particle. Equation 3 shows the diffusion-
controlled rate of a reaction as it was derived from Levenspiel.
!" = 1− 3(1− !)! ! + 2(1− !), (3)
where k is again the formation rate constant, t is time and α is the total reaction extent. Plotting t
against the term 1− 3(1− !)! ! + 2(1− !) the rate constant k can be obtained from the slope of
the curve.
Apparently, neither the Avrami nor the Levenspiel model was originally developed to analyse hy-
drate formation kinetics. Therefore, these models have to be used with caution. A recent publica-
tion of Falenty et al. [27] for instance mentions that for micrometer-sized ice particles (also re-
ferred to as frost) the initial hydrate film does not form because this already exceeds the ice parti-
cle dimensions. The authors argue that in this case “the ice grains are directly consumed by a

10
growing nucleus created on the particle surface”. For this reason the Avrami equation cannot be
applied to the hydrate formation from micrometer-sized ice particles (particle size of 2.5-7.5 µm)
because the Avrami model assumes “…an infinitively large domain of crystallization” [27]. Note-
worthy, this effect is not supposed to have an essential impact on the results presented here be-
cause the ice particles used in this work have an average diameter of ca. 10-20 µm although they
are also partly covered with frost.
3.5 Results of kinetic analysis
The data obtained from in situ PXRD experiments were analysed according to equation 1 and 3.
For the experiments presented here, the third step in the transformation process from ice into struc-
ture II hydrate was not observed. Hydrate formation reactions were usually observed for at least 8
h to enable the identification of single reaction stages. Figure 5 shows a two-step analysis of the
formation process of CH4 + C3H8 hydrate. Figure 5a, 5b and 5c include the experimental data for
the hydrate formation reaction recorded for 500 min at 1.26 MPa and 267 K, the respective triple
logarithmic plot for the overall reaction and the plot for the diffusion-controlled second step for
one out of five measuring points.
In order to find out if and at what point the reaction changes from initial nucleation and growth to
diffusion control the complete data set for the CH4 + C3H8 hydrate was displayed in the triple loga-
rithmic plot. From figure 5b it comes out that the Avrami fit works within the first 40 min
(ln ! = 3.76) of hydrate formation. After 40 min the curve shows a turning, which indicates a
change of the reaction mechanism. The subsequent hydrate formation is most likely dominated by
a diffusion-controlled reaction and is therefore analysed by means of the Levenspiel equation. To
meet the conditions of equation 3 the amount of hydrate formed during the first step was deducted
and the corrected reaction time t* was introduced starting with !∗ = 0. So, α* is the total reaction
extent when diffusion overtakes the control of the reaction rate. From figure 5c it becomes appar-
ent that the fitting related to diffusion control is successful. A two-step analysis could also be car-
ried out for the CH4 + neo-C5H12 hydrate.
In contrast to the previous example, it is also possible that a hydrate formation reaction is only
weakly influenced by diffusion. Figure 6 shows the hydrate formation reaction for CH4 + n-C4H10
that was observed for 480 min and the triple logarithmic plot for the complete reaction.

11
From figure 6a it becomes obvious that the amount of hydrate reaches ca. 65% (rel.) within the
observed time period. Remarkably, the Avrami fit (figure 6b) succeeds for the complete period
that was recorded. This indicates that the formation rate is governed by the enclathration reaction
and it is furthermore not controlled but presumably only slightly affected by diffusion within this
time. The same effect was also observed for the CH4 + iso-C4H10 hydrate. Table 4 and 5 give an
overview on the formation rate constants that were obtained for the reaction-controlled formation
steps and diffusion-controlled steps, respectively.
Regarding table 4 and 5 two different tendencies can be observed. First, for the mixed hydrates
containing C3H8 and neo-C5H12, respectively, a two step-process can be applied. This implies that
after an initial nucleation reaction diffusion determines the formation rate constant. Secondly, for
the mixed hydrates that contain n-C4H10 and iso-C4H10 the observed part of the formation reaction
can be completely described by means of the Avrami model.
In terms of absolute values CH4 + n-C4H10 hydrate shows the highest formation rate constant for
the enclathration-controlled reaction as comes out from table 4. It is followed by the mixed hy-
drates including C3H8 and iso-C4H10, which are in the same order of magnitude. The k value of
CH4 + neo-C5H12 hydrate is two order magnitudes less. In regard of the pressure-temperature dia-
gram (figure 2) and the molecular diameters (table 2) this result is rather surprising. Starting from
the same temperature the CH4 + n-C4H10 hydrate shows the highest equilibrium pressure compared
to other mixed hydrates also because n-C4H10 does not ideally fill the large cage of structure II
[16]. In terms of molecular diameter C3H8, iso-C4H12 and neo-C5H12 have similar values and show
a more favourable size to cavity ratio [1]. Therefore, the molecular size and shape does not seem to
be related to the hydrate formation rate at least during the first step.
In case of neo-C5H12 it was pointed out before that the p,T conditions applied during the PXRD
experiments are based on own experimental data that were obtained in the LW-H-V region. Flow-
ingly, the calculation of p,T values below 273 K from the experimental data might be imperfect
resulting in too low p values. Consequently, the formation rate constants for CH4 + neo-C5H12
might be underestimated.
In addition to k values the Avrami model also delivers indications regarding the dimension of the
crystal growth. Assuming that the nucleation occurs instantaneously when the cell is pressurized a
value of ! = 1 can be expected which corresponds to a one-dimensional growth in the form of
dendrites or needles. However, the Avrami exponents for the hydrates containing the C3H8, iso-
C4H10 and n-C4H10 are less than one. An n value below one indicates that the nucleation and

12
growth rate are decreasing during the formation process due to decreasing nucleation and growth
sites. Since the particle size distribution for the ice particles is not homogenous and the ice parti-
cles are presumably also covered with frost it seems to be reasonable that the smaller particles re-
act first and convert also faster into hydrate. As a result the number of possible nucleation sites and
also the growth rate decreases. However, it is not clear to what extent mass transfer effects affect
the formation rates. For CH4 + neo-C5H12 hydrate the value for the Avrami exponent is ! = 1.71,
which indicates a 1D/2D dimensional growth of hydrate crystals.
Contrary to the binary hydrates including iso-C4H10 or n-C4H10, for CH4 + C3H8 hydrate and CH4
+ neo-C5H12 hydrate the initial nucleation and growth process is followed by a change of the reac-
tion mechanism where the formation rate slows down. The second step can be successfully fitted
by means of the diffusion-controlled model. Compared to C3H8, the molecular diameter of neo-
C5H12 is slightly larger which also influences the rate of diffusion. From table 5 it comes out that
the k value for CH4 + neo-C5H12 hydrate is smaller which supports this assumption.
From the gained parameters it might be concluded that the mixed hydrates containing n-C4H10 and
iso-C4H10 show a fast instantaneous nucleation which is presumably immediately accompanied by
mass transfer effects as there is no change of mechanism observable from the triple logarithmic
plot. In contrast, the CH4 + C3H8 and CH4 + neo-C5H12 hydrates exhibit a two-step mechanism
including an initial hydrate nucleation and growth stage followed by a diffusion-controlled stage.
The reasons for this behaviour seem to be rather complex and do not only depend on the molecular
size and shape in the first order. At least, the presented results are tentative and need more discus-
sion.
3.6 In situ Raman and PXRD analysis of CH4 + iso-C5H12 hydrate formation
Time-dependent measurements employing Raman spectroscopy and PXRD were also conducted
with a gas mixture consisting of 1% iso-C5H12 and 99% CH4. Figure 7 shows PXRD diagrams as a
function of time collected during CH4 + iso-C5H12 hydrate formation from ice at one measuring
point at 267 K and 1.06 MPa. Please note, that the chosen p,T conditions are located within the
stability fields of structure I CH4 hydrate as well as structure H CH4 + iso-C5H12 hydrate which
was estimated using CSMGem [22].
The experiment starts from hexagonal ice, which is labelled in figure 7. Remarkably, after 7 min
the first reflections that occur from a new phase arise from cubic structure I. After ca. 120 min a
13
small shoulder starts to form at 18.3° 2θ that was not recorded for pure cubic structure I hydrates
in reference experiments before. The hydrate formation was observed for more than 12 h. Analysis
of the position of the diffraction peaks showed that the formation of a cubic structure I hydrate is
followed by the formation of a hexagonal structure H hydrate. The whole experiment was run for
48 h under the same conditions showing a decreasing amount of ice but a continuous coexisting of
structure I and structure H hydrate crystals.
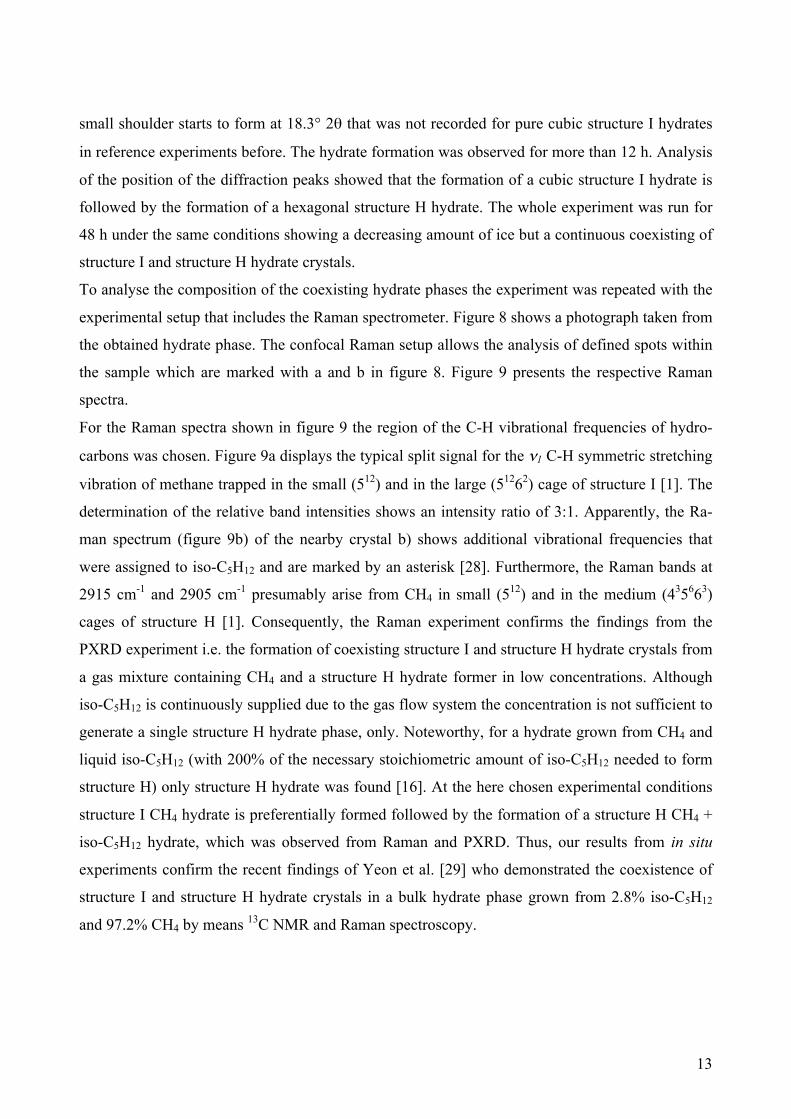
To analyse the composition of the coexisting hydrate phases the experiment was repeated with the
experimental setup that includes the Raman spectrometer. Figure 8 shows a photograph taken from
the obtained hydrate phase. The confocal Raman setup allows the analysis of defined spots within
the sample which are marked with a and b in figure 8. Figure 9 presents the respective Raman
spectra.
For the Raman spectra shown in figure 9 the region of the C-H vibrational frequencies of hydro-
carbons was chosen. Figure 9a displays the typical split signal for the ν1 C-H symmetric stretching
vibration of methane trapped in the small (512) and in the large (51262) cage of structure I [1]. The
determination of the relative band intensities shows an intensity ratio of 3:1. Apparently, the Ra-
man spectrum (figure 9b) of the nearby crystal b) shows additional vibrational frequencies that
were assigned to iso-C5H12 and are marked by an asterisk [28]. Furthermore, the Raman bands at
2915 cm-1 and 2905 cm-1 presumably arise from CH4 in small (512) and in the medium (435663)
cages of structure H [1]. Consequently, the Raman experiment confirms the findings from the
PXRD experiment i.e. the formation of coexisting structure I and structure H hydrate crystals from
a gas mixture containing CH4 and a structure H hydrate former in low concentrations. Although
iso-C5H12 is continuously supplied due to the gas flow system the concentration is not sufficient to
generate a single structure H hydrate phase, only. Noteworthy, for a hydrate grown from CH4 and
liquid iso-C5H12 (with 200% of the necessary stoichiometric amount of iso-C5H12 needed to form
structure H) only structure H hydrate was found [16]. At the here chosen experimental conditions
structure I CH4 hydrate is preferentially formed followed by the formation of a structure H CH4 +
iso-C5H12 hydrate, which was observed from Raman and PXRD. Thus, our results from in situ
experiments confirm the recent findings of Yeon et al. [29] who demonstrated the coexistence of
structure I and structure H hydrate crystals in a bulk hydrate phase grown from 2.8% iso-C5H12
and 97.2% CH4 by means 13C NMR and Raman spectroscopy.

14
4. Summary and conclusions
The main goal of this study was to present a new in situ technique to investigate hydrate formation
kinetics and to give a first insight into the influence of the guest molecule size on the hydrate for-
mation rate. Therefore, mixed structure II hydrates containing C3H8, iso-C4H10, n-C4H10 or neo-
C5H12 besides CH4 were grown at comparable conditions that were figured out before from exper-
imental and modelled phase equilibria data. Hydrate formation was followed by in situ PXRD and
analysed by means of a three-step model whereby the third stage was not observed for these exper-
iments. The first stage including the initial formation and growth of a hydrate layer was modelled
with the Avrami equation. The Levenspiel model for diffusion-controlled reactions is used to de-
scribe the second stage. It turned out that the mixed hydrates follow two different reaction mecha-
nisms. The formation of the hydrates containing iso-C4H10 and n-C4H10, respectively, can be com-
pletely described with the Avrami model. The formation rate constants for the observed period are
determined by the enclathration reaction. The hydrates grown from the gas mixtures containing
C3H8 and neo-C5H12 show a change in the formation mechanism, which allowed the application of
a typical two-step formation model. Regarding the guest molecule size and shape, this does not
seem to influence the formation rate at least during the enclathration-controlled stage of hydrate
formation. Remarkably, the n-C4H10 containing hydrate has the highest formation rate although its
size to cavity ratio is much less favourable as it is for the other large hydrocarbon guest molecules
examined here. In contrast, for the diffusion controlled second step the guest molecule with the
smaller molecular diameter shows the larger reaction rate.
However, from the here presented in situ PXRD experiments of the binary structure II hydrates it
remains unclear what caused the observed change of the reaction mechanism. Except from guest
composition and absolute pressure all parameters were kept constant. So, the reason is assumed to
be related to one of these parameters. Therefore, further experiments with varying pressure are
performed whose results will be presented later.
In addition, the formation reaction of hydrates grown from CH4 and a low concentrated structure H
former was studied using Raman spectroscopy and PXRD. From both experiments it was observed
that a structure I CH4 hydrate forms in the first place. Thereupon, an iso-C5H12 containing struc-
ture H hydrates forms in coexistence with the structure I CH4 hydrate.

15
Acknowledgements
The authors thank the staff of the GFZ workshops for the invaluable technical help and for the
construction of the pressure cells.
References
[1] E.D. Sloan, C.A. Koh, Clathrate Hydrates of Natural Gases, third ed., CRC Press, Boca Raton,
2008.
[2] I.L. Moudrakovski, A.A. Sanchez, C.I. Ratcliffe, J.A. Ripmeester, J. Phys. Chem. B 105
(2001) 12338-12347.
[3] R.M. Barrer, A.V.J. Edge, Proceedings of the Royal Society of London. Series A. Mathemati-
cal and Physical Sciences 300 (1967) 1-24.
[4] S. Takeya, T. Hondoh, T. Uchida, Ann NY Acad Sci 912 (2000) 973-982.
[5] R.W. Henning, A.J. Schultz, V. Thieu, Y. Halpern, J. Phys. Chem. A 104 (2000) 5066-5071.
[6] X. Wang, A.J. Schultz, Y. Halpern, J. Phys. Chem. A 106 (2002) 7304-7309.
[7] O. Levenspiel, Chemical Reaction Engineering, John Wiley & Sons, New York, 1999.
[8] A.N. Salamatin, W.F. Kuhs, in: Proceedings of the Forth International Conference on Gas Hy-
drates, Yokohama, 2002.
[9] D.K. Staykova, W.F. Kuhs, A.N. Salamatin, T. Hansen, J. Phys. Chem. B 107 (2003) 10299-
10311.
[10] G. Genov, W.F. Kuhs, D.K. Staykova, E. Goreshnik, A.N. Salamatin, Amer. Mineral. 89
(2004) 1228–1239.
[11] G. Genov, Physical processes of the CO2 hydrate formation and decomposition at conditions
relevant to Mars, PhD thesis, Georg August Universität, Göttingen, 2005.
[12] W.F. Kuhs, D.K. Staykova, A.N. Salamatin, J. Phys. Chem. B 110 (2006) 13283-13295.
[13] A. Falenty, Formation and decomposition processes of CO2 hydrates at conditions relevant to
Mars, PhD thesis, Georg-August-Universität, Göttingen, 2008.
[14] R. Susilo, J.A. Ripmeester, P. Englezos, AIChE Journal 53 (2007) 2451-2460.
[15] J.M. Schicks, M. Luzi, J. Erzinger, E. Spangenberg, in: W.F. Kuhs (Ed.), Physics and Chem-
istry of Ice, RSC Publishing. Cambridge, 2007, pp. 537-544.

16
[16] M. Luzi, J.M. Schicks, R. Naumann, J. Erzinger, K. Udachin, I. Moudrakovski, J.A. Rip-
meester, R. Ludwig, in: Proceedings of the 6th International Conference on Gas Hydrates, Vancou-
ver, 2008.
[17] J.M. Schicks, R. Naumann, J. Erzinger, K.C. Hester, C.A. Koh, E.D. Sloan, J. Phys. Chem. B
110 (2006) 11468-11474.
[18] M. Luzi, M. Girod, R. Naumann, J.M. Schicks, J. Erzinger, Rev. Sci. Instrum. 81 (2010)
125105.
[19] M. Mantina, A.C. Chamberlin, R. Valero, C.J. Cramer, D.G. Truhlar, J. Phys. Chem. A 113
(2009) 5806-5812.
[20] D.W. Davidson, S.K. Garg, S.R. Gough, R.E. Hawkins, J.A. Ripmeester, Can. J. Chem. 55
(1977) 36-41-3650.
[21] S. Subramanian, E.D. Sloan, J. Phys. Chem. B 106 (2002) 4348-4355.
[22] A.L. Ballard, E.D. Sloan, Fluid Phase Equilib. 194-197 (2002) 371-383.
[23] J.E. House, Principles of Chemical Kinetics, Elsevier, San Diego, 2007.
[24] M. Fanfoni, M. Tomellini, Il Nuovo Cimento D 20 (1998) 1171-1182.
[25] T. Pradell, D. Crespo, N. Clavaguera, M.T. Clavaguera-Mora, J. Phys.: Condens. Matter 10
(1998) 3833-3844.
[26] U.W. Gedde, Polymer Physics: Crystallization Kinetics, Chapman and Hall, London, 1995.
[27] A. Falenty, G. Genov, T.C. Hansen, W.F. Kuhs, A.N. Salamatin, J. Phys. Chem. C 115 (2011)
4022-4032.
[28] N.G. Mirkin, S. Krimm, J. Mol. Struct. 550-551 (2000) 67-91.
[29] S.-H. Yeon, J. Seol, H. Lee, JACS 128 (2006) 12388-12389.

17
Figures:
FIGURE 1. SEM image of freshly prepared ice powder.
FIGURE 2: Phase diagram of mixed gas hydrates includig experimental and modelled data: p, 2% n-C4H10 98% CH4; ¢, 2% C3H8 98% CH4; �, 2% iso-C4H10 98% CH4; é, 2% neo-C5H12 98% CH4; —, modelled values using CSMGem or exponential fit for neo-C5H12 + CH4 hydrate.
FIGURE 3. Time-resolved PXRD diagrams showing the growth of CH4 + n-C4H10 hydrate at 267 K and 2.36 MPa.

18
FIGURE 4. Mean formation rate of CH4 + n-C4H10 hydrate at 267 K and 2.36 MPa.
FIGURE 5. a) Formation reaction of CH4 + C3H8 hydrate for one measuring point b) overall Av-rami fit c) Levenspiel fit for second step.

19
FIGURE 6. a) Formation reaction of CH4 + n-C4H10 hydrate for one measuring point b) overall Avrami fit.

20
FIGURE 7. Time-resolved PXRD diagrams showing the formation of structure I and structure H gas hydrates from ice.
FIGURE 8. Photograph of hydrate crystals grown from a gas mixture containing 1% iso-C5H12 and 99% CH4.
FIGURE 9. Raman spectra of gas hydrate crystals grown from a gas mixture containing 1% iso-C5H12 and 99% CH4.

21

22
Tables:
TABLE 1. Composition of gas mixtures.
Gas mixture Name 2% C3H8 98% CH4 GM_C3 2% iso-C4H10 98% CH4 GM_isoC4 2% n-C4H10 98% CH4 GM_nC4 2% neo-C5H12 98% CH4 GM_neoC5 1% iso-C5H12 99% CH4 GM_isoC5
TABLE 1. van der Waals diameter of structure II hydrate formers.
Large hydrocarbon guest molecule Guest molecule diameter/ppm C3H8 657 iso-C4H10 657
n-C4H10 786 (trans conformer) 743 (gauche conformer) 733 (cis conformer)
neo-C5H12 658
TABLE 3. p,T conditions of time-dependent XRD experiments.
Gas mixture T/K p/MPa GM_C3 267 1.26 GM_isoC4 267 0.93 GM_nC4 267 2.36 GM_neoC5 267 0.54
TABLE 4. Formation rate constants and Avrami exponents obtained for enclathration-controlled
reaction step.
Gas mixture k/min-1 kerror/min-1 n nerror GM_C3 2.04E-02 5.73E-03 0.86 0.07 GM_iso-C4 1.49E-02 5.84E-03 0.78 0.07 GM_n-C4 3.02E-02 2.44E-03 0.57 0.01 GM_neo-C5 5.69E-04 1.87E-04 1.71 0.07

23
TABLE 5. Formation rate constants obtained for diffusion-controlled reaction step.
Gas mixture k/min-1 kerror/min-1 GM_C3 1.95E-04 3.15E-05 GM_iso-C4 - - GM_n-C4 - - GM_neo-C5 4.57E-05 1.76E-05

![New Techniques in Corolling Gas Hydrates [Recovered] Techniques in Corolling Gas Hydrates... · New Techniques in Controlling Gas Hydrates ... Ethane Propane ... • When hydrates](https://img.pdfslide.us/doc/110x75/5b865c467f8b9a195a8ca7ef/new-techniques-in-corolling-gas-hydrates-recovered-techniques-in-corolling-gas.jpg)