Embed Size (px)
Citation preview
2
Systematic Approach to Design with Nature
Ali Sepahi Isfahan University
Iran
1. Introduction
One of the main goals in the field of Environmental Design in the 21st Century should be to find objective and systematic design processes for the implementation of the concept of design with nature for large scale projects such as regional parks, residential villages, reforestation and green belts around industrial sites. The author also believes that to design with nature, one should design the way nature does. Nature designs in terms of natural laws rather than taste, personal preference or school of design. Some projects, however, involve man-made as well as natural laws and parameters. Fortunately with regards to site planning, surface modeling and site analysis software have been available by which the site can be analyzed and placements made based on topo-edaphic variables. For planting design, however, very little work has been done. In fact, to the author’s knowledge only one system for urban forests has been developed (Kirnbauer et al, 2009) which uses climatic and soil data to select the plant palette. Plant placement, however, is not based on topographic variables.
2. The systematic approach
The approach mainly consists of choosing the suitable parameters and variables, based on which the design evolves more or less automatically. The choice of parameters and variables is the most important step and requires careful consideration and consultation. This is due to the fact that from here on, the design will evolves from the interaction of these parameters and variables and the designer’s involvement will be minimal. In this chapter the systematic approach is first explained for site planning in general and then more specifically for planting design.
2.1 Site planning
The approach is demonstrated for site planning of a 38 ha villa complex on an undulating topography (Fig. 1) near Isfahan, Iran (by the author, in 1998) using the available surface modeling and site analysis modules of Landcadd. The procedure consists of three steps.
2.1.1 Step 1 – Determining the parameters and variables
The suitable range for each variable for the different design elements is determined. For the present project, three variables (based on the available data) were considered. Some examples are presented in Table 1.
www.intechopen.com

New Advances and Contributions to Forestry Research
20
Fig. 1. Topography of the 38 ha project site for a villa complex.
Variable
Design element Slope (%)
Aspect Elevation
(m)
Parking lots 0-10 Sports courts 0-10 N, NE, E (less wind) <110 (less wind) Vilas 0-15 >65 Hotel and restaurant 0-15 S, SE, SW (good view) >110 (good view) Mass irrigated tree planting 15-30 Mass non-irrigated shrubs 30-45
Table 1. Design elements and the corresponding classes of variables.
The three parameters considered were: Minimum distance of 15m between villa buildings, 8% maximum slope for the roads and 30 km speed limit (for the radii of road curvature).
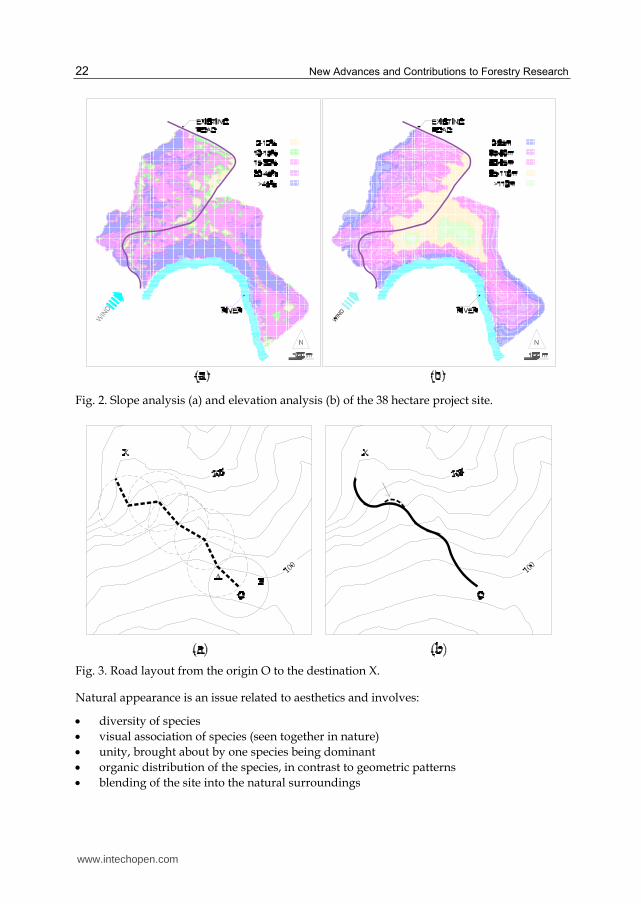
2.1.2 Step 2 – Site analysis
Surface modeling and site analysis software generate aspect, slope and elevation variables
from survey data (x, y, z) from project sites. They do this in terms of grid cells, the size of
which is determined by the designer, based on the topography and the intended use of the
site. Other variables such as soil depth can be added, using the elevation analysis (Sepahi,
2005). Figure 2 presents the classes (AutoCAD layers) for slope and elevation generated for
the site using Landcadd software. Regarding aspect, the software generates nine AutoCAD
layers for N, NE, E, SE, S, SW, W, NW and FLAT. A short review of the application of
Remote Sensing to site analysis regarding topography, soil and plant cover is presented by
Sepahi (2009).
2.1.3 Step 3 – Placement of the design elements
AutoCAD layers bearing the hatch patterns representing the suitable classes of slope, aspect
and elevation for each element were ‘frozen’, which led to the disappearance of their hatches
from the computer monitor. This resulted in patches of land with blank (not hatched) grid
www.intechopen.com

Systematic Approach to Design with Nature
21
cells in which the AutoCAD blocks representing the respective elements (such as villas)
were inserted. After laying out the access roads to the patches, finer adjustments, such as
alignment of elements along the roads were made. For the hotel and restaurant, for instance,
the AutoCAD layers corresponding to the suitable attribute (Table 1) i.e. SLOPE-0-10,
SLOPE-10-15, ASPEC-SOUT, ASPEC-SWST, ASPEC-SEST and ELEVE-110-MAX were
frozen resulting in a few options, of which the most suitable were chosen. The blank patches
would be more clearly visible if all the AutoCAD layers were assigned one color such as
grey. It should be noted that Landcadd has a command by which, for a given point on the
site, the scope of the observable terrain is indicated.
The layout of the roads was a function of maximum allowable slope, speed limit and the
topography. Civil engineering software is available for such a task. For a preliminary
road layout, however, a simple procedure can be used. A circle is drawn at the origin (O)
of the road (Fig. 3-a) with radius R = CI/MS, in which CI is the contour interval and MS is
the maximum allowable slope (e.g., 0.08 for 8%). The circle intersects the adjacent contour
line at two points (A and B). The point which is to the direction of the destination – point
A in this case- is chosen and an AutoCAD polyline is drawn from the origin to it. The
circle is then moved to this point and the process is repeated. At locations where the slope
of the land is less than the MS, the circle will not intersect the next contour and any line
drawn will have a slope less than MS. At the end of the road layout, the FIT Command of
AutoCAD is used to smooth the path of the road (Fig. 3-b). Finer modifications are then
made regarding the radii of the curves based on the speed limit (indicated by an arrow in
Figure 3-b). This approach to road layout does away with the common disagreement
between the landscape architects and engineers, i.e. aesthetics vs. engineering principles.
In fact the author doubts if there is such a thing as an aesthetic road that is not soundly
engineered.
The systematic approach provides the bulk of the conceptual site planning. Final decisions and refinements will eventually be made on the site. The main advantages of the approach are: conserving the natural topography by avoiding massive land leveling; organic distribution of the elements (naturalistic aesthetics) and the elements fitting comfortably in the terrain. In Figure 4 the site planning for the villa complex is presented.
2.2 Planting design
To the author, design with nature with respect to planting design, implies achieving three
objectives: conserving nature, establishing a sustainable ecosystem and achieving a natural
appearance. Conserving nature involves many issues. Those related to this topic are:
maintaining the site’s topography and contour planting to reduce erosion.
Sustainability is a complex concept. A version sufficient for mass planting involves:
selection of a plant palette suitable for the site’s climate and soil
placing individual plants at suitable locations within the site
ensuring compatibility among the species
avoiding extensive plant loss due to natural causes and attracting varied wildlife
through a diverse plant palette
www.intechopen.com
New Advances and Contributions to Forestry Research
22
Fig. 2. Slope analysis (a) and elevation analysis (b) of the 38 hectare project site.
Fig. 3. Road layout from the origin O to the destination X.
Natural appearance is an issue related to aesthetics and involves:
diversity of species
visual association of species (seen together in nature)
unity, brought about by one species being dominant
organic distribution of the species, in contrast to geometric patterns
blending of the site into the natural surroundings
www.intechopen.com

Systematic Approach to Design with Nature
23
Fig. 4. Site planning of the 38 ha villa complex near Isfahan, Iran.
The above objectives can be realized by selecting a plant palette from a native (model) plant community suitable for the climate and soil of the project site, and placing the individual plants based on the specific topographic and soil characteristics of the locations within the site. The author believes, as some other workers cited by Thompson (1998) that if landscape planning is undertaken along ecological lines, the aesthetic aspects will be taken care of automatically. Not only should there not be a “‘tension between aesthetics and scientific foundations in Landscape Architecture” as Harding Hooper et al (2008) put it, application of scientific findings should be an integral part of the design process.
Three methods were presented (Sepahi, 2000, 2005, 2009, in print) to arrive at an objective and systematic design process for planting designs resembling native plant communities. The approach can be summarized in four main steps. The steps, however, do not correspond
www.intechopen.com
New Advances and Contributions to Forestry Research
24
to those in the respective articles. The three methods differ only with respect to Step-3. The main purpose of the present chapter is to present an overall view of these methods. Hence, the same set of data with a few variables and species (Sepahi, in print) is considered to briefly explain the three methods. For discussions on the justification, literature review and mathematical details, the reader is referred to the original articles.
2.2.1 Step 1 – Site analysis of the project site
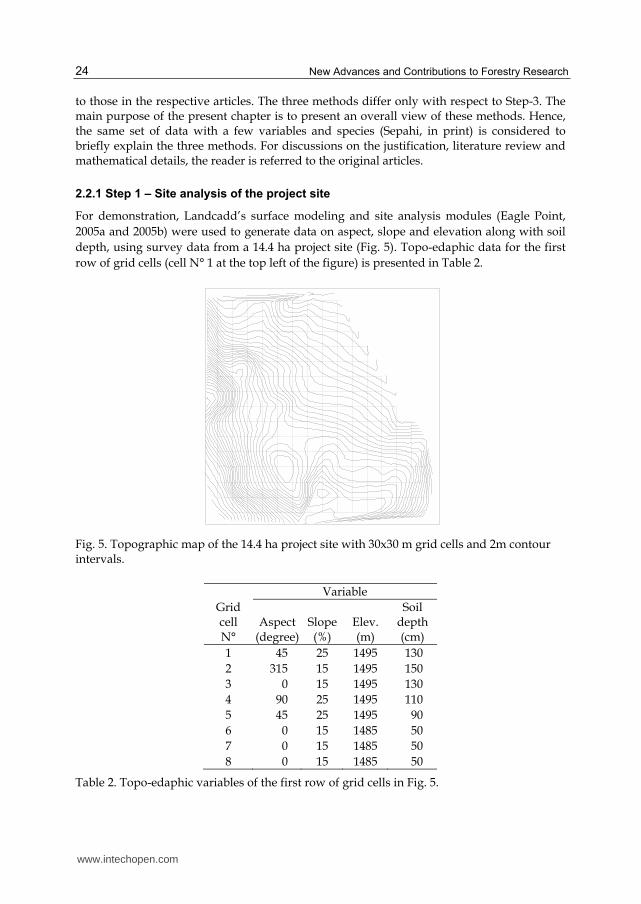
For demonstration, Landcadd’s surface modeling and site analysis modules (Eagle Point,
2005a and 2005b) were used to generate data on aspect, slope and elevation along with soil
depth, using survey data from a 14.4 ha project site (Fig. 5). Topo-edaphic data for the first
row of grid cells (cell N° 1 at the top left of the figure) is presented in Table 2.
Fig. 5. Topographic map of the 14.4 ha project site with 30x30 m grid cells and 2m contour intervals.
Variable
Grid cell N°
Aspect(degree)
Slope(%)
Elev. (m)
Soil depth (cm)
1 45 25 1495 130
2 315 15 1495 150
3 0 15 1495 130
4 90 25 1495 110
5 45 25 1495 90
6 0 15 1485 50
7 0 15 1485 50
8 0 15 1485 50
Table 2. Topo-edaphic variables of the first row of grid cells in Fig. 5.
www.intechopen.com

Systematic Approach to Design with Nature
25
2.2.2 Step 2 – Selecting a plant palette
A plant palette from a native (model) plant community suitable for the site’s climate and overall soil characteristics (with supplementary irrigation, if required) is chosen. For demonstration, a plant palette of seven species was chosen from an Englemann Spruce-Subalpine Fir biogeoclimatic zone in the Boston Bar area, B.C., Canada, as the model community. Data from 10m-radius sample plots, provided by the Resource Inventory Branch, Ministry of Forestry, Victoria, B.C. was used (Table 3).
2.2.3 Step 3 – Determining species composition of the grid cells
In this step the expected percent crown cover (abundance) for each species for every grid cell is determined. This is done differently in the three methods explained below.
The Regression Method - The method (Sepahi, 2005) can accommodate any number of environmental variables and species, thus different levels of biodiversity and natural representation can be attempted. For each of the seven species (Table 3) a multiple regression of the percent crown cover on the topo-edaphic variables is run. The format of the resulting seven equations would be:
Y = b0 + b1X1 + … + bnXn (1)
in which Y represents the expected percent crown cover (EP), X the value for the topo- edaphic variable and b the corresponding partial regression coefficient. The values of the topo-edaphic variables for each grid cell (Table 2) are inserted in every one of the seven multiple regression equations and the expected percent crown covers for the seven species for the grid cell are calculated. These are later translated into the recommended number of trees in Step 4.
The Least Difference Method - With the imminent availability of a large volume of data from model communities through Remote Sensing technology, the Least Difference Method
Topo-edaphic variables Species1 percent crown cover
Sample Plot No
Aspect (degrees)
Slope (%)
Elev.(m)
Soil depth(cm)
AB
IEL
AS
AL
NU
CR
I
AL
NU
VIR
LO
NII
NV
PIC
EE
NE
PIC
EE
NG
PIN
UC
ON
TS TA
1 78 2 1354 141.0 17.9 0.0 2.3 0.0 0.0 26.7 0.3 47.2 131.9 2 165 12 1275 106.0 16.0 0.0 10.0 0.0 0.0 5.0 55.0 86.0 141.2 3 353 70 1330 102.0 12.3 0.0 0.0 0.0 0.0 3.0 0.0 15.3 62.5 4 350 4 1090 149.0 0.4 0.0 23.0 0.0 5.0 0.0 14.0 42.4 46.3 5 352 15 1200 55.0 38.0 0.0 1.0 3.0 0.0 38.0 0.0 80.0 90.2
.
. . .
.
. . .
.
. . .
.
. . .
.
. . .
.
. . .
.
. . .
36 34 23 1230 160.0 38.0 0.0 0.0 0.0 0.0 8.0 10.0 56.0 146.6
1: Abbreviations used by the Ministry of Forestry, BC, Canada TS: Total percent crown cover of the selected seven species TA: Total percent crown cover of all the species (originally recorded) in the sample plot
Table 3. Data from Englemann Spruce-Subalpine Fir biogeoclimatic zone in, B.C. Canada.
www.intechopen.com

New Advances and Contributions to Forestry Research
26
(Sepahi, 2009) was presented that emulates nature more closely and is not based on a
mathematical model. The approach is based on a simple argument that if two patches
of land are similar, plant composition suitable for one (a sample plot in the model
community) is also suitable for the other (a grid cell on the project site). Topo-edaphic
variables of each grid cell (Table 2) are compared with those of all the 36 sample
plots in the model community (Table 3) one plot at a time. The sample plot, most similar to
the grid cell is chosen and its percent crown covers are assigned (as EPs) to the
grid cell. The method can accommodate any number of environmental variables
and species.
The Variable Classification Method- This method (Sepahi, 2012) draws on the fact that
plants respond to ranges, rather than to specific values of environmental variables. It is not
based on a mathematical model and does not involve statistical analysis. Although it can be
fully computerized, it can also be applied semi-automatically, using the available site
analysis software. The values for the different variables in Table 2 and Table 3 are grouped
into different classes. The method is suitable when few variables and classes (e.g. low,
medium and high) are considered.
Regarding aspect, Landcadd generates nine aspects: N, NE, E, SE, S, SW, W, NW and FLAT. The ideal way to reduce this number would be to customize the software to generate five aspects of NE, SE, SW, NW and FLAT. This is based on the fact that in the Northern Hemisphere, the growth gradient is along the NE-SW axis rather than the N-S axis (Urban et al., 2000). A simpler and close enough alternative is to merge every two consecutive aspects (AutoCAD layers) to produce four aspects of: N-NE, E-SE, S-SW, W-NW plus one FLAT. This approach was followed for the present demonstration. In Table 4 the resulting classes for the variables in Table 2 are presented. Although a bit more involved (see Sepahi, 2012) in principle, the percent crown covers of the sample plots are allocated to the grid cells with matching topo-edaphic variables.
Variable
Grid cell N°
Aspect(degree)
Slope(%)
Elev. (m)
Soil depth
(cm)
1 N-NE L L H
2 W-NW L L H
3 N-NE L L H
4 E-SE L L H
5 N-NE L L H
6 N-NE L L L
7 N-NE L L L
8 N-NE L L L
H and L: represent high and low classes respectively.
Table 4. Topo-edaphic variables of Table 2, classified into different classes.
www.intechopen.com

Systematic Approach to Design with Nature
27
2.2.4 Step 4 – Determining plant number and placement
The expected percent crown covers calculated in step 3 (by any of the three methods) are translated into the number of plants for the seven species using equation 2.
N100 cos
EP GA TA
CA TS (2)
Where, EP is the expected percent crown cover for the species, GA is the area of a grid cell, CA is the crown area (from the crown diameter assigned to the species), TA and TS are from the last two columns of Table 3 and α is the angle of the slope of the grid cell.
Once the numbers of the plants of the species for the grid cells are determined, different schemes can be used for their placement. For demonstration, one type of contour planting is explained here. The MEASURE command of AutoCAD is used to mark the contour lines at the desired intervals (Fig. 6). The icons (AutoCAD blocks) for the species are, then, placed at random on contour lines within the grid cells in the drawing. Figure 6 presents the placement of icons for cell N°5, using the Regression Method.
Fig. 6. Plant composition of the grid cell for cell N° 5 using the Regression Method.
The choice of the Regression Method, the Least Difference Method or the Variable
Classification Method is based on the number of sample plots, number of variables and the
mode of data processing (Table 5). Data processing could be automatic (using a computer
program) or manual (using a spreadsheet).
The three Methods place individual plants based on topo-edaphic variables, thus realizing the ecological potential of the project site more fully than the present common practice. They draw on an already available wealth of data on plant communities in forestry departments. They provide an organic distribution of species for the bulk of the planting. Designers can make necessary changes in specific areas (e.g. around buildings, sitting areas) using a larger or different plant palette. Designers can also use their ingenuity for modifications or attaining different levels of natural representation. The following are a few examples:
planting mark
www.intechopen.com

New Advances and Contributions to Forestry Research
28
taking into consideration the uneven age distribution in the model community
bio-geographic planting (Kingsbury, 2004), i.e. aiming at as complete a representation of a natural plant community as possible
achieving organic distribution for plant palettes of commercial (non-native) cultivars
Method Number
of samplesNumber
of variablesAutomatic
data processing
Regression low any required
Least Difference high any required
Variable Classification high low not required
Table 5. Recommended methods for different number of sample plots and topo-edaphic variables and modes of data processing.
For the reader who would like to try the methods, a few recommendations are presented.
For the Least Difference Method, adjust the elevations from the project site so that
the minimum elevation is the same as the model community. For both the Regression
Method and the Least Difference Method, convert aspects into Annual Direct Incident
Radiation and Heat Load, using the procedure proposed by McCune (2002). Apply
Equation 2 to all the three methods, except for the cases where TS for any of the sample
plots in the model community is zero. In that case the equation should be modified
as follows:
100 cos
EP GA DFN
CA a
(3)
In which, DF is the density factor calculated as the average of TA divided by the average of
TS (last two columns of Table 3). It is used to account for the fact that not all the species in
the original sample plots were included in the design.
2.3 The role of scientific research
The present trend in design emphasizes issues such as social responsibility, sustainability,
environmental responsiveness and human health (Milburn et. al., 2003). In the systematic
approach to design, the quality of the outcome is determined by the reliability of the
parameters and variables chosen. Such issues require incorporation of research into the
landscape design process. The research, basically a literature review, taps into the available
body of knowledge acquired through scientific research. Some advances in the field of
Landscape Architecture in areas such as irrigation, soil amendments, new cultivars and
computer aided design have been due to the scientific and technical achievements of other
disciplines. However some information, especially for the implementation of the concept of
design with nature, might require studies which are not of common interest to the other
disciplines. These have to be dealt with by scientific research within the profession. For
instance, more work could be done to increase the accuracy of the planting design methods
www.intechopen.com
Systematic Approach to Design with Nature
29
mentioned above. In the Regression Method, interaction (statistical) between topo-
edaphic variables could be considered, or transformations (e.g. logarithmic) on the
variables could be tried. With respect to the Least Difference Method, other analysis for
determining the relative importance of the different topo-edaphic variables in species
distribution should be attempted. More work on combining some of the topo-edaphic
variables into ecologically relevant predictors, such as soil fertility, would help to reduce
the number of variables.
Some of the problems might be unique to specific projects. In a green belt project around
the 3000 ha Mobarekeh Steel Mill Complex in Iran, the author was faced with a number
of questions regarding the choice of the species suitable for the calcareous soil of the
site, tolerant to the mill’s pollutants and their irrigation requirements under the site’s
arid climate. Also of interest was the relative efficiency of the species in removing
the pollutants from the environment. Thus the author in cooperation with two colleagues,
an irrigation and a soil scientist, started a long term experiment involving 648 treatments
(factorial combination of 72 species, 3 levels and 3 intervals of irrigation). The actual
mass planting at the mill was to be carried out over a number of years. As new
results were obtained from the experiment, modifications were made in the upcoming
plantings.
The above passage pivots on the phrase ‘scientific research’. One can get into a long
discussion regarding the definition of scientific research, including basic and applied
research. For our purpose, let us adopt a practical definition and consider scientific
research as one which is accepted by scientific societies for publication. Such societies
require that the results of experiments be accompanied by a statement of the probability
of the validity of the results (denoted by * or **, indicating 95 or 99% levels of confidence).
Such a statement can only be made if there is an estimate of the experimental
error, obtained through the application of statistical analysis to the data. The analysis
in turn, can only be made on data obtained based on a statistical design. Such an approach
to research is imperative when a number of variables (controllable, uncontrollable
or unknown) besides the variables in question, affect the results of the study. This
necessity was first felt at the Rothamsted Agriculture Research Station in the 1920s which
led to the invention of the science of Statistics by Sir R.A. Fisher. Although initially
developed for agricultural research, it became widely used in almost all other fields
of research.
To bestow research in the field of Landscape Architecture with such quality, it is necessary
to incorporate the required skills in the curriculum. To this end the Masters Program should
be divided into two sections:
1. Urban Design – the extension of the undergraduate program
2. Rural Design – with focus on projects involving nature at a large scale
The distinction between the two sections will be based on the relative emphasis placed on
innovative creativity versus the artistic creativity. In the Rural Design, emphasis should shift
more towards the innovative creativity which enables the future designers to deal with
the various problems that nature with all its complexities presents, to devise new
www.intechopen.com
New Advances and Contributions to Forestry Research
30
techniques and carry out research projects that add to the body of knowledge in the
profession.
The modification of the curriculum would involve incorporation of two courses in statistics.
In the last term of the undergraduate program, the students should take an introductory
course in statistics offered at the Departments of Statistics. This course can be elective, for
those who expect to continue their post graduate studies in Rural Design. In the first term of
the graduate program, the students of Rural Design should take a course in design and
analysis of the experiments, known as Statistical Design. The statistical design course covers
the application of statistics to the different types of experiments or surveys pertinent to the
specific field of study and is usually offered within the respective department. Of course, the
students would also take the necessary courses pertinent to nature, depending on their
theses projects.
In the undergraduate program, being bold and daring (appreciated for urban designs) is
encouraged. Exposure to scientific research methods leads to a more cautious, sensitive,
respectful and humble attitude towards nature and controls the overuse of the so called
artistic license. It would be helpful, if a reference manual on the application of statistical
designs to Landscape Architecture research is put together.
The application of computers to scientific research is well known. In fact thanks to the
computer, research workers (including the author) have been applying the statistical
analyses to their data without remembering the details of the calculations involved. With
respect to landscape design, once a process is based on laws, the logical next step would be
to computerize it. However, the computer is not just to speed up the process; rather it is an
integral part of the decision support systems. This is due to the fact that in the case of
planting design, for instance, a number of variables (more than the three conceivable
Cartesian coordinates) are involved, which mathematically can be considered. Moreover,
challenging as it is to envisage the combined effects of a number of variables for placing
individual plants from different species, applying it manually to thousands of individual
plants would be a monumental task
3. Conclusion
Nature is already under heavy pressure from over population and cannot endure more
hammering by designs incompatible with nature. Availability of a systematic approach
reduces the occurrence of such designs. There are also a number of advantages in the
systematic approach for the designers themselves:
Confidence in the outcome - Since the best possible locations are determined for the
design elements, there is no uncertainty, doubt and indecisiveness during the design
process.
Automation – The approach can be computerized, resulting in accuracy and speed
Defendability - The questions raised by juries, regarding large scale projects, are mainly
with respect to issues such as placement of the design elements, impact on nature, ease
of implementation and cost, rather than the aesthetic aspects. These are all the issues
www.intechopen.com
Systematic Approach to Design with Nature
31
based on which the parameters and variables were initially determined. Placement
based on topo-edaphic variables, by minimizing land leveling would address such
issues.
4. Acknowledgement
The author wishes to acknowledge the Resource Inventory Branch of the Ministry of
Forestry and Range, Victoria, BC, Canada for providing the data.
5. References
Eagle Point (2005a). Surface Modeling Manual, Eagle Point, Retrieved from
<http://www.eaglepoint.com>
Eagle Point (2005b). Site Analysis Manual, Eagle Point, Retrieved from
<www.eaglepoint.com>
Harding Hooper, V.; Endter-Wada, J. & Johnson, C. W. (2008). Theory and Practice
Related to Native Plants, a Case Study of Urban Landscape Professionals.
Landscape Journal, Vol. 27, (January 2008), No. 1, pp. 127-141, ISSN 0277-
2426
Kingsbury, N. (2004). Contemporary Overview of Naturalistic Planting Design. In: The
dynamic landscape; design, ecology and management of naturalistic urban planting, N.
Dunnett, & J. Hitchmough, (Eds), 58-96 , Spon Press, Taylor & Francis Group. N.Y.,
ISBN 97804 15256209
Kirnbauer, M. C.; Kenney, W. A., Churchill, C. J. & Baetz, B. W. (2009). A Prototype Decision
Support System for Sustainable Urban Tree Planting Programs. Urban Forestry &
Urban Planning, Vol. 8, (January 2009), 3-11, ISSN 1618-8667
McCune, B. & Keon, D. (2002). Equations for Potential Annual Direct Incident Radiation and
Heat Load. Journal of Vegetation Science, Vol. 13, (August 2002), pp. 603-606, ISSN
1100-9233
Milburn, L. S. & Brown, R. D. (2003). The Relationship between Research and Design In
Landscape Architecture. Landscape and Urban Planning, Vol. 64 (June 2003), pp. 47-
66, ISSN 0169-2046
Sepahi, A. (2000) Nature as a Model for Large-scale Planting Design. Landscape Research, Vol.
25, No. 1, (January 2000), pp. 63-77, ISSN 0142-6397
Sepahi, A. (2005). Nature as a Model for Large-scale Planting Design II, Proceedings of the
CSLA (Canada) Congress “Landscape Architecture - EXPOSED!” , Winnipeg, 17-20
August 2005 Winnipeg, Manitoba
Sepahi, A. (2009). Nature as a Model for Large Scale Planting Design, Least Difference
Method. Urban Forestry and Urban Greening, Vol. 8, No. 3, (June 2009), pp. 97-205,
ISSN 1618-8667
Sepahi, A. (2012). Nature as a Model for Large Scale Planting Design, Variable Classification
Method. Landscape Research, DOI 10.1080/01426397.2011.638740
Thompson, J.H. (1998). Environmental Ethics and the Development of Landscape
Architectural Theory. Landscape Research, Vol. 23, (July 1998), pp. 175-194, ISSN
0142-6397
www.intechopen.com

New Advances and Contributions to Forestry Research
32
Urban, D. L.; Miller, C., Halpin, P. N., and Stephenson, N. L. (2000), Forest Gradient
Response in Sierran Landscapes: the Physical Template, Landscape Ecology, Vol. 15,
(October 2000), pp. 603-620, ISSN 0921-2973
www.intechopen.com

New Advances and Contributions to Forestry ResearchEdited by Dr. Dr. Andrew A. Oteng-Amoako
ISBN 978-953-51-0529-9Hard cover, 256 pagesPublisher InTechPublished online 27, April, 2012Published in print edition April, 2012
InTech EuropeUniversity Campus STeP Ri Slavka Krautzeka 83/A 51000 Rijeka, Croatia Phone: +385 (51) 770 447 Fax: +385 (51) 686 166www.intechopen.com
InTech ChinaUnit 405, Office Block, Hotel Equatorial Shanghai No.65, Yan An Road (West), Shanghai, 200040, China
Phone: +86-21-62489820 Fax: +86-21-62489821
New Advances and Contributions to Forestry Research consists of 14 chapters divided into three sections andis authored by 48 researchers from 16 countries and all five continents. Section Whither the Use of ForestResources, authored by 16 researchers, describes negative and positive practices in forestry. Forest is acomplex habitat for man, animals, insects and micro-organisms and their activities may impact positively ornegatively on the forest. This complex relationship is explained in the section Forest and OrganismsInteractions, consisting of contributions made by six researchers. Development of tree plantations has beenman’s response to forest degradation and deforestation caused by human, animals and natural disasters.Plantations of beech, spruce, Eucalyptus and other species are described in the last section, Amelioration ofDwindling Forest Resources Through Plantation Development, a section consisting of five papers authored by20 researchers. New Advances and Contributions to Forestry Research will appeal to forest scientists,researchers and allied professionals. It will be of interest to those who care about forest and who subscribe tothe adage that the last tree dies with the last man on our planet. I recommend it to you; enjoy reading it, savethe forest and save life!
How to referenceIn order to correctly reference this scholarly work, feel free to copy and paste the following:
Ali Sepahi (2012). Systematic Approach to Design with Nature, New Advances and Contributions to ForestryResearch, Dr. Dr. Andrew A. Oteng-Amoako (Ed.), ISBN: 978-953-51-0529-9, InTech, Available from:http://www.intechopen.com/books/new-advances-and-contributions-to-forestry-research/systematic-approach-to-design-with-nature

© 2012 The Author(s). Licensee IntechOpen. This is an open access articledistributed under the terms of the Creative Commons Attribution 3.0License, which permits unrestricted use, distribution, and reproduction inany medium, provided the original work is properly cited.