Embed Size (px)
Citation preview

Systematic Approach to Address Traffic Safety
Vinod Vasudevan, Ph.D., P.E.Department of Civil EngineeringIndian Institute of Technology Kanpur, UP, India
Shashi Nambisan, Ph.D., P.E.Institute of TransportationIowa State University, Ames, IA, USA
1

Traffic Safety in India
• 130,000 fatalities on road in India in 2006• (~356 people die every day)• Increase ~8% annually since 2000• 500,000 reported injuries• Unofficial estimate of over 9,000,000
– Includes over 1,650,000 serious injuries• Accidents Vs Crashes
2

Presentation Outline• Systematic approach – introduction• Problem identification• Analysis of problem• Prioritization• Countermeasure selection• Deployment of countermeasures• Evaluation of countermeasures• Case studies:
– Engineering – Pedestrian safety– Education/Enforcement – Occupant protection
3

Systematic Approach• Why do we need systematic approach?
– Repeatability– Transferability– Identifying best practices– Identifying efficient countermeasures
• Challenges– Requires additional funds and man power
(minimal)– Could consume additional time
4

Components
• Problem identification• Analysis of the problem• Prioritization of risks• Selection of countermeasure• Deployment of countermeasure• Evaluation of countermeasure
5

Problem Identification• The first and the most important step• Use all existing information (official + unofficial)• Could use simple spreadsheets or similar
programs for initial analysis• Example:
– High proportion of mid-block pedestrian crashes in an area
– Increase in proportion of traffic fatalities without wearing seatbelts during nighttime
• 6

Problem Analysis• Analyze all available information in detail• Detailed police crash report (if available) are
ideal• Could use analysis tools such as GIS• Could also use results of traffic safety audits• Identifies major causes of problems by location• Example:
– High speeds of vehicles and huge proportion of elderly pedestrians are involved in crashes
– High proportion of traffic fatalities also include alcohol involvement
• 7

Site (or Risk) Prioritization• Lack of funds to address all safety concerns• Efficient utilization of limited resources• Maximum benefits• Could use mathematical and statistical
analyzes• Example:
– Top 20 sites account for 80 percent of pedestrian crashes
– Areas near bars account for over 75 percent of fatalities 8

Selection of Countermeasures• Based on “problem analysis”• Need to study sites in detail• Could vary from site to site• Could include engineering, education, and
enforcement, or a combination of any• Example:
– Traffic calming measures and high-visible pedestrian crossings
– Education campaigns and strict enforcement aimed and drink-and-drive 9

Countermeasure Deployment• Could be very tricky• Might face huge opposition, if not deployed
without proper planning• Some could be deployed in stages• Example:
– Deploy high-visibility cross-walk first, depending on the driver behavior deploy traffic calming measures
– Start education campaigns for 2-3 weeks, then start enforcement campaigns for the next two weeks
10

Evaluation of Countermeasures• Evaluating effectiveness• Uses mathematical and statistical analyzes• Could be used for economic feasibility for
large scale deployment• Examples:
– Before and after studies– Control site methods
11

Case Study 1: Pedestrian Safety
12
• Problem identification• Analysis of problem• Prioritization of risks• Selection of countermeasures• Deployment of countermeasures• Evaluation

Problem Identification• Significant growth for 20+ years• Wide, fast street grid network
– High posted & operational vehicle speeds
• High risk conditions for pedestrians
• Demographics– Population ~ 1.8 million– Diversity: age, race– Over 39 million visitors in 2008
• 85 percent of the crashes involved locals 13

Crash Analysis - Pedestrian Crashes (2003 – 2006)
14
15
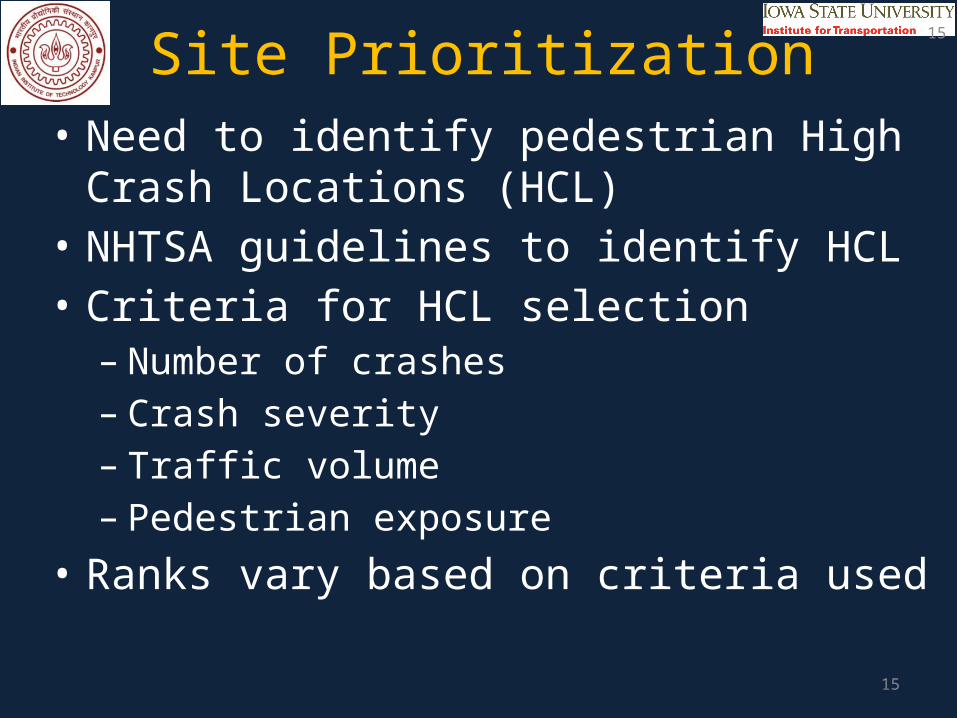
• Need to identify pedestrian High Crash Locations (HCL)
• NHTSA guidelines to identify HCL• Criteria for HCL selection
– Number of crashes– Crash severity– Traffic volume– Pedestrian exposure
• Ranks vary based on criteria used
Site Prioritization 15

Comparison of Ranking Methods
16

Study Locations• Top priority / High Risk Locations
– Crash Index and Crash Rank• GIS based analysis• 18 locations
– includes 4 control locations• Different Jurisdictions
– City of Las Vegas– City of North Las Vegas – Clark County – Nevada Dept. of Transportation (State)
17

Selection of Countermeasures• Site Characteristics
– Geometric Conditions– Operating Conditions– Light Conditions– Demographics– Land-use
• Costs• Countermeasures include:
– Engineering-based– ITS-based– Other 18

Portable Speed Trailer
19

Danish Offset and Median Refuge
20
20

Pedestrian Activated Flashers21
21

Automatic Pedestrian Detection and Smart Lighting
22
22

Pedestrian Buttons that Confirm “Call”
23
23

Pedestrian Channelization24
24

ITS No-Turn on Red Blank out Signs
25
25
Countermeasure Deployment• Several challenges due to changes in personnel• Administrative and vendor related hurdles• Combination of countermeasures per site
– Deployed in stages– Helps to evaluate individual and combined
effectiveness
26

Evaluation of Effectiveness• “Before” and “After” analysis• Comparative studies (with control sites)• Used statistical analyses
27
MOE
Baseline vs. Stage 1 Baseline vs. Stage 2
DeltaMeanSpeed
P-value
H0
DeltaMeanSpeed
P- value
H0
H0: Vbefore= Vafter vs. Ha: Vafter< Vbefore
Eastbound mph
(kmph)
5.5(8.9) <0.001 Reject 8.1
(13.0) <0.001 Reject
Westbound mph
(kmph)
6.5(10.5) <0.001 Reject 3.7
(6.0) <0.001 Reject

Case Study 2: Occupant Protection
28
• Problem identification and analysis• Prioritization of sites (site selection)• Selection of countermeasures• Deployment of countermeasures• Evaluation

Problem Identification and Analysis
• Nevada has a secondary seatbelt law• Lower seatbelt usage rates among motorists• Existing data showed lower usage among:
– Male drivers– Hispanic and African American drivers
• Need to improve seatbelt usage rates
29

Site Selection• Sites selected based on guidelines established
by the National Highway Traffic Safety Administration (NHTSA) – Identified based on VMT distribution and
geographic distribution across various roadway functional classes
– Rural interstates, urban interstates, rural arterials and urban arterials, collector roads
• 50 sites selected including rural sites• 400 observations per site (total 20,000
observations for the state) 30

Selection of Countermeasures• Combination of education and enforcement• Education:
– Media campaigns: “Click-it or ticket” campaigns– Earned and paid media coverage (print and broadcast)– TV advertisements: mainly aired during sports events – Radio media: music stations– Hispanic advertisements on Hispanic TV and radio
• Enforcement:– “Joining forces” program: 19 agencies across the state
coordinate enforcement efforts– Stepped-up enforcement of seatbelt usage
31

Deployment
• First 4 weeks on education campaigns only– Inform motorists of advantages of using seatbelts– Inform about the enforcement activities
• Followed by 2 weeks of stepped-up enforcement• Nevada Office of Traffic Safety paid overtime for
police officers for enforcement campaigns
32

Evaluation• Telephone survey response:
33
Pre Camapign
Post Campaign
N = 650 N = 652
% %
Awareness of any special effort by police to ticket drivers for seat belt violations? (YES) 12% 58% p < 0.001
If yes, where did you hear/see the message?TV -- 63%Radio -- 16%Newspaper -- 11%Other -- 10%
Whether they have seen/heard any messages that encourage use of seat belts (all modes including TV, Radio, Signs, News Stories, ..) 26% 45% p < 0.001
Police are writing more seat belt tickets now than they were a few months ago. (STRONGLY AGREE) 15% 40% p < 0.001
It is important for police to enforce the seat belt laws. (STRONGLY AGREE) 66% 75% p < 0.001
Chi-SquareQuestion (RESPONSE)
Media Penetration
Attitudes toward Law/Police

Statistical Analysis
34
# SB Used # Observation % Usage # SB Used # Observation % Usage
Male Drivers 9,651 13,498 71.5% 9,832 12,935 76.0% -8.33 <0.001 Significant
Occupant Group
Pre-Campaign (Before) Post-Campaign (After)
ZOBSAll Occupants 22,378 27,341 81.8% 22,461 25,939 86.6% -14.99 <0.001 Significant
Male Drivers 11,676 13,574 86.0% 12,686 13,560 93.6% -20.50 <0.001 Significant
Female Drivers 5,870 6,426 91.3% 6,196 6,441 96.2% -11.38 <0.001 Significant
All Drivers 17,546 20,000 87.7% 18,882 20,000 94.4% -23.42 <0.001 Significant
Male Passengers 2,369 2,729 86.8% 2,555 2,737 93.4% -8.09 <0.001 Significant
Female Passengers 4,159 4,514 92.1% 4,880 5,011 97.4% -11.63 <0.001 Significant
Passengers 6,528 7,243 90.1% 7,435 7,748 96.0% -14.12 <0.001 Significant
All Occupants 24,074 27,243 88.4% 26,317 27,748 94.8% -27.42 <0.001 Significant
# SB Used # Observation % Usage # SB Used # Observation % Usage
Male Drivers 9,651 13,498 71.5% 9,832 12,935 76.0% -8.33 <0.001 Significant
p -value
Statistical Significance
(95%)ZOBSAll Occupants 22,378 27,341 81.8% 22,461 25,939 86.6% -14.99 <0.001 Significant
Male Drivers 11,676 13,574 86.0% 12,686 13,560 93.6% -20.50 <0.001 Significant
Female Drivers 5,870 6,426 91.3% 6,196 6,441 96.2% -11.38 <0.001 Significant
All Drivers 17,546 20,000 87.7% 18,882 20,000 94.4% -23.42 <0.001 Significant
Male Passengers 2,369 2,729 86.8% 2,555 2,737 93.4% -8.09 <0.001 Significant
Female Passengers 4,159 4,514 92.1% 4,880 5,011 97.4% -11.63 <0.001 Significant
Passengers 6,528 7,243 90.1% 7,435 7,748 96.0% -14.12 <0.001 Significant
All Occupants 24,074 27,243 88.4% 26,317 27,748 94.8% -27.42 <0.001 Significant

Evaluation
35
91.2%90.1%90.0%
95.0%
89.4%
91.7%93.5%92.6%
89.4%90.4% 90.9%90.5%
93.8%
91.3%91.2%92.3%
89.9%90.0%
93.0%
88.6%90.2%90.1%89.1%
91.6%
89.8%
92.0%
87.9%89.5%
50%
60%
70%
80%
90%
100%
All Occupants Drivers Male Drivers Female Drivers Passengers Nevadans Non-Nevadans
2006 2007 2008 2009

Summary• Systematic approach is important• Advantages:
– Keep track of activities over time– Repeatability– Transferability– Identifying best practices– Identifying efficient countermeasures
• Extremely important to document activities in Indian scenario on effectiveness of various countermeasures
36

Questions?
Thank you!
37