Embed Size (px)
Citation preview
System of Managerial and AnalyticalReporting Tools (SMART)
for Basic Element
Many companies in the Basic Element group hold leading positions across their respective sectors. These include RUSAL, the world’s largest producer of aluminum; EuroSibEnergo, Russia’s largest private power generation company (part of En+ Group); and GAZ Group, Russia’s leading automotive holding (part of Russian Machines).Basic Element’s portfolio of assets and companies actively cooperate with each other to create partnerships that simultaneously reinforce the competitive advantages of each business and the entire group.basel.ru/en
Basic Element is a diversified industrial group made up of over 100 Russian and international companies and facilities operating in a range of sectors. These include energy, metals and mining, machinery, aviation, financial services, and agriculture.
The System of Managerial and Analytical Reporting Tools (SMART) is designed to generate and analyze managerial and analytical reports of the Basic Element group of companies. The main purpose of the software is to replace the current reporting
The Basic Element group is made up of over 100 Russian and international companies. In view of its diverse structure and need in consolidating and analyzing immense amounts of heterogeneous data, the Basic Element group was looking for standardized and automated reporting and analysis processes. Basic Element’s Analytical
Reporting & Business Process Reengineering Division stated a number of problems that gave impetus to the development of SMART:
Customer profile
2
process where business units prepare reports and approve them by the management company with data loading, verification, and validation using the Enterprise Performance Management (EPM) system instead of a set of traditional multipage static reports.
Project objective
background
Reports from businesses included numerous files of different formats with no common format or unified list of indicators used for managerial reports.
3
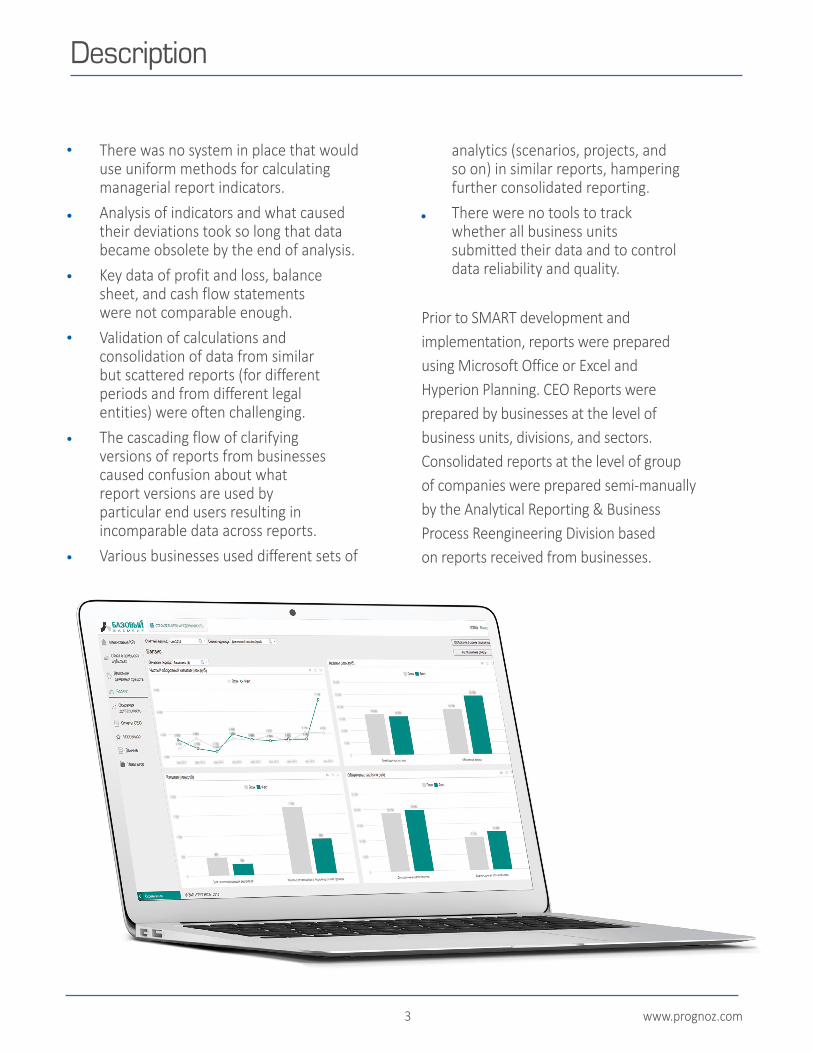
Prior to SMART development and implementation, reports were prepared using Microsoft Office or Excel and Hyperion Planning. CEO Reports were prepared by businesses at the level of business units, divisions, and sectors. Consolidated reports at the level of group of companies were prepared semi-manually by the Analytical Reporting & Business Process Reengineering Division based on reports received from businesses.
www.prognoz.com
Description
There was no system in place that would use uniform methods for calculating managerial report indicators.Analysis of indicators and what caused their deviations took so long that data became obsolete by the end of analysis.Key data of profit and loss, balance sheet, and cash flow statements were not comparable enough.Validation of calculations and consolidation of data from similar but scattered reports (for different periods and from different legal entities) were often challenging.The cascading flow of clarifying versions of reports from businesses caused confusion about what report versions are used by particular end users resulting in incomparable data across reports.Various businesses used different sets of
analytics (scenarios, projects, and so on) in similar reports, hampering further consolidated reporting.There were no tools to track whether all business units submitted their data and to control data reliability and quality.
Description
4
The development of project documentation, interface design, software development, and field trial was carried out from August 2013 through May 2014.The solution architecture is as follows:
Master data management (MdM). This module is designed to organize and maintain master data used in multidimensional structures of the system and delimit user access to data of company divisions and sectors. The MDM supports master data loading to the system via a Web service with delimitation of rights to load dictionaries and data correlated with specific dictionary elements.
etL. This module is designed to implement procedures to collect data from source systems and make necessary data transformations for further population of the data warehouse. The ETL module provides independence from data formals of corporate information systems through the development and use of a standard and unified data schema (SMART metadata format) for data submitted by businesses to the integrated reporting system. The embedded tools enable users to perform distributed data loading
remotely via a Web service with the pre-audit functionality to control closed periods, referential integrity, and data load rights. This module has close-period functionality with delimitation of rights by levels such as division-sector-company.
data Quality Management. This module enables users to create their own rules of logic and arithmetic checks of input data (for example, the assets side of the balance sheet = liabilities side of the balance sheet rule). All input data are automatically checked with recording of any failed checks. The module also supports a special DQM mode for regular reports to highlight cells that violate DQM rules.
data warehouse. This module enables users to create multidimensional structures for storage, preprocessing, and analysis of input data, as well as data marts for building regular reports and dashboards. Input data is used to calculate aggregates, computable indicators according to a predefined sequence of calculations, and cumulative totals of different calculation types (year-to-date, balance sheet, average, and so on).
reporting. This module provides a
Project descriPtion
5 www.prognoz.com
Description
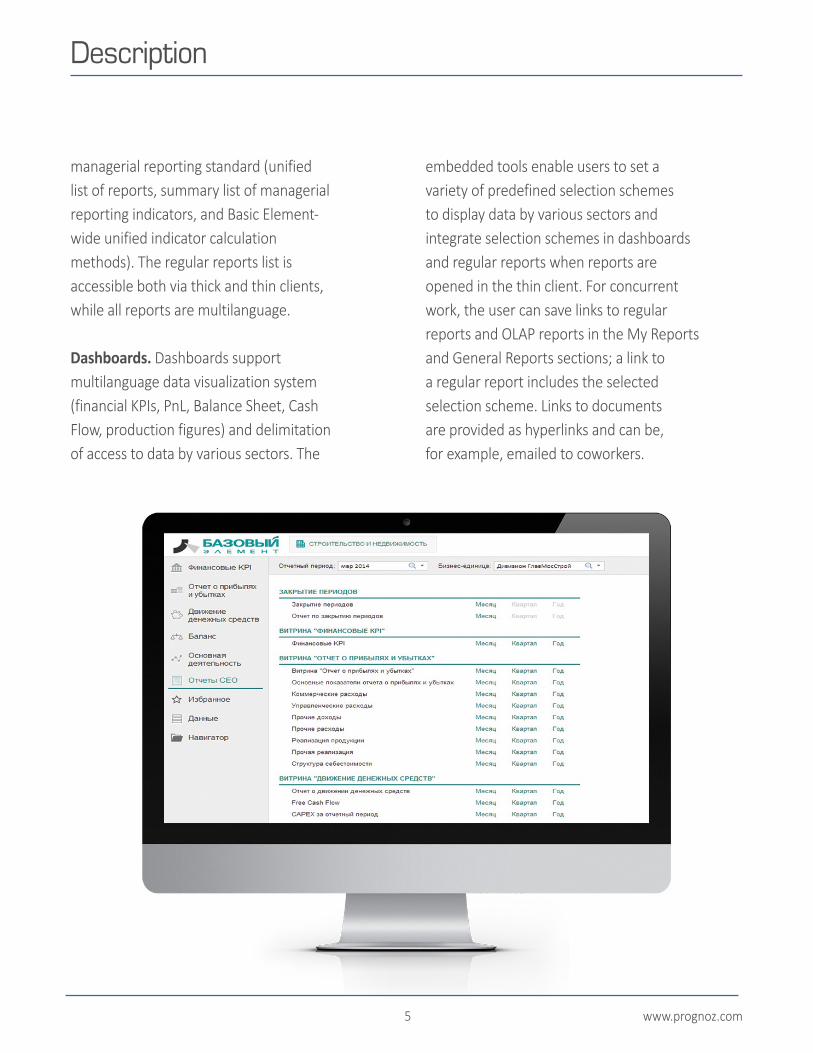
managerial reporting standard (unified list of reports, summary list of managerial reporting indicators, and Basic Element-wide unified indicator calculation methods). The regular reports list is accessible both via thick and thin clients, while all reports are multilanguage.
dashboards. Dashboards support multilanguage data visualization system (financial KPIs, PnL, Balance Sheet, Cash Flow, production figures) and delimitation of access to data by various sectors. The
embedded tools enable users to set a variety of predefined selection schemes to display data by various sectors and integrate selection schemes in dashboards and regular reports when reports are opened in the thin client. For concurrent work, the user can save links to regular reports and OLAP reports in the My Reports and General Reports sections; a link to a regular report includes the selected selection scheme. Links to documents are provided as hyperlinks and can be, for example, emailed to coworkers.
SMART encompasses the full range of reporting processes, from loading of consolidated data from business unit accounting systems, data storage and classification, and KPI data processing to the generation of management reports to deliver information to users. A variety of reports is created using a common pool of accumulated data.
Manual routines for data collection, input validation, and reporting are replaced with automated unified methods for management reporting of the group.With the system implementation, the time and effort needed to collect and validate received data and generate reports was reduced significantly
Description
6
resuLts of the iMPLeMentation of the systeM
key features
The system has a unified list of managerial reporting indicators, as well as functionality for unifying collected data regardless of business specifics.
SMART is independent from source data formats for corporate information systems of businesses.
The system has a mechanism for automatic generation of server procedures for calculating computable indicators and DQM audit routines that provides high-speed data processing. The user can easily set calculation rules by specifying the formula line in an indicator attribute.
With scalability features, the user can quickly add new sectors or divisions.
Large amounts of input data (calculated aggregates, formula-based indicators, cumulative totals using different calculation types) are processed automatically.
Upon completion of the project, the SMART had been implemented on 20 user workstations in the headquarters of Basic Element and in GlavMOsStroy.
SMART runs on the latest version of the Prognoz Platform with MS SQL 2012 employed as a DBMS.
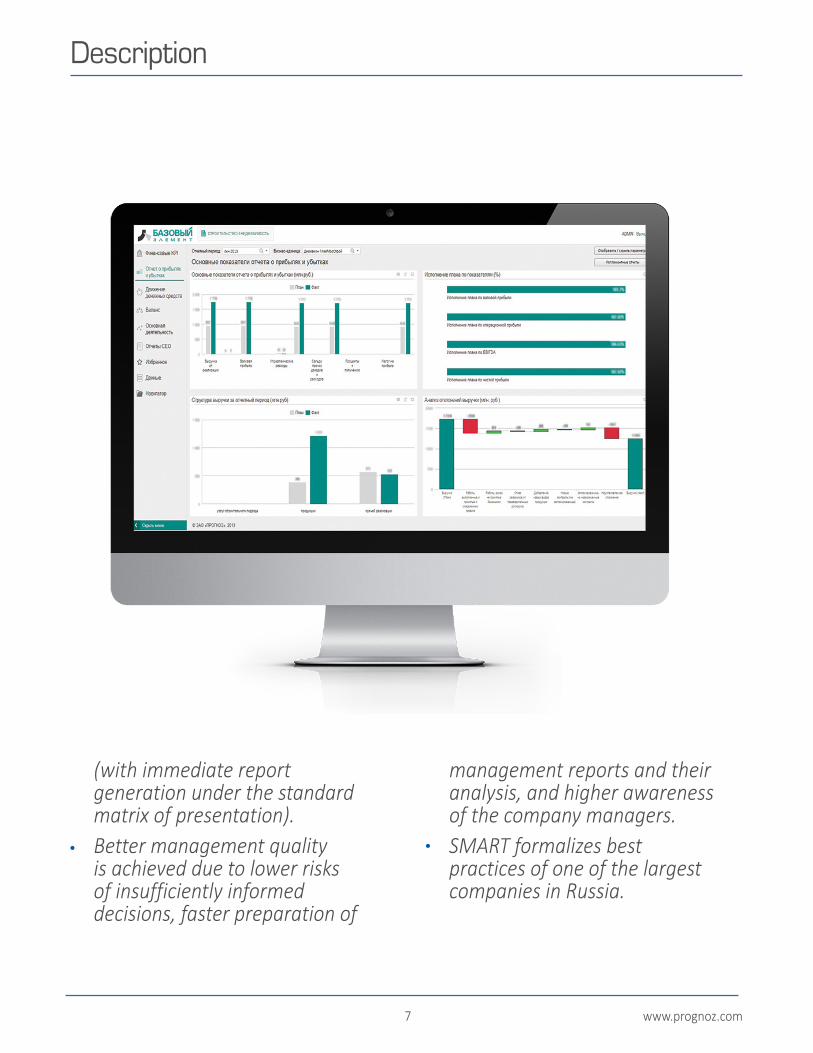
(with immediate report generation under the standard matrix of presentation).Better management quality is achieved due to lower risks of insufficiently informed decisions, faster preparation of
management reports and their analysis, and higher awareness of the company managers.SMART formalizes best practices of one of the largest companies in Russia.
7
Description
www.prognoz.com
www.prognoz.com