Embed Size (px)
Citation preview

System Management Principles Statement
� Compliance report for June 2014 to August 2014� Summary of balancing actions and breaches for June 2014 to Aug 2014� Performance compared to last year

2
Summary Report
0
0
Aug-14
00Number of Non-Material Breaches
00Number of Material Breaches
Jul-14Jun-14
22
4
18
Aug-14
1916Total
612Total Number of Sell Actions
134Total Number of Buy Actions
Jul-14Jun-14
0
0
273
Aug-13
0Number of Non-Material Breaches
(Calendar year to date)
0Number of Material Breaches
(Calendar year to date)
174Number of Balancing Actions
(Calendar year to date)
Aug-14

Operational Overview

4
Month-ahead ensemble CWV October 2013 to Sept 2014 vs. Historical Range
-5
0
5
10
15
20
01/10/2013 01/11/2013 01/12/2013 01/01/2014 01/02/2014 01/03/2014 01/04/2014 01/05/2014 01/06/2014 01/07/2014 01/08/2014 01/09/2014
Deg
rees C
WV
Maximum to seasonal normal
Actual CWV
Ensemble forecasts
Minimum to seasonal normal
Mean Ensemble

Demands

6
Gas Demand Breakdown1st October 2013 to 27th August 2014 Vs Previous Year
0
50
100
150
200
250
300
350
400
450
Oct-13 Nov-13 Dec-13 Jan-14 Feb-14 Mar-14 Apr-14 May-14 Jun-14 Jul-14 Aug-14
mcm
NDM DM [Exc Interconnectors] Total Interconnector Export
Storage Injection Previous Years Actual Demand

7
Gas Demand Statistics1st October 2013 to 27th August 2014
0
50
100
150
200
250
300
350
400
450
Gas Year 13/14 Average
Gas Year 13/14 Max
Gas Year 13/14 Min
NDM DM [Exc Interconnectors]
Storage Injection Total Interconnector Export

9
Gas Demand Vs SND / Cold / Warm 1st October 2013 to 27th August 2014
0
50
100
150
200
250
300
350
400
450
500
Oct-13 Nov-13 Dec-13 Jan-14 Feb-14 Mar-14 Apr-14 May-14 Jun-14 Jul-14 Aug-14
mcm
Total Demand SND Cold Warm
10
LDZ Actual Demand Vs LDZ SND 1st October 2013 to 28th August 2014
0
50
100
150
200
250
Gas Year 13/14 Average Winter average [Oct to Mar] Summer average [Apr to Current Date]
mcm
LDZ Actual LDZ SND

12
Gas C
on
su
mp
tion
for P
ow
er G
en
era
tion
Octo
ber 2
013 to
Au
g 2
014
0
10
20
30
40
50
60
70
80
01-Oct
08-Oct
15-Oct
22-Oct
29-Oct
05-Nov
12-Nov
19-Nov
26-Nov
03-Dec
10-Dec
17-Dec
24-Dec
31-Dec
07-Jan
14-Jan
21-Jan
28-Jan
04-Feb
11-Feb
18-Feb
25-Feb
04-Mar
11-Mar
18-Mar
25-Mar
01-Apr
08-Apr
15-Apr
22-Apr
29-Apr
06-May
13-May
20-May
27-May
03-Jun
10-Jun
17-Jun
24-Jun
01-Jul
08-Jul
15-Jul
22-Jul
29-Jul
05-Aug
12-Aug
mcm/d
Actu
al P
ow
er G
en
era
tion
de
ma
nd
Mo
de
lH
igh
Po
we
rP
revio
us Y
ea
r

Supplies

14
Gas Supply Breakdown 1st October 2013 to 26th August 2014 vs Previous Year
0
50
100
150
200
250
300
350
400
450
500
550
600
Oct-13 Nov-13 Dec-13 Jan-14 Feb-14 Mar-14 Apr-14 May-14 Jun-14 Jul-14 Aug-14
mcm
Gas Day
UKCS Norway BBL IUK LRS MRS SRS LNG Previous Year Supply

15
NSS [Non-Storage Supply] 1st October 2013 to 26th August 2014
0
50
100
150
200
250
300
350
400
450
500
550
600
Gas Year 13/14 Average
Gas Year 13/14 Max
Margins Notice Assumptions
Capacity
UKCS Norway LNG BBL IUK

16
IUK Flows Vs NBP & ZEE Price Differential1st October 2013 to 27th August 2014
-10
-8
-6
-4
-2
0
2
4
6
8
10
-80
-60
-40
-20
0
20
40
60
80
01-Oct-13 01-Nov-13 01-Dec-13 01-Jan-14 01-Feb-14 01-Mar-14 01-Apr-14 01-May-14 01-Jun-14 01-Jul-14 01-Aug-14
pp
/th d
iffe
rential (
NB
P v
s. Z
ee)
mcm
/d
IUK IUK Import Capacity IUK Export Capacity IUK Price Dif ferential
+ IMPORT TO NBP
- EXPORT TO ZEE

17
LNG Terminal Flows1st October 2013 to 31st August 2014
0
10
20
30
40
50
60
70
80
Oct-13 Nov-13 Dec-13 Jan-14 Feb-14 Mar-14 Apr-14 May-14 Jun-14 Jul-14 Aug-14
mcm
South Hook Isle of Grain Dragon Previous Year LNG

18
Norway Flows1st October 2013 to 31st August 2014
0
20
40
60
80
100
120
140
Oct-13 Nov-13 Dec-13 Jan-14 Feb-14 Mar-14 Apr-14 May-14 Jun-14 Jul-14 Aug-14
mcm
Langeled Vesterled [estimated] FLAGS [estimated] Previous Year Norway

19
Norway vs LNG Flows1st October 2013 to 31st August 2014
0
20
40
60
80
100
120
140
160
Oct-13 Nov-13 Dec-13 Jan-14 Feb-14 Mar-14 Apr-14 May-14 Jun-14 Jul-14 Aug-14 Sep-14
mcm
Total Norway Total LNG

20
Storage Withdrawal Vs Injection1st October 2013 to 31st August 2014
-80
-60
-40
-20
0
20
40
60
80
100
Oct-13 Nov-13 Dec-13 Jan-14 Feb-14 Mar-14 Apr-14 May-14 Jun-14 Jul-14 Aug-14
Mcm
Withdrawal Injection

21
Long Range Storage Stocks [LRS]1st October 2013 to 2nd September 2014 Vs Previous Years
0.00
5.00
10.00
15.00
20.00
25.00
30.00
35.00
40.00
45.00
Oct-13 Dec-13 Feb-14 Apr-14 Jun-14 Aug-14
twh
LRS 2012/2013 LRS 2013/2014
22
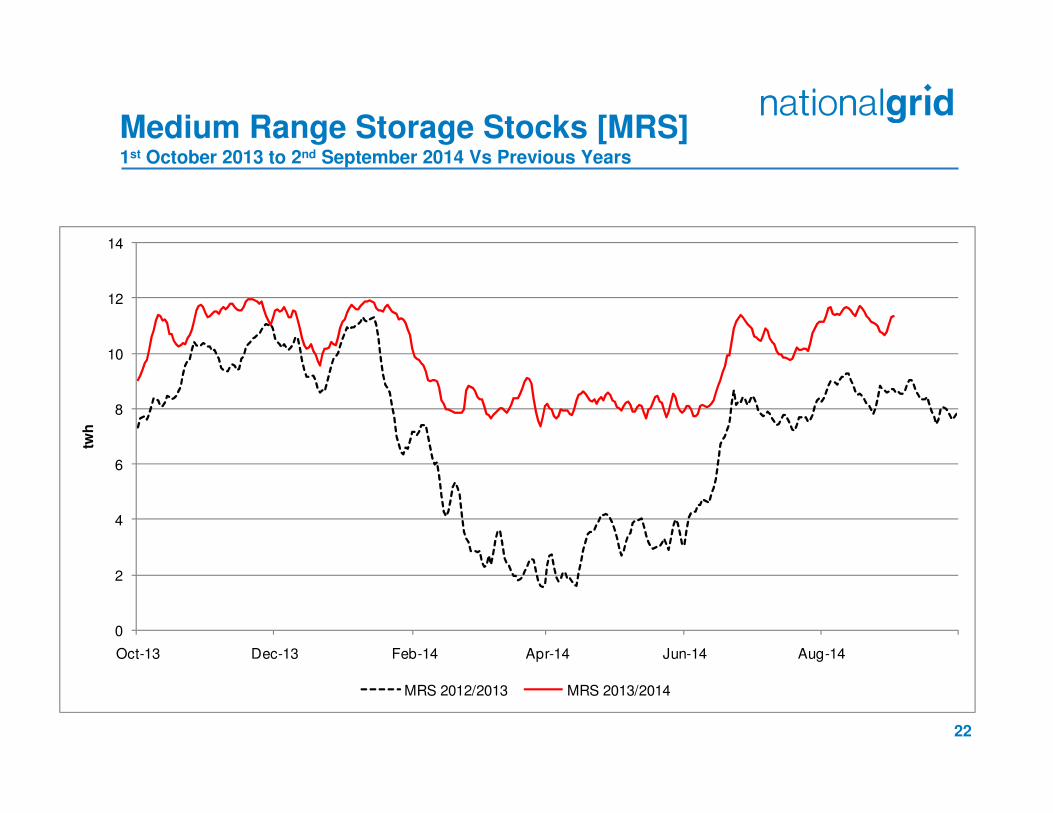
Medium Range Storage Stocks [MRS]1st October 2013 to 2nd September 2014 Vs Previous Years
0
2
4
6
8
10
12
14
Oct-13 Dec-13 Feb-14 Apr-14 Jun-14 Aug-14
twh
MRS 2012/2013 MRS 2013/2014

23
Short Range Storage Stocks [SRS]1st October 2013 to 2nd September 2014 Vs Previous Years
-0.05
0
0.05
0.1
0.15
0.2
0.25
0.3
0.35
0.4
01-Oct-13 01-Dec-13 01-Feb-14 01-Apr-14 01-Jun-14 01-Aug-14
twh
SRS 2012/2013 SRS 2013/2014

24
Combined EU Storage Stocks [% Full] From 1st October 2013 to 2nd September 2014 Vs Previous Years
0
10
20
30
40
50
60
70
80
90
100
01-Oct 01-Nov 01-Dec 01-Jan 01-Feb 01-Mar 01-Apr 01-May 01-Jun 01-Jul 01-Aug 01-Sep
%
2010/2011 2011/2012 2012/2013 2013/2014

25
UK Gas Prices 1st October 2013 to 31st August 2014 Vs Previous Years
30.00
40.00
50.00
60.00
70.00
80.00
90.00
100.00
110.00
01-Oct-13 01-Dec-13 01-Feb-14 01-Apr-14 01-Jun-14 01-Aug-14
p/p
therm
SAP SMPB SMPS Previous Year SAP

26
What Operational Issues Affected Users?

Transporter Actions and Neutrality
� Energy Balancing� Capacity

28
Transporter Energy Traded on the OCMNGG Monthly Buys and SellsAug 2013 to Aug 2014 Vs Previous Year
-700
-600
-500
-400
-300
-200
-100
0
100
200
300
400
500
600
700
-700
-600
-500
-400
-300
-200
-100
0
100
200
300
400
500
600
700
01-Aug-13 01-Oct-13 01-Dec-13 01-Feb-14 01-Apr-14 01-Jun-14 01-Aug-14
Gwh
Buy 2013/14 Buy Prev Year Sell 2013/14 Sell Prev Year

29
Days of Default SMP Prices [SMPB]From Sept 2013 to Aug 2014
0
10
20
30
40
50
60
70
80
90
100
Sep-13 Oct-13 Nov-13 Dec-13 Jan-14 Feb-14 Mar-14 Apr-14 May-14 Jun-14 Jul-14 Aug-14
%
SMPB [NG Set Price] SMPB [Default Marginal]

30
Days of Default SMP Prices [SMPS]From Sep 2013 to Aug 2014
0
10
20
30
40
50
60
70
80
90
100
Sep-13 Oct-13 Nov-13 Dec-13 Jan-14 Feb-14 Mar-14 Apr-14 May-14 Jun-14 Jul-14 Aug-14
%
SMPS [NG Set Price] SMPS [Default Marginal]

31
Energy Balancing – Balancing Costs Payments / Charges / Net Credit / Debit [Imbalance / Scheduling / OCM]May - July 2014
31,182,190
625,874
7,106,801
24,133,193
12,302,372
0
5,000,000
10,000,000
15,000,000
20,000,000
25,000,000
30,000,000
35,000,000
40,000,000
45,000,000
Credits Debits
Net Credit £2,479,299

32
Energy Balancing – Balancing Costs May - July 2014
May-14 Jun-14 Jul-14
Imbalance Payment £ [DCS] -6,565,892 -9,093,615 -8,473,686
Charge £ [DCT] 14,338,457 8,158,583 8,685,150
Scheduling Exit Charge £ [DXS] 6,573 6,592 11,776
Exit Charge £ [EXS] 53,737 45,037 48,898
Entry Charge £ [ESC] 114,376 109,421 229,463
OCM Payment £ [TTB] -7,632,296 -1,441,933 -3,228,143
Charge £ [TTS] 1,942,318 2,916,747 2,247,736
Balancing Costs 2,257,274 700,831 -478,805

33
Energy Balancing – Balancing CostsOCM Payments / ChargesMay - July 2014
-1,500,000
-1,000,000
-500,000
0
500,000
1,000,000
1,500,000
01/05/2014 15/05/2014 29/05/2014 12/06/2014 26/06/2014 10/07/2014 24/07/2014
£
Day
Payment [TTB] Charge £ [TTS]

34
Energy Balancing – Balancing CostsImbalance Payments / ChargesMay - July 2014
-1,500,000
-1,000,000
-500,000
0
500,000
1,000,000
1,500,000
2,000,000
01/05/2014 15/05/2014 29/05/2014 12/06/2014 26/06/2014 10/07/2014 24/07/2014
£
Day
Payment £ [DCS]
Charge £ [DCT]

35
Energy Balancing – Balancing CostsScheduling ChargesMay – Jul 2014
0
5,000
10,000
15,000
20,000
25,000
30,000
01/05/2014 15/05/2014 29/05/2014 12/06/2014 26/06/2014 10/07/2014 24/07/2014
£
Day
Exit Charge £ [DXS]
Entry Charge £ [ESC]
Exit Charge £ [EXS]

36
Capacity NeutralityNet Cost / Revenue From 1st April 2014 to 31th August 2014
-£231,039Net Revenue
£0Revenue from Locational Sells and PRI Charges
-£361Non-Obligated Sales Revenue (Entry only)
-£71,614Entry Capacity Overrun Revenue
£0Total Entry Constraint Management Operational Costs
-£159,064WDDSEC/DAI Entry Capacity Revenue
Revenue/Costs
37
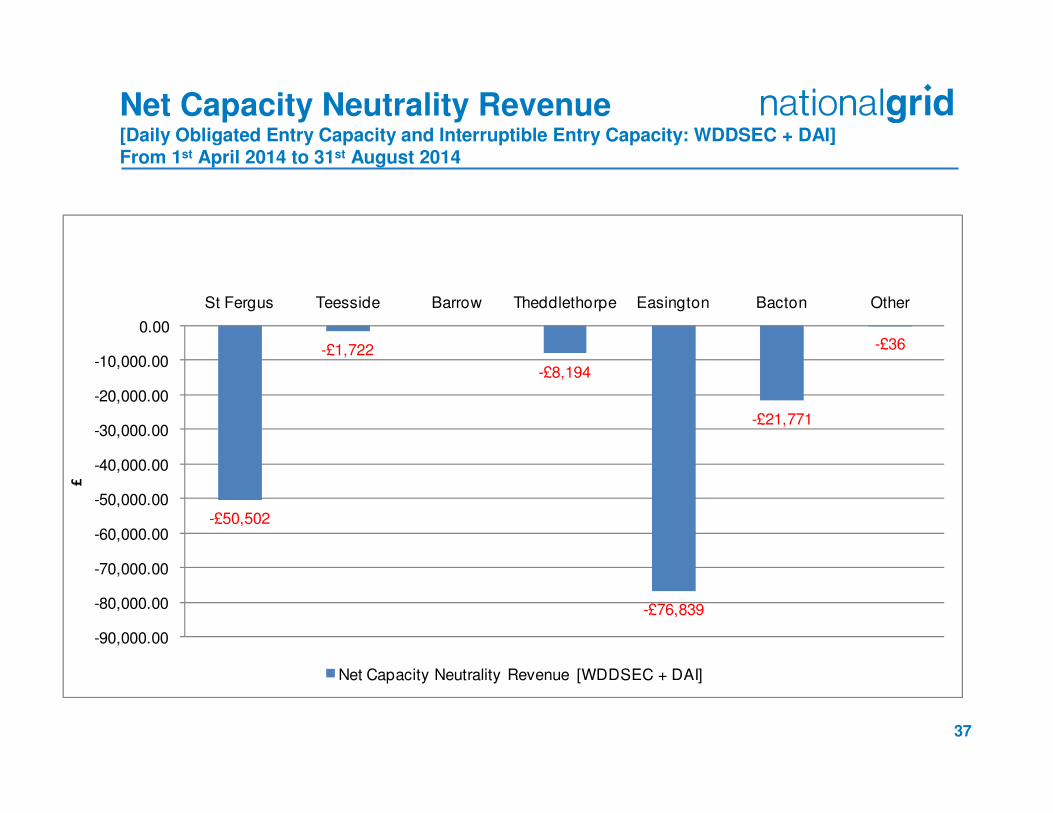
Net Capacity Neutrality Revenue [Daily Obligated Entry Capacity and Interruptible Entry Capacity: WDDSEC + DAI] From 1st April 2014 to 31st August 2014
-£50,502
-£1,722
-£8,194
-£76,839
-£21,771
-£36
-90,000.00
-80,000.00
-70,000.00
-60,000.00
-50,000.00
-40,000.00
-30,000.00
-20,000.00
-10,000.00
0.00
St Fergus Teesside Barrow Theddlethorpe Easington Bacton Other
£
Net Capacity Neutrality Revenue [WDDSEC + DAI]

38
Capacity NeutralityRevenues from Entry Cap Overruns and Non-Obligated Sales,and Locational Sells and PRI Charges. Totals From 1st April 2014 to 31st August 2014
£0 (FY14/15)Total
£0Mar-15
£0Feb-15
£0Jan-15
£0Dec-14
£0Nov-14
£0Oct-14
£0Sep-14
£0Aug-14
£0Jul-14
£0Jun-14
£0May-14
£0Apr-14
Locational Sells and PRI charges revenue
Month
Total
Mar-15
Feb-15
Jan-15
Dec-14
Nov-14
Oct-14
Sep-14
Aug-14
Jul-14
Jun-14
May-14
Apr-14
Month
-£361(FY14-15)-£71,614 (FY14-15)
--
--
--
--
--
--
--
-Not yet available
--£34,442
--£23,853
-£108 -£8,271
-£253-£5,048
Non-obligated sales revenue
(entry)
Entry Cap Overrun Revenue

39
Customer Outputs (June – August 2014)
NoneMargins Notices
NoneGas Deficit Warnings
NoneOperating Margins
5 Gas Quality Breach 293 interventionsGas Quality Excursions
35 rejections127,383 OPNs received.
57,789 non-compliantRules Breached
100% successful71 Non Routine Operations completed
Maintenance
99.8129% achieved21 Breaches of Agreed / Assured Pressures
Pressure Obligations
No Scalebacks or Buy BacksNoneCapacity Constraints