Embed Size (px)
Citation preview
STRUCTURAL CONTROL AND HEALTH MONITORINGStruct. Control Health Monit. 2006; 13:868–884Published online 18 May 2005 in Wiley InterScience (www.interscience.wiley.com). DOI: 10.1002/stc.86
System identification and active vibration controlof a composite I-beam using smart materials
Vineet Sethi1, Gangbing Song1,*,y and Pizhong Qiao2
1Department of Mechanical Engineering, University of Houston, Houston, TX 77204, U.S.A.2Department of Civil Engineering, University of Akron, Akron, OH 44325, U.S.A.
SUMMARY
This research concerns active vibration control of a 3.35-m-long composite I-beam in a cantileveredconfiguration by using peizoceramics smart materials, in particular the PZT (lead zirconate titanate), in theform of patches. These PZT patches are surface-bonded on the I-beam and function as actuators andsensors. A real-time data acquisition and control system is used to record the experimental data and toimplement designed controllers. To assist control system design, open-loop testing and systemidentification are conducted. To excite the 3.35-m composite I-beam, a sweep sinusoidal input is usedand then a state space model is derived for the system. This state space model is used for simulation anddevelopment of control algorithms. A positive position feedback (PPF) controller is designed and issimulated using the identified model. Simulations show the dramatic increase in damping of the beamswhich, when implemented experimentally, shows an increase in the damping up to 1100%. Experimentalresults verify the simulated results and demonstrate the effectiveness of active control of a civil structureusing smart materials. Copyright # 2005 John Wiley & Sons, Ltd.
KEY WORDS: system identification; piezoceramics; positive position feedback; PZT; beam control;vibration suppression; smart structure
1. INTRODUCTION
Lightweight structures have been used extensively in the spacecraft industry to satisfy strengthand size requirements. Extensive research has been done on these lightweight structures toactively and passively control the vibrations. Since these lightweight structures have a tendencyto become excited it becomes imperative to control their vibrations. However, this is also truefor the heavy structures for example civil structures that also have a tendency to excitation andvibrations are prominent in their dynamic behavior.
Received 27 September 2004Revised 15 January 2005Accepted 15 March 2005Copyright # 2005 John Wiley & Sons, Ltd.
yE-mail: [email protected]
Contract/grant sponsor: NSF; contract/grant number: 0093737Contract/grant sponsor: NASA; contract/grant number: NCC3-839
*Correspondence to: Gangbing Song, Department of Mechanical Engineering, University of Houston, Houston, TX,U.S.A.
Civil engineering structures are increasingly using lightweight fiber-reinforced plastic (FRP)beams and columns that are more economical and efficient than traditional structures and alsoare light. These composite beams have great potential for application in bridges, piers, retainingwalls, airport facilities, storage structures exposed to chemical reaction and others. Most ofthese beam composites are thin-walled structures, manufactured from pultrusion methods. Thematerial constituents consist of E-glass fibers and polyester or vinylester resins and hence have:(a) Relatively large deflection due to the low elastic modulus of resins used; (b) considerableshear deformation due to relatively the low shear modulus of the composite; (c) low buckling,vibration resistance due to thin-walled geometry and low stiffness of E-glass/polyestercomposites.
External disturbances can cause vibrations that are critical and that may becomecatastrophic in due course. Since beams made of special composites are also extensivelyused in space applications and antennas, their vibration control has received much researchattention [1].
Smart materials are now extensively used in research conducted for control of flexible slenderbeams and plates. Piezoelectric (PZT) smart materials offer the flexibility of bonding to thestructure besides being cost efficient. PZTs attached to the structures can be used as sensors andactuators for effective control of the structure. Aizawa et al. [2] and Kamada et al. [3]demonstrated the use of piezoelectric actuators for response control of a four-storey structuralframe. Won et al. [4] studied the application of piezoelectric devices to active vibrationsuppression. Blangurenon et al. [5], Han et al. [6] and Sugavanam et al. [7] have used modelingtechniques for the structure coupled with PZTs in identifying the system of the structure. Finiteelement analysis of the coupled structure has also been done to find a physical model of thestructure. Yang and Lee [8,9] developed and validated a stepped beam model to predictanalytically the natural frequencies and mode shapes at different piezoelectric sensor/actuatorlocations. This paper adopts the approach of system identification using the data collected fromthe system response to the input signals. A state space model can be quickly identified from therepresentative data collected and can then be effectively used for designing the controller.
Many researchers have developed control algorithms to control lightweight and lightlydamped structures. Scott et al. [10] and Manning et al. [11] have used pole placement to controllightly damped structures. Han et al. [6] have described linear quadratic Gaussian control for alightly damped structures. Stobener et al. [12] have used a poly vinylidene floride (PVDF)actuator for active control of plate vibrations. Chiang and Lee [13] have used a distributedmodal actuator and sensor active control for a flexible slender plate. Chantalakhana andStanway [14] have used active constrained layer damping to control plate vibrations. Thepositive position feedback controller was introduced by Goh and Caughey [15] in 1985 andsubsequently used in various forms by Fanson and Caughey [16], Dosch et al. [17,18], Agrawaland Bang [19], Baz and Poh [20], Friswell and Inman [21], and Song et al. [22] in the control offlexible structures. In this research, the positive position feedback controller is also used toeffectively achieve damping of a large beam.
2. STATE SPACE MODEL
The general form of the equation of motion governing the dynamic equilibrium between theexternal, elastic, inertia and damping forces acting on a discrete, flexible structure with a finite
Copyright # 2005 John Wiley & Sons, Ltd. Struct. Control Health Monit. 2006; 13:868–884
SYSTEM IDENTIFICATION AND ACTIVE VIBRATION CONTROL 869
number of degrees of freedom is given by
M .xþ C ’xþ Kx ¼ Qf ð1Þ
where, f and x and vectors of generalized forces and displacements, Q is input force influencematrix and M, K, C are respectively the mass, stiffness and damping matrices (symmetric andsemi positive definite). The damping matrix C represents the various dissipation mechanisms inthe structure. Equation (1) can be written in terms of modal coordinates by introducing thefollowing coordinate transformation
xðtÞ ¼ SrðtÞ ð2Þ
where S is the matrix of right hand eigen vectors and r is the modal coordinate. PremultiplyingEquation (1) with ST and using the orthogonality condition we get the following decoupledequation
%M .xþ %C ’xþ %Kx ¼ %Qf ð3Þ
and assuming Rayleigh damping
%C ¼ a %M þ b %K ð4Þ
Now, if we define the state variable z as modal displacements and modal velocities, Equation(2) can be written in state space form as
’z ¼ Azþ Bu
y ¼ Lz ð5Þ
where
z ¼r
’r
" #; A ¼
0 I
� %M�1 %K � %M�1 %C
" #; B ¼
0
%M�1 %Q
" #
and L ¼ I 0� �
and I is the identity matrix.
3. SYSTEM IDENTIFICATION
This approach of determining the transfer function using modal analysis is complex andinvolves the use of finite element analysis to get the mass and stiffness matrices. However, thesystem identification technique offers a rather simplistic approach for getting the transferfunction of the system. The system identification model used to identify the system is basedupon the subspace method. A linear system can be represented in state space innovations form as
xðtþ 1Þ ¼AxðtÞ þ BuðtÞ þ KeðtÞ
yðtÞ ¼CxðtÞ þDuðtÞ þ eðtÞ ð6Þ
where e(t) expresses the innovations, x(t) is the state vector, y(t) is output, u(t) is the input and Kis the Kalman gain. The states x(t) can be formed as linear combinations of the kth step aheadpredicted outputs. The predictor, in this method, can be determined using the kth step aheadpredictors by projections from the observed data sequences.
Copyright # 2005 John Wiley & Sons, Ltd. Struct. Control Health Monit. 2006; 13:868–884
V. SETHI, G. SONG AND P. QIAO870
The subspace method can be used to estimate the A, B, C, D and K matrices. Assuming thatx(t), y(t) and u(t) are known, Equation (6) becomes a linear regression. This enables us toestimate the matrices C and D by the least-squares method and will lead us to determine e(t).
Again e(t) can be treated as a known signal and this will lead us to determine A, B and K usingthe least-squares method. The Kalman gain K is computed using the Riccati equation. Thismodel, derived from the subspace method, is then used as base model for further refining modelby the prediction error method (PEM).
In the time domain, the system can be represented by using the shift operator q
yðtÞ ¼ GðqÞuðtÞ þHðqÞeðtÞ ð8Þ
GðqÞ ¼ CðqInx � AÞ�1BþD ð9Þ
HðqÞ ¼ CðqInx � AÞ�1K þ Iny ð10Þ
where G(q) is the transfer function of the system, e(t) represents the innovations or white noise,nx is the dimension of the state vector x(t), ny is the dimension of y(t), Inx is the nx� nx identitymatrix, Iny is the ny� ny identity matrix.
From the observed data of input u and output y, the prediction errors can be computed as
eðtÞ ¼ H�1ðqÞ½yðtÞ � GðqÞuðtÞ� ð11Þ
The error can now be parameterized by the state space matrices derived by the subspacemethod. The common parametric identification method is to determine estimates of G and H byminimizing
VNðG;HÞ ¼XNt¼1
e2ðtÞ ð12Þ
This forms the basis for the prediction error method. The model is first initialized and thefurther adjusted by optimizing the prediction error fit. Substantial details for systemidentification can be found in the Ljung [23] and the MATLAB reference manual [24].MATLAB has the system identification toolbox to perform the above algorithm. The predictionerror method first initializes the model by using the subspace algorithm and then minimizes theprediction error.
4. POSITIVE POSITION FEEDBACK CONTROL
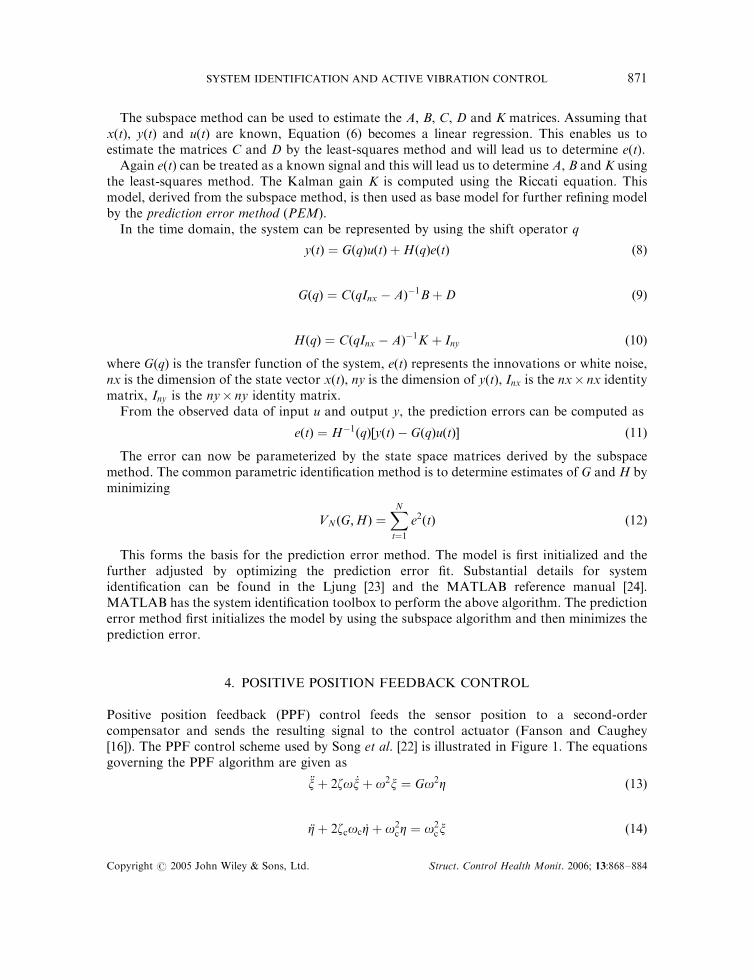
Positive position feedback (PPF) control feeds the sensor position to a second-ordercompensator and sends the resulting signal to the control actuator (Fanson and Caughey[16]). The PPF control scheme used by Song et al. [22] is illustrated in Figure 1. The equationsgoverning the PPF algorithm are given as
.xþ 2zo’xþ o2x ¼ Go2Z ð13Þ
.Zþ 2zcoc ’Zþ o2cZ ¼ o2
cx ð14Þ
Copyright # 2005 John Wiley & Sons, Ltd. Struct. Control Health Monit. 2006; 13:868–884
SYSTEM IDENTIFICATION AND ACTIVE VIBRATION CONTROL 871
In the equations x is a modal coordinate of structure displacement, z is the damping ratio of thestructure, o is the natural frequency of the structure, G is the feedback gain, Z is thecompensator coordinate, zc is the damping ratio of the compensator, oc is the natural frequencyof the compensator.
The PPF compensator results in an increase in active damping of the structure. To achievemaximum damping, oc of the compensator should be approximately same as o of the structure.
5. EXPERIMENTAL PROCEDURE
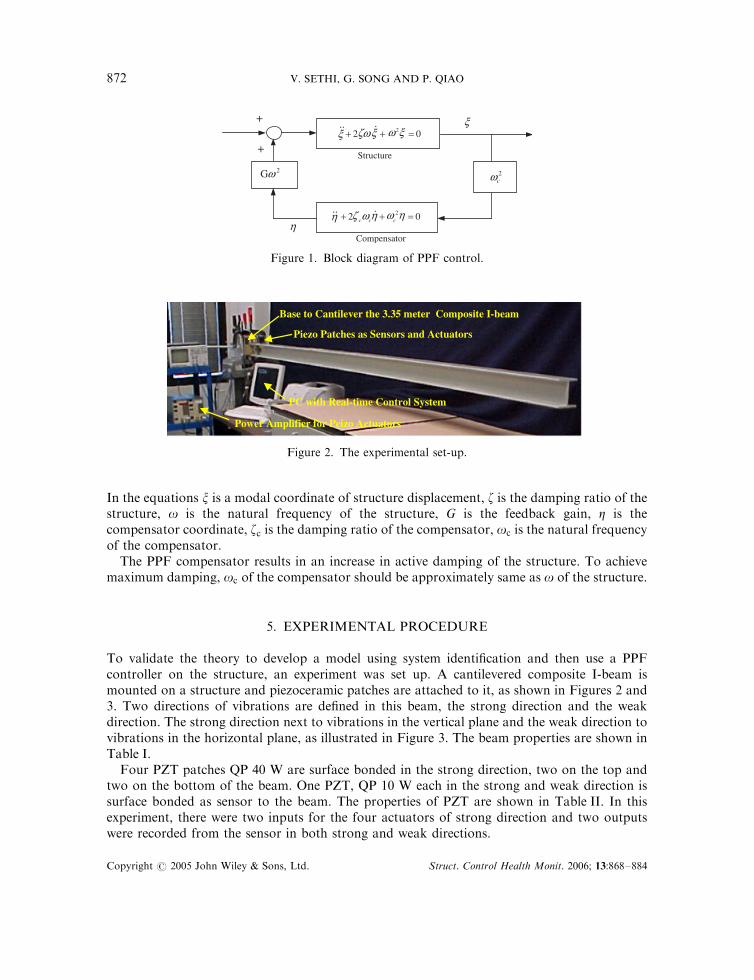
To validate the theory to develop a model using system identification and then use a PPFcontroller on the structure, an experiment was set up. A cantilevered composite I-beam ismounted on a structure and piezoceramic patches are attached to it, as shown in Figures 2 and3. Two directions of vibrations are defined in this beam, the strong direction and the weakdirection. The strong direction next to vibrations in the vertical plane and the weak direction tovibrations in the horizontal plane, as illustrated in Figure 3. The beam properties are shown inTable I.
Four PZT patches QP 40 W are surface bonded in the strong direction, two on the top andtwo on the bottom of the beam. One PZT, QP 10 W each in the strong and weak direction issurface bonded as sensor to the beam. The properties of PZT are shown in Table II. In thisexperiment, there were two inputs for the four actuators of strong direction and two outputswere recorded from the sensor in both strong and weak directions.
Compensator
+
+
2 G
02 2 =++ ccc
2cω
ξ
η
ω
η ζ ω η ω η
Structure
.. .
02 2 =++ ξ ζ ω ξ ω ξ .. .
Figure 1. Block diagram of PPF control.
Base to Cantilever the 3.35 meter Composite I-beam - Piezo Patches as Sensors and Actuators
Power Amplifier for Peizo Actuators
PC with Real-time Control System
Figure 2. The experimental set-up.
Copyright # 2005 John Wiley & Sons, Ltd. Struct. Control Health Monit. 2006; 13:868–884
V. SETHI, G. SONG AND P. QIAO872
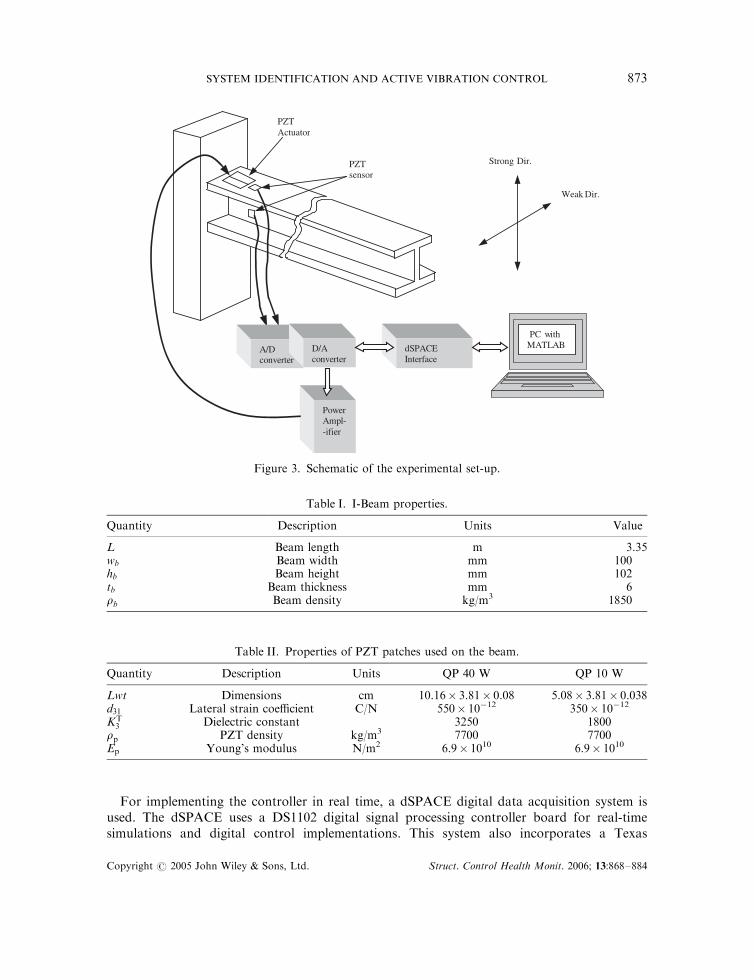
For implementing the controller in real time, a dSPACE digital data acquisition system isused. The dSPACE uses a DS1102 digital signal processing controller board for real-timesimulations and digital control implementations. This system also incorporates a Texas
Strong Dir.
Weak Dir.
Power Ampl--ifier
A/D converter
dSPACE Interface
PC withMATLAB D/A
converter
PZT sensor
PZT Actuator
Figure 3. Schematic of the experimental set-up.
Table I. I-Beam properties.
Quantity Description Units Value
L Beam length m 3.35wb Beam width mm 100hb Beam height mm 102tb Beam thickness mm 6rb Beam density kg/m3 1850
Table II. Properties of PZT patches used on the beam.
Quantity Description Units QP 40 W QP 10 W
Lwt Dimensions cm 10.16� 3.81� 0.08 5.08� 3.81� 0.038d31 Lateral strain coefficient C/N 550� 10�12 350� 10�12
KT3 Dielectric constant 3250 1800
rp PZT density kg/m3 7700 7700Ep Young’s modulus N/m2 6.9� 1010 6.9� 1010
Copyright # 2005 John Wiley & Sons, Ltd. Struct. Control Health Monit. 2006; 13:868–884
SYSTEM IDENTIFICATION AND ACTIVE VIBRATION CONTROL 873
instruments TMS320C31 floating-point processor. The dSPACE can convert analog inputs todigital signals for processing, by using the DS2003 MUX/AD board. The GUI based module ofdSPACE can be customized for data acquisition in the experiment. The data is captured realtime and stored in *.mat format. The trace files can then be used for post-processing of the datausing MATLAB.
6. OPEN-LOOP TESTING
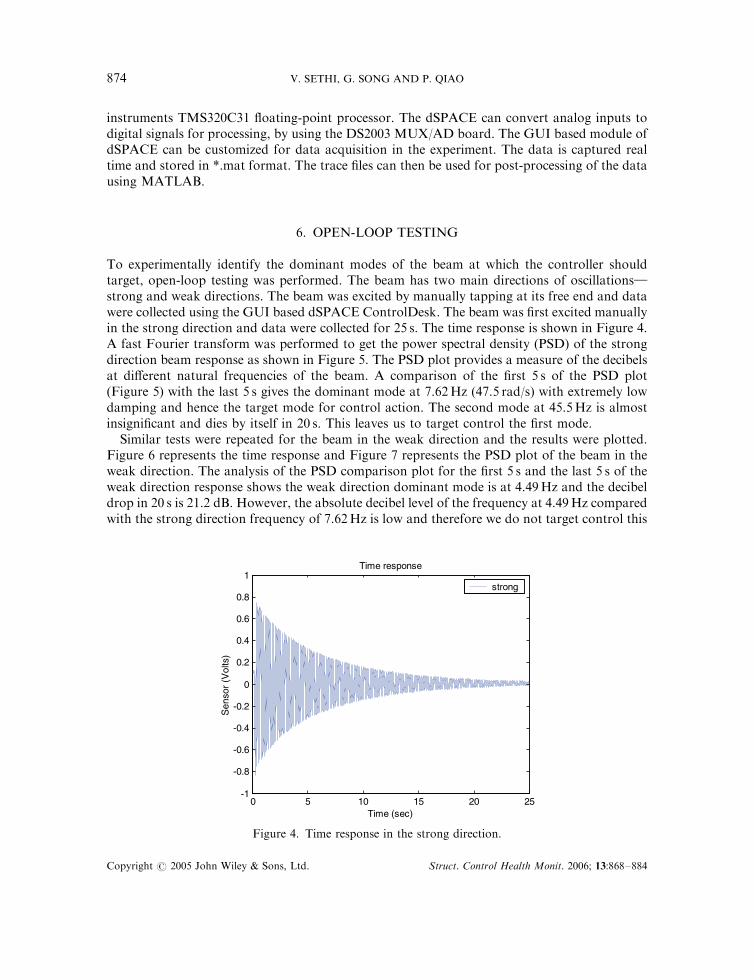
To experimentally identify the dominant modes of the beam at which the controller shouldtarget, open-loop testing was performed. The beam has two main directions of oscillations}strong and weak directions. The beam was excited by manually tapping at its free end and datawere collected using the GUI based dSPACE ControlDesk. The beam was first excited manuallyin the strong direction and data were collected for 25 s. The time response is shown in Figure 4.A fast Fourier transform was performed to get the power spectral density (PSD) of the strongdirection beam response as shown in Figure 5. The PSD plot provides a measure of the decibelsat different natural frequencies of the beam. A comparison of the first 5 s of the PSD plot(Figure 5) with the last 5 s gives the dominant mode at 7.62Hz (47.5 rad/s) with extremely lowdamping and hence the target mode for control action. The second mode at 45.5Hz is almostinsignificant and dies by itself in 20 s. This leaves us to target control the first mode.
Similar tests were repeated for the beam in the weak direction and the results were plotted.Figure 6 represents the time response and Figure 7 represents the PSD plot of the beam in theweak direction. The analysis of the PSD comparison plot for the first 5 s and the last 5 s of theweak direction response shows the weak direction dominant mode is at 4.49Hz and the decibeldrop in 20 s is 21.2 dB. However, the absolute decibel level of the frequency at 4.49Hz comparedwith the strong direction frequency of 7.62Hz is low and therefore we do not target control this
0 5 10 15 20 25-1
-0.8
-0.6
-0.4
-0.2
0
0.2
0.4
0.6
0.8
1Time response
Time (sec)
strong
Sen
sor
(Vol
ts)
Figure 4. Time response in the strong direction.
Copyright # 2005 John Wiley & Sons, Ltd. Struct. Control Health Monit. 2006; 13:868–884
V. SETHI, G. SONG AND P. QIAO874
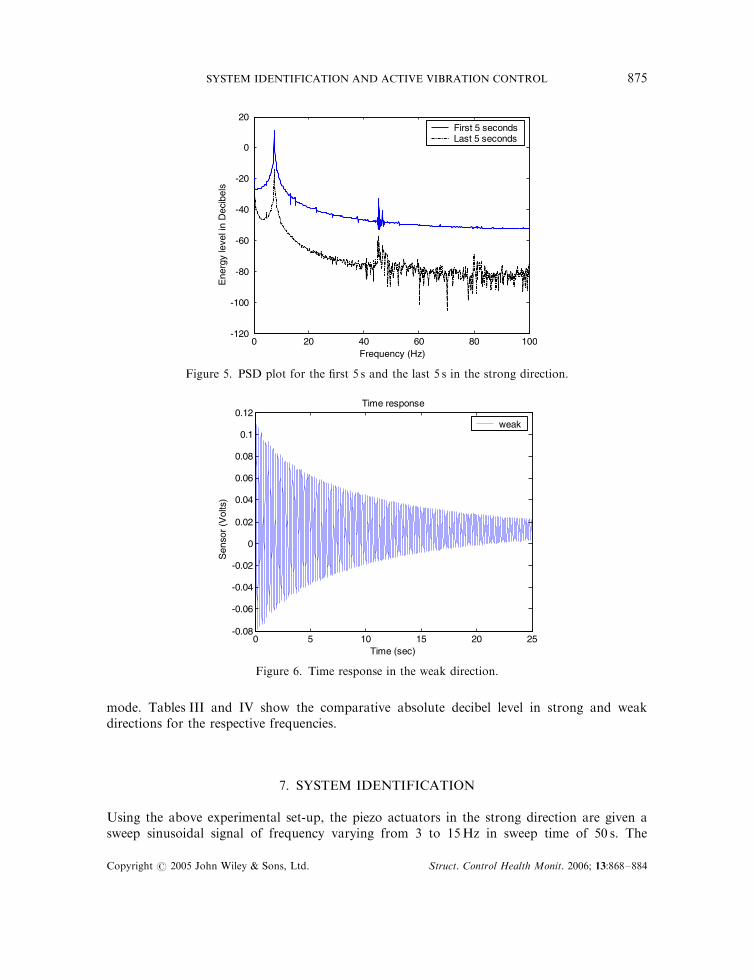
mode. Tables III and IV show the comparative absolute decibel level in strong and weakdirections for the respective frequencies.
7. SYSTEM IDENTIFICATION
Using the above experimental set-up, the piezo actuators in the strong direction are given asweep sinusoidal signal of frequency varying from 3 to 15Hz in sweep time of 50 s. The
0 20 40 60 80 100-120
-100
-80
-60
-40
-20
0
20
Frequency (Hz)
First 5 secondsLast 5 seconds
Ene
rgy
leve
l in
Dec
ibel
s
Figure 5. PSD plot for the first 5 s and the last 5 s in the strong direction.
0 5 10 15 20 25-0.08
-0.06
-0.04
-0.02
0
0.02
0.04
0.06
0.08
0.1
0.12Time response
Time (sec)
weak
Sen
sor
(Vol
ts)
Figure 6. Time response in the weak direction.
Copyright # 2005 John Wiley & Sons, Ltd. Struct. Control Health Monit. 2006; 13:868–884
SYSTEM IDENTIFICATION AND ACTIVE VIBRATION CONTROL 875
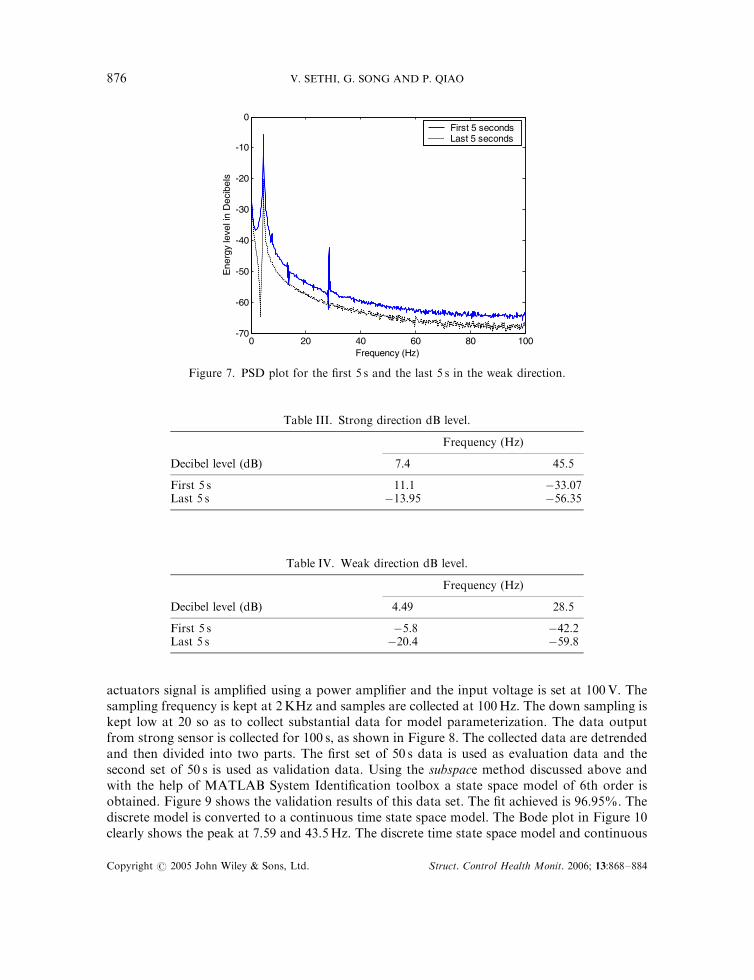
actuators signal is amplified using a power amplifier and the input voltage is set at 100V. Thesampling frequency is kept at 2KHz and samples are collected at 100Hz. The down sampling iskept low at 20 so as to collect substantial data for model parameterization. The data outputfrom strong sensor is collected for 100 s, as shown in Figure 8. The collected data are detrendedand then divided into two parts. The first set of 50 s data is used as evaluation data and thesecond set of 50 s is used as validation data. Using the subspace method discussed above andwith the help of MATLAB System Identification toolbox a state space model of 6th order isobtained. Figure 9 shows the validation results of this data set. The fit achieved is 96.95%. Thediscrete model is converted to a continuous time state space model. The Bode plot in Figure 10clearly shows the peak at 7.59 and 43.5Hz. The discrete time state space model and continuous
0 20 40 60 80 100-70
-60
-50
-40
-30
-20
-10
0
Frequency (Hz)
First 5 secondsLast 5 seconds
Ene
rgy
leve
l in
Dec
ibel
s
Figure 7. PSD plot for the first 5 s and the last 5 s in the weak direction.
Table III. Strong direction dB level.
Frequency (Hz)
Decibel level (dB) 7.4 45.5
First 5 s 11.1 �33.07Last 5 s �13.95 �56.35
Table IV. Weak direction dB level.
Frequency (Hz)
Decibel level (dB) 4.49 28.5
First 5 s �5.8 �42.2Last 5 s �20.4 �59.8
Copyright # 2005 John Wiley & Sons, Ltd. Struct. Control Health Monit. 2006; 13:868–884
V. SETHI, G. SONG AND P. QIAO876
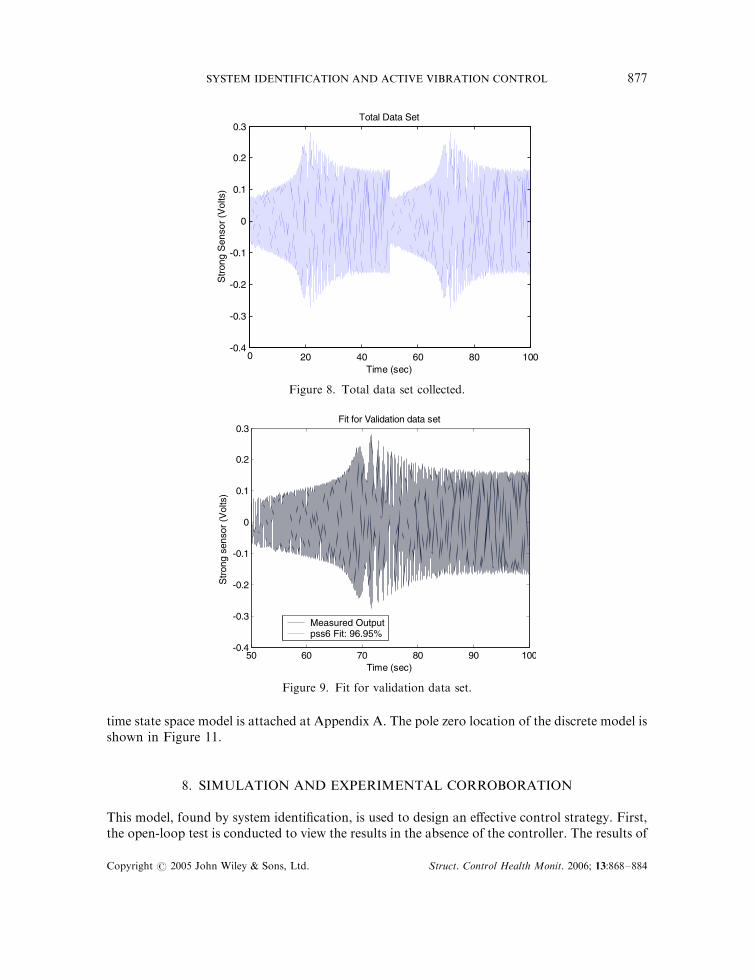
time state space model is attached at Appendix A. The pole zero location of the discrete model isshown in Figure 11.
8. SIMULATION AND EXPERIMENTAL CORROBORATION
This model, found by system identification, is used to design an effective control strategy. First,the open-loop test is conducted to view the results in the absence of the controller. The results of
0 20 40 60 80 100-0.4
-0.3
-0.2
-0.1
0
0.1
0.2
0.3Total Data Set
Time (sec)
Str
ong
Sen
sor
(Vol
ts)
Figure 8. Total data set collected.
50 60 70 80 90 100-0.4
-0.3
-0.2
-0.1
0
0.1
0.2
0.3Fit for Validation data set
Time (sec)
Measured Outputpss6 Fit: 96.95%
Str
ong
sens
or (
Vol
ts)
Figure 9. Fit for validation data set.
Copyright # 2005 John Wiley & Sons, Ltd. Struct. Control Health Monit. 2006; 13:868–884
SYSTEM IDENTIFICATION AND ACTIVE VIBRATION CONTROL 877
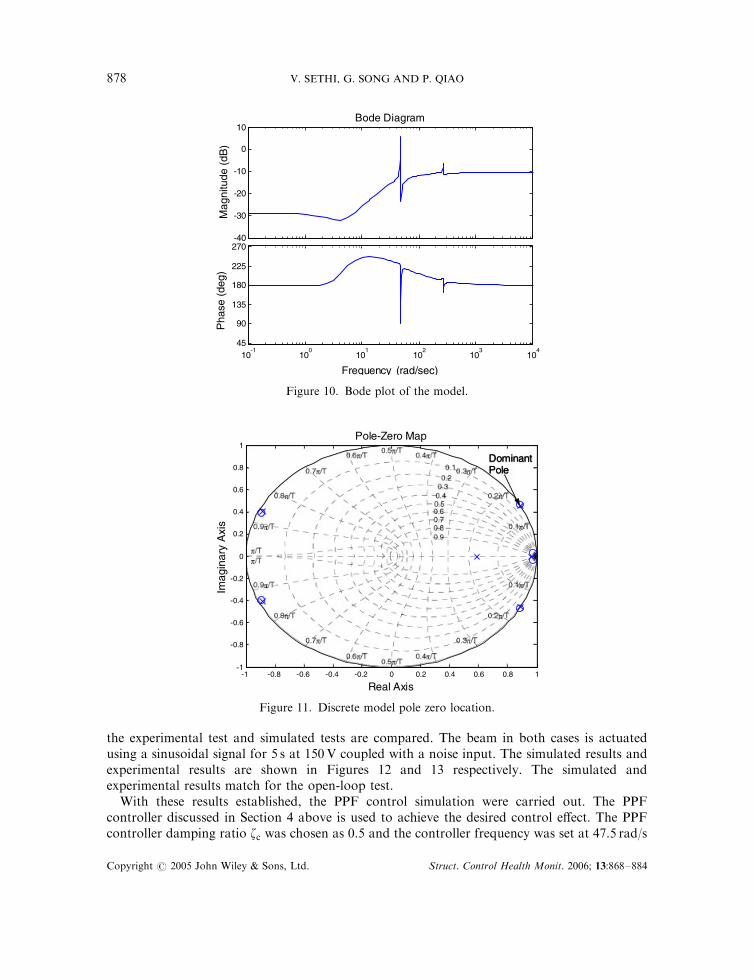
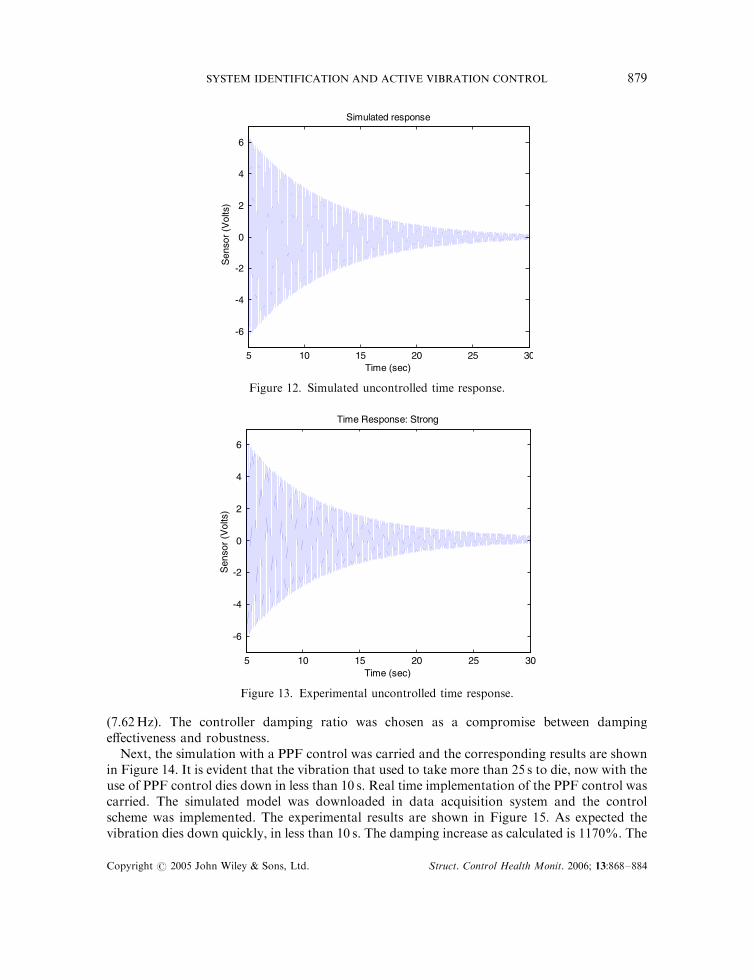
the experimental test and simulated tests are compared. The beam in both cases is actuatedusing a sinusoidal signal for 5 s at 150V coupled with a noise input. The simulated results andexperimental results are shown in Figures 12 and 13 respectively. The simulated andexperimental results match for the open-loop test.
With these results established, the PPF control simulation were carried out. The PPFcontroller discussed in Section 4 above is used to achieve the desired control effect. The PPFcontroller damping ratio zc was chosen as 0.5 and the controller frequency was set at 47.5 rad/s
-40
-30
-20
-10
0
10
10-1
100
101
102
103
104
45
90
135
180
225
270
Bode Diagram
Frequency (rad/sec)
Mag
nitu
de (
dB)
Pha
se (
deg)
Figure 10. Bode plot of the model.
-1 -0.8 -0.6 -0.4 -0.2 0 0.2 0.4 0.6 0.8 1-1
-0.8
-0.6
-0.4
-0.2
0
0.2
0.4
0.6
0.8
1Pole-Zero Map
Real Axis
DominantPole
Imag
inar
y A
xis
Figure 11. Discrete model pole zero location.
Copyright # 2005 John Wiley & Sons, Ltd. Struct. Control Health Monit. 2006; 13:868–884
V. SETHI, G. SONG AND P. QIAO878
(7.62Hz). The controller damping ratio was chosen as a compromise between dampingeffectiveness and robustness.
Next, the simulation with a PPF control was carried and the corresponding results are shownin Figure 14. It is evident that the vibration that used to take more than 25 s to die, now with theuse of PPF control dies down in less than 10 s. Real time implementation of the PPF control wascarried. The simulated model was downloaded in data acquisition system and the controlscheme was implemented. The experimental results are shown in Figure 15. As expected thevibration dies down quickly, in less than 10 s. The damping increase as calculated is 1170%. The
5 10 15 20 25 30
-6
-4
-2
0
2
4
6
Simulated response
Time (sec)
Sen
sor
(Vol
ts)
Figure 12. Simulated uncontrolled time response.
5 10 15 20 25 30
-6
-4
-2
0
2
4
6
Time Response: Strong
Time (sec)
Sen
sor
(Vol
ts)
Figure 13. Experimental uncontrolled time response.
Copyright # 2005 John Wiley & Sons, Ltd. Struct. Control Health Monit. 2006; 13:868–884
SYSTEM IDENTIFICATION AND ACTIVE VIBRATION CONTROL 879
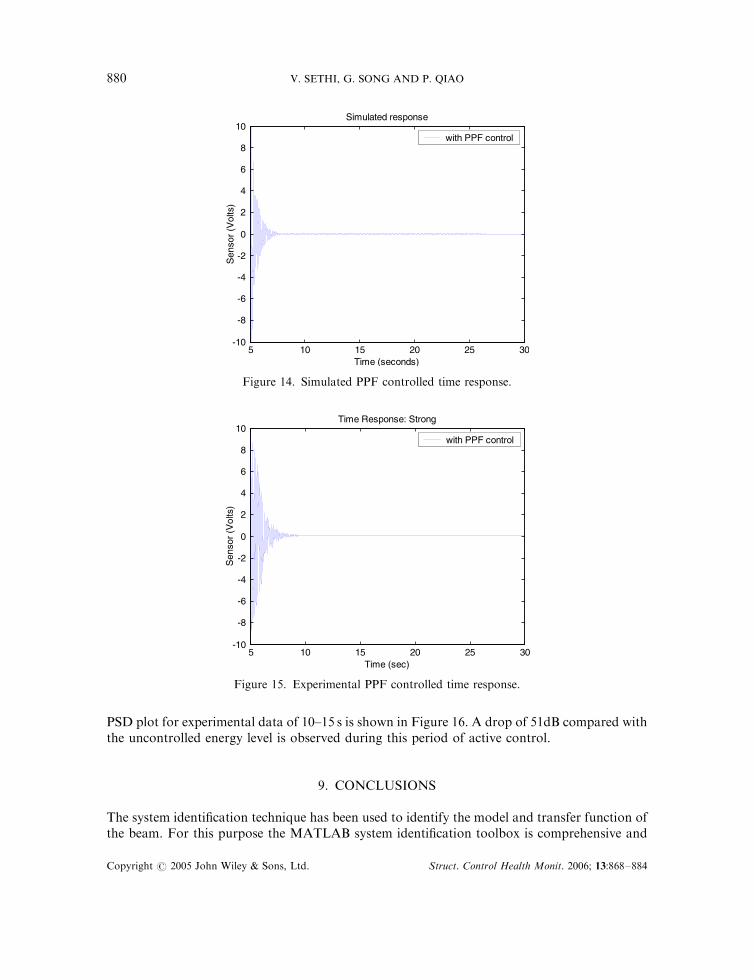
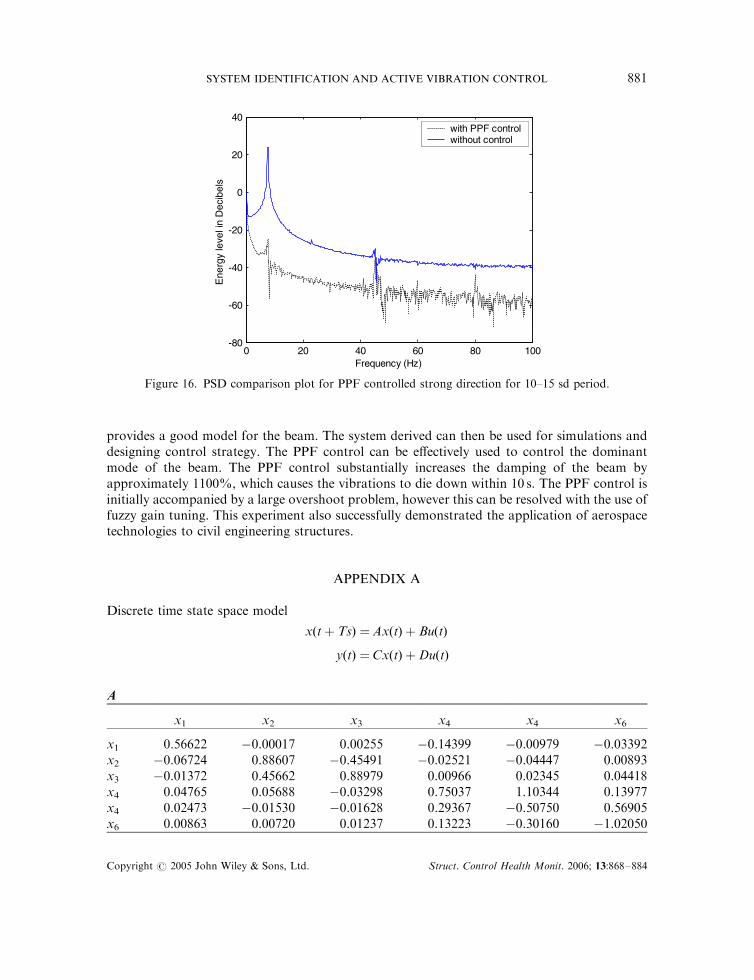
PSD plot for experimental data of 10–15 s is shown in Figure 16. A drop of 51dB compared withthe uncontrolled energy level is observed during this period of active control.
9. CONCLUSIONS
The system identification technique has been used to identify the model and transfer function ofthe beam. For this purpose the MATLAB system identification toolbox is comprehensive and
5 10 15 20 25 30-10
-8
-6
-4
-2
0
2
4
6
8
10Simulated response
Time (seconds)
with PPF control
Sen
sor
(Vol
ts)
Figure 14. Simulated PPF controlled time response.
5 10 15 20 25 30-10
-8
-6
-4
-2
0
2
4
6
8
10Time Response: Strong
Time (sec)
with PPF control
Sen
sor
(Vol
ts)
Figure 15. Experimental PPF controlled time response.
Copyright # 2005 John Wiley & Sons, Ltd. Struct. Control Health Monit. 2006; 13:868–884
V. SETHI, G. SONG AND P. QIAO880
provides a good model for the beam. The system derived can then be used for simulations anddesigning control strategy. The PPF control can be effectively used to control the dominantmode of the beam. The PPF control substantially increases the damping of the beam byapproximately 1100%, which causes the vibrations to die down within 10 s. The PPF control isinitially accompanied by a large overshoot problem, however this can be resolved with the use offuzzy gain tuning. This experiment also successfully demonstrated the application of aerospacetechnologies to civil engineering structures.
APPENDIX A
Discrete time state space model
xðtþ TsÞ ¼AxðtÞ þ BuðtÞ
yðtÞ ¼CxðtÞ þDuðtÞ
A
x1 x2 x3 x4 x4 x6
x1 0.56622 �0.00017 0.00255 �0.14399 �0.00979 �0.03392x2 �0.06724 0.88607 �0.45491 �0.02521 �0.04447 0.00893x3 �0.01372 0.45662 0.88979 0.00966 0.02345 0.04418x4 0.04765 0.05688 �0.03298 0.75037 1.10344 0.13977x4 0.02473 �0.01530 �0.01628 0.29367 �0.50750 0.56905x6 0.00863 0.00720 0.01237 0.13223 �0.30160 �1.02050
0 20 40 60 80 100-80
-60
-40
-20
0
20
40
Frequency (Hz)
with PPF controlwithout control
Ene
rgy
leve
l in
Dec
ibel
s
Figure 16. PSD comparison plot for PPF controlled strong direction for 10–15 sd period.
Copyright # 2005 John Wiley & Sons, Ltd. Struct. Control Health Monit. 2006; 13:868–884
SYSTEM IDENTIFICATION AND ACTIVE VIBRATION CONTROL 881

B
u1
x1 0.31302x2 �0.11454x3 �0.07562x4 1.99384x4 �5.00341x6 5.36734
C
x1 x2 x3 x4 x4 x6
y1 1.05303 �2.41599 �2.59382 0.04862 0.10959 �0.04528
D
u1
y1 �0.29358
Continuous time state space model
’xðtÞ ¼AxðtÞ þ BuðtÞ
yðtÞ ¼CxðtÞ þDuðtÞA
x1 x2 x3 x4 x4 x6
x1 �62.554 �298.4 �65.761 �43.618 �34.904 7.5921x2 256 0 0 0 0 0x3 0 256 0 0 0 0x4 0 0 64 0 0 0x4 0 0 0 64 0 0x6 0 0 0 0 16 0
B
u1
x1 8x2 0x3 0x4 0x4 0x6 0
Copyright # 2005 John Wiley & Sons, Ltd. Struct. Control Health Monit. 2006; 13:868–884
V. SETHI, G. SONG AND P. QIAO882

C
x1 x2 x3 x4 x4 x6
y1 1.7261 �0.06624 2.1338 0.029903 1.1498 0.24524
D
u1
y1 �0.29358
ACKNOWLEDGEMENTS
The second author would like to thank the support provided through a NSF CAREER grant (Grant0093737) and a NASA cooperative agreement (NCC3-839) in conducting this research. Any opinions,findings, and conclusions or recommendations expressed in this material are those of the author(s) and donot necessarily reflect the views of the sponsors.
REFERENCES
1. Farhad A, Maji A, Leung C. Intelligent Civil Engineering Materials and Structures. American Society of CivilEngineers, 1997.
2. Aizawa S, Kakizawa T, Higasino M. Case studies of smart materials for civil structures. Smart Materials andStructures 1998; 7(5):617–626.
3. Kamada T, Fujita T, Hatayama T, Arikabe T, Murai N, Aizawa S, Tohyama K. Active vibration control of framestructures with smart structures using piezoelectric actuators (vibration control by control of bending moments ofcolumns). Smart Materials and Structures 1997; 6(4):448–456.
4. Won CC, Sulla L, Sparks DW, Belvin WK. Application of piezoelectric devices to vibration suppression. Journal ofGuidance, Control and Dynamics 1994; 17(6):1333–1338.
5. Blanguernon A, Lene F, Bernadou M. Active control of a beam using a piezoceramics element. Smart Materials andStructures 1999; 8:116–124.
6. Han JH, Rew KH, Lee I. An experimental study of active vibration control of composite structures with a piezoceramic actuator and a piezo film sensor. Smart Materials and Structures 1997; 6:549–558.
7. Sugavanam S, Vardan VK, Vardan VV. Modeling and control of a lightly damped T-beam using piezoceramicactuators and sensors. Smart Materials and Structures 1998; 7:899–906.
8. Yang SM, Lee YJ. Modal analysis of stepped beams with piezoelectric materials. Journal of Sound and Vibration1994; 176(3):289–300.
9. Yang SM, Lee YJ. Interaction of structure vibration and piezoelectric actuation. Smart Materials and Structures1994; 3(4):494–500.
10. Scott RG, Brown MD, Levesley M. Pole placement control of a smart vibrating beam. Proceedings of the 8thInternational Congress on Sound and Vibration, Hong Kong, 2001; 387–390.
11. Manning WJ, Plummer AR, Levesley MC. Vibration Control of a flexible beam with integrated actuators andsensors. Smart Materials and Structures 2000; 9:932–939.
12. Stobener U, Gaul L. Active control of plate vibrations by discrete PVDF actuator and sensor segments. Proceedingsof the International Conference on Adaptive Structures and Technologies 1998; 9:349–358.
13. Chiang WW, Lee CK. Critical active damping control of a flexible slender plate using a distributed modal actuatorand sensor. Proceedings of the 1989 American Control Conference 1989; 1:700–705.
14. Chantalakhna C, Stanway R. Active constrained layer damping of clamped-clamped plate vibrations. Journal ofSound and Vibration 2001; 241(5):755–777.
15. Goh CJ, Caughey TK. On the stability problem caused by finite actuator dynamics in the collocated control of largespace structure. International Journal of Control 1985; 41(3):787–802.
16. Fanson JL, Caughey TK. Positive position feedback control for large space structures. American Institute ofAeronautics. Astronautics Journal 1990; 28(4):717–724.
Copyright # 2005 John Wiley & Sons, Ltd. Struct. Control Health Monit. 2006; 13:868–884
SYSTEM IDENTIFICATION AND ACTIVE VIBRATION CONTROL 883

17. Dosch JJ, Leo DJ, Inman DJ. Comparison of vibration control schemes for a smart antenna. Proceedings of the 31stConference on Decision and Control, (Tucson, AZ), AIAA, Washington, DC, 1992; 1815–1820.
18. Dosch JJ, Leo DJ, Inman DJ. Modeling and control for vibration suppression of a flexible active structure. Journalof Guidance, Control and Dynamics 1995; 18(2):340–346.
19. Agrawal BN, Bang H. Active vibration control of flexible space structures by using piezoelectric sensors andactuators. Vibration and Control of Mechanical Systems 1993; 61:169–179.
20. Baz A, Poh S. Optimal vibration control with modal positive position feedback. Optimal Control Applications andMethods 1996; 17:141–149.
21. Friswell MI, Inman DJ. The relationship between positive position feedback and output feedback controllers. SmartMaterials and Structures 1999; 8:285–291.
22. Song G, Schmidt SP, Agrawal BN. Active vibration suppression of a flexible structure using smart material andmodular control patch. Proceedings of the Institution of Mechanical Engineers 2000; 214 G:217–229.
23. Ljung L. System Identification Theory for the User (2nd edn), Prentice Hall, NJ, 1999.24. System Identification, MATLAB User’s Guide Version 5, The Mathworks Inc., Natick, MA, 2000.
Copyright # 2005 John Wiley & Sons, Ltd. Struct. Control Health Monit. 2006; 13:868–884
V. SETHI, G. SONG AND P. QIAO884