Embed Size (px)
Citation preview

~ ' ? . . ' r l i - ~-
- - I I , - .
Final Letter Repor r* <-> I ' i J - " .
" * , * ~ I -
Design and Demonstration of an Analysis Information System for Magnetic Flux Leakage Inspection
of Natural Gas Pipeline
, - - October 1996-
' -
I
I L
-- DOE Office of Energy Research
Laboratory Technology Research Program
" I *
PacificL Noj-thwest.Natjoqal, ,I&oratory Richland, Washington 99352
- -


PNNL-11388 uc-900
Final Project Report
Staff Exchange with The Gas Research Institute and Pacific Northwest National Laboratory Design and Demonstration of an Analysis Information System for Magnetic Flux Inspection of Natural Gas Pipeline
G.J. Schuster B.A. Saffell
October 1996
Prepared for U.S. Department of Energy under Contract DEAC06-76RLO
Pacific Northwest National Laboratory Operated for the U.S. Department of Energy by Battelle

DXSCLAIMER
Portions of this document may be illegible in electronic image products. h a g s are produced from the best available original document.

Design and Demonstration of an Analysis Information System for Magnetic Flux Leakage Inspection of Natural Gas Pipeline
A staff exchange was conducted for the mutual benefit of the Department of Energy, the Gas Research Institute (GRI), Vetco Pipeline Services Inc. (VPSI), and the Pacific Northwest National Laboratory. This staff exchange provided direct exposure by a Laboratory staff member knowledgeable in inspection, integrity assessment, and robotic capabilities of the Laboratory to the needs of the natural gas pipeline industry. The project included an assignment to the GRI Pipeline Simulation Facility (PSF) during the period preceding the commissioning of the flow loop.
GRI is interested in exploiting advanced technology at the National Laboratories. To provide a sense of the market impact, it is estimated that $3 billion was spent in 1993 for the repair, renovation, and replacement of distribution piping. GRI has goals of saving the distribution industry $500 million in Operations and Maintenance costs and having an additional $250M savings impact on transmission pipelines.
PURPOSE/OBJECTIVES
The objectives of the project included:
For PNNL staff to present technology to GRI and PSF staff on non-destructive evaluation, robotics, ground penetrating radar, and risk based inspection guidelines for application to the operation and maintenance of natural gas pipelines.
For GRI and PSF staff to discuss with PNNL staff opportunities for improving the industrial competitiveness of operation and maintenance services.
To explore the basis for partnership with GRI and PSF staff on technology transfer topics.
SUMMARY OF ACTIVITIES PERFORMED
In this project, staff exchanges were conducted to GRI’s Pipeline Simulation Facility and to VPSI. PNNL staff had access to the $10M GRI Pipeline Simulation Facility (PSF) at West Jefferson, Ohio. The facility has a 4,700-ft. long pipe loop, an NDE laboratory, and a data analysis laboratory. Its mission is to help the gas utilities maintain their transmission and distribution systems. PNNL staff had access to the VPSI’s facility in Houston, TX. VPSI has developed some of the most sophisticated inspection tools currently used in the pipeline inspection industry.
1

Activities at the PSF
The first portion of the staff exchange was conducted at the PSF. Meetings were held with PSF staff to discuss opportunities for technology transfer. The operation of the PSF was observed and interactions with two vendors of pipe line inspection services were accomplished. The discussion of technology transfer identified the following specific industry needs.
During the first quarter of this project, the partnership was. established with the PSF staff and a list of 13 technology transfer topics were identified. These topics were presented to PNNL
staff in a 3 part informal lectures series. The technology transfer topics considered for the staff exchange where:
On-Line Management of Analysis Rules. The on-line management of the analysis rules included design of a tool for connecting the rules, changes to the rules, and exceptions to the rules to a data base. It includes the design of the tool to connect the rules to images (data). It includes the design of the tool to generate play-back of data analysis.
Prompt NDE Data Analysis. One of the problems that industry faces in the use of inspection data is the lengthy period of time required to analyze the data and produce a report to the customer.
Shape Based NDE Data Compression. NDE examinations generate large quantities of data. Pipeline inspection tools must save all of the inspection data in the tool’s recording system until the tool is retrieved from the pipe.
Information System for collaborating on MFL inspections of natural gas pipeline. This includes a survey of vendors to determine what they would like to receive from an information system installed at the Pipeline Simulation Facility. It includes information from ASTM on their directions on procedures and other inspection requirement in pipeline. Other interested parties would also provide input. PNNL is interested in providing on line management tools for analysis rules.
Stress Measurements in Pipeline. One of the principle problems in transmission lines is stress corrosion cracking. A demonstrated method of stress measurement is needed.
Shape based characterization of Magnetic Flux Leakage Images. This work is very interesting but already underway at the PSF.
Non-Pigable Pipelines. This topic opens the possibility to robotic inspection tools that can cope with crossed tees and valve obstructions without interrupting product flow.
2

e
e
e
e
0
Risk Based Inspection Guidelines. This requires that the probabilities of pipe failure and the consequence of pipe failure be quantified. The reliability of NDE inspections of the pipeline are used with the probabilities and consequences to form the bases for inspection guidelines for pipelines.
Support for Use of EMATs. The significance of EMAT technology for natural gas pipeline arises from the need to measure stress corrosion cracks, a degradation mode that MFL is not sensitive to. EMATs are preferred over conventional ultrasonic transducers because they do not require liquid couplant.
UT Tool for Liquid Lines. This was suggested by PSF staff as way to build capability for UT applications to natural gas pipelines. The topic is not really applicable to this staff exchange with the GRI.
Review of How GRI Uses Neural Net Software. Suggested by PSF staff, the use of pattern matching for MFL indications could be structured within the "On-Line Management of Analysis Rules".
Plastic Pipe Locator. Suggested by GRI, this topic is of major practical interest to natural gas utilities.
After this initial exchange, a series of informal presentations were conducted at PNNL for the purpose of selecting and rank ordering our best possibilities for contributing to the PSF. Based on the recommendations of PNNL staff, white papers were prepared on "On-Line Management of Inspection Data Analysis Rules", "Information Center fqr the Pipeline Simulation Facility", and "Application of Risk Based Methods to Inspection of Natural Gas Pipeline". A fourth topic was prepared in outline form: "Review of the Application of Neural Net Software to Magnetic Flux Leakage Indications". These papers were reviewed by PSF staff and forwarded to the Gas Research Institute.
Activities at the Gas Research Institute ~
A trip was conducted to the Gas Research Institute. The meeting was held with GRI and PSF staff to discuss opportunities for partnership with PNNL. We described the initiation of the staff exchange at the Pipeline Simulation Facility. At this meeting, we explored the use of the staff exchange process to generate opportunities for PNNL to understand natural gas industries issues and needs; transfer technology and experience to GRI; and develop the basis for further cooperation through CRADAs or other mechanisms.
The primary purpose of the visit to Gas Research Institute was to identify candidate topics, one of which was recommended to GRI as the focus for the staff exchange. The topics were:
On-Line Management of Inspection Data Analysis Rules
Information Center for the Pipeline Simulation Facility
3

Application of Risk-Based Methods to Inspection of Natural Gas Pipelines
Review of the Application of Neural Net Software to Magnetic Flux Leakage Indications.
Three short white papers were provided in advance of the meeting for the purpose of providing some,needed background and defining some terminology. The fourth topic was not fully developed and was presented in outline form for discussion purposes.
We recommend to GRI that the focus of the staff exchange be On-Line Management of Inspection Data Analysis Rules. Our intent as the scope of the staff exchange was to develop (a) the logic and approach for implementation for management of data analysis rules and (b) a detailed program plan for the implementation of the process. We proposed to GRI that the program plan would be basis for a follow-on "quick response" CRADA to actually implement the necessary logic using open data developed as part of the GRI program. We suggested that a demonstration of the process using "open" data would stimulate inspection vendors to implement this process into their systems.
GRI did not think that there was enough open data to develop our proposed analysis system. However, at GRI's recommendation, we agreed to approach VETCO Pipeline Services to determine their interest in our concept.
In preparation for the staff exchange with Vetco Pipeline Service Inc. (VPSI) a set of viewgraphs were prepared describing our proposed technology transfer topic. A review of the staff exchange was conducted with staff from VETCO at the dedication of the Pipeline Simulation Facility. The topic for the technology transfer, the design and demonstration of an analysis information system for magnetic flux leakage inspection of natural gas pipeline, was favorably received by the vendor and plans were made to start the staff exchange at the vendor's facility in Houston, Texas.
Activities at VETCO Pipeline Services
The staff exchange to VPSI was conducted in two parts. In the first half, the objectives of the technology transfer topic were discussed and Laboratory staff spent one week with the data analysis team at VPSI. In the second half of the staff exchange to VPSI, a demonstration of the technology transfer topic was conducted by the Laboratory and a plan was put forward for a proposal to GRI to fund the development of the Magnetic Flux Leakage Analysis Information System (MFL-AIS).
The objective of the proposed system was discussed at VPSI and it was agreed that the on- line management of data analysis rules can provide an effective means of both lowering cost and protecting the quality of the analysis by recording the interpretation methodology.
4
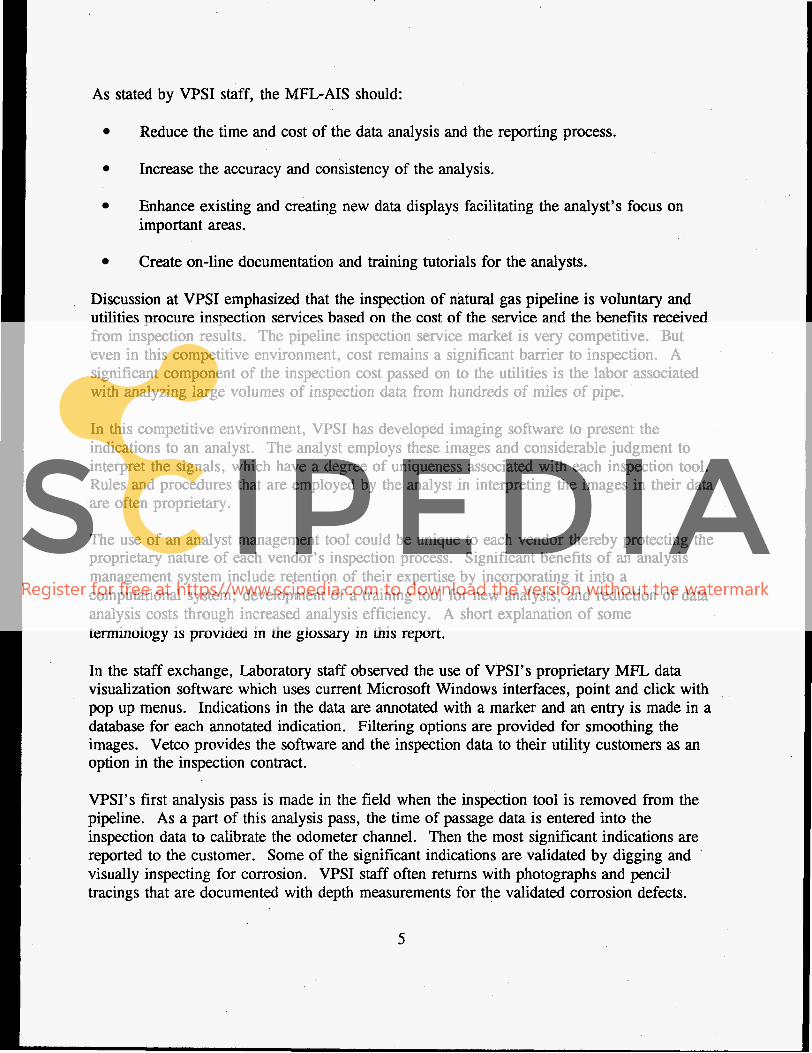
As stated by VPSI staff, the MFL-AIS should:
Reduce the time and cost of the data analysis and the reporting process.
Increase the accuracy and consistency of the analysis.
Enhance existing and creating new data displays facilitating the analyst’s focus on important areas.
Create on-line documentation and training tutorials for the analysts.
Discussion at VPSI emphasized that the inspection of natural gas pipeline is voluntary and utilities procure inspection services based on the cost of the service and the benefits received from inspection results. The pipeline inspection service market is very competitive. But even in this competitive environment, cost remains a significant barrier to inspection. A significant component of the inspection cost passed on to the utilities is the labor associated with analyzing large volumes of inspection data from hundreds of miles of pipe.
In this competitive environment, VPSI has developed imaging software to present the indications to an analyst. The analyst employs these images and considerable judgment to interpret the signals, which have a degree of uniqueness associated with each inspection tool. Rules and procedures that are employed by the analyst in interpreting the images in their data are often proprietary.
The use of an analyst management tool could be unique to each vendor thereby protecting the proprietary nature of each vendor’s inspection process. Significant benefits of an analysis management system include retention of their expertise by incorporating it into a computational system; development of a training tool for new analysts, and reduction of data analysis costs through increased analysis efficiency. A short explanation of some terminology is provided in the glossary in this report.
In the staff exchange, Laboratory staff observed the use of VPSI’s proprietary MFL data visualization software which uses current Microsoft Windows interfaces, point and click with pop up menus. Indications in the data are annotated with a marker and an entry is made in a database for each annotated indication. Filtering options are provided for smoothing the images. Vetco provides the software and the inspection data to their utility customers as an option in the inspection contract.
VPSI’s first analysis pass is made in the field when the inspection tool is removed from the pipeline. As a part of this analysis pass, the time of passage data is entered into the inspection data to calibrate the odometer channel. Then the most significant indications are reported to the customer. Some of the significant indications are validated by digging and .
visually inspecting for corrosion. VPSI staff often returns with photographs and pencil tracings that are documented with depth measurements for the validated corrosion defects.
5
VPSI has a number of loyal customers that have specific reporting requirements. The utilities exercise considerable freedom of selection. A number of human factors contributes the cost of data analysis. These factors include the repetitive nature of the analysis work, the level of proficiency with computer methods, and the large dedicated staff of 8 to 12 people working in the analysis and reporting group.
The analog recording systems in the older inspection tools are gradually being phased out in favor of digital systems as the inspection business permits. VPSI has both deformation tools and MFL tools. These tools are further broken down into high resolution tools (those that permit dense spatial sampling) and low resolution tools. The analysis group deals with the data from these tools using separate analysis protocols. The high resolution MFL tools produce data that the analysis can more fully characterize based on dense sampling of the indications.
For the high resolution MFL tool, the analysts report the depth, length, and width of corrosion indications and use this characterization to estimate the maximum operating pressure for the pipeline. This is one of the principle reasons. to use the high resolution MFL tool. The data visualization software obtained in the field confirms the on-line sizing algorithm for the larger diameter pipe. Manual sizing using the image of the indication is required, at present, for smaller diameter plus.
The data visualization software also contains indications types for the non-flawed features of the data. The indication types include girth weld, mill work, metal in close proximity, flange, value, tee, etc. In addition, an ID/OD channel provides information on whether the indication is located on the inside of the pipe or on the outside. Software is used to manage the characterized indications for reporting to the customer.
A considerable portion of the analysis effort is in the characterization of the non-flaw indications. This quality control activity is more important to VPSI’s customers than the small (less than 10%) corrosion indications. The large number of non-flaw indications often determine the cost of the analysis. Part of the reason for this is the written records must be examined as a part of the analysis task. The written records must be examined as a part of the analysis task. The written records include a table of known locations for valves, tees, etc. and engineering drawings of the pipeline (plan view). Progress is being made in automatic annotation of the data in that the girth welds are all characterized automatically and the reviewed by the analyst using the image of the inspection data.
VPSI has a local area network (LAN) and the inspection data is managed on the file server and the same inspection data can be accessed by more than one analyst at the same time. The server had 32 GBytes of disk space to hold the inspection data of interest and writable CD disks (640 MBytes) are used to archive the data.
6

Laboratory staff explained to VPSI our experience in developing analysis rules facilitating the interpretation of large ultrasonic data sets is transferable to magnetic flux leakage data sets. We have developed and tested an analysis capability for detecting, sizing, and documenting 4000 indications in a large data base (50 GBytes) of ultrasonic inspections of fabrication defects in steel components. In analysis problems of this kind, the documentation of one characterized indication can require more than one hour of time from a trained analyst. In ultrasonic testing, the analysis rules vary with each ultrasonic inspection mode and exceptions to the rules are often required. Our approach is to allow the analyst the greatest freedom in producing a repeatable consistent record of the analysis.
Analysis rules in NDE for the detection and characterization of flaws are useful on the portions of inspection data that contain recognizable patterns. Analysis rules describe these patterns and specify criteria for detection and the methods for sizing in different cases.
Of course, the rules for the analysis of MFL data and UT data are different. In fact, the rules for analyzing MFL data differ from vendor to vendor, inspection tool to inspection tool, pipeline to pipeline. Still, considerable similarities arise in the analysis of data from these inspection methods, at least for smart (automated) systems, from the use of computer- generated images for detection and characterization of flaws.
The shape of an NDE indication in a computer-generated image is a powerful method of detecting and characterizing inspection data. The shape of an NDE indication usually arises from both the shape of the flaw and the properties of the inspection systems. An analysis rule might state that image shapes of a given type are detectable as flaws when the geometry of the material does not interfere. Shape-based analysis rules use this kind of image data to detect and size indications in the presence of systematic noise.
Desipn and Demonstration of an MFLAIS
A demonstration of the concept of the MFL-AIS was conducted at VPSI. The demonstration was attended by VPSI staff and staff from the PSF facility. A description of the demonstration and the explanation of the MFL-AIS design is presented in the Appendix of this report.
SIGNIFICANT ACCOMPLISHMENTS
The significant accomplishments of the staff exchange were the development of PNNL’s understanding of industry needs, industry’s understanding of the national laboratory’s capability, and a better understanding of analysis information management on everyone’s
Part*
7

SIGNIFICANT PROBLEMS
A number of problems were encountered in the staff exchange. Most of the problems related to lack of understanding of computer methods on the part of PSF staff and these problems were mitigated for the most part by the demonstration conducted at VETCO.
One significant problem remained. The recommendation for follow on work on the development of the MFL-AIS was for an application that could be used by natural gas utilities with their other pipeline data. This recommendation is described below. PNNL would have a lead role in the development of this software application and Laboratory staff could use more experience in how natural gas utilities use inspection data. A follow-on staff exchange to a natural gas utility that uses MFL inspections would be very helpful.
INDUSTRY BENEFITS REALIZED
A letter proposal has been submitted to the Gas Research Institute by VPSI and PNNL for the development of the MFL-AIS. VPSI management staff is interested in the MFL-AIS because prompt analysis will solve problems with the analysis and reporting backlog. Analysis staff at VPSI are interested because the analysis product will be improved. It is estimated that 40% of the cost of performing MFL inspection is in the analysis and reporting activities.
RECOMMENDED FOLLOW ON WORK
In a discussion after the demonstration, VPSI and PSF staff recommended that we seek GRI funding for this activity as an application for GRI's Integrated Spatial Analysis Techniques (ISAT) program. ISAT is GRI's "smart map" software system for the natural gas industry by which data can be accessed, displayed, and manipulated to allow more effective and efficient management of pipeline information. GIU has funded the development of the core data base driver for the ISAT system.
Using this approach, the MFL-AIS becomes a stand-alone application which will integrate inspection data or reports and format that data such that it can be passed to the ISAT data base driver. The application will have data display capability such that the raw inspection data can be viewed in a convenient format. The system can contain the MFL-AIS which will allow the pipeline operator to better manage his own pipeline system. The application will format the inspection data in such a way that it will integrate into ISAT so that survey and geographical information can be linked with the inspection data.
The deliverable would be all software necessary to integrate inspection data into the ISAT system; to display and manipulate that data and to link into other pipeline data to provide mode effective management of natural gas pipelines.
8

POTENTIAL BENEFITS FROM PURSUING FOLLOW-ON WORK
The integrity of natural gas pipeline can be advanced by increasing the efficiency of inspection. The on-line management of data analysis rules can provide an effective means of both lowering cost and protecting the quality of the analysis by recording the interpretation of the data from the pipeline inspection.

APPENDIX A: DEVELOPMENT PLAN FOR AN MFL-AIS

The design prepared during the staff exchange to VPSI, as described below, prepares the MFL-AIS and installs the features necessary for rule definition in the first phase of a follow on project. The rules will be composed of those used in the existing customer driven analysis business. The MFL-AIS is designed to not interfere with the current analysis process which is both effective and proprietary. Rather, we require that this proposed activity provide additional efficiency to the inspection business on a quarterly or semi-annual basis. The general principle of on-line rule statements expressed by way of example and rule building apparatus is the subject of PNNL’s technology transfer in the first phase.
Analysis rule statements on computer with connection to an example library. Rules are defined by comparison of typical image(s) from the example library with text or voice explanation. Playback of rule application(s) or a recording.
Exception Library on computer with connection to the analysis rules. This is part of the rule building apparatus. No requirement for rules exceptions to be empty.
Indication library on computer. Connection of the indication library to rule statements and connection of the vendor image tool to the rule statements are provided. Confidence factor is manually entered for control of connection to the rules.
Flaw Libraries on computer. Field validation of corrosion moves MFL indications into the flaw library. Visual images of confirmed corrosion are available here.
Other features: Replay an analysis verbatim. Macro bdilding from the manual analysis .
In the second phase of this technology transfer we propose to establish the connections to advanced computer methods in pattern matching, digital signal filtering, and other advanced methods to implement the efficient application of vendor analysis rules. In this step, the analyst gains the ability to extract an additional level of detail from the inspection data gaining the ability to query the greater information at her disposal.
Pattern matching for prompt rule decision. Possible when the indication library is properly built. Connection to advanced software is provided.
Filtering and digital processing algorithms for connection to rule statements.
Rule statements produce resultant images from the application of the rule and rules always have a manual override capability.
A- 1
All rule statements have an option for immediate application and determination. A
second analysis pass can easily modify or nullify any portion of the analysis.
Rule statements can automatically assign confidence factor.
Rules are connected into procedures. Analysis is repeatable and consistent. Analysis can be done promptly. Analysis can be run (or rerun) unattended. Sensitivity studies are possible.
In the third phase of the technology transfer we add the feedback required to adjust the analysis rules based on the review of the final report by the analysis team. In this year we will incorporate the physical basis for the analysis to the extent that the inspection business warrants. Feedback features are important because they will provide the most efficient means of growing the rule statements which are the principle resource of the analysis information system. The procedure, that is how the rules are connected, will not be modified by the feedback mechanism since the procedure will be easy to change. The physical basis methods will be important because they will provide a means of connecting the analysis to the inspection tool design efforts.
The results are connected to the rule statements in order to show which rules are affected by manual changes in the results.
Feedback of the results into rule statements. Manual changes in the analysis results can change the rule parameters (probably not change the procedure). Can cause retraining of neural nets.
Field validation of corrosion and the flaw library are used in the calculation of confidence factors for indications.
A computerized demonstration of the MFL-AIS was conducted at VPSI during the last portion of the staff exchange there. Figures 1 through 5 show the computer displays generated in the demonstration that was conducted during the staff exchange to VPSI. These figures help explain some of the essential features of the MFL-AIS. These features include rule statements expressed by way of example, rules statements expressed in algebraic form, examples of validated indications, and an example of a characterized indication in the MFL- AIS, The demonstration also contained data animations to emphasize the rule statements and point and click sequences were provided to demonstrate the utility of the MFL-AIS.
I
A-2

Figure 1 shows an example of an on-line rule statement in the MFL-AIS. The bottom of the figure gives the rule statement: an indication is detectable as a TAP when the upstream edge
of the indication goes negative. The data image displayed in the figure enhances the text statement by providing a reference for degree to which the indication should go negative. In the demonstration, data animation was provided that removed and restored the negative portion for emphasis. This figure shows the display at the most negative part of the animation.
RULE STATEMENT z
x-Y
10.00
5.00
Z
0.00
-3.0 < X C 3.0 -3.0 C Y < 3.0 -4.4 z c 9.9
,- u. vu 2.00 *.OO flow
circumference
Rule Statement: An Indication is detectable as a TAP when the upstream edge of the
indication goes negative
Figure 1. A Rule Statement Expressed by Way of Example.
A-3

Figure 2 shows an example of an on-line algebraic rule statement in the MFL-AIS. The bottom of the figure gives the rule statement: an indication is detectable as a TAP when the upstream edge of the indication goes negative by more than 10% of m a , as possible TAP when more than 5%, and otherwise not a TAP. In the demonstration, data animation was provided that removed and restored the negative portion for emphasis and this figure shows the display at the least negative part of the animation.
2
x-y
-3.0 X c 3.0 3.0 Y < 3.0
-3.3 z < 9.8
RULE STATEMENT
circumference
Rule Statement: An Indication is detectable as a TAP when the upstream edge of the indication goes negative by more than 10Y0 of m a . and as POSSIBLE TAP when more than 5%. Otherwise indication is NOT TAP.
Figure 2. An Algebraic Rule Statement
A-4
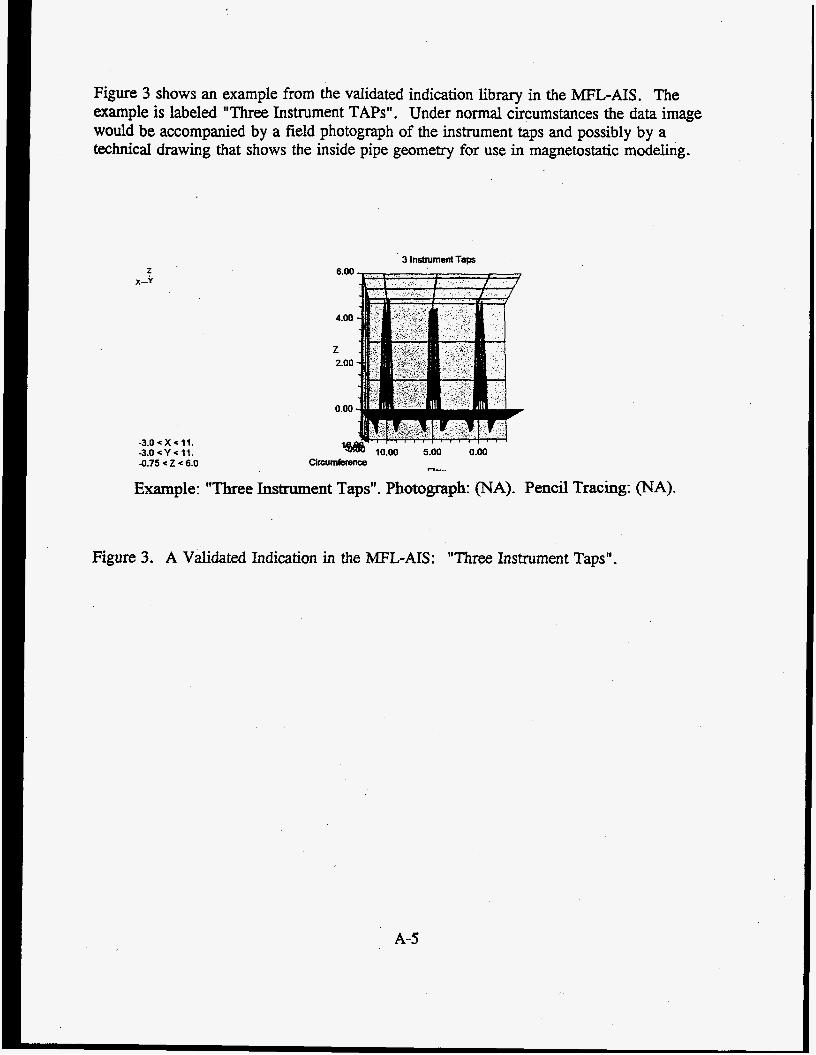
Figure 3 shows an example from the validated indication library in the MFL-AIS. The example is labeled "Three Instrument TAPS". Under normal circumstances the data image would be accompanied by a field photograph of the instrument taps and possibly by a technical drawing that shows the inside pipe geometry for use in magnetostatic modeling.
z X--u
3 IMment Taps
3.0 x < 11. 3.0 Y 11. 4.75 c 2 e 6.0
m-... Clrcum(ecence
Example: "Three Instrument Taps". Photograph: (NA). Pencil Tracing: (NA).
Figure 3. A Validated Indication in the MFL-AIS: "Three Instrument Taps".
A-5

Figure 4 shows an example of corrosion from the validated indication library in the MFL- A I S . The example is labeled "Three Corrosion Pits". Under normal circumstances the data image would be accompanied by a field photograph of the corrosion and/or by a pencil tracing of the corrosion. These confirmations are sometimes obtained by exposing suspect locations of the pipe after the inspection. The Polaroid photographs and pencil tracings are annotated to show the metal loss for use in comparison to the signal values or for use in magnetostatic modeling.
-3.0 X 4.0 3.0 < Y < 4.0 -1 .s < 2 < 12.
3 Conosiin Pis
10.00
a00
0.00
Chcumference
Example: "Three Corrosion Pits". Photograph: (NA). Pencil Tracing: (NA).
Figure 4. Another Example of a Validated Indication for the MFL-AIS: "Three Corrosion Pits".
A-6

Figure 5 shows the characterization process for a new indication in the MFL-AIS. The rule statement &at was applied to the indication is attached the data analysis record with the
decision that was made in the characterization.
3 Instrument Taps
6.00
4.00
2
2.00
0.00
-3.0 X < 11. - 3 . O C Y < l l .
-0.75 2 c 6.0
Position: X: 4.808 Y: 0.078
Rule Statement: An MFL indication is detectable as a TAP when the upstream
Characterization: TAP (Tap, Possible Tap, Not Tap) edge of the indication goes negative.
Figure 5. An Example of the Characterization Process.
A-7

Glossary
Analysis rule. An analysis rules is a statement that when applied to a selected NDE indication gives a decision or result. A decision, for example, might be that an indication is not detectable as a flaw.
Analysis procedure. Analysis procedures connect the analysis rules to the data and to other analysis rules. Procedures govern, for example, the order in which rules are applied.
On-line. Information is said to be on-line when it is present in computer memory or stored to disk for immediate retrieval into computer memory.

PNNL-11388 uc-900
Distribution
No. of Copies
Offsite
Ted Vojnovich Technical Program Manager Office of Computational and Technology Research Laboratory Technology Research Division U.S. Department of Energy Room G434 (ER-32) 19901 Germantown Road Germantown, Maryland 20874
No. of Copies
Onsite
DOE/Richland Operations Office
NL Hieb K8-50
12 Pacific Northwest National Laboratory
BJ Harrer (2) K9-2 1 BF Saffell (3) K5-22 GJ Schuster (3) K5-26 Information Release Office (7)
Distri. 1
![Engineering Structures Magnetic flux leakage technique to ......the flux leakage is measured using sensors, such as the Hall-effect sensor or coil sensor [11]. MFL methods can be classified](https://img.pdfslide.us/doc/110x75/5e8720708ea5393b014a2164/engineering-structures-magnetic-flux-leakage-technique-to-the-flux-leakage.jpg)