Embed Size (px)
Citation preview

16. Technology, Innovation and Supply Chain Management
Competitive Session
System Dynamics Modelling for Stakeholder Management
Dr Arun Elias
School of Management, Victoria University of Wellington, New Zealand
Email: [email protected]
Page 1 of 24 ANZAM 2014
16. Technology, Innovation and Supply Chain Management Competitive Session
System Dynamics Modelling for Stakeholder Management
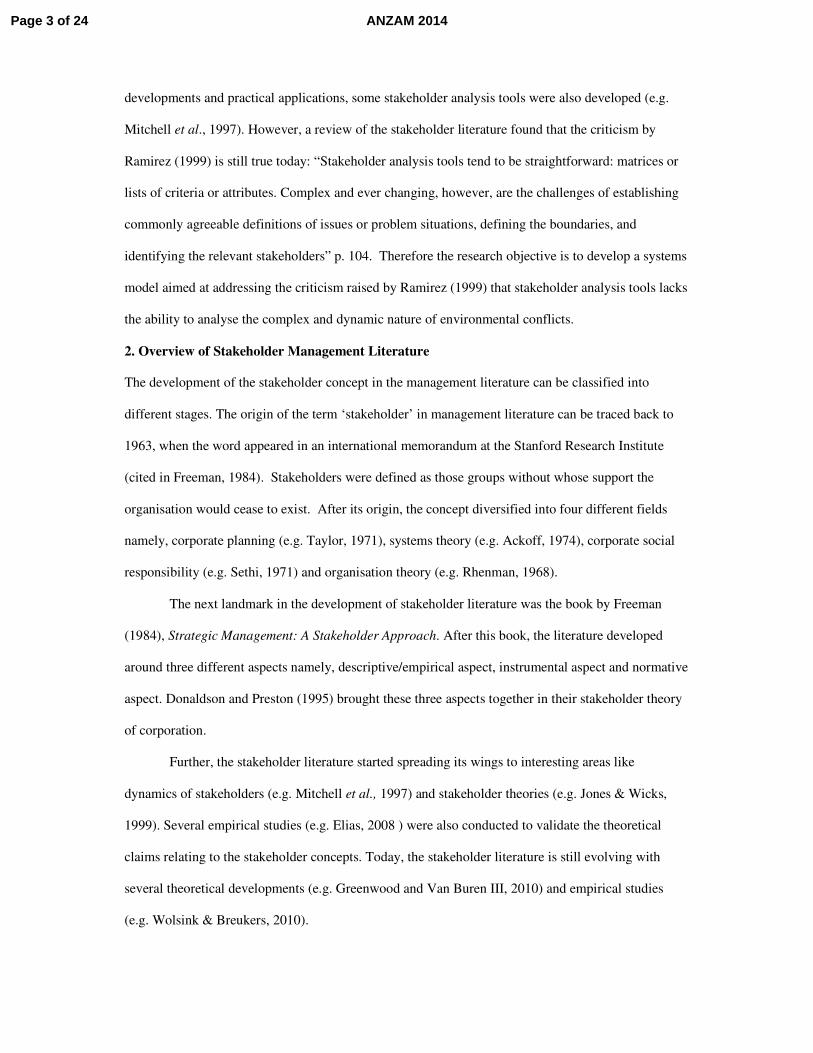
ABSTRACT: This article presents a system dynamics model for stakeholder management in
complex projects. The model development is illustrated using a case related to a complex New
Zealand transport infrastructure project. Experiments conducted using the model showed that
although the proposed transport project is capable of reducing traffic congestion in the short term, it
will not serve the purpose in the long term. Policy experiments conducted using the model revealed
that policies aimed at reducing traffic congestion could also reduce the conflict between stakeholders;
however, they showed some unintended consequences in the system which highlighted the complexity
of the problem situation.
Keywords: System Dynamics, Project Management, Stakeholder Management
1. Introduction
There is an increasingly common argument in the environmental management literature that much of
the environmental and resource management is the management of conflict (Mitchell, 2010). Such
conflict can exist between different users and uses of a resource, between the users of a resource and
those who would conserve it, and between decision-makers and those who want more of a say in
those decisions (Jackson, 2001). Most of these stakeholder conflicts relate to disputes or conflicts
pertaining to the environment, public lands, or natural resources.
Large scale development projects are examples of stakeholder conflicts where differing
perspectives of multiple stakeholders present a challenge to the managers. These projects usually
occur over relatively long time horizons and when they are in the public domain, the stakeholders of
the project feel that they have a right to be involved in the decision process, because they will be
affected by the ultimate policy choice (Gregory and Keeney, 1994). In such projects it is important to
identify and analyse the positions and interests of stakeholders involved in it. Managing this situation
demands the application of specialist knowledge, skills, tools and techniques for stakeholder analysis.
In his classic book Strategic Management: A Stakeholder Approach, Freeman (1984) defines
stakeholders as any group or individual who can affect or is affected by the achievement of the firm’s
objectives. Twenty six years since Freeman’s work, stakeholder theory has been applied to issues
ranging from organisational restructuring to wildlife management, from R&D management to
watershed management and from business ethics to logistics management. Along with theoretical
Page 2 of 24ANZAM 2014
developments and practical applications, some stakeholder analysis tools were also developed (e.g.
Mitchell et al., 1997). However, a review of the stakeholder literature found that the criticism by
Ramirez (1999) is still true today: “Stakeholder analysis tools tend to be straightforward: matrices or
lists of criteria or attributes. Complex and ever changing, however, are the challenges of establishing
commonly agreeable definitions of issues or problem situations, defining the boundaries, and
identifying the relevant stakeholders” p. 104. Therefore the research objective is to develop a systems
model aimed at addressing the criticism raised by Ramirez (1999) that stakeholder analysis tools lacks
the ability to analyse the complex and dynamic nature of environmental conflicts.
2. Overview of Stakeholder Management Literature
The development of the stakeholder concept in the management literature can be classified into
different stages. The origin of the term ‘stakeholder’ in management literature can be traced back to
1963, when the word appeared in an international memorandum at the Stanford Research Institute
(cited in Freeman, 1984). Stakeholders were defined as those groups without whose support the
organisation would cease to exist. After its origin, the concept diversified into four different fields
namely, corporate planning (e.g. Taylor, 1971), systems theory (e.g. Ackoff, 1974), corporate social
responsibility (e.g. Sethi, 1971) and organisation theory (e.g. Rhenman, 1968).
The next landmark in the development of stakeholder literature was the book by Freeman
(1984), Strategic Management: A Stakeholder Approach. After this book, the literature developed
around three different aspects namely, descriptive/empirical aspect, instrumental aspect and normative
aspect. Donaldson and Preston (1995) brought these three aspects together in their stakeholder theory
of corporation.
Further, the stakeholder literature started spreading its wings to interesting areas like
dynamics of stakeholders (e.g. Mitchell et al., 1997) and stakeholder theories (e.g. Jones & Wicks,
1999). Several empirical studies (e.g. Elias, 2008 ) were also conducted to validate the theoretical
claims relating to the stakeholder concepts. Today, the stakeholder literature is still evolving with
several theoretical developments (e.g. Greenwood and Van Buren III, 2010) and empirical studies
(e.g. Wolsink & Breukers, 2010).
Page 3 of 24 ANZAM 2014
2.1 Tools for Stakeholder Analysis
Experts have developed several tools for stakeholder analysis. Initially, some of the prominent
stakeholder analysis tools came from the field of strategic management. For example, Freeman (1984)
himself contributed a stakeholder analysis framework consisting of rational, process and transactional
level analysis. Johnson et al. (2008) popularised a stakeholder mapping tool using a power – interest
matrix that was developed by Mendelow (1991) for assessing the acceptability of strategic options.
Mitchell et al. (1997) developed a strategic model to analyse the salience of stakeholders based on the
attributes of power, legitimacy and urgency.
Further development of stakeholder analysis tools can be traced to a variety of literature
streams. For example, in project management literature, a stakeholder analysis tool called ‘stakeholder
circle’ (Bourne and Walker, 2005) was used to map and visualise, stakeholder power and influence. In
systems thinking literature, a stakeholder analysis tool called ‘rapid stakeholder and conflict
assessment’ based on cognitive mapping was used (Hjortso et al., 2005). This literature also provides
examples for stakeholder analysis that used soft systems methodology, a methodology developed by
Peter Checkland for system redesign (Checkland, 1981) and viable systems model, a generic model of
a viable organisation based on cybernetic principles developed by Stafford Beer (Simmons et al.,
2005). Some stakeholder analysis tools are also available in other literature streams like business
ethics (e.g. Vandekerckhove and Dentchev, 2005).
In addition to these basic methods, authors in this literature have also used more advanced
tools for analysing stakeholders. Wolsink and Breukers (2010) used the Q methodology, which
applies inverted factor analysis to reveal rationales, narratives or perspectives so as to systematically
compare the patterns in stakeholder views. Memon and Wilson (2007) used the concept of
‘governance’ and the related notion of multi-layered forest management decision making as an
overarching framework for analysis of conflict between different stakeholder groups with contrasting
perceptions about ‘appropriate’ use of indigenous forests. Finn et al. (2009) used multi-criteria
analysis techniques to weight the relative importance of different environmental objectives and to
compare the degree to which environmental effectiveness was achieved. Holz et al. (2006) grouped
the ‘multi-criteria decision management’ tool into three approaches namely weighting criteria,
Page 4 of 24ANZAM 2014

aspirational methods and holistic evaluation. They introduced a new aspirational tool referred to as
Target Ordering, which explores preferences through criteria targets rather than applying a weight to
the criteria themselves. Lange and Hehl-Lange (2005)
introduced a virtual landscape model during a
participatory planning workshop involving different stakeholders. During this workshop different
alternatives were discussed, and changes suggested by the stakeholders were incorporated in this 3D
model, resulting in better visualization and communication among different stakeholder groups.
Most of the stakeholder analysis tools available in the management literature tend to be
simplistic and straightforward. This issue was highlighted by Ramirez (1999) who felt the need for
stakeholder analysis tools which are capable of analysing complex and dynamic problem situations
related to stakeholder conflicts. This research project tries to address this gap by developing a systems
model for analysing a complex and dynamic problem situation related to a transport infrastructure
project in New Zealand.
3. Methodological Framework
The methodological framework used in this study is based on the system dynamics methodology.
System dynamics was developed in the second half of the 1950s by Jay Forrester and his seminal
book, Industrial Dynamics, continues to be a significant statement of philosophy in this field.
System dynamics is a methodology for studying and managing complex systems involving
multiple relationships, interdependencies and feedback, such as one finds in business and other social
systems, through the development of representational models that can be used to reflect aspects of
reality. Then, just as an airline uses flight simulators to help pilots learn to fly in different
environmental conditions, system dynamics methodology can be directed to developing management
flight simulators, often computer simulation models, to help learn about dynamic complexity, in
general, and to understand the sources of policy resistance, and design more effective policies in
particular. System dynamics has been applied to issues ranging from corporate strategy to the
dynamics of diabetes, from the cold war arms race between USSR and US, to the “combat” between
HIV and the human immune system (Sterman, 2000).
In this study, prior to the development of the system dynamics model two preliminary phases
were completed. In the first phase the problem was structured using an 8 step stakeholder analysis
Page 5 of 24 ANZAM 2014

(first step of stakeholder map is presented in figure 1) and the development of a behaviour over time
graph (figure 2). In the second phase, a causal loop model (figure 3) was developed using a group
model building process (Vennix, 1996) involving key stakeholders. This article gives more emphasis
to the two phases that followed. These phases include the development of a system dynamics model
and the experiments conducted using the model (Table 1). [Insert Table 1–Methodological Framework here]
4. The Case Wellington’s Basin Bridge Project
Wellington’s Basin Reserve currently functions as a large roundabout with signals. The streets in this
area have several functions, and congestion is affecting State Highway 1 traffic, local traffic, freight,
pedestrians, cyclists and bus travel. The regional transport planners feel that if something is not done
now, things can get worse. Greater Wellington Regional Council, Wellington City Council and the
New Zealand transport agency (NZTA) have agreed that north-south traffic needs to be separated
from east-west traffic in this area, and following extensive investigations and community engagement,
the NZTA has made the decision to proceed with Basin bridge option: Option A. But this project is
quite complex since it affects different stakeholders in different ways and it presents an interesting
example of stakeholder conflict.
5. System Dynamics Modelling
In this phase, a dynamic model was developed using the ithink software (Richmond and Peterson,
1997). This model was based on the casual loop model presented in figure 3. It included the steps:
5.1 Defining Variable Types and Constructing a Stock-flow Diagram
The stock flow diagram developed in this research is presented in figure 5. The two stock variables in
the traffic sector were attractiveness of driving and Basin Bridge construction. Attractiveness of
driving represented the level of attractiveness of driving a car from Wellington to Kapiti coast with
and without the Basin Bridge. Basin Bridge construction was a dummy variable to model the fact that
once the Basin Bridge was constructed, it would remain there, even if the position of political
stakeholders or any other factors that contributed to its construction changed. In essence, the traffic
sector provided the values of some important traffic variables like travel time and traffic volume
between Wellington and Kapiti coast.
Page 6 of 24ANZAM 2014

In the interests of the community stakeholder sector all the variables were modelled as
auxiliary variables. Variables like traffic volume and travel time in the traffic sector were connected
to auxiliary variables like number of accidents per annum, annual accidents costs and annual travel
costs in this sector. In essence, this sector generated community costs as a summation of annual
accidents costs and annual travel time costs.
The interests of environmental stakeholder sector also used auxiliary variables only. Based on
the variables generated by the traffic sector like speed, travel time and traffic volume, this sector
modelled carbon dioxide emissions and fuel consumption. These variables were then converted into
dollar values to model annual fuel costs and annual carbon dioxide costs. Finally, the summation of
annual fuel costs and annual carbon dioxide costs was taken as environmental costs.
[Insert Figure 5 - Stock Flow Diagram about here]
The stakeholder positions sector modelled the changing positions of environmental,
community and political stakeholders of the Basin Bridge project. The positions of community and
environmental stakeholders were modelled as graphical functions and were affected by changes in
community costs and environmental costs respectively. The positions of environmental and
community stakeholders affected the position of political stakeholders and the position of political
stakeholders decided whether the Basin Bridge would go ahead or not, thus completing the overall
major feedback loop.
During the group model building session (section 5.2) the stakeholders generated 35 variables
belonging to 18 clusters. In the system dynamics model, however, some of these variables could not
be included due to lack of data. Also, the model boundary was drawn to include only those variables
capable of capturing the causal structure of the system. This causal structure was able to explain the
problem situation as shown in the Reference Mode (figure 2).
5.2 Developing a Simulation Model
In this step, all the variables in the stock flow diagram were provided with an equation. Based on the
system dynamics approach, stock variables were modelled as accumulations (e.g. Attractiveness of
driving = Attractiveness of driving (t - dt) + (-Change in attractiveness of driving)* dt), and rate
variables as changes to the stocks that occur during a time period (e.g. Change in attractiveness of
Page 7 of 24 ANZAM 2014

driving= (Travel time-desired travel time) * EXP (-0.2 *travel time)). In addition to this, the model
consists of auxiliary variables (e.g. Volume–capacity ratio=Traffic volume/actual highway capacity),
including graphical relationships.
The dimensional consistencies of these equations were checked so that it was possible to
convert the dimensions of the variables on the right-hand side of the equation to those on the left-hand
side. Also, all the equations in the model were documented.
5.3 Reproducing Reference Mode Behaviour
This step involved putting in provisional values for the parameters at first, to try and reproduce the
general pattern of the reference mode (behaviour over time of the main variables). When the reference
mode is reproduced, it is generally called the base case version (Figure 6) of the model (Maani and
Cavana, 2007). In this base case traffic volume, travel time and CO2 emissions are increasing, while
speed and attractiveness of driving are decreasing. This is similar to the behaviour of the variables
presented in the reference mode (figure 2). [Insert Figure 6 - Graphical Output of the Base Case about here]
5.4 Validating the Model
According to Forrester and Senge (1980), it is very important to build confidence among the users of
a model regarding its soundness and usefulness. Keeping this in mind, the base case version of the
model was subjected to a range of validation tests suggested by Coyle (1996).
5.5 Performing Sensitivity Tests
The system dynamics model developed in this research was subjected to sensitivity analysis. The goal
of sensitivity analysis was to learn if the basic pattern of results is sensitive to changes in the uncertain
parameters (Ford, 1999). The sensitivity analysis in this research involved varying most of the model
parameters and graphical relationships by plus or minus 10%. The results of this sensitivity analysis
identified the most sensitive parameters/graphical relationships in the model.
Overall, the model developed is a simulation model which is dynamic in nature. This model is
capable of capturing the dynamic interactions between different parts of this environmental conflict.
For example, any change in variables in the traffic sector is linked to the stakeholder interests sector,
which is further connected to stakeholder positions sector, which is in turn connected back to the
traffic sector. The model is also able to recreate the dynamic nature of the problem situation, as
Page 8 of 24ANZAM 2014

captured in the reference mode presented in figure 2. In addition, this model also captures the
complexity of the problem situation by incorporating several variables that affect the problem
situation, and by modelling the complex interrelationships and interdependencies between the
different parts of this environmental conflict.
6. Model Experimentation
In the last phase of this research project, experiments were conducted on the model using a
management flight simulator (Figure 6). The purpose of a management flight simulator is to provide a
user-friendly interface with computer model (Maani and Cavana, 2007).
[Insert Figure 6. The Basin Bridge Management Flight Simulator about here]
These experiments were conducted in two stages. In the first stage, the modeller conducted
experiments on the model. During this stage, three types of experiments were conducted, namely
testing the effect of the Basin Bridge bridge on the existing system, conducting policy experiments on
the model, and modelling some scenarios using the model. In the second stage, the model was taken
to the stakeholders for conducting the same experiments in their presence.
6.1 Effects of the Basin Bridge
The first experiment conducted on the model was to run the model with the Basin Bridge bridge to
understand the behaviour if this bridge became a reality. The graphical results of this experiment are
in figure 7. [Insert Figure 7. Model Run With Basin Bridge Option about here]
These results highlight some interesting projected patterns of behaviour, once the Basin
Bridge bridge was available for the motorists (year 5 in this case, allowing delays for its construction).
It showed that some of the congestion related variables (e.g. traffic volume) kept on increasing, even
with the introduction of this new bridge. Some variables like travel time decreased significantly once
the Basin Bridge was operational, but in the long term it was showing an increasing trend. Some other
variables like speed increased significantly once the Basin Bridge was available, but in the long term
it showed a decreasing trend. This experiment revealed that once the Basin Bridge bridge was a reality
it would ease traffic congestion significantly for a short while. However, in the long term the traffic
congestion would slowly return.
Page 9 of 24 ANZAM 2014
6.2 Effects of Car Pooling
The first policy experiment consisted of testing the effects of car-pooling, since the Wellington
Regional Council was trying to promote car-pooling. In this experiment, car occupancy was increased
from 1 to 5. Results of these experiments for model runs with and without the Basin Bridge bridge
were analysed in this study. Table 2 presents the results of these experiments without the bridge.
[Insert Table 2 - Effects of Car Pooling without Basin Bridge about here]
The results of the simulation runs without the Basin Bridge bridge showed a reduction in traffic
variables like volume capacity ratio (from 0.94 to 0.20) and travel time (from 28.4 to 15.7 minutes). It
also showed a decrease in the variables capturing stakeholder interests like carbon dioxide emissions,
fuel consumption and accidents per annum. From a ‘very supportive’ position, the position of
community stakeholders was becoming more neutral, since the impacts of congestion on community
were reducing. The environmental stakeholders also moved towards a neutral position from a very
opposed position.
Attractiveness of Driving
Although this experiment showed some positive effects on reducing congestion, it also highlighted an
interesting counter-intuitive behaviour emerging for the attractiveness of driving variable. When the
car occupancy factor was increased to a particular level (e.g. 3 in the model run without the Basin
Bridge bridge), so that congestion decreased significantly, the attractiveness of driving started to
increase. This behaviour, in turn, could increase congestion. This situation could be explained by
summing up the intentions of a group of powerful people in a Canadian city as shared by an
environmental expert: “Let us improve car-pooling and public transport of this city, so that people
will be attracted to these alternative transport means, and stop using their cars; so that we can drive
our cars comfortably” (L. Jackson, personal communication).
Thus, these results showed that, generally, car-pooling was quite effective in decreasing
traffic congestion, decreasing environmental and community stress due to traffic and in decreasing the
conflict between stakeholders. Other system dynamic researchers have also reported the usefulness of
car-pooling (e.g. Stave, 2002). So, in general these results supported the efforts of Wellington
Regional Council in promoting car-pooling.
Page 10 of 24ANZAM 2014

This policy experiment also raises the issue of increasing attractiveness of driving when car-
pooling is overdone. For the policy makers of the Wellington Regional Council, this presents a
challenge for maintaining a delicate balance between popularising car-pooling and controlling
congestion.
6.3 Effects of Public Transport Improvements
As the second set of policy experiments, the effects of public transport improvements in the
Wellington region were studied. Experiments were conducted by increasing the public transport
improvements from 1 to 5. To elaborate, a value of 2 for public transport improvement meant the
Wellington Regional Council increasing its public transport improvement efforts, including funding,
by two times; 3 means three times and so on.
The results of these experiments were similar to the results of the previous policy experiment
on car-pooling. They yield positive results, in terms of reducing congestion, decreasing accidents,
decreasing environmental stress and in moving the positions of community and environmental
stakeholders to a more neutral stand. However, as in the earlier policy experiment, the counter-
intuitive behaviour of increasing attractiveness of driving with increasing public transport
improvements was also visible clearly.
6.4 Scenario Analysis
The third type of experiments conducted in this phase involved a scenario analysis. This was
conducted using the following steps given in Schoemaker (1993): (i) Planning general scope of
scenarios; (ii) Identifying key drivers of change and keynote uncertainties; (iii) Constructing forced
scenarios; (iv) Checking for internal consistency, plausibility and credibility (v) Constructing learning
scenarios; and (vi) Simulating scenarios with the model.
The three learning scenarios constructed in this study were called: (a) Do Nothing; (b)
Cleaner Greener Aotearoa; and (c) Kapiti– Exploding with People and Cars. The results (Table 3)
showed that ‘Cleaner Greener Aotearoa’ scenario paints a glossy picture of many aspects related to
this environmental conflict. However, attractiveness of driving was an exception and its increase was
a concern. Nevertheless, if attractiveness of driving is controlled within reasonable limits, such a
Page 11 of 24 ANZAM 2014

scenario could go a long way in resolving the issues related to the conflicts between the stakeholders
of the Basin Bridge project. [Insert Table 3 - Scenario Analysis with Basin Bridge about here]
The ‘Kapiti - Exploding with People and Cars’ scenario painted a grim picture of the
environmental conflict relating to the Basin Bridge project. This scenario showed some chaotic
behaviour in terms of congestion, interests of environmental and community stakeholders, and their
positions in this environmental conflict. Overall, such a systematic process of construction and
analysis of scenarios helped in learning more about the behaviour of the system under three different
sets of conditions.
6.5 Experiments in the Presence of Stakeholders
In the last phase of this study, experiments were conducted in the presence of fifteen key stakeholders
who were involved in this study. These fifteen stakeholders included three transport planners, a policy
manager, four environmental stakeholder, three political stakeholders and four community
stakeholder. In these sessions, the following issues were discussed: (a) Usefulness of the model; (b)
Soundness of the model; (c) Its ability to capture complexities; (d) Effect of such an exercise on
positions and interests of stakeholders; and (e) How that stakeholder would use the model
All of the fifteen stakeholders found this exercise generally useful. One community
stakeholder was an exception, who felt that this exercise muddies the waters, since it re-emphasises
the complexity of the issues. Regarding the soundness of the model, the stakeholders were generally
comfortable, although each of them suggested some problems or improvements in the model.
Regarding the ability of this exercise in capturing the complexity of the system, all the fifteen
stakeholders agreed that the model was able to capture the complexities of the system.
On the question of whether an exercise like this study could change the positions and interests
of stakeholders who were involved in this exercise, the fifteen stakeholders, in general, felt that such a
change is possible. For example, the transport planner felt that environmental stakeholders might
change their positions, but not immediately. An environmental stakeholder felt that the results of this
exercise would strengthen the present position of environmental stakeholders. The policy manager
opined that political stakeholders tend to have simplistic views and this exercise could help in
expanding their understanding and thus changing their positions. A political stakeholder observed that
Page 12 of 24ANZAM 2014

the politicians would change and so does their positions. The community stakeholders’ opinion was
different and one of them said that political stakeholders might become more confused and would
hide behind these findings. Based on the explanations of planning theorists (e.g. Healy, 2003) such
changes can be attributed to the interactive processes used in this study that facilitated stakeholder
discussions and deliberations, providing a dialogical space for various perspectives and issues.
All the fifteen stakeholders agreed that learning would affect positions; and most of them said
that this change might not happen immediately. They also said that they would use the model for
different purposes (e.g. as a discussion tool, for making submissions, for arguing with
politicians).Thus the experiments with the stakeholders resulted in some valuable feedback about the
model. This process also helped in improving the validity of the model. Overall, the model
experimentation phase illustrated the use of this systems model in anlaysing dynamic, temporal
behaviour of the variables related to this environmental conflict. The results of these experiments also
highlighted the complex, counterintuitive behaviour of the system.
7. Conclusions
The System Dynamics model model captured some complex interconnections between the different
variables related to stakeholder conflict. It also captured the structure of the system in terms of the
feedback loops operating in the system. These feedback loops, as illustrated in the causal loop model
(Figure 3) and stock flow diagram (Figure 5) can be used to explain the complex behaviour of the
system variables over time.
Based on hard systems approach (Maani and Cavana, 2007) models are simplified
representations of reality but not reality itself. System dynamics models are essentially simulation
models which represents simplified versions of complex real world problems. The model developed
in this study is also a dynamic model that imitates the interests and positions of stakeholders in
conflict. Moreover, this model also captured the dynamic interactions between the different sectors of
the system.For example, any change in variables like travel time and traffic volume in the traffic
sector affected variables like carbon dioxide emissions and accidents per annum in the stakeholder
interests sector. These variables further affected variables in the stakeholder positions sector like the
Page 13 of 24 ANZAM 2014

positions of environmental stakeholders. These changing positions influenced whether the project
would go ahead, which affected the traffic sector, thus completing the overall feedback main loop.
The system dynamics model developed in this study was used to conduct experiments about
the project. The results of the experiments showed that the transport project would ease traffic
congestion in the short term. But, in the long term it was not found to be an effective solution since
the variables related to traffic congestion showed an increasing trend. Policy experiments and scenario
analysis were also conducted using the model. These experiments showed that policies aimed at
reducing traffic congestion can also reduce the conflict between stakeholders. But, it also highlighted
a counterintuitive behaviour (Sterman, 2000) of a variable named attractiveness of driving. While
some policies and scenarios helped in decreasing variables related to traffic congestion, it also
increased attractiveness of driving, which in turn encouraged more cars and more traffic, and this
resulted in more traffic congestion. Such results revealed that complex problems cannot be solved
with simple solutions; instead they need to be approached holistically and some of these variables
have to be managed delicately.
References
Ackoff, R. (1974). Redesigning the Future. New York, NY: John Wiley and Sons.
Bourne, L. and Walker, D.H.T. 2005. Visualising and mapping stakeholder influence, Management
Decision, 43 (5): 649 – 660
Checkland, P. (1981). Systems Thinking, Systems Practice. Chichester: John Wiley and Sons,
Coyle R.G., 1996. System Dynamics Modelling: A Practical Approach. Chichester: John Wiley &
Sons.
Donaldson, T. & Preston, L. (1995). The Stakeholder theory of the corporation: concepts, evidence
and implications. Academy of Management Review, 20, 65-91.
Elias, A. A. (2008). Towards a shared system model of stakeholders in environmental conflict.
International transactions of operational research, 15, 239-253.
Finn, J. A., Bartolini, F., Bourke, D., Kurz, I. & Viaggi, D. (2009). Ex post environmental evaluation
of agri-environment schemes using experts’ judgements and multicriteria analysis. Journal of
Environmental Planning and Management, 52 (5): 717-737.
Fiorello, D., Fermi, F., and Bielansk, D. (2010). The ASTRA model for strategic assessment of
transport policies. System Dynamics Review, 26 (3): 283-290.
Ford, A. (1999). Modeling the Environment, An Introduction to System Dynamics Modeling of
Environmental Systems. Washington DC: Island Press.
Page 14 of 24ANZAM 2014

Forrester, J.W. and Senge, P.M. (1980). Tests for building confidence in system dynamics models.
TIMS Studies in Management Sciences, 14, 209-228.
Freeman, R.E. (1984). Strategic Management: A Stakeholder Approach. Boston, MA: Pitman
Publishing.
Gillard, A. (1977). System dynamics modelling in regional planning. Journal of Environmental
Planning and Management, 20 (1): 23-30.
Greater Wellington Regional Council. (2007). The Wellington Regional Land Transport Strategy,
2007-2016. Wellington: Greater Wellington Regional Council.
Greenwood, M. and Van Buren III, H. J. (2010). Trust and stakeholder theory: trustworthiness in the
organisation-stakeholder relationship. Journal of Business Ethics, 95 (3): 425-438.
Gregory, R., and Keeney, R. L. (1994). Creating policy alternatives using stakeholder values.
Management Science, 40 (8), 1035-1048.
Healy, P. (2003). Collaborative planning in perspective. Planning Theory, 2:101–23.
Hills, P. (2010). Environmental reform, ecological modernization and the policy process in Hong
Kong: an exploratory study of stakeholder perspectives. Journal of Environmental Planning and
Management, 48 (2): 209-240.
Hodgson, M.A. (1994). Hexagons for systems thinking. In: Morecroft, J,D,W. And Sterman, J.D., eds.
Modeling for learning organisations. Portland, OR: Productivity Press, 359-374.
Hjortso, C.N., Christensen, S. M., & Tarp, P. (2005). Rapid stakeholder and conflict assessment for
natural resource management using cognitive mapping: the case of Damdoi Forest Enterprise,
Vietnam. Agriculture and Human Values, 22: 149–167
Holz, L., Kuczera, G., and Kalma, J. 2006. Multiple criteria decision making: facilitating a learning
environment. Journal of Environmental Planning and Management, 49 (3): 455-470.
Jackson L.S. (2001). Contemporary public involvement: toward a strategic approach. Local
Environment 6 (2), 135-147.
Johnson, G., Scholes, K., & Whittington, R. (2008). Exploring corporate strategy: text and cases.
London: Prentice Hall.
Jones, T., & Wicks, A. (1999). Convergent stakeholder theory. Academy of Management Review, 24
(2), 206-221.
Kreutzer, D.P. (1995). FASTBreak: A facilitation approach to systems thinking breakthroughs. In:
Chawla, S. and Renesch, J. eds. Learning organizations: developing cultures for tomorrow’s
workplace. Portland, OR: Productivity Press, 229-241.
Lange, E. and Hehl-Lange, S. (2005). Combining a participatory planning approach with a virtual
landscape model for the siting of wind turbines. Journal of Environmental Planning and
Management, 48 (6), 833-852.
Maani, K.E., Cavana, R.Y. (2007). Systems Thinking and Modelling: Understanding Change and
Complexity. New Zealand: Prentice Hall.
Page 15 of 24 ANZAM 2014

Mendelow. A. (1991). Proceedings of the second international conference on information systems,
Cambridge, MA.
Memon, P. A. and Wilson, G.A. (2007). Contesting governance of indigenous forests in New
Zealand: the case of the West Coast Forest Accord. Journal of Environmental Planning and
Management, 50 (6): 745-764.
Mitchell, B. (2010). Resource and Environmental Management in Canada. UK : Oxford University
Press.
Mitchell, R., Agle, B., and Wood, D. (1997). Towards a theory of stakeholder identification and
salience: defining the principle of who and what really counts. Academy of Management Review, 22,
853-886.
O’ Regan, B. and Moles, R. (2001). A system dynamics model of mining industry investment
decisions within the context of environmental policy, Journal of Environmental Planning and
Management, 44(2), 245–262.
Ortuzar, J.D. and Willumsen, L.G. (1999). Modelling Transport, second ed. Chichester, UK: John
Wiley and Sons.
Post, J. (1981). Research in business and society: Current issues and approaches. Paper presented at
the AACSB conference on business environment/public policy and the business school of the 1980s,
Berkeley, CA.
Ramirez, R. (1999). Stakeholder analysis and conflict management. In: Buckles D., ed., Cultivating
Peace: Conflict and Collaboration in Natural Resource Management. Ottawa, Canada: International
Development Research Centre, 101-126.
Rhenman, E. (1968). Organisationsplanering. Stockholm, Sweden: PA Norstedt & Soner.
Richmond, B., and Peterson, S., 1997. An Introduction to Systems Thinking. Hanover, NH: High
Performance Systems.
Schoemaker, P. J. H. (1993). Scenario planning: A tool for strategic thinking. Sloan Management
Review, 36 (2), 25-40.
Sethi, P. (1971). Up Against the Corporate Wall. Englewood Cliffs, NJ: Prentice Hall, Inc.
Shackley, S. and Deanwood, R., 2002. Stakeholder perceptions of climate change impacts at the
regional scale: implications for the effectiveness of regional and local responses. Journal of
Environmental Planning and Management, 45 (3): 381-402.
Simmons, J., Iles, P., and Yolles, M. (2005). Identifying those on board the ‘moving train’: towards a
stakeholder focused methodology for organizational decision making. Systems Research and
Behavioral Science, 22 (1): 41-53.
Stave, K.A. (2002). Using system dynamics to improve public participation in environmental
decisions. System Dynamics Review, 18 (2), 139-167.
Sterman, J.D. (2000). Business Dynamics: Systems Thinking and Modeling for a Complex World.
New York, NY: Irwin/McGraw Hill.
Studer, S., Tsang, S. Welford, R., and Hills, P. (2008). SMEs and voluntary environmental initiatives:
a study of stakeholders' perspectives in Hong Kong. Journal of Environmental Planning and
Management, 51 (2): 285-301.
Page 16 of 24ANZAM 2014

Taylor, B. (1971). The future development of corporate strategy. The Journal of Business Policy, 2
(2), 22-38.
Vandekerckhove, W. and Dentchev, N. A. (2005). A Network Perspective on Stakeholder
Management: Facilitating Entrepreneurs in the Discovery of Opportunities. Journal of Business
Ethics, 60 (3): 221–232
Vennix J.A.M. (1996). Group Model Building: Facilitating Team Learning Using System Dynamics.
Chichester: John Wiley.
Wolsink, M. & Breukers, S. (2010). Contrasting the core beliefs regarding the effective
implementation of wind power. An international study of stakeholder perspectives. Journal of
Environmental Planning and Management, 53 (5): 535-558.
Table 1. Methodological Framework
Phases
Steps
Problem Structuring
(i) Developing a stakeholder map
(ii) Preparing a chart of specific stakeholders
(iii) Identifying the stakes of stakeholders
(iv) Preparing a power versus stake grid
(v) Conducting a process level stakeholder analysis
(vi) Conducting a transactional level stakeholder analysis
(vii) Determining the stakeholder management capability
(viii) Analysing the dynamics of stakeholders
(ix) Developing a BOT graph
Group Model Building
(i) Generating hexagons
(ii) Forming clusters
(iii) Identifying variables
(iv) Developing a causal loop model
System Dynamics
Modelling
(i) Reviewing transport modelling literature
(ii) Developing a high-level Systems Map
(iii) Defining variable types and constructing a stock-flow
diagram
(iv) Developing a Simulation Model
(v) Reproducing Reference Mode Behaviour (vi) Validating the model
(vii) Performing Sensitivity Tests
Model Experimentation
(i) Testing the effects on the existing system
(ii) Conducting policy experiments on the model
(iii) Modelling scenarios using the model
(iv) Conducting experiments using the model in the presence
of stakeholders
Page 17 of 24 ANZAM 2014

Note: Position of community, environmental and political stakeholders is a number indicating the
position of those stakeholders towards the Basin Reserve project. This is modelled as a 7-point
itemised rating scale. 1 = extremely opposed; 2 = very opposed; 3 = opposed; 4 = neutral; 5 =
supportive; 6 = very supportive; 7 = extremely supportive.
Table 2. Effects of Car Pooling – without Basin Bridge
Car Occupancy 1 2 3 4 5
Volume capacity ratio 0.94 0.47 0.32 0.25 0.20
Travel time (min) 28.4 18.5 16.9 16.2 15.7
Attractiveness of driving 1.99 1.92 2.63 3.13 3.49
Accidents per annum 14.7 7.4 5.1 3.9 3.1
Total CO2 emission (tones) 21.3 12.9 9.4 7.5 6.2
Total fuel consumption (litres) 8,539 5,164 3,747 2,983 2,482
Community costs (NZ$m) 3.34 1.67 1.15 8.89 7.23
Environmental costs (NZ$m) 1.67 1.01 7.35 5.85 4.87
TG construction No No No No No
Position of com. stakeholders 6.3 5.3 4.8 4.5 4.3
Position of env. stakeholders 2.2 3.1 3.5 3.8 4.0
Position of pol. stakeholders 4.2 4.2 4.2 4.1 4.1
Page 18 of 24ANZAM 2014

Note: Position of community, environmental and political stakeholders is a number indicating the
position of those stakeholders towards the Basin Reserve project. This is modelled as a 7-point
itemised rating scale. 1 = extremely opposed; 2 = very opposed; 3 = opposed; 4 = neutral; 5 =
supportive; 6 = very supportive; 7 = extremely supportive.
Table 3. Scenario Analysis – with Basin Bridge
Variables
Do Nothing
Cleaner Greener Aotearoa
Kapiti - Exploding with
People and Cars
Volume capacity ratio 0.47 0.10 0.74
Travel time (min) 18.5 15.0 22.9
Attractiveness of driving 1.92 4.07 1.90
Accidents per annum 14.7 3.3 23.3
Total CO2 emission (tones) 38.3 9.6 55.3
Total Fuel consmpn.(litres) 15,332 3,853 22,105
Community costs (NZ$m) 3.34 7.49 5.29
Environmental costs (NZ$m) 30.1 9.14 4.34
TG Construction Yes Yes Yes
Position of Comm. Stkldrs. 6.3 4.3 6.9
Position of Env. Stkhldrs. 1.5 3.2 1.1
Position of Pol. Stkhldrs. 3.9 3.8 4.0
Page 19 of 24 ANZAM 2014

Figure 1. Stakeholder Map of the Basin Bridge Project
1
2
3
4
5
2000 2025
1=Traffic volume, 2= Travel time, 3=CO2 emissions, 4= Speed, 5 = Attractiveness of driving
Figure 2. Reference Mode
Customer
Community
Media
Financial
Political
Environmental
Internal
Basin Bridge Project
Citizen
Action
Governmen
t
Special Interest
Groups
Page 20 of 24ANZAM 2014

Figure 3. Casual Loop Diagram
No. of Cars in the region
Highway capacity
Volume-capacity Ratio
Traffic Volume
+
-
CO2 Emissions
Fuel Consumption
Population
Fraction of Cars travelling
Cars per person
Position of environmnental stakeholders
Environmental pollution due to roads
Political willSpeed Travel time
Desired Travel time
Attractiveness of driving
No. of accidents per annum
T.G Construction
+
Community Demand
+
-
+
+
+
--
+
+
+
+
+
+
-
+
-
+
+
-
+
+
B1
R1
B3
B2
B4
B5 B6
B7
R2
Delay
Page 21 of 24 ANZAM 2014

Figure 4. Stock-flow Diagram
Community costs
~
Position of env stakeholders
Desired travel time
Traffic volume
~
Speed
Accidents per annum
~
Position of Community Stakeholder
Actual highway capacity
Potential highway capacity
Volume capacity ratio
Travel time
TG start
TG construction
Position of Political Stakeholders
Environmental costs
Annual accident costs
SH1 Fuel consumption
Annual CO2 costs
Annual Fuel costs
~
Cars per person
Change in attr of driving
Attr of driving
TG Fuel Consumption
~Regional population
No of cars
Total CO2 emission
~
Fraction of cars travelling
TG Switch
Potential TG taffic volume
TG Traffic volumeSH1 Traffic Volume
Actual TG traffic volume
~
SH1 Fuel consumption graph
~
TG Fuel Consumption Graph
TG CO2 emission
SH1 CO2 emission
Fuel costs per litre
Travel time
Annual travel time costs
Desired travel time
Traffic volume
TG construction
Total fuel consmpn
~Speed
Carbon tax
Traffic Sector
Interests of Community Stakeholders Sector
Interests of Environmental Stakeholders Sector Stakeholder Positions Sector
Page 22 of 24ANZAM 2014
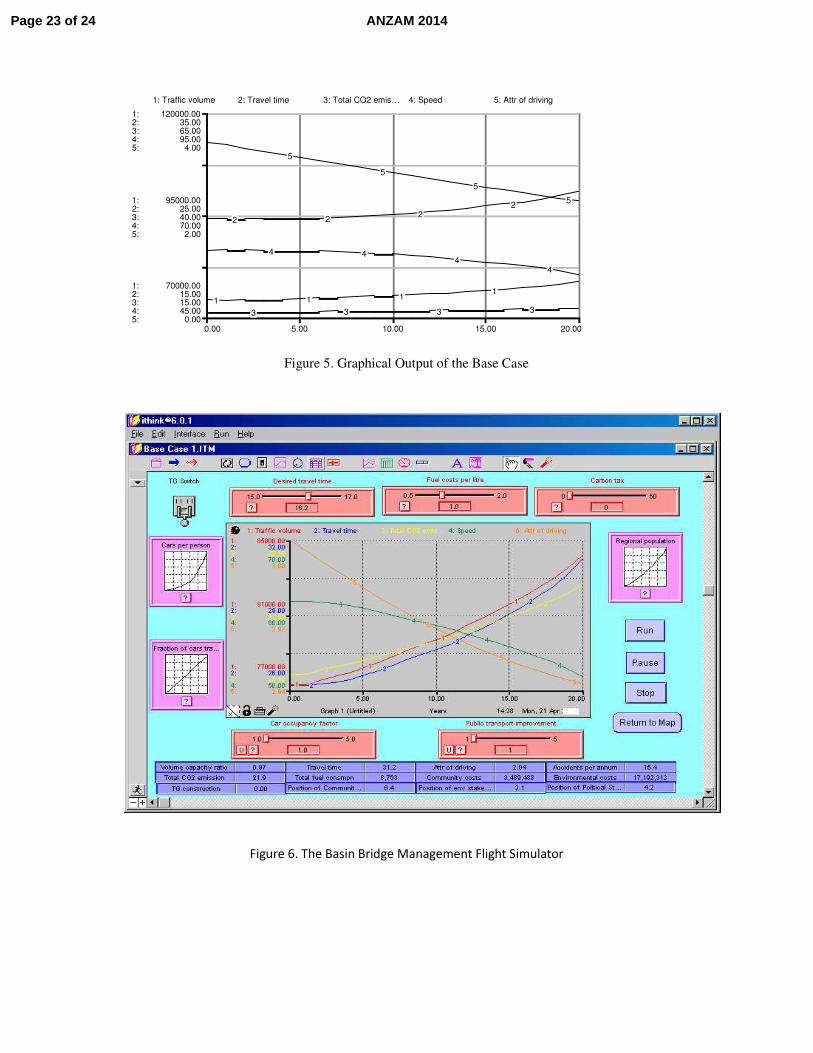
Figure 5. Graphical Output of the Base Case
Figure 6. The Basin Bridge Management Flight Simulator
0.00 5.00 10.00 15.00 20.00
1:
1:
1:
2:
2:
2:
3:
3:
3:
4:
4:
4:
5:
5:
5:
70000.00
95000.00
120000.00
15.00
25.00
35.00
15.00
40.00
65.00
45.00
70.00
95.00
0.00
2.00
4.00
1: Traffic volume 2: Travel time 3: Total CO2 emis… 4: Speed 5: Attr of driving
1 1 11
2 22
2
3 3 3 3
4 44
4
5
5
5
5
Page 23 of 24 ANZAM 2014
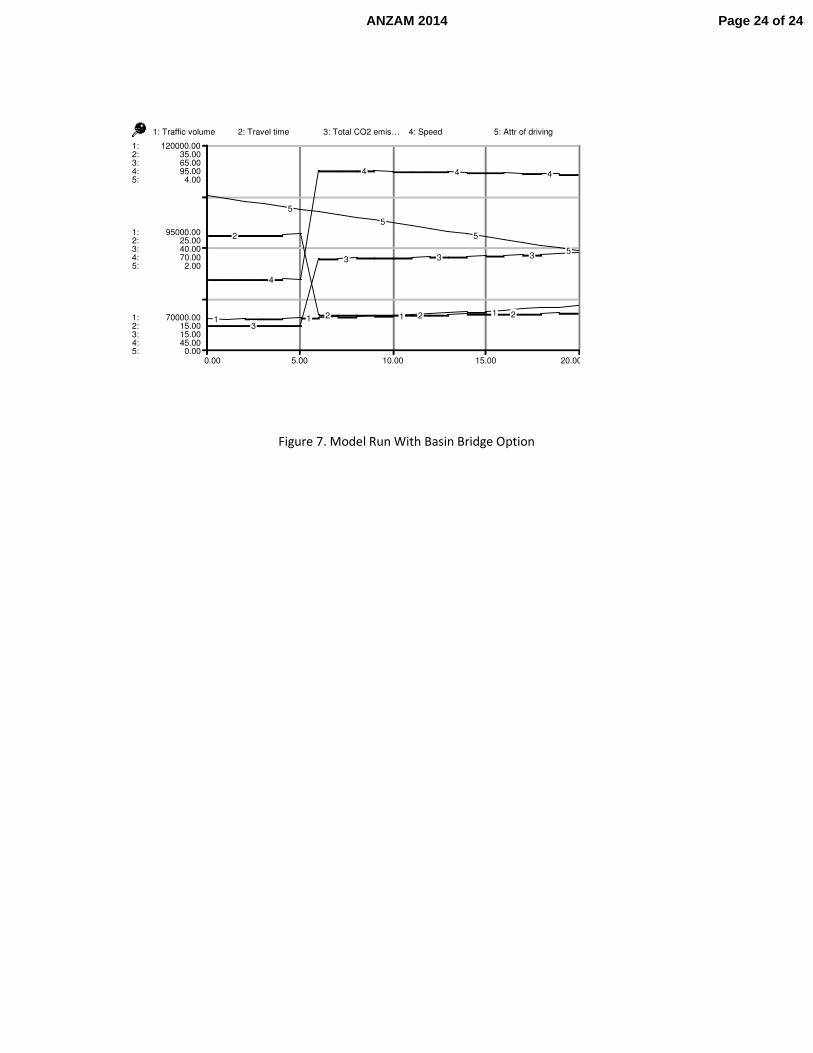
Figure 7. Model Run With Basin Bridge Option
0.00 5.00 10.00 15.00 20.00
1:
1:
1:
2:
2:
2:
3:
3:
3:
4:
4:
4:
5:
5:
5:
70000.00
95000.00
120000.00
15.00
25.00
35.00
15.00
40.00
65.00
45.00
70.00
95.00
0.00
2.00
4.00
1: Traffic volume 2: Travel time 3: Total CO2 emis… 4: Speed 5: Attr of driving
1 1 1 1
2
2 2 2
3
3 3 3
4
4 4 4
5
5
5
5
Page 24 of 24ANZAM 2014