Embed Size (px)
Citation preview
SYSTEM CHARACTERIZATION AND
CATALYTIC IGNITION
OF PROPANE-AIR MIXTURES
IN A PLUG FLOW REACTOR
Final Report
KLK342
N06-12B
National Institute for Advanced Transportation Technology
University of Idaho
December 2006
Amit Patel and Judith Steciak


DISCLAIMER
The contents of this report reflect the views of the authors,
who are responsible for the facts and the accuracy of the
information presented herein. This document is disseminated
under the sponsorship of the Department of Transportation,
University Transportation Centers Program, in the interest of
information exchange. The U.S. Government assumes no
liability for the contents or use thereof.
1. Report No.
2. Government Accession No.
3. Recipient‘s Catalog No.
4. Title and Subtitle
System Characterization and Catalytic Ignition of Propane-Air Mixtures in
a Plug Flow Reactor
5. Report Date
December 2006
6. Performing Organization Code
KLK342
5.Author(s)
Amit Patel and Judith Steciak
8. Performing Organization Report No.
N06-12B
9. Performing Organization Name and Address
National Institute for Advanced Transportation Technology
University of Idaho
10. Work Unit No. (TRAIS)
PO Box 440901; 115 Engineering Physics Building
Moscow, ID 838440901
11. Contract or Grant No.
DTRS98-G-0027
12. Sponsoring Agency Name and Address
US Department of Transportation
Research and Special Programs Administration
13. Type of Report and Period Covered
Final Report: Sept. 03-July 06
400 7th Street SW
Washington, DC 20509-0001
14. Sponsoring Agency Code
USDOT/RSPA/DIR-1
Supplementary Notes:
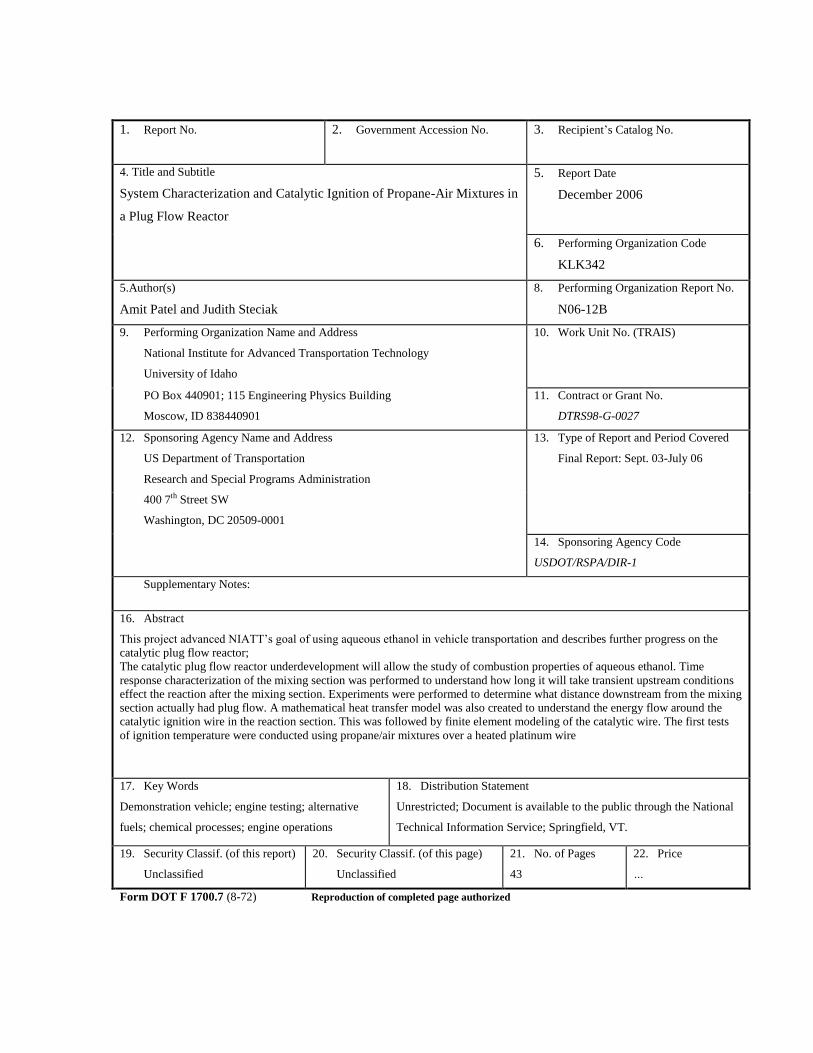
16. Abstract
This project advanced NIATT‘s goal of using aqueous ethanol in vehicle transportation and describes further progress on the
catalytic plug flow reactor;
The catalytic plug flow reactor underdevelopment will allow the study of combustion properties of aqueous ethanol. Time
response characterization of the mixing section was performed to understand how long it will take transient upstream conditions
effect the reaction after the mixing section. Experiments were performed to determine what distance downstream from the mixing
section actually had plug flow. A mathematical heat transfer model was also created to understand the energy flow around the
catalytic ignition wire in the reaction section. This was followed by finite element modeling of the catalytic wire. The first tests
of ignition temperature were conducted using propane/air mixtures over a heated platinum wire
17. Key Words
Demonstration vehicle; engine testing; alternative
fuels; chemical processes; engine operations
18. Distribution Statement
Unrestricted; Document is available to the public through the National
Technical Information Service; Springfield, VT.
19. Security Classif. (of this report)
Unclassified
20. Security Classif. (of this page)
Unclassified
21. No. of Pages
43
22. Price
…
Form DOT F 1700.7 (8-72) Reproduction of completed page authorized

Ethanol-Water Catalytic Igniter Performance and Emissions Testing page i
Table of Contents
EXECUTIVE SUMMARY ................................................................................................ 1
INTRODUCTION .............................................................................................................. 1
Background and Motivation ........................................................................................... 2
Catalytic Plug Flow Reactor ........................................................................................... 4
DESCRIPTION OF PROBLEM......................................................................................... 5
Construction and Working .............................................................................................. 7
Mixing Section ................................................................................................................ 7
APPROACH AND METHODOLOGY ......................................................................... 9
Response Time Experiments........................................................................................... 9
Verifying Plug Flow ..................................................................................................... 11
Surface Temperature Model and Experimental Set up ................................................. 12
Microcalorimetry ...................................................................................................... 12
Data Acquisition ....................................................................................................... 14
Test Apparatus .......................................................................................................... 15
Finite Element Ignition Temperature Model ............................................................ 17
Finite Element Model (Algor) ...................................................................................... 18
Input parameters........................................................................................................ 18
Sensitivity Studies ..................................................................................................... 19
Finite Element Energy Balance Model ......................................................................... 20
Boundary Conditions ................................................................................................ 21
Energy Balance ......................................................................................................... 22
Parameters Investigated ............................................................................................ 23
Theoretical Analysis ................................................................................................. 23
Finding .......................................................................................................................... 26
Plug Flow .................................................................................................................. 26
Surface Temperature ................................................................................................. 27
Summary of Equivalence Ratio Experiments ........................................................... 31
Finite Element Model Results ................................................................................... 33
Ethanol-Water Catalytic Igniter Performance and Emissions Testing page ii
CONCLUSIONS........................................................................................................... 38
Plug flow reactor ........................................................................................................... 38
System Modeling .......................................................................................................... 38
Catalytic ignition temperature....................................................................................... 38
Recommendations ......................................................................................................... 39
Plug flow reactor ....................................................................................................... 39
System modeling ....................................................................................................... 39
Catalytic ignition temperature................................................................................... 39
REFERENCES ............................................................................................................. 41
Ethanol-Water Catalytic Igniter Performance and Emissions Testing page 1
EXECUTIVE SUMMARY
This project advanced NIATT‘s goal of using aqueous ethanol in vehicle transportation.
This report describes further progress on the catalytic plug flow reactor;
The catalytic plug flow reactor underdevelopment will allow the study of combustion
properties of aqueous ethanol. Time response characterization of the mixing section was
performed to understand how long it will take transient upstream conditions effect the
reaction after the mixing section. Experiments were performed to determine what
distance downstream from the mixing section actually had plug flow. A mathematical
heat transfer model was also created to understand the energy flow around the catalytic
ignition wire in the reaction section. This was followed by finite element modeling of the
catalytic wire. The first tests of ignition temperature were conducted using propane/air
mixtures over a heated platinum wire.

Ethanol-Water Catalytic Igniter Performance and Emissions Testing page 2
Ethanol-Water Catalytic Igniter Performance and Emissions Testing page 1
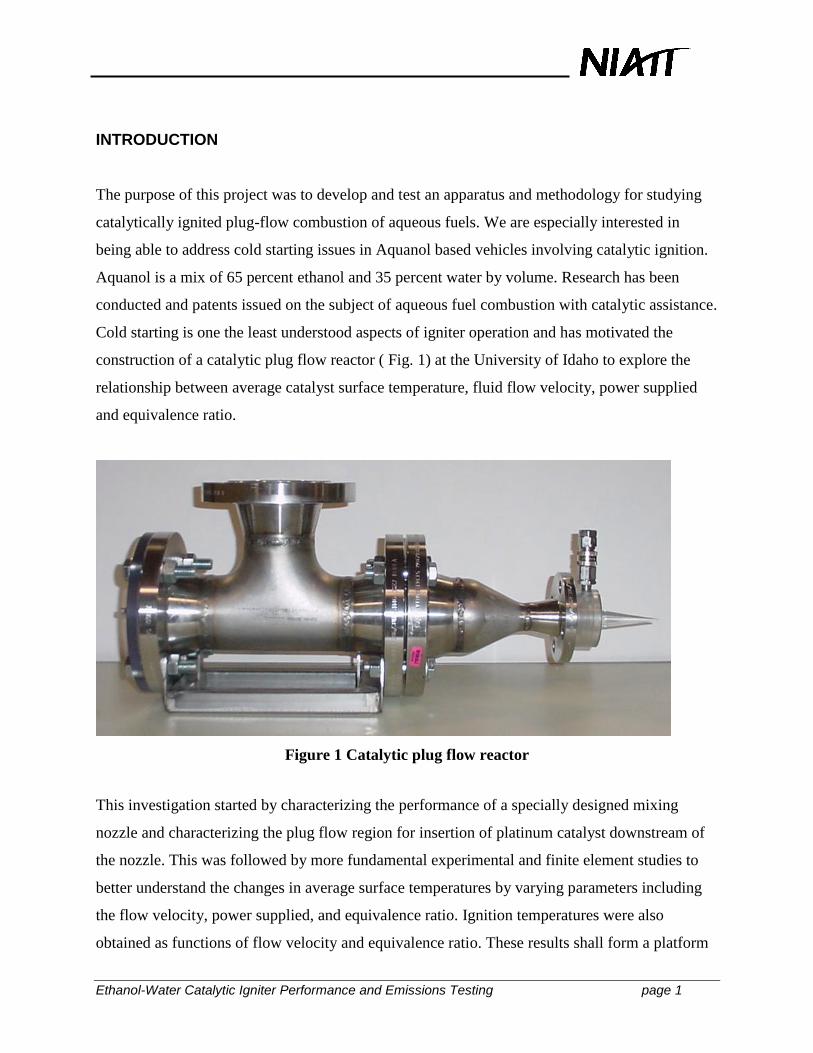
INTRODUCTION
The purpose of this project was to develop and test an apparatus and methodology for studying
catalytically ignited plug-flow combustion of aqueous fuels. We are especially interested in
being able to address cold starting issues in Aquanol based vehicles involving catalytic ignition.
Aquanol is a mix of 65 percent ethanol and 35 percent water by volume. Research has been
conducted and patents issued on the subject of aqueous fuel combustion with catalytic assistance.
Cold starting is one the least understood aspects of igniter operation and has motivated the
construction of a catalytic plug flow reactor ( Fig. 1) at the University of Idaho to explore the
relationship between average catalyst surface temperature, fluid flow velocity, power supplied
and equivalence ratio.
Figure 1 Catalytic plug flow reactor
This investigation started by characterizing the performance of a specially designed mixing
nozzle and characterizing the plug flow region for insertion of platinum catalyst downstream of
the nozzle. This was followed by more fundamental experimental and finite element studies to
better understand the changes in average surface temperatures by varying parameters including
the flow velocity, power supplied, and equivalence ratio. Ignition temperatures were also
obtained as functions of flow velocity and equivalence ratio. These results shall form a platform
Ethanol-Water Catalytic Igniter Performance and Emissions Testing page 2
for future research with Aquanol air mixtures over platinum wires. In this introductory chapter,
the background and motivation for this work are first presented followed by brief discussions on
the benefits of Aquanol fuel combustion, catalytic igniter technology and on the catalytic plug
flow reactor. Finally the specific objectives of this study are presented along with a brief outline
of this thesis.
Background and Motivation
Previous studies, discussed below, indicate that lean mixtures can tolerate higher compression
ratios leading to an increase in engine efficiency. Lean mixtures have the potential of reducing
NOx and CO emissions in internal combustion engines. However, lean mixtures are not readily
ignited and are characterized by a low flame propagation velocity. One effective method to
improve flame initiation is catalytic assistance of ignition and combustion. The transition state of
the molecule catalyst complex is then in a low energy configuration which provides an easier
route for the reactants to proceed in subsequent reactions to form the final products. The fact that
the catalyst can have strong influence on the reaction mechanism, in addition to lowering the
overall activation energy, was suggested by the work of Patterson and Kembal [1], who obtained
a negative reaction order in fuel for the oxidation of olefins on platinum films. Similar findings
have been reported by Moro-Oka et.al. [2], by Schwartz et al. [3], and by Cardoso and Luss [4].
Bruno and coworkers [5] demonstrated experimentally that surface chemistry plays a vital role in
the conversion of fuel to CO2 and H2O when lean preheated propane-air mixtures are passed over
platinum catalyst. Cho and Law [6] performed propane-air mixture experiments at low Reynolds
number in steady state flow conditions to achieve axial symmetry of the flow along the length of
wire and to minimize convective heat transfer losses. The results of these experiments were
reported for a flow velocity of 5-10 cm/s that corresponded to a Reynolds number of 0.1. They
used 0.5 - 2.0 percent of propane by volume in the fuel-air mixtures and the experimental data
was independent of the fluid velocity. Their paper mentions that since catalytic combustion is
basically a three component system involving fuel/oxidizer/catalyst, with strong coupling
between the gas and surface processes, simplified approaches in the above manner can lead to
Ethanol-Water Catalytic Igniter Performance and Emissions Testing page 3
ambiguities in attempts to understand the phenomenon under investigation. The experimental
and finite element studies reported here explore the changes in catalyst surface temperature with
the variations in flow velocity, fuel concentration, oxygen concentration, platinum wire
geometry, power supply and preheated temperatures of fuel air mixtures at higher Reynolds
number.
The ultimate goal is to explore a possible solution for cold starting problem while using Aquanol
fuel in vehicles. Ethanol, a renewable fuel, is produced primarily from grains and other
agricultural crops. Previously research has been conducted to reap the benefits of alcohol-based
fuels. The addition of water to ethanol in a combustion chamber reduces flame temperatures and
thus reduces NOx emissions. Studies of aqueous transportation fuels, discussed below, indicate
that in majority of the cases, engines had cold starting problems so they were always started on
gasoline and once the engine was warm enough they were changed to aqueous fuels. The
primary drawback to Aquanol is the difficulty of initiating combustion. Conventional sources of
ignition such as spark plugs cannot ignite these aqueous ethanol air mixtures because of the high
water concentrations involved extinguish the flame. Likewise, compression ignition of aqueous
fuels has been largely ineffective due to problems in controlling the ignition timing. In
conventional design combustion chambers with commonly used fuels, it is very difficult to
increase the compression ratio due to problems of knocking, throttle and mechanical losses.
Earlier research by Jarosinski and Podfilipski [7] has been done using modified design
combustion chambers with typical fuels such as gasoline and diesel. Also, research using
alternative alcohol based fuels but with conventional design combustion chambers has been
done.
The research reported here is unique since it combines features of both of the above approaches
and uses alcohol based fuels in a modified design combustion chamber. Work with water-
naphthalene and water-alcohol mixtures pioneered the use of water as a combustion diluent and
temperature reducer for NOx reduction in diesel and SI engines [8]. If this technology were to be
commercialized, gasoline or diesel would have to be delivered to the engine during start-up,
Ethanol-Water Catalytic Igniter Performance and Emissions Testing page 4
necessitating two separate fuel-handling systems. This would not be cost effective and could not
be retrofitted to existing engine.
Hence to eliminate double fuel handling systems and to address engine cold starting issues,
catalytic ignition research was initiated at University of Idaho. This ignition source is elementary
in the conversion of an engine for operation on Aquanol. Initial experiments were performed
with propane-air mixtures over platinum wires and gradually we shall shift to Aquanol-air
mixtures. These studies provided the ground and motivation for pursuing this research on
catalytic assisted ignition and combustion.
Catalytic Plug Flow Reactor
As discussed the catalytic plug reactor has many features that make it a promising combustor
design for overcoming many difficulties associated with conventional combustor chamber
designs. This specially designed catalytic reactor can handle both liquid and gaseous fuels. It
operating pressures will range from 1 atm to 15 atm and it will be able to withstand temperatures
up to 1700 K.
Ethanol-Water Catalytic Igniter Performance and Emissions Testing page 5
DESCRIPTION OF PROBLEM
Introducing catalytic surfaces in combustion systems supplies an additional control parameter,
namely the surface reaction rate. Diffusion of energy and intermediate species released from
exothermic surface reaction can dramatically accelerate the gas phase reaction and initiate
ignition at low temperatures.
This work is one of a series of experimental and modeling investigations designed to help
understand the ethanol-water gas phase and surface mechanisms. The experimental approach
includes the design, construction and testing of a plug flow reactor that can be pressurized to
typical pre-ignition engine conditions. The modeling approach includes thermodynamic
calculations at different ethanol-water volume factions, equivalence ratios, and pressures.
Detailed chemical kinetic modeling of gas-phase and surface reactions, coupled with
experimental results, will permit us to develop a simplified model that accurately predicted
ignition.
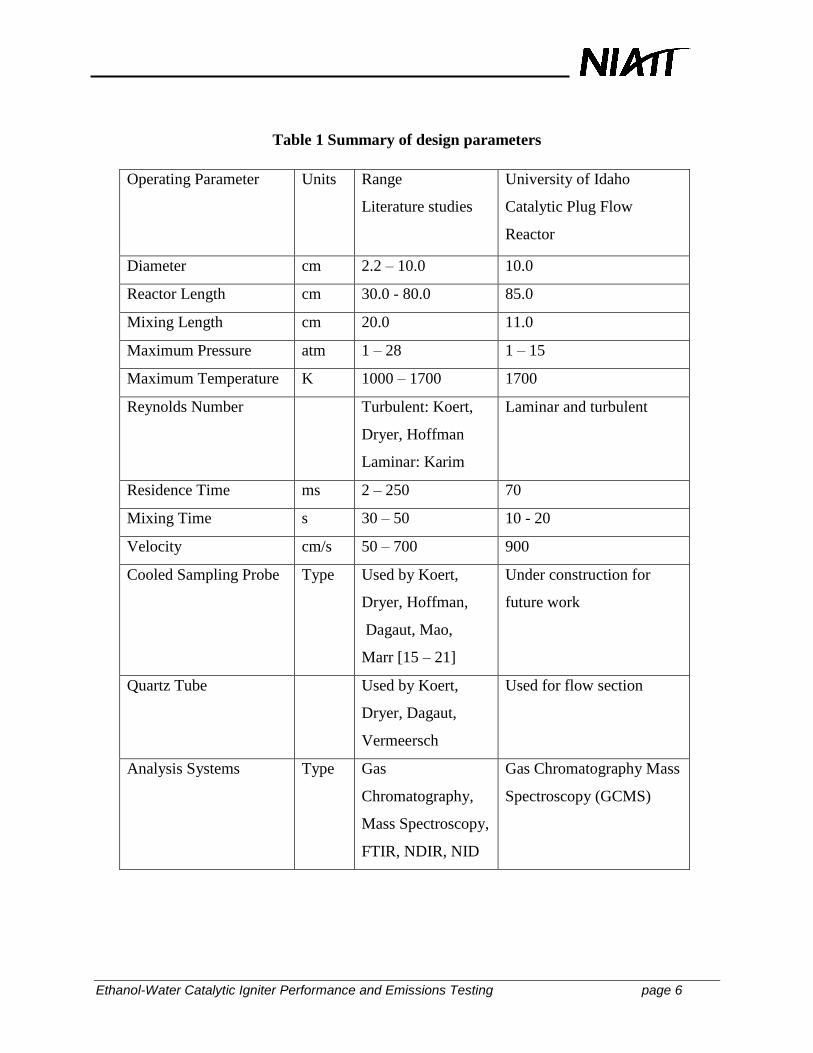
A literature search for flow reactor systems provided information about standard designs features
of reactors for combustion studies. Table 1 below summarizes the nominal operating ranges for
the reactor based on the work of Koert, Hoffman, Dryer, Karim, Vermeersch, Mao, Mitchell [15
- 21] and operating ranges for the catalytic plug flow reactor at University of Idaho.
The combustion section of the reactor will contain catalysts in different arrangements as needed
for the experiments. The work reported here used a platinum catalyst wire for igniting the fuel-
air mixture. Instrumentation and calculations related to the wire will be used to determine the
transition temperature from kinetic to diffusion control of the ignition process, based on the
experimental method of Schwartz, et al. [3]. The flow section ensures plug flow – a uniform
cross section of temperature, velocity, and concentration.
Ethanol-Water Catalytic Igniter Performance and Emissions Testing page 6
Table 1 Summary of design parameters
Operating Parameter Units Range
Literature studies
University of Idaho
Catalytic Plug Flow
Reactor
Diameter cm 2.2 – 10.0 10.0
Reactor Length cm 30.0 - 80.0 85.0
Mixing Length cm 20.0 11.0
Maximum Pressure atm 1 – 28 1 – 15
Maximum Temperature K 1000 – 1700 1700
Reynolds Number Turbulent: Koert,
Dryer, Hoffman
Laminar: Karim
Laminar and turbulent
Residence Time ms 2 – 250 70
Mixing Time s 30 – 50 10 - 20
Velocity cm/s 50 – 700 900
Cooled Sampling Probe Type Used by Koert,
Dryer, Hoffman,
Dagaut, Mao,
Marr [15 – 21]
Under construction for
future work
Quartz Tube Used by Koert,
Dryer, Dagaut,
Vermeersch
Used for flow section
Analysis Systems Type Gas
Chromatography,
Mass Spectroscopy,
FTIR, NDIR, NID
Gas Chromatography Mass
Spectroscopy (GCMS)
Ethanol-Water Catalytic Igniter Performance and Emissions Testing page 7
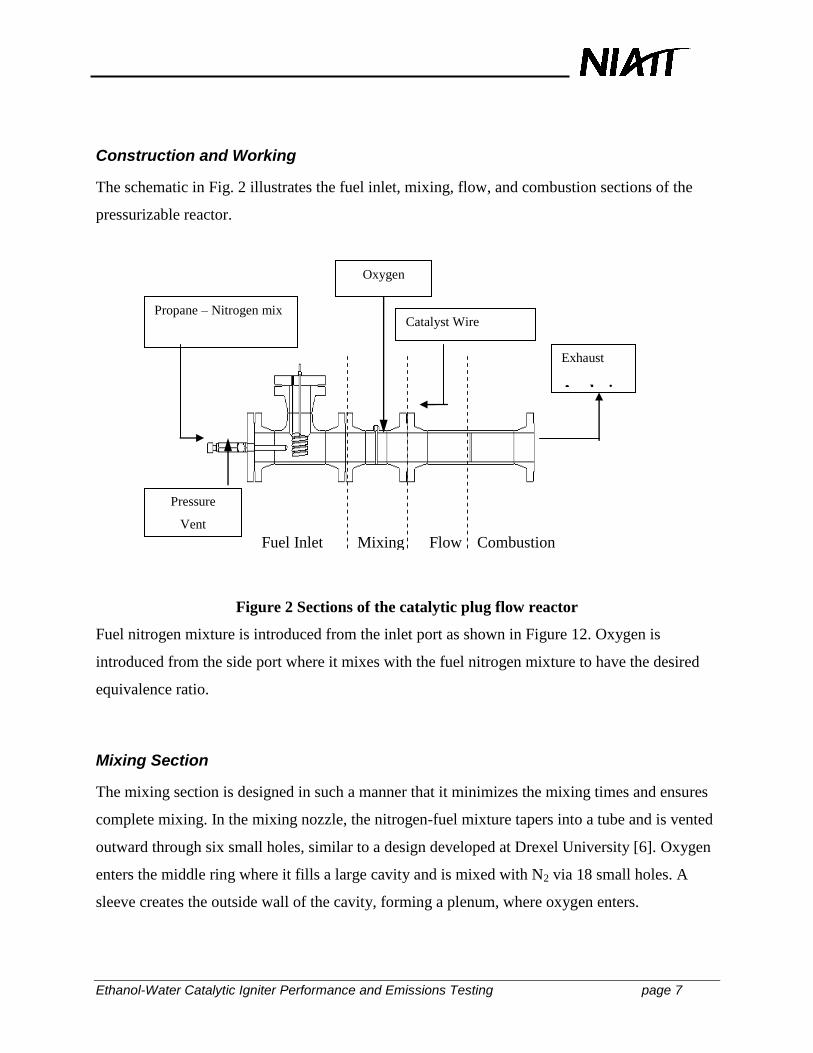
Construction and Working
The schematic in Fig. 2 illustrates the fuel inlet, mixing, flow, and combustion sections of the
pressurizable reactor.
Figure 2 Sections of the catalytic plug flow reactor
Fuel nitrogen mixture is introduced from the inlet port as shown in Figure 12. Oxygen is
introduced from the side port where it mixes with the fuel nitrogen mixture to have the desired
equivalence ratio.
Mixing Section
The mixing section is designed in such a manner that it minimizes the mixing times and ensures
complete mixing. In the mixing nozzle, the nitrogen-fuel mixture tapers into a tube and is vented
outward through six small holes, similar to a design developed at Drexel University [6]. Oxygen
enters the middle ring where it fills a large cavity and is mixed with N2 via 18 small holes. A
sleeve creates the outside wall of the cavity, forming a plenum, where oxygen enters.
Fuel Inlet Mixing Flow Combustion
Exhaust
Analysis
(FTIR)
Oxygen
Propane – Nitrogen mix
Pressure
Vent
Catalyst Wire
Ethanol-Water Catalytic Igniter Performance and Emissions Testing page 8
A prototype-mixing nozzle was machined from polymethyl methacrylate and tested for fit with
the evaporator section. The gas-mixing nozzle design aimed to preserve a step-change when the
concentration of one gas stream — the fuel-nitrogen stream — was suddenly changed.
Experiments described in the next section used two CO2-N2 gas streams of different
compositions verified complete mixing.

Ethanol-Water Catalytic Igniter Performance and Emissions Testing page 9
APPROACH AND METHODOLOGY
The aim of these experiments was threefold. First, we wanted to verify the operation of the
mixing nozzle in terms of response time. Second, we needed to find the axial limits of the plug
flow region for insertion of the platinum catalyst. For this purpose, a hot wire anemometer was
used for obtaining the velocity profile at various radial positions and at different axial positions.
Third, we needed to characterize the average surface temperature of the Pt wire in plug flow for
comparison with an FEA model.
Response Time Experiments
Tests were performed to determine how the sampling probe length and flow rate of the gases
affect the response time. This procedure was performed for sampling probe lengths of 0.889 m
and 2.565 m. The flow rate was kept constant at 13.2 percent total for the calibration gas and
16.4 percent total for the oxygen. This corresponds to a volumetric flow rate of about 43 cm3/sec.
Figure 3 shows the experimental set up for studying the effect of changing the sampling probe
length on the response time. Gases from two fifteen-gallon tanks were flowed through the flow
meters.
Figure 3 Experimental set up for studying the response time of the mixing nozzle
Flow meters
Calibration gas entrance
Nitrogen gas
entrance
Ethanol-Water Catalytic Igniter Performance and Emissions Testing page 10
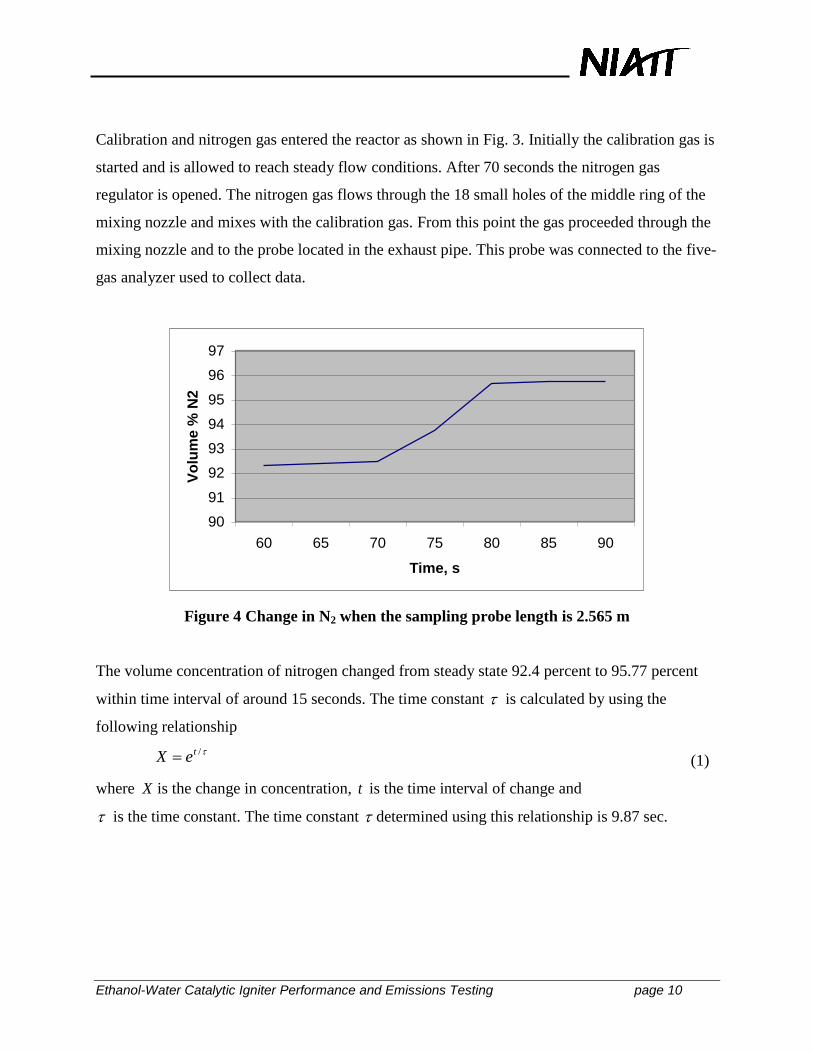
Calibration and nitrogen gas entered the reactor as shown in Fig. 3. Initially the calibration gas is
started and is allowed to reach steady flow conditions. After 70 seconds the nitrogen gas
regulator is opened. The nitrogen gas flows through the 18 small holes of the middle ring of the
mixing nozzle and mixes with the calibration gas. From this point the gas proceeded through the
mixing nozzle and to the probe located in the exhaust pipe. This probe was connected to the five-
gas analyzer used to collect data.
90
91
92
93
94
95
96
97
60 65 70 75 80 85 90
Time, s
Vo
lum
e %
N2
Figure 4 Change in N2 when the sampling probe length is 2.565 m
The volume concentration of nitrogen changed from steady state 92.4 percent to 95.77 percent
within time interval of around 15 seconds. The time constant is calculated by using the
following relationship
/teX (1)
where X is the change in concentration, t is the time interval of change and
is the time constant. The time constant determined using this relationship is 9.87 sec.
Ethanol-Water Catalytic Igniter Performance and Emissions Testing page 11
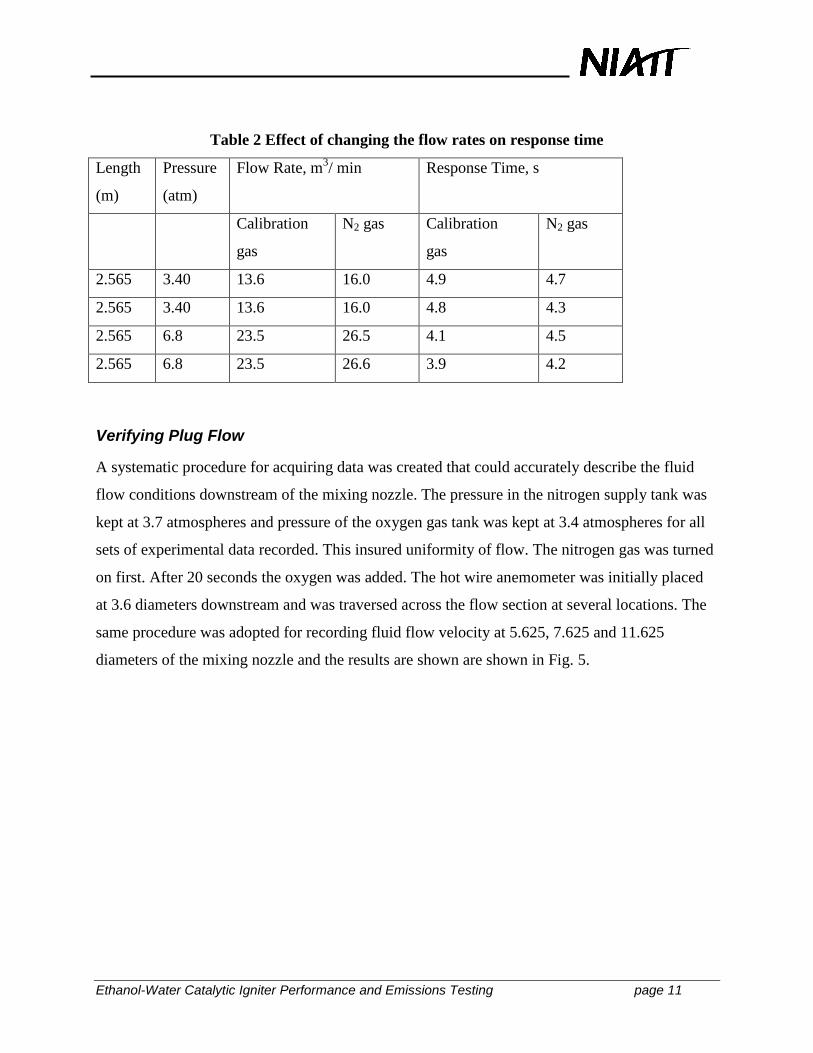
Table 2 Effect of changing the flow rates on response time
Length
(m)
Pressure
(atm)
Flow Rate, m3/ min Response Time, s
Calibration
gas
N2 gas Calibration
gas
N2 gas
2.565 3.40 13.6 16.0 4.9 4.7
2.565 3.40 13.6 16.0 4.8 4.3
2.565 6.8 23.5 26.5 4.1 4.5
2.565 6.8 23.5 26.6 3.9 4.2
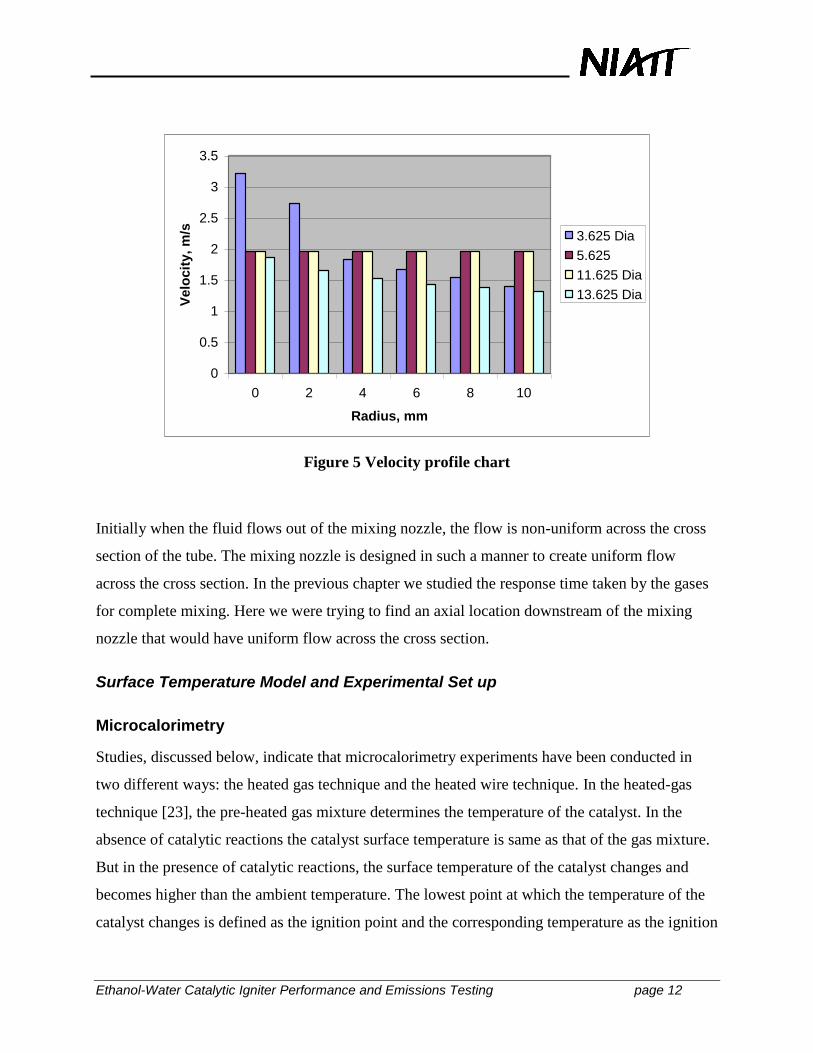
Verifying Plug Flow
A systematic procedure for acquiring data was created that could accurately describe the fluid
flow conditions downstream of the mixing nozzle. The pressure in the nitrogen supply tank was
kept at 3.7 atmospheres and pressure of the oxygen gas tank was kept at 3.4 atmospheres for all
sets of experimental data recorded. This insured uniformity of flow. The nitrogen gas was turned
on first. After 20 seconds the oxygen was added. The hot wire anemometer was initially placed
at 3.6 diameters downstream and was traversed across the flow section at several locations. The
same procedure was adopted for recording fluid flow velocity at 5.625, 7.625 and 11.625
diameters of the mixing nozzle and the results are shown are shown in Fig. 5.
Ethanol-Water Catalytic Igniter Performance and Emissions Testing page 12
0
0.5
1
1.5
2
2.5
3
3.5
0 2 4 6 8 10
Radius, mm
Ve
locit
y,
m/s 3.625 Dia
5.625
11.625 Dia
13.625 Dia
Figure 5 Velocity profile chart
Initially when the fluid flows out of the mixing nozzle, the flow is non-uniform across the cross
section of the tube. The mixing nozzle is designed in such a manner to create uniform flow
across the cross section. In the previous chapter we studied the response time taken by the gases
for complete mixing. Here we were trying to find an axial location downstream of the mixing
nozzle that would have uniform flow across the cross section.
Surface Temperature Model and Experimental Set up
Microcalorimetry
Studies, discussed below, indicate that microcalorimetry experiments have been conducted in
two different ways: the heated gas technique and the heated wire technique. In the heated-gas
technique [23], the pre-heated gas mixture determines the temperature of the catalyst. In the
absence of catalytic reactions the catalyst surface temperature is same as that of the gas mixture.
But in the presence of catalytic reactions, the surface temperature of the catalyst changes and
becomes higher than the ambient temperature. The lowest point at which the temperature of the
catalyst changes is defined as the ignition point and the corresponding temperature as the ignition
Ethanol-Water Catalytic Igniter Performance and Emissions Testing page 13
temperature. In the heated-wire technique, the gas mixture is heated locally at the catalyst surface
by the wire that is the active heating element. Of these two methods, the heated-wire technique
has been favored by most of the researchers in extracting kinetic and temperature data out of
catalytic reactions.
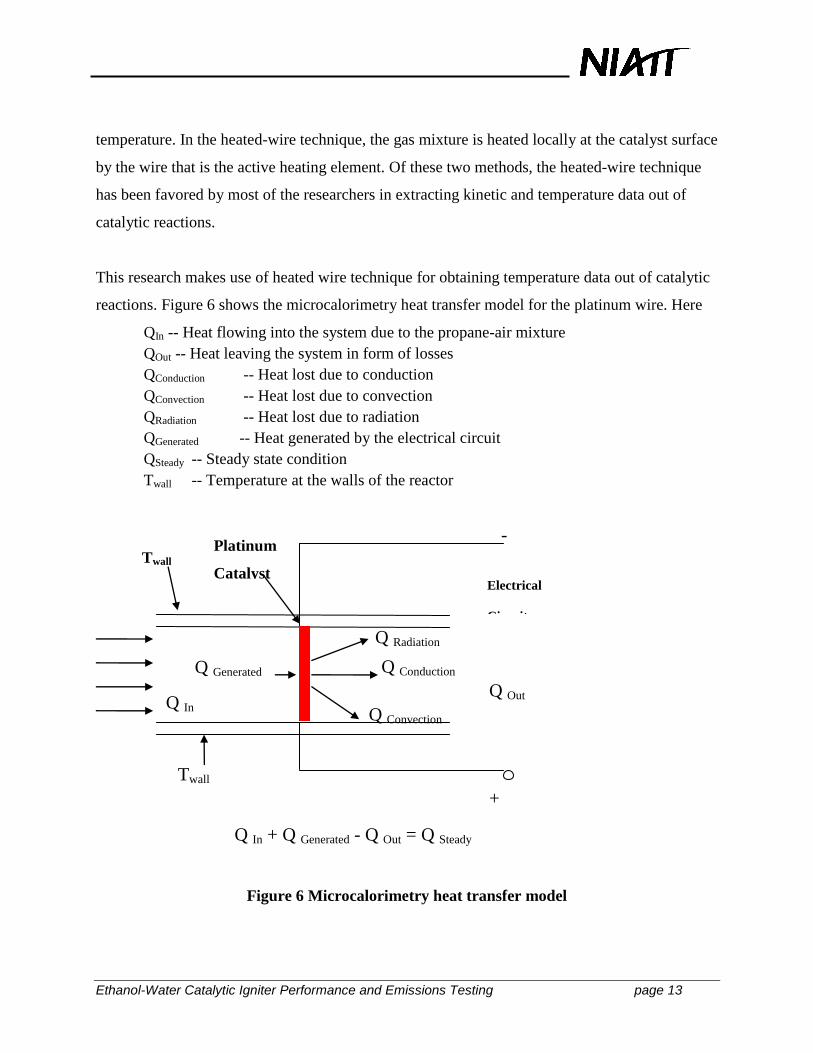
This research makes use of heated wire technique for obtaining temperature data out of catalytic
reactions. Figure 6 shows the microcalorimetry heat transfer model for the platinum wire. Here
QIn -- Heat flowing into the system due to the propane-air mixture
QOut -- Heat leaving the system in form of losses
QConduction -- Heat lost due to conduction
QConvection -- Heat lost due to convection
QRadiation -- Heat lost due to radiation
QGenerated -- Heat generated by the electrical circuit
QSteady -- Steady state condition
Twall -- Temperature at the walls of the reactor
Figure 6 Microcalorimetry heat transfer model
Q Conduction
Twall
Twall
Electrical
Circuit
Platinum
Catalyst
Q Radiation
Q In
Q Out
Q Generated
+
-
Q In + Q Generated - Q Out = Q Steady
Q Convection
Ethanol-Water Catalytic Igniter Performance and Emissions Testing page 14
The amount of energy entering into the system is the sum of Q In and Q Generated. The total
amount of energy lost due to conduction, convection and radiation is included in Q Out. In the
absence of gas flow over the platinum wire, the heat input to the system is solely the term
representing the heat generated by the electrical system. The total heat lost by the system is Q
Out. The temperature of the platinum catalyst can be determined from the equilibrium of heat
generation and the heat loss due to conduction, convection and radiation. The power required to
maintain the platinum catalyst at temperature T will be
RIP 2 [2]
where I is the current through the platinum wire and R is the resistance across the platinum wire
at temperature T . Here the quantity I is measured at the power supply unit and voltage V by
using the data acquisition control unit. Previous experimental studies [1] by researchers indicate
that wire geometries give more accurate measurement of surface temperature. Wire geometries
are easier to construct and are less susceptible to physical change with time. This research has
adopted wire geometry for its experimental investigation.
Data Acquisition
The experimental facility consists of catalyst configuration, digital flow system, variable power
supply unit, and computer data acquisition control unit for monitoring changes in voltage across
the circuit.
The reactor is designed for pressures ranging from 1-15 atmospheres and temperatures up to
1700 Kelvin. Its core diameter is 10 cm and it can handle both liquid and gaseous fuels. For the
work here, the reactor was operated at atmospheric pressure and a quartz tube replaced the metal
combustion section. Fuel nitrogen mixture was made to enter the reactor from the inlet port and
oxygen flows through the side port. Porter Mass Flow meters, Model 112 (flow meter)/ Model
202 and 202A (Flow controller) were used for measurement and control of gas flows.
A turbulence grid injection system was used as a mixing nozzle. The mixing nozzle ensured
timely and complete mixing. The design of the mixing nozzle was crucial; it needed to provide a
Ethanol-Water Catalytic Igniter Performance and Emissions Testing page 15
homogeneous mixture in a short period of time. A platinum catalyst was inserted downstream of
the mixing nozzle across the fluid flow in a quartz tube.
The most interesting feature of the experimental setup is the electronic circuitry that enables an
accurate measurement of ignition temperature. In these experiments the platinum wire performs
many functions simultaneously. It acts as a catalyst enabling surface reactions of propane-air
mixtures. It is connected to a variable power supply unit and acts as a constant source of heat
supply to the system. The 508-micron diameter platinum catalyst is connected to a data
acquisition control unit and computer for monitoring the changes in temperature and acts as a
temperature transducer.
Due to an increase in the functionality of the catalyst, the data acquisition control unit becomes
an integral part of the heating power system. The data acquisition control unit used for our
experiments has enough capacity to heat the catalyst to a high temperature favorable for
chemical reaction and at the same time and has enough sensitivity to respond to and detect small
changes in the power consumption.
For non-reactive conditions where no gas flows over the platinum wire, the voltage and current
readings represent the power required to heat and then maintain the platinum catalyst at a
constant temperature. Under the influence of fluid flow over the platinum wire the thermal
equilibrium is disturbed due to the chemical reactions at the surface of the catalyst.
Test Apparatus
The platinum catalyst used for these experiments was purchased from Surepure Chemetals. It is
highly resistant to corrosion and electrochemical attack and its purity is 99.99 percent. A simple
straight platinum wire of 508-micron diameter was used for these experiments. The axis of the
platinum wire was perpendicular to the direction of fluid flow. The average surface temperature
of the platinum catalyst was calculated from the measurement of the change in its resistance.
Ethanol-Water Catalytic Igniter Performance and Emissions Testing page 16
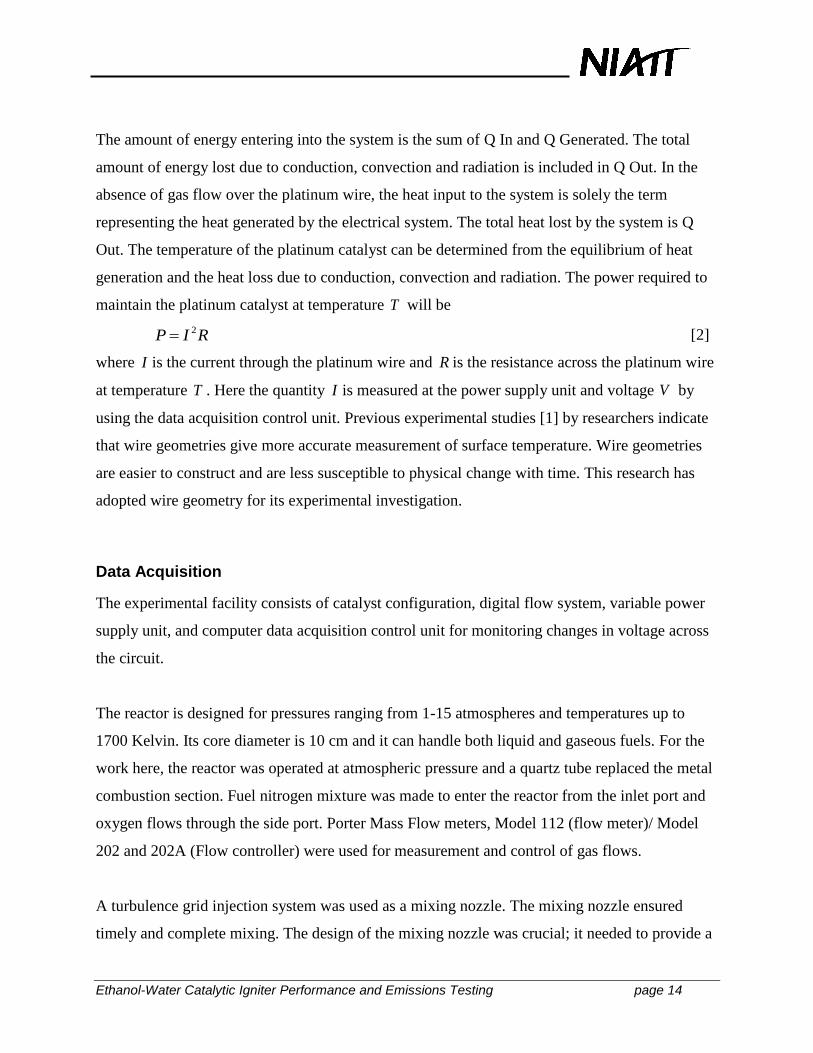
Figure 7 Flow diagram of propane-air mixture ignition
Figure 7 is a flow diagram of propane-air ignition by a platinum catalyst. With the Pt wire
connected to a variable power supply and monitoring of voltage, power to the wire was slowly
increased as a propane-air mixture was passed over the wire.
As the temperature of the wire increased, the corresponding change in resistance was calculated
and the average wire temperature found from Equation 3. The average surface temperature
obtained was used for comparison with the FEA model results.
The electrical resistance of platinum varies as
R = Ro (1 + α [T – To]) [3]
where R is the electrical resistance at temperature T, Ro is the electrical resistance at temperature
To, and α is the resistivity of Pt, a property of the metal.
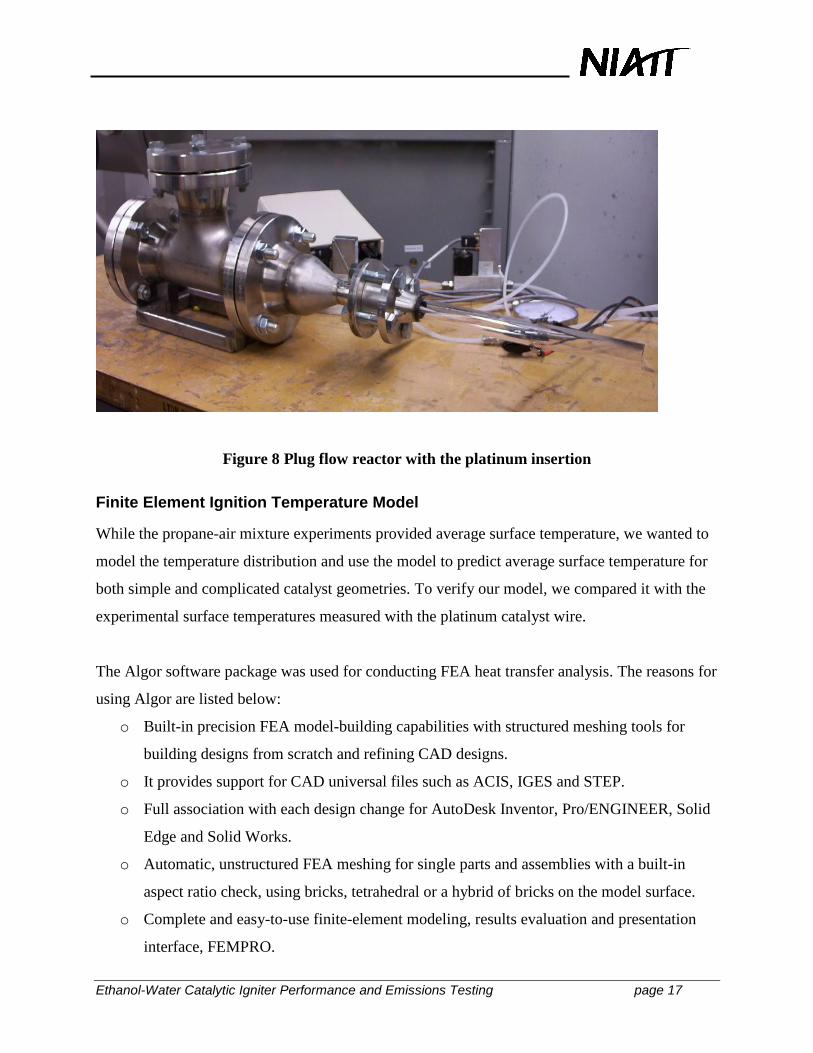
Figure 8 shows the plug flow reactor with the platinum catalyst inserted 5.625 diameters
downstream of the mixing nozzle. The 508-micron diameter platinum catalyst is connected to a
variable power supply unit and the voltage changes with the flow of propane-air mixture over the
wire are recorded using the data acquisition control unit.
Platinum
Catalyst
Power
Supply Propane -Air Mixture
+
-
Voltmeter
R = Ro [1 + α [T – To]
Ethanol-Water Catalytic Igniter Performance and Emissions Testing page 17
Figure 8 Plug flow reactor with the platinum insertion
Finite Element Ignition Temperature Model
While the propane-air mixture experiments provided average surface temperature, we wanted to
model the temperature distribution and use the model to predict average surface temperature for
both simple and complicated catalyst geometries. To verify our model, we compared it with the
experimental surface temperatures measured with the platinum catalyst wire.
The Algor software package was used for conducting FEA heat transfer analysis. The reasons for
using Algor are listed below:
o Built-in precision FEA model-building capabilities with structured meshing tools for
building designs from scratch and refining CAD designs.
o It provides support for CAD universal files such as ACIS, IGES and STEP.
o Full association with each design change for AutoDesk Inventor, Pro/ENGINEER, Solid
Edge and Solid Works.
o Automatic, unstructured FEA meshing for single parts and assemblies with a built-in
aspect ratio check, using bricks, tetrahedral or a hybrid of bricks on the model surface.
o Complete and easy-to-use finite-element modeling, results evaluation and presentation
interface, FEMPRO.
Ethanol-Water Catalytic Igniter Performance and Emissions Testing page 18
This section contains information on three-dimensional FEA studies conducted to understand the
relationship between the surface temperature and power supply. Relative significance of fuel/air
surface heating, axial conduction to the catalyst supports, surface heat generation, supplemental
electrical heating, radiative losses, and convective losses have been documented from the finite
element studies and preliminary experiments. Of particular interest is the temperature
distribution along the length of the platinum catalyst and comparison of the calculated and
measured average wire temperature.
Finite Element Model (Algor)
A 3-D element representing a platinum catalyst was first created in SUPERDRAW and then
exported to FEMPRO‘S FEA Editor environment. Initially, I planned to achieve the temperature
distribution using a steady state heat transfer analysis. Modeling in FEMPRO‘S FEA Editor
environment involves the following steps.
We imported the already developed SUPERDRAW file into FEA, created a meshed model,
specified data needed for analysis including the analysis type, element type, and element
definition. Next we selected the material, added the applied temperatures, specified surface
properties, which included calculating the convection coefficient, ambient temperature, heat flux,
fluid properties and wall temperature. Finally we checked the model geometry and finite element
data to verify that it is ready for analysis.
Input parameters
We considered a platinum catalyst (cylinder) of 254-micron diameter and 0.015 m long in
SOLID WORKS. The surface in contact with the wire supports was kept at room temperature,
25 C0 . The entire outer surface was exposed to convection cooling by the fluid flow. For this
particular case study ,the Reynolds number was taken as 2,400 to have a similarity with the
experimental conditions. The temperature profile is symmetrical; the bottom surface of the FEA
model corresponds to the intersection of the catalytic wire and the axial centerline of the reactor
Ethanol-Water Catalytic Igniter Performance and Emissions Testing page 19
tube. The temperature profile is symmetrical; the bottom surface of the FEA model corresponds
to the intersection of the catalytic wire and the axial centerline of the reactor tube.
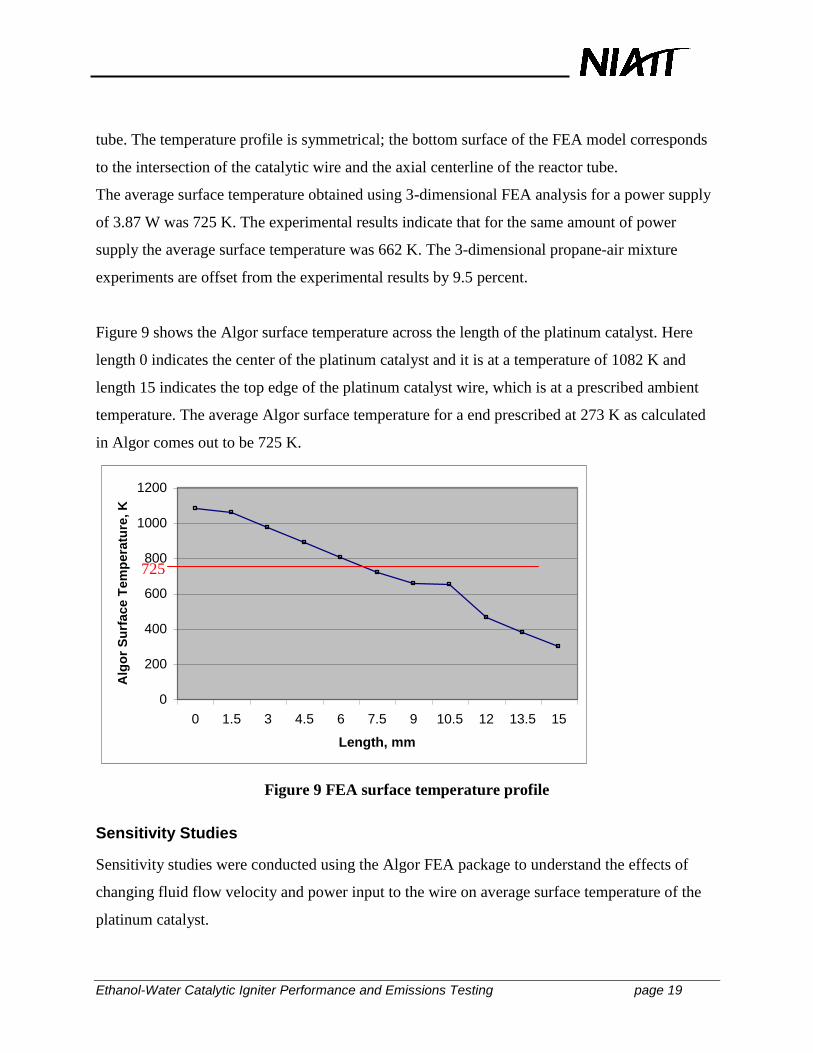
The average surface temperature obtained using 3-dimensional FEA analysis for a power supply
of 3.87 W was 725 K. The experimental results indicate that for the same amount of power
supply the average surface temperature was 662 K. The 3-dimensional propane-air mixture
experiments are offset from the experimental results by 9.5 percent.
Figure 9 shows the Algor surface temperature across the length of the platinum catalyst. Here
length 0 indicates the center of the platinum catalyst and it is at a temperature of 1082 K and
length 15 indicates the top edge of the platinum catalyst wire, which is at a prescribed ambient
temperature. The average Algor surface temperature for a end prescribed at 273 K as calculated
in Algor comes out to be 725 K.
0
200
400
600
800
1000
1200
0 1.5 3 4.5 6 7.5 9 10.5 12 13.5 15
Length, mm
Alg
or
Su
rface T
em
pera
ture
, K
Figure 9 FEA surface temperature profile
Sensitivity Studies
Sensitivity studies were conducted using the Algor FEA package to understand the effects of
changing fluid flow velocity and power input to the wire on average surface temperature of the
platinum catalyst.
725
Ethanol-Water Catalytic Igniter Performance and Emissions Testing page 20
The fluid velocity for this particular case study was 1.52 m/s. We wereinterested in studying the
changes in temperature with respect to the changes in fluid velocity. The other parameters--mesh
size, heat flux, and wire geometry--are kept constant. The results indicate that as fluid flow
velocity is increased, convective heat losses also increase and so there is a decrease in the
average Algor surface temperature. This agrees with the theory and experimental results and this
is verification that the FEA model is correct.
Calculations were carried out to study the average temperature variation with the changes in the
power supply. The results show an increase in average catalyst temperature with the changes in
the power supply. As the heat input to the system increases, the average catalyst temperature
increases. In the laboratory experiments we observed a similar trend. This concurs with the
theoretical analysis. As the heat input to the system is increased the catalyst temperature
increases. In laboratory experiments a similar trend was observed. This makes us to believe that
our model is correct.
Finite Element Energy Balance Model
An analytical model was derived to obtain a temperature distribution along the length of the
platinum catalyst in terms of temperature of inflowing fuel air mixture, thermal conductivity of
platinum catalyst, length and cross-sectional area of the platinum wire, coefficient of heat
transfer from the gas to the surface, perimeter of the platinum wire and temperature of the walls.
The following assumptions were made for this model
Assumptions
o The temperature of the propane-air mixture surrounding the platinum catalyst is uniform.
o The temperature variation in the radial direction is the platinum wire is negligible
compared to the temperature gradient along its length.
o The ends of the platinum catalyst are at known temperatures.
o We assume a steady state heat transfer process involving heat generation.
o Negligible radiation exchange with the surroundings.
Ethanol-Water Catalytic Igniter Performance and Emissions Testing page 21
o Uniform convection coefficient over outer surface of the Pt wire.
o We then developed a differential equation for the temperature distribution at various
points along the length of the platinum wire by means of a balance of the following
quantities
o Conductive heat flow into and out of a differential section dx , of the platinum catalyst.
o Heat loss from the wire due to convection cooling by the inflowing fuel air mixture.
o Heat generated per unit volume in the differential section, dx, by the constant temperature
anemometer circuit.
Boundary Conditions
The boundary conditions were obtained by expressing mathematically the following
o The temperature at the ends of the platinum catalyst is equal to the wall temperature.
o There is heat generation due to electrical heating. The BC is that the maximum
temperature of the wire occurs at its geometrical center.
o Hence, at that location, 0/ dxdT
Based on these assumptions, applying laws of heat transfer and specifying the above boundary
conditions, we obtained a temperature distribution along the length of the platinum wire.
Ethanol-Water Catalytic Igniter Performance and Emissions Testing page 22
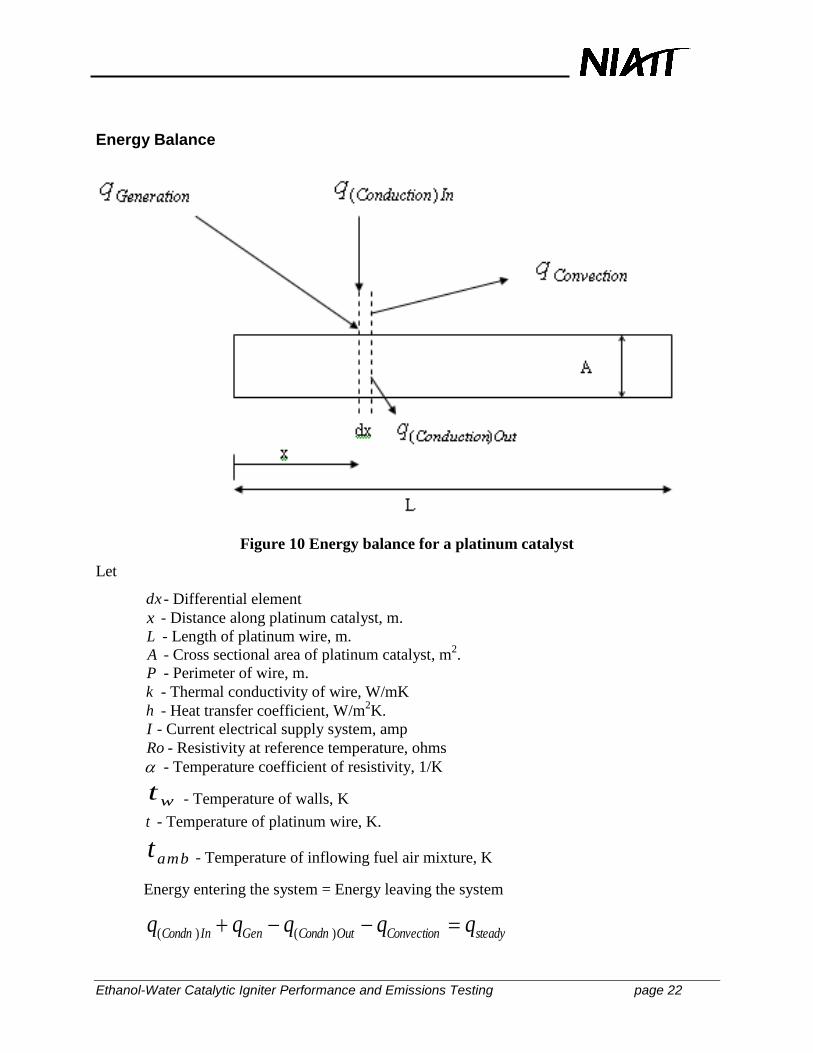
Energy Balance
Figure 10 Energy balance for a platinum catalyst
Let
dx - Differential element
x - Distance along platinum catalyst, m.
L - Length of platinum wire, m.
A - Cross sectional area of platinum catalyst, m2.
P - Perimeter of wire, m.
k - Thermal conductivity of wire, W/mK
h - Heat transfer coefficient, W/m2K.
I - Current electrical supply system, amp
Ro - Resistivity at reference temperature, ohms
- Temperature coefficient of resistivity, 1/K
wt - Temperature of walls, K
t - Temperature of platinum wire, K.
ambt - Temperature of inflowing fuel air mixture, K
Energy entering the system = Energy leaving the system
steadyConvectionOutCondnGenInCondn qqqqq )()(
Ethanol-Water Catalytic Igniter Performance and Emissions Testing page 23
Parameters Investigated
Ignition of propane-air mixtures over platinum wires at higher Reynolds number was
experimentally studied by using microcalorimetry. Parameters investigated included average
surface temperature, flow velocity, and equivalence ratio. The meaning of the word ‗ignition‘
used in the combustion field is much different than that used in day-to-day life. In the
combustion field, the word ignition can signify different moments in the process of producing an
explosion. The theory of ignition has been defined by two different approaches: kinetic theory
and thermal theory. According to kinetic theory, ignition is defined as the point at which the
production of radicals due to chain branching exceeds the destruction due to chain termination
and product formation [25]. From the thermal point of view, ignition temperature is defined as
the lowest temperature at which a measurable amount of heat is released from chemical reactions
[6]. The propane-air mixture experiments described here take the thermal approach into account
for analysis.
When an ignitable gas stream is made to flow over the wire, some chemical heat is generated at
the surface of the wire due to the surface reactions occurring between the fuel air mixture and the
platinum wire. Hence, less electrical heating is needed to maintain the surface at the same
temperature T . In order to have greater control on the accuracy and precision of the analysis,
instead of a bare platinum wire a catalyst/sensor prepared in a thin film by depositing catalytic
material on a ceramic substrate can be used. Robben et al. [24] have used the heated-film micro
calorimetric technique to study catalyzed combustion of hydrogen/air mixtures in a flat plate
boundary layer. Activation energy and the pre-exponential constants are determined from the
heat release rate measurements in conjunction with numerical computation of the boundary layer
combustion model.
Theoretical Analysis
Figure 21 shows a theoretical model of the energy fluxes resulting from heat generation by
(electrical heating and exothermic reaction) and heat loss due to conduction, convection and
radiation. As shown in Figure 21, for a given concentration of reactants the heat generation curve
as a function of catalyst temperature exhibits the typical sigmoidal shape, while the heat loss
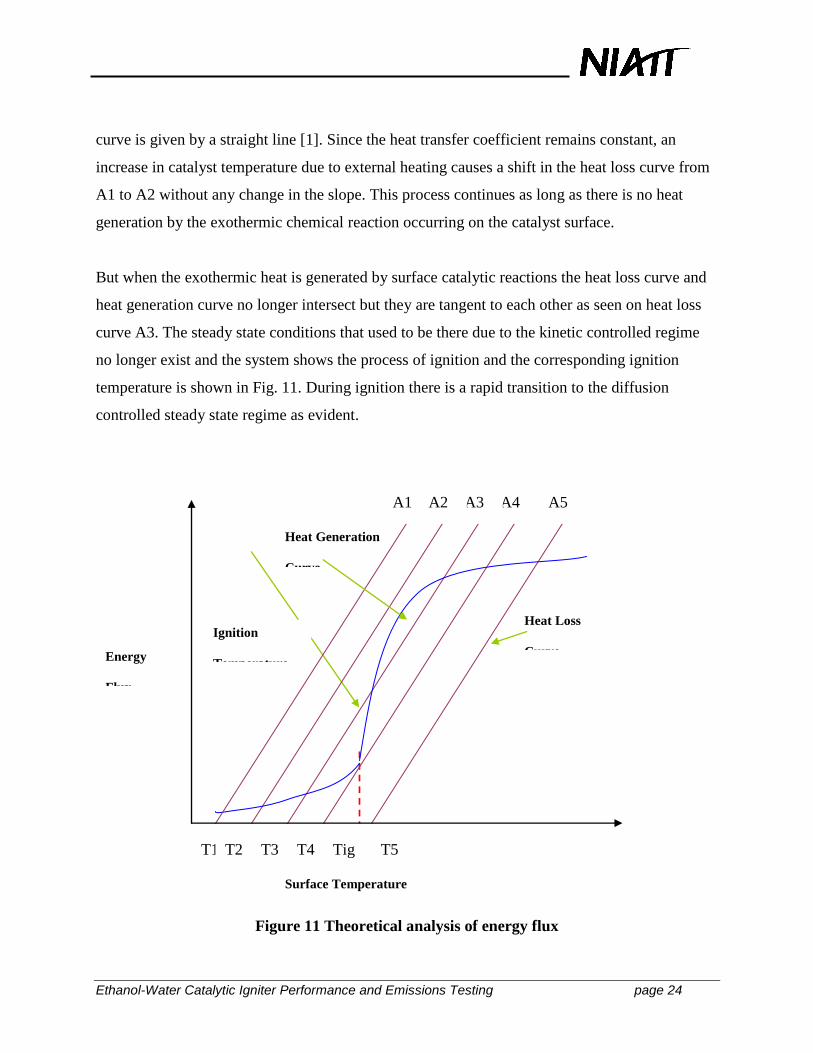
Ethanol-Water Catalytic Igniter Performance and Emissions Testing page 24
curve is given by a straight line [1]. Since the heat transfer coefficient remains constant, an
increase in catalyst temperature due to external heating causes a shift in the heat loss curve from
A1 to A2 without any change in the slope. This process continues as long as there is no heat
generation by the exothermic chemical reaction occurring on the catalyst surface.
But when the exothermic heat is generated by surface catalytic reactions the heat loss curve and
heat generation curve no longer intersect but they are tangent to each other as seen on heat loss
curve A3. The steady state conditions that used to be there due to the kinetic controlled regime
no longer exist and the system shows the process of ignition and the corresponding ignition
temperature is shown in Fig. 11. During ignition there is a rapid transition to the diffusion
controlled steady state regime as evident.
Figure 11 Theoretical analysis of energy flux
Energy
Flux
T1 T2 T3 T4 T5
Ignition
Temperature
Surface Temperature
Heat Generation
Curve
Heat Loss
Curve
A1
Tig
A5 A4 A3 A2
Ethanol-Water Catalytic Igniter Performance and Emissions Testing page 25
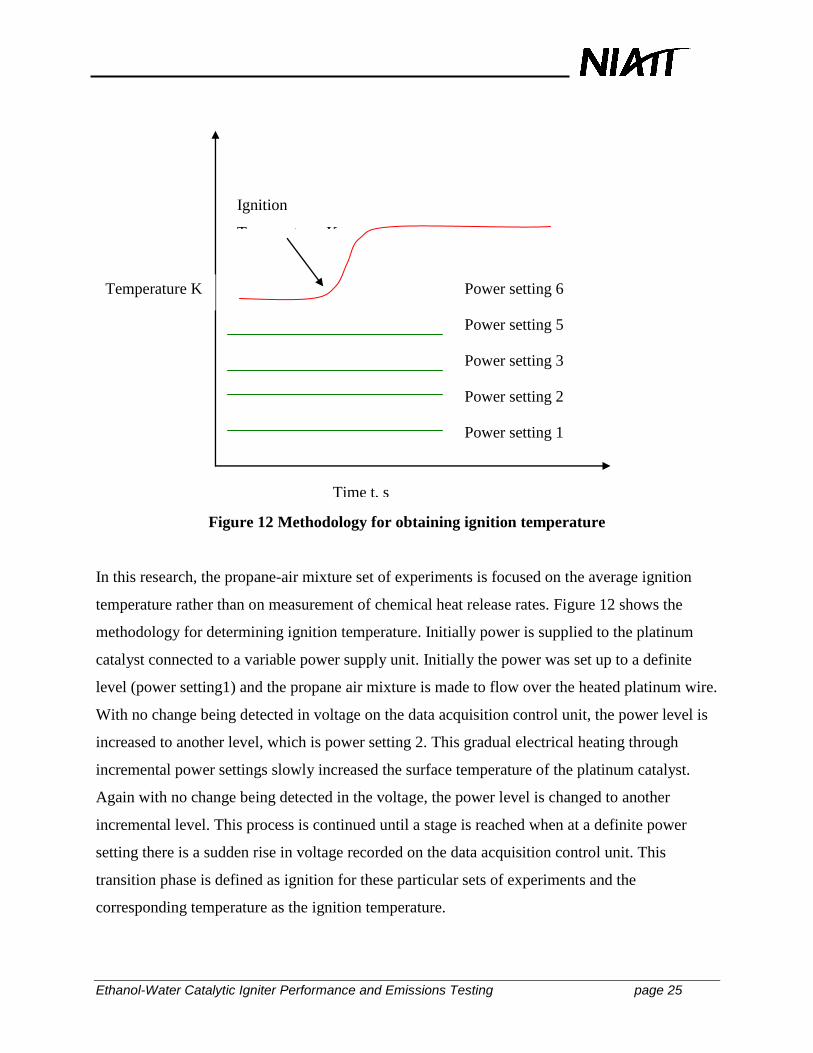
Figure 12 Methodology for obtaining ignition temperature
In this research, the propane-air mixture set of experiments is focused on the average ignition
temperature rather than on measurement of chemical heat release rates. Figure 12 shows the
methodology for determining ignition temperature. Initially power is supplied to the platinum
catalyst connected to a variable power supply unit. Initially the power was set up to a definite
level (power setting1) and the propane air mixture is made to flow over the heated platinum wire.
With no change being detected in voltage on the data acquisition control unit, the power level is
increased to another level, which is power setting 2. This gradual electrical heating through
incremental power settings slowly increased the surface temperature of the platinum catalyst.
Again with no change being detected in the voltage, the power level is changed to another
incremental level. This process is continued until a stage is reached when at a definite power
setting there is a sudden rise in voltage recorded on the data acquisition control unit. This
transition phase is defined as ignition for these particular sets of experiments and the
corresponding temperature as the ignition temperature.
Time t, s
Temperature K
Ignition
Temperature, K
Power setting 1
Power setting 2
Power setting 3
Power setting 5
Power setting 6
Ethanol-Water Catalytic Igniter Performance and Emissions Testing page 26
In addition to electrical heating of the platinum wire, additional heat is generated due to the
chemical reactions occurring on the surface of the catalyst. Hence, the temperature of the
platinum catalyst increases. This small increase in temperature of the catalyst is reflected as an
increase in its resistance. For the same amount of current flowing through it, the final voltage
reading becomes greater than the initial voltage reading. This change in voltage reading is
successfully detected by using a data acquisition control unit connected to a computer.
Finding
Successful completion of experimental and finite element studies on plug flow combustion of
propane-air mixtures completes a major milestone in the exploration of catalytic ignition of
Aquanol air mixtures over platinum wires. This section summarizes results for plug flow
experiments, surface temperature experiments, and the finite element model.
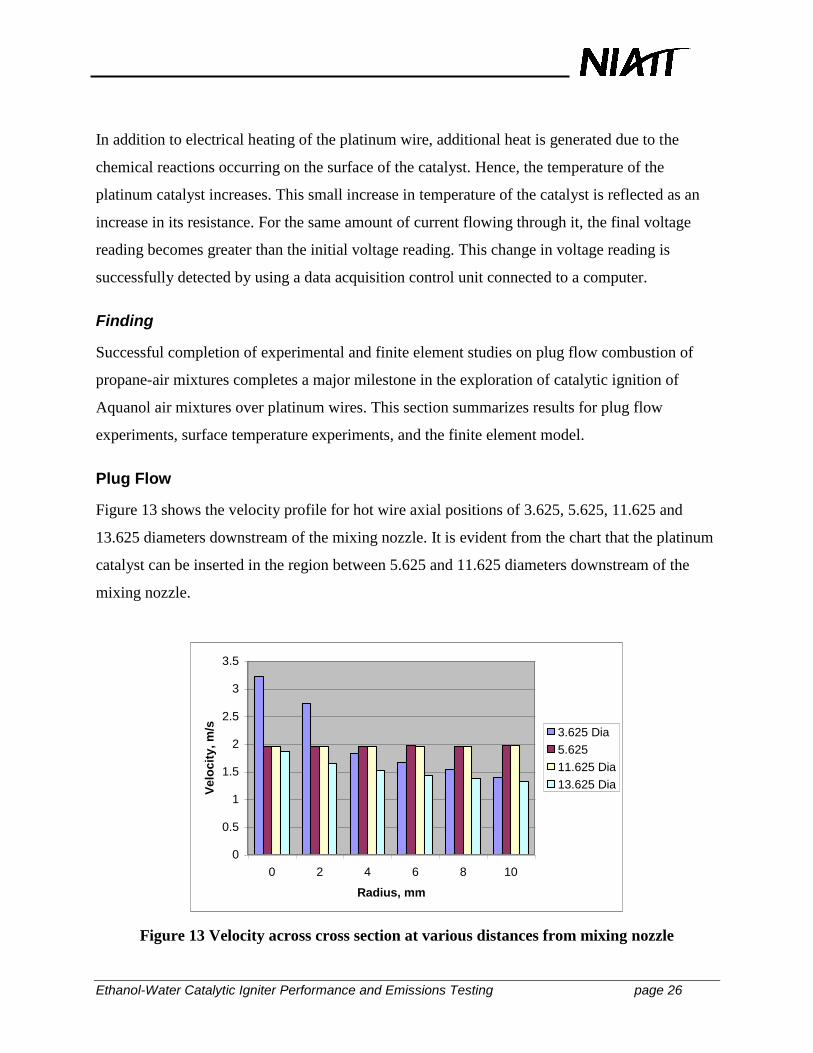
Plug Flow
Figure 13 shows the velocity profile for hot wire axial positions of 3.625, 5.625, 11.625 and
13.625 diameters downstream of the mixing nozzle. It is evident from the chart that the platinum
catalyst can be inserted in the region between 5.625 and 11.625 diameters downstream of the
mixing nozzle.
0
0.5
1
1.5
2
2.5
3
3.5
0 2 4 6 8 10
Radius, mm
Ve
locit
y,
m/s 3.625 Dia
5.625
11.625 Dia
13.625 Dia
Figure 13 Velocity across cross section at various distances from mixing nozzle
Ethanol-Water Catalytic Igniter Performance and Emissions Testing page 27
The volumetric flow rate was estimated at each of the axial positions by summing the product of
the velocity at each radial position and the area of the annular region that the probe was centered
on. These calculations were within 10 percent of expected and the difference is suspected to be
uncertainty in the probe velocitymeasurement. Based on these results, the platinum catalyst was
inserted at 5.625 diameters downstream of the mixing nozzle.
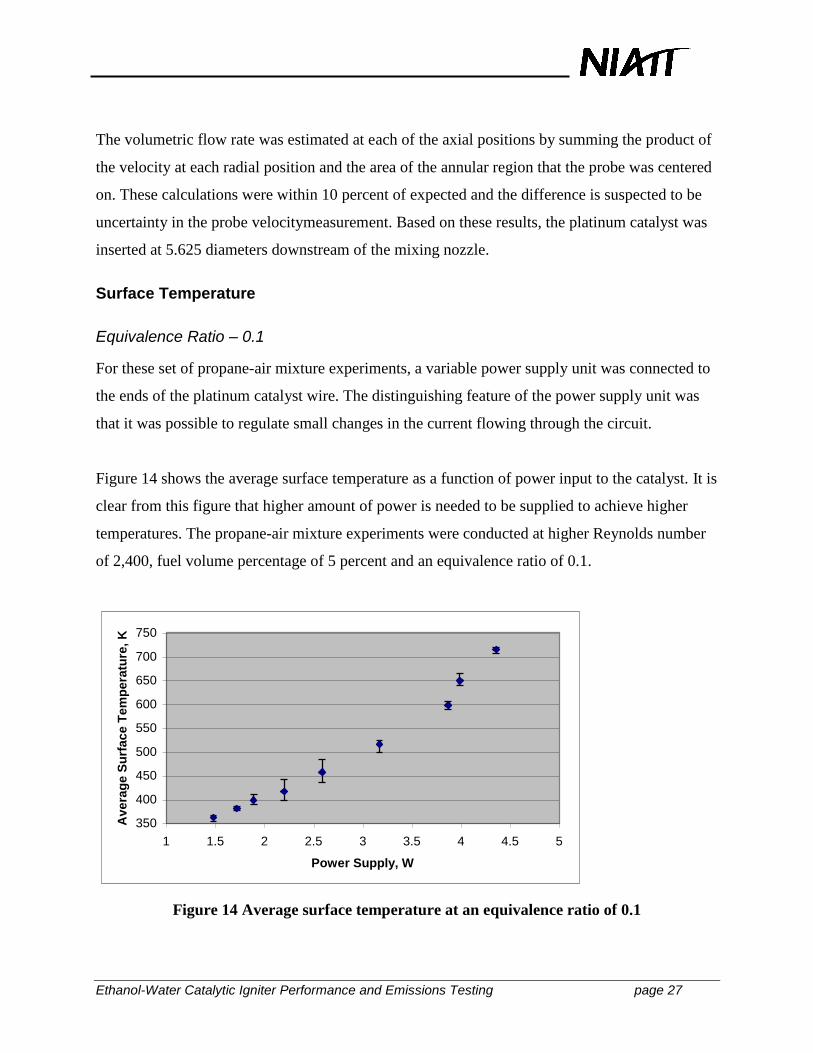
Surface Temperature
Equivalence Ratio – 0.1
For these set of propane-air mixture experiments, a variable power supply unit was connected to
the ends of the platinum catalyst wire. The distinguishing feature of the power supply unit was
that it was possible to regulate small changes in the current flowing through the circuit.
Figure 14 shows the average surface temperature as a function of power input to the catalyst. It is
clear from this figure that higher amount of power is needed to be supplied to achieve higher
temperatures. The propane-air mixture experiments were conducted at higher Reynolds number
of 2,400, fuel volume percentage of 5 percent and an equivalence ratio of 0.1.
350
400
450
500
550
600
650
700
750
1 1.5 2 2.5 3 3.5 4 4.5 5
Power Supply, W
Av
era
ge
Su
rfa
ce
Te
mp
era
ture
, K
Figure 14 Average surface temperature at an equivalence ratio of 0.1
Ethanol-Water Catalytic Igniter Performance and Emissions Testing page 28
The plot shows that the surface temperature of the catalyst wire rises from 362 K to 715 K when
the power input is increased from 1.48 W to 4.36 W at an equivalence ratio of 0.1. The plot
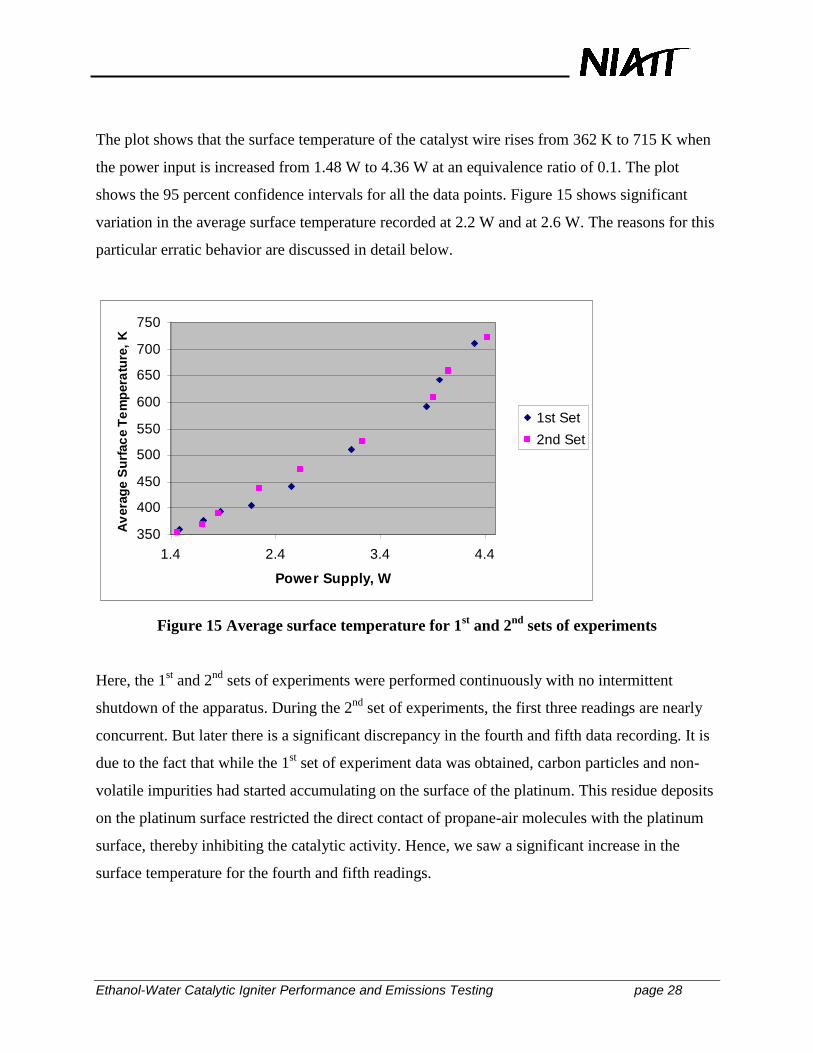
shows the 95 percent confidence intervals for all the data points. Figure 15 shows significant
variation in the average surface temperature recorded at 2.2 W and at 2.6 W. The reasons for this
particular erratic behavior are discussed in detail below.
350
400
450
500
550
600
650
700
750
1.4 2.4 3.4 4.4
Power Supply, W
Av
era
ge S
urf
ac
e T
em
pera
ture
, K
1st Set
2nd Set
Figure 15 Average surface temperature for 1st and 2
nd sets of experiments
Here, the 1st and 2
nd sets of experiments were performed continuously with no intermittent
shutdown of the apparatus. During the 2nd
set of experiments, the first three readings are nearly
concurrent. But later there is a significant discrepancy in the fourth and fifth data recording. It is
due to the fact that while the 1st set of experiment data was obtained, carbon particles and non-
volatile impurities had started accumulating on the surface of the platinum. This residue deposits
on the platinum surface restricted the direct contact of propane-air molecules with the platinum
surface, thereby inhibiting the catalytic activity. Hence, we saw a significant increase in the
surface temperature for the fourth and fifth readings.
Ethanol-Water Catalytic Igniter Performance and Emissions Testing page 29
In order to avoid further discrepancies, the platinum catalyst was carefully taken out of the quartz
tube and was replaced by a new platinum wire. The new wire helped to eliminate the surface
temperature differences and it can be seen in the subsequent data recordings.
This set of experiments helped to understand the effect of aging of the catalyst on ignition.
Figure 25 shows that the average surface temperature is affected by the history of the catalytic
surface.
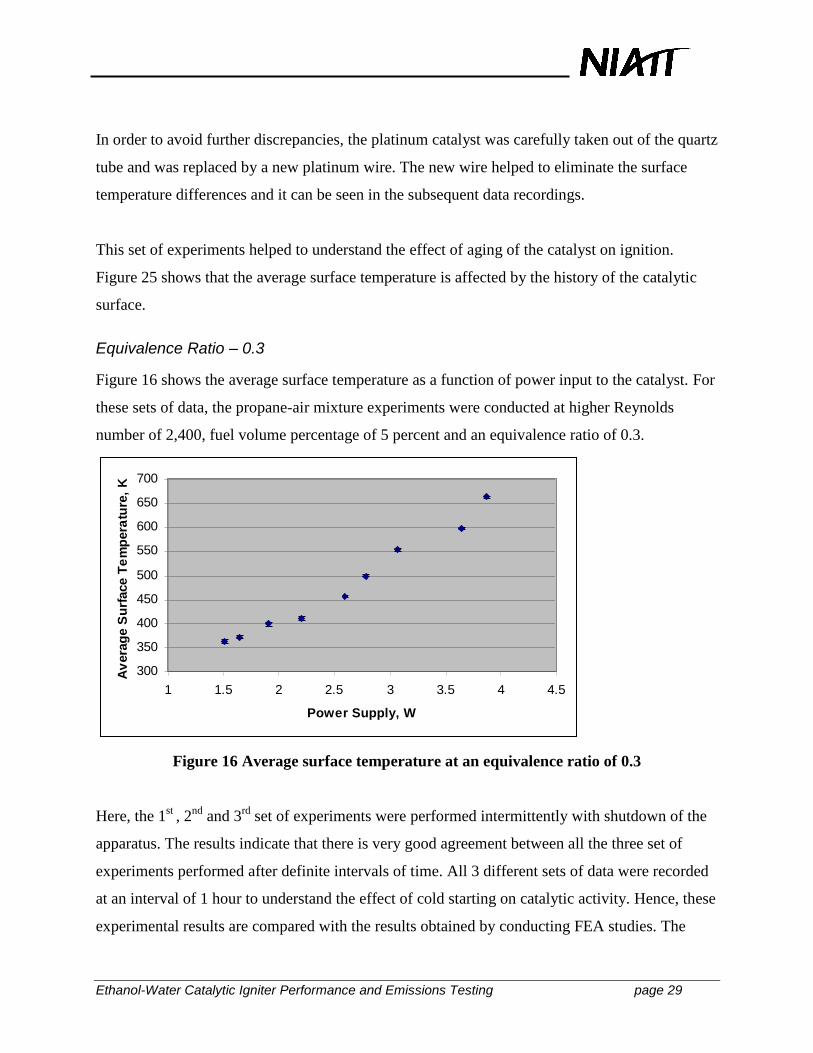
Equivalence Ratio – 0.3
Figure 16 shows the average surface temperature as a function of power input to the catalyst. For
these sets of data, the propane-air mixture experiments were conducted at higher Reynolds
number of 2,400, fuel volume percentage of 5 percent and an equivalence ratio of 0.3.
300
350
400
450
500
550
600
650
700
1 1.5 2 2.5 3 3.5 4 4.5
Power Supply, W
Av
era
ge S
urf
ace
Te
mp
era
ture
, K
Figure 16 Average surface temperature at an equivalence ratio of 0.3
Here, the 1st
, 2nd
and 3rd
set of experiments were performed intermittently with shutdown of the
apparatus. The results indicate that there is very good agreement between all the three set of
experiments performed after definite intervals of time. All 3 different sets of data were recorded
at an interval of 1 hour to understand the effect of cold starting on catalytic activity. Hence, these
experimental results are compared with the results obtained by conducting FEA studies. The
Ethanol-Water Catalytic Igniter Performance and Emissions Testing page 30
overall aim here is to determine the amount of electrical heating needed to reach a desired
surface temperature.
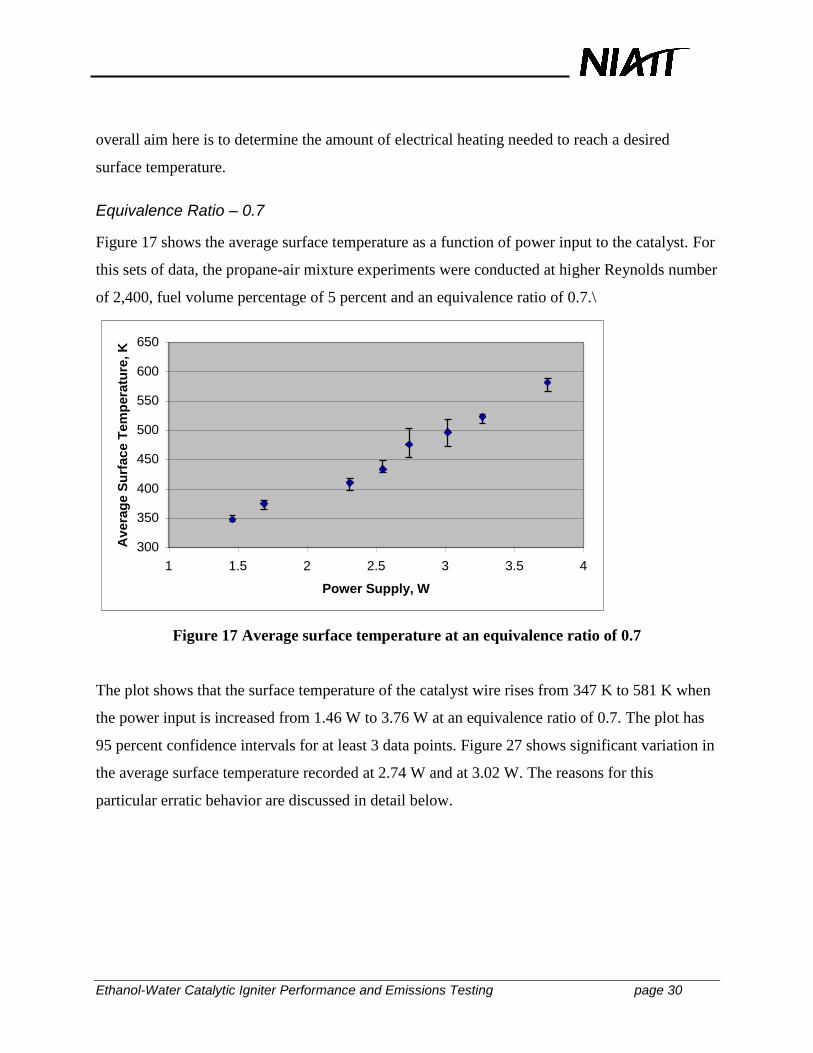
Equivalence Ratio – 0.7
Figure 17 shows the average surface temperature as a function of power input to the catalyst. For
this sets of data, the propane-air mixture experiments were conducted at higher Reynolds number
of 2,400, fuel volume percentage of 5 percent and an equivalence ratio of 0.7.\
300
350
400
450
500
550
600
650
1 1.5 2 2.5 3 3.5 4
Power Supply, W
Av
era
ge S
urf
ace T
em
pera
ture
, K
Figure 17 Average surface temperature at an equivalence ratio of 0.7
The plot shows that the surface temperature of the catalyst wire rises from 347 K to 581 K when
the power input is increased from 1.46 W to 3.76 W at an equivalence ratio of 0.7. The plot has
95 percent confidence intervals for at least 3 data points. Figure 27 shows significant variation in
the average surface temperature recorded at 2.74 W and at 3.02 W. The reasons for this
particular erratic behavior are discussed in detail below.
Ethanol-Water Catalytic Igniter Performance and Emissions Testing page 31
300
350
400
450
500
550
600
650
1 1.5 2 2.5 3 3.5 4
Power Supply, W
Avera
ge S
urf
ace T
em
pera
ture
, K
1st Set
2nd Set
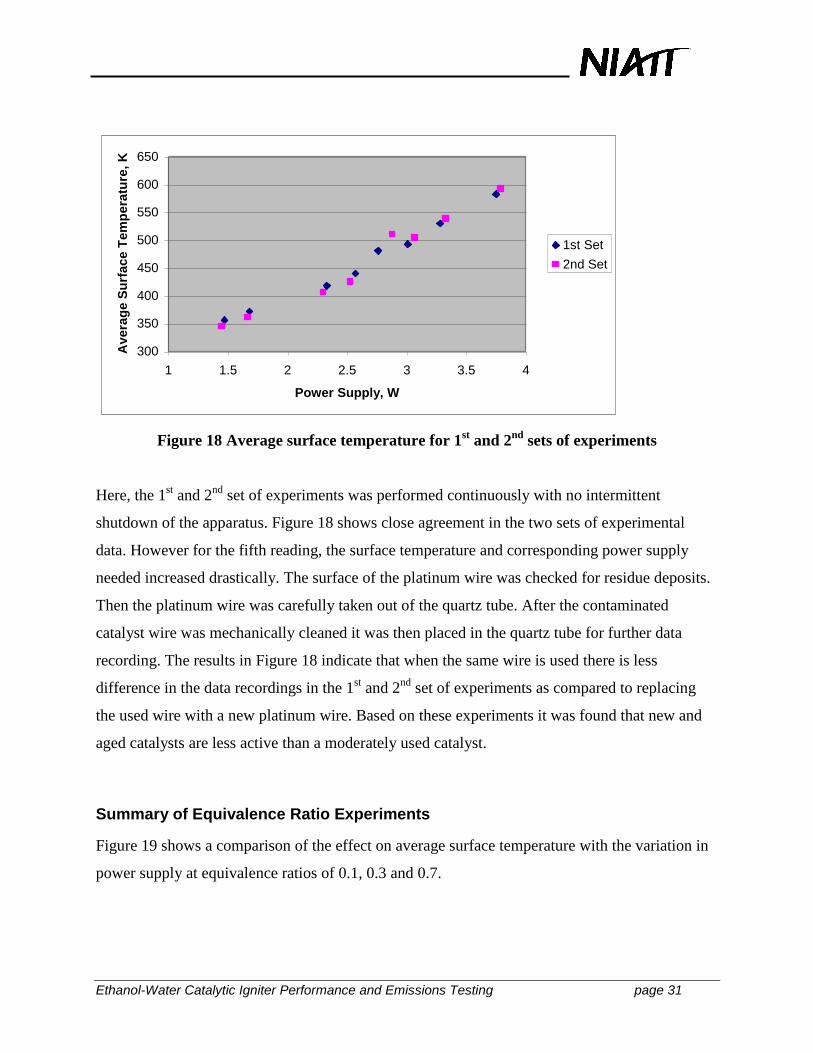
Figure 18 Average surface temperature for 1st and 2
nd sets of experiments
Here, the 1st and 2
nd set of experiments was performed continuously with no intermittent
shutdown of the apparatus. Figure 18 shows close agreement in the two sets of experimental
data. However for the fifth reading, the surface temperature and corresponding power supply
needed increased drastically. The surface of the platinum wire was checked for residue deposits.
Then the platinum wire was carefully taken out of the quartz tube. After the contaminated
catalyst wire was mechanically cleaned it was then placed in the quartz tube for further data
recording. The results in Figure 18 indicate that when the same wire is used there is less
difference in the data recordings in the 1st and 2
nd set of experiments as compared to replacing
the used wire with a new platinum wire. Based on these experiments it was found that new and
aged catalysts are less active than a moderately used catalyst.
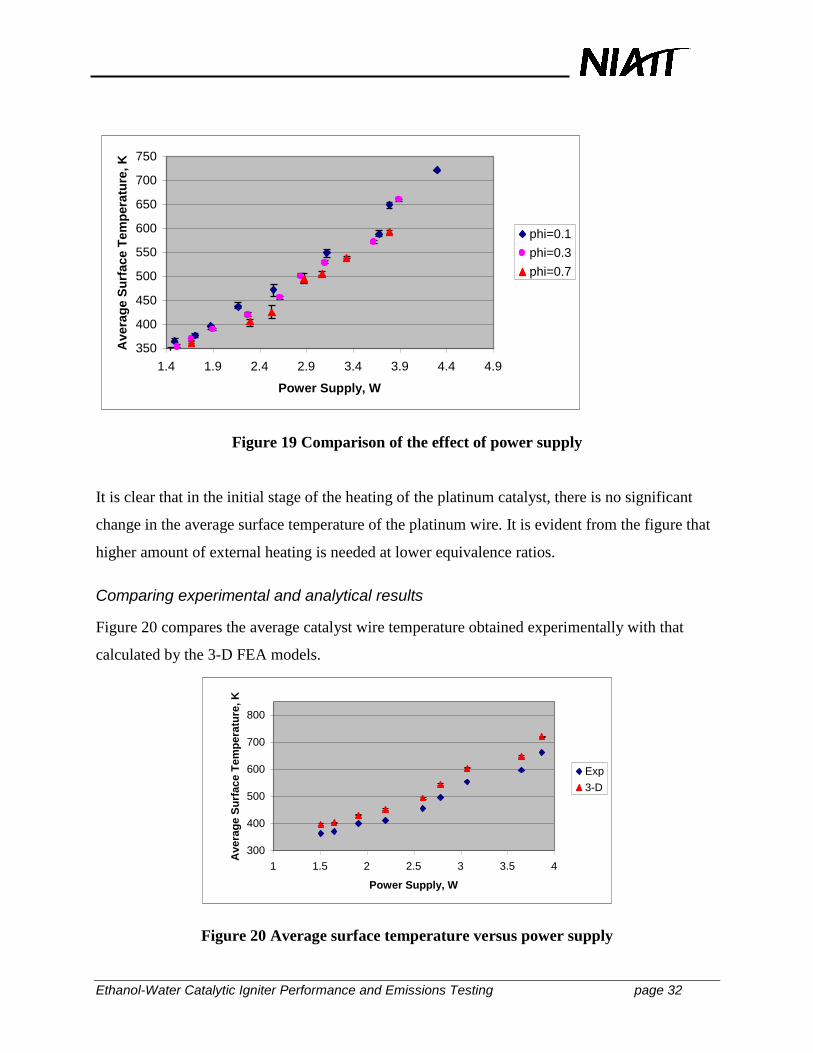
Summary of Equivalence Ratio Experiments
Figure 19 shows a comparison of the effect on average surface temperature with the variation in
power supply at equivalence ratios of 0.1, 0.3 and 0.7.
Ethanol-Water Catalytic Igniter Performance and Emissions Testing page 32
350
400
450
500
550
600
650
700
750
1.4 1.9 2.4 2.9 3.4 3.9 4.4 4.9
Power Supply, W
Av
era
ge
Su
rfa
ce
Te
mp
era
ture
, K
phi=0.1
phi=0.3
phi=0.7
Figure 19 Comparison of the effect of power supply
It is clear that in the initial stage of the heating of the platinum catalyst, there is no significant
change in the average surface temperature of the platinum wire. It is evident from the figure that
higher amount of external heating is needed at lower equivalence ratios.
Comparing experimental and analytical results
Figure 20 compares the average catalyst wire temperature obtained experimentally with that
calculated by the 3-D FEA models.
300
400
500
600
700
800
1 1.5 2 2.5 3 3.5 4
Power Supply, W
Ave
rag
e S
urf
ac
e T
em
pe
ratu
re,
K
Exp
3-D
Figure 20 Average surface temperature versus power supply
Ethanol-Water Catalytic Igniter Performance and Emissions Testing page 33
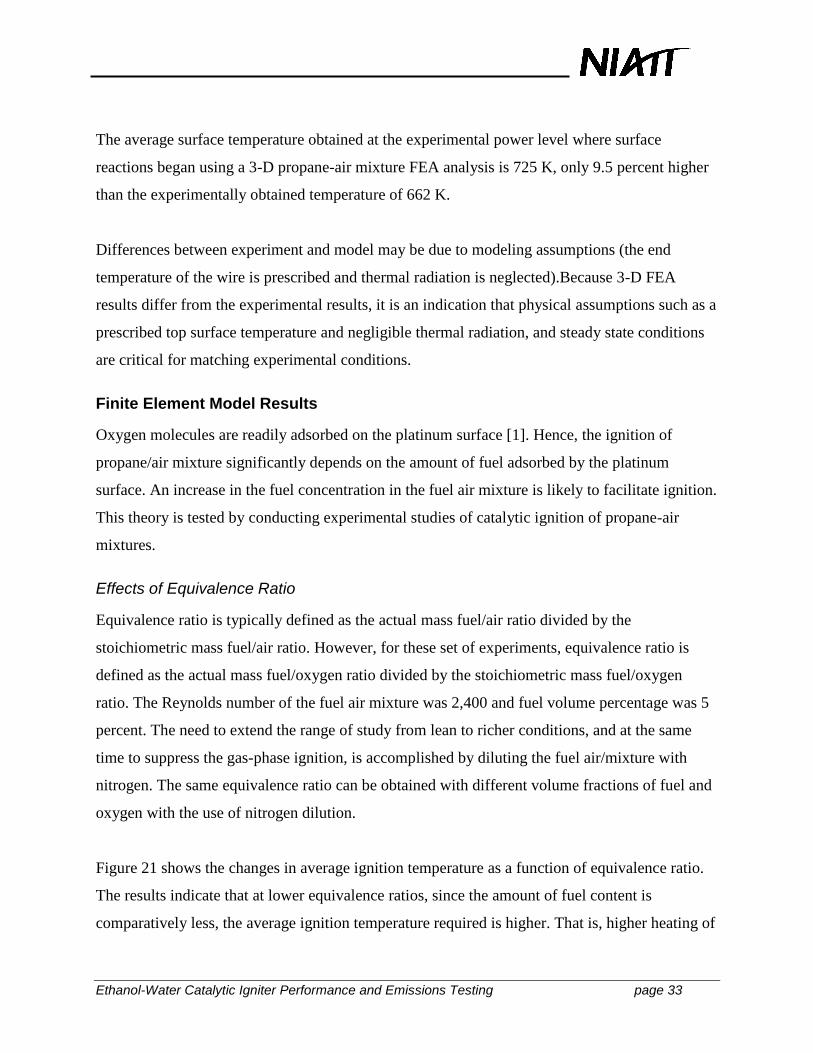
The average surface temperature obtained at the experimental power level where surface
reactions began using a 3-D propane-air mixture FEA analysis is 725 K, only 9.5 percent higher
than the experimentally obtained temperature of 662 K.
Differences between experiment and model may be due to modeling assumptions (the end
temperature of the wire is prescribed and thermal radiation is neglected).Because 3-D FEA
results differ from the experimental results, it is an indication that physical assumptions such as a
prescribed top surface temperature and negligible thermal radiation, and steady state conditions
are critical for matching experimental conditions.
Finite Element Model Results
Oxygen molecules are readily adsorbed on the platinum surface [1]. Hence, the ignition of
propane/air mixture significantly depends on the amount of fuel adsorbed by the platinum
surface. An increase in the fuel concentration in the fuel air mixture is likely to facilitate ignition.
This theory is tested by conducting experimental studies of catalytic ignition of propane-air
mixtures.
Effects of Equivalence Ratio
Equivalence ratio is typically defined as the actual mass fuel/air ratio divided by the
stoichiometric mass fuel/air ratio. However, for these set of experiments, equivalence ratio is
defined as the actual mass fuel/oxygen ratio divided by the stoichiometric mass fuel/oxygen
ratio. The Reynolds number of the fuel air mixture was 2,400 and fuel volume percentage was 5
percent. The need to extend the range of study from lean to richer conditions, and at the same
time to suppress the gas-phase ignition, is accomplished by diluting the fuel air/mixture with
nitrogen. The same equivalence ratio can be obtained with different volume fractions of fuel and
oxygen with the use of nitrogen dilution.
Figure 21 shows the changes in average ignition temperature as a function of equivalence ratio.
The results indicate that at lower equivalence ratios, since the amount of fuel content is
comparatively less, the average ignition temperature required is higher. That is, higher heating of
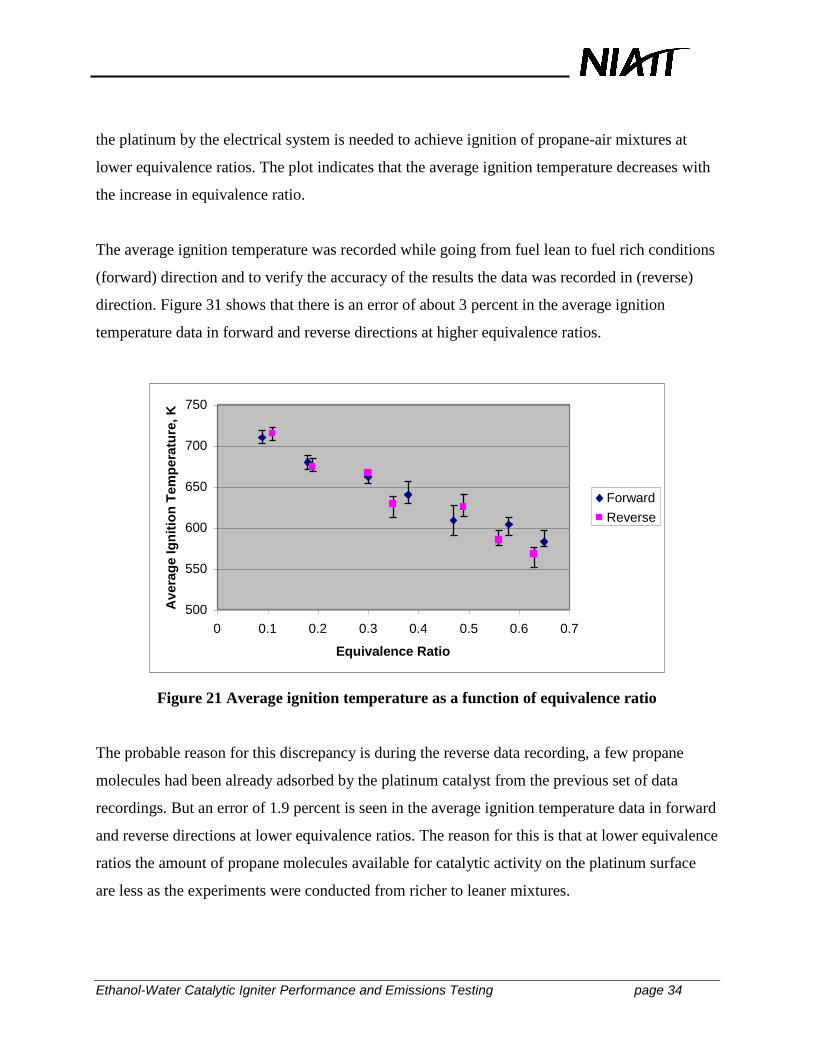
Ethanol-Water Catalytic Igniter Performance and Emissions Testing page 34
the platinum by the electrical system is needed to achieve ignition of propane-air mixtures at
lower equivalence ratios. The plot indicates that the average ignition temperature decreases with
the increase in equivalence ratio.
The average ignition temperature was recorded while going from fuel lean to fuel rich conditions
(forward) direction and to verify the accuracy of the results the data was recorded in (reverse)
direction. Figure 31 shows that there is an error of about 3 percent in the average ignition
temperature data in forward and reverse directions at higher equivalence ratios.
500
550
600
650
700
750
0 0.1 0.2 0.3 0.4 0.5 0.6 0.7
Equivalence Ratio
Av
era
ge I
gn
itio
n T
em
pera
ture
, K
Forward
Reverse
Figure 21 Average ignition temperature as a function of equivalence ratio
The probable reason for this discrepancy is during the reverse data recording, a few propane
molecules had been already adsorbed by the platinum catalyst from the previous set of data
recordings. But an error of 1.9 percent is seen in the average ignition temperature data in forward
and reverse directions at lower equivalence ratios. The reason for this is that at lower equivalence
ratios the amount of propane molecules available for catalytic activity on the platinum surface
are less as the experiments were conducted from richer to leaner mixtures.
Ethanol-Water Catalytic Igniter Performance and Emissions Testing page 35
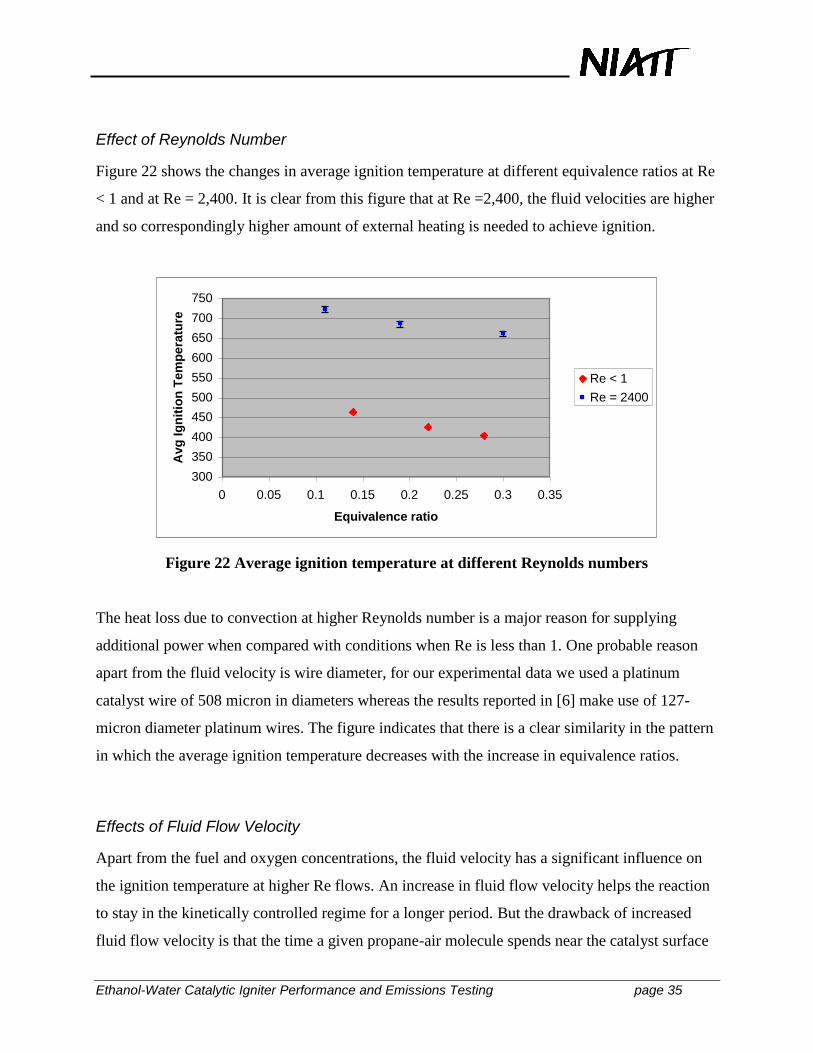
Effect of Reynolds Number
Figure 22 shows the changes in average ignition temperature at different equivalence ratios at Re
< 1 and at Re = 2,400. It is clear from this figure that at Re =2,400, the fluid velocities are higher
and so correspondingly higher amount of external heating is needed to achieve ignition.
300
350
400
450
500
550
600
650
700
750
0 0.05 0.1 0.15 0.2 0.25 0.3 0.35
Equivalence ratio
Avg
Ig
nit
ion
Te
mp
era
ture
Re < 1
Re = 2400
Figure 22 Average ignition temperature at different Reynolds numbers
The heat loss due to convection at higher Reynolds number is a major reason for supplying
additional power when compared with conditions when Re is less than 1. One probable reason
apart from the fluid velocity is wire diameter, for our experimental data we used a platinum
catalyst wire of 508 micron in diameters whereas the results reported in [6] make use of 127-
micron diameter platinum wires. The figure indicates that there is a clear similarity in the pattern
in which the average ignition temperature decreases with the increase in equivalence ratios.
Effects of Fluid Flow Velocity
Apart from the fuel and oxygen concentrations, the fluid velocity has a significant influence on
the ignition temperature at higher Re flows. An increase in fluid flow velocity helps the reaction
to stay in the kinetically controlled regime for a longer period. But the drawback of increased
fluid flow velocity is that the time a given propane-air molecule spends near the catalyst surface
Ethanol-Water Catalytic Igniter Performance and Emissions Testing page 36
decreases [6]. The residence time of the reactants within the reacting environment decreases. The
propane-air molecules have less time to react and consequently it is difficult to achieve ignition.
However, a higher catalyst surface temperature can facilitate a more intense reacting
environment, wherein the molecules of the propane-air mixture are equally excited in a shorter
period to time [6]. Also, when the fluid velocity is increased, the heat losses due to convection
increase. Hence, a mixture flowing at a higher flow velocity would require a correspondingly
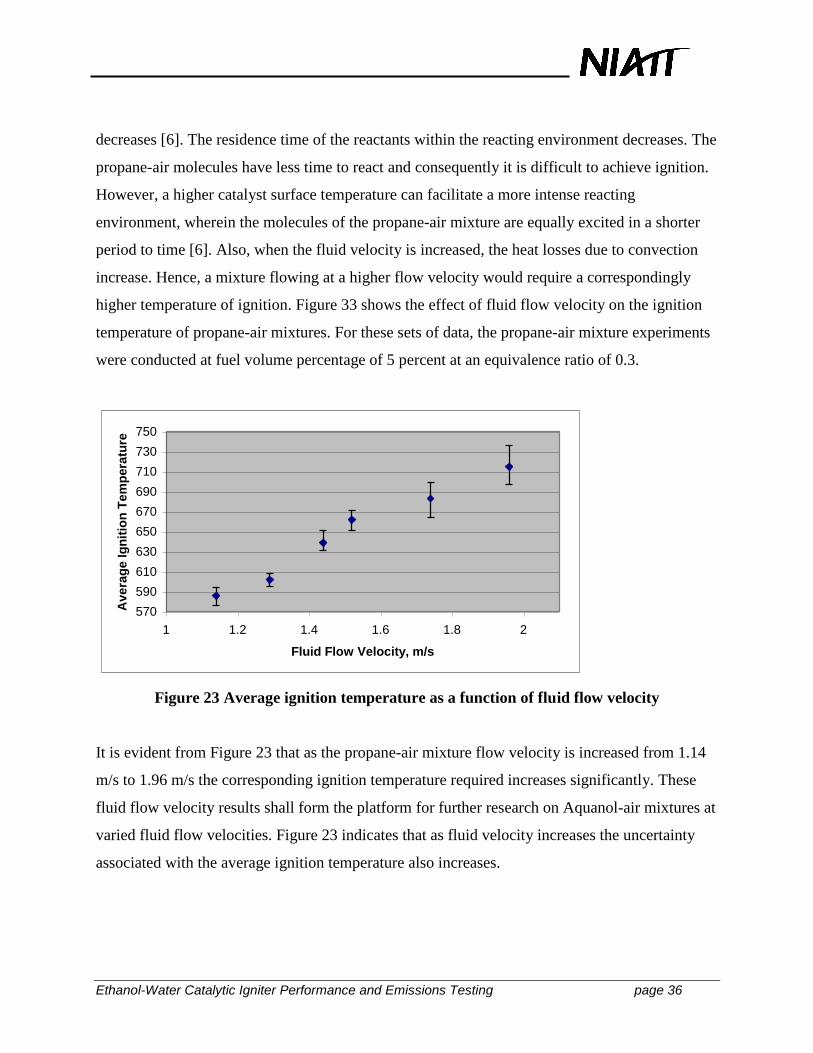
higher temperature of ignition. Figure 33 shows the effect of fluid flow velocity on the ignition
temperature of propane-air mixtures. For these sets of data, the propane-air mixture experiments
were conducted at fuel volume percentage of 5 percent at an equivalence ratio of 0.3.
570
590
610
630
650
670
690
710
730
750
1 1.2 1.4 1.6 1.8 2
Fluid Flow Velocity, m/s
Avera
ge
Ig
nit
ion
Tem
pera
ture
Figure 23 Average ignition temperature as a function of fluid flow velocity
It is evident from Figure 23 that as the propane-air mixture flow velocity is increased from 1.14
m/s to 1.96 m/s the corresponding ignition temperature required increases significantly. These
fluid flow velocity results shall form the platform for further research on Aquanol-air mixtures at
varied fluid flow velocities. Figure 23 indicates that as fluid velocity increases the uncertainty
associated with the average ignition temperature also increases.

Ethanol-Water Catalytic Igniter Performance and Emissions Testing page 37
The plot shows that the average ignition temperature of the catalyst wire rises from 586 K to 715
K when the fluid velocity is increased from 1.14 m/s to 1.96 m/s at an equivalence ratio of 0.3.
The plot has 95 percent confidence intervals for all the data.
Ethanol-Water Catalytic Igniter Performance and Emissions Testing page 38
CONCLUSIONS
Plug flow reactor
This work produced a robust, reliable platform for evaluating average catalytic ignition
temperatures of fuel-air mixtures. A specially designed catalytic plug flow reactor was modified
to conduct catalytic ignition of propane-air mixtures over platinum wires.
Considerable effort was made to characterize the reactor and catalyst system. Experiments on
gases mixing response time were conducted to determine the effectiveness of the mixing nozzle.
Hot wire anemometer experiments were conducted to determine the axial position downstream
of the mixing nozzle for insertion of the platinum catalyst. Surface temperatures were obtained
as a function of equivalence ratio and power supplied to the catalyst.
System Modeling
Finite element steady state heat transfer analysis of propane-air mixtures over platinum wires has
helped to develop a correlation between the amount of power needed to be supplied to reach a
desired average catalytic surface temperature. Further, the results of the FEA sensitivity analysis
shall provide an insight into accommodating system modifications. The FEA sensitivity studies
on the platinum wire geometry has been very much helpful in investigating the changes in the
wire temperature without purchasing platinum wires of different diameters and lengths. Since 10
inches of platinum wire costs around $140, FEA studies has proved to be beneficial in
eliminating costs. Although the FEA results don‘t match up the experimental results hundred
percent, we used the 3-D FEA results to get a closer range of changes in average catalytic surface
temperature with the corresponding alterations in the system geometry, fluid flow and heat
supplied.
Catalytic ignition temperature
Propane-air mixture experiments over platinum catalyst were performed using microcalorimetry
to investigate various parameters associated with catalytic ignition of propane-air mixtures over
platinum wires at higher Reynolds number. Parameters investigated included flow velocity and
equivalence ratio.
Ethanol-Water Catalytic Igniter Performance and Emissions Testing page 39
Recommendations
The work described here represents a first phase at developing and understanding catalytic
ignition of fuel-air mixtures.
Plug flow reactor
An interesting exercise would be flow visualization of two gas streams in the mixing nozzle.
Aqueous ethanol experiments will first require verification that the liquid fuel evaporator works
correctly. Development of the reactor should continue with the design of a quartz-lined pressure-
vessel reaction section, a catalyst bed, water-cooled sampling probe, and operation of a gas
chromatograph and mass spectrometer for product species quantification. These additions will
permit measurements of conversion efficiency of fuel to complete combustion products for
comparison with detailed chemical kinetic modeling.
System modeling
The immediate next step is to include radiation losses in the 3-D model that we have already
generated, perform parametric studies for model sensitivity to a prescribed end temperature and
convective heat transfer coefficient, and compare with the experimental results. Efforts shall be
made to conduct transient heat transfer analysis for this model using Algor. Further, Algor may
be used to obtain temperature information in more complex geometries such as the catalytic
igniter core/pre-chamber. Algor may also be used to model the fluid mechanics and heat transfer
of the actual igniter.
The capabilities of Algor should be explored to determine if the program accepts chemical
reactions as heat generation terms. If so, a simplified catalytic ignition mechanism should be
developed so that the FEA model can predict ignition temperature.
Catalytic ignition temperature
The experimental methodology for average surface and ignition temperatures described herein
should be expanded for propane-air mixtures and conducted with other fuels including aqueous
ethanol-air mixtures. For example, ignition temperatures at the similar conditions used by Cho
and Law [6] (wire diameter, Re, equivalence ratio, fuel and oxygen mole fractions) should be
Ethanol-Water Catalytic Igniter Performance and Emissions Testing page 40
conducted to gain additional confidence in the apparatus and methodology. More than one set of
fuel and oxygen percentages can have the same fuel-oxygen equivalence ratio; this would permit
study of the influence that fuel and oxygen partial pressure have on the catalytic reactions. These
tests should be extended to high Re flow as well.
Propane-air mixture ignition experiments have helped to understand the effect of catalyst aging
on ignition temperature. A very helpful insight is provided by these particular sets of
experiments. It brings into account an issue that needs to be addressed in future studies and
analysis. If residue formation on the platinum surface occurs during use in vehicles, then efforts
have to be made to minimize this trouble of changing the platinum catalyst frequently. One
possible reason for the embrittlement of platinum catalyst may be the increased porosity due to
the presence of hydrogen at high temperatures. The catalyst aging effect has opened up a new
field for further investigation changes in surface morphology of the platinum exposed to high
temperature reactions.
Future experimental work with aqueous ethanol-air mixtures should collect data to determine the
temperature of the platinum catalyst required for ignition of a particular volumetric content of
water in ethanol at a specified equivalence ratio. Further investigation should be carried out in
order to understand the changes in ignition temperature for different volumetric concentrations of
aqueous ethanol at a constant excess air coefficient.
Ethanol-Water Catalytic Igniter Performance and Emissions Testing page 41
REFERENCES
1. Patterson, W. R., and C. Kemball, ―The Catalytic Oxidation of Olefins on Metal
Films,‖ Journal of Catalysis2:465-478, 1963.
2. Moro-Oka, Y., Y. Morikawa, Y., and A. Ozaki, ―Properties of Metal Oxides in
Hydrocarbon Oxidation,‖ Journal of Catalysis7:23-32, 1967.
3. Schwartz, A., L. L. Holbrook, and H. Wise, ―Catalytic Oxidation Studies with Platinum
and Paladium,‖ Journal of Catalysis21:199-207, 1971.
4. Cardoso, M., and D. Luss, ―Stability of Catalytic Wires,‖ Chemical Engineering
Science 24:1699-1710, 1969.
5. Bruno, C., P. M. Walsh, D. A. Santavicca, N. Sinha, and Y. Yaw, ―Catalytic
Combustion of Propane/Air Mixtures on Platinum,‖ Combustion Science and
Technology 31:43-74, 1983.
6. Cho, P., and C. K. Law, ―Catalytic Ignition of Fuel/Oxygen/Nitrogen Mixtures Over
Platinum Wires,‖ Combustion and Flame 66:159 –170, 1986.
7. Jarosinski, J., and J. Podfilipski, ―Infuence of Catalysis on Combustion in Spark
Ignition Engine,‖ Society of Automotive Engineers Paper No. 2000-01-1338, 2000.
8. Gunnerman, R.W., US Patent 5,156,114, 1992.
9. Bechtold, R. L., ―Properties, Storage, Dispensing, and Vehicle Facility Modifications,‖
Alternative Fuels Guidebook. Warrendale, PA: Society of Automotive Engineers
International, 1997.
10. Cherry, M., Catalytic-Compression Timed Ignition, US Patent 5 109 817, December
18, 1990.
11. Dale, J. and A. Oppenheim, ―A Rationale for Advances in Technology of IC Engines,‖
Society of Automotive Engineers Paper No. 820047, 1982.
12. Cherry, M., Catalytic-Compression Timed Ignition, US Patent 5 109 817, December
18, 1990
Ethanol-Water Catalytic Igniter Performance and Emissions Testing page 42
13. Morton, A., G. Munoz-Torrez, S. Beyerlein, J. Steciak, and M. Cherry, ―Aqueous
Ethanol-Fueled Catalytic Ignition Engine,‖ Society of Automotive Engineers Paper No.
1999-01-3267, 1999.
14. Cordon, D., E. Clarke, S, Beyerlein, J. Steciak, and M. Cherry, ―Catalytic Igniter to
Support Combustion of Ethanol-Water Air Mixtures in Internal Combustion Engines,‖
Society of Automotive Engineers Paper No. 02FFL-46, 2002.
15. Koert, D. N., Effects of Pressure on Hydrocarbon Oxidation Chemistry. Doctor of
Philosophy Thesis, Drexel University, 1990.
16. Hoffman, J. S., W. Lee, A. Litzinger, D. A. Santaciaa, and W. J. Pitz, ―Oxidation of
Propane at Elevated Pressures--Experiments and Modeling,‖ Combustion Science and
Technology 77:95-125, 1991.
17. Dryer, F. L., ―High Temperature Oxidation of Carbon Monoxide and Methane in a
Turbulent Flow Reactor,‖ American Mathematical Society Report T-1034, 1972.
18. Karim, H., L. D. Pfefferle, P. Markatou, and M. Smooke, ―Modeling
Heterogeneous/Homogeneous Reactions and Transport Coupling of Catalytic
Combustion of Methyl Chloride over a Mn-Based Catalyst,‖ Twenty-Fifth International
Symposium on Combustion, pp. 299-306, 1994.
19. Vermeersch, M. L., T. J. Held, Y. Stein, and F.L. Dryer, ―Auto-Ignition Chemistry
studies of n-Butane in a Variable Pressure Flow Reactor,‖ Society of Automotive
Engineers Paper No. 912316, 1991.
20. Mao, F., and R. B. Barat, ―Experimental and Modeling Sudies of Staged Combustion
Using a Reactor Engineering Approach,‖ Chemical Engineering Communications
145:1-21, 1996.
21. Mitchell, W., T. Litzinger, and W. Lee, ―Effects of In-Cylinder Catalysts on
Combustion and Emissions of a D.I. Diesel Engine Fueled on Neat Methanol,‖ Society
of Automotive Engineers Paper No. 920688, 1992.
22. King, L.V., ―On the Convection of Heat from Small Cylinders in a Stream of Fluid:
Determination of the Convection Constants of Small Platinum Wires with Applications
to Hot-Wire Anemometry,‖ Philosophical Transactions of the Royal Society A, 214:
373-432, 1914.
Ethanol-Water Catalytic Igniter Performance and Emissions Testing page 43
23. Cardoso, M. A. A., and D. Luss, ―Stability of Catalytic Wires,‖ Chemical Engineering
Science, pp. 1669-1710, 1969.
24. Roben, R., R. Schefer, V. Agrawal, and I. Namer, ―Catalyzed Combustion in a Flat
Plate Boundary Layer I. Experimental Measurements and Comparison with Numerical
Calculations,‖ presented at the Western States Section of the Combustion Institute
Meeting, Oct 17-18, California, 1977.
25. Turns, S., An Introduction to Combustion, McGraw Hill, New York, 2000.
26. Warnatz, J., U. Maas, U., and R. W. Dibble. Combustion: Physical and Chemical
Fundamentals, Modeling and Simulation, Experiments, Pollution Formation, New
York: Springer, 1999.
27. Incropera, F. P., and D. P. DeWitt. Fundamentals of Heat and Mass Transfer. 4th
Edition, New York: John Wiley and Sons, 1996.