Embed Size (px)
Citation preview
System Blackouts,Description and Prevention
IEEE PSRC, System Protection SCWG C6 “Wide Area Protection and Control”
Cigre TF38.02.24 Defense Plans Against Extreme Contingencies
Damir Novosel, PhDKEMA T&D Consulting
November 12, 2003
PES Chicago Chapter
2
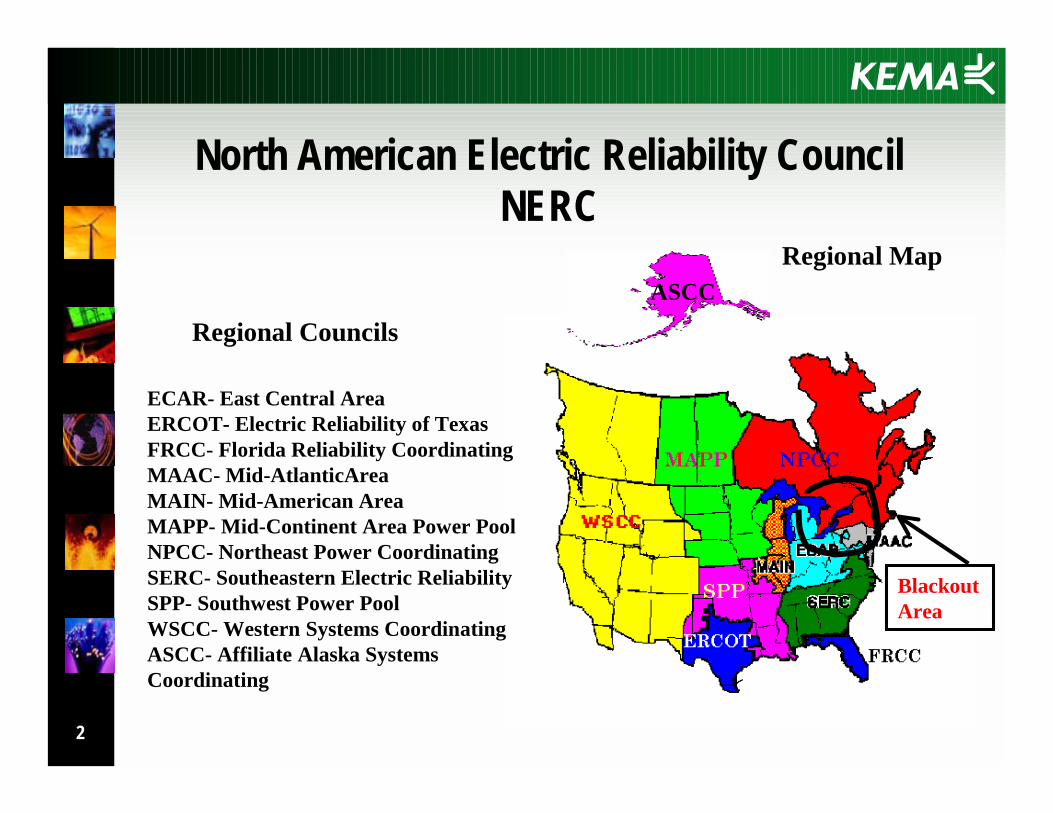
Regional Councils
Regional Map
ECAR- East Central AreaERCOT- Electric Reliability of TexasFRCC- Florida Reliability CoordinatingMAAC- Mid-AtlanticAreaMAIN- Mid-American AreaMAPP- Mid-Continent Area Power PoolNPCC- Northeast Power CoordinatingSERC- Southeastern Electric ReliabilitySPP- Southwest Power PoolWSCC- Western Systems CoordinatingASCC- Affiliate Alaska Systems Coordinating
ASCC
North American Electric Reliability Council NERC
Blackout Area
3
Statistics on Recent Blackouts
■ August 14, NE USA (8 states) and Canada (2 provinces) affected:! 50 million people
! 34,000 miles of transmission
! ~290 generating units
! ~ 61,800 Megawatts (MW) • PJM Interconnection 4,000 MW; Midwest ISO 18,500 MW; Hydro Quebec
100 MW; Ontario IMO 21,000 MW; ISO New England 2,500 MW; New York ISO 24,400 MW
! Restoration efforts• A day to restore power to New York City
• Almost two days to restore power to Detroit
4
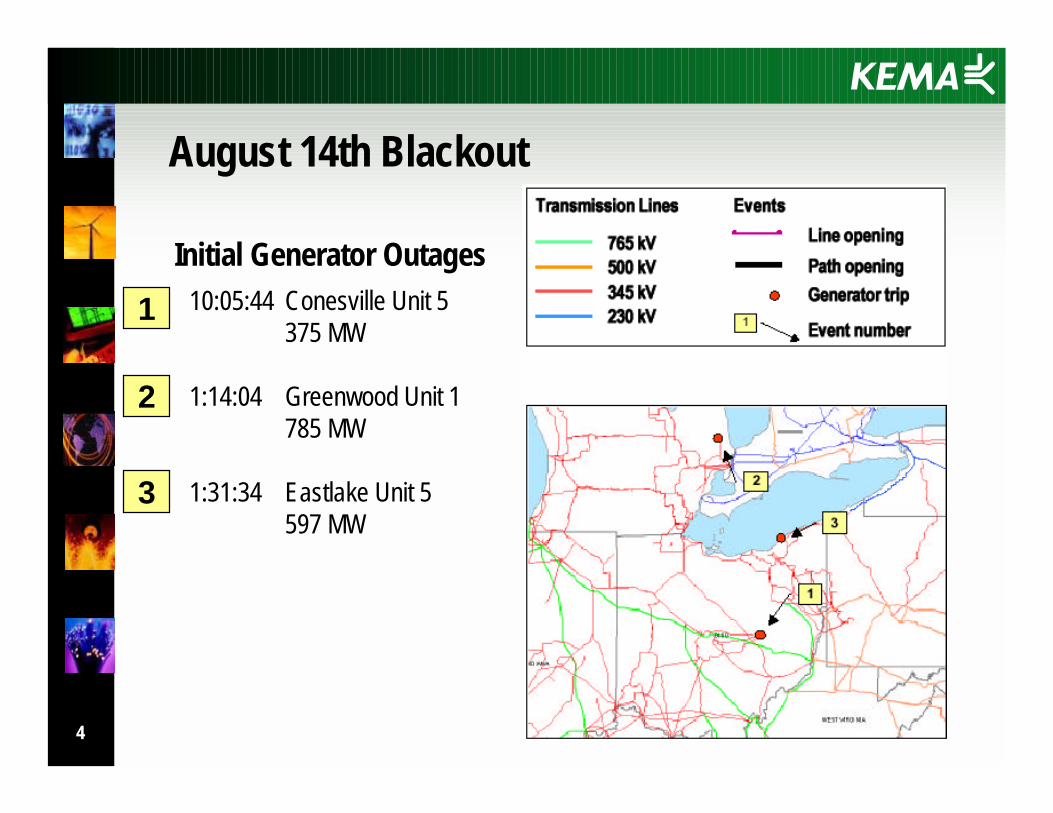
10:05:44 Conesville Unit 5 375 MW
1:14:04 Greenwood Unit 1785 MW
1:31:34 Eastlake Unit 5597 MW
3
2
1
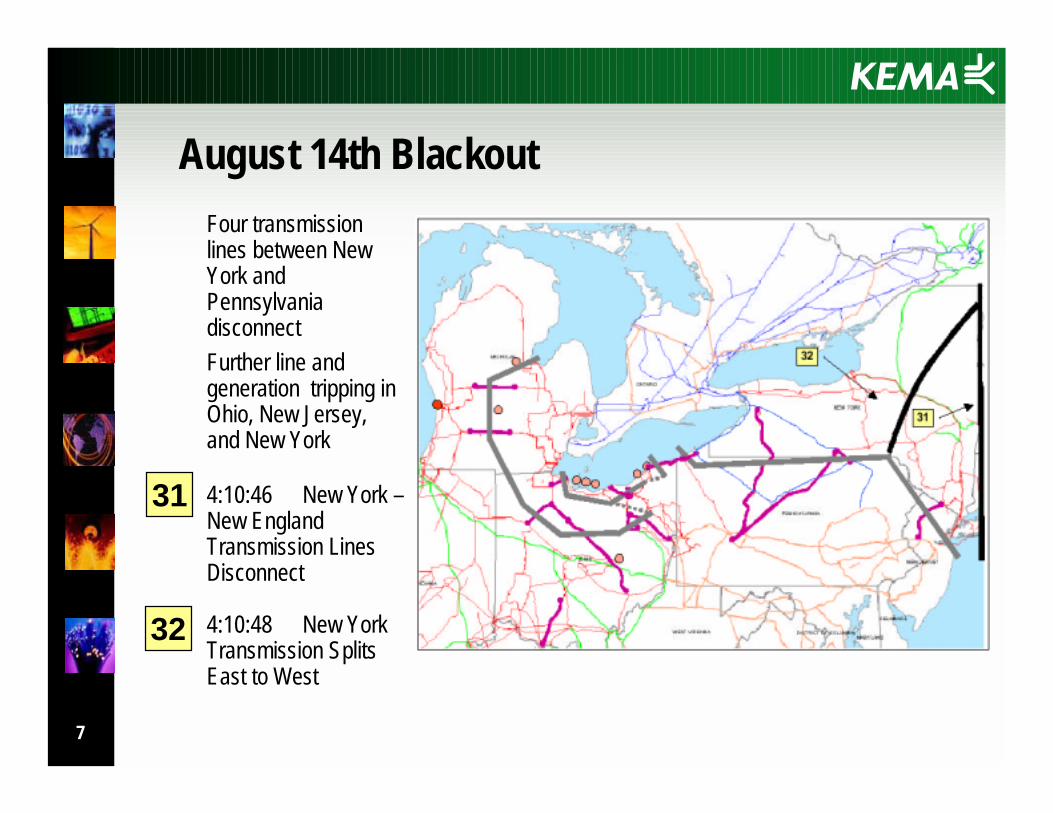
August 14th Blackout
Initial Generator Outages
5
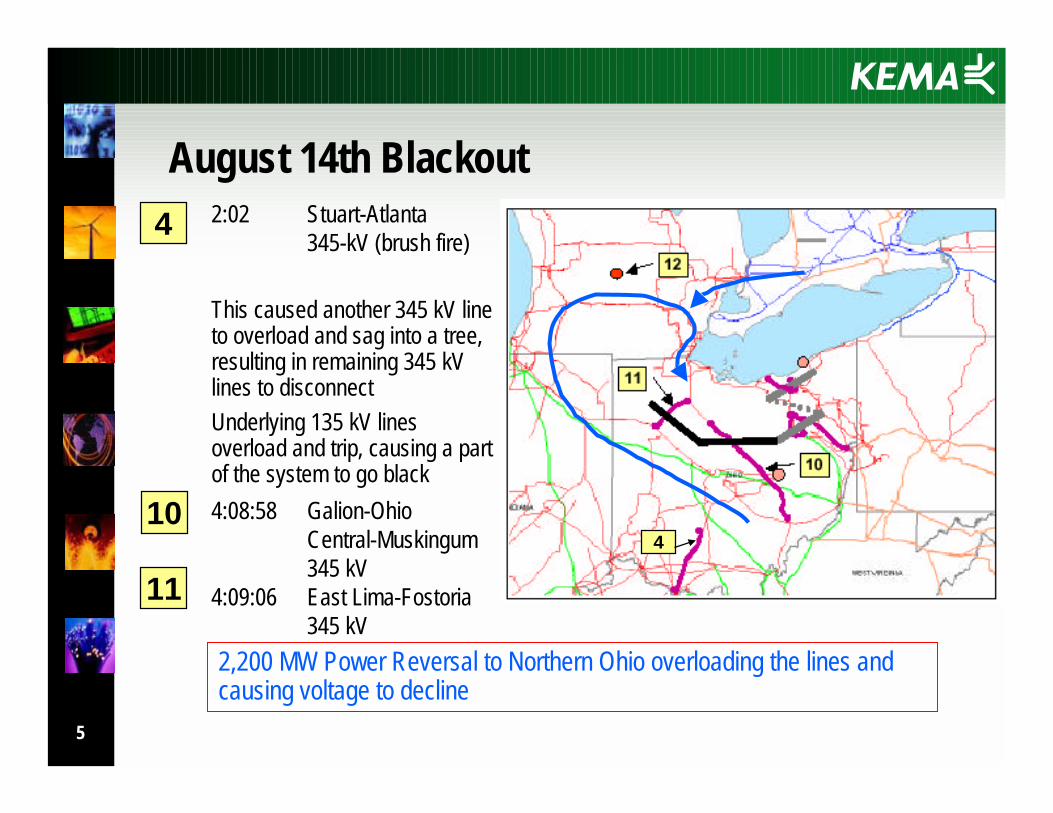
2,200 MW Power Reversal to Northern Ohio overloading the lines and causing voltage to decline
2:02 Stuart-Atlanta345-kV (brush fire)
This caused another 345 kV line to overload and sag into a tree, resulting in remaining 345 kV lines to disconnectUnderlying 135 kV lines overload and trip, causing a part of the system to go black 4:08:58 Galion-Ohio
Central-Muskingum345 kV
4:09:06 East Lima-Fostoria345 kV
August 14th Blackout4
410
11
6
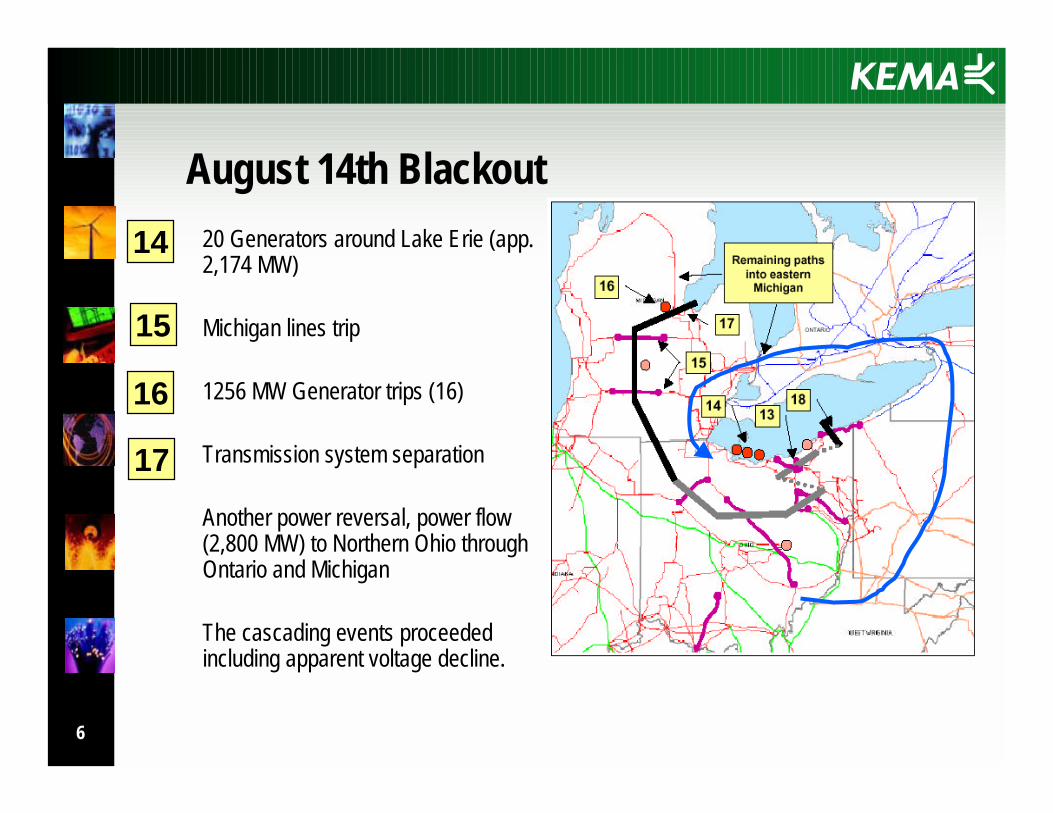
20 Generators around Lake Erie (app. 2,174 MW)
Michigan lines trip
1256 MW Generator trips (16)
Transmission system separation
Another power reversal, power flow (2,800 MW) to Northern Ohio through Ontario and Michigan
The cascading events proceeded including apparent voltage decline.
August 14th Blackout
17
16
14
15
7
32
31
Four transmission lines between New York and Pennsylvania disconnectFurther line and generation tripping in Ohio, New Jersey, and New York
4:10:46 New York –New England Transmission Lines Disconnect
4:10:48 New York Transmission Splits East to West
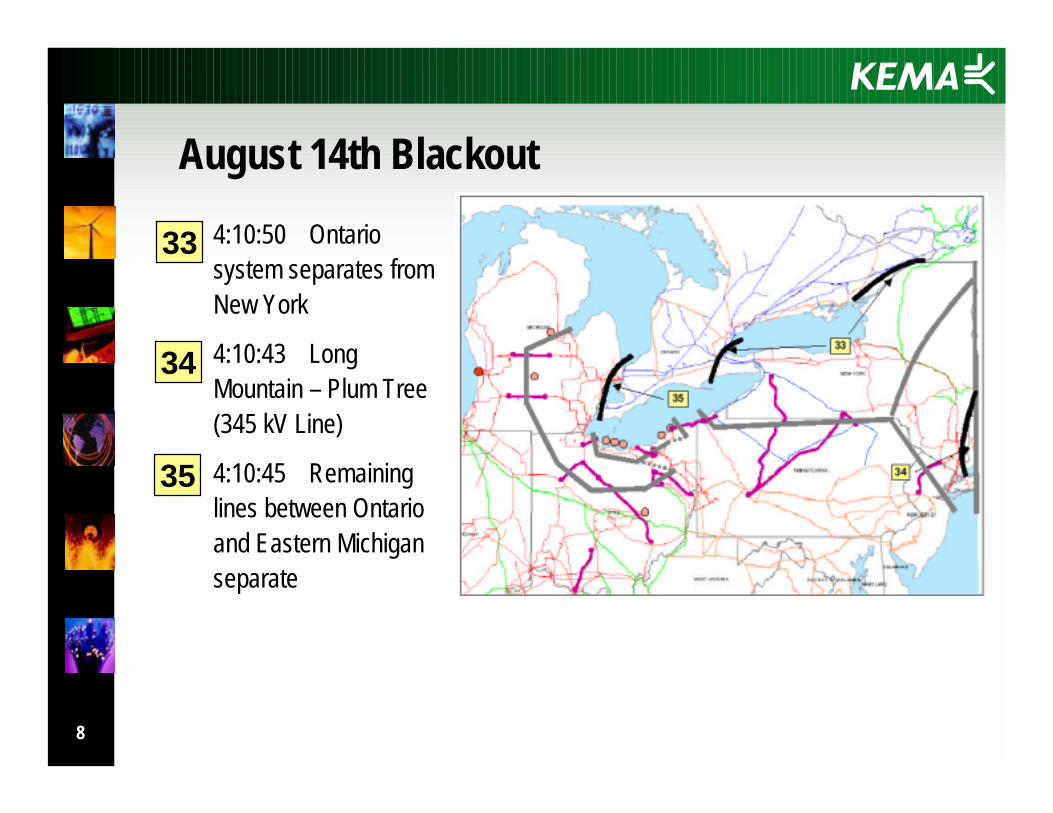
August 14th Blackout
8
35
34
33 4:10:50 Ontario system separates from New York
4:10:43 Long Mountain – Plum Tree (345 kV Line)
4:10:45 Remaining lines between Ontario and Eastern Michigan separate
August 14th Blackout
9
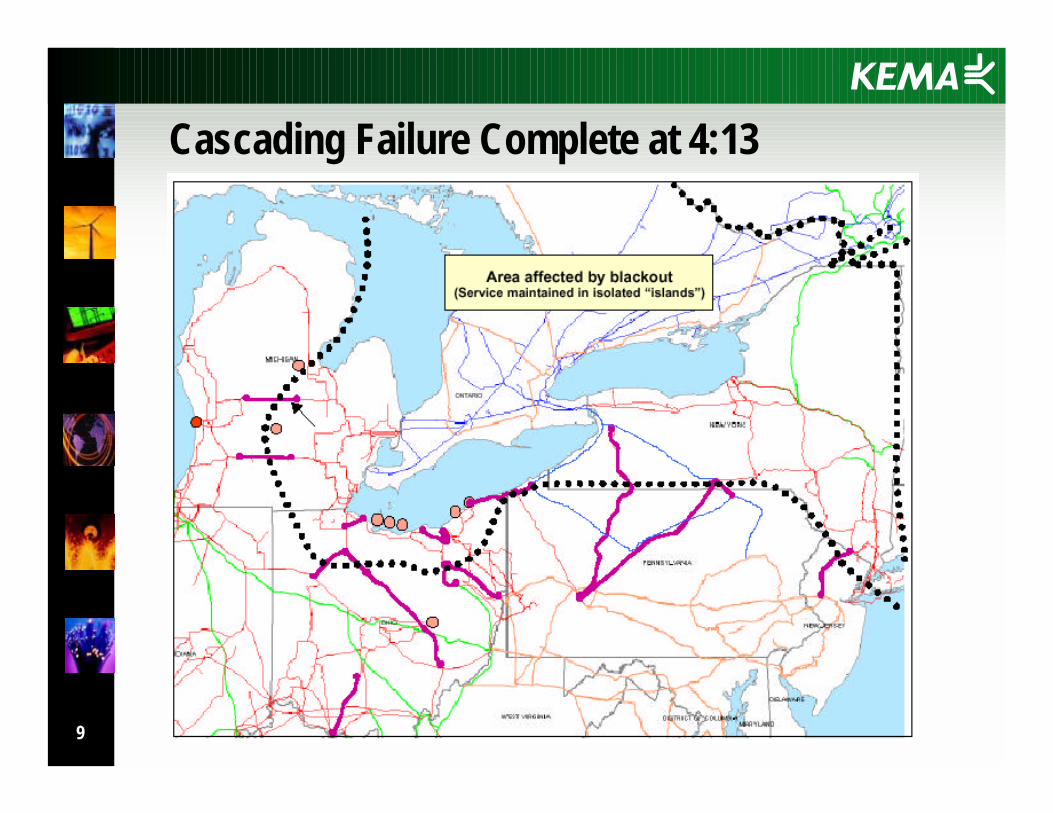
Cascading Failure Complete at 4:13
10
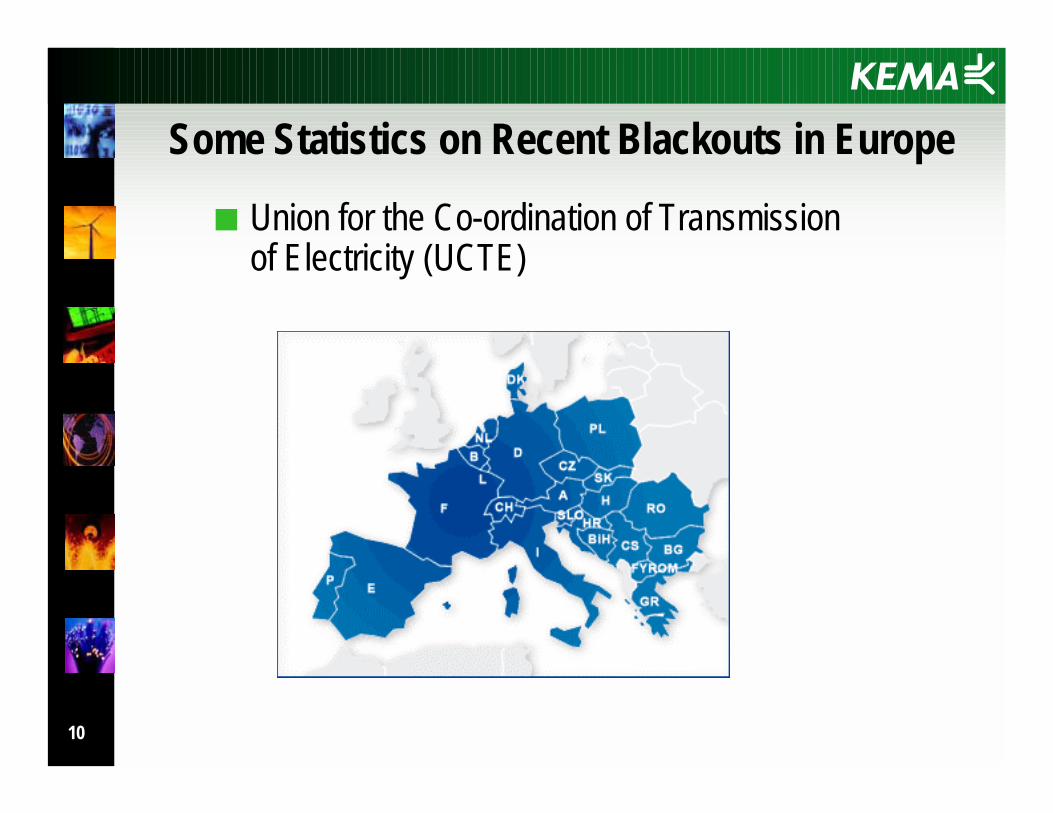
Some Statistics on Recent Blackouts in Europe
■ Union for the Co-ordination of Transmission of Electricity (UCTE)
11
Some Statistics on Recent Blackouts in Europe■ September 28, 2003, Italy
! The worst blackout in Europe ever, affecting 57M people• 30,000 blocked in trains
! It took app. 5-9 hours to restore the power to major cities! Chain of events
• Italian grid was importing 6,000MW from the rest of the grid• 380 kV line (300 MW) disconnects due a tree contact (unsuccessful reclosing) • Parallel line overloads, import is reduced, but not enough to prevent sagging
into a tree and disconnecting• Other lines to Italy overload and trip, resulting in isolating Italian grid 12s after
the loss of the second line• During 12s, low voltage in Northern Italy caused generators to start tripping. • Voltage and angular instability are suspected to have occurred.• 2.5 minutes after islanding, Italy goes black separated from the rest of UCTE• Other UCTE countries tripped generation (app. 6,700MW)
12
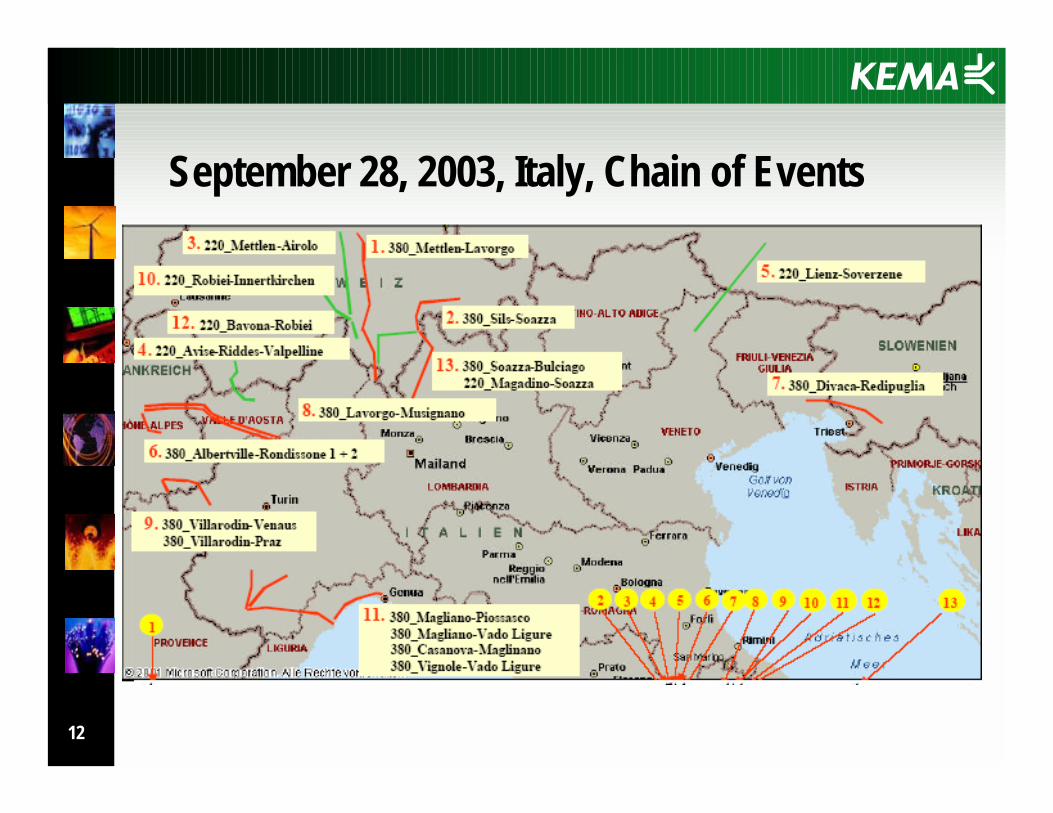
September 28, 2003, Italy, Chain of Events
13
Some Statistics on Recent Blackouts■ August 28, 2003, London,
! Affecting commuters during the rush hour! Resulted in approximately 50 minute loss of supply to about 20% of the
London demand (724 MW) ! Two lines out for maintenance, third line closed down due to a false alarm.! Incorrect installation of 1A relay, causing the last circuit to trip
■ September 23, 2003, Sweden and Denmark! Affecting approximately 5 million people! Power was restored in approximately 5 hours! Initiated by tripping of the power line due to a storm! Followed by tripping of the two large nuclear generation units (app. 3000
MW) and control equipment failure! One nuclear unit was out for maintenance
14
Some Common Threads During Blackouts■ Pre-existing conditions, e.g. generator/line maintenance, heavy loading■ Tripping lines due to faults and/or protection actions, causing heavy overloads on
other lines. ■ Protection and control misoperation or unnecessary actions (incorrect
settings/design or HW failures) contributed to disturbance propagation■ Insufficient voltage (reactive power) support■ Inadequate right-of-way maintenance■ Inability of operators to prevent further propagation of the disturbance and
problems with EMS/SCADA systems ■ Inadequate planning/operation studies■ Automated actions not available/initiated to:
! Prevent further overloading of the lines, ! Arrest voltage decline! Initiate automatic and pre-planned separation of the power system
15
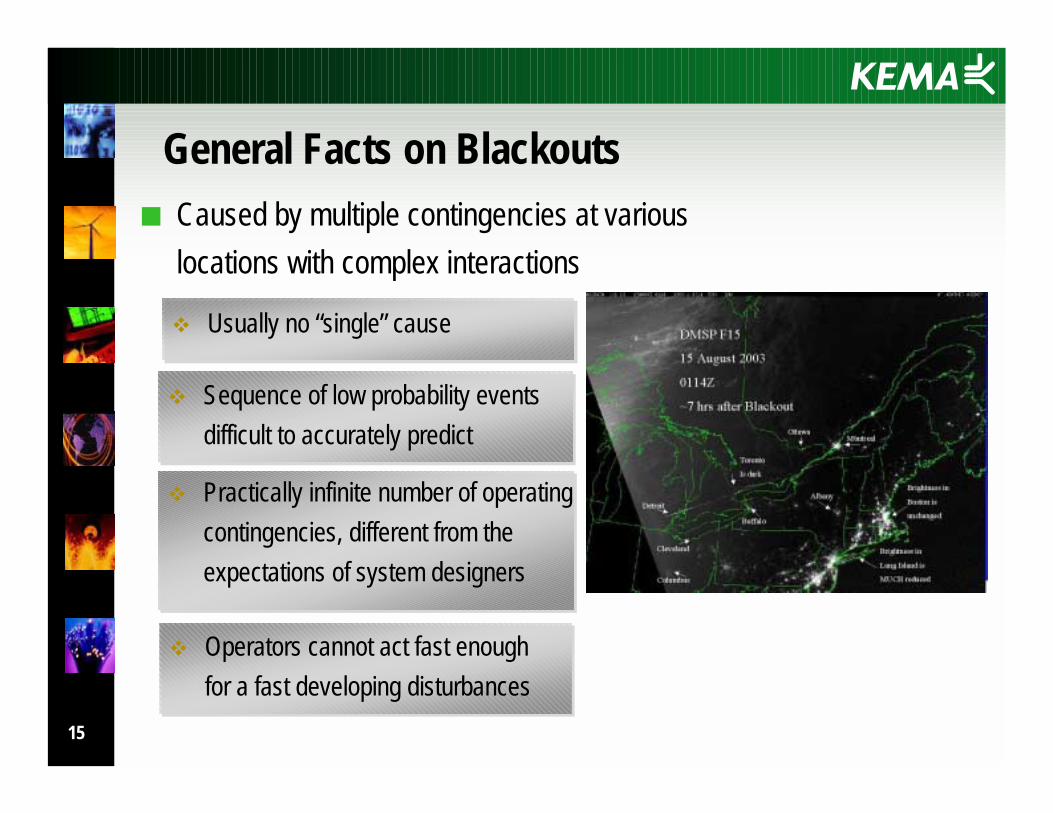
General Facts on Blackouts■ Caused by multiple contingencies at various
locations with complex interactions
! Usually no “single” cause
! Sequence of low probability events difficult to accurately predict
! Practically infinite number of operating contingencies, different from the expectations of system designers
! Operators cannot act fast enough for a fast developing disturbances
16
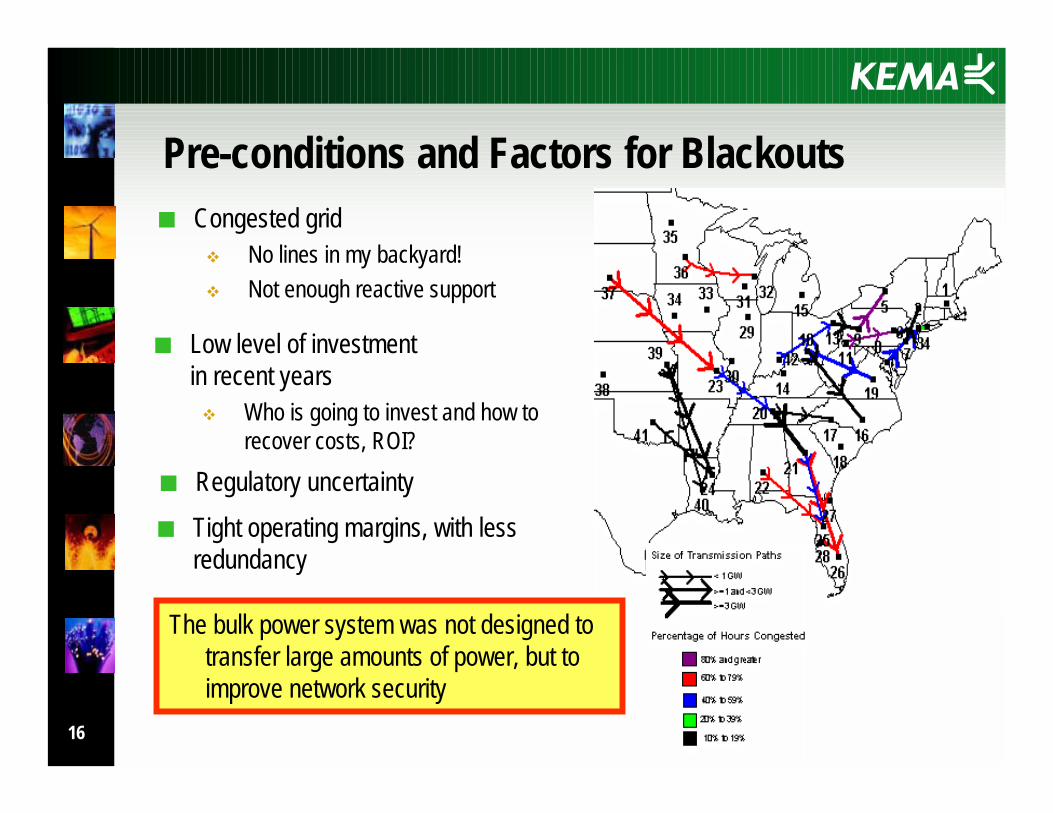
Pre-conditions and Factors for Blackouts■ Congested grid
! No lines in my backyard!! Not enough reactive support
■ Low level of investment in recent years! Who is going to invest and how to
recover costs, ROI?
■ Regulatory uncertainty
The bulk power system was not designed to transfer large amounts of power, but to improve network security
■ Tight operating margins, with less redundancy
17
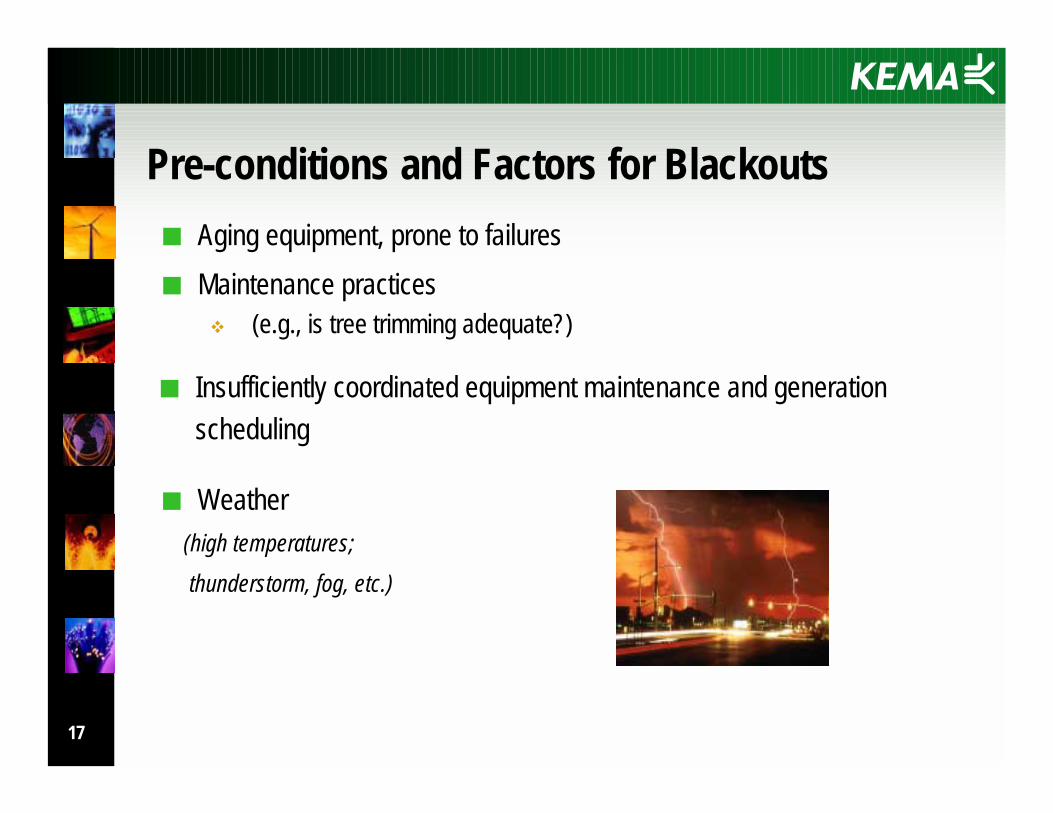
Pre-conditions and Factors for Blackouts■ Aging equipment, prone to failures ■ Maintenance practices
! (e.g., is tree trimming adequate?)
■ Weather(high temperatures;thunderstorm, fog, etc.)
■ Insufficiently coordinated equipment maintenance and generation scheduling
18
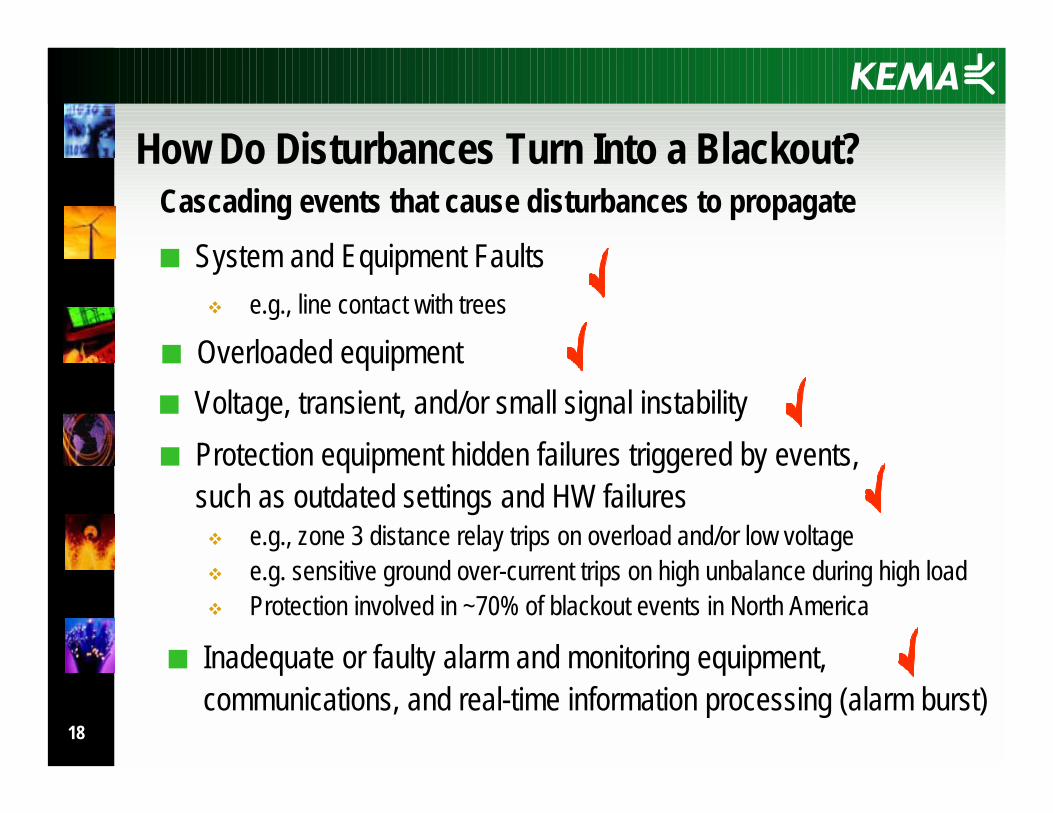
How Do Disturbances Turn Into a Blackout?Cascading events that cause disturbances to propagate■ System and Equipment Faults
! e.g., line contact with trees
■ Overloaded equipment■ Voltage, transient, and/or small signal instability
■ Inadequate or faulty alarm and monitoring equipment, communications, and real-time information processing (alarm burst)
■ Protection equipment hidden failures triggered by events,such as outdated settings and HW failures ! e.g., zone 3 distance relay trips on overload and/or low voltage! e.g. sensitive ground over-current trips on high unbalance during high load! Protection involved in ~70% of blackout events in North America
19
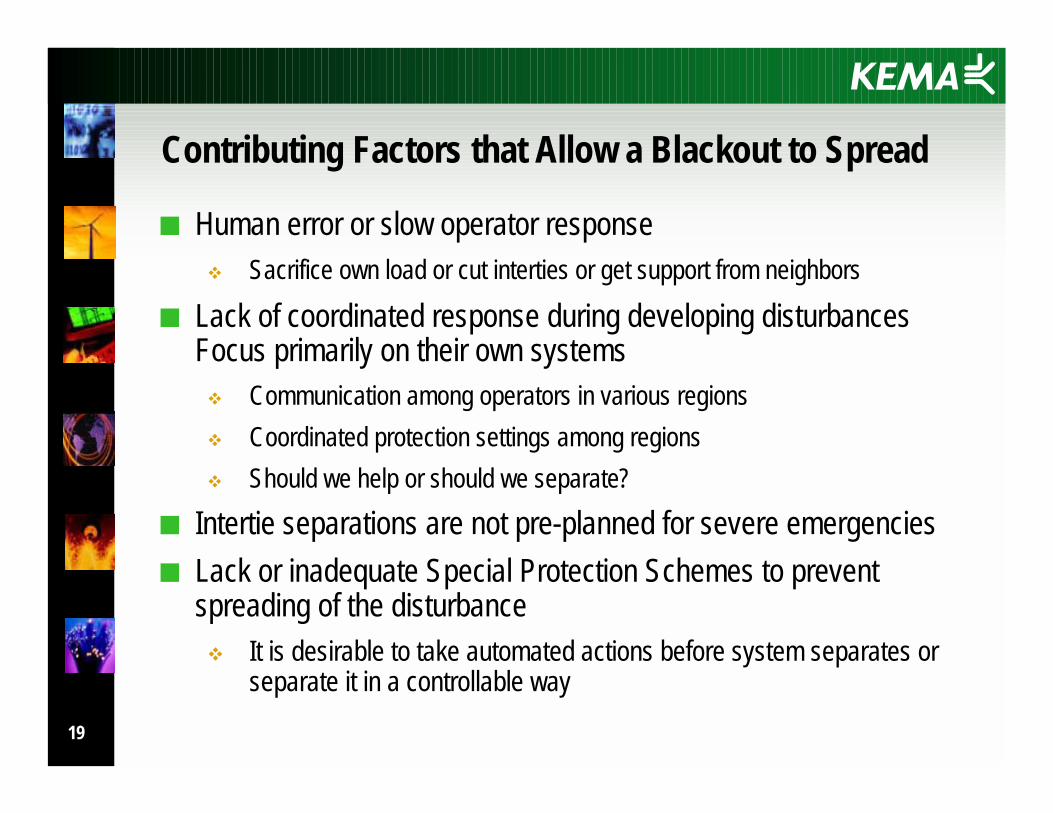
Contributing Factors that Allow a Blackout to Spread
■ Human error or slow operator response! Sacrifice own load or cut interties or get support from neighbors
■ Lack of coordinated response during developing disturbances Focus primarily on their own systems! Communication among operators in various regions! Coordinated protection settings among regions! Should we help or should we separate?
■ Intertie separations are not pre-planned for severe emergencies■ Lack or inadequate Special Protection Schemes to prevent
spreading of the disturbance! It is desirable to take automated actions before system separates or
separate it in a controllable way
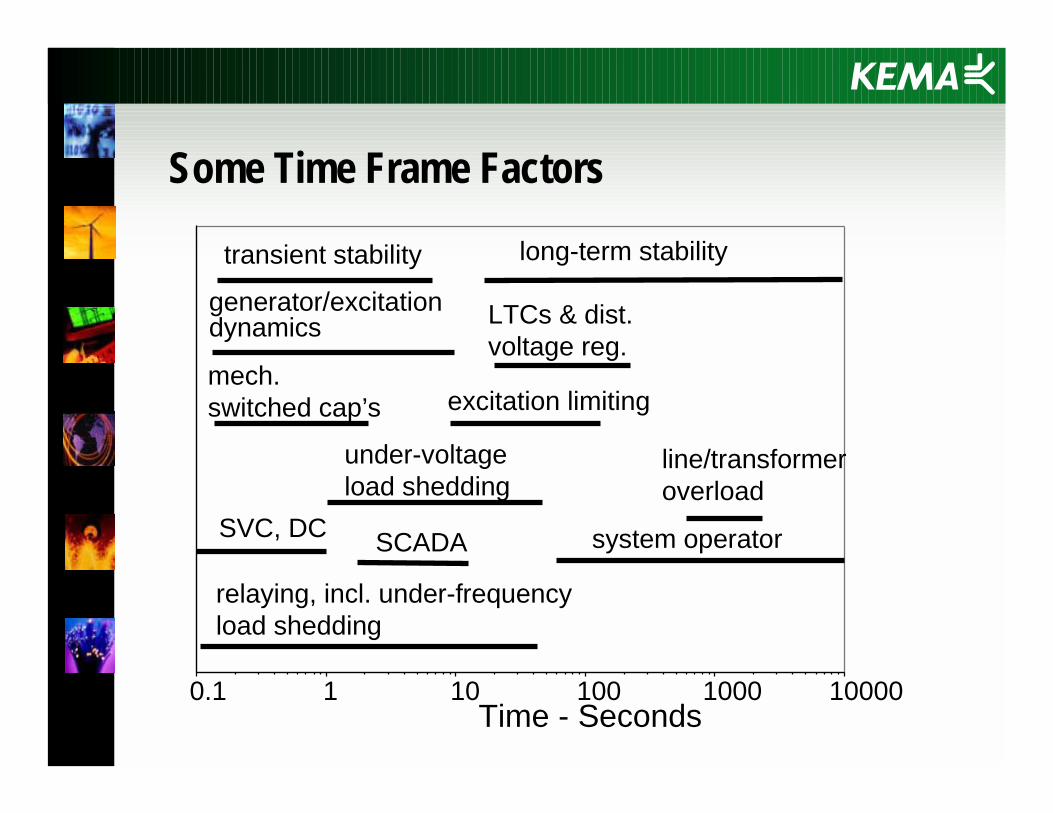
Some Time Frame Factors
0.1 1 10 100 1000 10000Time - Seconds
transient stability long-term stability
generator/excitationdynamics LTCs & dist.
voltage reg.
excitation limiting
line/transformeroverload
SVC, DC
mech.switched cap’s
system operator
under-voltage load shedding
relaying, incl. under-frequency load shedding
SCADA
21
Physical Phenomena: Voltage Instability
■ Voltage instability: Inability to maintain voltage so that both power and voltage are controllable
■ Typical scenario: high system loading, followed by a relay action (a fault, line overload or hitting an excitation limit)
■ As the grid gets more overloaded, more reactive power is consumed, causing voltages to drop.
■ It is desirable to provide enough reactive power close to the load
■ Regardless of the provisions for reactive power support, power system can experience “the point of no return” where voltage can no longer be maintained
22
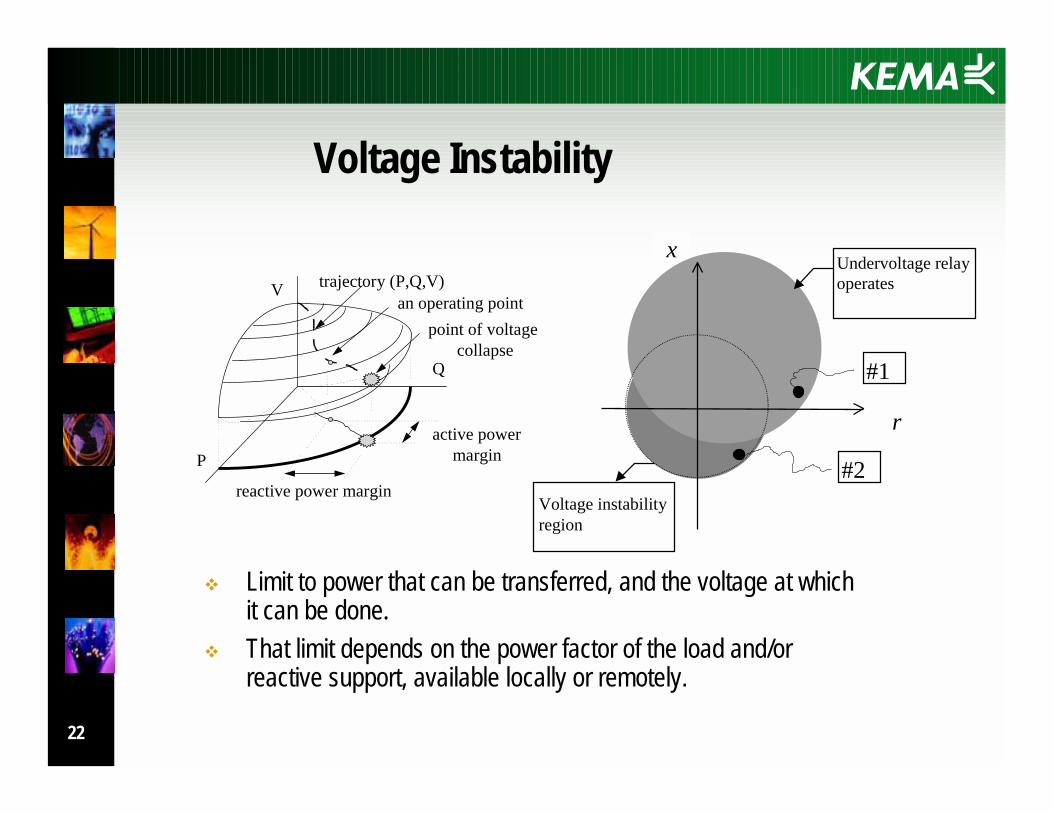
P
Q
V trajectory (P,Q,V)
point of voltage collapse
an operating point
active powermargin
reactive power margin
! Limit to power that can be transferred, and the voltage at whichit can be done.
! That limit depends on the power factor of the load and/or reactive support, available locally or remotely.
Voltage Instability
xUndervoltage relayoperates
#1
#2
r
Voltage instabilityregion
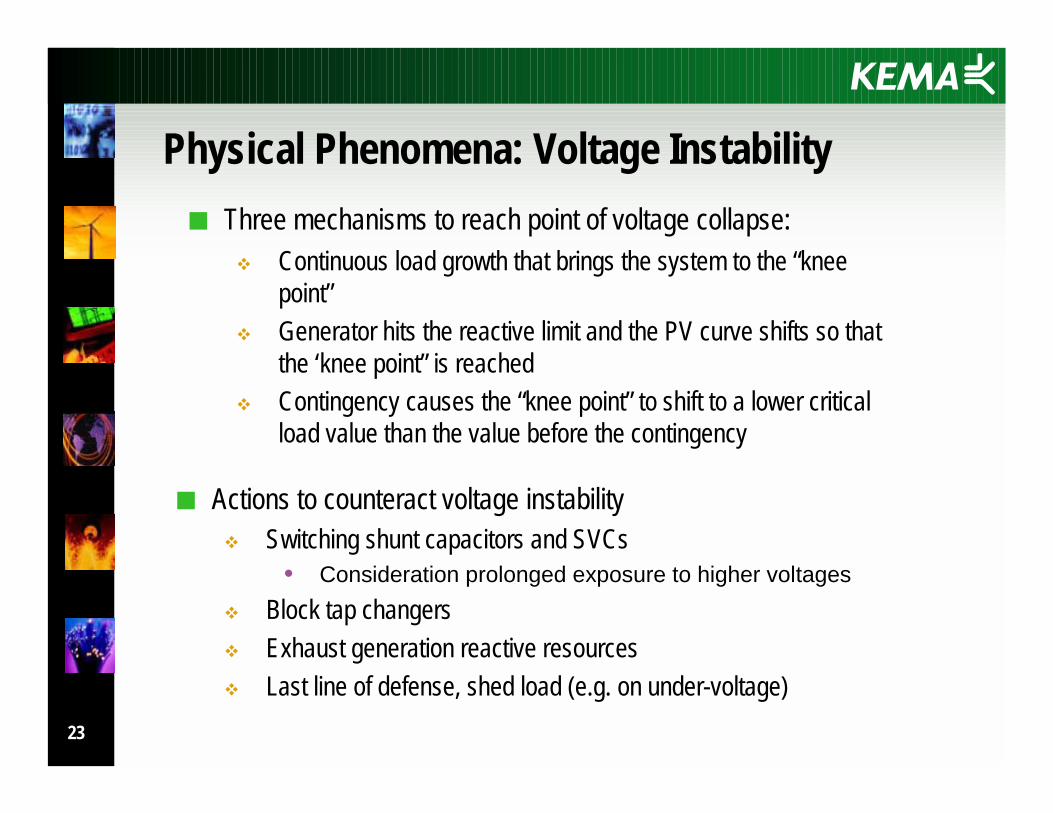
23
Physical Phenomena: Voltage Instability■ Three mechanisms to reach point of voltage collapse:
! Continuous load growth that brings the system to the “knee point”
! Generator hits the reactive limit and the PV curve shifts so that the ‘knee point” is reached
! Contingency causes the “knee point” to shift to a lower criticalload value than the value before the contingency
■ Actions to counteract voltage instability! Switching shunt capacitors and SVCs
• Consideration prolonged exposure to higher voltages! Block tap changers! Exhaust generation reactive resources! Last line of defense, shed load (e.g. on under-voltage)
24
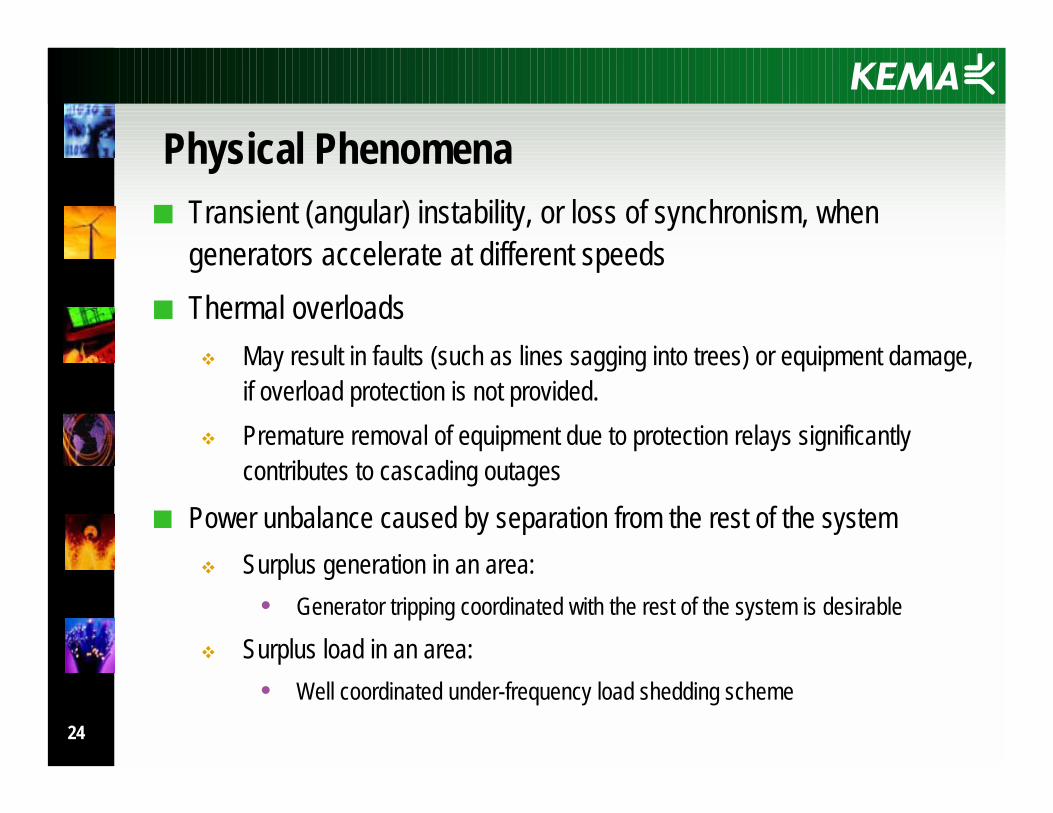
Physical Phenomena■ Transient (angular) instability, or loss of synchronism, when
generators accelerate at different speeds■ Thermal overloads
! May result in faults (such as lines sagging into trees) or equipment damage, if overload protection is not provided.
! Premature removal of equipment due to protection relays significantly contributes to cascading outages
■ Power unbalance caused by separation from the rest of the system! Surplus generation in an area:
• Generator tripping coordinated with the rest of the system is desirable
! Surplus load in an area:• Well coordinated under-frequency load shedding scheme
25
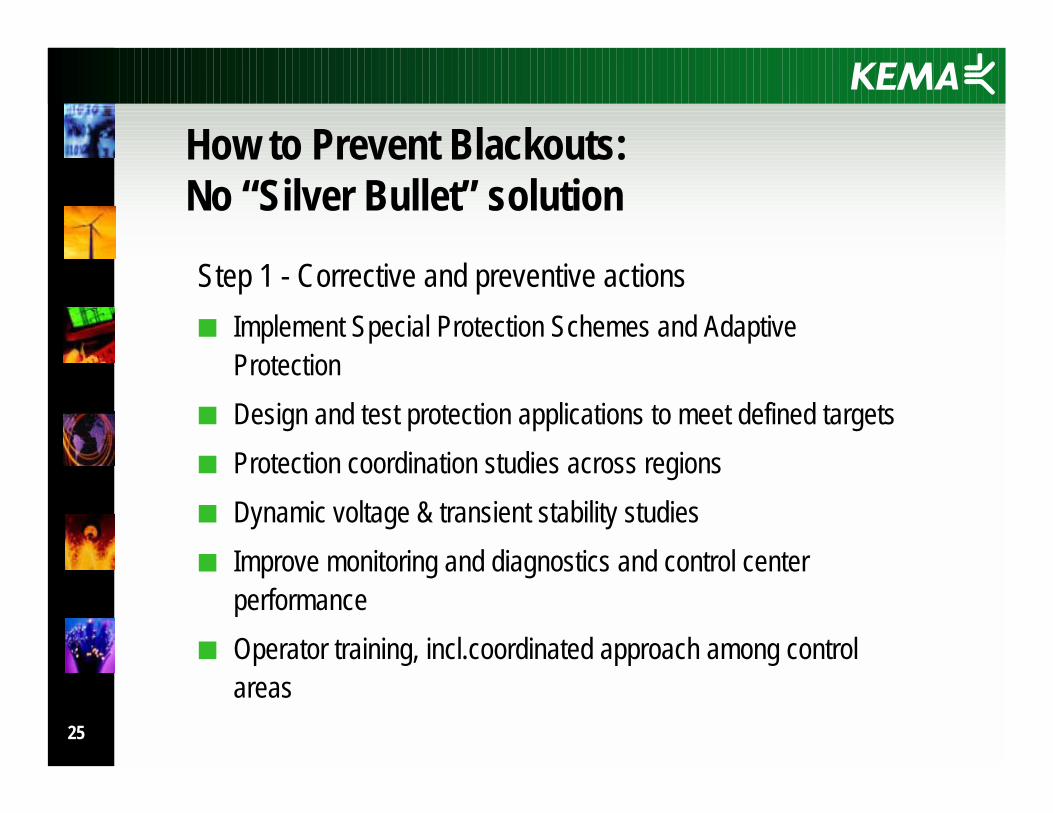
How to Prevent Blackouts: No “Silver Bullet” solution
Step 1 - Corrective and preventive actions■ Implement Special Protection Schemes and Adaptive
Protection ■ Design and test protection applications to meet defined targets ■ Protection coordination studies across regions■ Dynamic voltage & transient stability studies■ Improve monitoring and diagnostics and control center
performance■ Operator training, incl.coordinated approach among control
areas
26
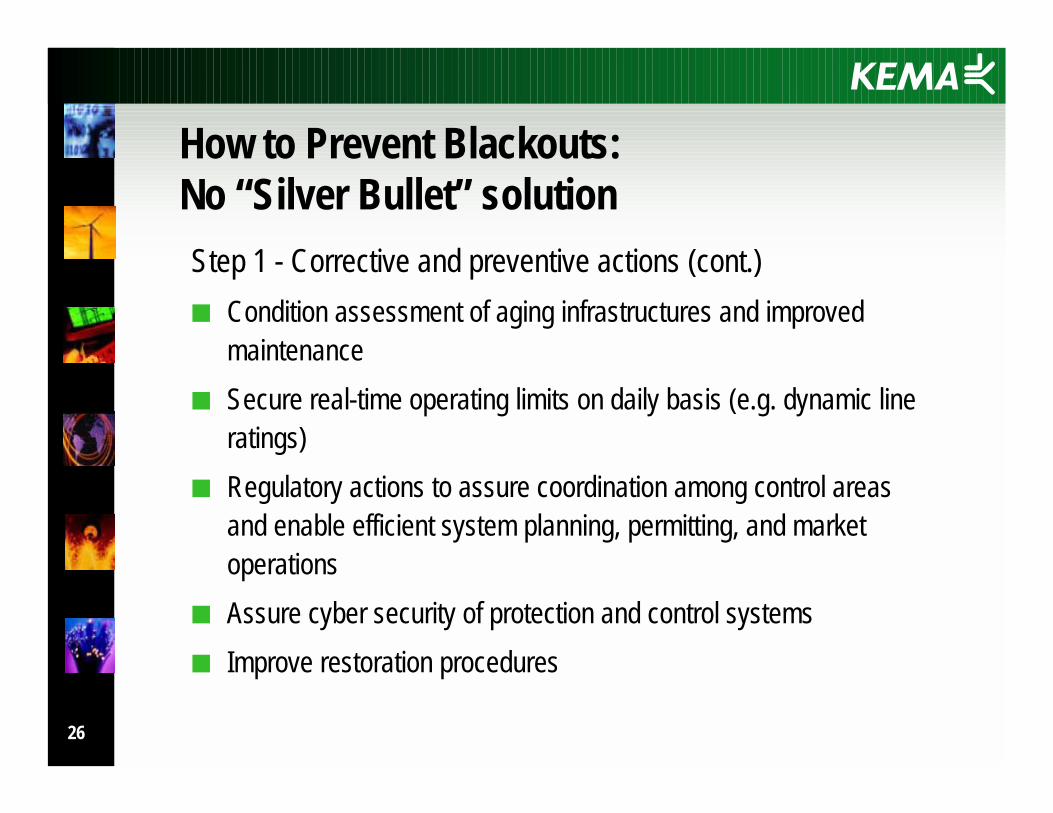
Step 1 - Corrective and preventive actions (cont.)■ Condition assessment of aging infrastructures and improved
maintenance■ Secure real-time operating limits on daily basis (e.g. dynamic line
ratings) ■ Regulatory actions to assure coordination among control areas
and enable efficient system planning, permitting, and market operations
■ Assure cyber security of protection and control systems ■ Improve restoration procedures
How to Prevent Blackouts: No “Silver Bullet” solution
27
■ Special Protection Schemes! Although SPS schemes can help increase the
transfer limits, their primary goal is to improve security of the power system.
! Could have August 14th blackout been arrested by implementation of SPS schemes (e.g. under-voltage)
! Coordination with SPSs in the immediate neighboring systems
■ Adaptive Protection! E.g. multiple setting groups for protection to
accommodate to system changes
Step 1, Corrective and Preventive Actions
28
■ Design and test protection applications! Avoid hidden failures by adequate testing of not only individual
relays, but also overall relay applications! Increase the security of protection design in the areas vulnerable
to blackouts• E.g. permissive overreach transfer trip scheme (POTT), which is
more secure, could be used instead of the more dependable Directional Comparison Blocking (DCB)
■ Protection coordination studies! Perform studies and review protection designs on a regular basis,
as system conditions change! Studies across regions
Step 1, Corrective and Preventive Actions
29
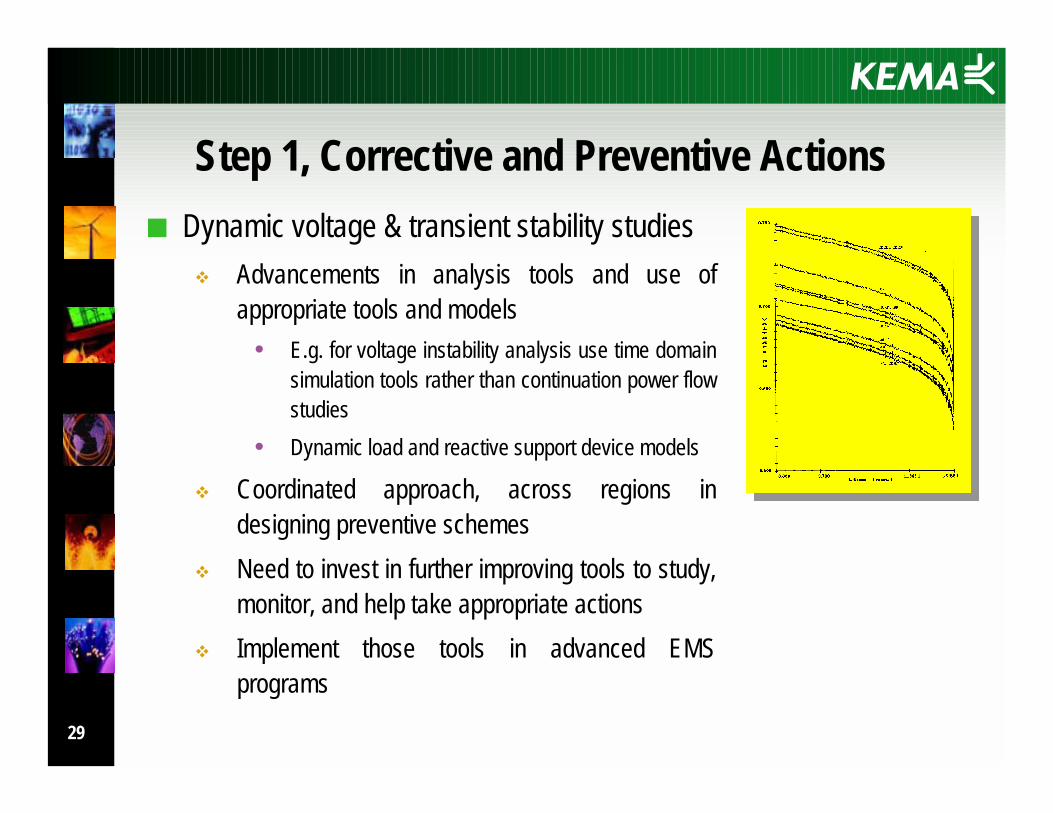
■ Dynamic voltage & transient stability studies! Advancements in analysis tools and use of
appropriate tools and models • E.g. for voltage instability analysis use time domain
simulation tools rather than continuation power flow studies
• Dynamic load and reactive support device models
! Coordinated approach, across regions in designing preventive schemes
! Need to invest in further improving tools to study, monitor, and help take appropriate actions
! Implement those tools in advanced EMS programs
Step 1, Corrective and Preventive Actions
30
■ Improve monitoring and diagnostics and control center performance! Availability of critical functions needs to increase to 99.99%! Advanced algorithms and calculation programs to assist the
operator, such as “faster than real-time simulations”! Assure adequate exchange of information between neighboring
control centers
■ Operator training, incl.coordinated approach among control areas
Step 1, Corrective and Preventive Actions
31
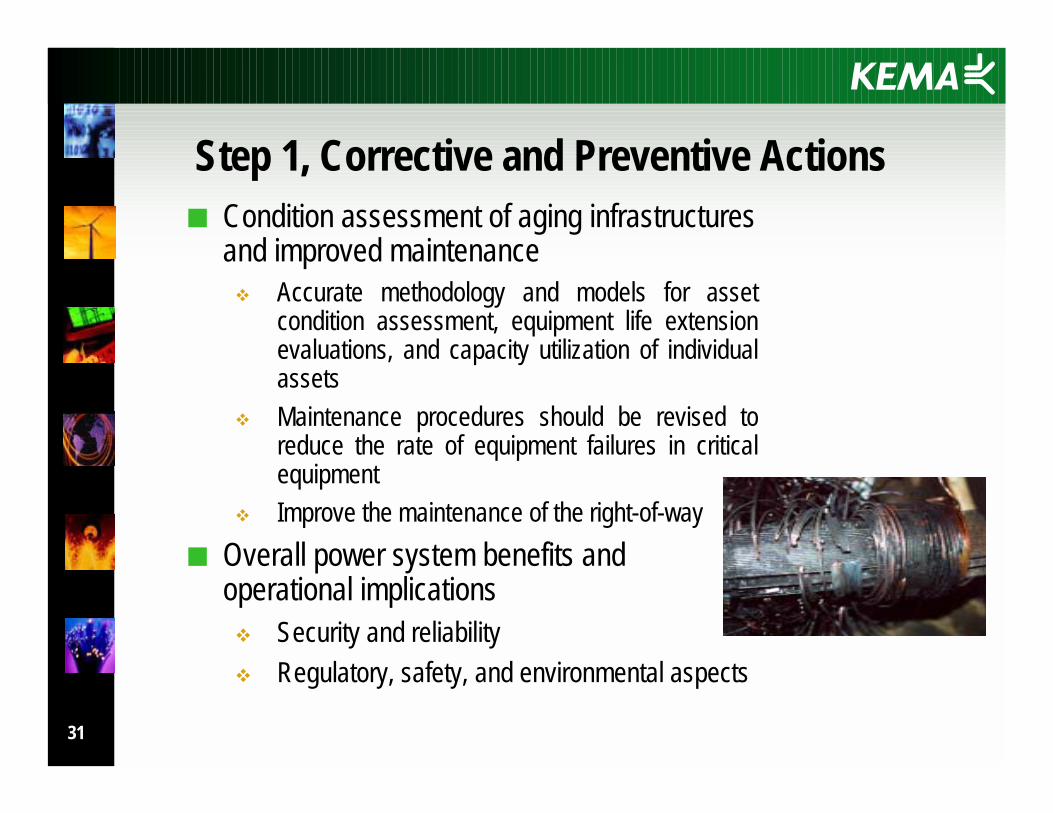
■ Condition assessment of aging infrastructures and improved maintenance! Accurate methodology and models for asset
condition assessment, equipment life extension evaluations, and capacity utilization of individual assets
! Maintenance procedures should be revised to reduce the rate of equipment failures in critical equipment
! Improve the maintenance of the right-of-way ■ Overall power system benefits and
operational implications! Security and reliability! Regulatory, safety, and environmental aspects
Step 1, Corrective and Preventive Actions
32
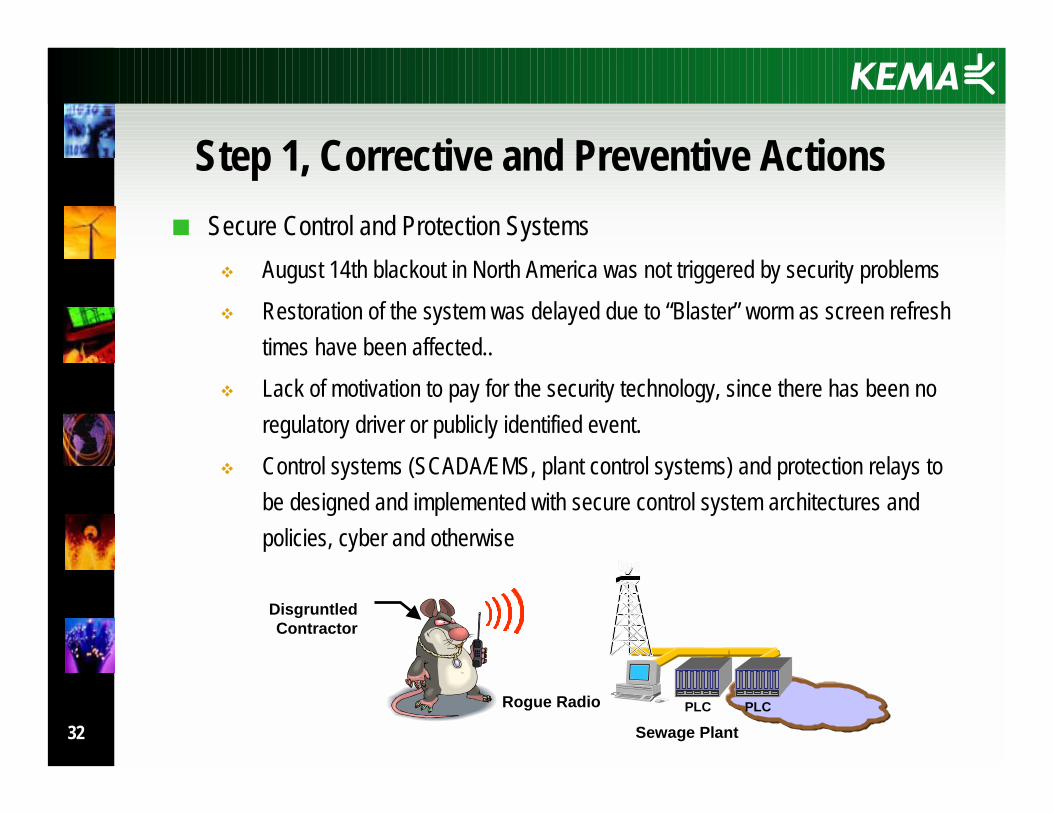
■ Secure Control and Protection Systems! August 14th blackout in North America was not triggered by security problems ! Restoration of the system was delayed due to “Blaster” worm as screen refresh
times have been affected.. ! Lack of motivation to pay for the security technology, since there has been no
regulatory driver or publicly identified event. ! Control systems (SCADA/EMS, plant control systems) and protection relays to
be designed and implemented with secure control system architectures and policies, cyber and otherwise
Step 1, Corrective and Preventive Actions
Disgruntled Contractor
PLC PLC
Sewage Plant
Rogue Radio
33
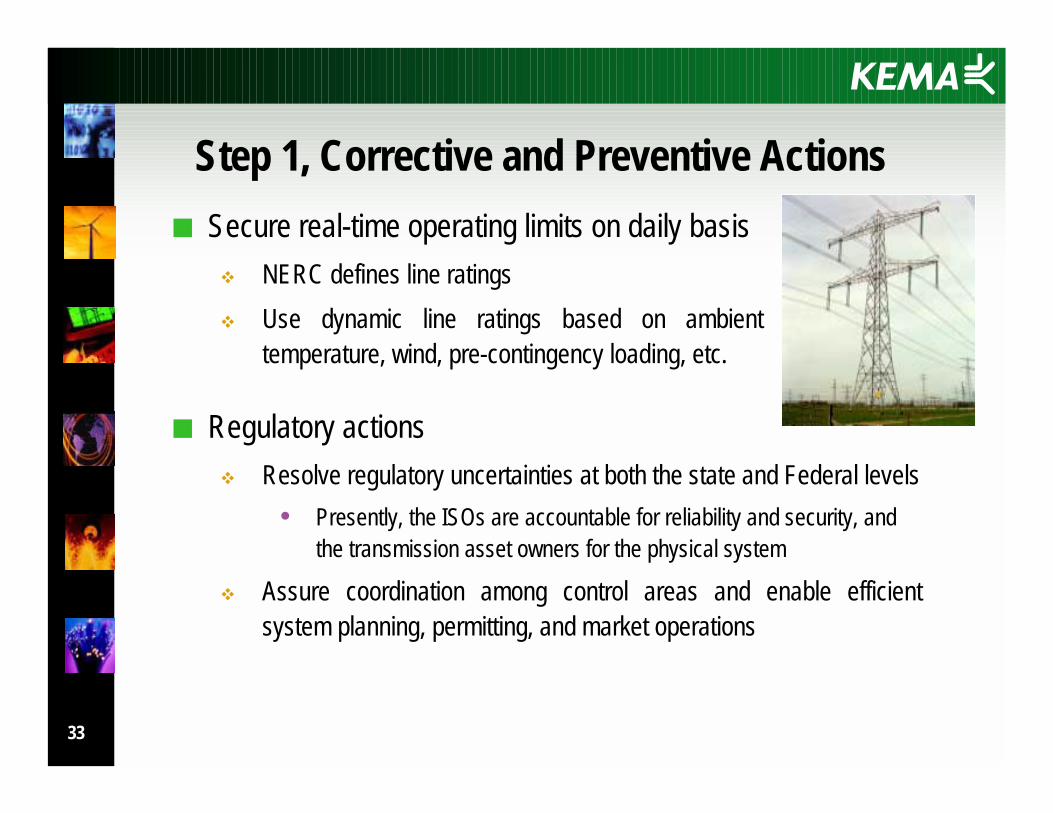
■ Secure real-time operating limits on daily basis! NERC defines line ratings! Use dynamic line ratings based on ambient
temperature, wind, pre-contingency loading, etc.
Step 1, Corrective and Preventive Actions
■ Regulatory actions ! Resolve regulatory uncertainties at both the state and Federal levels
• Presently, the ISOs are accountable for reliability and security, and the transmission asset owners for the physical system
! Assure coordination among control areas and enable efficient system planning, permitting, and market operations
34
■ Improve restoration procedures! It is not possible to completely prevent blackouts
! Need for effective and fast power system restoration after major disturbances.
! Well-defined procedures that require overall coordination within the restoring area, as well as with the neighboring electrical networks
! Reliable and efficient restoration software (as a part of EMS/SCADA) significantly helps operators to execute optimal procedures.
• Regular training and exercise sessions are required to assure effectiveness of the process
Step 1, Corrective and Preventive Actions
35
■ Automated Power System Restoration! Has not been widely used to avoid unexpected worsening
effects on the system
! Usual implementation is by restoring loads switched off by under-frequency load shedding as the frequency recovers
! Potential in using new communication and measurement technologies for wider implementation of automated power system restoration to help operators speed up the process
! New technology allows for advance development of outage scenarios and drill practices to help with restoration
• Similar to DTS (Dispatcher Training Simulators)
Improve restoration procedures
36
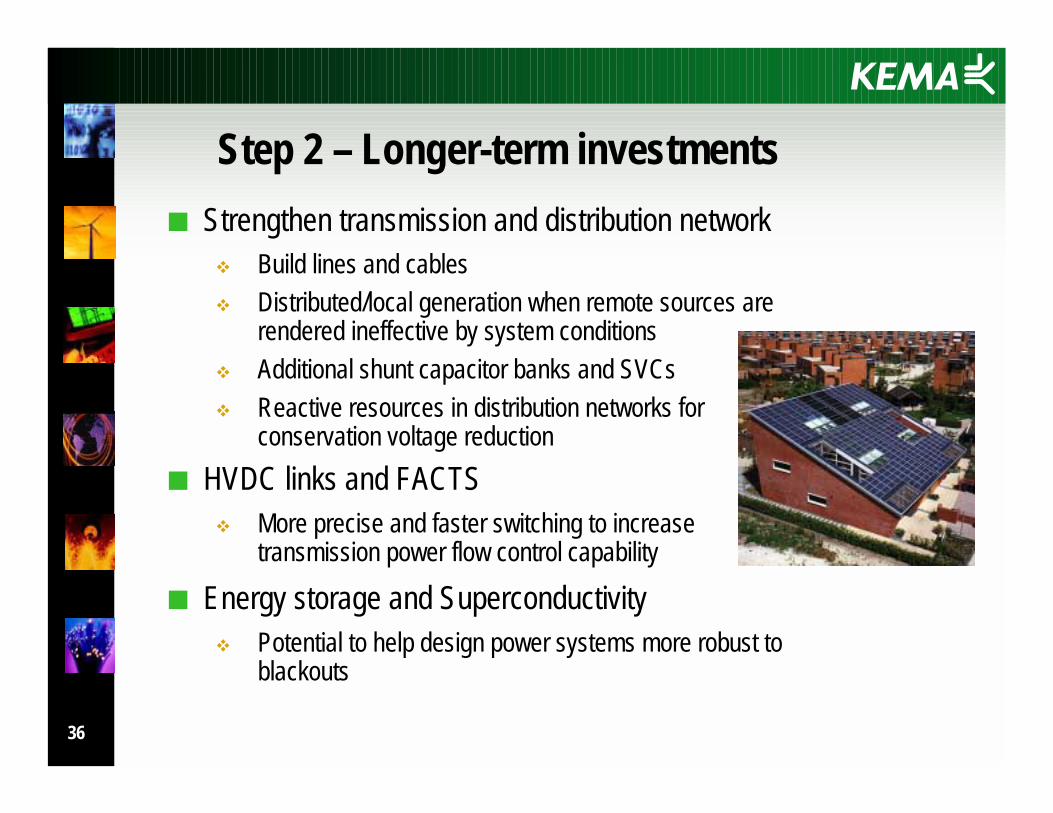
■ Strengthen transmission and distribution network! Build lines and cables! Distributed/local generation when remote sources are
rendered ineffective by system conditions! Additional shunt capacitor banks and SVCs! Reactive resources in distribution networks for
conservation voltage reduction■ HVDC links and FACTS
! More precise and faster switching to increase transmission power flow control capability
■ Energy storage and Superconductivity! Potential to help design power systems more robust to
blackouts
Step 2 – Longer-term investments
37
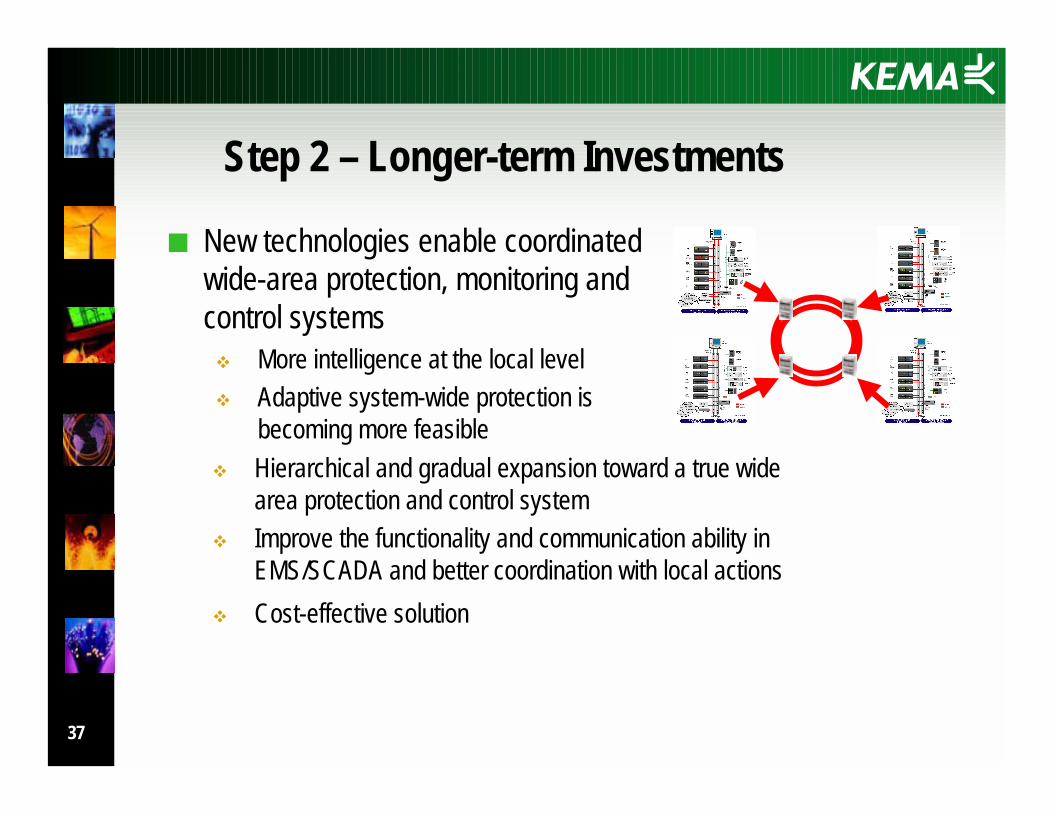
Step 2 – Longer-term Investments
■ New technologies enable coordinated wide-area protection, monitoring and control systems ! More intelligence at the local level! Adaptive system-wide protection is
becoming more feasible! Hierarchical and gradual expansion toward a true wide
area protection and control system! Improve the functionality and communication ability in
EMS/SCADA and better coordination with local actions! Cost-effective solution
38
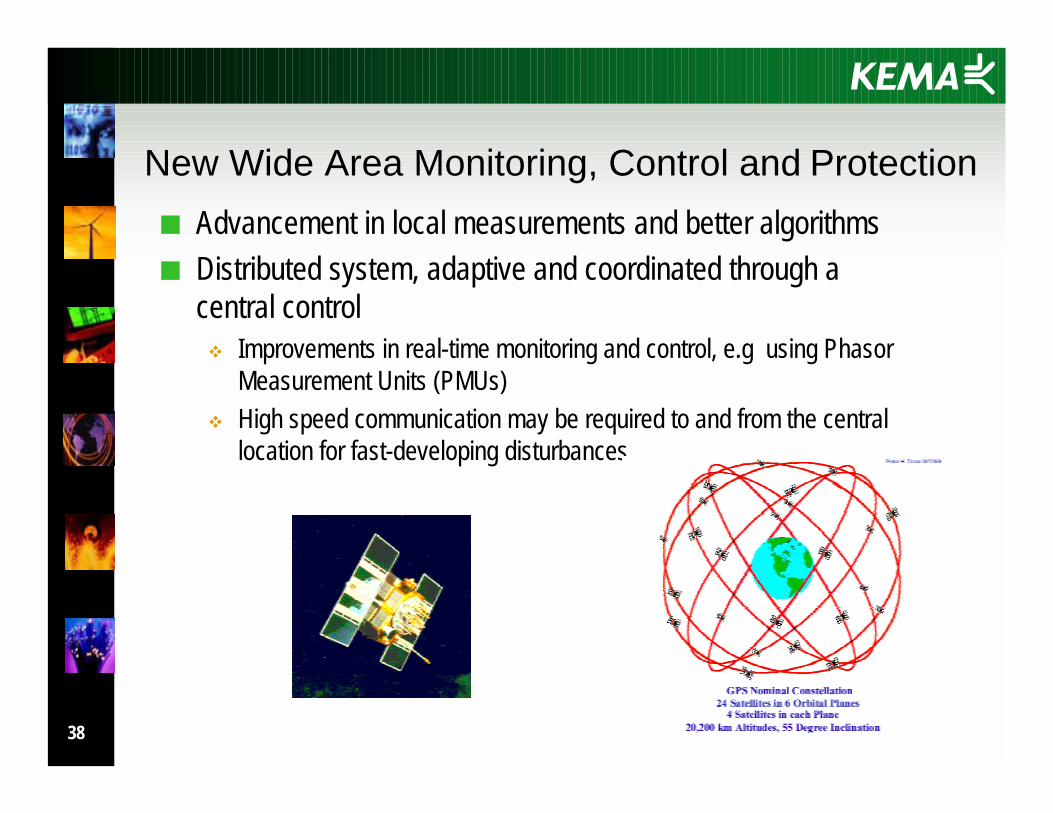
■ Advancement in local measurements and better algorithms■ Distributed system, adaptive and coordinated through a
central control! Improvements in real-time monitoring and control, e.g using Phasor
Measurement Units (PMUs) ! High speed communication may be required to and from the central
location for fast-developing disturbances
New Wide Area Monitoring, Control and Protection
39
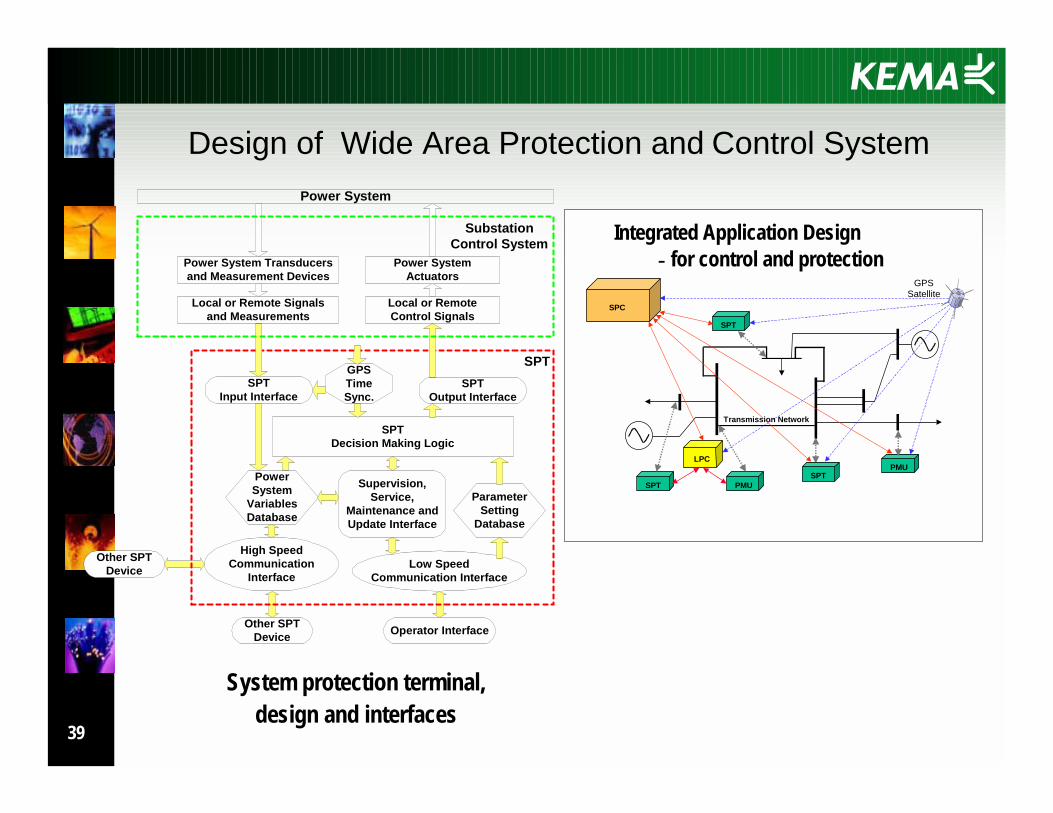
Design of Wide Area Protection and Control System
Transmission Network
SPT
SPTPMU
SPC
GPSSatellite
SPT PMU
LPC
Integrated Application Design- for control and protection
SPTDecision Making Logic
High SpeedCommunication
InterfaceLow Speed
Communication Interface
PowerSystem
VariablesDatabase
ParameterSetting
Database
Supervision,Service,
Maintenance andUpdate Interface
Operator Interface
Power System
SPTOutput Interface
SPTInput Interface
GPSTimeSync.
Power System Transducersand Measurement Devices
Power SystemActuators
SPT
Other SPTDevice
Other SPTDevice
SubstationControl System
Local or RemoteControl Signals
Local or Remote Signalsand Measurements
System protection terminal, design and interfaces
40
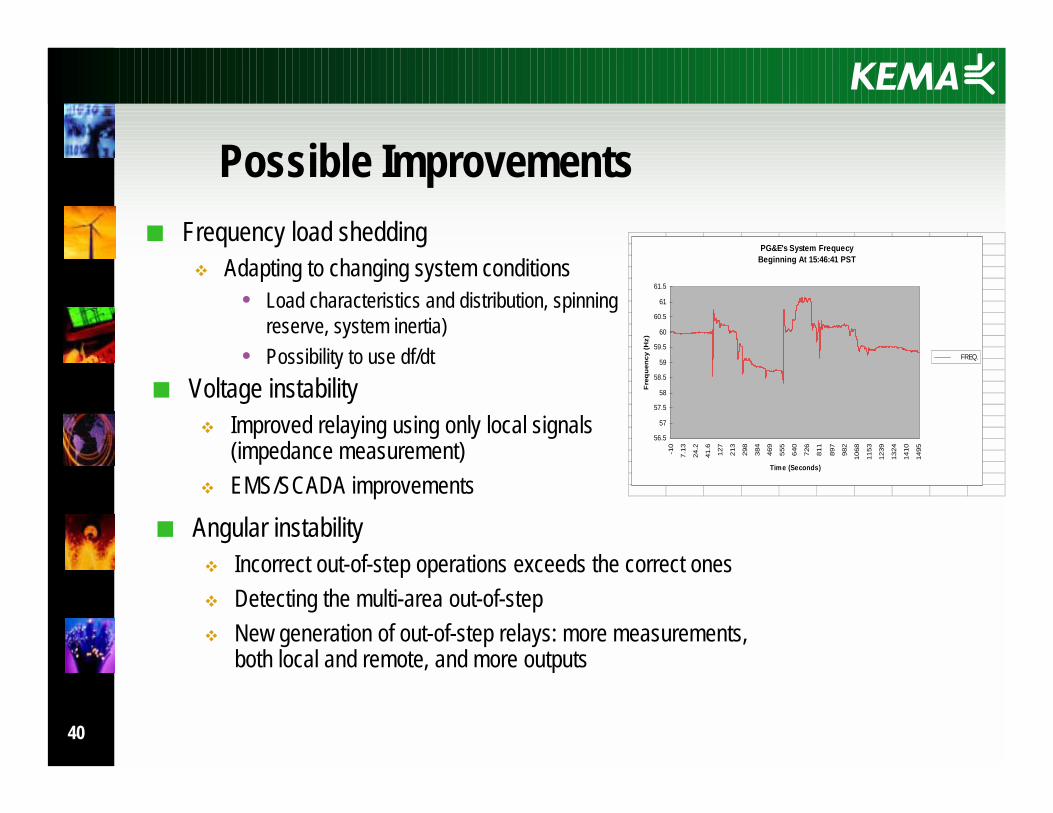
Possible Improvements■ Frequency load shedding
! Adapting to changing system conditions • Load characteristics and distribution, spinning
reserve, system inertia)• Possibility to use df/dt
PG&E's System FrequecyBeginning At 15:46:41 PST
56.5
57
57.5
58
58.5
59
59.5
60
60.5
61
61.5
-10
7.13
24.2
41.6
127
213
298
384
469
555
640
726
811
897
982
1068
1153
1239
1324
1410
1495
Time (Seconds)
Fre
qu
ency
(H
z)
FREQ.
■ Angular instability! Incorrect out-of-step operations exceeds the correct ones! Detecting the multi-area out-of-step! New generation of out-of-step relays: more measurements,
both local and remote, and more outputs
■ Voltage instability! Improved relaying using only local signals
(impedance measurement)! EMS/SCADA improvements
41
Conclusions■ Increase in a number and frequency of major blackouts■ Analysis of recent disturbances reveals some common
threads among them, leading to a conclusion that propagation of disturbances could be prevented
■ Various cures to minimize the possibility of future outages! A need for deployment of well-defined and coordinated overall plans
■ Prudent investment and stringent cost-benefit analysis required
■ Great potential for deployment of wide area protection and control systems as a cost effective solution to increase security

42
Questions???