Embed Size (px)
Citation preview

R-02-25
Svensk Kärnbränslehantering ABSwedish Nuclear Fueland Waste Management CoBox 5864SE-102 40 Stockholm SwedenTel 08-459 84 00
+46 8 459 84 00Fax 08-661 57 19
+46 8 661 57 19
System and safety studies ofaccelerator driven transmutation
Annual Report 2001
Waclaw Gudowski, Jan Wallenius, Kamil Tucek,
Marcus Eriksson, Johan Carlsson, Per Seltborg,
Jerzy Cetnar, Roumiana Chakarova and Daniel Westlén
Department of Nuclear and Reactor Physics
Royal Institute of Technology, Stockholm
March 2002

ISSN 1402-3091
SKB Rapport R-02-25
This report concerns a study which was conducted for SKB. The conclusionsand viewpoints presented in the report are those of the author(s) and do notnecessarily coincide with those of the client.
System and safety studies ofaccelerator driven transmutation
Annual Report 2001
Waclaw Gudowski, Jan Wallenius, Kamil Tucek,
Marcus Eriksson, Johan Carlsson, Per Seltborg,
Jerzy Cetnar, Roumiana Chakarova and Daniel Westlén
Department of Nuclear and Reactor Physics
Royal Institute of Technology, Stockholm
March 2002

PREFACE
The research on safety of Accelerator-Driven Transmutation Systems (ADS) at theDepartment of Nuclear and Reactor Physics has been focused in year 2001 on:
a) ADS core design and development of advanced nuclear fuel optimised for hightransmutation rates and good safety features;
b) analysis of ADS-dynamics
c) computer code and nuclear data development relevant for simulation andoptimization of ADS;
d) participation in ADS experiments including 1 MW spallation target manufacturing,subcritical experiments MUSE (CEA-Cadarache) and YALINA experiment inMinsk
The Department is very actively participating in many European projects in the 5th
Framework Programme of the European Community.
Most of the research topics reported in this paper are referred to by appendices, which havebeen published in the open literature. The topics, which are not yet published, are describedhere in more details.
Blue text color in a PDF version of this report implies links which can take a reader by amouse click to the referred part of the report or to a referred Appendix.

SAMMANFATTNING
Avdelningen för Kärn- och reaktorfysik på KTH har under år 2001 forskat om acceleratordrivna system för transmutation av kärnavfall. Följande områden har specialstuderats:
• Utformning och optimering av underkritiska härdar • Underkritisk reaktordynamik vid olycksscenarier • Egenskaper och beteende hos uranfria bränslen • Simulering av strålskador i konstruktionsmaterial • Utveckling av simuleringskoder och kärndatabibliotek • Kostnader för användning av acceleratordrivna system.
Avdelningen är dessutom aktiv i en rad EU-projekt, och deltar även i experimentella verksamheter. Arbetet har under året redovisats i 16 vetenskapliga artiklar, konferensbidrag och tekniska rapporter, vilka redovisas i appendici. Till de mer intressanta resultaten hör att:
• Reaktivitetsförluster i härdar med plutoniumbaserat bränsle kan hanteras genom att härdens storlek ökas med jämna mellanrum. Därmed kan den variation i acceleratorstyrka som behövs för att bibehålla en konstant härdeffekt begränsas till mindre än en faktor två. Införande av neutronabsorbatorer i härden (borkarbid) kan möjligöra hårdare neutronspektra och därmed högre klyvningssannolikheter för americium. Med 30% borkarbidstavar i bränsleknippen som innehåller americium, kan produktionen av curium halveras, jämfört med icke-absorberande alternativ.
• Reaktivitetsåterkopplingarna i en härd med uranfria bränslen är mycket små, varför den underkritiska härden bör utformas med stora marginaler till bränsleskada. Tänkbara olyckscenarier kan vara att felaktig (för stor) acceleratorström tillförs härden, eller att pumpar slutar fungera. Användning av bly-vismut som kylmedel i kombination med nitridbränsle och stora avstånd mellan bränslestavar visar sig ge tidsmarginaler på 100 sekunder eller mer innan bränsleskada uppstår. Beräkningar har visat att nödkylning av reaktortank vid pumpstopp kan åstadkommas genom naturlig cirkulation av luft, i fall härdeffekten är relativt låg (80 MWt). Den mest problematiska olyckstypen visar sig vara oväntade ökningar i acceleratorströmmen, varför passiva mekanismer (oberoende av elektronik) för att stänga av acceleratorn behöver utvecklas. Olika passiva mekanismer har föreslagits och redovisas i rapporten.
• Uranfria nitridbränslen möjliggör högre effekttäthet i bränslet samt att standardmetoder för upparbetning kan tillämpas. Dock behöver isotopen kväve-15 anrikas för att man skall undvika produktion av radioaktivt kol-14 vid bestrålning av naturligt kväve. Beräkningar har visat att en anrikningsgrad på 98% vore tillräcklig ett scenario då nitridbränslen används för transmutation av endast mindre aktinider. Merkostnaden för anrikningen uppskattades till mindre än 10% av totala bränslekostnaden.
4

• En helt ny potential för den effektiva växelverkan mellan järn- och kromatomer har tagits fram, vilken visade att antalet producerade defekter i modellstål främst beror på hur potentialen ser ut vid korta avstånd mellan atomerna. Migrationshastigheten för defekterna beror däremot mer på växelverkan vid längre avstånd.
• En 1 GeV proton ger upphov till c:a 15 primära spallationsneutroner, varav sjutton procent har energi högre än 20 MeV. Multiplikation genom neutronutslagning leder till att ett bly-vismuttarget kan producera runt 25 neutroner per proton. Inbromsning av spallationsneutronerna genom inelastisk spridning gör dock att dessa har en medelenergi som är lägre än medelenergin för klyvningsneutroner när de gör entré i bränsleelementen.
• Merkostnaden för att transmutera allt plutonium och americium som produceras av svenska lättvattenreaktorer i ADS uppskattades till 12 öre per kWh kärnkraftsel. Genom att anta återcykling av plutoniet som MOX en gång i lättvattenreaktor minskade till 8 öre per kWh. Konservativa antaganden om utbränning (10%) och tillgänglighet (70%) för acceleratordrivna reaktorer gjordes i denna studie, varför merkostnaderna i praktiken torde kunna minskas ytterligare.
Den första skarpa versionen av den Monte Carlo-baserade utbränningskoden MCB blev färdig och har släppts för distribution via NEAs databank tillsammans med 3 olika temparatureberoende kärndatabibliotek. Koden möjligör noggrann simulering av utbränning i närheten av starka absorbatorer som exempelvis styrstavar.
5

TABLE OF CONTENTS
PREFACE .........................................................................................................................3
SAMMANFATTNING.....................................................................................................4
TABLE OF CONTENTS..................................................................................................6
1 INTRODUCTION...................................................................................................10
2 DESIGN STUDIES OF TRANSURANIUM ADS BURNER (SING-SING CORE CONCEPT) .............................................................................................................11
2.1 Introduction .....................................................................................................11
2.2 Spallation target...............................................................................................11
2.3 Core design......................................................................................................14
2.4 Conclusions .....................................................................................................20
3 ADS DYNAMICS...................................................................................................22
3.1 Introduction .....................................................................................................22
3.2 Reference Design and Modeling .....................................................................22
3.3 The Role of Reactivity Feedbacks ..................................................................24
3.4 Importance of Doppler effect ..........................................................................25
3.5 Accident Analyses...........................................................................................27
3.6 An Approach to Inherent Shutdown................................................................30
3.7 Preliminary Concepts for Inherent Shutdown.................................................31
3.8 Conclusions .....................................................................................................33
4 FUEL FOR ADS: 15N ENRICHMENT REQUIREMENT FOR 2ND STRATUM ADS NITRIDE FUELS...........................................................................................34
4.1 INTRODUCTION...........................................................................................34
4.2 CARBON-14...................................................................................................34
4.3 THE DOUBLE STRATA SCENARIO ..........................................................34
4.4 MODELING....................................................................................................34
4.5 NITRIDES VERSUS OXIDES.......................................................................35
4.6 NITRIDE FABRICATION.............................................................................35
4.7 15N ENRICHMENT ........................................................................................36
5 MATERIALS FOR ADS: MOLECULAR DYNAMICS STUDY OF RADIATION DAMAGE IN FE-CR ALLOYS...........................................................................37
6

5.1 Background..................................................................................................... 37
5.2 General concept and structure of the Fe-Cr potential ..................................... 38
5.3 Implementation of the Fe-Cr potential to molecular dynamics simulations... 39
5.4 Conclusions..................................................................................................... 40
6 ADS SAFETY: EMERGENCY HEAT REMOVAL AND ACCELERATOR BEAM STOP DEVICES....................................................................................... 41
6.1 Introduction..................................................................................................... 41
6.2 Results............................................................................................................. 41
7 ADS RELATED EXPERIMENTS......................................................................... 45
7.1 MUSE ............................................................................................................. 45
7.2 1 MW SPALLATION TARGET DEVELOPMENT ..................................... 58
7.3 Yalina experiment........................................................................................... 59
7.4 SAD project .................................................................................................... 60
8 A COST BENEFIT ANALYSIS OF AN ACCELERATOR DRIVEN TRANSMUTATION SYSTEM ............................................................................. 63
9 CODE DEVELOPMENT....................................................................................... 65
10 NUCLEAR DATA LIBRARIES FOR ADS CALCULATIONS ...................... 66
11 SEMINARS, CONFERENCES AND INTERNATIONAL INTERACTIONS. 67
12 REFERENCES ................................................................................................... 69
APPENDICES ................................................................................................................ 73
APPENDICES:
APPENDIX I M. Eriksson and J. Cahalan, “Inherent Shutdown Capabilities in Accelerator-driven Systems,” Annals of Nucl. Energy (accepted Dec. 3, 2001). APPENDIX II M. Eriksson and J. Cahalan, “Applicability of Passive Safety to Accelerator-driven Systems,” AccApp/ADTTA '01, American Nuclear Society Winter Meeting 2001, Reno, November, 2001. APPENDIX III J. Wallenius et al, The European Union CONFIRM project, Proceedings of AccApp/ADTTA01, Reno, Nevada, 2001. APPENDIX IV J. Wallenius, S. Pillon, N-15 Requirement for 2nd Stratum ADS Nitride Fuels, Proceedings of AccApp/ADTTA01, Reno, Nevada, 2001.
7

APPENDIX V P. SELTBORG, R. JACQMIN, “Investigation of Neutron Source Effects in Sub-Critical Media and Application to a Model of the MUSE-4 Experiments,” Int. Meeting on Mathematical Methods for Nuclear Applications, Mathematics and Computation, September 9-13, 2001, Salt Lake City, Utah, USA (2001). APPENDIX VI P. SELTBORG, R. JACQMIN, “Spallation Neutron Source Effects in a Sub-Critical System,” Int. Meeting Accelerator Applications/Accelerator Driven Transmutation Technology and Applications ’01, November 11-15, 2001, Reno, Nevada, USA (2001). APPENDIX VII Y. Efimov, W. Gudowski, Checklist for TC-1 Target Test APPENDIX VIII W. Gudowski, A. Polanski, I. V. Puzynin, V. Shvetsov, ”Monte Carlo Modeling of a Sub-Critical Assembly Driven with the Existing 660 MeV JINR Protons Accelerator”, Proc. Accelerator Applications 2001 and ADTTA 2001 “Nuclear Applications in the New Millennium”, Reno (USA). ANS (2001) APPENDIX IX Daniel Westlén, “A Cost Benefit Analysis of an Accelerator Driven Transmutation System”, Msc Tehsis, Kungliga Tekniska Högskolan, Stockholm, 2001. APPENDIX X D. Westlén, W. Gudowski, J. Wallenius, K. Tucek: “A Cost Benefit Analysis of an Accelerator Driven Transmutation System”, Proc. Accelerator Applications 2001 and ADTTA 2001 “Nuclear Applications in the New Millennium”, Reno (USA). ANS (2001) APPENDIX XI Waclaw Gudowski, et al., 2IAEA BENCHMARK ON ACCELERATOR-DRIVEN SYSTEMS”, Proc. Accelerator Applications 2001 and ADTTA 2001 “Nuclear Applications in the New Millennium”, Reno (USA). ANS (2001) APPENDIX XII Jerzy Cetnar, W. Gudowski and J. Wallenius , “User Manual for Monte-Carlo Continuous Energy Burnup (MCB) Code –Version 1C”, KTH, Stockholm 2001. APPENDIX XIII Jerzy Cetnar, Waclaw Gudowski, Jan Wallenius and Kamil Tucek, “Simulation of Nuclide Transmutations with Monte-Carlo Continuous Energy Burnup Code (MCB1C)”, Proc. Accelerator Applications 2001 and ADTTA 2001 “Nuclear Applications in the New Millennium”, Reno (USA). ANS (2001) APPENDIX XIV Tucek K., et al.: Source efficiency in an accelerator-driven system with burnable absorbers, International Conference on Back-End of the Fuel Cycle: From Research to Solutions, GLOBAL 2001, Paris. ANS (2001). APPENDIX XV H. Condé, J. Blomgren, W. Gudowski, J.-O. Liljenzin, C. Mileikowsky, N. Olsson, and J. Wallenius, “Swedish Expert Group on Transmutation”, Proc. Accelerator Applications 2001 and ADTTA 2001 “Nuclear Applications in the New Millennium”, Reno (USA). ANS (2001)
8

APPENDIX XVI S. Barashenkov, S. Buttsev, S. Chigmnov, S. Dudarev, W. Gudowski et al. ”Fast Sub-Critical Assembly with MOX Fuel for Research on Nuclear Waste Transmutation” , Academy of Sciences of Belarus, 2001.
9

1 INTRODUCTION
The research program in accelerator-driven nuclear transmutation at the Department of Nuclear and Reactor Physics of the Royal Institute of Technology in Stockholm is focused on safety aspects of transmutation systems. In order to cover this broad and complicated topic and to harmonize our activities with international projects in which we actively participate, our research has been structured into few major workpackages:
• Design of high-performance ADS-core and analysis of its parameters including dynamics of ADS, emergency cooling systems, radiation stability of materials and development of advanced fuel for ADS
• Development of simulation tools and nuclear data libraries necessary for advanced ADS-simulations
• Participation in ADS-related experiments, with a special attention to important components of ADS (e.g. construction of the spallation target)
10

2 DESIGN STUDIES OF TRANSURANIUM ADS BURNER (SING-SING CORE CONCEPT)
2.1 INTRODUCTION There is a growing consensus today that radiotoxic inventory of spent fuel may be reduced by more than a factor of 100 in dedicated reactor systems (critical or sub-critical) operating on a fast neutron spectrum. Role of such dedicated systems in the transmutation scenarios is intimately interconnected with the selected plutonium strategy. In the frame of multi-component concepts, dedicated burners have been suggested to work in concert with a fleet of thermal and/or fast reactors. In our reactor design studies (Sing-Sing Core concept, SSC) an alternative approach has been investigated, when whole TRU vector from spent light-water reactor fuel is directed into the dedicated, sub-critical incinerator.
The SSC aims at addressing major difficulties associated with TRU recycling by:
• limiting Curium inventories, and thus He production in fuel pins, easing fuel handling, consequently extending burnup and maximum achievable actinide fission fraction rates,
• providing negative coolant void reactivity feedback, • limiting burnup reactivity swing, and thus increasing fuel residence time in the
reactor, • minimizing power peaking, increasing consequently an average power density, • limiting a beam margin available in accelerator, increasing thus grace time to fuel
and cladding damage under postulated design basis accident conditions.
The SSC is a medium power, 800 MWth lead-bismuth cooled core, employing 99.5% 15N enriched TRU mononitride fuel and lead-bismuth coolant. The concept relies on massive introduction of burnable neutron absorber (B4C) into the reactor core. Boron carbide acts as an effective shield of thermal neutrons, protecting them from being captured in even neutron number actinides. Accordingly, build-up of the alpha-emitter 242Cm is reduced. At the same time, burnable absorber (BA) provides means for an efficient power flattening (independent of fuel composition and geometry) and somewhat mitigates reactivity losses.
The introduction of burnable absorbers, on the other hand, deteriorates safety characteristics of the reactor, particularly coolant void reactivity and Doppler feedback. Due to lack of favourable prompt temperature feedbacks, loss-of-flow generated transients of overpower (TOP) can eventually result in cladding and fuel damage, especially if the accelerator beam is not turned off. One of the remedies, investigated within the frame of SSC design studies, is a substantial increase in pin pitches, providing thus sufficient coolant flow to carry out the excess heat from the system until reactor operator or passive inherent devices can react.
2.2 SPALLATION TARGET In the design investigation, the special attention was first paid to the utilization of spallation neutrons in the system [2]. This determines the efficiency of neutron
11

multiplication and directly an intensity of the external neutron source that has to be provided in order to keep the system power constant. The source efficiency of an external neutron source φ∗ relates the external source neutron multiplication to the multiplication of a neutron from an average fission as:
fsfiss
ext
kk
MM 0*
11
=−−
=φ ,
where Mext is the external source multiplication Mext=1+νNf, ν is the average fission yield, Nf is the number of fissions per source neutron, k0 is the external source neutron multiplication factor and Mfiss=1/(1-keff) is the fundamental mode neutron multiplication. The multiplication of the neutron chain except of the first neutron generation (i.e. neutrons produced by an external source particle) can be expressed as:
fsk
kkkkkk−
≡+⋅⋅+⋅++1
11 321211 L ,
where ki are multiplication factors of fission neutrons.
By introducing k0, the physical model of neutron chain propagation can be conveniently separated into source and fission parts. The external source neutron multiplication for spallation is usually obtained in calculation codes per incident particle, e.g. proton, and appropriate renormalization of results per source neutron is necessary. For this purpose, in our simulations, we introduce the multiplication parameter kp of a source particle, which is equal to the number of neutrons per source particle (i.e. proton).
The optimal relative axial position of the spallation target beam impact was investigated in terms of minimizing leakage of neutrons to axial reflectors. Leaked neutrons have lower probability to enter the reactor core and, consequently, induce fission. The target height was taken to be 3 m; a beam tube of 15 cm radius was adopted. A proton beam having a Gaussian shape (beam radius of 7.5 cm) was assumed to impinge on top of the lead/bismuth target. The proton energy was set to 1 GeV, corresponding to the optimal neutron gain per source proton and energy unit. The simulations have been performed by MCNPX Monte Carlo particle transport code executed in coupled proton, neutron, and photon mode using LA150 data library [4].
It appeared that the neutron leakage is minimized when the target surface is placed 17.6 cm above the core centre for a radius of 20 cm, while for R=50 cm, the optimal position is z=19.7 cm, see Figure 2.1(a). The slight shift of the optimal position can be attributed to enhanced diffusion of neutrons in the target material. The corresponding external neutron multiplication factor was evaluated for a realistic design of a sub-critical system with target radius of 25 cm and is displayed in Fig. 2.1(b).
Considering a typical active core length of 100 cm, about 8.5% of the neutrons leak outside the core (2.6% in the forward, 5.9% in the backward direction), which is to be compared to the 25.6% in the case of target radius of 50 cm (forward 10.8%, backward 14.8%). The total number of neutrons leaking out of the target without entering the core is showed in Fig. 2.2(a). More than 95% of neutrons enter the core when the fuel pin length is larger than 1.3 m, for the 50-cm target the corresponding figure is 2.1 m.
12

Figure 2.1: The axial distribution of normalized neutron flux exiting target of a given radius (a). The external source multiplication factor k0 as a function of beam impact relative to the core centre (b).
Figure2.2: The fraction of neutrons not directly entering the reactor core as a function of active pin length (a). Energy spectra of neutrons exiting target (b).
The spectrum of neutrons escaping the target has been determined for five different target radii. The results are displayed in Fig. 2.2(b). The probability to induce fission for source neutrons sharply decreases with increasing target radius (as the actinide fission-to-absorption ratio drops with decreasing energy). A change of source neutron spectrum has the largest effect for fertile matrices 238U and 232Th, while americium, neptunium and plutonium fission thresholds are lower, at energies of 400-600 keV. Remembering that fission neutrons are born with a median energy of 1.6 MeV, it is clear that the source efficiency may fall well bellow unity for targets of any reasonable sizes. The number weighted mean energy of the spectrum decreases by a factor of five for target radius increasing from 20 cm to 50 cm. Only 0.4% neutrons are above 20 MeV in the case of the 50 cm target radius while, 3.2% in the case of 20 cm radius.
It can be therefore concluded that a small target radius is favourable not only from the viewpoint of gaining fast neutron spectra but also for minimizing neutron losses to the axial reflector, both effects yielding higher source efficiency.
13

2.3 CORE DESIGN Reactor system investigations have been developed by revising our design of an accelerator-driven transuranium burner employing burnable absorbers [1]. This design consisted of four zones containing 84 hexanes, surrounded by one row of a steel reflector. Six central sub-assemblies were removed and replaced by a target module.
The composition of TRU vector assumed in the studies is corresponding to the aged light-water reactor spent fuel discharges of average burnup 41 GWd/tHM after 30 years of cooling. MCNP4C code was used for eigenvalue calculations. Burnup calculations have been performed by Monte Carlo code MCB (see section 9), integrating neutron transport simulations with in-flight calculations of reaction rates and nuclide density evolution.
2.3.1 Refined core
First, the technetium was removed from zone 2, and amount of uranium was adjusted in order to obtain a flat power profile. Additionally, an appropriate choice of sub-criticality at BOL (keff = 0.96) was made in order to accommodate maximum reactivity increases associated with lead-bismuth coolant voiding followed by fuel decomposition.
2.3.2 Homogeneous vs. heterogeneous modeling
At this stage, before advancing into more elaborate simulations, we investigated a sensitivity of our results to the modelling approximation of the system geometry. The self-shielding effects observed in standard fast reactor design can be even more pronounced in reactor cores with heavy presence of burnable absorbers.
A full pin-by-pin core geometry model of the refined core was thus compared with the homogeneous approximation, when fuel and absorber pins were smeared together with the cladding while ducts and coolant in-between individual sub-assemblies were modelled explicitly. The results of this simulation are displayed in Table 2-1.
In order to dispatch the study and match realistic calculation times, the homogeneous modelling approach is clearly preferable as calculation times are increased by more than a factor of five in the case of heterogeneous modelling in order to reach similar 1-sigma relative statistical errors. On the other hand, homogeneous approximation implies strong underestimation of a neutron multiplication and sub-criticality level by ~2000 pcm. We note that the source efficiency remains rather constant at this sub-criticality level.
Table 2-1: Comparison of eigenvalue and source calculations for homogeneous and heterogeneous designs. In the case of eigenvalue calculations, totally 1 million of neutrons have been simulated in 100 active histories. 3000 protons were used in a source multiplication run. Simulations have been performed on a single 1 GHz Pentium III processor PC running Linux OS. Design keff Tcalc (min) Mext Tcalc (min) φ*
Homogeneous 0.94079 ± 0.00054 99.5 18.463 ±
0.0049 2166.7 1.162 ± 0.0093
Heterogeneous 0.96086 ± 0.00053 308 27.461 ±
0.0055 11920.4 1.119 ± 0.0141
14

2.3.3 Improving core design
In order to improve source efficiency, according to the previous findings, we start to modify the refined core by decreasing the target radius from 25 to 19.6 cm. Consequently, power of the system was decreased to 800 MWth to assure the removal of dissipated heat in the target. Main parameters of the core are described in Table 2-2.
Table 2-2: Design parameters of fuel pin and pellet
Core power (MWth) 800
Cycle length (days) 300
k-eigenvalue at BOL 0.96
Target radius (cm) 19.6
Target wall thickness (cm) 0.5 Fuel (U,TRU)N + ZrN
Pellet density (% TD) 0.85
Coolant and target material Pb/Bi
Maximum coolant velocity (m/s) 2.5
Structural material Fe/Cr-steel Pin design
Active pin length (cm) 100
Pellet inner radius (mm) 1.00
Pellet outer radius (mm) 2.40
Clad inner radius (mm) 2.49
Clad outer radius (mm) 2.94
Smear density (% TD) 0.67
Comparing to our previous studies, the number of fuel zones have been increased from four to seven. The most important improvement is, however, that we have removed all minor actinides from the inner core parts, and located them in fuel pins adjacent to the absorber pins present in the central core zones. The core consists of three distinctive zones: the source multiplication zone ensuring effective multiplication of spallation neutrons, the transmutation zone where all minor actinides are placed and the outer driver supplying neutrons to heavily poisoned transmutation zones.
Thermo dynamical stability constraints concerning mononitride fuel determine the maximum linear power rating of fuel pins. In the multiplication zones, the linear power is limited to 60 kW/m as the fuel centreline temperature cannot exceed 1573 K at which the stability of AmN is ensured, while linear ratings up to 80 kW/m are permissible in source and driver zones as thermal conductivity of fuel is enhanced by UN and ZrN, respectively. The thermal behaviour of CmN is a large uncertainty factor, due to a lack of experimental data, but thermal conductivity is supposed to follow know decrease
15

with increasing proton number. In the driver zones, the fuel was mixed with ZrN in order to compensate for excessive plutonium reactivity. Uranium-TRU ratios as well as BA content in the individual zones are adjusted in order to obtain flat power distribution at BOL.
A triangular pin lattice is adopted keeping core compact and thus maintaining hard neutron spectrum. The active length of the core is 100 cm, similar to those adopted for standard fast reactor designs.
2.3.4 Impact of the pin pitch
In an approach to the optimised core design, we first investigate an impact of pin pitch variation on neutronic and burnup performance. For a purpose of these scoping calculations, we consider a semi-heterogeneous modular design of a transuranium burner. The core structure is modelled heterogeneously while densities of materials outside the core were smeared.
The effect of increasing coolant fractions was investigated by enlarging reactor lattice pitch-to-diameter ratio from 1.883 to 2.448, which corresponds to the coolant volume fractions of 75.4%, and 85.6%, respectively. These designs are then compared to the refined design of our 1200 MWth-core, see Table 2-3. The amount of boron carbide and minor actinides were adjusted in order to obtain flat power profile in the core. The relative fraction of pins in source, transmutation, and driver zones was kept roughly constant, while their total number was adjusted in order to obtain the effective multiplication coefficient equal to 0.96. The power of the system was kept constant at the level of 800 MWth as limited by availability of the target to lead out dissipated heat.
Table 2-3: Data and performance characteristics of individual core design options. Sub-assembly inner and outer flat-to-flat are 16.62 cm and 17.12 cm, respectively. The MA/TRU ratio was taken to be 82.5%; 300- days long fuel cycle is adopted.
Parameters Unit Refined ref. [1] P/D=1.883 P/D=2.448
Power MWth 1200 800 800 k-eigenvalue (keff) 0.960 0.960 0.961 Source intensity at BOL 1018 n/s 3.98 2.72 4.21
Beam current increase 2.9 3.5 2.1 φ* 1.10 1.24 0.7 S/A (source/transm/driver) 12/72/0 30/66/20 54/126/74
Reactivity loss pcm/cycle 6900 7000 4300
Average linear power kW/m 46.7 40.4 26.3
Average burnup % h.a. 7.6 6.8 4.6
Uranium content %U/(U+TRU) 27.1 22.0 16.3
Net Pu consumption kg/y 230 177 180
Net MA consumption kg/y 43 18 22
Coolant void worth (core and upper plenum voided) pcm +2200 ~0 +540
16

In the reactor lattices with large pin pitches, both burnup reactivity swing and average burnup decreases (burnup reactivity swing per percent burnup remaining rather constant, however). The most pronounced effect is, however, a drastic drop of source efficiency due to the enhanced neutron thermalization in P/D = 2.448 case. The consumption rates of plutonium and minor actinides shown to be, however, mainly determined by core power.
Large volume fractions of coolant enhance core’s potential for decay heat removal, improving thus safety margins to fuel and cladding damage during reactivity transients (beam overpower, loss-of-flow, and loss-of-heat-sink). Moreover, large pin pitches have a beneficial impact on coolant void reactivity. In our core concept, we therefore rely on enlarging pin lattice up to P/D ∼ 2.2. Shortening of the cycle length and application of batch-wise refuelling strategy then manage the associated decrease in source efficiency.
2.3.5 Optimised core design
For the optimised core design, the flat-to-flat (FTF) of the core sub-assembly was further decreased to 9.72 cm, allowing thus a finer distribution of fuel and burnable absorbers in the core. Further decrease of the duct FTF is however not meaningful as this would lead to an excessive fraction of construction material in the core.
The proton beam impact window was placed 17.2 cm above the midplane of the core in order to minimize number of neutrons leaking out of the spallation target into the axial reflectors and maximizing the source efficiency. The gas plenum is located in the upper part of the core, reducing risks associated with positive reactivity insertion due to gas release from ruptured cladding. The length of the upper plenum was assumed to be substantially large, 150 cm, sufficient to accommodate released fission gases and all nitrogen, would the dissociation of nitride fuel occur.
Figure 2.3: Cross-section of the optimised Sing-Sing core design. The core consists of four zones: source zones consisting of (U,Pu)N pins (depicted in yellow), buffer zone with PuN and B4C pins (in dark orange), transmutation zone containing (Pu,MA)N and B4C pins (in blue) and driver with (Pu,Zr)N pins (in grey). Core enlargement zones are depicted in red (30 S/A), green (34 S/A), and orange (38 S/A).
17

The outer radius of the spallation target is kept at 19.6 cm and the core now consists of 12 zones, see Fig. 2.3. The distribution of the fuel pins and BA yielding flat power density at BOL is further summarized in Table 2-4. Three innermost zones are fuelled with uranium and plutonium, 238U content ranging from 80% to 60% in zone 1-3. The amount of MA in TRU fuel of transmutation zones is kept under 30% as pins with larger MA fractions may start to be difficult to fabricate. In the driver zones, the PuN is mixed with diluent (ZrN) in order to compensate for excessive plutonium reactivity.
Table 2-4: Sub-assembly design parameters yielding a radial power peaking less than 1.25 at BOL.
Zone 1 2 3 4 5 6 7 8 9 10 11 12Fuel pins 61 61 61 26 26 26 27 28 29 29 37 37
B4C pins 0 0 0 11 11 11 10 9 8 8 0 0
Pin P/D 1.83 1.83 1.83 2.33 2.33 2.33 2.33 2.33 2.33 2.33 2.33 2.33Number S/A 18 24 30 36 42 48 54 60 66 54 96 78 In order to increase source efficiency, we set up smaller pin pitches in the source zones while larger in transmutation zones and driver. As the AmN is removed from the source zones, small pitches does not at accidental conditions (i.e. a sudden increase of beam power) immediately result in fuel decomposition.
At BOL, the power density peaks in the driver zones, but in the course of the irradiation the power shifts towards the innermost multiplication zones, see Fig. 2.4(a). Maximum radial power peaking factor thus always remains under 1.4. However, this “power swing” behaviour is also responsible for rather low source efficiency being 0.61 at BOL.
Figure 2.4: Radial power density (a) and minor actinide fission probabilities in individual core zones (b).
The volume fraction of boron carbide in transmutation zones (5-10) is kept at 25-30%, yielding maximum fission-to-absorption probabilities of 241Am equal to 0.24, a factor of two higher than for typical designs relying on diluents or moderators, see Fig. 2.4(b). The neutron spectrum remains fairly constant in transmutation zones, with median energies ranging from 300 to 400 keV.
18

In this study, we incorporate a fuel cycle consisting of four irradiation batches (150 days long) with 30 days outages for refuelling, see Fig. 2.5(a). The core is enlarged by 30, 34, and 38 sub-assemblies during first, second, and third outage period, respectively. The beam power in-between outages increases roughly twice. Such a beam margin can be safely accommodated by the system, providing sufficient time for passive devices or system operator to respond [see Section 3].
Figure 2.5: Reactivity loss (a) and increase in accelerator power (b) during one irradiation cycle. Values for present, optimised SSC2 design are compared to the SSC1 figures [1].
The neutronic and burnup characteristics of the optimised core design are summarized in Table 2-5.
Table 2-5: Neutronic and burnup performance parameters for optimised core design of the Sing-Sing core (SSC2).
Parameters Unit SSC2
Power MWth 800 Proton Beam Energy GeV 1 Number of batches 4 Cycle length days 150 Reactivity Loss pcm/%h.a. 1085 Average Linear Power at BOL kW/m 38.6 Average Burnup %h.a./cycle 13.0 U/(U+TRU) content % 19.8 Fissile inventory at BOL kg 3477 Net Pu consumption kg/y 171 Net MA consumption kg/y 20 Doppler constant 10-5 T dk/dT -38.7 BOL βeff pcm 170 Coolant void worth (core and upper plenum voided) pcm -1500
Coolant void worth (only core voided) pcm 1900
19

The reactivity loss is about 1000 pcm per percent of TRU burnup and the average fuel burnup achieved during an irradiation period of 600 efpd becomes 13%. The system features considerable negative void reactivity worth (upon voiding both core and upper plenum). On the other hand, limited presence of fertile materials in the fuel results in a deterioration of prompt fuel temperature feedback. Moreover, in very hard spectrum, hardly any neutrons reach resonances around 1 keV (2.4 keV for 240Pu and 0.9 keV for 242Pu). Due to the low fractions of uranium in the fuel, the effective delayed neutron fraction βeff is accordingly very small. The ability of the core to respond to the postulated design basis accidents is therefore mainly ensured by deep sub-criticality of the system.
The concentration of higher actinides in the fuel cycle was calculated for mass-constrained equilibrium assuming 4-year cooling time prior fuel reprocessing. Equilibrium inventories of higher actinides (americium and curium) in SSC2 showed to be only weakly dependent on flux level and equals to 15% (in transmutation zones an average flux level is 2.5⋅1015 n/cm2/s), see Fig. 2.6(a). On the other hand, the equilibrium fraction of curium is highly dependent on a flux level, as shown on Fig. 2.6(b), and in SSC2 core equals to about 1%. This is to be compared to more than 4% in a CAPRA type spectrum (φ ∼ 4⋅1015 n/cm2/s). Due to the high fractions of MA in the BOL fuel of JAERI ADS MA burners, their equilibrium concentrations of higher actinides are accordingly larger than for TRU incinerators.
Figure 2.6: Equilibrium inventories of higher actinides (a) and curium (b) with respect to the amount of TRU elements in discharged SSC2 fuel. Fuel cooling time is 4 years.
2.4 CONCLUSIONS Sing-Sing core concept is based on a massive introduction of burnable absorbers (B4C) into the core of sub-critical transuranium burner. The core design has been further optimised in order to limit adverse effects of boron carbide on reactor safety parameters (coolant void worth) while, at the same time, maintaining favourable core transmutation characteristics. A special attention was paid to the economy and utilization of spallation neutrons inducing fission in the reactor system. The source efficiency appeared to be a strong function of the target radius and axial position of a beam impact with respect to the active core. We therefore decreased the radius of the spallation target and
20

consequently lowered the total core power to 800 MWth. Pin pitches in the transmutation zones and driver were simultaneously increased up to P/D = 2.33.
The core features improved safety characteristics - coolant void worth being slightly negative upon the voiding the core and upper plenum from coolant. At the same time, unprotected loss-of-flow and transient overpower by beam insertion accidents are safely accommodated such that risks for fuel and cladding damage are minimized. Burnup reactivity swing was managed by stepwise core enlargement after each irradiation sub-cycle (batch). The source intensity thus increases by less than a factor of two during the fuel cycle with fuel average burnup reaching 13%. Problems with lower source efficiency could be in further studies addressed by optimisation of active fissile column length and reloading of fuel sub-assemblies in source multiplication zones.
21

3 ADS DYNAMICS
3.1 INTRODUCTION Problems related to the dynamics of ADS have been studied in collaboration with the Argonne National Laboratory (ANL) of the United States. The main goal of the collaboration is to investigate whether and how a passive safety strategy can be applied to ADS. The analysis presented in this section is a selection of work that has been reported in two recent papers [5] [6] (see Appendices I and II).
Several dynamic features are characteristic and important for the ADS. Inherent reactivity feedbacks have proven to be excellent means for achieving passive safety in traditional reactors that operate in the critical mode. However, it is shown that the course of design-basis accidents in an ADS is relatively insensitive to the values of individual reactivity coefficients. We examine the role of reactivity coefficients in accident analysis. We evaluate the potential for passive safety by Doppler reactivity feedback. The usually desirable negative Doppler effect is an important safety mechanism in a critical reactor, but the effect is vanishing small in accelerator-driven systems employing dedicated fuels (free from fertile fuel isotopes such as uranium or thorium).
We investigate the applicability for inherent shutdown mechanisms. Given the dynamic characteristics of an ADS, it is necessary to manage the external neutron source in order to achieve passive shutdown capability. We investigate conceptual designs of self-actuated shutdown devices. Operating characteristics is obtained by studying dynamics performance of the Sing-Sing Core (SSC) subject to a set of representative accident initiators.
3.2 REFERENCE DESIGN AND MODELING Accident analysis is performed with the aid of the SAS4A safety code [7]. The thermal, hydraulic, neutronic, and mechanical models employed in the SAS4A computer code were developed in the U.S. liquid metal reactor development program. These models have been extensively validated with experimental test data from the EBR-II, FFTF, and TREAT reactors [8][9][10]. The coolant thermophysical property database used in SAS4A has been extended to include the properties of lead-bismuth eutectic (LBE), based on evaluations of available U.S. and Russian experimental data [11][12]. The combination of experimentally based coolant thermophysical property data with the already validated, first-principles coolant thermal-hydraulics models in SAS4A provides a satisfactory basis for conceptual design basis analysis.
In the assessment, we employ a reference design of an ADS to obtain operating performance data. The reference design is based on the Sing-Sing Core (SSC) concept. The SSC is a model of an ADS that has evolved at the department of Nuclear and Reactor Physics [1][2][3]. Basic design parameters are listed in Table 3-1. Further details on the SSC concept are outlined in previous chapters. A comprehensive model of the primary system is set-up including a multi-channel model of the core, heat exchangers, pumps, compressible pool volumes, etc. The primary circuit is illustrated in Fig. 3.1. The core, heat exchangers, and primary pumps are immersed in a single pool containing LBE. Coolant temperatures, in steady state, range from 573 K at inlet to 702
22

K at the outlet. The reactor vessel is filled with LBE to a prescribed level, with the remainder of the vessel being occupied by an inert cover gas. The steam generators are elevated well above the core to promote natural convection.
Table 3-1. Reference ADS design parameters (SSC concept)
Core power, MWth 800
Coolant LBE
Core inlet temperature, K 573
Core outlet temperature, K 702
Flow velocity, m/s 2.5
Volume hot pool, m3 435
Volume cold pool, m3 197
Volume inlet plenum, m3 20
Fuel Nitrides
Composition (core average) 12%MA/73%Pu 15%238U
Pellet inner radius, mm 1.00
Pellet outer radius, mm 2.40
Cladding HT-9
Inner radius, mm 2.49
Outer radius, mm 2.94
P/D 1.83 and 2.33
keff eigenvalue, BoL, steady state 0.954 βeff, % 0.160
Doppler constant, Tfdk/dTf -3.87*104
Coolant density, dk/dTc -2.28*104
23

M
STEAMGENERATOR
x 4
PRIMARYPUMP
(CENTRIFUGAL)x 4
10.0 m
15.0
m
-4.0 m (BOTTOM OF VESSEL)
-1.5 m (OUTLET COLD LEG)
-1.0 m (CORE INLET)
0 m (BOTTOM FUEL SECTION)
+3.0 m (CORE OUTLET)
+1.0 m (PUMP OUTLET)
+8.0 m (INLET STEAM GENERATOR)
BEAMTUBE
COLD POOL(COMPRESSIBLE VOLUME 3)
HOT POOL
INLET PLENUM(COMPRESSIBLE VOLUME 1)
OUTLET PLENUM(COMPRESSIBLE VOLUME 2)
CORE
COLD LEG
+4.0 m (PUMP INLET + OUTLETSTEAM GENERATOR)
+6.0 m (THERMAL CENTER OF STEAMGENERATOR)
+9.0 m (COVER GAS LEVEL)
+11.0 m (TOP OF VESSEL)
CORE SUPPORT STRUCTURE
Figure 3.1: Model of the primary circuit of SSC
3.3 THE ROLE OF REACTIVITY FEEDBACKS A source-driven system does not respond to reactivity feedbacks like a critical reactor. While the critical reactor is sensitive to reactivity feedbacks, the ADS is not. The ADS is largely offset from criticality. The net effect is a substantially reduced sensitivity to reactivity changes. On one hand, this feature is advantageous since it mitigates the consequences of reactivity insertion accidents; on the other hand, it diminishes the practical use of negative reactivity feedbacks as a means for natural safety mechanisms in accelerator-driven systems. We address the latter feature.
To study these characteristics we exposed the reference design to an unprotected transient overpower (UTOP) event. The initiator for the accident is a sudden increase in source strength. The intensity of the external neutron source is promptly increased by a factor of 1.8, corresponding to the insertion of maximum beam capacity at begin-of-life. It represents a strong transient, integral power increases by a factor of 1.8 within a few hundred prompt periods. In Fig. 3.2, the effect of subcriticality on the combined reactivity effect from Doppler feedback (Tfdk/dTf=-3.87×10-4) and coolant density feedback (dk/dTc=-2.28×10-6) is illustrated. The unconstrained response, when no feedbacks are accounted for, is also shown to facilitate comparison. The response is calculated for a varying degree of subcriticality, keff=0.954 (reference design), keff=0.98, keff=0.995, and keff=0.9995. Structural reactivity feedback phenomena (e.g. radial and axial core expansion) are not taken into account. Employing more sophisticated feedback models is of little interest for our purpose. Fig. 3.2, clearly demonstrates the response of an ADS subject to reactivity feedbacks (prompt and delayed feedbacks).
24

1.0
1.2
1.4
1.6
1.8
0 100 200 300 400 500 600 700 800 900 1000Time [s]
Norm
alize
d rea
ctor p
ower
keff=0.9995
keff=0.995
keff=0.980keff=0.954
keff=0.954 (no feedback)
Tfdk/dTf= -3.87e-4dk/dTc= -2.28e-6
Figure 3.2: Impact of reactivity feedbacks in a source-driven system. Accident initiator by sudden increase in source intensity (S=1.8*S0). Subcriticality is a parameter.
The reference ADS (keff=0.954) experiences minor influence from reactivity feedbacks whereas the close-to-critical system (keff=0.9995) exhibits strong feedback effects. Approaching criticality, on the expense of reducing the margin to prompt criticality, results in stronger feedback coupling. The significance of feedback mechanisms in a source-driven system depends on the reactivity worth of these feedbacks, i.e. reactivity coefficients, but more important on the choice of the subcritical level. Thus, taking advantage of reactivity feedbacks calls for a careful balance between the desired feedback performance and the subcritical margin. It is seen in Fig. 3.2, that it is not until we approach a multiplication constant of keff>0.999 (~1$ below critical) that reactivity feedbacks have a significant influence and possibly could serve as a means for inherent shutdown. The level of subcriticality being suggested for most conceptual ADS’s is at least an order of magnitude larger (~10$ subcritical or keff<0.99). It is clear that reactivity feedbacks will not be as effective a means in source-driven systems as they are in critical systems. Much stronger reactivity effects, from what is experienced in traditional reactors, are necessary to effect the source-driven system. Therefore, it is not practical to implement reactivity feedbacks, by physics or engineering design, as the sole means to accommodate inherent shutdown. Inherent shutdown must be reinforced by other means.
3.4 IMPORTANCE OF DOPPLER EFFECT There has been considerable interest on the use of so-called “dedicated” fuels as to achieve maximum transmutation rate in accelerator-driven systems. The dedicated fuels contain large amounts of minor actinides (Np, Am, and Cm) and plutonium, but lack the classical fertile isotopes (i.e. 238U and 232Th). Subsequent deterioration of safety parameters, when using such fuels, is well known [14]. While Doppler broadening of capture resonances is an important reactivity mechanism in a reactor loaded with uranium fuel, the effect is vanishing small in accelerator-driven systems using dedicated fuels. The reduction of the fertile inventory and the spectrum hardness are the main reasons for this impairment. It has been argued that a typical ADS core, based on dedicated fuels, contain several critical masses, which in principle provides the potential
25

for criticality if the fuel is rearranged in a more dense configuration. In the absence of Doppler effect, such accidents may occur without any restraining prompt negative reactivity feedback. Provisions for increasing the Doppler effect in dedicated cores have been proposed. It is possible to enhance the Doppler effect in a fertile-free core by adding a hydrogenated moderator [15]. The argument is that a softer spectrum allows more neutrons to appear in the resonance region. Practically all the Doppler effect occurs below about 25 keV, where cross section variations with temperature are large [16]. Another possibility is to introduce enough 238U into the core to provide a Doppler effect of a size significant for safety. 238U is a main contributor to a negative Doppler effect. Temperature rise in 238U results in a relatively large increase in the effective parasitic capture cross section.
We investigated the merits; in terms of safety performance, for enhancing the Doppler effect in an ADS. By explicitly taking into account the Doppler feedback, we studied the response following a sudden “source jump” (same as previous transient). The source transient was chosen because it results in high fuel temperatures, which is the driver for reactivity input by Doppler effect. Different values for the Doppler constant were modeled, Tdk/dT=-3.87×10-4 and Tdk/dT=-2.71×10-3, representing a core containing dedicated fuels and a core containing large amounts of fertile isotopes, respectively. The results are presented in Fig. 3.3.
1.0
1.2
1.4
1.6
1.8
0 100 200 300 400 500 600 700 800 900 1000Time [s]
Dedicated fuel (Tdk/dT=-3.87e-4)Fertile fuel (Tdk/dT=-2.71e-3)Tdk/dT 3 87 4
Norm
alize
d rea
ctor p
ower
keff=0.9995
keff=0.9995
keff=0.954
keff=0.954 (ref.)
Figure 3.3: Doppler feedback in source-driven systems. Two different subcritical levels are considered. Accident initiator by sudden increase in source intensity (S=1.8*S0).
The Doppler effect has negligible influence on the dynamics of a subcritical assembly with a multiplication constant of keff=0.954 and a core loaded with dedicated fuel. Even when the Doppler constant is increased by a factor of seven, by introducing massive amounts of fertile material, the actual gain in safety performance is small. There seems to be little benefit for increasing the Doppler effect in an effort to obtain a more benign response to accidents that remain in the subcritical state. In general, the importance of the Doppler effect in an ADS is strongly related to the level of subcriticality. There is no doubt that the Doppler effect is of great value if the system is close-to-critical, see Fig.
26

3.3 (keff=0.9995). It is the main limiting safety mechanism in supercritical excursions. In that perspective, the Doppler effect must not be excluded as an important safety means in source-driven systems. The role of Doppler feedback in hypothetical accidents exceeding the critical margin must be further investigated.
3.5 ACCIDENT ANALYSES Thermal response of core structures and the time to reach failure under various accidents influences the requirements on the shutdown system. Knowledge of the grace period is essential in the evaluation of such devices. The plant must survive long enough that a passive safety action can be initiated in time to prevent core damage. Our intention is to study the response in order to assess the requirements on the safety system and to evaluate possible actions to enhance the performance. We subjected the reference design to three representative sequences of unprotected (i.e. no shutdown or plant protection system action) design basis accidents, namely:
a) Unprotected transient overpower (UTOP) by a prompt insertion of maximum beam power. It is assumed that the steam generators remove heat at a rate of nominal power (=constant temperature drop in steam generators).
b) Unprotected loss-of-flow (ULOF) by a loss of primary pump power. Feed-water flow is assumed to remain at its initial value and coolant inlet temperature is constant (=constant outlet temperature in steam generator).
c) Unprotected loss-of-heat-sink (ULOHS) by a sudden inability of the steam generators to remove heat (=zero temperature drop in steam generators).
In Figures 3.4 and 3.5, peak fuel temperatures and peak cladding temperatures, respectively, are displayed as a function of time. Safety margins for the SSC are indicated. These are based on postulated transient failure temperatures. The stability limit of the fuel is set to 1573 K, which represents a conservative assumption of the dissociation temperature of AmN [18]. Mechanical failure limits used to evaluate cladding failure are based on transient burst tests conducted on unirradiated and internally pressurized cladding specimens [19].
In the source transient (UTOP), the power “jumps” by a factor of 1.8, see Fig. 3.2. Since no time is required for heat flow, the fuel suffers a rapid, almost adiabatic thermal excursion, Fig. 3.4. Coolant and structure are heated at a rate determined by the time constant of the fuel element. The fuel itself, has the shortest time response and is most sensitive to source transients. After a few seconds, the fuel pins have adjusted to the new power level and temperatures temporarily settle in a quasi-stationary level (not visible in the figure). For an extended period (~30 seconds in SSC), mainly determined by the primary loop circulation time and the coolant heat capacity, the coolant inlet temperature remains at its initial value. The steam generators are assumed to remove heat at a rate of nominal power, resulting in a mismatch in the heat production and heat removal as the accident proceeds. The net effect is increasing inlet temperature, which causes the reactor core, coolant, and other components to overheat, inevitably leading to core damage unless the reactor is shut down.
27

1100
1300
1500
1700
1900
2100
0 100 200 300 400 500 600 700 800 900 1000Time [s]
Peak
fuel
tempe
rature
[K]
AmN stability limit (conservative)
Source transient (S=S0*1.8)Unprotected loss-of-
heat-sink
Unprotected loss-of-flow
Figure 3.4: Peak fuel temperatures in Unprotected TOP, LOF, and LOHS. The stability limit (1573 K) of americium nitride is shown.
800
1000
1200
1400
1600
0 100 200 300 400 500 600 700 800 900 1000Time [s]
Peak
clad
ding t
empe
rature
[K]
Cladding burst temperature
Source transient (S=S0*1.8)
Unprotected loss-of-flow
Unprotected loss-of-heat-sink
Figure 3.5: Peak cladding temperature in Unprotected TOP, LOF, and LOHS. The cladding burst temperature (1333 K) is based on 20% CW 316 stainless steel.
In the loss-of-flow (ULOF) accident, core heat-up occurs at a rate determined by the flow coast-down. Inertial forces help to push coolant through the primary system for an extended period. Peak temperatures occur as the pump impeller comes to a complete rest. Core temperatures and buoyancy forces eventually balance. In the asymptotic state, flow is sustained by natural convection alone. Reactivity feedbacks have negligible effect on transient response. For this particular system, an unprotected loss-of-flow accident should result in little or no damage. The integrity of the fuel and the cladding is not compromised. The protective oxide film layer on the cladding may suffer some damage that potentially could harm the cladding in the long run.
28

The loss-of-heat-sink (ULOHS) accident tends to be a more slowly evolving accident than the source transient and the loss-of-flow accident. The accident manifests as rising inlet temperature, which accompanies loss of primary heat sink. Response time is determined by the primary loop circulation time and coolant heat capacity. The prolonged grace period in a ULOHS accident facilitates successful performance of the safety system. Core damage is inevitable unless safety measures are taken to shut down the reactor.
In Fig. 3.6, the thermal response of the coolant in the hot pool (located right above the core, see Fig. 3.1) is displayed. The coolant temperature is an important safety system parameter since it is related to the heat production in the core. It can be used to sense power excursions and reduction in coolant flow rate. The coolant temperature may be used as an actuator for passive safety action.
600
800
1000
1200
1400
0 100 200 300 400 500 600 700 800 900 1000Time [s]
Hot p
ool c
oolan
t tem
perat
ure [K
]
Unprotected loss-of-flow
Unprotected loss-of-heat-sink
Source transient (S=S0*1.8)
Figure 3.6: Coolant temperature in the hot pool.
The thermal response of the coolant in the hot pool following a change in power or flow is delayed by the heat capacity of the coolant and transport lags. Therefore, it must be ascertained whether the time response of the coolant is sufficient to serve as an accident indicator and protect against the fastest transients conceivable in an ADS. Rapid coolant response is advantageous since it promotes prompt action of the safety system. In general, UTOP caused by insertion of maximum beam power, is likely to exert the fastest transient. The absence of any moveable control rods, that may rather quickly add or remove large amounts of reactivity, diminishes the potential for fast transients caused by reactivity insertion. Significant reactivity is potentially available in core compaction or voiding phenomenon, but such sequences stretch over a longer period. It is noticeable in Fig. 3.6, that during the initial ∼200 seconds the temperature increases at the same rate in all transients. However, source transients introduce the shortest grace period (with respect to fuel damage), see Fig. 3.4, while the temperature rise in the coolant is modest. In that sense, source transients impose the highest demands on a passive device that relies on the thermal response of the coolant.
29

3.6 AN APPROACH TO INHERENT SHUTDOWN Compared to reactivity changes, variations in source strength or source importance have a strong influence on the ADS. The reactor power is linearly proportional to the source strength, 10% reduction in source strength yields 10% reduction of power, and so on. Shutdown of the external source effectively halts the fission process in the entire core.
The shutdown system must be capable of halting the external source before excessive temperatures are obtained. This may be accomplished by reducing the time required for the shutdown system to act and by limiting the speed of the temperature rise by design considerations. As mentioned previously, the fastest credible transient in an ADS is a source insertion transient. Worst conditions occur when maximum beam power is inserted in a step fashion at begin-of-life. Source transients result in a rapid, but bounded power excursion. Consequently, it is unsafe to rely on a safety system to assure protection in the early phase of a source transient. Instead, protection must be accomplished through safety-by-design principles, e.g. minimizing the beam output capability by utilizing an appropriate burnup control strategy. While the speed of the beam controller may be limited by fundamental means, the capacity of the accelerator (maximum beam power) is dictated by reactivity losses governed by fuel burnup. Various options exist, for example, shorter irradiation-cycle time and multi-batch fuel loading strategy [20], lower power density and higher transuranic inventory [21], optimal distribution of plutonium and minor actinides [22], use of burnable absorbers [1]. Safety-by-design relaxes the requirements on the shutdown system.
In UTOP and ULOHS accidents, the grace period may be prolonged by the primary loop circulation time and the coolant heat capacity. We studied the benefits from increasing the coolant inventory. Results are summarized in Table 3.2. In effect, 10% more coolant resulted in ~10% longer grace period, and so on. Typical accidents where the coolant inventory has an appreciable effect on the response involve situations when there is a net change in internal energy (primary system). Loss-of-flow accidents do not necessarily involve any accumulation of internal energy in the primary system, as the heat-removal rate in the steam-generators may be unaffected. For loss-of-flow transients, the initial response is determined by the flow coast-down. It may be influenced by changing the moment of inertia of the pump and by increasing natural convection.
Table 3-2. Lengthening of the grace period corresponding to a certain increase in coolant inventory. The slash separates fuelfailure from cladding failure.
Coolant inventory Grace period, TOP Grace period, LOHS
+10% +12% / +11% +12% / +12%
+50% +56% / +57% +57% / +58%
Taking these circumstances in consideration, our approach is to prolong grace periods, increase safety margins, and utilize safety-by-design principles, all easing the demands on the safety system. Prolonged grace periods do not only improve our chances for successful safety performance but reduces the probability for false actuation and
30

interference of the passive system during normal operation. The second objective, in order to achieve high reliability, is to design simple, redundant and diverse shutdown systems, and to use components of proven high reliability. Greater complexity generally means reduced reliability.
3.7 PRELIMINARY CONCEPTS FOR INHERENT SHUTDOWN
In this section, we suggest some concepts for inherent beam shutdown. The intention is to demonstrate the basic working principle. Appropriate references are included for concepts suggested by separate authors.
3.7.1 Flooding of the beam tube
Shutdown of the external source may be accomplished by flooding the beamtube with coolant. The main purpose for filling the beam tube is to shift the axial position of beam impact, which in principle reduces the importance of source neutrons [2]. Actuation may be based on thermal expansion of coolant or use of bursting disk devices [23]. Several authors have proposed designs that utilize such principles.
C. Rubbia, et al. [24], proposed a technique for the “energy amplifier” in which coolant rising above a prescribed level activates an overflow path and floods the cavity in the beam tube. To fill the beam tube, we suggest installing a drainpipe in the shape of a U tube, shown in Fig. 3.7.
Cover gas ~1 atm
BeampipeDrainpipe
Liquid LBE
Figure 3.7: Basic scheme for filling the beamtube with coolant through a U tube. Concept relies on a working moving fluid (IAEA Class B device [25]).
One side of the U tube is open to the cover gas region while the other side is connected to the beamtube. A portion of the coolant is retained in the U bend, forming a liquid seal that separates the beamtube from the cover gas region. A liquid column is supported by the pressure difference. A pressure difference of 1 atm is equivalent to a column height of LBE of 1 m (11 m for sodium). The inlet is located at a certain height above the surface. As the coolant expands, it would rise to the inlet, flood the drainpipe, and subsequently spill into the beamtube. The intake to the drainpipe must be elevated high
31

enough to reduce the risk for false actuation. Difficulties may exist if the surface is seriously disturbed by turbulence and vapor bubbles.
In our reference design, the coolant level rises at a rate of 10 cm/100 K. In Fig. 3.8, the coolant surface elevation is calculated for unprotected TOP, LOF, and LOHS accidents. Zero level is the surface elevation at steady-state. The points at which the fuel and the cladding exceed their safety margins are also indicated. For the source transient (UTOP), the surface rises approximately 10 cm before fuel failure, corresponding to the smallest level change yet leading to core damage. In a loss-of-flow accident, there is a gradual loss of pressure head and the coolant level may actually drop during pump coast-down. The rate at which the coolant rises can be affected by the geometry of the vessel.
-10
0
10
20
30
40
50
0 100 200 300 400 500 600 700 800 900 1000Time [s]
Surfa
ce el
evati
on [c
m] = Fuel failure= Cladding failure
Unprotected loss-of-heat-sink
Source transient (S=S0*1.8)
Unprotected loss-of-flow
Figure 3.8: Rise of coolant level in hot pool in unprotected accidents.
The conceptual design only relies on the integrity of the components and a moving working fluid. It does not require signals, external power, or moving mechanical parts. In that case, it is classified as a passive device in category B, in compliance with IAEA’s categorization of passive systems [25].
Beam chambers typically require high vacuums and chemically clean surfaces to prevent proton interaction with trapped gas. Filling the beam tube with coolant may cause serious contamination of the accelerator tunnel. One option is to install a second beam window at the top of the tube to separate the beam tube from the accelerator tunnel. If the passive system provokes a shutdown, it may require replacing the beam tube, however, it is likely the plant needs correction anyhow, to assure its integrity and to reinstate the original safety function. In that perspective, filling of the beam tube could possibly serve as a last resort. False actuation, however, must be eliminated.
3.7.2 Alternative Methods
In most pre-conceptual ADS designs, the beam is subject to some bending action before entering the vessel. Bending of a charged particle beam is normally carried out by magnets. In principle, a bending magnet could serve as an on/off switch for the external source. If the magnet is de-energized, the beam would safely end-up in a beam stop, otherwise the beam is diverted to the target.
32

For such a device switching is necessary, e.g. an electrical circuit must open/close, which limits the safety level achievable by this principle (IAEA Class D device). Preferably, the passive switch is of a fail-safe type, i.e. unless connection is established the magnet is off. Possible agencies for actuating such a switch include:
a. A ferromagnetic Curie-point-operated device. Above the Curie temperature, the magnetization of a permanent magnet vanishes. Such a device could either be used for switching or in lock-release function acting on safety rods. Similar devices showed considerable promise for application in self-actuated shutdown systems in liquid-metal fast breeder reactors [25]. The Curie temperature of carbon steel is 1043 K.
b. Pressure build-up in the cover gas region (or some other compartment), due to thermal expansion of the medium could actuate a switch that operates at a predetermined pressure. A weighted lever or a spring could set the limiting pressure. Alternatively, thermal expansion of a fixed mass of a fluid (LBE) in a confined space could perform a similar task.
c. Liquid metal coolants feature temperature-dependent resistivity. Increasing the temperature lead to higher resistivity. Resistivity rising above a limiting value could trigger an electrical or magnetic switch.
3.8 CONCLUSIONS The applicability for passive safety to accelerator-driven systems was studied. The current study focused on means for inherent shutdown. The usefulness for reactivity feedbacks was evaluated and some schemes for inherent source shutdown were suggested.
It seems that inherent shutdown based solely on reactivity feedbacks is fruitless in accelerator-driven systems. Inherent shutdown must be reinforced by other means. It was shown that increasing the Doppler effect, by introducing massive amounts of fertile material, have limited effect on transients that remain in the subcritical state. Doppler feedback may be important for accidents exceeding criticality. The significance of reactivity feedbacks, in general, depends on the specific design and in particular on the choice of the subcritical level. Taking advantage of reactivity feedbacks calls for a careful balance between the desired feedback performance and the subcritical margin.
Safety analysis indicate that transient overpower accidents, caused by insertion of the maximum beam power, is likely to exert the fastest transients conceivable in an ADS. In that perspective, source transients have profound impact on the requirements for a shutdown device. Safety-by-design principles must be utilized to assure protection against source transients.
Some concepts to accomplish passive source shutdown were presented. One method is to block the beam by filling the beamtube with coolant. Actuation may be caused by thermal expansion of coolant. Other options include shutdown of beam bending magnets or insertion of shutdown rods by passive means, e.g. ferromagnetic Curie-point-operated device.
Shutdown of the beam by passive means can provide an important additional safety feature for accelerator-driven systems. Such systems may contribute significantly to the reliability of the safety system.
33

4 FUEL FOR ADS: 15N ENRICHMENT REQUIREMENT FOR 2ND STRATUM ADS NITRIDE FUELS
4.1 INTRODUCTION The application of nitride fuels in accelerator driven systems requires use of N-15 enriched nitrogen to suppress C-14 production arising due to (n,p) reactions on N-14. As part of the CONFIRM project [32], see Appendix III, an assessment of enrichment level required within the Double Strata fuel cycle has been made. The task was performed in collaboration with CEA/Cadarache.
4.2 CARBON-14 14C is one of the main contributors to the exposure of radio-toxicity in the vicinity of reprocessing plants, as carbon is typically released in the off-stream gas. 14C is mainly produced in (n,p) reactions on 14N, that is present as an impurity in oxide fuel as well as in cladding and structural material. According to a study made by BNFL, 4.7% of the dose to the group of individuals most prone to inhalation exposure from THORP in Sellafield is due to 14C [27]. If one is to introduce nitride fuels for the purpose ow waste transmutation, clearly the releases of 14C should not be increased significantly. Use of nitrogen enriched in 15N in the fabrication of transmutation fuels is one way of limiting such releases.
4.3 THE DOUBLE STRATA SCENARIO For the present analysis, the Double Strata scenario [29][30] was adopted. In the particular implementation [33], plutonium from spent UOX LWR fuel is recycled once in LWRs and then multi-recycled in fast neutron reactors of CAPRA type. All minor actinides are directed to accelerator driven systems, where they are multirecycled together with the low quality Pu present in ADS discharges. A nuclear park producing 1000 TWhe was assumed. 6.0 percent of the park power is produced by accelerator driven systems, 19.5 percent by the CAPRA reactors, and 74.5 percent by light water reactors operating on UOX and MOX fuel [33]. The minor actinide flow rate into the 2nd stratum is 6.6 kg/TWhe, or 6.6 tons per year for the park considered. The ADS is assumed to operate on uranium free nitride fuel. The corresponding mass flows are shown in Figure 4.1.
4.4 MODELING A fully three-dimensional (pin by pin) model of a sub-critical core similar to the one proposed by JAERI was made [31]. The Monte Carlo codes MCNPX was used for simulation of proton and neutron transport in the core [4]. The characteristics of the core setup are displayed in Table 4-1.
34

Table 4-1: Characteristics of the ADS used in the analysis
Core Power 820 MWth Linear rating (average) 30 kW/m Spallation target PbBi – 19 cm radius Sub-criticality at BOL 0.95 Coolant Sodium Fuel (Pu0.2,MA0.3,Zr0.5)15N Clad outer/inner diameter 5.9/5.0 mm Pin Pitch 1.45 PD Burnup 20% h.a. / 600 EPFD
Burnup was calculated using MCB. The 15N enrichment level of the 300 kg nitrogen present in the core was set to be 99%. Hence uncertainties in 14C production rates due to self-shielding effects at high enrichment levels could be avoided. The core averaged cross section for the 14N(n,p) reaction equaled 15 mb. The resulting production rate of 14C in the fuel was 6.7 grams per 300 equivalent full power days. Adopting an availability factor of 0.8, 6.7 grams 14C equals the annual production of the core.
4.5 NITRIDES VERSUS OXIDES With 6.6 tons of Minor Actinides to be managed by accelerator driven systems (see Fig. 4.1), 28 of the above ADS cores would be present in the 1000 TWhe park. LWR plutonium is assumed to be needed only for startup. The annual 14C production due to the use of nitride fuel with 99% 15N enrichment then becomes 185 grams.
The release of 14C from reprocessing of oxide fuels being about 3 g/(GWyear) [28], the contribution of the 1st stratum light water reactors amounts to 300 grams annually. The Pu managing CAPRA reactors provide another 70 grams, yielding a total 14C release from oxide fuels equal to 370 grams.
Introduction of nitride fuels for MA transmutation in ADS thus increases releases of 14C into the atmosphere by about 50%, for an 15N enrichment level of 99%. As 14C from oxide reprocessing provides less than five percent of the total inhalated dose to high risk individuals, one may conclude that this enrichment level is sufficient to avoid a significant increase in dose committments.
4.6 NITRIDE FABRICATION Pending calculations of cladding damage, we set the fuel residence time to two years, yielding a final average burnup of 20 percent heavy atoms. Consequently, 33.2 ton of heavy metal needs to be fabricated into ADS fuel each year, demanding 4.2 tons of nitrogen. In existing fabrication lines, an open gas cycle is used for converting oxides or metals into nitrides, and typically about 99% of the nitrogen supplied is lost. A closed gas cycle would therefore have to be implemented.
35

Figure 4.1 Mass flows and 14C production in the 1000 TWhe nuclear park analysed in the analysis. LWRs and Fast Neutron CAPRA reactors use oxide fuels. The ADS is assumed to operate on nitride fuel, where the nitrogen is enriched in 15N.
4.7 15N ENRICHMENT 15N is today used as a tracer in agronomic and organic industry. The world wide market is about 20 to 40 kilograms annually, and the current cost is about 80 euro/g. The supply of several tons per year to the 60 TWhe ADS park, would therefore demand an increase in production capacity by a factor of 100. Accordingly, the specific production cost can be expected to decrease. Estimations made at CEA point towards a price of approximately 10 euros per gram, depending on the selected method of fabrication. The resulting cost penalty for the use of 15N in ADS fuel fabrication is found to be less than 10%, based on a cost estimation of 2000 euro per kg TRU fuel recently made by NEA [33](see also Appendix IV).
36

5 MATERIALS FOR ADS: MOLECULAR DYNAMICS STUDY OF RADIATION DAMAGE IN FE-CR ALLOYS
5.1 BACKGROUND The decisive factor limiting the fuel burnup in fast neutron reactors is swelling of the cladding material. The discovery of this phenomenon was made in 1969 in the Dounray Fast Reactor. Since then a large experimental effort has been devoted to finding steel compositions more resistant to radiation. Consequently, the incubation threshold for onset of accelerated swelling has been increased from the 20 DPA limit of SS316, up to 100 DPA for austenitic steels like 15-15Ti, and up to 200 DPA for certain ferritic steels, with the 9Cr-1Mo composition (EM10) providing the best performance seen up to date.
Theoretical understanding of the mechanisms responsible for swelling of neutron irradiated steels has however remained on a qualitative level. The Production Bias Model (PBM) originally suggested by Woo and Singh has been able to reproduce swelling rates fcc-copper irradiated up to 1 DPA [43]. In this model it is assumed that aggregation of interstitial clusters during the recoil cascade, and their subsequent one-dimensional migration to grain boundaries is the main driver for swelling. The well known difference in swelling rates between FCC- and BCC-crystals, has so far not been possible to explain within the PBM framework. A number of molecular dynamics simulations of interstitial cluster formation has been performed for pure BCC-iron [36] indicating differences in cluster size and formation rate with respect to FCC-copper but not being able to explain experimental findings. The conclusion is strongly dependent on the validity of the effective interaction potential adopted in the simulations. A potential of Finnis-Sinclair type, further developed at Liverpool University [36], was used in all of the above listed references. This potential should be able to correctly describe the initial phase of the recoil cascade, but the long range behavior is more uncertain, especially when comparing to the EAM potential for BCC-Fe developed by Simonelli and Farkas [40]. It thus appears important to improve the quality of the existing potentials.
There is still an uncertainty in the behavior of pure iron subject to high energy recoil cascades, e.g. the measured swelling rate varies from 0.03% per DPA up to 0.5% per DPA at the same temperature. A more consistent experimental picture has emerged for FeCr alloys. Irradiation of FeCr alloys with varying fractions of Cr have been made in EBR-II, FFTF, DFR and BR-10 [38]. At doses below 15 DPA (where impact of He generation would be possible to neglect), the data exhibit maximum swelling rates for Cr concentrations ranging from 9 to 12 percent. The DFR and BR-10 irradiation further show that adding 2-6 percent of Cr leads to a pronounced decrease in swelling as compared to pure Fe.
Therefore, the implementation of a Fe-Cr potential in the MD simulations may give us important information on basic mechanisms responsible for swelling, that would be difficult to elucidate in pure Fe. In what follows, we will describe the work made at KTH on the development of an EAM potential for Fe-Cr, and its impact on the formation probability of interstitial clusters in high energy recoil cascades. Special attention is devoted to the fact that the bulk modulus of Fe-Cr exhibits a sharp minimum
37

at 6-7% of Cr concentration, coinciding with the minimum in swelling seen in the low dose irradiation experiments.
5.2 GENERAL CONCEPT AND STRUCTURE OF THE FE-CR POTENTIAL
The Embedded Atom Method (EAM) has its roots in the density functional theory where the energy of the system of atoms is given by the functional of its electronic density. The atom energy is expressed as a sum of a pairwise (electrostatic) interaction, ➥ (r), depending on the scalar distance between the atoms and a many body term, , representing the quantum mechanical energy to embed the atom into a homogeneous electron gas of a certain local density. The complete EAM energy expression in the case of the Fe-Cr binary alloy requires definitions for the Fe and Cr pair potentials, the mixed Fe-Cr pair potential, and for the embedding functions for Fe and Cr [42].
)(↑F
At large distances, i.e. around and after the first neighbor distance the pair interaction for Fe and Cr as well as the mixed Fe-Cr pair interaction are described by the long range potentials developed by Simonelli and Farkas [40][37]. The free parameters of the Fe pair potential are calculated to fit experimental data such as the lattice constant, the unrelaxed vacancy formation energy and the elastic constants. The same approach is used for the Cr pair potential. However, due to the negative value of the Cauchi pressure the reproduction of the elastic constants for this material is very complicated. The Fe-Cr alloys of interest here are with relative low Cr content (up to 20%) and we have assumed that the exact fitting to the elastic constants of pure Cr is not significant. The parameters of the mixed pair potential are fitted to thermodynamic measurements of heat of mixing of Fe-Cr alloys and to predicted variation of the lattice parameter with the Cr concentration.
These pair potentials can not be directly used to simulate radiation induced cascades since they can not describe interactions inside the nearest neighbor distances. Therefore, we have modified the Simonelli potential by smoothly transforming it into the Born-Mayer potential, which reproduces sensible values for the displacement threshold energy [36], and to the screened Coulomb potential. The modification affects the shape of the potentials at short distances and does not change their properties at large distances listed above.
The embedding functions are calculated by fitting the cohesive energy to the Rose universal expression, which gives the state of expanded or compressed perfect crystal as a function of the interatomic separation. The bulk modulus is an important parameter in the equation. When performing simulations for Fe-Cr alloys with a low Cr content, it is reasonable to fit the Cr embedding function to the alloy bulk modulus for the actual Cr content instead to a pure Cr. According to the experimental results, the bulk modulus value is a non monotonic function of the Cr concentration in the FeCr alloy, having a well pronounced minimum around 6-7% Cr (Fig. 5.1). The location of this minimum coincides with the region of Cr content where
Figure 5.1: Bulk modulus [kbar] vs Cr concentration [%]
38

the Fe-Cr alloys show minimum swelling. Therefore it is important to investigate how sensitive is the embedding function, and consequently the defect properties, to the bulk modulus value. The cascade simulations in the FeCr alloy reported in the ext section correspond to 7% Cr content in the alloy.
5.3 IMPLEMENTATION OF THE FE-CR POTENTIAL TO MOLECULAR DYNAMICS SIMULATIONS.
It has been found that the integral characteristics of the radiation damage such as the total number of the defects and displacements support the power law empirical formula [34] and the previous published results based on the modified N-body potential of Finnis and Sinclair. The presence of Cr atoms has little effect on the integral cascade properties. The potential favor <111> structures which is in agreement with earlier investigations relating the <111> defect orientations to the long range of the potential.
In contrast to the conclusion above, substantial differences have been observed in the defect configuration, clustering and mobility. For pure iron, the new potential predicts a formation of more extended defects (e.g. crowdions or larger structures), enhanced clustering and 1D collective motion of large sets of parallel crowdions. In general, the mobility is high with no direct relation to the size of the parallel structures. The individual crowdions jump almost independently but keep the compact arrangement. The vacancies remain immobile during the period of investigation. The 1D motion involves dumbbell-crowdion transformation. Crowdions close to <111> orientation may rotate and join a parallel set of <111> crowdions when passing close to it.
Figure 5.2: Snapshot of the defect structure in Fe-7Cr alloy at 0.4 ps after the generation of 5 keV Fe recoil in the central region of the box.
No such clustering and aggregation of defects have been observed in the Fe-7Cr alloy.
39

An intriguing tendency of increasing of the Cr content in the defect structures with the time has been recorded. Typical cascade development for 5 keV recoil is illustrated in Fig. 5.2. Only displaced atoms are shown. The blue, read and yellow balls denote a vacancy, Fe or Cr interstitial atom, respectively. The damage region is expanding and rows of displaced atoms are created along the close packed directions. About 7% of the displaced atoms are Cr atoms reflecting the original Cr content in the alloy. With the time most of the atoms return to their original sites. The recombination of Fe atoms is stronger which increases the fraction of the Cr atoms in the SIAs clusters of the alloy (Fig. 5.3).
Figure 5.3: Time evolution of the the Cr content in the displacements for Fe-7Cr
5.4 CONCLUSIONS Further improvement of the potential parameters and their fitting to alloy properties is necessary. Heat of mixing as a function of the Cr content obtained from ab initio methods is one of the important parameters. The MD simulations will focus on calculations of migration barriers, cluster binding energies and other data needed to describe defect evolution and to approach methods like PBM or KMC. A special attention should be devoted to simulations of cascade development in a non perfect lattice, e.g. including dislocations.
40

6 ADS SAFETY: EMERGENCY HEAT REMOVAL AND ACCELERATOR BEAM STOP DEVICES
Studies of the emergency heat removal and other aspects of ADS safety is a joint project in the frame of the collaboration with the Joint Research Centres (JRC), first JRC in Ispra and then with the JRC in Petten.
6.1 INTRODUCTION Emergency decay heat removal studies by natural air convection and thermal radiation from the guard vessel surface has proceeded, for example has the importance of chimneys been investigated for an Reactor Vessel Auxiliary Cooling System (RVACS) [44]. All calculations were based on Ansaldo’s design of an Accelerator Driven System [45]. Most studies involved simultaneous Loss-Of-Heat-Sink (LOHS) and Loss-Of-Flow (LOF) accidents. Moreover, some investigations have been performed on a 250MWt reactor with the same vessel geometry as for the 80MWt design.
To ensure low temperatures of the structural materials during accident scenarios, it is important to interrupt the accelerator proton beam in order to reduce the heat generation. A beam-stop device of the type, which fills the beam pipe reduces the maximum temperature increase significantly. The period of time before rupture is about 5-10 minutes depending on the thermal capacity of the whole system.
Currently another type of beam-stop device is designed, which will not fill the beam pipe with Pb/Bi. This device will passively respond to steep temperature transients of about 20C/sec within less than 10 seconds.
The Computational Fluid Dynamics (CFD) code STAR-CD is used in all calculations [46].
6.2 RESULTS
6.2.1 Emergency Decay Heat Removal
In accidents where the normal heat removal systems are not functional an efficient decay heat removal is important in order to reduce the period of time the vessel is exposed to elevated temperatures. The ultimate resort to remove the decay heat of most metal-cooled designs is the Reactor Vessel Auxiliary Cooling System (RVACS), see Fig 6.1 [47]. These systems are driven by natural air convection alone and are consequently totally passive. They also function during normal operation and consequently add a small parasitic thermal loss.
41

Figure 6.1: Reactor Vessel Auxiliary Cooling Systems on a Power Reactor Innovative Small Module design.
Emissivity
To increase the emissivity on the surfaces of reactor vessel and the guard vessel was examined on an 80MWt design. An increase from 0.7 to 0.9 reduced the maximum temperature peak of the hottest section of the reactor vessel wall by 29K. Naturally, this is because the radiation heat transfer rate is increased between the vessels. This tendency will be more important at higher vessel temperatures since the thermal radiation heat transfer is proportional to (reactor vessel wall temperature)4 – (guard vessel wall temperature)4. The temperature evolution at the hottest section of the reactor vessel wall can be seen in Fig 6.2.
Tim e, hours
0 10 20 30 40
Tem
pera
ture
, K
620
640
660
680
700
720
740
760
Em m issivity 0.7Em m issivity 0.9
Figure 6.2: The temperature evolution above the heat exchanger in the reactor vessel after a simultaneous LOHS and LOF accident.
Chimneys
To increase the length on which the static pressure difference between the cold downcomer and the warmer riser of the RVACS one can build chimneys. It was
42

investigated how straight chimneys and chimneys with bends influence the decay heat removal. The calculations showed that straight chimneys have the best performance, which is due to that the pressure losses are less than for the case with chimneys with bends. The temperature evolution and geometrical mesh set-up can be seen in Fig 6.3 and 6.4.
Time, hours
0 10 20 30 40 50
Tem
pera
ture
, K
620
640
660
680
700
720
740
760
No chimneysStraight ChimneyChimneys with step bend
Figure 6.3: The temperature evolution above the heat exchanger in the reactor vessel when using straight chimneys and chimneys with bends.
Figure 6.4: Set-up of the mesh for the case with chimneys with bends.
6.2.2 Accelerator Beam Stop Devices
Earlier version
One beam-stop device has been designed based on the idea that a disc on the proton beam pipe would break as a certain coolant temperature was exceeded, see Fig 6.5. This would result in a flooding of the beam pipe and a relocation of the impact point of the
43

proton beam from the core region to the upper section of the reactor vessel. Thus, the heat generation in the core is reduced to decay heat level.
For the 80MWt design it was shown that a melt-rupture disk significantly increases the grace time until the accelerator beam stop is really necessary, see Fig 6.6.
Figure 6.5: Design of the melt-rupture disc [47].
Figure 6.6: Comparison of the temperature evolution in the reactor vessel wall for immediate beam-stop, 30min delayed beam-stop, and no beam-stop but using a melt-rupture disc.
New beam-stop device
The new beam-stop design is now under patenting process.
The new beam-stop device switches off the proton beam, instead of filling the proton beam pipe with Pb/Bi. Thus, the vacuum pipe does not have to be replaced in case the beam-stop is activated, as was necessary for the older version of the beam-stop, see above.
Another advantage is that it will respond faster to steep temperature gradients. The new beam-stop will respond within about 7 seconds if the temperature increase is 20 K/sec. Such temperature gradients could develop for example in the Sing-Sing core in a LOF accident.
44

7 ADS RELATED EXPERIMENTS
7.1 MUSE
7.1.1 Introduction
A large number of numerical simulations have been performed to investigate neutron source effects in a sub-critical media. The core has been successively coupled to a (d,d)-source, a (d,t)-source and a spallation source. The investigations have focused on the neutron energy spectra in the fuel, the source efficiency ϕ* and on the high-energy spallation neutron effects. The calculations have been performed for some different models representative of the MUSE-4 experiments [49][50][51] and for different sub-critical levels. The Monte Carlo codes MCNP [52] and MCNPX [4] and the deterministic code system ERANOS [53] have been used to perform the calculations.
7.1.2 The Muse-4 Model
A homogeneous model representing one of the sub-critical configurations (SC3) planned in the MUSE-4 experiments (keff = 0.95) has been studied. The geometry of the model is shown in Fig. 7.1. The fuel is MOX fuel with 72% 238U, 21% 239Pu and 5% 240Pu plus small amounts of some other actinides. The fuel is homogeneously distributed together with the Na-coolant [54]. The axial (z-direction) dimension of the fuel is 60.96 cm, except in a 21.2 cm wide channel above and below the lead buffer and the accelerator tube (in the y direction), where it was extended by 10.16 cm. The sodium-steel reflector ends at z = ±61.76 cm. There is also a 10.16 thick axial shield (not shown in the figure) above and below the Na/SS reflector. The overall dimensions of the whole model, including the reflector and the shields, are 159 cm x 169.6 cm x 143.84 cm.
Figure 7.1: x-y cross-sectional view of the mconfiguration. The cross shows the position whecalculated, see Section 7.1.3.
45
z
y
x
Region 0: Accelerator TubeRegion 1: Fuel Region 2: Na/SS Reflector Region 3: Axial Shield Region 4: Radial Shield Region 5: Lead Buffer
odel of the MUSE-4 sub-critical re the neutron spectra have been

7.1.3 Neutron Spectra
Neutron Leakage Spectra from the Lead Buffer only The energy spectra of the neutrons exiting the lead region are plotted in Fig. 7.2.
Figure 7.2: Neutron leakage spectrum at the outer surface of the lead buffer zone for a (d,d)-source, a (d,t)-source and a spallation source – The surrounding fuel and shielding are removed!
The following remarks can be made about the neutron fluxes:
• The (d,d)-spectrum has a large peak between 2 and 3 MeV, which is the energy range where the neutrons are born in the (d,d)-fusion reaction. Hence, only a small fraction of the source neutrons has been slowed down by the lead.
• For the (d,t)-source, a large part of the source neutrons has been slowed down by scattering and (n,2n)-reactions in the lead and the spectrum has a maximum at a little less than 2 MeV. However, 23.4 % of the neutrons exiting the lead buffer have not interacted with the lead and are still in the 14-MeV peak.
• For the spallation source, most of the source neutrons have been slowed down and the spectrum has a shape similar to the (d,t)-leakage spectrum, but with even more neutrons slowed down. 5.6 % of the neutrons still have energies higher than 20 MeV and 1.5 % higher than 100 MeV.
Neutron Spectra in the Core
The neutron energy spectra in the core resulting from the three different sources were calculated in the subassembly centred at 21.2 cm from the centre of the core, indicated with a cross in Fig. 7.1. The neutron spectra of the other sub-critical states (Sc1 and Sc2) are not shown here, since they are very similar to the spectra of Sc3.
It is seen in Fig. 7.3 that the three spectra at this position are very similar to each other and that they are largely dominated by the fission multiplication in the fuel. The two dips in the neutron fluxes caused by the resonances in sodium (∼ 3 keV) and oxygen (∼ 0.4 MeV) can be seen. The fraction of neutrons still having their initial (source) energy
46

is very small (but should not automatically be disregarded) – about 0.2 % of the (d,t)-neutrons are still in the 14 MeV peak and 0.1 % of the spallation neutrons have energies above 20 MeV. Hence, we conclude that, for the purpose of computing neutron spectrum weighted quantities, the presence of the external sources can be considered “forgotten” beyond a few centimetres into the fuel.
Figure 7.3: MUSE-4 neutron energy spectra in the subassembly centred at x=21.2 cm, y=-5.3 cm, resulting from the three different external sources.
Neutron Energy Spectrum in the Target from Spallation
The neutron yield per proton and the neutron spectrum in a spallation system are very sensitive to the shape of the target. In this section the energy spectrum of spallation neutrons as a function of the target radius and target height has been investigated.
a) Energy Spectrum versus Target Radius In these simulations the target consisted of a cylinder with a fixed height of 50 cm and a radius varying from 5 to 20 cm (Fig. 7.4). As it is seen in Fig. 7.4, and as expected (since the neutrons are surrounded by more scattering material), the peak of the spectrum moves towards lower energies with increasing radius of the lead target. With the radii of 5 cm and 10 cm, the peaks are at a little more than 2 MeV and a little less than 2 MeV respectively, while the neutron spectrum in the case of the 20 cm radius peaks at about 1 MeV.
47

R
Z = 50 cm
1 GeV protons
Lead
R = 5, 10, 20 cm
Figure 7.4: Neutron energy spectrum of spallation source neutrons versus lead target radius (z = 50 cm), computed with MCNPX.
b) Energy Distribution versus Target Height In this case the target consisted of a cylinder with a fixed radius of 20 cm and a height varying from 25 to 100 cm (Fig 7.5). It is seen in the figure that the distribution of the neutron yield is relatively insensitive to the height of the target when it is increased beyond 50 cm, i.e. saturation is reached.
R = 20 cm
Z
1 GeV protons
Lead
Z = 25, 50, 75, 100 cm
Figure 7.5: Neutron energy spectrum of spallation source neutrons versus lead target height (r = 20 cm), computed with MCNPX.
48

7.1.4 Description of the Spallation Source and the Primary Spallation Neutrons
The MCNPX simulations calculating the efficiency of the spallation source neutrons were divided into two steps. In the first simulation, a large number of protons (1000 MeV) were accelerated towards the lead target (Fig. 7.6). The protons were uniformly distributed across the beam of radius 2 cm. The angular, energy and spatial distributions of all neutrons that were created directly from the spallation interactions (primary spallation neutrons) were recorded. After that the neutron trajectories were immediately terminated. This procedure produces the spectrum of primary spallation neutrons, i.e. no secondary neutrons are included.
Figure 7.6: 1000 MeV protons accelerated towards the lead target creating neutrons via spallation interactions. The generated primary neutrons are “frozen” at the moment when they are created, and emitted as fixed source neutrons in a separate simulation.
In the second step, these primary spallation neutrons were supplied to the MCNPX code as fixed source neutrons for separate simulations and the source efficiency was determined.
The spatial distribution where the primary neutrons were created was found to be rather limited. Axially, most of the neutrons were emitted in the upper part of the lead target (77% within the first 20 cm, see Fig. 7.7 A). The radial distribution was found to be very peaked around the axis of the incident proton beam, about 98% of the neutrons were created within a 3 cm radius (Fig. 7.7 B).
49

Figure 7.7: A) Axial distribution of the primary spallation neutrons. B) Radial distribution of the primary spallation neutrons.
The energy distribution of the primary neutrons produced by the 1000 MeV protons is shown in Fig. 7.8. We note that 16.8% of the neutrons have energies higher than 20 MeV and 3.3% of them higher than 150 MeV, and that the neutrons with very high energy are mainly emitted in the forward direction of the proton beam, as expected.
Figure 7.8: Energy spectrum of the primary spallation neutrons created by the 1000 MeV protons.
There were about 14.5 primary spallation neutrons produced per 1000 MeV proton. This value should be compared to the total number of neutrons produced in the lead target, i.e. around 21 neutrons per proton. Thus, almost a third of the neutrons that exit the lead target and enter into the fuel are secondary neutrons, most of them created in neutron spallation reactions and (n,xn)-reactions.
It should be noted that, when calculating ϕ* for a spallation system, the results are directly dependent on the definition of the neutron source. Other source definitions are possible [54], which will result in different meanings and values for ϕ*.
50

7.1.5 Source Efficiency
The relative efficiency (ϕ*) of the source neutrons was determined for the three different sources and for the three different sub-critical configurations of the MUSE-4 model.
Definition of ϕ*
The neutron flux distribution in a sub-critical core is the solution of the inhomogeneous balance equation:
Eq. (1) Sss += φφ FA
where F is the fission production operator, A is the net neutron loss operator and S is the external source. The quantity ϕ*, which represents the relative efficiency of external source neutrons, is defined as the ratio of the average importance of the external source neutrons to the average importance of the fission neutrons [48], i.e.:
Eq. (2)
><><
><><
=
s
sS
S
φφφ
φ
ϕ
FF*,
*,
*0
0
where
φ0* = The adjoint flux (the everywhere positive solution of
**1** 00 φφ FAeffk
= ) which provides a measure of neutron importance.
<Fφs> = Total production of neutrons by fission.
<S> = Total production of neutrons by the external source.
In the above formula, the brackets imply integration over space, angle and energy.
As some of the integrals in Eq. (2) cannot be directly calculated with MCNP and MCNPX, another procedure was sought to compute ϕ*. By using the balance equation Eq. (1), the properties of the adjoint flux φ0*, the A, F operators and their adjoints A*, F*, the source efficiency can be expressed equivalently as
Eq. (3) ><
><⋅
−=
Sks
eff
φϕ
F11*
Eq. (3) is a simple formula relating the total fission neutron production <Fφs> to the external source, ϕ* and reactivity (1 – 1/ keff). It shows that, for given values of keff and <S>, the larger ϕ* the larger the fission power produced in the system.
The quantities in the right hand side of Eq. (3) are standard outputs from MCNP and MCNPX. For simplicity, the production terms will be labelled only F and S in the sequel.
51

Calculations of ϕ* for the MUSE-4 Model
The multiplication factor keff and the total number of neutrons produced by fission (F) were calculated for the three different sources and the three different sub-critical configurations. F was automatically normalised per source neutron, so S was always equal to 1. The source efficiency was calculated according to Eq. (3). All results including error estimations are listed in Table 7-1.
Table 7-1: MCNP/MCNPX results for the MUSE-4 Sc1, Sc2 and Sc3 configurations. Source keff F ϕ*
(D,D)-Source 140.2 (± 1.6 %) 1.35 (± 0.024) (D,T)-Source
0.99045 (± 8 pcm)
223.2 (± 1.7 %) 2.15 (± 0.040) Sc1
Spallation Source 0.99040(± 8 pcm) 236.3 (± 2.0 %) 2.29 (± 0.050)
(D,D)-Source 44.2 (± 0.9 %) 1.36 (± 0.015) (D,T)-Source
0.97007 (± 14 pcm)
69.9 (± 1.0 %) 2.16 (± 0.024) Sc2
Spallation Source 0.96992 (± 15 pcm)
72.6 (± 1.2 %) 2.25 (± 0.030)
(D,D)-Source 25.4 (± 0.6 %) 1.34 (± 0.009) (D,T)-Source
0.94982
(± 14 pcm) 40.1 (± 0.5 %) 2.12 (± 0.013)
Sc3
Spallation Source 0.94993 (± 15 pcm)
41.9 (± 0.7 %) 2.21 (± 0.020)
The energy of the (d,d)-source neutrons (2-3 MeV, see Appendices V and VI) is only slightly larger than the average energy of a neutron produced by fission. The ϕ* value for the (d,d)-source is therefore expected to be equal or slightly larger than 1, which is indeed the case.
In the case of the (d,t)-source, the reason for the higher values of ϕ* is the larger fission rate, part of which coming from fissions induced by the neutrons multiplied by (n,2n)-reactions in the lead buffer. It is seen in Fig. 7.9 that the number of fission neutrons per source neutron is large, approximately 58 % larger than for the (d,d)-source. It is also seen in Fig. 7.9 that the (n,2n)-cross section in lead has a threshold at about 7 MeV, which is the reason why this reaction is insensitive to the (d,d)-source neutrons. At 14 MeV the value of the lead (n,2n)-cross section is about 2 barns, which is comparable to the fission cross section in 239Pu and in 238U.
Concerning the spallation source neutrons, the values of ϕ* obtained in the simulations are somewhat higher than for the (d,t)-source. This is due to the fraction of neutrons having a very high energy. Most of the neutrons from the spallation process are born with an energy lower than the (n,2n)-cross section threshold in lead, but the neutrons with very high energy contribute significantly to ϕ*, as will be shown in Section 7.1.6
52

Figure 7.9: Neutron microscopic cross sections for Pu-239 fission, U-238 fission and (n,2n)-reactions in Pb-206, -207,-208. (ENDF/B6.4)
It is also seen in Table 7-1 that, for all three sources, ϕ* remains approximately constant or increases slightly as keff increases. This trend will be further discussed in the following section.
Dependence of ϕ* on Neutron Importance and keff
The dependence of the source efficiency on neutron importance φ0* was investigated for a wider range of sub-criticality (keff = 0.70 to 0.996), for a (d,d)- and a (d,t)-source, using a spherical model consisting of a buffer core (lead or 238U with r =10 cm) and MUSE-4 type fuel. Only a limited class of importance variations was considered. The results are plotted in Fig. 7.10.
Figur 7.10: ϕ* versus keff for spherical configurations with a buffer of lead or 238U (r=10 cm) and MUSE-4 type fuel, coupled to a (d,d)- and a (d,t)-source. The neutron importance and keff were changed by varying the fuel radius from about 48 cm (keff ≈ 0.70) to 68 cm (keff ≈ 0.996).
53

Instead of plotting the ratio ϕ* / (1/keff – 1) versus keff which would reflect the rapid increase of ><>< SsφF (and therefore of the fission power) as keff approaches unity, we focused instead on the behaviour of ϕ* versus keff. The neutron importance (and therefore keff) was varied by changing the outer radius of the fuel from approximately 48 to 68 cm. It is seen in Fig 7.10 that ϕ* shows the same almost constant or slightly increasing trend in the interval keff = 0.95 to 0.99, for the spherical configurations with the lead buffer, as already observed for the MUSE-4 model.
The first case (Case 1) is a sphere consisting of a lead core surrounded by fuel with approximately the same material composition as the MUSE-4 model. ϕ* increases slightly but constantly in the interval keff = 0.70 to 0.996. The importance of the (n,2n)-effect is also demonstrated by replacing the (d,t)-source by a (d,d)-source (Case 2), which results in significantly lower values of ϕ*. The curve shows the same increasing trend as for the (d,t)-source.
In Case 3, when the lead buffer at the centre of the sphere is replaced by 238U, a large increase in ϕ* occurs at all sub-criticality levels because of 238U fissions. The same increasing trend as with the lead buffer is not observed here as ϕ* remains nearly constant.
The statistical errors of the ϕ* values are rather small in the range 0.70 ≤ keff ≤ 0.99 – less than 1 % (±1 standard deviation), while around 2.5 % for the very last point (keff = 0.996). In the absolute vicinity of criticality (keff ≥ 0.996) the computation time for calculating ϕ* grows too large to obtain reliable results.
We conclude that the variations of ϕ* with neutron importance are rather small in the investigated range 0.70 ≤ keff ≤ 0.996.
7.1.6 Decomposition of the Spallation Source
Most reactor codes take into account only neutrons with energies lower than 20 MeV. However, a significant fraction of the neutrons produced by spallation have energies higher than 20 MeV (Fig. 7.8). The contribution of those high-energy neutrons to the source efficiency needs to be investigated. For this, the spallation source was artificially split into two “low-energy” bins (S1 from 0 to 5 MeV and S2 from 5 to 20 MeV) and two “high-energy” bins (S3 from 20 to 150 MeV and S4 from 150 to 1000 MeV).
In order to derive a formula for the low- and high-energy contributions to the source efficiency, we start from Eq. (3), applied to each source bin
Eq. (4) ><><
⋅
−=
i
i
effi Sk
φϕ
F11*
where
φi = flux resulting from each source bin alone (S1 → φ1, S2 → φ2 etc.).
Since , the following relationship for the decomposition of ϕ* is readily obtained:
∑ = ><>=< 41i iT φφ FF
54

Eq. (5) ∑= ><
><⋅=
4
1**
i T
iiT S
Sϕϕ
where
ϕ*T = Efficiency of the total source.
ϕ*i = Efficiency of each source bin alone.
Calculations Performed with MCNPX
The ϕ*i results obtained from the MCNPX simulations are listed in Table 7-2. As expected, for the first low-energy bin, ϕ*i is relatively low (ϕ*1 = 1.24). For the second bin, it is found to be higher (ϕ*2 = 1.63), since many neutrons have energies above the lead (n,2n)-cross section threshold. For the two high-energy parts, ϕ*i is very high (ϕ*3
= 4.80 and ϕ*4 = 13.9), which is the consequence of fissions induced by secondary neutrons born from (n,xn)-reactions and neutron spallation interactions. The statistical relative 1σ error estimates in the ϕ* values are about 1 %.
Table 7-2: MCNPX results for the decomposition of the spallation source, obtained for the MUSE-4 model (keff = 0.95013 ± 14 pcm).
Source Bin Energy intervals
(MeV) ><><
T
iSS
A ><><
i
iSφF
B
ϕ*i ><><
⋅T
ii S
S*ϕ
C
S1 0 - 5 0.592 23.5 1.24 0.736 (33 %) S2 5 - 20 0.240 31.1 1.63 0.390 (17 %) S3 20 - 150 0.135 91.3 4.79 0.647 (29 %) S4 150 - 1000 0.033 264.3 13.9 0.458 (21 %) Sum = 2.23 ST D 0 - 1000 1.0 42.2 2.21
The superscripts A, B, C and D in Table 7-2 stand for: A: Fraction of the total number of source neutrons in each energy bin (compare Fig. 7.8). B: Neutrons produced by fission in the core, per external source neutrons from bin i. C: Contribution to total ϕ* (Product of column 3 and column 5). D: Simulation with the total source.
It is also seen in Table 7-2 that the two high-energy parts (16.8% of the total number of source neutrons), contribute for about 50% of the total ϕ*, and the highest energy part alone (3.3% of the total number of source neutrons) for more than 20%. The sum of the contributions to ϕ* from the four different parts in the rightmost column, according to Eq. (5), is 2.23, which is in agreement with the value obtained from the simulation with the total source (ϕ*T = 2.21).
The rather high average number of fission neutrons produced per source neutron for the two high-energy bins (91 and 264, respectively) might seem surprising at first. The explanation for this is that most of the high-energy neutrons from the spallation source have already been multiplied in the lead (most of them via secondary neutron spallation
55

and (n,xn)-reactions) before they enter into the fuel. Each of them gives birth to a number of lower-energy neutrons, which then leak out of the lead and induce fission chain reactions in the fuel. Additional simulations in which the lead target alone was kept show that only about 5 % of the neutrons leaking out of the lead have energies higher than 20 MeV and about 1% of them higher than 150 MeV.
We conclude that, although neutron transport in the fuel is largely dominated by neutrons with low energies (En < 20 MeV) which can be well simulated with a number of classical calculation codes such as MCNP and ERANOS, high-energy neutrons contribute significantly to ϕ*. Further investigating these high-energy effects would be made easier by extending the neutron data libraries of existing codes from 20 MeV to at least 150 MeV.
Comparisons between MCNPX and ERANOS In practice, many hybrid system core studies rely on deterministic codes such as ERANOS, which do not model neutrons with energies above 20 MeV. It is therefore interesting to compare the predictions of such codes with MCNPX. While only small differences are expected in reactivity and power shape predictions (see Fig. 7.11), the results of the previous section suggest that a rather large impact is anticipated on ϕ*.
To verify this conjecture, a small benchmark was defined and calculated with both MCNPX and ERANOS. This benchmark is a simplified two-dimensional R-Z version of the MUSE-4 model described in 7.10. The distribution of the primary source neutrons was slightly simplified to make it possible to use exactly the same sources in both ERANOS and MCNPX.
Figure 7.11: Radial power profiles computed by MCNPX and ERANOS.
There are at least two ways of calculating ϕ* with ERANOS. The first possibility is to use Eq. (2). However, this requires an adjoint calculation. Another, simpler way is to use Eq. (3), which may also be written as:
56

Eq. (6) 11
11*
−
−=
s
eff
k
kϕ
where ><><= sssk φφ AF .
We chose this second alternative.
As can be seen in Table 7-3, ERANOS produces values of ϕ* in fairly good agreement with MCNPX for the two low-energy bins S1 and S2, in spite of differences between the nuclear datasets used by the two codes. The relative statistical 1σ error estimates in the ϕ* values for the MCNPX-calculations are less than 1%.
Table 7-3: MCNPX and ERANOS results for a simplified two-dimensional MUSE-like model (keff ≈ 0.95).
Source Bin Energy intervals (MeV) ><><
T
iSS
ϕ*i
MCNPX ERANOS S1 0 - 5 0.592 1.20 1.14 S2 5 - 20 0.240 1.56 1.49 S3 20 - 150 0.135 4.56 - S4 150 - 1000 0.033 14.6 -
ST 0 - 1000 1.0 2.17 1.42A
A When simulating the total source with ERANOS, all neutrons above 20 MeV (16.8%) were placed in the highest energy group (14.2 to 19.6 MeV).
However, since the ERANOS libraries are currently limited to neutrons below 20 MeV, the value of ϕ* for the total source is much lower (ϕ*ERANOS = 1.42) than the MCNPX value (ϕ*MCNPX = 2.17). A large fraction (∼ 35%) of the total value of ϕ* is actually not reflected in the ERANOS results. This is something one should bear in mind when calculating ϕ* for a spallation source with ERANOS or any other “low”-energy reactor code.
7.1.7 Conclusions
The neutron leakage spectra at the outer surface of the lead buffer alone, with the (d,d)-, the (d,t)- and the spallation sources coupled to it, have been determined. In the case of the (d,t)- and the spallation source, most of the source neutrons have been slowed down when they exit the lead buffer, and the peaks of the spectra are found at a little less than 2 MeV. However, a large fraction of the neutrons still have much higher energies, 32 % of the (d,t)-neutrons are unperturbed and are still in the 14 MeV peak, and 7.5 % of the spallation neutrons have an energy higher than 20 MeV. For the (d,d)-source, only a small fraction of the neutrons have been slowed down and most of them have about the same energy as when they were emitted (2 to 3 MeV).
The computed neutron spectra in all cases show that fission multiplication dominates at distances past a few centimetres into the fuel. This implies that, for the purpose of ADS
57

core studies, the presence of the source may be ignored in the calculation of spectrum-weighted quantities, except possibly in the immediate vicinity of the external source.
In the case of the spallation source, created by 1000 MeV protons impinging on a cylindrical target of lead, the neutron yield has been investigated as a function of the lead target dimensions. When increasing the radius from 5 to 20 cm the spectrum moves towards lower energies, as expected, since the neutrons are surrounded by more scattering material. When varying the height of the lead target, the spallation neutron moderation reaches saturation at a depth of about 50 cm and the spectrum does not change when further increasing the height.
The relative efficiency of the (d,d)-source is somewhat higher than 1 (∼1.35). For the (d,t)-source, it is much larger, around 2.15. This significantly larger value is due to the (n,2n)-multiplication in lead (with an energy threshold at about 7 MeV) and the induced fissions.
The variations of ϕ* with neutron importance (and reactivity) was also investigated for different spherical configurations. It was found that ϕ* remains approximately constant or increases slightly in the interval 0.70 < keff < 0.996.
To analyse this rather high value of ϕ*, the spallation source was artificially split into four energy bins and the efficiency of each bin was determined. It was found that the two high-energy bins (En > 20 MeV) contribute for about 50% to ϕ* and to the total number of fission neutrons produced in the core. This can be explained by the fact that primary neutrons born with high energy from spallation give birth to a large number of lower-energy neutrons, which in turn induce fissions. This finding indicates the need for extending reactor analysis code capabilities above 20 MeV for more detailed investigations of high-energy spallation neutron effects.
Comparisons of ERANOS and MCNPX calculations of ϕ* were found to be in good agreement for the energy bins below 20 MeV. However, as ERANOS does not take into account neutrons above 20 MeV, it largely underestimates the total value of ϕ*. This effect should be remembered when calculating ϕ* with reactor codes that do not account for neutrons above 20 MeV.
7.2 1 MW SPALLATION TARGET DEVELOPMENT The International Science and Technology Centre Project # 559 “Pilot flow lead-bismuth target of 1 MWth for accelerator-based systems” is a collaborative project between Institute of Physics and Power Engineering (IPPE) in Obninsk, Los Alamos National Laboratory (LANL), Royal Institute of Technology and CEA-Cadarache. Funding parties of this project are USA, EU and Sweden.
In April 2001 the final thermal hydraulic tests have been performed proving that all the required conditions for off-beam testing have been satisfied. Appendix VII describes in details the off-beam tests of the spallation target conducted in Obninsk in April 2001.
The future experiments with this target are under discussion now between partners in this collaboration. Most probably target will be shipped to the University of Nevada in Las Vegas (UNLV) for further off-beam tests. For the time being irradiation experiments at Los Alamos National Laboratory are postponed, if not cancelled,
58

because of extremely high costs for experimental hall renovation and adaptation for suggested target experiments. An international advisory group prepares a program for common experiments at UNLV
7.3 YALINA EXPERIMENT Subcritical thermal neutron set-up called Yalina is another interesting collaborative integral experiment very complementary to the MUSE-facility. A subcritical thermal neutron assembly is a uranium-polyethylene multiplying system with maximal multiplication factor ksrc < 0,98 in a well of a stack composed of high purity graphite bricks) serving as a lateral reflector. The assembly is driven by an intense neutron generator wit a D or T target located OUTSIDE the subcritical core (see Figs 7.12 and 7.13) [55].
The assembly is mounted on the movable platform which allows to shift the assembly in two directions with respect to the ion beam axis. A rectangular lattice has a pitch equal to 20 mm. Fuel pins consist of 10% enriched U.
5
Figure 7.12: The subcritical facility Yalina in Minsk. 1 - neutron generator, 2 - Ti-3H target system, 3 - subcritical assembly, 4 - movable platform, 5 - collimator.
8
Figure 7.13: A detailed view of the Yalina facility.
1 2 0 0
14Мeneutro
1000
0 6 4
1
Uranium-polyethylene assembly
59

Experiments with KTH participation on the Yalina facility are focused on: enerator,
• of the experimental techniques for subcriticality monitoring, neutron
• characteristics of the subcritical systems with the
• stems
ig. 7.14 shows a core model for a Yalina benchmark with comparative results for
7.4 SAD PROJECT
tog itute for Nuclear Research in Dubna and with other
facility has been prepared and is based on a
nstallation – see Figures 7.15 and 7.16 - includes:
• investigation of physics of the subcritical systems driven by a neutron g• measurements of transmutation rates of the fission products and minor actinides, • investigation of spatial kinetics of the subcritical systems with the external neutron
sources, validationspectra measurement etc. investigation of dynamics external neutron sources in pulse mode of the neutron generator operation. validation of the nuclear data and simulation methodology for subcritical sy
• reference experiment for benchmark comparisons. Fdifferent nuclear data libraries.
Figure 7.14: A core model of Yalina-benchmark. Nuclear data sensitivity studies for
.2 JENDL3.2keff gave the following results: ENDFB6.6 JEF20.9651+/-.0008 0.9675+/-0.0007 0.967+/-.0007
KTH ether with Joint Instforeign collaborators from CEA-Cadarache, CIEMAT-Madrid, nad FZK-Karlsruhe have proposed a project to develop and construct a Subritical Assembly in Dubna (SAD) driven by the existing phasotron accelerator of protons with energy 660 MeV. A subcritical core will be fuelled with MOX fuel elements containing a mixture uranium and weapon grade plutonium oxides.
The preconceptual design of the SADsubcritical MOX core with a nominal thermal power of 20 kW [56] (see also Appendix VIII). This corresponds to the multiplication coefficient keff = 0.95 for the accelerator beam power of 1kW.
A design of the SAD i
60

• The proton accelerator with energy 660 MeV and maximum power of 2.1 kW; • Beam transport line; • Replaceable targets of various length and material: Pb, W, Pb/Bi; • Subcritical core with fuel elements of a BN-600 type; • Reflector and radiation shielding; • Systems of air-cooling of target and blanket; • Safety and monitoring systems.
Figure 7.15: A predesign of a SAD-core with experimental channels and lead and beryllium inserts.
The proton beam will impinge on the target placed in a steel tube. Surrounding subcritical core will be set up with MOX fuel placed in a stainless steel vessel. The lead reflector will surround the subcritical core. A small beryllium insert with experimental channels will be placed behind the lead reflector in order to perform additional studies with moderated neutrons and to increase experimental flexibility of this assembly.
The installation will be placed in accelerator hall surrounded with a concrete wall with thickness of about 2 meters.
A standard fuel batch used in a BN-600 fast reactor has been considered for the SAD-coer. The distance between fuel batch centres has been
Figure 7.16: A computational model of the SAD subcritical assembly as simulated for different set-up. (green - lead, violet - fuel elements, blue – stainless steel, yellow-spallation target (Pb,Pb-Bi or W), rose –vacuum.
61

96 mm. The fuel designed for the fast breeder BN-600 reactor will be adopted for the core of the SAD-facility. The 127 fuel elements will be located in a hexagonal stainless steel fuel batch. Fuel elements contain the fuel pallets with 27%PuO2 + 73%UO2 of average density of 10 g/cm3. The content of 239Pu in PuO2 is not less than 95%. Uranium in oxide is depleted to 0.4% of 235U.
The following research topics are foreseen for SAD experiments:
• Studies of the coupling between a spallation target and a subcritical assembly, development of techniques for measurement and control of physical parameters of the facility (e.g. reactivity and subcriticality level)
• Measurement of keff and absolute value of a power gain of installation; • Studies of the spallation target including spallation neutron yields and spectra for:
Different target materials (Pb, W, Pb-Bi) Different target sizes Different shapes of a target interface surface and optimization of the target
shape. Different position of the target in the subcritical assembly. Investigations of the
spallation neutron source importance and the resulting consequence on the global energy gain of the ADS. All targets will be instrumented for monitoring neutron and proton fields. Post irradiation analysis of the targets is foreseen.
• Validation of the codes and nuclear data spporting development of ADS • Specific properties of systems using fuels that include Pu with very large fraction of
239Pu. • The measurement of the contribution of high-energy (E >10 MeV) neutrons and
protons in particular studies of neutron shielding for a high energy neutron tail. • Post-mortem analysis of the spallation target and special samples (transuranic
isotopes) including radiochemical analysis
SAD project has been recently approved and the setup will be ready for experiments in about 3 years.
It is worth to mentioned that a number of interesting experiments have been already performed in a frame of SAD project preparation and those experiments are linked and coordinated with the mentioned above European MUSE-project.
62

8 A COST BENEFIT ANALYSIS OF AN ACCELERATOR DRIVEN TRANSMUTATION SYSTEM
The economical costs and benefits associated with a nuclear waste transmutation strategy have been assessed. An 800 MWth, fast neutron spectrum, subcritical core design has been used in the study (the so called Sing-Sing Core). Three different fuel cycle scenarios have been compared.
The main purpose of the studies has been to identify the cost drivers of a partitioning and transmutation strategy, and to estimate the cost of electricity generated in a nuclear park with operating accelerator driven systems.
It has been found that directing all transuranic discharges from spent light water reactor (LWR) uranium oxide (UOX) fuel to accelerator driven systems leads to a cost increase for nuclear power of 50±15%, while introduction of a mixed oxide (MOX) burning step in the LWRs diminishes the cost penalty to 35±10%.
The cost of electricity from nuclear power has been calculated in three different fuel cycle scenarios. As the reference case a light water reactor scenario without reprocessing was used (Once through). The two other scenarios use dedicated subcritical systems to transmute the wastes from the light water reactor park. In one of the scenarios (LWR UOX + ADS) spent UOX fuel is sent directly to transmutation. The other scenario (ADS + LWR MOX) contains an intermediate step of plutonium recycling in the light water reactors.
The costs for producing electricity in these three scenarios range from 24,54 mills/kWh to 37,24 mills/kWh – Fig. 8.1. Only the production costs were considered. No taxes or subsidies were taken into account. Once through appears as expected the cheapest scenario. The advanced fuel cycles show a higher cost of electricity, but are still low enough to be competitive in a future market with anticipated higher electricity prices.
The full results have been presented in MSc Thesis of D. Westlén (Appendix IX) and in [34] (Appendix X).
63

1.743.23 3.30
14.20 10.9212.01
7.31
5.626.18
4.443.20
5.02 3.35
5.17
3.45
1.29
0.19
0.19
0.00
5.00
10.00
15.00
20.00
25.00
30.00
35.00
40.00
Once through LW R UOX +ADS
ADS + LWRMOX
CO
E (m
ills)
W astesADS O&MADS Capital costADS Fuel cycleLWR O&MLWR Capital costLWR Fuels
Figure 8.1: Overall cost distributions for the three fuel cycles considered. COE is the abbreviation for Cost of Electricity, O&A - for Operation and Maintenance
64

9 CODE DEVELOPMENT
Monte-Carlo Burnup code – MCB is an original contribution to the development of Monte-Carlo based burnup codes. In difference to a simple coupling of Monte Carlo to “Origen” like burnup codes [57], two original Monte-Carlo burnup codes emerged in the last few years. The EA-MC code [58][59] simulates steady state particle transport and perform burnup calculations starting from the initial impinging high-energy protons, the MCB code performs for today burnup calculations only starting from the neutron source supplied from the separate high-energy transport calculations or from the inherent neutron source obtained from criticality calculations.
MCB code is fully compatible with MCNP (version 4C) and complete burnup calculations can be done in a single run that requires preparation of a single input file with a very few more data lines compared to a regular MCNP input. A continuous or batch fuel feed/extraction can be simulated including a possibility of reloading and shuffling of the fuel elements. The code uses extensive data libraries that covers nuclide decay schemes, continuous energy transport and reaction cross-sections, isomer state formation ratios, incident energy and target nucleus dependent fission product yield, and radioactive hazard indexes. This novel and advanced numerical tool can be used for a design of various nuclear systems, particularly for simulations of the accelerator driven systems. The extensive tests on the system were performed on IAEA [60] (Appendix XI) and NEA [61] ADS-benchmarks data covering both, time evolution of keff and transmutation of 99Tc. Those benchmarks show a very good performance of the MCB code compared to other codes.
MCB code has been dispatched to NEA/OECD program library and will be freely available for the world nuclear technology community through NEA/OECD and RSIC distribution routines.
Appendix XII gives details of the MCB-code. Appendix XIII presents the results of an extensive benchmarking.
65

10 NUCLEAR DATA LIBRARIES FOR ADS CALCULATIONS
The final version of the MCB-code dispatch to OECD/NEA program library includes temperature dependent neutron-cross section data libraries for the temperatures of 300K, 600K, 900K, 1200K, 1500K and 1800K. The following data libraries created at KTH are freely distributed with MCB code:
• ENDF/B6 version 8 • JENDL version 3.2 • JEF version 2.2 • EAF version 99
This vast amount of data gives a unique opportunity for the users to perform state-of-the art simulations both for k-eff calculations and burnup evolution.
Neutron and proton cross-section evaluations for 232Th, 238U and 239Pu for energy range up to 150 MeV prepared at KTH in collaboration with IPPE in Obninsk have been included into data libraries.
66

11 SEMINARS, CONFERENCES AND INTERNATIONAL INTERACTIONS
The 5th Accelerator and Transmutation Technology Workshop in Taejon, S. Korea. Waclaw Gudowski presented KTHs projects. February 2001.
2nd CONFIRM meeting in Harwell, United Kingdom. Chaired by Janne Wallenius. Presentation on R2 core modelling by Janne Wallenius. April 2001
Muon Catalysed Fusion 01, conference in Shimoda, Japan. Presentation on metastable ppmu molecules by Janne Wallenius. April 2001.
IAEA Fast Reactor Working Group meeting in Semiplatinsk, Kazakhstan. Presentation of the Swedish ADS-projects. Waclaw Gudowski. May 2001
International Expert Committee for Myrrha project. SCK-CEA Mol. Waclaw Gudowski. May 2001.
Visit to Dimitrovgrad, Russia: presentation of CONFIRM & preparation of nitride fuel irradiation in BOR-60 by Janne Wallenius. May 2001.
Visit to Risö laboratory, Denmark. Working meeting on radiation damage modelling. Attended by Roumiana Chakarova and Janne Wallenius. May 2001.
NEA ADS-Expert Group meeting in Paris. Waclaw Gudowski is co-author of the NEA comparison studies. June 2001.
Participation is 2nd SPIRE meeting in Madrid. Presentation of calculated recoil spectra and defect production by Janne Wallenius and Roumiana Chakarova. June 2001.
IAEA ADS Workshop in Trieste. Waclaw Gudowski delivered series of lectures on ADS. September 2001.
FUETRA cluster meeting in Karlsruhe. Chaired by Janne Wallenius. September 2001
FUTURE kick-off meeting in Karlsruhe. Attended by Janne Wallenius. September 2001.
3rd CONFIRM meeting in Karlsruhe, Germany. Presentations on N-15 enrichment by Janne Wallenius and R2 core modelling by Jerzy Cetnar. Chaired by Janne Wallenius. September 2001.
International Conference on Back-End of the Fuel Cycle: From Research to Solutions, GLOBAL 2001, Paris. ANS (2001). Kamil Tucek (Appendix XIV). September 2001.
GEDEON (French transmutation coordination project) meeting Lyon. Waclaw Gudowski presented paper on ISTC transmutation related projects. October 2001.
MUSE – EU-project annual meeting in Grenoble. Waclaw Gudowski, Per Seltborg. October 2001.
XADS EU-project kick-off meeting, Lyon. Waclaw Gudowski, Jerzy Cetnar. October 2001.
67

XADS, WorkPackage 4 project meeting in Rome. Waclaw Gudowski. November 2001.
Participation in AccApp/ADTTA01, Reno, Nevada. 10 presentations of KTH group. Waclaw Gudowski, Janne Wallenius, Jerzy Cetnar, Kamil Tucek, Marcus Eriksson, Daniel Westlén. November 2001 (Appendices II, III, IV, VI, VIII, X, XI, XIII, XIV, XV)
Transmutation fuel workshop in Idaho Falls. Presentation of CONFIRM and prospects of BOR-60 irradiations. Janne Wallenius. November 2001
Radiation damage network (ITEM) meeting in Fontainbleau, France. Janne Wallenius. November 2001
Workshop on molecular effects in muonic hydrogen cascades and CONFIRM working meeting at PSI, Switzerland. Janne Wallenius. November 2001
BASTRA and ADOPT EU-cluster/network meetings in Geneve. Waclaw Gudowski. December 2001
Preparation of ISTC proposal for nitride fuel modelling. Meeting in Cadarache attended by Janne Wallenius. December 2001.
SAD-project meeting in Warszawa. Waclaw Gudowski. December 2001.
Guest researchers and scientific exchange:
Drs Greg van Tuyle and Kemal Pasamehmetoglu from Los Alamos National Laboratory. February 2001.
Dr. Alexander Polanski, Joint Institute of Nuclear Research. February-March 2001
Dr. Nikolai Sobolevski, Russian Academy of Sciences, April 2001.
68

12 REFERENCES
[1] Wallenius J., et al.: Application of burnable absorbers in an accelerator driven
system, Nuclear Science and Engineering 137 (2001) 96 [2] Tucek K., et al.: Source efficiency in an accelerator-driven system with burnable
absorbers, International Conference on Back-End of the Fuel Cycle: From Research to Solutions, GLOBAL 2001, Paris. ANS (2001).
[3] Wallenius J., et al.: The Sing Sing core: A sub-critical TRU burner with low production of curium, Proc. Accelerator Applications 2001 and ADTTA 2001 “Nuclear Applications in the New Millennium”, Reno (USA). ANS (2001)
[4] Laurie S. Waters, Editor, MCNPX Users’s Manual, TPO-E83-G-UG-X-00001, LANL, 1999.
[5] M. Eriksson and J. Cahalan, “Inherent Shutdown Capabilities in Accelerator-driven Systems,” Annals of Nucl. Energy (accepted Dec. 3, 2001).
[6] M. Eriksson and J. Cahalan, “Applicability of Passive Safety to Accelerator-driven Systems,” AccApp/ADTTA '01, American Nuclear Society Winter Meeting 2001, Reno, November, 2001.
[7] J. E. Cahalan, A. M. Tentner, and E. E. Morris, “Advanced LMR Safety Anlaysis Capabilities in the SASSYS-1 and SAS4A Computer Codes,” Proc. of the International Topical Meeting on Advanced Reactors Safety, Pittsburgh, April 17-21, 1994.
[8] D. J. Hill, "SASSYS Validation Studies", Proceedings of the International Topical Meeting on Safety of Next Generation Power Reactors, Seattle, WA, May 1-5, American Nuclear Society, 1988.
[9] J. P. Herzog, "SASSYS Validation with the EBR-II Shutdown Heat Removal Tests", Trans. Am. Nucl. Soc., 60, 730, 1989.
[10] F. E. Dunn, "Validation of Detailed Thermal Hydraulic Models Used for LMR Safety and for Improvement of Technical Specifications", Proceedings of the American Nuclear Society International Topical Meeting on Safety of Operating Reactors, Seattle (Bellevue), WA, September 17-20, American Nuclear Society, 1995.
[11] R. N. Lyon, Ed., "Liquid Metals Handbook", NAVEXOS P-733(Rev.), U.S. Atomic Energy Commission and U.S. Department of the Navy, June, 1952.
[12] N. A. Nikol'skii, et al., "Thermal and Physical Properties of Molten Metals and Alloys", pp. 1-36, Problem of Heat Transfer , M. A. Mikheev, Ed.,Publishing House of the Academy of Sciences SSSR, Moscow, 1959. [Translated as USAEC Report AEC-tr-4511].
[13] W. Maschek, A. Rineiski, K. Morita, G. Muhling, M. Flad, ”Safety Analysis for ADS Cores with dedicated Fuel and Proposals for Safety Improvements,” Proc. IAEA Technical Committee Meeting on Core Physics and Engineering Aspects of Emerging Nuclear Energy Systems for Energy Generation and Transmutation, Argonne, Nov 28-Dec 1, 2000.
[14] W. Maschek, D. Thiem, and G. Heusener, “Safety features of a reactor core with minor actinide transmutation and burning capabilities,” Proc. International Conf. On Future Nucl. Energy Systems, GLOBAL 99, ANS, 1999.
69

[15] J. Tommasi and S. Massara, “L.M.F.R dedicated cored for transmutation critical vs. subcritical systems comparison,” Proc. International Conf. On Future Nucl. Energy Systems, GLOBAL 99, ANS, 1999.
[16] H. H. Hummel and D. Okrent, “Reactivity Coefficients in Large Fast Power Reactors,” Section on Doppler effect, pp. 133, American Nuclear Society, 1978.
[17] Y. Suzuki and Y. Arai, “Thermophysical and thermodynamic properties of actinide mononitrides and their solid solutions,” J. Alloys Comp. 271-273 (1998) 577-582.
[18] M. Takano et al., ”Synthesis of americium mononitride by carbothermic reduction method,” Proc. International Conf. on Future Nucl. Energy Systems, GLOBAL’99, ANS, 1999.
[19] Hunter, C. W., Fish, R. L., Holmes, J. J., 1975. Mechanical properties of unirradiated fast reactor cladding during simulated overpower transients. Nucl. Technol. 27(3), pp. 376-388 (Nov 1975).
[20] W. S. Yang and H. S. Khalil, “Reduction in Burnup Reactivity Loss in Accelerator Driven Transmutation Systems,” Proc. of the 4th Topical Meeting on Nuclear Applications of Accelerator Technology, Washington, DC November 13-15, 2000.
[21] R. Hill and H. Kahlil, “Physics Studies For A NA-Cooled ATW Design,” IAEA Technical Committee Meeting on Core Physics and Engineering Aspects of Emerging Nuclear Energy Systems for Energy Generation and Transmutation, Argonne, 28 Nov-1 Dec, 2000.
[22] E. Gonzalez, et al., “Transuranics on Fertile and Inert Matrix Lead-Bismuth Cooled ADS,” 6th Information Meeting on Actinide and Fission Product Partioning & Transmutation, Madrid, Dec 11-13, 2000.
[23] H. U. Wider, J. Karlsson, and A. V. Jones, “Safety Considerations of Heavy metal-cooled accelerator-driven systems,” Proc. International Conf. On Future Nucl. Energy Systems, GLOBAL 99, ANS, 1999.
[24] C. Rubbia, et al., “Conceptual Design of a Fast Neutron Operated Energy Amplifier,” Cern publication, CERN/AT/95-44.
[25] Safety Related Terms for Advanced Nuclear Power Plants, IAEA, TECDOC-626 (September 1991).
[26] Sowa, E. S., et al., 1976. LMFBR self-actuated shutdown systems. Volume II. Proc. of the international meeting of fast reactor safety and related physics, Chicago.
[27] S. Beaty, The THORP project – an overview. Energy and environment 6 (1995) 383.
[28] W.R.A. Gossens, C.G. Eichholz and DW. Tedder, eds, Treatments of gaseous effluents at nuclear facilities, Radioactive waste management handbook vol 2 (1991).
[29] H. Murata and T. Mukaiyama, Fission reactor studies in view of reactor waste programs. Atomenergie-Kerntechnik 45 (1984) 23.
[30] M. Salvatores et al, Long-Lived Radioactive waste transmutation and the role of accelerator driven (hybrid) systems. Nucl. Inst. Meth. A, 414 (1997) 5.
[31] T. Takizuka et al, Studies on accelerator driven transmutation systems. In Fifth international infomation exchange meeting on actinide and fission product partitioning and transmutation, page 383. EUR-18898 EN, OECD/NEA, 1998.
70

[32] J. Wallenius et al, The European Union CONFIRM project, Proceedings of AccApp/ADTTA01, Reno, Nevada, 2001.
[33] P. Wydler, P&T studies of the OECD/NEA, Fifth framework program meeting on P&T and ADS activities, Paris 2000.
[34] D. Westlén, W. Gudowski, J. Wallenius, K. Tucek: “A Cost Benefit Analysis of an Accelerator Driven Transmutation System”, Proc. Accelerator Applications 2001 and ADTTA 2001 “Nuclear Applications in the New Millennium”, Reno (USA). ANS (2001)
[35] D.J.Bacon, A.F.Calder and F.Gao, J. Nucl. Mat. 251 (1997) 1 [36] A. F.Calder and D.J Bacon, J. Nucl. Mat. 207 (1993) 25 [37] D. Farkas, C.G.Schon, M.S.F.de Lima and H. Goldstein, Acta mater. 44 (1996)
409 [38] F. A. Garner, M. B. Toloczko and B. H. Senser, J. Nucl. Mat. 283-287 (2000)
168 [39] S. I. Golubov, B. N. Singh and T. Trinkaus, J. Nucl. Mat. 276 (2000) 78 [40] G. Simonelli, R. Pasianot and E.J.Savino, Mat.Res.Soc.Symp.Proc 291 (1993)
567 [41] R. E. Stoller, G. R. Odette, B. D. Wirth, J. Nucl. Mat. 251 (1997) 49 [42] A.F. Voter in Intermetalic Compounds, vol 1, Principles, Editors J.H.Westbrook
and R.L. Fleisher, John Wiley & Sons, 1995 [43] C.H.Woo and B.N.Singh, Phil. Mag. A65 (1992) 889 [44] Berglund, R.C., et al., Sept. 1987, Design of PRISM, An Inherently Safe,
Economic, and Testable Liquid Metal Fast Breeder Reactor Plant, Proc. ANS/ENS Int. Conf. on Fast Breeder Systems - Volume 2
[45] Cinotti, L., and Corsini, G., A proposal for enhancing the primary coolant circulation in an ADS, unpublished
[46] Computational Dynamics Ltd., 1999, Methodology Volume 3.10 [47] Wider, H.U., Karlsson, J., Passive Safety Approaches in Lead/Bismuth-Cooled
Accelerator Driven Systems, Annual Meeting on Nuclear Technology 2000, Bonn, Germany (2000)
[48] M. Salvatores, “Accelerator Driven Systems (ADS), Physics Principles and Specificities,” J. Phys. IV France 9, pp. 7-17 –7-33 (1999).
[49] M. Salvatores, M. Martini, I. Slessarev, “MUSE-1: A first Experiment at MASURCA to Validate the Physics of Sub-Critical Multiplying Systems Relevant to ADS,” Kalmar, Sweden, June 3-7 (1996).
[50] R. Soule, M. Salvatores, R. Jacqmin, “Validation of Neutronic Methods Applied to the Analysis of Fast Sub-Critical Systems: The MUSE-2 Experiments,” GLOBAL’97, page 639 (1997).
[51] J. F. Lebrat et al., “Experimental Investigation of Multiplying Sub-Critical Media in Presence of an External Source Operating in Pulsed or Continuous Mode: The MUSE-3 Experiment,” ADTTA’99 (1999).
[52] Briesmeister, J.F. MCNPTM – A General Monte Carlo N-Particle Transport Code – Version 4C. LANL/Los Alamos, LA-13709-M, April 10, 2000.
[53] J.Y. Doriath et al, “ERANOS 1: The Advanced European System of Codes for Reactor Physics Calculation,” Int. Conf. on Mathematical Methods and Super
71

Computing in Nuclear Application, 19-23 April 1993, Kongresszentrum, Karlsruhe, Germany (1993).
[54] P. Seltborg, R. Jacqmin, “Investigation of Neutron Source Effects in Sub-Critical Media and Application to a Model of the MUSE-4 Experiments,” Int. Meeting on Mathematical Methods for Nuclear Applications, Mathematics and Computation, September 9-13, 2001, Salt Lake City, Utah, USA (2001).
[55] A. Kievitskaya, S. Chigrinov et al, ISTC #B70 Progress reports and private communications 2001.
[56] W. Gudowski, A. Polanski, I. V. Puzynin, V. Shvetsov, ”Monte Carlo Modeling of a Sub-Critical Assembly Driven with the Existing 660 MeV JINR Protons Accelerator”, Proc. Accelerator Applications 2001 and ADTTA 2001 “Nuclear Applications in the New Millennium”, Reno (USA). ANS (2001)
[57] D.I. Postone and H.R. Trellue, “User’s Manual Version 2.0 for Monteburns, Version 1.0”, Los Alamos National Laboratory report LA-UR-99-4999. September 1999.
[58] C. Rubbia et al, “Conceptual Design of a Fast Neutron Operated High Power Energy Amplifier”, CERN Divisional Report CERN/AT/95-44 (ET), 29th September 1995. See also C. Rubbia, “A High Gain Energy Amplifier Operated with Fast Neutrons”, AIP Conference Proceedings 346, International Conference on Accelerator-Driven Transmutation Technologies and Applications, Las Vegas, July 1994.
[59] F. Carminati and Y. Kadi, CERN/ET/ Internal Note 98-005 [60] Waclaw Gudowski, et al., “IAEA BENCHMARK ON ACCELERATOR-
DRIVEN SYSTEMS”, Proc. Accelerator Applications 2001 and ADTTA 2001 “Nuclear Applications in the New Millennium”, Reno (USA). ANS (2001)
[61] Byung-Chan Na, editor: “Comparison Calculations for an Accelerator-Driven Minor Actinide Burner”, NEA-OECD report 2001, in preparation.
72

73
APPENDICES

APPENDIX I M. Eriksson and J. Cahalan, “Inherent Shutdown Capabilities in Accelerator-driven Systems,” Annals of Nucl. Energy (accepted Dec. 3, 2001).

Inherent Shutdown Capabilities in Accelerator-driven Systems
M. Erikssona*, J. E. Cahalanb
aRoyal Institute of Technology, Stockholm Center for Physics, Astronomy and Biotechnology, Dep. Nuclear & Reactor Physics, S-106 91 Stockholm, Sweden.
bArgonne National Laboratory, Reactor Analysis & Engineering Division
9700 South Cass Ave., IL 60439, USA.
Number manuscript folios: 21 Number of figures: 9 Number of tables: 4
1. Abstract
The applicability for inherent shutdown mechanisms in accelerator-driven systems (ADS)
has been investigated. The usefulness of reactivity feedbacks is investigated. The benefits, in
terms of dynamics performance, for enhancing the Doppler effect are examined. Given the
performance characteristics of source-driven systems, it is necessary to manage the neutron
source in order to achieve inherent shutdown. The shutdown system must be capable of
halting the external source before excessive temperatures are obtained. We evaluate methods,
based on the analysis of unprotected accidents, to accomplish such means. Pre-conceptual
designs for self-actuated shutdown of the external source are suggested. We investigate time
responses and evaluate methods to improve the performance of the plant protection system. It
is shown that maximum beam output must be limited by fundamental means in order to
protect against accident initiators that appear to be achievable in source-driven systems.
Utilizing an appropriate burnup control strategy plays a key role in that effort.
*Corresponding author. Tel.: +46 8 5537 8197; fax: +46 8 5537 8465. E-mail address: [email protected] (M. Eriksson). 1

2. Introduction
In the design process of advanced reactors, major consideration is given to the utilization
of passive safety systems and inherent safety features. There is a consensus among reactor
designers, supporting the value of passive safety designs. Passive safety systems rely on
natural physical phenomena, such as thermal expansion, fundamental nuclear properties,
gravity, and heat-transfer by natural convection, to perform essential safety functions. The
laws of physics dictate such properties and their effectiveness is not influenced by human
action. In the ideal case, the passive safety design does not require the action of any
mechanical or electrical device, making safety functions less dependent on active
components. The incentives for employing such designs are improved reliability and
simplified operation, both resulting in better safety performance. Besides the obvious
benefits, in terms of safety characteristics, passive designs are valuable means for minimizing
public concern and gaining public perception on new reactor concepts.
Most work on passive safety in the past has been related to study the innovative use of
natural convection, decay heat removal, and inherent negative reactivity feedbacks. Such
schemes have been successfully implemented in many reactor designs, including water-
cooled reactors, gas-cooled reactors, and liquid metal-cooled reactors.
In this paper, we explore the use of passive safety mechanisms to accelerator-driven
systems (ADS). While an intrinsic heat-transport path and sufficient natural convection are
necessary to achieve passive safety in any reactor system, those requirements are of general
character and are treated elsewhere e.g. (Karlsson and Wider, 2000). Our attention is focused
on inherent shutdown capabilities. We evaluate the applicability for such schemes and we
suggest some concepts for that purpose.
2

3. Reference design and modelling
In the assessment, we employ a reference design of an ADS to obtain essential data and to
verify predictions. Accident analysis is performed with the aid of the SAS4A safety code
(Cahalan, et al., 1994).
The reference design is a model of an ADS that has evolved at the Royal Institute of
Technology, Sweden (Wallenius, et al., 2001) and (Wallenius, et al., 2001). The core has a
nominal power of 800 MWth. It is cooled by liquid lead-bismuth eutectic (LBE) and the fuel
is based on a nitride matrix. Fuel pins are configured in an open pin lattice with core average
volume fractions of 8%/12%/80% (fuel/structure/coolant). The fuel consists of (core
average): 58% plutonium, 12% minor actinides, 14% boron carbide, 10% uranium-238, and
6% zirconium nitride. Uranium-238 is used in the inner zones to compensate for burnup and
poisoning effects (Tûcek, 2001). Boron carbide is utilized to increase fission-to-absorption
probabilities in even neutron number americium isotopes. Radial zoning is applied with an
optimized distribution of minor actinides, plutonium, burnable absorbers, and diluents to
mitigate power peaking factors and reduce long-term reactivity swing. Taking advantage of a
multi-batch fuel loading strategy (Yang and Khalil, 2000), where some fuel sub-assemblies
are added to the perimeter of the core on an intermediate time schedule (150 days), the
required beam insertion capacity can be reduced. In the present design, it is necessary to ramp
the beam by a factor of 1.8 to maintain constant power through an irradiation period of 510
days. Basic design parameters are listed in Table 1.
The primary circuit is illustrated in Fig 1. The core, heat exchangers, and primary pumps
are immersed in a single pool containing LBE. Coolant temperatures, in steady state, range
from 573 K at inlet to 702 K at the outlet. In the present design, the inlet flow velocity is set
to 2.5 m/s. Deterioration of the protective oxide film layer on structural material imposes an
3

upper limit on the flow velocity. The actual limit depends on the temperature and is not well
known, however, it is estimated to be in the range of 2-3 m/s (Novikova, et al., 1999). The
reactor vessel is filled with LBE to a prescribed level, with the remainder of the vessel being
occupied by an inert cover gas. The steam generators are elevated well above the core to
promote natural convection.
A primary system model is set-up in SAS4A, including a detailed multi-channel model of
the core, heat exchangers, pumps, compressible pool volumes, etc. Point kinetics is used for
calculating transient power. The neutronic response between core regions is strongly coupled
and space-time effects may be neglected for our purposes.
4. Applicability of reactivity feedbacks in ADS
Intelligent use of inherent reactivity feedbacks (e.g. Doppler effect, coolant density effect,
structural expansion, etc.) has provided excellent safety characteristics to advanced, critical,
reactor concepts. In the design process of a new reactor, it is simply good engineering
practice to utilize the inherent nuclear properties of the reactor to ensure optimal safety
performance. In particular, operating experience and experiments on liquid metal reactors
have demonstrated that better use of the inherent nuclear characteristics may provide a high
level of safety even in severe accidents where the shutdown system fails completely (Lucoff,
et al., 1992). Nowadays, because of design efforts and increased understanding, the safety
characteristics of critical, liquid metal reactors, are considered as a principal advantage. In
that context, it may seem natural to use a similar strategy for ADS’s. However, an ADS does
not respond to reactivity feedbacks like a critical reactor. While the critical reactor is
sensitive to reactivity feedbacks, the ADS is not. The ADS is largely offset from criticality.
The net effect is a substantially reduced sensitivity to reactivity changes. This feature
4

diminishes the practical use of reactivity feedbacks as a means for natural safety mechanisms
in accelerator-driven systems.
To study these features we exposed the reference design to an unprotected transient
overpower (UTOP) event. The initiator for the accident is a sudden increase in source
intensity. The intensity of the external neutron source is promptly increased by a factor of
1.8, corresponding to the insertion of maximum beam power at begin-of-life. It represents a
strong transient, integral power increases by a factor of 1.8 within a few hundred prompt
periods. In Fig 2, the impact of subcriticality on the combined reactivity effect from Doppler
feedback (Tdk/dT=-3.87×10-4) and coolant density feedback (dk/dT=-2.28×10-6) is
illustrated. The unconstrained response, when no feedbacks are accounted for, is also shown
to facilitate comparison. The response is calculated for a varying degree of subcriticality,
keff=0.954 (reference design), keff=0.98, keff=0.995, and keff=0.9995. Structural reactivity
feedback phenomena (e.g. radial and axial core expansion) are not incorporated into the
model. Nevertheless, Fig 2 is instructive in that sense it demonstrates the general
characteristics of a source-driven system subject to reactivity feedbacks both prompt and
delayed by heat-transfer.
The reference ADS (keff=0.954) experiences minor influence from Doppler and coolant
density feedback whereas the close-to-critical system (keff=0.9995) exhibits strong feedback
effects. Approaching criticality, at the expense of reducing the margin to prompt criticality,
results in stronger reactivity feedback coupling. Thus, the significance of reactivity feedbacks
depends on the specific design and in particular the choice of the subcritical level. Taking
advantage of reactivity feedbacks calls for a careful balance between the desired feedback
performance and the subcritical margin. It is clear, however, that reactivity feedbacks will not
be as effective a means in source-driven systems as they are in critical systems. Much
5

stronger reactivity effects, from what is experienced in critical reactors, are necessary to
impact on the source-driven system. Therefore, it is not practical to implement reactivity
feedbacks, by physics or engineering design, as the sole means to bring an ADS to a safe
shutdown condition. Inherent shutdown must be reinforced by other means.
4.1. Doppler effect
There has been considerable interest on the use of so-called “dedicated” fuels as to
achieve maximum transmutation rate in accelerator-driven systems. The dedicated fuels
contain large amounts of minor actinides (Np, Am, and Cm) and plutonium, but lack the
classical fertile isotopes (i.e. 238U and 232Th). Subsequent deterioration of safety parameters,
when using such fuels, is well known (Maschek, et al., 2000). While Doppler broadening of
capture resonances is the most important inherent shutdown mechanism in a liquid-metal
reactor, the effect is vanishing small in accelerator-driven systems using dedicated fuels. The
reduction of the fertile inventory and the spectrum hardness are the main reasons for this
impairment (Maschek, et. al, 2000). It has been argued that a typical ADS core, based on
dedicated fuels, contain several critical masses, which in principle provides the potential for
criticality if the fuel is rearranged in a more dense configuration. In the absence of Doppler
effect, such accidents may occur without any constraining prompt negative reactivity
feedback. Provisions for increasing the Doppler effect in dedicated cores have been proposed
(Tommasi and Massara, 1999). In Table 2, values of the Doppler constant are listed for
various heavy-metal cooled reactors. The Doppler constant for a sodium-cooled reactor is
also included.
The Doppler constant for the dedicated cores (cases 1 and 2) are an order of magnitude
lower than those of the mixed U-Pu fuels (cases 4 and 5) with their large Doppler constant.
Tommasi and Massara (1999), enhanced the Doppler effect in a fertile-free core by adding
6

some amount of hydrogenated moderator. The Doppler effect obtained in the sodium design
(case 6), by Hill, et al. (1999), surpasses the Doppler values in the lead-based designs by a
factor of two. The argument is that the softer spectrum of the sodium design allows more
neutrons to appear in the resonance region. Practically all the Doppler effect occurs below
about 25 keV, where cross section variations with temperature are large (Hummel and
Okrent, 1978).
We have investigated the benefits; in terms of dynamic behaviour of the core, of
increasing the Doppler effect in an ADS. By explicitly taking into account the Doppler
feedback, we studied the dynamic response following the sudden “source jump” (same as
previous transient). The source transient was chosen because it results in high fuel
temperatures, which is the driver for reactivity input by Doppler effect. Different values for
the Doppler constant were modelled, Tdk/dT=-3.87⋅10-4 and Tdk/dT=-2.71⋅10-3, representing
a core containing dedicated fuels and a core containing large amounts of fertile material,
respectively. The results are presented in Fig 3.
The dynamics response, including Doppler reactivity feedback in the reference ADS
(keff=0.954) with dedicated fuel is tiny. Even if the Doppler constant is increased by a factor
of seven, by introducing massive amounts of fertile material, the gain in feedback effect is
small. There seems to be little benefit for increasing the Doppler effect in an effort to
constrain accidents in the subcritical state. In general, the importance of the Doppler effect in
an ADS is strongly related to the level of subcriticality. In a close-to-critical system an
equivalent increase of the Doppler effect would result in significant improvement, see Fig 3
(keff=0.9995). The importance of Doppler feedback in hypothetical accidents exceeding the
critical margin must be further evaluated.
7

5. Time response
The thermal response of core constituents and the time to reach failure in various
accidents influences the requirements on the shutdown device. Knowledge of the grace
period, as defined by IAEA (1991), is essential in the evaluation of such devices. The plant
must survive long enough that a passive safety action can be initiated in time to prevent core
damage.
The numerical value of the grace period is necessarily specific to the particular design and
is of less interest, but the time responses of accidents. Our intention is to analyze the transient
response in order to assess the requirements on the safety system and to evaluate possible
safety actions to enhance the performance. We may express response times defined by time
constants rather than by absolute values, which has broader range of applicability.
We subjected the reference design to three representative sequences of unprotected (i.e. no
shutdown or plant protection system action) accidents, namely:
a) Unprotected transient overpower (UTOP) by a prompt insertion of maximum beam
current. It is assumed that the steam generators remove heat at a rate of nominal power
(constant temperature drop in steam generators).
b) Unprotected loss-of-flow (ULOF) by a loss of primary pump power. Feed-water flow is
assumed to remain at its initial value and coolant inlet temperature is constant (constant
outlet temperature in steam generator).
c) Unprotected loss-of-heat-sink (ULOHS) by a sudden inability of the steam generators to
remove heat (zero temperature drop in steam generators).
8

Constant steam generator boundary conditions are assumed. The actual boundary
condition depends on the particular accident (see above). As an example, the safety margins
for the present design are included in the figures. These are based on postulated transient
failure temperatures, listed in Table III.
The dissociation temperature of minor actinide nitride fuel (NpN, AmN, CmN) is not well
known (Suzuki and Arai, 1998). However, it is known that stable AmN has been fabricated at
1573 K (Takano, et al., 1999). Mechanical failure limits, used to evaluate cladding failure, are
those for 20% cold-worked 316 stainless steel due to lack of reliable data on HT-9.
Mechanical strength properties are based on transient burst tests conducted on unirradiated
and internally pressurized cladding specimens (Hunter, et al., 1975).
In Fig 4 and Fig 5, peak fuel temperatures and peak cladding temperatures, respectively,
are displayed as a function of time.
In the source transient (UTOP), the power “jumps” by a factor of 1.8, see previous Fig 2.
Since no time is required for heat flow, the fuel suffers a rapid, almost adiabatic thermal
excursion, Fig 4. Coolant and structure are heated at a rate determined by the characteristic
time constant of the fuel element. The fuel itself, has the shortest time response and is most
sensitive to source transients. After a few seconds, the fuel pins have adjusted to the new
power level and temperatures temporarily settle in a quasi-equilibrium (not visible in the
figure). For an extended period, mainly determined by the primary loop circulation time and
the coolant heat capacity, the coolant inlet temperature remains at its initial value. The steam
generators are assumed to remove heat at a rate of nominal power, resulting in a mismatch in
the heat production and heat removal. The net effect is increasing inlet temperature, which
causes the reactor core, coolant, and other components to overheat, inevitably leading to core
damage unless the reactor is shut down.
9

In the loss-of-flow (ULOF) accident, core heat-up occurs at a rate determined by the flow
coast-down. Inertial forces help to push coolant through the primary system for an extended
period. Peak temperatures occur as the pump impeller comes to a complete rest. Core
temperatures and buoyancy forces eventually balance. In the asymptotic state, flow is
sustained by natural convection alone. Reactivity feedbacks have negligible effect on the
transient. For this particular system, an unprotected loss-of-flow accident should result in
little or no damage. The integrity of the fuel and the cladding is not compromised. The
protective oxide film layer on the cladding may suffer some damage that potentially could
harm the cladding in the long run.
The loss-of-heat-sink (ULOHS) accident tends to be a more slowly evolving accident than
the source transient and the loss-of-flow accident. The accident manifests as rising inlet
temperature, which accompanies loss of primary heat sink. Response time is determined by
the primary loop circulation time and coolant heat capacity. The prolonged grace period in a
ULOHS accident facilitates successful performance of the safety system. Core damage is
inevitable unless safety measures are taken to shut down the reactor.
In the unprotected LOHS accident shown in Fig 4, we assumed that the primary pumps
continued to operate. We also studied the response to a combination of loss-of-heat-sink and
malfunctioning primary pumps. The temperature increased much more rapidly as the initial
response, in that case, is mainly determined by the flow coast-down. It turned out that the
grace period in a combined ULOHS and ULOF accident for this specific system was reduced
by 50% compared to an isolated ULOHS. It should be taken into account, however, that it is
likely that a loss-of-heat-sink accident will be in the form of impairment rather than a sudden
and complete loss of heat rejection capability.
10

In Fig 6, the thermal response of the coolant in the hot pool is displayed. The coolant
temperature is an important safety system parameter since it is related to the heat production
in the core. It can be used to sense power excursions and reduction in coolant flow rate. Most
likely, an inherent shutdown device will be actuated by the coolant temperature some way or
the other.
The thermal response of the coolant in the hot pool following a change in power or flow is
delayed by the heat capacity of the coolant and transport lags. Therefore, it must be
ascertained whether the time response of the coolant is sufficient to serve as an accident
indicator and protect against the fastest transients conceivable in an ADS. Rapid coolant
response is advantageous since it promotes prompt action of the safety system. In general,
UTOP caused by insertion of maximum beam power, is likely to exert the fastest transient.
The absence of any moveable control rods, that may rather quickly add or remove large
amounts of reactivity, diminishes the potential for fast transients caused by reactivity
insertion. Significant reactivity is potentially available in core compaction or voiding
phenomenon, but such sequences stretch over a longer period. It is noticeable in Fig 6, that
the initial response (<200 seconds) is more or less the same for all transients. However,
source transients introduce the shortest grace period (with respect to fuel damage), while the
temperature rise in the coolant is modest. In that sense, source transients impose the highest
demands on a passive device that relies on the thermal response of the coolant.
6. An approach to inherent shutdown
Compared to reactivity changes, variations in source strength or source importance have a
strong influence on the ADS. The power is linearly proportional to the source, 10% reduction
in source strength yields 10% reduction of power, and so on. Shutdown of the external source
effectively halts the fission process in the entire core.
11

Our approach is to design a passive system for the primary purpose to shut down the
source in an emergency. The passive device would be comprised in an overall plant control
system strategy similar to: a) Use an active, regulating system that adjusts the source during
normal operation. The regulating system function is to meet power demand rather than to
shut the reactor down if an accident occurs. b) Use an active Plant Protection System (PPS)
as a first level of protection to shut off the beam in an accident. The PPS would signal on
excess temperature levels, low coolant flows, high neutron flux levels, etc. c) Use the passive,
self-actuated, shutdown system providing the second line of protection whenever the PPS
function is not properly carried out. The passive system must be inherently independent of
the normal beam control system.
It should be recognized that system redundancy makes the assumption of PPS failure
highly unlikely. In fact, actual activation of the passive shutdown system must be regarded as
hypothetical. Indeed, it affects the design requirements on the device.
The shutdown system must be capable of halting the external source before excessive
temperatures are obtained. This may be accomplished by reducing the time required for the
shutdown system to act and by limiting the speed of the temperature rise by design
considerations. As mentioned previously, the fastest credible transient in an ADS is a source
insertion transient. Worst conditions occur when maximum beam power is inserted in a step
fashion at begin-of-life. Source transients result in a rapid, but bounded power excursion.
Consequently, it is unsafe to rely on a safety system to assure protection in the early phase of
a source transient. Instead, protection must be accomplished through safety-by-design
principles, e.g. minimizing the beam output capability by utilizing an appropriate burnup
control strategy. While the speed of the beam controller may be limited by fundamental
means, the capacity of the accelerator (beam power) is dictated by reactivity losses governed
by fuel burnup. Various options exist, for example, shorter irradiation-cycle time and multi-
12

batch fuel loading strategy (Yang and Khalil, 2000), lower power density and higher
transuranic inventory (Hill and Khalil, 2000), optimal distribution of plutonium and minor
actinides (Gonzalez, et al., 2000), use of burnable absorbers (Wallenius, et al., 2001). Safety-
by-design relaxes the requirements on the shutdown system.
In UTOP and ULOHS accidents, the grace period may be prolonged by the primary loop
circulation time and the coolant heat capacity. Typical accidents where the coolant inventory
has an appreciable effect on the thermal response involve situations when there is a net
change in internal energy (primary system). Loss-of-flow accidents do not necessarily
involve any accumulation of internal energy in the primary system, as the heat-removal rate
may unaffected. For loss-of-flow transients, the initial response is determined by the flow
coast-down. It may be influenced by changing the moment of inertia of the pump and by
increasing natural convection.
Taking these circumstances in consideration, our approach is to prolong grace periods,
increase safety margins, and utilize safety-by-design principles, all easing the demands on the
safety system. Prolonged grace periods do not only improve our chances for successful safety
performance but reduces the probability for false actuation and interference of the passive
system during normal operation. The second objective, in order to achieve high reliability, is
to design simple, redundant and diverse shutdown systems, and to use components of proven
high reliability. Greater complexity generally means reduced reliability.
7. Inherent shutdown mechanisms
In this section, we suggest some concepts for inherent beam shutdown. The intention is to
demonstrate the basic working principle. Appropriate references are included for strategies
suggested by separate authors.
13

7.1. Flooding of the beam tube
Shutdown of the external source can be accomplished by flooding the beamtube with
coolant. The main purpose for filling the beamtube is to shift the axial position of beam
impact, which in principle reduces the importance of source neutrons. Actuation may be
based on thermal expansion of coolant or use of bursting disk devices. Several authors have
proposed designs that utilize such principles.
Rubbia, et al. (1995) proposed a technique for the “energy amplifier” in which coolant
rising above a prescribed level activates an overflow path and floods the cavity in the beam
tube.
To fill the beamtube, we suggest installing a drainpipe in the shape of a U tube, shown in
Fig 7.
One side of the U tube is open to the cover gas region while the other side is connected to
the beamtube. A portion of the coolant is retained in the U bend, forming a liquid seal that
separates the beamtube from the cover gas region. A liquid column is supported by the
pressure difference. A pressure difference of 1 atm is equivalent to a column height of LBE
of 1 m (11 m for sodium). The inlet is located at a certain height above the surface. As the
coolant expands, it would rise to the inlet, flood the drainpipe, and subsequently spill into the
beamtube. The intake to the drainpipe must be elevated high enough to reduce the risk for
false actuation. Difficulties may exist if the surface is seriously disturbed by turbulence and
vapor bubbles.
In our reference design, the coolant level rises at a rate of 10 cm/100 K. In Fig 8, the
coolant surface elevation is calculated for unprotected TOP, LOF, and LOHS accidents. Zero
level is the surface elevation at steady-state. The points at which the fuel and the cladding
14

exceed their safety margins are also indicated. For the source transient (UTOP), the surface
rises approximately 10 cm before fuel failure, corresponding to the smallest level change yet
leading to core damage. In a loss-of-flow accident there is a gradual loss of pressure head
why the coolant level actually drops during pump coast-down. The rate at which the coolant
rises can be affected by the geometry of the vessel.
The basic design only relies on the integrity of the components and a moving working
fluid. It does not require signals, external power, moving mechanical parts. In that case, it is
classified as a passive device in category B, in compliance with IAEA’s categorization of
passive systems (IAEA, 1991).
A straightforward method was proposed by Wider, et al. (1999), in which a melt-rupture
disk is installed in the side-wall of the beam tube. The membrane is in contact with the
coolant. Source shutdown is actuated as the disk fails and the vacuum tube is flooded with
coolant.
Another option is to have a liquid, e.g. LBE, completely fill a sealed container of fixed
volume, see Fig 9. The container is placed in thermal contact with the coolant and it is sealed
off to the beamtube by a rupture disk. When excessive pressures occur then the rupture disk
fractures releasing the liquid to the beamtube.
In general, bursting disk devices tend to be less accurate. The burst pressure/temperature
is unpredictable. The problem is accentuated due to ageing and when used in aggressive
conditions. A drawback is that the disk is destroyed in the action, thus eliminating the
possibility of testing the device prior to its installation or when it is in service. In order to
attain a short time response, the disk must be operated close to its bursting point, which
15

increases the possibility for false actuation. Passive safety based on bursting disk devices is
classified in category C, in accordance with IAEA regulation.
Beam chambers typically require high vacuums and chemically clean surfaces to prevent
proton interaction with trapped gas. Filling the beamtube with coolant may cause serious
contamination of the accelerator tunnel. One option is to install a second beam window at the
top of the tube to separate the beamtube from the accelerator tunnel. If the passive system
provokes a shutdown, it may require replacing the beamtube, however, it is likely the plant
needs correction anyhow, to assure its integrity and to reinstate the original safety function.
In that perspective, filling of the beam tube could possibly serve as a last resort. False
actuation, however, must be eliminated.
7.2. Alternative methods
In most pre-conceptual ADS designs, the beam is subject to some bending action before
entering the vessel. Bending of a charged particle beam is normally carried out by magnets.
In principle, a bending magnet could serve as an on/off switch for the external source. If the
magnet is de-energized, the beam would safely end-up in a beamstop, otherwise the beam is
diverted to the target.
For such a device switching is necessary, e.g. an electrical circuit must open/close, which
limits the safety level achievable by this principle. Preferably, the passive switch is of a fail-
safe type, i.e. unless connection is established the magnet is off. Possible agencies for
actuating such a switch include:
- A ferromagnetic Curie-point-operated device. Above the Curie temperature, the
magnetization of a permanent magnet vanishes. Such a device could either be used for
switching or in lock-release function acting on safety rods. Similar devices showed
16

considerable promise for application in self-actuated shutdown systems in liquid-metal fast
breeder reactors (Sowa, et al., 1976). The Curie temperature of carbon steel is 1043 K.
- Elongation of a metal rod that is submerged in the coolant or bending of a bi-metallic
component could be used as a temperature-sensitive switch.
- Rising coolant levels could elevate a float device that is connected to an electrical circuit.
Alternatively, the medium itself could act as conductor and establish connection.
- Pressure build-up in the cover gas region (or some other compartment), due to thermal
expansion of the medium could actuate a switch that operates at a predetermined pressure. A
weighted lever or a spring could set the limiting pressure. Alternatively, thermal expansion of
a fixed mass of a fluid (LBE) in a confined space could perform a similar task.
- A generator that is connected to the coolant flow may supply power to the bending magnet.
The generator may be driven by mechanical forces or as a reversed electromagnetic pump.
However, the drawbacks include, obstruction of flow in a free-convection mode, need for
significant pumping power, and lack of temperature feedback.
- Liquid metal coolants feature temperature-dependent resistivity. Increasing the temperature
will increase the resistivity. Resistivity rising above a limiting value could trigger an
electrical or magnetic switch.
8. Conclusions
The applicability for passive safety to accelerator-driven systems was studied. The current
study focused on means for inherent shutdown. The usefulness for reactivity feedbacks was
evaluated and some schemes for inherent source shutdown were suggested.
17

It seems that inherent shutdown based solely on reactivity feedbacks is fruitless in
accelerator-driven systems. Inherent shutdown must be reinforced by other means. It was
shown that increasing the Doppler effect, by introducing massive amounts of fertile material,
have limited effect on transients that remain in the subcritical state. Doppler feedback may be
important for accidents exceeding criticality. The significance of reactivity feedbacks, in
general, depends on the specific design and in particular on the choice of the subcritical level.
Taking advantage of reactivity feedbacks calls for a careful balance between the desired
feedback performance and the subcritical margin.
Safety analysis indicated that transient overpower accidents, caused by insertion of the
maximum beam power, is likely to exert the fastest transients conceivable in an ADS. In that
perspective, source transients have profound impact on the requirements for a shutdown
device. Safety-by-design principles must be utilized to assure protection to source transients.
Some concepts to accomplish passive source shutdown were presented. Two methods that
seek to block the beam by filling the beamtube with coolant were proposed. Actuation is
caused by thermal expansion of coolant. Other options include shutdown of beam bending
magnets or insertion of shutdown rods by passive means.
Shutdown of the beam by passive means can provide an important additional safety
feature for accelerator-driven systems. Such systems may contribute significantly to the
reliability of the overall plant protection system. At this point, however, considering the
premature nature and the lack of experimental validation, further work is necessary in order
to determine the practicability of the present design concepts.
18

9. Acknowledgments
Sincere appreciation is expressed to the SKB AB and The Swedish Center for Nuclear
Technology who financially supported the project.
References
Cahalan, J. E., Tentner, A. M., Morris, E. E., 1994. Advanced LMR safety anlaysis
capabilities in the SASSYS-1 and SAS4A computer codes. Proc. of the International Topical
Meeting on Advanced Reactors Safety, Pittsburgh.
Sowa, E. S., et al., 1976. LMFBR self-actuated shutdown systems. Volume II. Proc. of the
international meeting of fast reactor safety and related physics, Chicago.
Gonzalez, E., et al., 2000. Transuranics on fertile and inert matrix lead-bismuth cooled ADS.
6th Information Meeting on Actinide and Fission Product Partioning & Transmutation,
Madrid.
Hill, R. N., Cahalan, J. E., Khalil, H. S., Wade, D. C., 1999. Development of small, fast
reactor core designs using lead-based coolant. Proc. International Conf. On Future Nucl.
Energy Systems, GLOBAL’99, Jackson Hole.
Hill, R., Kahlil, H., 2000. Physics studies for a Na-cooled ATW design. IAEA Technical
Committee Meeting on Core Physics and Engineering Aspects of Emerging Nuclear Energy
Systems for Energy Generation and Transmutation, Argonne.
Hummel, H. H., Okrent, D., 1978. Reactivity coefficients in large fast power reactors.
Chapter 5. Publ. by American Nuclear Society.
Hunter, C. W., Fish, R. L., Holmes, J. J., 1975. Mechanical properties of unirradiated fast
reactor cladding during simulated overpower transients. Nucl. Technol. 27(3), pp. 376-388
(Nov 1975).
IAEA, 1991. Safety related terms for advanced nuclear power plants. TECDOC-626.
19

Karlsson, J., Wider, H., 2000. New aspects of emergency decay heat removal from a Pb/Bi-
cooled ADS by auxiliary cooling. Proc. of ICONE 8, 8th Int. Conf. on Nuclear Engineering,
Baltimore.
Lucoff, D. M., Waltar, A. E., Sackett, J. I., Aizawa, K., 1992. Experimental and design
experience with passive safety features of liquid metal reactors. Int. Conf. on Design and
Safety of Advanced Nuclear Power Plants, Tokyo.
Maschek, W., Rineiski, A., Morita, K., Muhling, G., Flad, M., 2000. Safety analysis for ADS
cores with dedicated fuel and proposals for safety improvements. Proc. IAEA Technical
Committee Meeting on Core Physics and Engineering Aspects of Emerging Nuclear Energy
Systems for Energy Generation and Transmutation, Argonne.
Maschek, W., Thiem, D., Heusener, G., 1999. Safety features of a reactor core with minor
actinide transmutation and burning capabilities. Proc. International Conf. On Future Nucl.
Energy Systems, GLOBAL’99, Jackson Hole.
Novikova, N., Pashkin, Y., Chekunov, V., 1999. Some features of sub-critical blankets
cooled with lead-Bismuth. Proc. Int. Conf. Accelerator-driven Technologies and
Applications, ADTTA’99, Praha.
Rubbia, C., et al., 1995. Conceptual design of a fast neutron operated energy amplifier. Cern
publication, CERN/AT/95-44.
Suzuki, Y., Arai, Y., 1998. Thermophysical and thermodynamic properties of actinide
mononitrides and their solid solutions. J. Alloys Comp. 271-273 (1998) 577-582.
Takano, M., et al., 1999. Synthesis of americium mononitride by carbothermic reduction
method. Proc. International Conf. on Future Nucl. Energy Systems, GLOBAL’99, ANS,
Jackson Hole.
Tommasi, J., Massara, S., 1999. L.M.F.R dedicated cored for transmutation critical vs.
subcritical systems comparison. Proc. International Conf. On Future Nucl. Energy Systems,
GLOBAL’99, Jackson Hole.
20

Tûcek, K., Wallenius, J., Gudowski, W., 2001. Source efficiency in an accelerator-driven
system with burnable absorbers. GLOBAL 2001, Int. conf. on the back-end of the fuel Cycle:
from research to solutions, Paris.
Wallenius, J., Tucek, K., Carlsson, J., Gudowski, W., 2001. Application of burnable
absorbers in an accelerator-driven system. Nucl. Sci. Eng. 137, 96-106.
Wallenius, J., Tucek, K., Eriksson, M., Gudowski, W., 2001. The Sing Sing Core: a sub-
critical TRU burner with low reactivity losses. Proc. Int. Conf. Accelerator
Applications/Accelerator Driven Transmutation Technology and Applications ’01.
AccApp/ADTTA '01, Reno.
Wider, H., Karlsson, J., Jones, A. V., Safety considerations of heavy metal-cooled
accelerator-driven systems. Proc. International Conf. On Future Nucl. Energy Systems,
GLOBAL’99, Jackson Hole.
Yang, W. S.., Khalil, H. S., 2000. Reduction in burnup reactivity loss in accelerator driven
transmutation systems. Proc. of the 4th Topical Meeting on Nuclear Applications of
Accelerator Technology, Washington.
21

Table 1. Reference ADS design parameters Core power, MWth 800 Coolant LBE Core inlet temperature, K 573 Core outlet temperature, K 702 Flow velocity, m/s 2.50 Volume hot pool, m3 435 Volume cold pool, m3 197 Volume inlet plenum, m3 20 Fuel composition (core average) Nitrides:
12%MA/73%Pu/ 15%U238
Inner radius, mm 1.00 Outer radius, mm 2.40 Cladding HT-9 Inner radius, mm 2.49 Outer radius, mm 2.94 P/D 1.83 and 2.33 keff eigenvalue, BOL, steady-state 0.954 βeff, % 0.100 Doppler constant, Tfdk/dTf -3.87⋅10-4 Coolant density reactivity feedback, dk/dTc -2.28⋅10-6
22

M
STEAMGENERATOR
x 4
PRIMARYPUMP
(CENTRIFUGAL)x 4
10.0 m
15.0
m
-4.0 m (BOTTOM OF VESSEL)
-1.5 m (OUTLET COLD LEG)
-1.0 m (CORE INLET)
0 m (BOTTOM FUEL SECTION)
+3.0 m (CORE OUTLET)
+1.0 m (PUMP OUTLET)
+8.0 m (INLET STEAM GENERATOR)
BEAMTUBE
COLD POOL(COMPRESSIBLE VOLUME 3)
HOT POOL
INLET PLENUM(COMPRESSIBLE VOLUME 1)
OUTLET PLENUM(COMPRESSIBLE VOLUME 2)
CORE
COLD LEG
+4.0 m (PUMP INLET + OUTLETSTEAM GENERATOR)
+6.0 m (THERMAL CENTER OF STEAMGENERATOR)
+9.0 m (COVER GAS LEVEL)
+11.0 m (TOP OF VESSEL)
CORE SUPPORT STRUCTURE
Fig 1. Primary circuit of reference ADS design
23

1,0
1,1
1,21,3
1,4
1,5
1,61,7
1,8
1,9
0 100 200 300 400 500 600 700 800 900 1000Time [s]
No feedbackk_eff=0.954 (ref.)k_eff=0.980k_eff=0.995k_eff=0.9995No
rmali
zed r
eacto
r pow
er
Fig 2. Impact of reactivity feedbacks in a source-driven system. Accident initiator by sudden increase in source intensity (S=1.8*S0). Subcriticality is a parameter.
24

Table 2. List of Doppler constants in various LMR designs Case Tdk/dT Fuel compositionCoolant Comment Reference 1 -3.87⋅10-4 (U0.1Pu0.7MA0.2) PbBi Mostly MA
and Pu Present design
2 -1.50·10-4 (Pu0.5MA0.5) Pb Very hard spectrum
Tommasi and Massara, (1999)
3 -2.03⋅10-3 (Pu0.5MA0.5) Pb Added moderator
Tommasi and Massara, (1999)
4 -1.63⋅10-3 (U0.8Pu0.2) PbBi Compact design
Hill, et al. (1999)
5 -2.71⋅10-3 (U0.9Pu0.1) PbBi Derated design
Hill, et al. (1999)
6 -4.89·10-3 (U0.9Pu0.1) Na Derated design
Hill, et al. (1999)
25

1,01,11,21,31,41,51,61,71,81,9
0 100 200 300 400 500 600 700 800 900 1000Time [s]
Dedicated fuel (Tdk/dT=-3.87e-4)Fertile fuel (Tdk/dT=-2.71e-3)Tdk/dT 3 87 4
keff=0.954 (ref.)
keff=0.9995
Norm
alize
d rea
ctor p
ower keff=0.954
keff=0.9995
Fig 3. Issue of enhancing the Doppler effect in ADS’s. Lower Doppler value representing a dedicated core, higher Doppler value representing a core containing a large fraction of 238U. Two different subcritical levels are considered. Accident initiator by sudden increase in source intensity (S=1.8*S0).
26

Table 3. List of failure temperatures for the reference design. Failure mechanism
Failure temperature Comment
Dissociation of AmN.
1573 K Conservative assumption (Takano, et al., 1999).
Cladding burst temperature
1333 K 20% CW SS316, 5.56 °C/sec, hoop stress 100 MPa. (Hunter, et al., 1975).
Cladding/ coolant corrosion
946 K Extended operation (Novikova, et al., 1999).
27

1100
1300
1500
1700
1900
2100
0 100 200 300 400 500 600 700 800 900 1000Time [s]
UTOPULOFULOHSF l f il
Peak
fuel
tempe
ratur
e [K]
Fuel failure margin
Fig 4. Peak fuel temperatures in Unprotected TOP, LOF, and LOHS.
28

800
1000
1200
1400
1600
0 100 200 300 400 500 600 700 800 900 1000Time [s]
UTOPULOFULOHSCl ddi
Peak
clad
ding t
empe
ratur
e [K]
Cladding failure margin
Fig 5. Peak cladding temperature in Unprotected TOP, LOF, and LOHS.
29

600
800
1000
1200
1400
0 100 200 300 400 500 600 700 800 900 1000Time [s]
UTOPULOFULOHS
Coola
nt tem
pera
ture h
ot po
ol [K
]
Fig 6. Coolant temperature in the hot pool.
30

Table 4. Plant control system strategy Control system Classification Action
Regulating system Active Source regulation. Online usage during normal operation.
Plant Protection System (PPS)
Active Beam/source shutdown. Actuated in an off-normal event.
Passive shutdown system
Passive Source shutdown. Actuated when PPS malfunctions.
31

Cover gas ~1 atm
BeampipeDrainpipe
Liquid LBE
Fig 7. Basic scheme for filling the beamtube with coolant through a U tube. Concept relies on a working moving fluid (Class B device)
32

-10
0
10
20
30
40
50
0 100 200 300 400 500 600 700 800 900 1000Time [s]
Coola
nt lev
el ris
e [cm
]Fuel failure (1573 K)Cladding failure (1333 K)
ULOF
ULOHS
UTOP
Fig 8. Rise of coolant level in hot pool in unprotected accidents.
33

Beampipe
Liquid LBE
Rupture disk
Sealed container
Fig 9. Scheme for filling the beamtube using a pressurized container. Concept relies on a bursting disk device (Class C device).
34

APPENDIX II M. Eriksson and J. Cahalan, “Applicability of Passive Safety to Accelerator-driven Systems,” AccApp/ADTTA '01, American Nuclear Society Winter Meeting 2001, Reno, November, 2001.

AccApp/ADTTA’ 01
Applicability of Passive Safety to Acc
M. Eriksson* Royal Institute of Technology, Stockholm Center for Ph
Dep. Nuclear & Reactor Physics, 10691
and
J. E. Cahalan Argonne National Laboratory, Reactor Analy
9700 South Cass Ave., IL 60
Abstract - We examine the use of reactivity feedbacks as adriven systems (ADS). In particular, we evaluate the potereactivity feedback in a subcritical core dedicated for tracharacteristics of a source-driven system, it is necessary torder to achieve passive shutdown capability. Conceptual dare suggested. Operating characteristics is obtained by studsubject to a set of typical accident initiators. It is shown thatorder to protect against accident initiators that appear appropriate burnup control strategy plays a key role in that e
I. INTRODUCTION
In the design process of advanced reactors, major consideration is given to the utilization of passive safety systems and inherent safety features. There is a consensus among reactor designers, supporting the value of passive safety designs. Passive safety systems rely on natural physical phenomena, such as thermal expansion, fundamental nuclear properties, gravity, and heat-transfer by natural convection, to perform essential safety functions. In case of an emergency, the plant would not require the action of any mechanical or electrical device, making safety functions less dependent on active components. The incentives for employing such designs are improved reliability and simplified operation, both resulting in better safety performance. Inherent features are valuable means for minimizing public concern and gaining public perception on new reactor concepts.
Most work on passive safety in the past has been related to study the innovative use of natural convection, decay heat removal, and inherent negative reactivity feedbacks. Such schemes have been successfully implemented in many reactor designs, including water-cooled reactors, gas-cooled reactors, and liquid metal-cooled reactors.
Imechan iconvreactcharaattenWe edevicthat p
ASASneutrSASand deveextenthe Erecenusedpropevalu
*E-mail: [email protected]
elerator-driven Systems
ysics, Astronomy and Biotechnology, Stockholm, Sweden.
sis & Engineering Division 439, USA.
means for passive safety in accelerator-ntial for inherent shutdown by Doppler nsmutation of waste. Given the dynamic o manage the external neutron source in esigns of self-actuated shutdown devices ying the performance of a reference ADS maximum beam output must be limited in to be achievable in ADS. Utilizing an ffort.
n this paper, we explore the use of passive safety anisms to accelerator-driven systems (ADS). While
ntrinsic heat-transport path and sufficient natural ection are necessary to achieve passive safety in any or system, those requirements are of general cter and are treated elsewhere, e.g. [1]. Our tion is focused on inherent shutdown capabilities. valuate the applicability of self-actuated shutdown es and we suggest some actual design concepts for urpose.
II. REFERENCE DESIGN & MODELLING
ccident analysis is performed with the aid of the 4A safety code [2]. The thermal, hydraulic, onic, and mechanical models employed in the 4A computer code were formulated, implemented,
validated in the U.S. liquid metal reactor lopment program. These models have been sively validated with experimental test data from BR-II, FFTF, and TREAT reactors [3][4][5]. More tly, the coolant thermophysical property database
in SAS4A has been extended to include the erties of lead and lead-bismuth eutectic, based on ations of available U.S. and Russian experimental
1

data [6][7]. Validation of the SAS4A coolant hydraulics models with heavy liquid metal coolants will require the availability of prototypic reactor test data. It is judged that the combination of experimentally based coolant thermophysical property data with the already validated, first-principles coolant thermal-hydraulics models in SAS4A provides a satisfactory basis for conceptual design basis analysis.
In the assessment, we employ a reference design of an ADS to obtain essential data and to verify predictions. The reference design is a model of an ADS that has evolved at the Royal Institute of Technology, Sweden [8][9]. The core has a nominal power of 800 MWth. It is cooled by liquid lead-bismuth eutectic (LBE). The pins are configured in an open pin lattice (P/D=1.83 in inner zones and P/D=2.33 in outer zones). The fuel consists of (core average): 70% plutonium, 15% minor actinides (americium, curium, and neptunium), and 15% uranium. A detailed description of this design is available in the present proceedings [10].
A primary system model is set-up including a detailed multi-channel model of the core, heat exchangers, pumps, compressible pool volumes, etc. Point kinetics is used for calculating transient power. The neutronic response between core regions is strongly coupled and space-time effects may be neglected for our purposes.
III. APPLICABILITY OF INHERENT REACTIVITY FEEDBACKS
Intelligent use of inherent reactivity feedbacks (e.g. Doppler effect, coolant density effect, structural expansion, etc.) has provided excellent safety characteristics to advanced, critical, reactor. In the design process of a new reactor, it is simply good engineering practice to utilize the inherent nuclear properties of the reactor to ensure optimal safety performance. In particular, operating experience and experiments on liquid metal reactors have demonstrated that better use of the inherent nuclear properties may provide a high level of safety even in severe accidents where the shutdown system fails completely [11]. Nowadays, because of design efforts and increased understanding, the safety characteristics of critical, liquid metal reactors, are considered as a principal advantage. In that context, it may seem natural to use a similar strategy for ADS’s. However, a source-driven system does not respond to reactivity feedbacks like a critical reactor. While the critical reactor is sensitive to reactivity feedbacks, the ADS is not. The ADS is largely offset from criticality. The net effect is a substantially reduced sensitivity to reactivity changes. On one hand, this feature is advantageous since it mitigates the consequences of reactivity insertion accidents; on the other hand, it diminishes the practical use of negative reactivity feedbacks as a means for natural safety mechanisms in
accelerator-driven systems. The present paper addresses the latter feature.
To study these features we exposed the reference design to an unprotected transient overpower (UTOP) event. The initiator for the accident is a sudden increase in source-intensity. The intensity of the external neutron source is promptly increased by a factor of 1.8, corresponding to the insertion of maximum beam capacity at begin-of-life. It represents a strong transient, integral power increases by a factor of 1.8 within a few hundred prompt periods. In Fig 1, the effect of subcriticality on the combined reactivity effect from Doppler feedback (Tdk/dT=-3.87×10-4) and coolant density feedback (dk/dT=-2.28×10-6) is illustrated. The unconstrained response, when no feedbacks are accounted for, is also shown to facilitate comparison. The response is calculated for a varying degree of subcriticality, keff=0.954 (reference design), keff=0.98, keff=0.995, and keff=0.9995. Structural reactivity feedback phenomena (e.g. radial and axial core expansion) are not taken into account. Employing more sophisticated feedback models is of little interest for our purpose. Fig 1 clearly demonstrates the resistance of a source-driven system subject to reactivity feedbacks (prompt and delayed feedbacks).
1.0
1.2
1.4
1.6
1.8
0 100 200 300 400 500 600 700 800 900 1000Time [s]
No feedbackk_eff=0.954 (ref.)k_eff=0.980k_eff=0.995k_eff=0.9995No
rmali
zed
reac
tor p
ower
Fig 1. Influence of reactivity feedbacks in a source-driven
system. Accident initiator by sudden increase in source intensity (S=1.8*S0). Subcriticality is a parameter.
The reference ADS (keff=0.954) experiences minor influence from reactivity feedbacks whereas the close-to-critical system (keff=0.9995) exhibits strong feedback effects. Approaching criticality, on the expense of reducing the margin to prompt criticality, results in stronger feedback coupling. The significance of feedback mechanisms in a source-driven system depends on the reactivity worth of these feedbacks, i.e. reactivity coefficients, but more important on the choice of the subcritical level. Thus, taking advantage of reactivity feedbacks calls for a careful balance between the desired feedback performance and the subcritical margin. It is seen, Fig 1, that it is not until we approach a multiplication constant close to keff>0.999 (~1$ below
2

critical) that reactivity feedbacks have a significant influence and possibly could serve as a means for inherent shutdown. The level of subcriticality being suggested for most conceptual ADS’s is at least an order of magnitude larger (typically ~10$ subcritical or keff<0.98-0.99). It is clear that reactivity feedbacks will not be as effective a means in source-driven systems as they are in critical systems. Much stronger reactivity effects, from what is experienced in traditional reactors, are necessary to have an effect on the source-driven system. Therefore, it is not practical to implement reactivity feedbacks, by physics or engineering design, as the sole means to bring an ADS to safe shutdown conditions. Inherent shutdown must be reinforced by other means.
III.A. Doppler Effect
There has been considerable interest on the use of so-called “dedicated” fuels as to achieve maximum transmutation rate in accelerator-driven systems. The dedicated fuels contain large amounts of minor actinides (Np, Am, and Cm) and plutonium, but lack the classical fertile isotopes (i.e. 238U and 232Th). Subsequent deterioration of safety parameters, when using such fuels, is well known [12]. While Doppler broadening of capture resonances is the most important inherent shutdown mechanism in a liquid-metal reactor, the effect is vanishing small in accelerator-driven systems using dedicated fuels. The reduction of the fertile inventory and the spectrum hardness are the main reasons for this impairment [13]. It has been argued that a typical ADS, based on dedicated fuels, contain several critical masses, which in principle provides the potential for criticality if the fuel is rearranged in a more dense configuration. In the absence of Doppler effect, such accidents may occur without any restraining prompt negative reactivity feedback. Provisions for increasing the Doppler effect in dedicated cores have been proposed [14]. In TABLE I, values of the Doppler constant are listed for various heavy-metal cooled reactors. The Doppler constant for a sodium-cooled reactor is also shown.
TABLE I List of Doppler constants in various LMR designs
Case Tdk/dT Fuel Coolant Comment Ref. 1 -3.87⋅10-4 (U0.1Pu0.7MA0.2) PbBi Mostly Pu
and MA Present design
[10] 2 -1.50·10-4 (Pu0.5MA0.5) Pb Very hard
spectrum Tommasi, et al.
[14] 3 -2.03⋅10-3 (Pu0.5MA0.5) Pb Added
moderator Tommasi, et al.
[14] 4 -1.63⋅10-3 (U0.8Pu0.2) PbBi Compact
design Hill, et al. [15]
5 -2.71⋅10-3 (U0.9Pu0.1) PbBi Derated design
Hill, et al. [15]
6 -4.89·10-3 (U0.9Pu0.1) Na Derated design
Hill, et al. [15]
The Doppler constant for the dedicated cores (cases 1 and 2) are an order of magnitude lower than those of the mixed U-Pu fuels (cases 4 and 5) with their large Doppler constant. Tommasi and Massara [14] enhanced the Doppler effect in a fertile-free core by adding some amount of hydrogenated moderator. The Doppler effect obtained in the sodium design (case 6), by Hill, et al. [15], surpasses the Doppler values in the lead-based designs by a factor of two. The argument is that the softer spectrum of the sodium design allows more neutrons to appear in the resonance region. Practically all the Doppler effect occurs below about 25 keV, where cross section variations with temperature are large [16].
We have investigated the merits; in terms of safety performance, for enhancing the Doppler effect in an ADS. By explicitly taking into account the Doppler feedback, we studied the response following a sudden “source jump” (same as previous transient). The source transient was chosen because it results in high fuel temperatures, which is the driver for reactivity input by Doppler effect. Different values for the Doppler constant were modeled, Tdk/dT=-3.87×10-4 and Tdk/dT=-2.71×10-3, representing a core containing dedicated fuels and a core containing large amounts of fertile fuel, respectively. The results are presented in Fig 2.
1.0
1.2
1.4
1.6
1.8
0 100 200 300 400 500 600 700 800 900 1000Time [s]
Dedicated fuel (Tdk/dT=-3.87e-4)Fertile fuel (Tdk/dT=-2.71e-3)
keff=0.954 (ref.)
keff=0.9995
Norm
alize
d re
acto
r pow
er keff=0.954
keff=0.9995
Fig 2. Dynamics effects of Doppler feedback in source-
driven systems. Two different subcritical levels are considered. Accident initiator by sudden increase in source intensity (S=1.8*S0).
The Doppler effect has negligible influence on the dynamics of a subcritical assembly with a multiplication constant of keff=0.954 and a core loaded with dedicated fuel. Even when the Doppler constant is increased by a factor of seven, by introducing massive amounts of fertile material, the actual gain in safety performance is small. There seems to be little benefit for increasing the Doppler effect in an effort to obtain a more benign response to accidents that remain in the subcritical state. In general, the importance of Doppler feedback in an ADS is strongly related to the level of subcriticality. There is no doubt that the Doppler effect is of great value if the system is close-to-critical, see Fig 2 (keff=0.9995). It is
3

the chief limiting safety mechanism in supercritical excursions. In that perspective, the Doppler effect must not be excluded as an important safety means in source-driven systems. The role of Doppler feedback in hypothetical accidents exceeding the critical margin must be further investigated.
IV. TIME RESPONSE
The thermal response in core structures and the time to reach failure under various accidents influences the requirements on the shutdown device. Knowledge of the grace period is essential in the evaluation of such devices. The plant must survive long enough that a passive safety action can be initiated in time to prevent core damage.
The numerical value of the grace period is necessarily specific to the particular design and is of less interest, but the time responses of accidents. Our intention is to study the transient response in order to assess the requirements on the shutdown system and to evaluate possible actions to enhance the safety performance. We may express response times defined by time constants rather than by absolute values, which has broader range of applicability.
We subjected our reference design to three representative sequences of unprotected (i.e. no shutdown or plant protection system action) accidents, namely:
a) Unprotected transient overpower (UTOP) by a prompt insertion of maximum beam power. It is assumed that the steam generators remove heat at a rate of nominal power (=constant temperature drop in steam generators).
b) Unprotected loss-of-flow (ULOF) by a loss of primary pump power. Feed-water flow is assumed to remain at its initial value and coolant inlet temperature is constant (=constant outlet temperature in steam generator).
c) Unprotected loss-of-heat-sink (ULOHS) by a sudden inability of the steam generators to remove heat (=zero temperature drop in steam generators).
Constant steam generator boundary conditions are assumed. The actual boundary condition depends on the particular accident (see above). In Fig 3 peak fuel temperatures are displayed as a function of time. Cladding temperatures were calculated, but turned out to be less serious and is not included in this paper.
1100
1300
1500
1700
1900
2100
0 100 200 300 400 500 600 700 800 900 1000Time [s]
UTOPULOFULOHS
Peak
fuel
tem
pera
ture
[K]
Fig 3. Peak fuel temperatures in Unprotected TOP, LOF,
and LOHS.
In the source transient (UTOP), the power “jumps” by a factor of 1.8, see previous Fig 1. Since no time is required for heat flow, the fuel suffers a rapid, almost adiabatic thermal excursion, Fig 3. Coolant and structure are heated at a rate determined by the characteristic time constant of the fuel element. The fuel itself, has the shortest time response and is most sensitive to source transients. After a few seconds, the fuel pins have adjusted to the new power level and temperatures temporarily settle in a quasi-stationary level (not visible in the figure). For an extended period (~30 seconds in present design), mainly determined by the primary loop circulation time and the coolant heat capacity, the coolant inlet temperature remains at its initial value. The steam generators are assumed to remove heat at a rate of nominal power, resulting in a mismatch in the heat production and heat removal as the accident proceeds. The net effect is increasing inlet temperature, which causes the reactor core, coolant, and other components to overheat, inevitably leading to core damage unless the reactor is shut down.
In the loss-of-flow (ULOF) accident, core heat-up occurs at a rate determined by the flow coast-down. Inertial forces help to push coolant through the primary system for an extended period. Peak temperatures occur as the pump impeller comes to a complete rest. Core temperatures and buoyancy forces eventually balance. In the asymptotic state, flow is sustained by natural convection alone. Reactivity feedbacks have negligible effect on the transient. For this particular system, an unprotected loss-of-flow accident should result in little or no damage. The integrity of the fuel and the cladding is not compromised. The protective oxide film layer on the cladding may suffer some damage that potentially could harm the cladding in the long run.
The loss-of-heat-sink (ULOHS) accident tends to be a more slowly evolving accident than the source transient and the loss-of-flow accident. The accident manifests as rising inlet temperature, which accompanies loss of primary heat sink. Response time is determined by the
4

primary loop circulation time and coolant heat capacity. The prolonged grace period in a ULOHS accident facilitates successful performance of the safety system. Core damage is inevitable unless safety measures are taken to shut down the reactor.
In Fig 4, the thermal response of the coolant in the hot pool is displayed. The coolant temperature is an important safety system parameter since it is related to the heat production in the core. It can be used to sense power excursions and reduction in coolant flow rate. Most likely, an inherent shutdown device will be actuated by the coolant temperature some way or the other.
600
800
1000
1200
1400
0 100 200 300 400 500 600 700 800 900 1000Time [s]
UTOPULOFULOHS
Coola
nt te
mper
atur
e ho
t poo
l [K]
Fig 4. Average coolant temperature in the hot pool.
The thermal response of the coolant in the hot pool following a change in power or flow is delayed by the heat capacity of the coolant and transport lags. Therefore, it must be ascertained whether the time response of the coolant is sufficient to serve as an accident indicator and protect against the fastest transients conceivable in an ADS. Rapid coolant response is advantageous since it promotes prompt action of the safety system. In general, UTOP caused by insertion of maximum beam power, is likely to exert the fastest transient. The absence of any moveable control rods, that may rather quickly add or remove large amounts of reactivity, diminishes the potential for fast transients caused by reactivity insertion. Significant reactivity is potentially available in core compaction or voiding phenomenon, but such sequences stretch over a longer period. It is noticeable in Fig 4, that the initial response (<200 seconds) is identical for all transients. However, source transients introduce the shortest grace period (with respect to fuel damage), see Fig 3, while the temperature rise in the coolant is modest. In that sense, source transients impose the highest demands on a passive device that relies on the thermal response of the coolant.
V. AN APPROACH TO INHERENT SHUTDOWN
Compared to reactivity changes, variations in source strength or source importance have a strong influence on the ADS. The power is linearly proportional to the source, 10% reduction in source strength yields 10%
reduction of power, and so on. Shutdown of the external source effectively halts the fission process in the entire core.
Our approach is to design a passive system for the primary purpose to shut down the source in an emergency. It should be recognized that system redundancy makes the assumption of failure of the active plant protection system highly unlikely. In fact, actual activation of the passive shutdown system must be regarded as hypothetical. Indeed, it affects the design requirements on the device.
The shutdown system must be capable of halting the external source before excessive temperatures are obtained. This may be accomplished by reducing the time required for the shutdown system to act and by limiting the speed of the temperature rise by design considerations. As mentioned previously, the fastest credible transient in an ADS is a source insertion transient. Worst conditions occur when maximum beam power is inserted in a step fashion at begin-of-life. Source transients result in a rapid, but bounded power excursion. Consequently, it is unsafe to rely on a safety system to assure protection in the early phase of a source transient. Instead, protection must be accomplished through safety-by-design principles, e.g. minimizing the beam output capability by utilizing an appropriate burnup control strategy. While the speed of the beam controller may be limited by fundamental means, the capacity of the accelerator (maximum beam power) is dictated by reactivity losses governed by fuel burnup. Various options exist, for example, shorter irradiation-cycle time and multi-batch fuel loading strategy [17], lower power density and higher transuranic inventory [18], optimal distribution of plutonium and minor actinides [19], use of burnable absorbers [8]. Safety-by-design relaxes the requirements on the shutdown system.
In UTOP and ULOHS accidents, the grace period may be prolonged by the primary loop circulation time and the coolant heat capacity. We studied the benefits of increasing the coolant inventory. Results are summarized in TABLE II. In effect, 10% more coolant resulted in ~10% longer grace period, and so on. Typical accidents where the coolant inventory has an appreciable effect on the thermal response involve situations when there is a net change in internal energy (primary system). Loss-of-flow accidents do not necessarily involve any accumulation of internal energy in the primary system, as the heat-removal rate in the steam-generators may be unaffected. For loss-of-flow transients, the initial response is determined by the flow coast-down. It may be influenced by changing the moment of inertia of the pump and by increasing natural convection.
5

TABLE II
Lengthening of the grace period corresponding to a certain increase in coolant inventory. The slash separates fuel failure
from cladding failure.
Coolant inventory
Grace period TOP
Grace period LOHS
+10% +12% / +11% +12% / +12%
+50% +56% / +57% +57% / +58%
Taking these circumstances in consideration, our approach is to prolong grace periods, increase safety margins, and utilize safety-by-design principles, all easing the demands on the safety system. Prolonged grace periods do not only improve our chances for successful safety performance but reduces the probability for false actuation and interference of the passive system during normal operation. The second objective, in order to achieve high reliability, is to design simple, redundant and diverse shutdown systems, and to use components of proven high reliability. Greater complexity generally means reduced reliability.
VI. INHERENT SHUTDOWN MECHANISMS In this section, we suggest some concepts for
inherent beam shutdown. The intention is to demonstrate the basic working principle.
VI.A. Flooding of the beam tube Shutdown of the external source may be
accomplished by flooding the beamtube with coolant. The main purpose for filling the beamtube is to shift the axial position of beam impact, which in principle reduces the importance of source neutrons [9]. Actuation may be based on thermal expansion of coolant [20] or use of bursting disk devices [21]. Several authors have proposed designs that utilize such principles.
To fill the beamtube, we suggest installing a drainpipe in the shape of a U tube. One side of the U tube is open to the cover gas region while the other side is connected to the beamtube. A portion of the coolant is retained in the U bend, forming a liquid seal that separates the beamtube from the cover gas region. The drainpipe is in thermal contact with the coolant. A liquid column is supported by the pressure difference. A pressure difference of 1 atm is equivalent to a column height of LBE of 1 m (11 m for sodium). The inlet is located at a certain height above the surface. As the coolant expands, it would rise to the inlet, flood the drainpipe, and subsequently spill into the beamtube. The intake to the drainpipe must be elevated high enough to reduce the risk for false actuation. Difficulties may exist if the surface is seriously disturbed by turbulence and vapor bubbles. The conceptual design only relies on the integrity of the components and a moving working fluid. It does not require signals, external power, or moving mechanical parts. In that case, it is classified as a passive device in category B, in compliance with IAEA’s categorization of passive systems [22].
In our reference design, the coolant level rises at a rate of 10 cm/100 K. For the source transient (UTOP), the surface rises approximately 10 cm before fuel failure, corresponding to the smallest change in coolant level (in comparison with ULOF and ULOHS) yet leading to fuel damage. The rate at which the coolant rises can be affected by the geometry of the vessel.
Beam chambers typically require high vacuums and chemically clean surfaces to prevent proton interaction with trapped gas. Filling the beamtube with coolant may cause serious contamination of the accelerator tunnel. One option is to install a second beam window at the top of the tube to separate the beamtube from the accelerator tunnel. If the passive system provokes a shutdown, it may require replacing the beamtube, however, it is likely the plant needs correction anyhow, to assure its integrity and to reinstate the original safety function. In that perspective, filling of the beam tube could possibly serve as a last resort. False actuation, however, must be eliminated.
VI.B. Alternative methods
In most pre-conceptual ADS designs, the beam is subject to some bending action before entering the vessel. Bending of a charged particle beam is normally carried out by magnets. In principle, a bending magnet could serve as an on/off switch for the external source. If the magnet is de-energized, the beam would safely end-up in a beamstop, otherwise the beam is diverted to the target.
For such a device switching is necessary, e.g. an electrical circuit must open/close, which limits the safety level achievable by this principle (IAEA Class D device). Preferably, the passive switch is of a fail-safe type, i.e. unless connection is established the magnet is off. Possible agencies for actuating such a switch include: a) A ferromagnetic Curie-point-operated device. Above
the Curie temperature, the magnetization of a permanent magnet vanishes. Such a device could either be used for switching or in lock-release function acting on safety rods. Similar devices showed considerable promise for application in self-actuated shutdown systems in liquid-metal fast breeder reactors [23]. The Curie temperature of carbon steel is 1043 K.
b) Pressure build-up in the cover gas region (or some other compartment), due to thermal expansion of the medium could actuate a switch that operates at a predetermined pressure. A weighted lever or a spring could set the limiting pressure. Alternatively, thermal expansion of a fixed mass of a fluid (LBE) in a confined space could perform a similar task.
c) Liquid metal coolants feature temperature-dependent resistivity. Increasing the temperature lead to higher resistivity. Resistivity rising above a limiting value could trigger an electrical or magnetic switch.
6

VII. CONCLUSIONS
The applicability for passive safety to accelerator-driven systems was studied. The current study focused on means for inherent shutdown. The usefulness for reactivity feedbacks was evaluated and some schemes for inherent source shutdown were suggested.
It seems that inherent shutdown based solely on reactivity feedbacks is fruitless in accelerator-driven systems. Inherent shutdown must be reinforced by other means. It was shown that increasing the Doppler effect, by introducing massive amounts of fertile material, have limited effect on transients that remain in the subcritical state. Doppler feedback may be important for accidents exceeding criticality. The significance of reactivity feedbacks, in general, depends on the specific design and in particular on the choice of the subcritical level. Taking advantage of reactivity feedbacks calls for a careful balance between the desired feedback performance and the subcritical margin.
Safety analysis indicate that transient overpower accidents, caused by insertion of the maximum beam power, is likely to exert the fastest transients conceivable in an ADS. In that perspective, source transients have profound impact on the requirements for a shutdown device. Safety-by-design principles must be utilized to assure protection to source transients.
Some concepts to accomplish passive source shutdown were presented. A method that seeks to block the beam by filling the beamtube with coolant were proposed. Actuation is caused by thermal expansion of coolant. Other options include shutdown of beam bending magnets or insertion of shutdown rods by passive means, e.g. ferromagnetic Curie-point-operated device.
Shutdown of the beam by passive means can provide an important additional safety feature for accelerator-driven systems. Such systems may contribute significantly to the reliability of the overall plant protection system. At this point, however, considering the premature nature and the lack of experimental validation, further work is necessary in order to determine the practicability of the present design concepts.
ACKNOWLEDGMENTS
Sincere appreciation is expressed to Svensk Kärnbränslehantering AB and the Swedish Center for Nuclear Technology who financially supported the project.
REFERENCES
1. J. KARLSSON and H. WIDER, “New Aspects of Emergency Decay Heat Removal from a Pb/Bi-cooled ADS by Auxiliary Cooling,” Proc. of ICONE 8, 8th Int.
Conf. on Nuclear Engineering, Baltimore, Apr. 2-6 (2000).
2. J. E. Cahalan, A. M. TENTNER, and E. E. MORRIS, “Advanced LMR Safety Anlaysis Capabilities in the SASSYS-1 and SAS4A Computer Codes,” Proc. of the International Topical Meeting on Advanced Reactors Safety, Pittsburgh, Apr. 17-21 (1994).
3. D. J. HILL, "SASSYS Validation Studies," Proc. of the International Topical Meeting on Safety of Next Generation Power Reactors, Seattle, May 1-5, American Nuclear Society (1988).
4. J. P. HERZOG, "SASSYS Validation with the EBR-II Shutdown Heat Removal Tests," Trans. Am. Nucl. Soc., 60, 730 (1989).
5. F. E. DUNN, "Validation of Detailed Thermal Hydraulic Models Used for LMR Safety and for Improvement of Technical Specifications," Proc. of the American Nuclear Society International Topical Meeting on Safety of Operating Reactors, Seattle, Sep. 17-20, American Nuclear Society (1995).
6. R. N. LYON, Ed., "Liquid Metals Handbook," NAVEXOS P-733(Rev.), U.S. Atomic Energy Commission and U.S. Department of the Navy, June (1952).
7. N. A. NIKOL'SKII, et al., "Thermal and Physical Properties of Molten Metalsand Alloys," pp. 1-36, Problem of Heat Transfer, M. A. Mikheev, Ed.,Publishing House of the Academy of Sciences SSSR, Moscow, [Translated as USAEC Report AEC-tr-4511] (1959).
8. J. WALLENIUS, K. TUCEK, J. CARLSSON, and W. GUDOWSKI, “Application of Burnable Absorbers in an Accelerator-Driven System,” Nucl. Sci. Eng., 137, 96 (2001).
9. K. TUCEK, J. WALLENIUS, and W. GUDOWSKI, “Source Efficiency in an Accelerator-driven System with Burnable Absorbers,” Proc. Int. Conf. On: Back-End of the Fuel Cycle: From Research to Solutions, GLOBAL 2001, Paris, Sep 9-13 (2001).
10. J. WALLENIUS, K. TUCEK, M. ERIKSSON, and W. GUDOWSKI, "The Sing Sing Core: a Sub-critical TRU Burner with Low Reactivity Losses," Accelerator Applications/Accelerator Driven Transmutation Technology and Applications ’01 (AccApp/ADTTA '01), Reno, Nov. 12-15 (2001).
11. D. M. LUCOFF, A. E. WALTAR, J. I. SACKETT, and K. AIZAWA, “Experimental and Design Experience with Passive Safety Features of Liquid Metal Reactors,” Proc. Int. Conf. on Design and Safety of Advanced Nuclear Power Plants, Tokyo, Oct. 25-29 (1992).
7

12. W. MASCHEK, A. RINEISKI, K. MORITA, G. MUHLING, and M. FLAD, ”Safety Analysis for ADS Cores with dedicated Fuel and Proposals for Safety Improvements,” Proc. IAEA Technical Committee Meeting on Core Physics and Engineering Aspects of Emerging Nuclear Energy Systems for Energy Generation and Transmutation, Argonne, Nov. 28-Dec. 1 (2000).
13. W. MASCHEK, D. THIEM, and G. HEUSENER, “Safety features of a reactor core with minor actinide transmutation and burning capabilities,” Proc. Int. Conf. On Future Nucl. Energy Systems, GLOBAL 99, ANS (1999).
14. J. TOMMASI and S. MASSARA, “L.M.F.R dedicated cored for transmutation critical vs. subcritical systems comparison,” Proc. Int. Conf. On Future Nucl. Energy Systems, GLOBAL 99, ANS (1999).
15. R. N. HILL, J. E. CAHALAN, H. S. KHALIL, and D. C. WADE, “Development of small, fast reactor core designs using lead-based coolant, “Proc. Int. Conf. On Future Nucl. Energy Systems, GLOBAL 99, ANS (1999).
16. H. H. HUMMEL and D. OKRENT, Reactivity Coefficients in Large Fast Power Reactors, p. 133, American Nuclear Society, Argonne (1978).
17. W. S. YANG and H. S. KHALIL, “Reduction in Burnup Reactivity Loss in Accelerator Driven Transmutation Systems,” Proc. of the 4th Topical Meeting on Nuclear Applications of Accelerator Technology, Washington, Nov. 13-15 (2000).
18. R. HILL and H. KAHLIL, “Physics Studies For A NA-Cooled ATW Design,” Proc. IAEA Technical Committee Meeting on Core Physics and Engineering Aspects of Emerging Nuclear Energy Systems for Energy Generation and Transmutation, Argonne, 28 Nov-1 Dec (2000).
19. E. GONZALEZ, et al., “Transuranics on Fertile and Inert Matrix Lead-Bismuth Cooled ADS,” Proc. 6th Information Meeting on Actinide and Fission Product Partioning & Transmutation, Madrid, Dec. 11-13 (2000).
20. C. RUBBIA, et al., “Conceptual Design of a Fast Neutron Operated Energy Amplifier,” Cern publication, CERN/AT/95-44 (1995).
21. H. U. WIDER, J. KARLSSON, and A. V. JONES, “Safety Considerations of Heavy metal-cooled accelerator-driven systems,” Proc. International Conf. On Future Nucl. Energy Systems, GLOBAL 99, ANS (1999).
22. Safety Related Terms for Advanced Nuclear Power Plants, IAEA, TECDOC-626, Sep. (1991).
23. E. S. SOWA, et al., “LMFBR self-actuated shutdown systems,” Proc. of the international meeting of fast reactor safety and related physics, Volume II, Chicago (1976).
8

APPENDIX III J. Wallenius et al, The European Union CONFIRM project, Proceedings of AccApp/ADTTA01, Reno, Nevada, 2001.

CONFIRM: Collaboration on Nitride Fuel Irradiation and Modelling
J. WalleniusDepartment of Nuclear and Reactor Physics
Royal Institute of TechnologyStockholm Centre for Physics, Astronomy and Biotechnology
S-106 91 Stockholm
Abstract
Uranium free nitride fuels are investigated as a potential fuel applied to wastetransmutation in accelerator driven systems. In the European 5th FP CONFIRM project,four (Pu,Zr)N helium bonded fuel pins will be fabricated at PSI and then irradiated to highburnup at Studsvik in 2003/2004. (Am,Zr)N pellets will be manufactured and characterisedat ITU. In addition, nitride safety analysis and fuel modelling is performed at KTH, AEA-T,CEA and BNFL. In the present contribution, the work program of CONFIRM is reviewed.Some initial results from activities on safety analysis and fuel modelling are also presented.
INTRODUCTION
Implementation of accelerator driven systems (ADS) forthe purpose of burning americium and degradedplutonium may enable a reduction of radio-toxicinventories directed to geological repository by a factorof 100 [Foster74, Delpeche99]. The ADS is supposed tooperate on uranium free fuels, in order to maximiseTRU destruction rates, and thus minimise added costs tothe nuclear fuel cycle induced by ADS operation andrecycling of the higher actinides. The particular choiceof fuel type however remains an open question, sincevery little experience on the performance of uraniumfree fuels exist.
While oxide fuels have an undisputable advantage interms of the vast experience accumulated for LWR andFBR MOX, the poor solubility of plutonium oxide innitric acid appears to require large scale development ofnon-aqeous reprocessing methods, with much smallersecondary waste streams than has been achieved up todate.
Uranium free nitride fuels, on the other hand, appear tobe compatible with the industrialised PUREX process.They further have the advantage of allowing higherlinear ratings than corresponding oxide or metallic fuels.
The lack of data on uranium free nitrides howevernecessitates a significant R&D program before nitridescan be qualified and validated as a suitable ADS fuel.Such programs have been initiated in Japan [Arai99],and recently in the United States [Meyer01]. In Europe,the participants of CONFIRM (Collaboration On NitrideFuel Irradiation and Modelling) have agreed to performa joint research program on uranium free nitride fuels.With the financial support of the European Union thefollowing activities are included in the program:
• Studies on the safety of nitride fuels• Theoretical modelling of fuel performance as
function of pellet and pin design• Fabrication and characterisation of (Pu,Zr)N• Fabrication and characterisation of (Am,Zr)N• Irradiation of (Pu,Zr)N pins up to 10% burnup.
SAFETY OF NITRIDE FUELS
It is known that plutonium nitride decomposes intometal and nitrogen gas at temperatures well below themelting point of PuN. For instance, the formation ofmetal was observed in the irradiation of the NILOC(U,Pu)N pins, which accidentally were operating at amaximum temperature exceeding 1800°C [Blank91].The subsequent loss of nitrogen gas from the core maylead to positive reactivity feedback, as well as buildupof excessive pressures in the reactor vessel. The stabilityof cores operating on nitride fuel therefore has beenquestioned [Umeoka99].
Two experiments to assess the vaporisation behaviourof nitride compounds at high temperatures and highpressures have been conducted at AEA-T. In the first,two samples of UN were heated in sealed tungsten cansup to 2800°C using an RF furnace. Post test analysisshowed that dissociation of the nitride and formation ofliquid uranium had occured in both samples. It could bedetected that a reaction between the liquid uranium andthe tungsten capsule had occured at temperatures of2410°C and 2420°C, respectively. In the secondexperiment, two samples of (U,Zr)N were heated to thesame temperature. There was no indication of any suchreaction or damage to the capsules after the test. Thesolidus and liquidus temperatures for the (U,Zr)Nsamples were determined at 2612 and 2765°Crespectively. These results show that the stability of the

APPENDIX IV
J. Wallenius, S. Pillon, N-15 Requirement for 2nd Stratum ADS Nitride Fuels, Proceedings of AccApp/ADTTA01, Reno, Nevada, 2001.

N-15 Requirement for 2nd Stratum ADS Nitride Fuels
J. WalleniusDepartment of Nuclear and Reactor Physics
Royal Institute of TechnologyStockholm Centre for Physics, Astronomy and Biotechnology
S-106 91 Stockholm
S. PillonDEN/DEC
CEA Cadarache Bât 315F-13108 Saint-Paul-lez-Durance
Abstract
The application of nitride fuels in accelerator driven systems dedicated to wastetransmutation requires use of N-15 enriched nitrogen to suppress C-14 production due to(n,p) reactions on N-14. With C-14 emission rates of the oxide reprocessing plants asreference, we find that 99% N-15 enrichment is sufficient when using nitride fuels for minoractinide transmutation in 2nd stratum accelerator driven systems. Projected costestimations make recycling of N-15 in the fabrication stage mandatory, while recovery ofN-15 from reprocessing does not appear to be necessary.
INTRODUCTION
If one by partitioning and transmutation wishes toreduce the long term radiotoxic inventory directed togeological repositories by a factor of 100 or more,recycling of americium and curium becomes mandatory[1]. As the potential for homogeneous recycling ofhigher actinides in critical reactors is limited [2-4], theDouble Strata fuel cycle was suggested by JAERI [5]. Inthis concept, minor actinide waste from commercialreactors are recycled in dedicated reactors that operateon fuel free from U-238. Due to an decrease in Dopplerfeedback, an increase in void worth and a very smallfraction of delayed neutrons, it is assumed that suchMA-burners should operate in sub-critical mode inorder to meet safety requirements [2,6].
The composition of the fuel to be used in AcceleratorDriven Systems (ADS) dedicated to waste transmutationhas yet to be determined. Possible choices are oxides,nitrides and metals, each one featuring advantages anddrawbacks. In the European research program onpartitioning and transmutation, oxides are regarded asthe preferred option, due to fewer problems related tofabrication and the huge accumulated experience ofoxide fuels taken to high burnup in various fast reactorprograms.
However, since plutonium oxide is not soluble in nitricacid without the use of special catalysts, standardPUREX reprocessing is difficult to apply to uraniumfree oxide fuels. Therefore pyrometallurgical methods
have to be developed for this purpose. Plutonium nitrideon the other hand is soluble in nitric acid, and nitridefuels hence appear to offer a larger flexibility in thechoice of reprocessing methods.
In the European Union CONFIRM program [7],uranium free nitride fuels are explored as a backupoption for application in Accelerator Driven Systems.An important issue to clarify in the present context, isthe enrichment level of N-15 required to avoidexcessive production of C-14 due to (n,p) reactions onN-14. In the present paper, this problem is discussedtaken into account the specific features of the DoubleStrata fuel cycle. First, we calculate the C-14 productionin an ADS typical for the 2nd stratum as function of N-15 enrichment. Then we make an estimation of the totalC-14 production arising from both first and secondstratum of a full P&T scenario. Comparing theproduction rates, we arrive at a value for the N-15enrichment level that will ensure an acceptable increasein C-14 emission from the reprocessing plant due to theuse of nitride fuel in the 2nd stratum.
CARBON-14
C-14 is one of the main contributors to the exposure ofradio-toxicity in the vicinity of reprocessing plants, ascarbon is typically released in the off-stream gas. C-14is mainly produced in (n,p) reactions on N-14, that ispresent as an impurity in oxide fuel as well as incladding and structural material. According to a studymade by BNFL, 4.7% of the dose to the group of
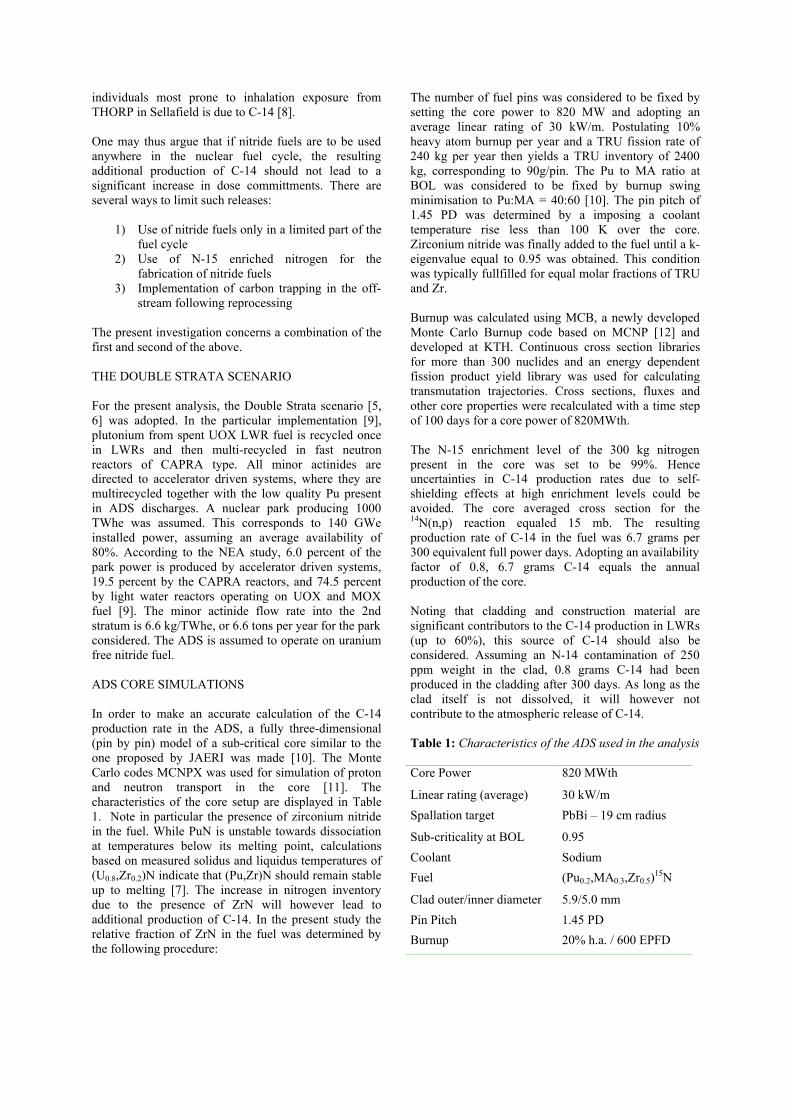
individuals most prone to inhalation exposure fromTHORP in Sellafield is due to C-14 [8].
One may thus argue that if nitride fuels are to be usedanywhere in the nuclear fuel cycle, the resultingadditional production of C-14 should not lead to asignificant increase in dose committments. There areseveral ways to limit such releases:
1) Use of nitride fuels only in a limited part of thefuel cycle
2) Use of N-15 enriched nitrogen for thefabrication of nitride fuels
3) Implementation of carbon trapping in the off-stream following reprocessing
The present investigation concerns a combination of thefirst and second of the above.
THE DOUBLE STRATA SCENARIO
For the present analysis, the Double Strata scenario [5,6] was adopted. In the particular implementation [9],plutonium from spent UOX LWR fuel is recycled oncein LWRs and then multi-recycled in fast neutronreactors of CAPRA type. All minor actinides aredirected to accelerator driven systems, where they aremultirecycled together with the low quality Pu presentin ADS discharges. A nuclear park producing 1000TWhe was assumed. This corresponds to 140 GWeinstalled power, assuming an average availability of80%. According to the NEA study, 6.0 percent of thepark power is produced by accelerator driven systems,19.5 percent by the CAPRA reactors, and 74.5 percentby light water reactors operating on UOX and MOXfuel [9]. The minor actinide flow rate into the 2ndstratum is 6.6 kg/TWhe, or 6.6 tons per year for the parkconsidered. The ADS is assumed to operate on uraniumfree nitride fuel.
ADS CORE SIMULATIONS
In order to make an accurate calculation of the C-14production rate in the ADS, a fully three-dimensional(pin by pin) model of a sub-critical core similar to theone proposed by JAERI was made [10]. The MonteCarlo codes MCNPX was used for simulation of protonand neutron transport in the core [11]. Thecharacteristics of the core setup are displayed in Table1. Note in particular the presence of zirconium nitridein the fuel. While PuN is unstable towards dissociationat temperatures below its melting point, calculationsbased on measured solidus and liquidus temperatures of(U0.8,Zr0.2)N indicate that (Pu,Zr)N should remain stableup to melting [7]. The increase in nitrogen inventorydue to the presence of ZrN will however lead toadditional production of C-14. In the present study therelative fraction of ZrN in the fuel was determined bythe following procedure:
The number of fuel pins was considered to be fixed bysetting the core power to 820 MW and adopting anaverage linear rating of 30 kW/m. Postulating 10%heavy atom burnup per year and a TRU fission rate of240 kg per year then yields a TRU inventory of 2400kg, corresponding to 90g/pin. The Pu to MA ratio atBOL was considered to be fixed by burnup swingminimisation to Pu:MA = 40:60 [10]. The pin pitch of1.45 PD was determined by a imposing a coolanttemperature rise less than 100 K over the core.Zirconium nitride was finally added to the fuel until a k-eigenvalue equal to 0.95 was obtained. This conditionwas typically fullfilled for equal molar fractions of TRUand Zr.
Burnup was calculated using MCB, a newly developedMonte Carlo Burnup code based on MCNP [12] anddeveloped at KTH. Continuous cross section librariesfor more than 300 nuclides and an energy dependentfission product yield library was used for calculatingtransmutation trajectories. Cross sections, fluxes andother core properties were recalculated with a time stepof 100 days for a core power of 820MWth.
The N-15 enrichment level of the 300 kg nitrogenpresent in the core was set to be 99%. Henceuncertainties in C-14 production rates due to self-shielding effects at high enrichment levels could beavoided. The core averaged cross section for the14N(n,p) reaction equaled 15 mb. The resultingproduction rate of C-14 in the fuel was 6.7 grams per300 equivalent full power days. Adopting an availabilityfactor of 0.8, 6.7 grams C-14 equals the annualproduction of the core.
Noting that cladding and construction material aresignificant contributors to the C-14 production in LWRs(up to 60%), this source of C-14 should also beconsidered. Assuming an N-14 contamination of 250ppm weight in the clad, 0.8 grams C-14 had beenproduced in the cladding after 300 days. As long as theclad itself is not dissolved, it will however notcontribute to the atmospheric release of C-14.
Table 1: Characteristics of the ADS used in the analysis
Core Power 820 MWth
Linear rating (average) 30 kW/m
Spallation target PbBi – 19 cm radius
Sub-criticality at BOL 0.95
Coolant Sodium
Fuel (Pu0.2,MA0.3,Zr0.5)15N
Clad outer/inner diameter 5.9/5.0 mm
Pin Pitch 1.45 PD
Burnup 20% h.a. / 600 EPFD

NITRIDES VERSUS OXIDES
With 6.6 tons of Minor Actinides to be managed byaccelerator driven systems (see Figure 1), 28 of theabove ADS cores would be present in the 1000 TWhepark. LWR plutonium is assumed to be needed only forstartup. The annual C-14 production due to the use ofnitride fuel with 99% N-15 enrichment then becomes185 grams.
The release of C-14 from reprocessing of oxide fuelsbeing about 3 g/(GWyear) [13], the contribution of the1st stratum light water reactors amounts to 300 grams
annually. The Pu managing CAPRA reactors provideanother 70 grams, yielding a total C-14 release fromoxide fuels equal to 370 grams.
Introduction of nitride fuels for MA transmutation inADS thus increases releases of C-14 into theatmosphere by about 50%, for an N-15 enrichment levelof 99%. As C-14 from oxide reprocessing provides lessthan five percent of the total inhalated dose to high riskindividuals, one may conclude that this enrichment levelis sufficient to avoid a significant increase in dosecommittments.
Figure 1: Mass flows and C-14 production in the 1000 TWhe nuclear park analysed in thepresent paper. LWRs and Fast Neutron CAPRA reactors use oxide fuels. The ADS is assumedto operate on nitride fuel, where the nitrogen is enriched in N-15.
NITRIDE FABRICATION
Pending calculations of cladding damage, we set thefuel residence time to two years, yielding a final averageburnup of 20 percent heavy atoms. Consequently, 33.2ton of heavy metal needs to be fabricated into ADS fueleach year, demanding 4.2 tons of nitrogen. In existingfabrication lines, an open gas cycle is used forconverting oxides or metals into nitrides, and typicallyabout 99% of the nitrogen supplied is lost. A closed gascycle would therefore have to be implemented.Estimations made at CEA show that about 200 percent
of excess gas inventory could be sufficient in thefabrication of a given amount of nitride. Being a onetime expense (depending on frequency of accidental gaslossses), one could expect a cost penalty of less than 20percent relating to the excess inventory.
N-15 ENRICHMENT
N-15 is today used as a tracer in agronomic and organicindustry. The world wide market is about 20 to 40kilograms annually, and the current cost is about 80euro/g. The supply of several tons per year to the 60

TWhe ADS park, would therefore demand an increasein production capacity by a factor of 100. Accordingly,the specific production cost can be expected to decrease.Estimations made at CEA point towards a price ofapproximately 10 euros per gram, depending on theselected method of fabrication. The total cost for the N-15 supply would then approach 50 million euroannually. This number should be compared to the totalproduction cost for 1000 Twhe in the nuclear park herestudied.
The cost of electricity from LWRs operating on UOXfuel is today well known, and a recent study from theuniversity of Lappenranta predicts a cost of 22keuro/GWhe for a planned reactor block (1.0 – 1.5Gwe) built at an existing reactor site. Currently the priceof LWR MOX is four times that of UOX. Fuelrepresenting 12% of the total cost for the future Finnishreactor, the price for electricity from light water reactorsoperating on a mix of UOX and MOX can be calculatedto 23 Meuro/TWhe.
The cost of fast reactor electricity is less wellestablished. Figures from different studies vary from the30 000 euro/GWhe for the lead cooled BREST-1200reactor to 40 000 euro/GWhe for BN-800. The costincrement for ADS electricity is obviously based ontheoretical estimations only, but a recent NEA studyarrived at a preliminar figure of 60 000 euro/GWhe for anitride fueled ADS [14]. This is in reasonableagreement with a study of relative fuel cycle cost madeat JAERI. We thus arrive at an average cost forelectricity produced in the present park equal to 27Meuro/TWh, with the uncertainty estimated to be about5 percent. The total cost of electricity (excluding N-15enrichment) then becomes 26 – 28 Geuro per year.Comparing with the above estimation for the N-15enrichment cost (50 Meuro/year) one finds that itsrelative contribution to the total cost is of the order of0.2 percent, which should be acceptable.
CONCLUSIONS
Under the assumptions made in the present study of theDouble Strata fuel cycle, 6.0% of the total nuclear parkpower is produced by minor actinide transmutation inADSs operating on nitride fuels. It has been found thatfor an N-15 enrichment level of 99%, the C-14production in ADS fuel is half of that produced in theoxide fuels used in the first stratum. Noting thatpresently C-14 constitutes 5% of the dose to the groupmost exposed to inhalation doses from THORP , it isour opinion that the increase in dose committments isacceptable. C-14 releases from reprocessing of ADSnitride fuels would however become a major contributorto inhalated doses at N-15 enrichment levels less than90% (Provided that carbon trapping is notimplemented). Hence we conclude that the requiredenrichment level for nitrogen to be used for nitride fuelfabrication is in the range of 98-99 percent, depending
on the actual fraction of nitrogen containing inert matrixin the fuel. Use of higher enrichemt levels would not bemeaningful as long as carbon trapping is notimplemented for the reprocessing of oxide fuels.
The cost for the use of N-15 could be estimated to 50Meuro/year, corresponding to 0.2% of the total cost forthe 1000 Twhe park. In our opinion this is an acceptablepenalty. The biggest uncertainties in the cost analysisare:
a) The fraction of inert matrix nitrogen to besupplied, which could increase the N-15 costby up to a factor of two;
b) The frequency of accidental loss of gas in thefabrication facility, which would increase thecost by a factor of three, if the full gasinventory would have to be replaced annually.
Implementation of N-15 recovery from reprocessingcould further decrease the penalty, but does not appearto be required. On the other hand, the use of a closedgas cycle in the fabrication stage is clearly mandatory.
ACKNOWLEDGEMENTS
This work was made as part of the CONFIRM project,funded by the European Commission.
REFERENCES
1) M. Delpech et al, The Am and Cm transmutation,physics and feasibility. Proc. Int Conf. Future NuclearSystems, GLOBAL 99. ANS 1999.
2) D.G. Foster et al, Review of PNL study ontransmutation processing of high level waste. LA-UR-74-74, LANL 1974.
3) S.L. Beaman, Actinide Recycle in LMFBRs as awaste managemnet alternative. Proc. 1st Int. Conf.Nuclear Waste Transmutation, page 61. University ofTexas (1980).
4) J. Tommasi et al, Long lived waste transmutation inreactors, Nucl. Tech. 111 (1995) 133.
5) H. Murata and T. Mukaiyama, Fission reactor studiesin view of reactor waste programs. Atomenergie-Kerntechnik 45 (1984) 23.
6) M. Salvatores et al, Long-Lived Radioactive wastetransmutation and the role of accelerator driven (hybrid)systems. Nucl. Inst. Meth. A, 414 (1997) 5.
7) J. Wallenius et al, The European Union CONFIRMproject, these proceedings.
8) S. Beaty, The THORP project – an overview. Energyand environment 6 (1995) 383.

9) P. Wydler, P&T studies of the OECD/NEA, Fifthframework program meeting on P&T and ADSactivities, Paris 2000.
10) T. Takizuka et al, Studies on accelerator driventransmutation systems. In Fifth international infomationexchange meeting on actinide and fission productpartitioning and transmutation, page 383. EUR-18898EN, OECD/NEA, 1998.
11) L. Waters, editor, MCNPX user’s manual, version2.1.5 TPO-E83-G-UG-X-00001, LANL 2000.
12) J.F. Briesmeister, editor, MCNP – A general Monte
Carlo N-Particle transport code, version 4C, LA-13709-M, LANL 2000.
13) W.R.A. Gossens, C.G. Eichholz and DW. Tedder,eds, Treatments of gaseous effluents at nuclearfacilities, Radioactive waste management handbook vol2 (1991).
14) D. Westlen et al, A cost benefit analysis of anaccelerator driven system, these proceedings.

APPENDIX V
P. SELTBORG, R. JACQMIN, “Investigation of Neutron Source Effects in Sub-Critical Media and Application to a Model of the MUSE-4 Experiments,” Int. Meeting on Mathematical Methods for Nuclear Applications, Mathematics and Computation, September 9-13, 2001, Salt Lake City, Utah, USA (2001).

INVESTIGATION OF NEUTRON SOURCE EFFECTS IN SUB-CRITICAL MEDIA AND
APPLICATION TO A MODEL OF THE MUSE-4 EXPERIMENTS
P. Seltborg1, R. Jacqmin CEA/Cadarache - DER/SPRC/LEPh – Bat. 230
13 108 Saint-Paul-Lez-Durance, France [email protected], [email protected]
Keywords: MUSE-4, Neutron Source, Spallation, MCNP, MCNPX
ABSTRACT
Monte Carlo simulations have been performed to investigate the neutron source effects in a sub-critical media successively coupled to a (d,d)-source, a (d,t)-source and a spallation source. The investigations have focused on the neutron energy spectra in the fuel and on the source relative efficiency ϕ*. The calculations have been performed for three sub-critical configurations, representative of the coming MUSE-4 experiments.
The Monte Carlo codes MCNP and MCNPX have been used to compute ϕ*. ϕ* has been found to be low for the (d,d)-source (∼1.35 compared to 1.0 for an average fission neutron), while considerably higher for the (d,t)-source (∼2.15) and the spallation source (∼2.35). The high value of ϕ* for the spallation source has been shown to be due to the fraction of high-energy neutrons (17 % of total source with En > 20 MeV) born from spallation, which contribute for 50 % to the total number of fission neutrons produced in the core. The variations of ϕ* with neutron importance have also been studied for some spherical configurations with a (d,d)- and a (d,t)-source. For the class of variations considered here, ϕ* was found to remain constant or increase only slightly in the interval 0.70 < keff < 0.996.
1 INTRODUCTION
Accelerator Driven Systems (ADS) (Salvatores, 1999) are being investigated as a possible means for reducing the long-term radiotoxicity in the spent fuel from the nuclear industry. In principle, the sub-criticality of ADS allows for dedicated cores with a much higher concentration of minor actinides than what is acceptable in critical reactors. Those dedicated cores could achieve high transmutation rates. Research done on ADS indicates that a waste reduction factor of 50 to 100 is theoretically possible (Delpech et al, 1999).
1 Permanent affiliation: Department of Nuclear and Reactor Physics Royal Institute of Technology 100 44 Stockholm, Sweden

2/2
The basic idea of ADS is to supply a sub-critical reactor core with neutrons generated by an intense external neutron source, usually from spallation reactions in a heavy metal target. This idea is being investigated in the MASURCA experimental facility at CEA Cadarache in the framework of the MUSE experiments (MUltiplication avec Source Externe). Different configurations and several different sub-critical levels are being studied (Salvatores, 1996; Soule, 1997; Lebrat, 1999).
The planned MUSE-4 experiments will not use a spallation source. Instead, a high-intensity pulsed neutron generator GENEPI, constructed by CNRS/ISN/Grenoble, will be used to accelerate a 250 keV deuteron beam towards either a deuterium target (d,d) or a tritium target (d,t) to produce well-characterized neutron sources via fusion reactions. (d,d)-reactions produce neutrons with energies between 2 and 3 MeV, while the (d,t)-reactions produce neutrons between 13 and 15 MeV.
The objective of the present study is to investigate neutron source effects in a MUSE-4-type sub-critical core coupled to a well-known (d,d)- or (d,t)-source, and to compare the results with those that would be obtained for a hypothetic spallation source coupled to the same core.
This investigation relies entirely on numerical simulations performed with the MCNP (Briesmeister, 2000) and MCNPX (Waters, 1999) Monte Carlo software packages. The two codes are essentially equivalent for neutron transport below 20 MeV. MCNP is used to simulate the production of the (d,d)- and (d,t)-sources, as well as neutron transport below 20 MeV. MCNPX is used to simulate the production of spallation neutrons and particle transport at all energies.
MCNP and MCNPX Monte Carlo models were set up in which a (d,d)-source, a (d,t)-source and a spallation source were successively coupled to three sub-critical configurations (Sc1, Sc2 and Sc3) representative of the upcoming MUSE-4 experiments.
A description of the MUSE-4 model, the calculation codes and the neutron sources used in this study is given in Section 2. In Section 3, the computed neutron energy spectra in the fuel are compared for the three different sources. In Section 4, we describe investigations of the neutron source efficiency ϕ*. The specific procedure used for calculating ϕ* with MCNP and MCNPX is described. The differences in the computed values of ϕ* are analysed, as well as the variations of ϕ* with neutron importance and reactivity.
2 DESCRIPTION OF THE MUSE-4 MODEL, CALCULATION TOOLS AND NEUTRON SOURCES USED IN THIS STUDY
2.1 The Muse-4 Model
Three homogeneous sub-critical configurations have been studied (Sc1, Sc2 and Sc3 with keff = 0.99, 0.97 and 0.95 respectively) representing three configurations planned in the MUSE-4 experiments. The geometry of the Sc2 model is shown in Fig. 1 below. The material compositions of the different regions are listed in Appendix A. The axial (z

3/3
direction) dimension of the fuel is 60.96 cm, except in a 21.2 cm wide channel above and below the lead buffer and the accelerator tube (in the y direction), where it was extended by 10.16 cm. The Na/SS reflector (Region 2) ends at z = ±61.76 cm. There is also a 10.16 thick axial shield (Region 3) above and below the Na/SS reflector. The overall dimensions of the whole model, including the reflector and the shields, are 159∗169.6∗143.84 cm.
Fig. 1 x-y Cross-sectional View of the MUSE-4 Sc2 Sub-Critical Configuration (k -eff = 0.97). The cross shows the position where the neutron spectra have been calculated, see Section 3.
To obtain the two other sub-critical levels, Sc1 and Sc3, fuel cells were added or removed at the core periphery.
2.2 Description of the Calculation Codes
Calculations have been performed with MCNP-4C for models of the three MUSE-4 sub-critical configurations with the (d,d)- and (d,t)-sources. MCNPX was used to simulate the system with the spallation source. All simulations relied on the same evaluated nuclear data library, namely ENDF/B-VI.4.
MCNPX is the extended version of MCNP where the major capabilities of LAHET (Prael and Lichtenstein, 1989) and MCNP-4B (Briesmeister, 1997) have been merged together. In MCNP, particle transport relies entirely on nuclear data contained in externally supplied cross section tables (En < 20 MeV), which are derived from evaluated nuclear data files. In LAHET, on the other hand, particle transport is accomplished by using various theoretical physics models embedded in the code, covering the energy range up to several GeV. In MCNPX, the table-based data are used whenever they exist, as such data are known to yield the best results. When they do not exist, the code built-in physics models are used.
Several physics models are available for high-energy transport in MCNPX. In the first stage, in which the incident particles interact with the individual nucleons via particle-particle cross sections, the Intranuclear Cascade (INC) and Multistage Pre-
z
y
x
Region 0: Accelerator Tube Region 1: Fuel Region 2: Na/SS Reflector Region 3: Axial Shield Region 4: Radial Shield Region 5: Lead Buffer

4/4
equilibrium (Prael, 1998) Models are used. The INC model used in this study is the Bertini package (Bertini, 1963). In the second stage the nucleus undergoes either evaporation (emitting neutrons and light ions) or fission, while in the final stage the excited nucleus decays by gamma emission, with energies described by a decay library (PHTLIB).
2.3 Description of the Sources
Three different neutron sources have been considered in this study: a (d,d)-, a (d,t)- and a spallation source. It should be noted that (α,n)- or spontaneous fission sources in the fuel have not been considered here.
2.3.1 The Fusion Sources used in MUSE-4
Two different fusion sources can be produced by the GENEPI neutron generator. 250 keV-deuterons are accelerated through the accelerator tube towards either a deuterium or a tritium target. The neutrons are emitted (the fusion reactions themselves are not simulated) from a point at the centre of the core (Fig. 2A). The energy of the emitted neutrons in the laboratory system (derived from basic kinematics) ranges from 2 to 3 MeV for the (d,d)-neutrons and from about 13 to 15 MeV for the (d,t)-neutrons, with a maximum emission probability density peaked in the forward direction. The source neutron energy spectrum and angular distribution used in this study are listed in Appendix B.
Fig. 2 A) (d,d)- or (d,t)-Source Emitted from the GENEPI Neutron Generator at the Centre of
the Core. B) 1 GeV Protons Accelerated Towards the Lead Buffer Creating Neutrons via Spallation Interactions. The generated neutrons are “frozen” and emitted as fixed source
neutrons in a separate simulation.
2.3.2 The Spallation Source
For the purpose of producing the spallation source for the numerical simulations, the lead buffer/target in the model was extended by one extra subassembly towards the proton beam, replacing part of the accelerator tube (Fig. 2B). This was done in order to

5/5
maximize neutron production near the centre of the core (the same position where the (d,d)- and the (d,t)-source neutrons are emitted).
The simulations with the spallation source were divided into two steps. A first simulation with the 1000 MeV proton beam (the protons were uniformly distributed across the beam of diameter 4 cm) impinging on the lead target, was performed with MCNPX. The properties, in terms of angular, energy and spatial distribution, of the primary neutrons born from the spallation interactions were recorded. In the second step, these primary neutrons were supplied to the MCNPX code as fixed source neutrons for separate simulations.
The spatial range of the primary neutrons was found to be rather limited, most neutrons being emitted within a 3 to 4 cm radius around the z-axis and within the first 30 cm axially, i.e., in the direction of the proton beam. The energy distribution of the neutrons produced from the 1000 MeV protons, integrated over all angles, is shown in Fig. 3 (neutrons created from secondary protons will have a slightly softer spectrum). We note that 17.3 % of the neutrons have energies higher than 20 MeV and 3.6 % of them higher than 150 MeV, and that these are mainly emitted in the forward direction of the incident proton beam. The effect of this high-energy fraction of neutrons on ϕ* will be discussed in Section 4.5.
1 0-3
1 0-2
1 0-1
1 00
1 01
1 02
1 03
0
0.002
0.004
0.006
0.008
0 .01
0.012
0.014
0.016
0.018
Energy (10E-3 to 10E3 MeV)
Neu
tron
s S
pect
rum
(N
orm
alis
ed t
o U
nity
)
Fig. 3 Spectrum of Primary Neutrons (Integrated over all Angles) born from 1000 MeV Protons
Impinging on a very thin Target of Lead (Single Reaction).
3 NEUTRON SPECTRA IN THE MUSE-4 CORE
The Sc3 sub-critical configuration of the MUSE-4 model with keff = 0.95 was simulated. The neutron energy spectra resulting from the three different sources were calculated in the subassembly centred at 21.2 cm from the centre of the core, indicated with a cross in Fig. 1. The neutron spectra of the other sub-critical states (Sc1 and Sc2) are not shown here, since they are very similar to the spectra of Sc3.
It is seen in Fig. 4 that the three spectra at this position are very similar to each other and that they are largely dominated by the fission multiplication in the fuel. The

6/6
two dips in the neutron fluxes caused by the resonances in sodium (∼ 3 keV) and oxygen (∼ 0.4 MeV) can be seen. The fraction of neutrons still having their initial (source) energy is very small (but should not automatically be disregarded) – about 0.2 % of the (d,t)-neutrons are still in the 14 MeV peak and 0.1 % of the spallation neutrons have energies above 20 MeV. Hence, we conclude that, for the purpose of computing neutron spectrum weighted quantities, the presence of the external sources can be considered “forgotten” beyond a few centimetres into the fuel.
1 0-4
1 0-3
1 0-2
1 0-1
1 00
1 01
1 02
1 03
0
0 . 0 0 5
0 .01
0 . 0 1 5
(D ,D) -sou rce
(D ,T ) -source
Spa l la t ion source
E n e r g y ( 1 0 E - 4 t o 1 0 E 3 M e V )
Neu
tron
s D
ensi
ty (
Nor
mal
ised
to U
nity
)
Fig. 4 MUSE-4 Neutron Energy Spectra in the Subassembly Centred at x=21.2 cm, y=-5.3 cm,
Resulting from the three Different External Sources.
4 SOURCE EFFICIENCY
The relative efficiency (ϕ*) of the source neutrons was determined for the three different sources and for the three different sub-critical configurations of the MUSE-4 model.
4.1 Definition of ϕϕ*
The neutron flux distribution in a sub-critical core is the solution of the inhomogeneous balance equation:
Sss += φφ FA (1)
where F is the fission production operator, A is the net neutron loss operator and S is the external source. The quantity ϕ*, which represents the relative efficiency of external source neutrons, is defined as the ratio of the average importance of the external source neutrons to the average importance of the fission neutrons (Salvatores, 1999), i.e.:
><><
><><
=
s
s
SS
φφφ
φ
ϕ
FF*,
*,
*0
0
(2)

7/7
where φ0* = The adjoint flux (the everywhere positive solution of
**1
** 00 φφ FAeffk
= ) which provides a measure of neutron importance.
<Fφs> = Total production of neutrons by fission. <S> = Total production of neutrons by the external source.
In the above formula, the brackets imply integration over space, angle and energy.
As some of the integrals in Eq. (2) cannot be directly calculated with MCNP and MCNPX, another procedure was sought to compute ϕ*. By using the balance equation (Eq. 1), the properties of the adjoint flux φ0*, the A, F operators and their adjoints A*, F*, the source efficiency can be expressed equivalently as
><><
⋅
−=
Sks
eff
φϕ
F1
1* (3)
Eq. (3) is a simple formula relating the total fission neutron production <Fφs> to the external source, ϕ* and reactivity (1 – 1/ keff). It shows that, for given values of keff and <S>, the larger ϕ* the larger the fission power produced in the system.
The quantities in the right hand side of Eq. (3) are standard outputs from MCNP and MCNPX. For simplicity, the production terms will be labelled only F and S in the sequel.
4.2 Estimation of the Statistical Error in ϕϕ*
To get an estimate of the statistical uncertainty in the source efficiency, assume that the errors of F and S are ∆F and ∆S and apply the formula for “propagation of error” (Eq. 4)
......,...),( 22
11
12
2
22
2
11
21 +∆∂∂
⋅∆∂∂
⋅++
∆
∂∂
+
∆
∂∂
=∆ xxf
xxf
xxf
xxf
xxf ρ (4)
The correlation constant ρ could be either positive or negative – negative if keff and F are correlated and positive if they are anti-correlated. However, as a first approximation, ρ
may be assumed to be zero. With the derivatives effk∂
∂ *ϕ , F∂
∂ *ϕ and S∂
∂ *ϕ inserted in Eq.
(4) an expression for the relative error in ϕ* can be obtained:
2222
11
**
∆
+
∆
+
∆⋅
−≈
∆SS
FF
k
k
k eff
eff
effϕϕ (5)
Eq. 5 will be used in the subsequent sections to estimate the statistical uncertainty in ϕ*.

8/8
4.3 Calculations of ϕϕ* for the MUSE-4 Model
The multiplication factor keff and the total number of neutrons produced by fission (F) were calculated for the three different sources and the three different sub-critical configurations. F was automatically normalised per source neutron, so S was always equal to 1. The source efficiency was calculated according to Eq. (3) and the corresponding statistical errors (±1 standard deviation) according to Eq. (5). All results including error estimations are listed in Table 1.
Table 1 MCNP/MCNPX Results for the MUSE-4 Sc1, Sc2 and Sc3 Configurations. Source keff F ϕϕ *
(D,D)-Source 140.2 (± 1.6 %) 1.35 (± 0.024) (D,T)-Source
0.99045 (± 8 pcm) 223.2 (± 1.7 %) 2.15 (± 0.040)
Sc1 Spallation Source
0.99040 (± 8 pcm)
248.6 (± 1.8 %) 2.41 (± 0.047)
(D,D)-Source 44.2 (± 0.9 %) 1.36 (± 0.015) (D,T)-Source
0.97007 (± 14 pcm) 69.9 (± 1.0 %) 2.16 (± 0.024)
Sc2
Spallation Source
0.96992 (± 15 pcm)
76.6 (± 1.1 %) 2.37 (± 0.028)
(D,D)-Source 25.4 (± 0.6 %) 1.34 (± 0.009) (D,T)-Source
0.94982 (± 14 pcm) 40.1 (± 0.5 %) 2.12 (± 0.013)
Sc3 Spallation Source
0.94993 (± 15 pcm)
44.2 (± 0.7 %) 2.33 (± 0.018)
The energy of the (d,d)-source neutrons (2-3 MeV, see Appendix B) is only slightly larger than the average energy of a neutron produced by fission. The ϕ* value for the (d,d)-source is therefore expected to be equal or slightly larger than 1, which is indeed the case.
In the case of the (d,t)-source, the reason for the higher values of ϕ* is the larger fission rate, part of which coming from fissions induced by the neutrons multiplied by (n,2n)-reactions in the lead buffer. It is seen in Table 1 that the number of fission neutrons per source neutron is large, approximately 58 % larger than for the (d,d)-source. It is also seen in Fig. 5 that the (n,2n)-cross section in lead has a threshold at about 7 MeV, which is the reason why this reaction is insensitive to the (d,d)-source neutrons. At 14 MeV the value of the lead (n,2n)-cross section is about 2 barns, which is comparable to the fission cross section in Pu-239 and in U-238.
Concerning the spallation source neutrons, the values of ϕ* obtained in the simulations are somewhat higher than for the (d,t)-source. This is due to the fraction of neutrons having a very high energy (see Section 2.3.2). Most of the neutrons from the spallation process are born with an energy lower than the (n,2n)-cross section threshold in lead, but the neutrons with very high energy contribute significantly to ϕ*, as will be shown in Section 4.5.

9/9
Fig. 5 Neutron Microscopic Cross Sections for Pu-239 Fission, U-238 Fission and (n,2n)-
Reactions in Pb-206, -207,-208. (ENDF/B-VI.4)
It is also seen in Table 1 that, for all three sources, ϕ* remains approximately constant or increases slightly as keff increases. This trend will be further discussed in the following section.
4.4 Dependence of ϕϕ* on Neutron Importance and keff
The dependence of the source efficiency on neutron importance φ0* was investigated for a wider range of sub-criticality (keff = 0.70 to 0.996), for a (d,d)- and a (d,t)-source, using a spherical model consisting of a buffer core (lead or U-238 with r =10 cm) and MUSE-4 type fuel. Only a limited class of importance variations was considered. The results are plotted in Fig. 6.
0.7 0 . 7 5 0.8 0 . 8 5 0.9 0 . 9 5 11
1.5
2
2.5
3
3.5
4
4.5
2 . L e a d + F u e l ( D , D )
1 . L e a d + F u e l ( D , T )
3 . U - 2 3 8 + F u e l ( D , T )
k-ef f
Sou
rce
Effi
cien
cy
Fig. 6 ϕ* versus k eff for Spherical Configurations with a Buffer of Lead or U-238 (r=10 cm) and MUSE-4 type Fuel, Coupled to a (d,d)- and a (d,t)-Source. The neutron importance and k eff were
changed by varying the fuel radius from about 48 cm (keff ≈ 0.70) to 68 cm (keff ≈ 0.996).

10/10
Instead of plotting the ratio ϕ* / (1/keff – 1) versus keff which would reflect the rapid increase of ><>< SsφF (and therefore of the fission power) as keff approaches unity, we focused instead on the behaviour of ϕ* versus keff. The neutron importance (and therefore keff) was varied by changing the outer radius of the fuel from approximately 48 to 68 cm. It is seen in Fig. 6 that ϕ* shows the same almost constant or slightly increasing trend in the interval keff = 0.95 to 0.99, for the spherical configurations with the lead buffer, as already observed for the MUSE-4 model.
The first case (Case 1) is a sphere consisting of a lead core surrounded by fuel with approximately the same material composition as listed in Table 3. ϕ* increases slightly but constantly in the interval keff = 0.70 to 0.996. The importance of the (n,2n)-effect is also demonstrated by replacing the (d,t)-source by a (d,d)-source (Case 2), which results in significantly lower values of ϕ*. The curve shows the same increasing trend as for the (d,t)-source.
In Case 3, when the lead buffer at the centre of the sphere is replaced by U-238, a large increase in ϕ* occurs at all sub-criticality levels because of U-238 fissions. The same increasing trend as with the lead buffer is not observed here as ϕ* remains nearly constant.
The statistical errors of the ϕ* values are rather small in the range 0.70 ≤ keff ≤ 0.99 – less than 1 % (±1 standard deviation), while around 2.5 % for the very last point (keff = 0.996). In the absolute vicinity of criticality (keff ≥ 0.996) the computation time for calculating ϕ* grows too large to obtain reliable results.
We conclude that the variations of ϕ* with neutron importance are rather small in the investigated range 0.70 ≤ keff ≤ 0.996.
4.5 Decomposition of the Spallation Source
Most reactor code simulations only take into account neutrons with energies lower than 20 MeV. However, a significant fraction of the neutrons produced by spallation have energies higher than 20 MeV (see Fig. 3). The contribution of those high-energy neutrons to the source efficiency needs to be investigated. For this, the spallation source was artificially split into two “low-energy” bins (S1 from 0 to 5 MeV and S2 from 5 to 20 MeV) and two “high-energy” bins (S3 from 20 to 150 MeV and S4 from 150 to 1000 MeV). The study was performed for the third sub-critical level Sc3 (keff = 0.95) of the MUSE-4 model.
In order to derive a formula for the low- and high-energy contributions to the source efficiency, we start from Eq. (3), applied to each source bin
><><
⋅
−=
i
i
effi Sk
φϕ
F1
1* (6)
where φ i = Flux resulting from each source bin (S1 → φ 1, S2 → φ 2 etc.).

11/11
Since ∑ = ><>=< 41i iT φφ FF , the following relationship for the decomposition of ϕ* is
readily obtained
∑= ><
><⋅=
4
1**
i T
iiT S
Sϕϕ (7)
where ϕT* = Efficiency of the total source. ϕi* = Efficiency of each source bin alone.
The ϕi* results obtained from the Monte Carlo simulations are listed in Table 2. As expected, for the first low-energy bin, ϕi* is low (ϕ1*=1.25) and close to the value obtained for the (d,d)-source. For the second bin, it is found to be higher (ϕ2*=1.71) since many of the neutrons have energies above the lead (n,2n)-cross section threshold. For the two high-energy parts, ϕi* is very high (ϕ3*=4.58 and ϕ4*=14.4), which is the consequence of fissions induced by neutrons born from (n,xn)-reactions and spallation interactions.
Table 2 MCNPX Results for the Sc3 MUSE-4 Model (keff = 0.94993) Obtained from the Decomposition of the Spallation Source.
Source Bin
Energy limits (MeV)
><><
T
iSS A
><><
i
iSφF B ϕϕi*
><><⋅
T
ii S
S*ϕ C
S1 0 - 5 0.559 23.7 1.25 0.699 (30 %) S2 5 - 20 0.268 32.5 1.71 0.458 (20 %) S3 20 - 150 0.137 86.9 4.58 0.627 (27 %) S4 150 - 1000 0.036 273.1 14.4 0.518 (23 %) Sum = 2.30
ST D 0 - 1000 1.0 44.2 2.33
The superscripts A, B, C and D in Table 2 stand for:
A: Fraction of the total number of source neutrons in each energy bin (compare Fig. 3). B: Neutrons produced by fission in the core. C: Contribution to total ϕ* (Product of column 3 and 5). D: Simulation with the total source, identical as for Sc3 in Table 1.
It is also seen in Table 2 that the two high-energy parts (17.3 % of the total number of source neutrons), contribute for about 50 % of the total ϕ*, and the highest energy part alone (3.6 % of the total number of source neutrons) for more than 20 %. The sum of the contributions to ϕ* from the four different parts in the rightmost column, according to Eq. (7), is 2.30, which is in good agreement with the value obtained from the simulation with the total source (ϕT*=2.33). The statistical 1σ error estimates in the ϕ* values are less than 1 %.
The rather high average number of fission neutrons produced per source neutron for the two high-energy bins (87 and 273 respectively) might seem surprising at first. The explanation for this is that most of the high-energy neutrons from the spallation source

12/12
have already been multiplied in the lead (via secondary spallation and (n,xn)-reactions) before they enter into the fuel. Each of them gives birth to a number of lower-energy neutrons, which then leak out of the lead and induce fission chain reactions in the fuel. Additional simulations in which the lead target alone was kept showed that only about 5 % of the neutrons leaking out of the lead have energies higher than 20 MeV and about 1 % of them higher than 150 MeV.
We conclude that, although neutron transport in the fuel is largely dominated by neutrons with low energy (En < 20 MeV) which can be well simulated with a number of classical calculation codes such as MCNP, the importance of the high-energy contribution to ϕ* indicates the need for further investigating the effects from high-energy spallation neutrons. This could be made easier by extending the capabilities of existing neutronics codes, in particular deterministic codes, for studying high-energy (20-150 MeV) neutron transport.
5 CONCLUSIONS
Numerical simulations have been performed with MCNP and MCNPX to investigate the neutronic properties of a sub-critical core representative of the up-coming MUSE-4 experiments, alternatively coupled with a (d,d)-source, a (d,t)-source and a spallation source. The source-plus-core systems have been studied in terms of neutronic spectra and efficiency (ϕ*) in three different sub-critical configurations (keff = 0.99, 0.97, 0.95).
The computed neutron spectra in all cases show that fission multiplication dominates at distances past a few centimetres into the fuel. This implies that, for the purpose of ADS core studies, the presence of the source may be ignored in the calculation of spectrum-weighted quantities, except possibly in the immediate vicinity of the external source.
The relative efficiency of the (d,d)-source is somewhat higher than 1 (∼1.35). For the (d,t)-source, it is much larger, around 2.15. This significantly larger value is due to the (n,2n)-multiplication in lead (with an energy threshold at about 7 MeV) and the induced fissions. To analyse the high value of ϕ* obtained for the spallation source (∼2.35), the source was artificially split into four different energy bins and the efficiency of each bin was determined. It was found that these two high-energy bins (En > 20 MeV) contribute for about 50 % to ϕ* and to the total number of fission neutrons produced in the core. This can be explained by the fact that primary neutrons born with high energy from spallation give birth to a large number of lower-energy neutrons, which in turn induce fissions. This rather high fraction indicates the need for extending reactor analysis code capabilities above 20 MeV for more detailed investigations of high-energy spallation neutron effects.
The variations of ϕ* with neutron importance (and reactivity) was also investigated for different spherical configurations. It was found that ϕ* remains approximately constant or increases slightly in the interval 0.70 < keff < 0.996.
13/13
AKNOWLEDGEMENTS
This research work is supported and partly funded by SKB AB, Sweden, the Swedish Centre of Nuclear Technology, and the European Commission, DGRTD, under Contract # FIKW-CT-2000-00063.
REFERENCES
Bertini, H. W., 1969. Phys. Rev. 131, 1801.
Briesmeister, J.F. MCNPTM – A General Monte Carlo N-Particle Transport Code – Version 4B. LANL/Los Alamos, LA-12625-M, March, 1997.
Briesmeister, J.F. MCNPTM – A General Monte Carlo N-Particle Transport Code – Version 4C. LANL/Los Alamos, LA-13709-M, April 10, 2000.
Delpech, M. et al., 1999. The Am and Cm Transmutation – Physics and Feasability. Global’99.
Lebrat, J.F. et al., 1999. Experimental investigation of multiplying sub-critical media in presence of an external source operating in pulsed or continuous mode: The MUSE-3 experiment. ADTTA’99.
Prael R.E., Lichtenstein H. User Guide to LCS: The LAHET Code System. Los Alamos National Laboratory, LA-UR-89-3014, September 15, 1989.
Prael R.E., Bozoian M. Adaptation of the Multistage Pre-equilibrium Model for the Monte Carlo Method (I). Los Alamos National Laboratory Report LA-UR-88-3238, September 1998.
Salvatores, M., Martini, M., Slessarev, I. MUSE-1: A first experiment at MASURCA to validate the physics of sub-critical multiplying systems relevant to ADS. Kalmar, Sweden, June 3-7, 1996.
Salvatores, M., 1999. Accelerator Driven Systems (ADS), Physics Principles and Specificities. J. Phys. IV France 9, pp. 7-17 –7-33.
Soule, R., Salvatores, M., Jacqmin, R., 1997. Validation of neutronic methods applied to the analysis of fast sub-critical systems: The MUSE-2 experiments. Global’97, page 639.
Waters, L.S. MCNPXTM User´s Manual – Version 2.1.5. Los Alamos National Laboratory, November 14, 1999.
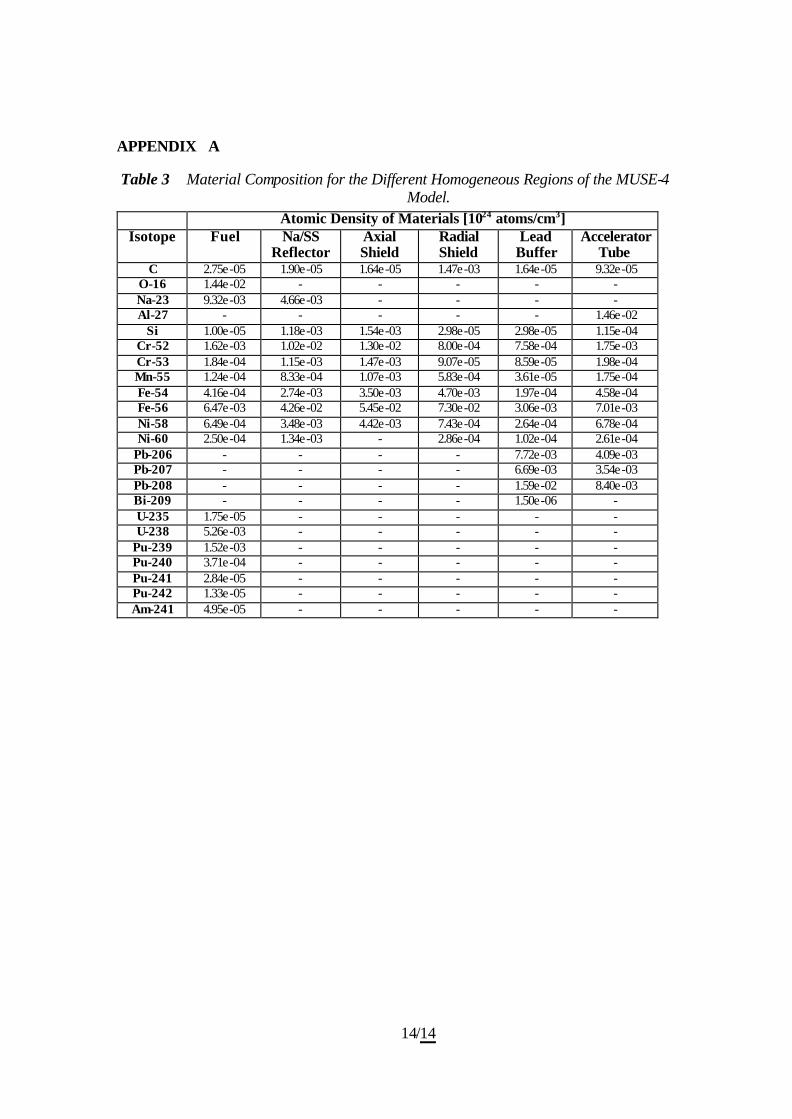
14/14
APPENDIX A
Table 3 Material Composition for the Different Homogeneous Regions of the MUSE-4 Model.
Atomic Density of Materials [1024 atoms/cm3] Isotope Fuel Na/SS
Reflector Axial Shield
Radial Shield
Lead Buffer
Accelerator Tube
C 2.75e-05 1.90e-05 1.64e-05 1.47e-03 1.64e-05 9.32e-05 O-16 1.44e-02 - - - - - Na-23 9.32e-03 4.66e-03 - - - - Al-27 - - - - - 1.46e-02
Si 1.00e-05 1.18e-03 1.54e-03 2.98e-05 2.98e-05 1.15e-04 Cr-52 1.62e-03 1.02e-02 1.30e-02 8.00e-04 7.58e-04 1.75e-03 Cr-53 1.84e-04 1.15e-03 1.47e-03 9.07e-05 8.59e-05 1.98e-04 Mn-55 1.24e-04 8.33e-04 1.07e-03 5.83e-04 3.61e-05 1.75e-04 Fe-54 4.16e-04 2.74e-03 3.50e-03 4.70e-03 1.97e-04 4.58e-04 Fe-56 6.47e-03 4.26e-02 5.45e-02 7.30e-02 3.06e-03 7.01e-03 Ni-58 6.49e-04 3.48e-03 4.42e-03 7.43e-04 2.64e-04 6.78e-04 Ni-60 2.50e-04 1.34e-03 - 2.86e-04 1.02e-04 2.61e-04
Pb-206 - - - - 7.72e-03 4.09e-03 Pb-207 - - - - 6.69e-03 3.54e-03 Pb-208 - - - - 1.59e-02 8.40e-03 Bi-209 - - - - 1.50e-06 - U-235 1.75e-05 - - - - - U-238 5.26e-03 - - - - -
Pu-239 1.52e-03 - - - - - Pu-240 3.71e-04 - - - - - Pu-241 2.84e-05 - - - - - Pu-242 1.33e-05 - - - - - Am-241 4.95e-05 - - - - -

15/15
APPENDIX B
Table 4 Laboratory-system Angular and Energy Dependence (Derived from Basic Kinematics) of the (d,d)- and the (d,t)-Source Neutrons Emitted at the Centre of the Core, Resulting from the GENEPI 250 keV Deuterons Impinging on a
Deuterium/Tritium Target. (D,D)-reaction (D,T)-reaction
Angle Energy Emission probability density
Energy Emission probability density
0 3.050 5.250% 15.12 4.924% 9 3.042 5.243% 15.10 4.922% 18 3.020 5.223% 15.07 4.916% 27 2.984 5.192% 15.00 4.906% 36 2.935 5.150% 14.92 4.893% 45 2.876 5.098% 14.82 4.876% 54 2.808 5.038% 14.70 4.856% 63 2.734 4.970% 14.57 4.834% 72 2.656 4.899% 14.43 4.811% 81 2.576 4.825% 14.28 4.786% 90 2.496 4.750% 14.13 4.760% 99 2.419 4.676% 13.98 4.735% 108 2.346 4.605% 13.83 4.711% 117 2.279 4.538% 13.70 4.688% 126 2.219 4.478% 13.58 4.667% 135 2.167 4.425% 13.47 4.648% 144 2.123 4.380% 13.37 4.632% 153 2.089 4.344% 13.30 4.619% 162 2.064 4.318% 13.25 4.610% 171 2.049 4.302% 13.21 4.604% 180 2.044 4.297% 13.20 4.602%

APPENDIX VI
P. SELTBORG, R. JACQMIN, “Spallation Neutron Source Effects in a Sub-Critical System,” Int. Meeting Accelerator Applications/Accelerator Driven Transmutation Technology and Applications ’01, November 11-15, 2001, Reno, Nevada, USA (2001).

Spallation Neutron Source Effects in a Sub-Critical System
P. Seltborg* Department of Nuclear and Reactor Physics, Royal Institute of Technology, Stockholm, Sweden
R. Jacqmin
CEA Cadarache, SPRC/LEPh Bat. 230, 13108 Saint-Paul-lez-Durance, France
Abstract – Numerical simulations of a sub-critical system coupled to a neutron spallation source (1000 MeV protons impinging on a lead target) have been performed with the Monte Carlo code MCNPX and the deterministic code system ERANOS. The investigations have focused on the determination of the source neutron efficiency, ϕ*, i.e. the ratio of the average importance of external source neutrons to the average importance of fission neutrons. The calculations have been performed for a model representative of the MUSE-4 experiments currently underway in the MASURCA facility. It has been found that the high-energy neutrons (En > 20 MeV) born from spallation, even though they represent only about 17% of the total neutrons, contribute for a large fraction (50%) to ϕ* and to the total number of fission neutrons produced in the core. It has also been found that codes such as ERANOS, which do not take into account neutrons with energies higher than 20 MeV, largely underestimate ϕ*.
* E-mail: [email protected]
I. INTRODUCTION Accelerator Driven Systems (ADS) (Ref. 1) are being
investigated as a possible means for reducing the long-term radiotoxicity of the spent reactor fuel. In principle, the sub-criticality of ADS allows for dedicated cores with a much higher concentration of minor actinides than what is acceptable in critical reactors. Those dedicated cores could achieve high transmutation rates. Research done on ADS indicates that a radiotoxicity reduction factor of 50 to 100 is theoretically possible (Ref. 2).
In an ADS, neutrons generated by an intense external
source, usually spallation reactions in a heavy metal target, are supplied to a sub-critical reactor core. This idea is being investigated in the MASURCA experimental facility at CEA Cadarache in the framework of the MUSE experiments (MUltiplication avec Source Externe) (Refs. 3, 4 and 5). Different configurations and several sub-critical levels are being studied.
The on-going MUSE-4 experiments do not use a
spallation source. Instead, a high-intensity pulsed neutron generator GENEPI, constructed by CNRS/ISN/Grenoble, is being used to accelerate a 250 keV deuteron beam towards either a deuterium target or a tritium target, producing well-characterized neutron sources via fusion reactions.
In a previous study (Ref. 8), we investigated spallation neutron source effects in a MUSE-4 type sub-critical core coupled to a 1000 MeV proton beam, in particular the contribution of high-energy neutrons (En > 20 MeV) to the source efficiency (ϕ*). The objective of the present study is to complement this past work. Additional numerical simulations have been performed with the Monte Carlo code MCNPX (Ref. 6). The results have been compared to those obtained with ERANOS (Ref. 7), the CEA reference deterministic code system for fast reactor analyses.

A description of the MUSE-4 model, the MCNPX and ERANOS codes and the spallation neutron source used in this study is given in Section II. In Section III, the specific procedure used for calculating ϕ* with MCNPX and ERANOS is described. A decomposition of the spallation source is performed and analysed. The results of the MCNPX and ERANOS simulations are compared.
II. DESCRIPTION OF THE MUSE-4 MODEL, THE CALCULATION CODES AND THE SPALLATION
NEUTRON SOURCE USED IN THIS STUDY
II.A. The Muse-4 Model A homogeneous model representing one of the sub-
critical configurations (SC3) planned in the MUSE-4 experiments (keff = 0.95) has been studied. The geometry of the model is shown in Fig. 1. The fuel is MOX fuel with 72% U-238, 21% Pu-239 and 5% Pu-240 plus small amounts of some other actinides. The fuel is homogeneously distributed together with the Na-coolant (Ref. 8). The axial (z-direction) dimension of the fuel is 60.96 cm, except in a 21.2 cm wide channel above and below the lead buffer and the accelerator tube (in the y direction), where it was extended by 10.16 cm. The sodium-steel reflector ends at z = ±61.76 cm. There is also a 10.16 thick axial shield (not shown in the figure) above and below the Na/SS reflector. The overall dimensions of the whole model, including the reflector and the shields, are 159 cm x 169.6 cm x 143.84 cm.
Fig. 1. x-y cross-sectional view of the model of the MUSE-
4 sub-critical configuration (keff = 0.95).
II.B. The Calculation Codes
II.B.1. MCNPX MCNPX is an extended version of MCNP where the
major capabilities of LAHET (Ref. 9) and MCNP-4B (Ref. 10) have been merged together. In MCNP, particle transport relies entirely on nuclear data contained in externally supplied cross section tables (En < 20 MeV), which are derived from evaluated nuclear data files. In LAHET, on the other hand, particle transport is accomplished by using various theoretical physics models embedded in the code, covering the energy range up to several GeV. In MCNPX, the table-based data are used whenever they exist, as such data are known to yield the best results. When they do not exist, the code built-in physics models are used.
Several physics models are available for high-energy
transport in MCNPX. In the first stage, in which the incident particles interact with the individual nucleons via particle-particle cross sections, the Intranuclear Cascade (INC) and Multistage Pre-equilibrium (Ref. 11) Models are used. The INC model used in this study is the Bertini package (Ref. 12). In the second stage the nucleus undergoes either evaporation (emitting neutrons and light ions) or fission, while in the final stage the excited nucleus decays by gamma emission, with energies described by a decay library (PHTLIB).
In this study, all simulations performed with MCNPX
relied on the same evaluated nuclear data library, namely ENDF/B-VI.6.
z
y
x
0: Accelerator Tube1: Fuel/Na-Coolant2: Na/SS Reflector3: Axial Shield 4: Radial Shield 5: Lead Buffer
II.B.2. ERANOS ERANOS is a deterministic fast reactor code system
developed by CEA in collaboration with other R&D organizations (Ref. 7). It uses cross-section libraries based on the JEF2.2 evaluated file. The ERANOS code system is well validated for classical sodium-cooled fast reactors. This validation has been recently extended to plutonium burning cores with steel-sodium reflectors and high Pu-content. However, the code is not yet fully validated for systems characterized by large sub-criticalities and the presence of high-energy neutrons from spallation.
In ERANOS, 1-D cell or 2-D subassembly calculations
are performed with the ECCO code, while core calculations can be performed with different 2-D or 3-D, diffusion or transport theory modules. In this study, the two-dimensional Sn transport code BISTRO (Ref. 13) was used.

II.C. Description of the Spallation Source and the Primary Spallation Neutrons
The MCNPX simulations calculating the efficiency of
the spallation source neutrons were divided into two steps. In the first simulation, a large number of protons (1000 MeV) were accelerated towards the lead target (Fig. 2). The protons were uniformly distributed across the beam of radius 2 cm. The angular, energy and spatial distributions of all neutrons that were created directly from the spallation interactions (primary spallation neutrons) were recorded. After that the neutron trajectories were immediately terminated. This procedure produces the spectrum of primary spallation neutrons, i.e. no secondary neutrons are included.
Fig. 2. 1000 MeV protons accelerated towards the lead target creating neutrons via spallation interactions. The generated primary neutrons are “frozen” at the moment
when they are created, and emitted as fixed source neutrons in a separate simulation.
In the second step, these primary spallation neutrons were supplied to the MCNPX code as fixed source neutrons for separate simulations and the source efficiency was determined.
The spatial distribution where the primary neutrons
were created was found to be rather limited. Axially, most of the neutrons were emitted in the upper part of the lead target (77% within the first 20 cm, see Fig. 3A). The radial distribution was found to be very peaked around the axis of the incident proton beam, about 98% of the neutrons were created within a 3 cm radius (Fig. 3B).
Fig. 3. A) Axial distribution of the primary spallation
neutrons. B) Radial distribution of the primary spallation neutrons.
The energy distribution of the primary neutrons produced by the 1000 MeV protons is shown in Fig. 4. We note that 16.8% of the neutrons have energies higher than 20 MeV and 3.3% of them higher than 150 MeV, and that the neutrons with very high energy are mainly emitted in the forward direction of the proton beam, as expected.
Fig. 4. Energy spectrum of the primary spallation neutrons
created by the 1000 MeV protons.
There were about 14.5 primary spallation neutrons produced per 1000 MeV proton. This value should be compared to the total number of neutrons produced in the lead target, i.e. around 21 neutrons per proton. Thus, almost a third of the neutrons that exit the lead target and enter into the fuel are secondary neutrons, most of them created in neutron spallation reactions and (n,xn)-reactions.

It should be noted that, when calculating ϕ* for a
spallation system, the results are directly dependent on the definition of the neutron source. Other source definitions are possible (Refs. 14 and 15), which will result in different meanings and values for ϕ*.
III. SOURCE EFFICIENCY
III.A. Definition of ϕ*
The neutron flux distribution φs in a sub-critical core is the solution of the inhomogeneous balance equation:
Sss += φφ FA (1)
where F is the fission production operator, A is the net neutron loss operator and S is the external source. The quantity ϕ*, which represents the relative efficiency of external source neutrons, is defined as the ratio of the average importance of the external source neutrons to the average importance of the fission neutrons (Ref. 1), i.e.:
><><
><><
=
s
sS
S
φφφ
φ
ϕ
FF,*
,*
*0
0 (2)
k
where φ*0 = The adjoint flux (the everywhere positive solution of A*φ*0 = 1/keff˙ F*φ*0 ), which provides a measure of neutron importance. <Fφs> = Total production of neutrons by fission. <S> = Total production of neutrons by the external source.
In the above formula, the brackets imply integration
over space, angle and energy. As some of the integrals in Eq. (2) cannot be directly
calculated with MCNPX, another procedure was sought to compute ϕ*. By using the balance equation [Eq. (1)], the properties of the adjoint flux φ0*, the A, F operators and their adjoints A*, F*, the source efficiency can be expressed equivalently as:
><><
⋅
−=
Sks
eff
φϕ
F11* (3)
Eq. (3) is a simple formula relating the total fission neutron production <Fφs> to the external source, ϕ* and reactivity
(1 – 1/ keff). It shows that, for given values of keff and <S>, the larger ϕ* the larger the fission power produced in the system.
The quantities in the right hand side of Eq. (3) are standard outputs from MCNPX.
III.B. Decomposition of the Spallation Source Most reactor codes take into account only neutrons with
energies lower than 20 MeV. However, a significant fraction of the neutrons produced by spallation have energies higher than 20 MeV (Fig. 4). The contribution of those high-energy neutrons to the source efficiency needs to be investigated. For this, the spallation source was artificially split into two “low-energy” bins (S1 from 0 to 5 MeV and S2 from 5 to 20 MeV) and two “high-energy” bins (S3 from 20 to 150 MeV and S4 from 150 to 1000 MeV), as explained in Ref. 8.
In order to derive a formula for the low- and high-
energy contributions to the source efficiency, we start from Eq. (3), applied to each source bin
><><
⋅
−=i
i
effi S
φϕ
F11* (4)
where φi = Flux resulting from each source bin alone (S1 → φ1, S2 → φ2 etc.).
Since , the following
relationship for the decomposition of ϕ* is readily obtained: ∑ = ><>=< 4
1i iT φφ FF
∑= ><
><⋅=
4
1**
i T
iiT S
Sϕϕ (5)
where ϕ*T = Efficiency of the total source. ϕ*i = Efficiency of each source bin alone.
III.B.1. Calculations Performed with MCNPX The ϕ*i results obtained from the MCNPX simulations
are listed in Table I. As expected, for the first low-energy bin, ϕ*i is relatively low (ϕ*1 = 1.24). For the second bin, it is found to be higher (ϕ*2 = 1.63), since many of the neutrons have energies above the lead (n,2n)-cross section threshold (ref. 8). For the two high-energy parts, ϕ*i is very high (ϕ*3 = 4.79 and ϕ*4 = 13.9), which is the consequence of fissions induced by secondary neutrons born from (n,xn)-

reactions and neutron spallation interactions. The statistical relative 1σ error estimates in the ϕ* values are about 1 %.
TABLE I MCNPX Results for the Decomposition of the Spallation Source, Obtained for the MUSE-4 Model (keff = 0.95013 ± 14 pcm).
Source Bin Energy intervals (MeV) ><
><
T
iSS A
><><
i
iSφF B ϕ*i
><><
⋅T
ii S
S*ϕ
C
S1 0 - 5 0.592 23.5 1.24 0.736 (33 %) S2 5 - 20 0.240 31.1 1.63 0.390 (17 %) S3 20 - 150 0.135 91.3 4.79 0.647 (29 %) S4 150 - 1000 0.033 264.3 13.9 0.458 (21 %) Sum = 2.23
ST D 0 - 1000 1.0 42.2 2.21
The superscripts A, B, C and D in Table I stand for: A: Fraction of the total number of source neutrons in each energy bin (compare Fig. 4). B: Neutrons produced by fission in the core, per external source neutrons from bin i. C: Contribution to total ϕ* (Product of column 3 and column 5). D: Simulation with the total source.
It is also seen in Table I that the two high-energy parts (16.8% of the total number of source neutrons), contribute for about 50% of the total ϕ*, and the highest energy part alone (3.3% of the total number of source neutrons) for more than 20%. The sum of the contributions to ϕ* from the four different parts in the rightmost column, according to Eq. (5), is 2.23, which is in agreement with the value obtained from the simulation with the total source (ϕ*T = 2.21). Comparisons with additional calculations (Ref. 8) show that this value is slightly higher than the ϕ*-value obtained for a (d,t)-fusion source, coupled to the same model (ϕ*d,t = 2.12), and much higher than for a (d,d)-source (ϕ*d,d = 1.34).
The rather high average number of fission neutrons
produced per source neutron for the two high-energy bins (91 and 264, respectively) might seem surprising at first. The explanation for this is that most of the high-energy neutrons from the spallation source have already been multiplied in the lead (most of them via secondary neutron spallation and (n,xn)-reactions) before they enter into the fuel. Each of them gives birth to a number of lower-energy neutrons, which then leak out of the lead and induce fission chain reactions in the fuel. Additional simulations in which the lead target alone was kept show that only about 5 % of the neutrons leaking out of the lead have energies higher than 20 MeV and about 1% of them higher than 150 MeV.
We conclude that, although neutron transport in the fuel
is largely dominated by neutrons with low energies (En < 20 MeV) which can be well simulated with a number of
classical calculation codes such as MCNP and ERANOS, high-energy neutrons contribute significantly to ϕ*. Further investigating these high-energy effects would be made easier by extending the neutron data libraries of existing codes from 20 MeV to at least 150 MeV.
III.B.2. Comparisons between MCNPX and ERANOS In practice, many hybrid system core studies rely on
deterministic codes such as ERANOS, which do not model neutrons with energies above 20 MeV. It is therefore interesting to compare the predictions of such codes with MCNPX. While only small differences are expected in reactivity and power shape predictions (see Fig. 5), the results of the previous section suggest that a rather large impact is anticipated on ϕ*.
To verify this conjecture, a small benchmark was
defined and calculated with both MCNPX and ERANOS. This benchmark is a simplified two-dimensional R-Z version of the MUSE-4 model described in Fig. 1. The distribution of the primary source neutrons was slightly simplified to make it possible to use exactly the same sources in both ERANOS and MCNPX.

Fig. 5. Radial power profiles computed by MCNPX and
ERANOS.
There are at least two ways of calculating ϕ* with ERANOS. The first possibility is to use Eq. 2. However, this requires an adjoint calculation. Another, simpler way is to use Eq. 3, which may also be written as:
11
11*
−
−=
s
eff
k
kϕ (6)
where ><><= sssk φφ AF . We chose this second alternative.
As can be seen in Table II, ERANOS produces values of ϕ* in fairly good agreement with MCNPX for the two low-energy bins S1 and S2, in spite of differences between the nuclear datasets used by the two codes. The relative statistical 1σ error estimates in the ϕ* values for the MCNPX-calculations are less than 1%.
TABLE II MCNPX and ERANOS Results for a Simplified Two-Dimensional MUSE-like Model (keff ≈ 0.95).
Source Bin Energy intervals (MeV) ><
><
T
iSS ϕ*i
MCNPX ERANOS S1 0 - 5 0.592 1.20 1.14 S2 5 - 20 0.240 1.56 1.49 S3 20 - 150 0.135 4.56 - S4 150 - 1000 0.033 14.6 -
ST 0 - 1000 1.0 2.17 1.42A
A When simulating the total source with ERANOS, all neutrons above 20 MeV (16.8%) were placed in the highest energy group (14.2 to 19.6 MeV).
However, since the ERANOS libraries are currently limited to neutrons below 20 MeV, the value of ϕ* for the total source is much lower (ϕ*ERANOS = 1.42) than the MCNPX value (ϕ*MCNPX = 2.17). A large fraction (∼ 35%) of the total value of ϕ* is actually not reflected in the ERANOS results. This is something one should bear in mind when calculating ϕ* for a spallation source with ERANOS or any other “low”-energy reactor code.
IV. CONCLUSIONS
Numerical simulations have been performed with
MCNPX and ERANOS to investigate the neutronic properties of a sub-critical model (keff = 0.95) representative of the on-going MUSE-4 experiments, coupled to a
spallation source (1000 MeV protons impinging on a lead target). The system has been studied in terms of source efficiency (ϕ*).
The efficiency of the total spallation source was found
to be 2.21, which could be compared to ϕ* for a (d,t)- and a (d,d)-source, coupled to the same system (ϕ*d,t = 2.12 and ϕ*d,d = 1.34, respectively). To analyse this rather high value of ϕ*, the spallation source was artificially split into four energy bins and the efficiency of each bin was determined. It was found that the two high-energy bins (En > 20 MeV) contribute for about 50% to ϕ* and to the total number of fission neutrons produced in the core. This can be explained by the fact that primary neutrons born with high energy from spallation give birth to a large number of lower-energy

neutrons, which in turn induce fissions. This finding indicates the need for extending reactor analysis code capabilities above 20 MeV for more detailed investigations of high-energy spallation neutron effects.
Comparisons of ERANOS and MCNPX calculations of
ϕ* were found to be in good agreement for the energy bins below 20 MeV. However, as ERANOS does not take into account neutrons above 20 MeV, it largely underestimates the total value of ϕ*. This effect should be remembered when calculating ϕ* with reactor codes that do not account for neutrons above 20 MeV.
AKNOWLEDGEMENTS
This research work is supported and partly funded by the Swedish Centre of Nuclear Technology, SKB AB (Sweden), CEA/Cadarache (France) and the European Commission, DGRTD, under Contract # FIKW-CT-2000-00063.
REFERENCES
1. M. SALVATORES, “Accelerator Driven Systems (ADS), Physics Principles and Specificities,” J. Phys. IV France 9, pp. 7-17 –7-33 (1999).
2. M. DELPECH et al., “The Am and Cm Transmutation – Physics and Feasability,” Proc. Int. Conf. Future Nuclear Systems, GLOBAL’99, August 30-September 2, 1999, Jackson Hole, Wyoming, American Nuclear Society (1999).
3. M. SALVATORES, M. MARTINI, I. SLESSAREV, “MUSE-1: A first Experiment at MASURCA to Validate the Physics of Sub-Critical Multiplying Systems Relevant to ADS,” Kalmar, Sweden, June 3-7 (1996).
4. R. SOULE, M. SALVATORES, R. JACQMIN, “Validation of Neutronic Methods Applied to the Analysis of Fast Sub-Critical Systems: The MUSE-2 Experiments,” GLOBAL’97, page 639 (1997).
5. J. F. LEBRAT et al., “Experimental Investigation of Multiplying Sub-Critical Media in Presence of an External Source Operating in Pulsed or Continuous Mode: The MUSE-3 Experiment,” ADTTA’99 (1999).
6. L. S. WATERS, “MCNPXTM User´s Manual – Version 2.1.5,” Los Alamos National Laboratory, November 14, (1999).
7. J.Y. DORIATH et al, “ERANOS 1: The Advanced European System of Codes for Reactor Physics Calculation,” Int. Conf. on Mathematical Methods and Super Computing in Nuclear Application, 19-23 April 1993, Kongresszeutrum, Karlsruhe, Germany (1993).
8. P. SELTBORG, R. JACQMIN, “Investigation of Neutron Source Effects in Sub-Critical Media and Application to a Model of the MUSE-4 Experiments,” Int. Meeting on Mathematical Methods for Nuclear Applications, Mathematics and Computation, September 9-13, 2001, Salt Lake City, Utah, USA (2001).
9. R. E. PRAEL, H. LICHTENSTEIN, “User Guide to LCS: The LAHET Code System,” LA-UR-89-3014, Los Alamos National Laboratory (1989).
10. MCNPTM – A General Monte Carlo N-Particle Transport Code – Version 4B,” LA-12625-M, J. F. BRIESMEISTER, Ed., Los Alamos National Laboratory, (1997).
11. R. E. PRAEL R, M. BOZOIAN, “Adaptation of the Multistage Pre-equilibrium Model for the Monte Carlo Method (1),” LA-UR-88-3238, Los Alamos National Laboratory Report, September (1998).
12. H. W. BERTINI, Phys. Rev. 131, 1801, (1969).
13. G. PALMIOTTI et al, ”BISTRO Optimized Two Dimensional Sn Transport Code,” Topical Meeting on Advances in Reactor Physics, Mathematics and Computation, April 1987, Paris, France (1987).
14. K. TUCEK et al., “Source Efficiency in an Accelerator-Driven System with Burnable Absorbers,”, Int. Conf. on Back-End of the Fuel Cycle: From Research to Solutions, GLOBAL 2001, Paris, France (2001).
15. S. ATZENI et al., “Statistical Fluctuations in Monte Carlo Simulations of a Sub-Critical System,” CERN-LHC-97-012-EET, CERN (1997).

APPENDIX VII
Y. Efimov, W. Gudowski, Checklist for TC-1 Target Test

1
Checklist for TC-1 Target Test
This document contains background information on the Project 559 Target Complex operations and sensors as evidenced by the LabVIEW display of the data acquisition and control system, followed by checklists for a series of verification tests to document performance of the target complex. This verification testing represents the conclusion of the ISTC Agreement 559, and the checklists, along with the associated data files, stand as record to the actual performance of the target complex prior to any future associated experimental work.

2
Heating TC-1 • Temperatures throughout the loop should be reach desired operating range (approx. 200°C) and the
heaters should be able to maintain them within this range - heating should be performed with both primary and backup heaters
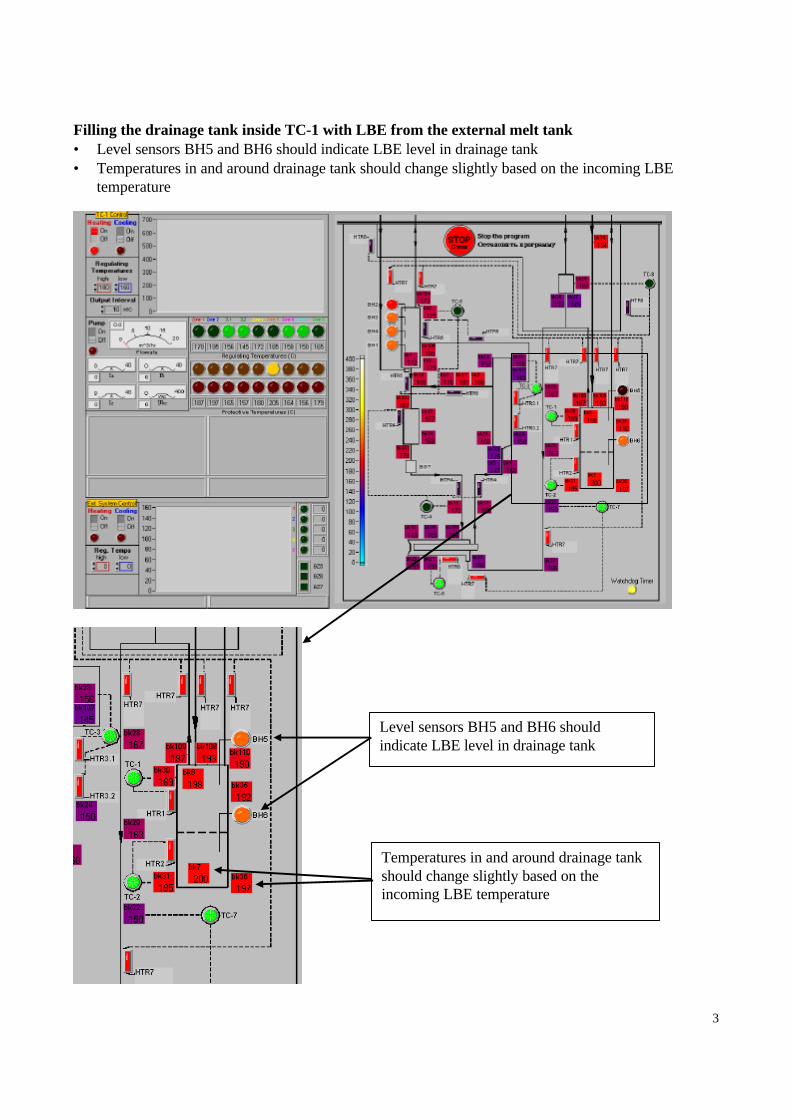
3
Filling the drainage tank inside TC-1 with LBE from the external melt tank • Level sensors BH5 and BH6 should indicate LBE level in drainage tank • Temperatures in and around drainage tank should change slightly based on the incoming LBE
temperature
Level sensors BH5 and BH6 should indicate LBE level in drainage tank
Temperatures in and around drainage tank should change slightly based on the incoming LBE temperature

4
Filling the TC-1 loop from the drainage tank • Temperatures throughout the loop should change slightly based on the incoming LBE temperature • Level sensor BH5 indicator light should turn off indicating that LBE level in drainage tank has
dropped • Level sensor indicator lights for BH1, BH2, BH3, and BH4 in expansion tank should turn on
indicating LBE present in expansion tank
Level sensor BH5 should turn off
Level sensors BH1, BH2, BH3 and BH4 should turn on

5
Turning the pump on • Temperatures throughout the loop should change slightly based on the circulation of LBE • Pump voltage, current, and flow rate should be indicated on the dial gauges • During pump operation, temperatures throughout the loop will gradually rise until limiting
temperatures are reached and the pump shuts off
Temperatures throughout the loop will gradually rise until limiting temperatures are reached
Pump voltage, current, and flow rate should be indicated

6
Draining the loop back into the drainage tank • Level sensor BH5 indicator light should turn on indicating that LBE level in drainage tank has risen • Level sensor indicator lights for BH1, BH2, BH3, and BH4 in expansion tank should turn off
indicating LBE has drained from expansion tank

7
Check List for Operational Testing Run 1 Objective: Operation testing of TC-1 starting from with heat-up from room temperature, followed by loop fill, pump operation, and loop drainage. Date of test:___16.04.01 – 23.04.01______________________ Name of data file (to be distributed by e-mail to [email protected], [email protected], [email protected], …..) _data 160401.txt, data 170401.txt, data 170401-1.txt, data 190401.txt, data 190401-1.txt _________________ Preheating: Temperature Set Point (°C): __low:190 °C, high: 200 °C (on regulative termocouples) Comments on temperature distribution, heat-up rates, locations of maximums and minimums, anomalies and concerns: 1. 16.04.01 the computer programm of TC-1 heating was started from room temperature to
temperature Set Points at first back up heaters were tested. 17.04.01 the same TC-1 tests were made using primary heaters from the preheated conditions that were reached in the previoustest. Temperature distribution, heat-up rates are in the files: data 160401.txt, data 170401.txt, data 170401-1.txt.
2. The inertial temperature exceeding above high Set Points were fixed on all sones after heaters were switched off. The maximum inertial temperature exceeding were fixed on regulative thermocouples 255 °C – 260 °C.
3. The heater number 6 (Target) can provide the temperature no more than 180 °C on regulative thermocouple
4. When temperatures of all zones achieves Set Points and are stabilized all zones have temperature that allow the loop filling from drainage tank
Verify: Data file contains complete heat-up history from room temperature start: ___data 160401.txt, data 170401.txt, data 170401-1.txt_________ Filling of the Loop from the Drainage Tank (drainage tank previously filled): Verify LBE in drainage tank and expansion tank (loop) is empty: Level sensor BH5 on (indicator lit): ____on_______________ Level sensor BH6 on (indicator lit): _____on______________ Level sensor BH1 off (indicator not lit): __off________________ Level sensor BH2 off (indicator not lit): __off________________ Level sensor BH3 off (indicator not lit): __off_________________ Level sensor BH4 off (indicator not lit): __off_______________ Transfer LBE to loop. (Slow pressurization of drainage tank with argon.)

8
Verify: Level sensor BH5 goes off (indicator light goes off): goes off ___________________ Level sensor BH1 comes on (indicator light comes on): comes on ___________________ Level sensor BH4 comes on (indicator light comes on): ___comes on ____________ Record pressure on analogue pressure gage on drainage tank side at end of transfer: ____0,02 MPa (excessive) _______________ Record pressure on analogue pressure gage on expansion tank side at end of transfer: 0,02 MPa (excessive) __________________ Verify pressure equalized between drainage tank, expansion tank, and siphon interrupt device prior to start-up. Note system pressure 0,28 MPa (excessive):___________________________ Comments on loop fill: Anomalies, changes in temperature, etc: 1. In the course of TC-1 loop filling coolant level in the expansion tank was specially rised. Level
indicators BH3 and BH2 were activated. Then coolant level was lowered to operation value and sensors BH2 and BH3 were switched off.
2. Data on temperature and level sensors indication are in the file data 180401.txt Loop Operation: Pump on. Ramp up pump speed to design flow rate (14.2 m3/hr). Verify: Flow rate: __9,5 m3/hr, 13,0 m3/hr, 14,0 m3/hr_______________ Pump voltage: _152 B, 209 B, 218 B, 60? ?_________________ Pump current A: _50,8 A, 71,6 A, 72,5 A____________________ Pump current B: __49,2 A, 69,3 A, 70,2 A___________________ Pump current C: __52,6A, 73,8 A, 75,1 A__________________ Operate at design flow until maximum pump temperature reaches 335 °C (emergency signal). Pump off. Comments on loop operation: Anomalies, changes in temperature (isothermality), uniformity of flow rate, uniformity of pump parameters, changes in level indicators, etc: 1. The pump parameters are stable. 2. Flow rate was maintained on the level 14,0 m3/hr. 3. By flow rate 14,0 m3/h pump was in operation 58 min and was switched off when emergency signal
was produced on pump vessel temperature (BK13) 335 °C (set point) after that temperature of pump vessel achieved 347 °C and stabilized. Temperatures of expansion tank, heat exchanger and adjacent pipelines were 320°C – 350 °C. Temperature of the target vessel was 250 °C – 270 °C, temperature of drainage tank was maintained automatically (by programm) 20 °C – 250 °C.
4. Additional data concerning the pump starts are presented in files data 190401.txt, data 190401-1.txt.

9
Draining the loop (LBE back to drainage tank): Verify LBE in expansion tank, and drainage tank is empty: Level sensor BH1 on (indicator lit): _____on______________ Level sensor BH4 on (indicator lit): _____on______________ Level sensor BH5 off (indicator not lit): __off_________________ Level sensor BH2 off (indicator not lit): __off_________________ Level sensor BH3 off (indicator not lit): __off_________________ Level sensor BH6 on (indicator lit): __on_________________ Transfer LBE to drainage tank. (Slow pressurization of expansion tank with argon.) Verify: Level sensor BH4 goes off (indicator light goes off): goes off ___________________ Level sensor BH1 goes off (indicator light goes off): goes off ___________________ Level sensor BH5 comes on (indicator light comes on): comes on ___________________ Record pressure on analogue pressure gage on drainage tank side at end of transfer: ____0,15 MPa (excessive) _______________ Record pressure on analogue pressure gage on expansion tank side at end of transfer: ____0,3 MPa (excessive) _______________ Verify pressure equalized between drainage tank, expansion tank, and siphon interrupt device prior at end of transfer. Note system pressure: ____0,02 MPa (excessive) _______________ Comments on loop drainage: Anomalies, changes in temperature, etc: 1. All temperatures were stabilized within limits. 2. Anomalies have not been fixed Signature of Observer (Dr. Gudowski): _______________________________ Signature of IPPE Project 559 Leader (Dr Yefimov):____________________________ Date:______________________

10
Check List for Operational Testing Run 2 Objective: Repeat operation testing of TC-1. Run may start from the preheated condition of the previous test; i.e., it is not necessary to repeat heat-up from room temperature. Date of test:___18.04.-1 – 19.04.01______________________ Name of data file (to be distributed by e-mail to [email protected], [email protected], [email protected], …..) _data 180401-1.txt_________________ Preheating: Temperature Set Point (°C): low:190 °C, high: 200 °C (on regulative termocouples) Comments on temperature distribution, locations of maximums and minimums, anomalies and concerns: 1. All temperatures were stabilized within limits. 2. The heater number 6 (Target) can provide the temperature no more than 180 °C on regulative
thermocouple Filling of the Loop from the Drainage Tank: Verify LBE in drainage tank and expansion tank (loop) is empty: Level sensor BH5 on (indicator lit): ___on________________ Level sensor BH6 on (indicator lit): ___on________________ Level sensor BH1 off (indicator not lit): off___________________ Level sensor BH2 off (indicator not lit): off___________________ Level sensor BH3 off (indicator not lit): off___________________ Level sensor BH4 off (indicator not lit): off___________________ Transfer LBE to loop. (Slow pressurization of drainage tank with argon.) Verify: Level sensor BH5 goes off (indicator light goes off): goes off ___________________ Level sensor BH1 comes on (indicator light comes on): comes on ___________________ Level sensor BH4 comes on (indicator light comes on): comes on ___________________ Record pressure on analogue pressure gage on drainage tank side at end of transfer: ____0,28 MPa (excessive) __________ Record pressure on analogue pressure gage on expansion tank side at end of transfer: ____0,02 MPa (excessive) _____________ Verify pressure equalized between drainage tank, expansion tank, and siphon interrupt device prior to start-up. Note system pressure: ____0,02 MPa (excessive) _____________ Comments on loop fill: Anomalies, changes in temperature, etc:

11
1. Loop temperatures are stabilized within limits 190 °C – 200 °C 2. Anomalies have not been fixed Loop Operation: Pump on. Ramp up pump speed to design flow rate (14.2 m3/hr). Verify: Flow rate: __14,0 m3/h_______________ Pump voltage: ____218 B______________ Pump current A: _________72,5 A____________ Pump current B: _________70,5 A____________ Pump current C: _________75,1 A___________ Operate at design flow until maximum pump temperature reaches 335 °C (emergency signal). Pump off. Comments on loop operation: Anomalies, changes in temperature (isothermality), uniformity of flow rate, uniformity of pump parameters, changes in level indicators, etc: 1. The flow rate is maintained on the level of 14,0 m3/hr 2. By the flow rate 14,0 m3/hr the pump was in operation 58 min and was switched off when
emergency signal was produced on pump vessel temperature (BK13) 335 °C (set point) .After that the pump vessel temperature achieved 351 °C and stabilized.
Draining the loop (LBE back to drainage tank): Verify LBE in expansion tank, and drainage tank is empty: Level sensor BH1 on (indicator lit): _______on____________ Level sensor BH4 on (indicator lit): _______on____________ Level sensor BH5 off (indicator not lit): ____off_______________ Level sensor BH2 off (indicator not lit): ____off_______________ Level sensor BH3 off (indicator not lit): ____off_______________ Level sensor BH6 on (indicator lit): ____on_______________ Transfer LBE to drainage tank. (Slow pressurization of expansion tank with argon) Verify: Level sensor BH4 goes off (indicator light goes off): goes off ___________________ Level sensor BH1 goes off (indicator light goes off): goes off ___________________ Level sensor BH5 comes on (indicator light comes on): comes on ___________________ Record pressure on analogue pressure gage on drainage tank side at end of transfer: ____0,15 MPa (excessive) ____ Record pressure on analogue pressure gage on expansion tank side at end of transfer: ____0,3 MPa (excessive) ____

12
Verify pressure equalized between drainage tank, expansion tank, and siphon interrupt device prior at end of transfer. Note system pressure: ____0,02 MPa (excessive) ____ Comments on loop drainage: Anomalies, changes in temperature, etc: 1. All temperatures were stabilized within limits. 2. Anomalies have not been fixed Signature of Observer (Dr. Gudowski): _______________________________ Signature of IPPE Project 559 Leader (Dr Yefimov):____________________________ Date:______________________

13
Run 3: Check on overfill of expansion tank. Objective: Document the operation of all level sensors, and the ability of TC-1 to recover from an overfill condition. Third run may start from the preheated condition of the previous test; i.e., it is not necessary to repeat heat-up from room temperature. Date of test:______23.04.01___________________ Name of data file (to be distributed by e-mail to [email protected], [email protected], [email protected], …..) ___data 230401.txt_______________ Preheating: Temperature Set Point (°C): low:190 °C, high: 200 °C (on regulative termocouples) Comments on temperature distribution, locations of maximums and minimums, anomalies and concerns: 1. All temperatures were stabilized within limits. 2. The heater number 6 (Target) can provide the temperature no more than 180 °C on regulative
thermocouple Filling of the Loop from the Drainage Tank (drainage tank previously filled): Verify LBE in drainage tank and expansion tank (loop) is empty: Level sensor BH5 on (indicator lit): _____on______________ Level sensor BH6 on (indicator lit): _____on______________ Level sensor BH1 off (indicator not lit): __off_________________ Level sensor BH2 off (indicator not lit): __off_________________ Level sensor BH3 off (indicator not lit): __off_________________ Level sensor BH4 off (indicator not lit): __off_________________ Transfer LBE to loop and overfill of expansion tank. (Slow pressurization of drainage tank with argon.) Verify: Level sensor BH5 goes off (indicator light goes off): goes off ___________________ Level sensor BH6 on (indicator light lit): ________on___________ Level sensor BH1 comes on (indicator light comes on): comes on ___________________ Level sensor BH4 comes on (indicator light comes on): comes on ___________________ Level sensor BH3 comes on (indicator light comes on): comes on ___________________ Level sensor BH2 comes on (indicator light comes on): comes on ___________________ Record pressure on analogue pressure gage on drainage tank side at end of transfer: ____0,28 MPa (excessive) ____ Record pressure on analogue pressure gage on expansion tank side at end of transfer: _____0,02 MPa (excessive) ____

14
Comments on loop overfill: Anomalies, changes in temperature, performance of level indicators, etc: 1. Anomalies have not been fixed Draining the loop (LBE back to drainage tank): Verify LBE in expansion tank, and drainage tank is empty: Level sensor BH1 on (indicator lit): _____on______________ Level sensor BH4 on (indicator lit): _____on______________ Level sensor BH5 off (indicator not lit): __off_________________ Level sensor BH2 on (indicator lit): _____on______________ Level sensor BH3 on (indicator lit): _____on______________ Level sensor BH6 on (indicator lit): __on_________________ Transfer LBE to drainage tank. (Slow pressurization of expansion tank with argon) Verify: Level sensor BH2 goes off (indicator light goes off): goes off ___________________ Level sensor BH3 goes off (indicator light goes off): goes off ___________________ Level sensor BH4 goes off (indicator light goes off): goes off ___________________ Level sensor BH1 goes off (indicator light goes off): goes off ___________________ Level sensor BH5 comes on (indicator light comes on): comes on ___________________ Level sensor BH6 comes on (indicator light comes on): comes on ___________________ Record pressure on analogue pressure gage on drainage tank side at end of transfer: ____0,15 MPa (excessive) ____ Record pressure on analogue pressure gage on expansion tank side at end of transfer: ____0,3 MPa (excessive) ____ Comments on loop drainage: Anomalies, changes in temperature, level indicators, etc: 1. Anomalies have not been fixed Signature of Observer (Dr. Gudowski): _______________________________ Signature of IPPE Project 559 Leader (Dr Yefimov):____________________________ Date:______________________

15
Run 4: Loop Cool Down Data Record Objective: A data record of cool down rates for later performance verification. Date of test:____23.04.01____________________ Name of data file (to be distributed by e-mail to [email protected], [email protected], [email protected], …..) __data 230401.txt ________________ System is at temperature, following any previous operational test, and the system is in normal isothermal or near isothermal mode following a transfer of LBE out of the loop and back to the drainage tank. The computer programm of TC-1 heating must be off. Verify all heaters are off:__when all zones reached room temperature Comments: 1. Anomalies have not been fixed 2. Temperature distribution, heat-up rates are in file: data 230401.txt Signature of Observer (Dr. Gudowski): _______________________________ Signature of IPPE Project 559 Leader (Dr Yefimov):____________________________ Date:______________________

APPENDIX VIII W. Gudowski, A. Polanski, I. V. Puzynin, V. Shvetsov, ”Monte Carlo Modeling of a Sub-Critical Assembly Driven with the Existing 660 MeV JINR Protons Accelerator”, Proc. Accelerator Applications 2001 and ADTTA 2001 “Nuclear Applications in the New Millennium”, Reno (USA). ANS (2001)

1
MONTE CARLO MODELING OF A SUB-CRITICAL ASSEMBLY DRIVEN WITH THE EXISTING 660 MEV JINR PROTONS
ACCELERATOR.
W. Gudowski*, A. Polanski, I. V. Puzynin, V. Shvetsov
*Royal Institute of Technology, 100 44 Stockholm, Sweden
Joint Institute for Nuclear Research, 141980 Dubna, Moscow region, Russia
Abstract - A sub-critical assembly driven with the existing 660 MeV proton accelerator at the Joint Institute for Nuclear Research (JINR) in Dubna has been modelled in order to choose optimal parameters for an experimental set-up. Different combinations of the target, fuel and reflector materials have been considered. Future experiments may also be used for validation of new computer codes merging high and medium energy particle transport with a conventional neutron transport models.
I. INTRODUCTION
Joint Institute for Nuclear Research in Dubna together with foreign collaborators from CEA-Cadarache, CIEMAT-Madrid, FZK-Karlsruhe and KTH-Stockholm has proposed a project to develop and construct a Subritical Assembly in Dubna (SAD) driven by the existing phasotron accelerator of protons with energy 660 MeV. A subcritical core will be fuelled with MOX fuel elements containing a mixture uranium and weapon grade plutonium oxides.
In order to optimise the parameters of this assembly and to choose the most flexible experimental set-up a series of simulations have been performed using MCNP4B/C [1], LAHET [2] and MCNPX [3] codes. Different fuel compositions surrounded by different reflectors have been tested, as well as few different spallation target materials have bee investigated.
II. MAIN CHARACTERISTICS OF SAD
The conceptual design of the SAD facility (SAD) is based on a subcritical MOX core with a nominal thermal power of 20 kW. This corresponds to the multiplication coefficient keff = 0.95 for the accelerator beam power of 1kW [4], [5].
A design of SAD installation – see Table I - includes:
• The proton accelerator with energy 660 MeV; • Beam transport line; • Replaceable targets of various length and
material: Pb, W, Pb/Bi; • Subcritical core with fuel elements of a BN-
600 type; • Reflector and radiation shielding; • Systems of air-cooling of target and blanket; • Safety and monitoring systems.
The proton beam is to be transported horizontally to the target through a vacuum track provided by a concrete shielding. The proton beam will impinge on the target placed in a steel tube. Surrounding subcritical core will be set up with MOX fuel placed in a stainless steel vessel. The lead reflector will surround the subcritical core. A beryllium reflector will be placed behind the lead reflector in order to perform additional studies with moderated neutrons and to increase experimental flexibility of this assembly.
The installation will be placed in accelerator hall surrounded with a concrete wall with thickness of about 2 meters.
Subcritical assembly will be placed inside the concrete container that provides radiation safety at all modes of operations of installation. Figure 1 shows a schematic layout of SAD-setup which has been intensively studied in different fuel-reflector configurations. We have considered a standard fuel batch used in a BN-600 fast reactor. The distance between fuel batch centers has been 96 mm. The fuel designed for the fast breeder BN-600 reactor will be adopted for the core of the SAD-facility. The 127 fuel elements are located in a hexagonal stainless steel fuel batch. The fuel elements with external diameter equal to 6.9 mm consists of a stainless steel tube 0.4 mm thick with the plutonium and uranium oxides mixture. These fuel elements contain the fuel pallets with 27%PuO2 + 73%UO2 of average density of 10 g/cm3. The content of 239Pu in PuO2 is not less than 95%. Uranium in oxide is depleted to 0.4% of 235U.
The diameter of a fuel pellet is equal to 5.8 mm. The full length of a fuel element is about 108 cm, while the core length is 50 cm.
III. RESEARCH PROGRAM OF SAD
The following research topics are foreseen for SAD experiments:

2
1. Studies of the coupling between a spallation target and a subcritical assembly, development of techniques for measurement and control of physical parameters of the facility (e.g. reactivity and subcriticality level)
2. Measurement of keff and absolute value of a power gain of installation;
3. Studies of the spallation target including spallation neutron yields and spectra for: a. Different target materials (Pb, W, Pb-Bi) b. Different target sizes c. Different shapes of a target interface
surface and optimization of the target shape.
d. Different position of the target in the subcritical assembly. Investigations of the spallation neutron source importance and the resulting consequence on the
global energy gain of the ADS. All targets will be instrumented for monitoring neutron and proton fields. Post irradiation analysis of the targets is foreseen.
4. Validation of the codes and nuclear data supporting development of ADS
5. Specific properties of systems using fuels that include Pu with very large fraction of 239Pu.
6. The measurement of the contribution of high-energy (E >10 MeV) neutrons and protons in particular studies of neutron shielding for a high energy neutron tail.
7. Post-mortem analysis of the spallation target and special samples (transuranic isotopes) including radiochemical analysis
Table I. Main final design parameters of the SAD assembly Fuel MOX, 27% PuO2 + 73% UO2. U-depleted (0.4 % of 235U) Pu composition 239Pu - 95.0%, 240Pu – 4.5%, 241Pu – 0.5 % Fuel pins diameter 5.8 mm Fuel density 10 g/cm3 Length of the fuel elements (core height) 50 cm Fuel core diameter (with Pb target) ~50 cm Weight of loaded fuel 350 kg keff 0.95 Thermal power 20 kW Proton beam energy 660 MeV Beam power 1.0 kW Spallation target diameter 8 - 9 cm Neutron flux ~1012 n/cm2s
Figure 1. A schematic model of the SAD subcritical assembly as simulated for different set-up. (green - lead, violet - fuel elements, blue – stainless steel, yellow-spallation target (Pb,Pb-Bi or W), rose – vacuum.

3
IV. MODELLING OF THE SAD-FACILITY
The MCNP4B/C, LAHET and MCNPX codes
have been used to model different configurations of the SAD-facility. In order to choose the best fuel-reflector configurations for SAD the geometrical modelling has been performed using MCNP standard
ENDFB6.4 and ENDFB6.5 libraries [1], [6]. Table II summarizes results of these
investigations. Based on these results one can see that SAD set-up with a Pb-reflector and keff ~ 0.95 can be realised with about 350 kg of the MOX fuel. This option has been chosen for the final SAD-design.
IV.A. Investigations of different MCNPX high energy transport models on the SAD set-up.
One of the possible SAD set-up has been
recalculated with different modes of high energy transport available in MCNPX v. 2.1.5 [3].
IV.A.1. Bare spallation target studies
A bare spallation neutron target of Pb – as presented on Fig. 2 - has been studied first in order to investigate the neutron yields, neutron spectra and proton scattering out from the target.
Neutron yield from Pb target of 82 mm radius is 15.5 neutrons/proton or 23.8 n/p×GeV.
Fig. 3 presents spectra of the spallation neutrons emerging from the target in different directions, i.e.
crossing surfaces 1 - forward, 5 - backward or 12 - side. Results labelled with “/150 lib” were obtained using CEM-model (Cascade, Evaporation Multi-fragmentation) and 150 MeV neutron data libraries for Pb, other results were obtained using standard 20MeV neutron data libraries and high-energy transport models above this energy. Maximum of the neutron energy is - as expected –at about 2.5 MeV corresponding to the evaporation neutrons. In the backward direction there is a visible peak between 20 and 30 MeV corresponding most probably to the peak
of different neutron interactions around this energies. There is no visible effects of applying the neutron data libraries over 20 MeV in the spallation neutrons emerging from the target, except for the neutrons emerging in the backward direction. In the energy interval from 20 to 80 MeV, high energy interaction models give somewhat higher values. This is a
Table II. Results of SAD-configuration modeling for different material and geometrical options.
Fuel density (g/cm3)
Core height
No of Fuel batches
Weight of MOX fuel, kg
Reflector Material
keff
1 10.2 50 18 357 Pb 0.965 ± 0.0012
2 10 50 18 350 Pb 0.948 ± 0.0011
3 9.6 50 18 335 Pb 0.930 ± 0.0010
4 8.6 30 12 + 6 halves
180 Be 0.945 ± 0.0011
5 8.6 50 6 100 Be 0.948 ± 0.0011
Figure 2. Geometrical model of a bare spallation target.
10-8 10-7 10-6 10-5 10-4 10-3 10-2 10-1 100 101 102 10310-10
10-9
10-8
10-7
10-6
10-5
10-4
10-3
10-2
Forward Backward Side Forward/150 lib Backward/150 lib Side/150 lib
Neutron flux through surfaces - Pb target, 8.2 cm - CEM-model
Neu
tron
s*cm
-2 p
er o
ne p
roto
n
E, Mev
Figure 3. Spectra of the spallation neutrons emerging from the spallation target. /150 lib indicates simulations performed with 150 MeV data library. Forward – neutrons passing surface 1 – see Fig.2; Backwards – neutrons passing surface 5; Side – neutrons passing surface 12 (side of the cylinder).

4
general pattern of discrepancies between the results of high energy transport codes and experiments and also applications of cross section data in this region for different isotopes like Fe, Ni, Pb etc. [7]
Table III summarizes the discrepancies of the results for spallation neutron yields modelled with different options of MCNPX. It is generally considered that spallation neutron production is one of the least sensitive results for different HET models. However, it is visible in Table III that discrepancies are definitely not negligible, well over 15 % between the different models. With existing experimental technique we hope to be able with SAD facility and accompanied experimental activities to measure spallation neutron yields with sufficiently small errors in order to be able to contribute to the improvement of models and data in the energy range of 20 – 600 MeV. Table III. Spallation neutron yield for different HET-modes in MCNPX. Model Neutrons/proton
(standard deviation well below 1 %)
CEM 15.5 CEM + 150 MeV lib 15.1 Bertini 17.6 Isabel 16.8
High-energy protons leaking from the spallation target and entering subcritical core can be a potential source of severe material damages around the spallation target area. It has been shown that ~ 2.0% of protons are not contained in the spallation target, most of them (1,98%) are scattered to the side of the target and can directly enter the core damaging the walls and fuel elements. Only a small fraction of the protons – 0.02 % leak from the target in the forward direction, some of these protons pass the target without a single interactions building up a small peak on the spectrum at 660 MeV – see Fig. 4.
Figure 4 presents spectra of the protons leaking
from the spallation target. “Forward” stands for protons passing surface 1 of the target – see Fig. 2, “Side” – stands for protons passing the side of target cylinder. Most of the protons leaking aside to the subcritical core have energy peaking at 200 – 300 MeV and lower, following the shape of ionisation interactions. Protons in forward direction have two pronounced peaks, one at 660 MeV corresponding to protons passing through without interactions, and another one at about 30-40 MeV coming most probably from the multiple scattering effects. This figure should be compared with Fig. 9 on which leakage of protons is compared for different targets.
IV.A.2. Comparison of the spallation target simulations with experimental results
A series of experiment has been performed in Dubna using a phasotron proton beam [8], [9]. The experimental target was assembled from the four equal cylinders of natural lead. Each cylinder was of 12.5 cm length and 8.2 cm in diameter. The target was enclosed in a 1,5 mm thick stainless steel cylinder. The proton beam extracted from the phasotron with timing stretching passed through the narrow collimator of a carbon absorber in order to reduce the original proton current of ∼0.2 µA down to intensity of 109 ÷ 1010 s-1. The proton beam was focused at the centre of the target by the coupled quadrupole magnetic lens. Location and dispersion of the proton beam was controlled during the experiment with a help of the beam position monitor. The spatial distribution of the protons in front of the target was measured by the matrix of the thermoluminescent detectors to have the average standard deviation of 4.2 mm.
For absolute monitoring of the number of protons interacting with the target the thin ionization chamber (25 cm of diameter) was placed in 30 cm up-stream the target. The effective air thickness between chamber electrodes was 6 mm and high voltage bias was chosen equal to 850 V. These conditions caused a negligible level of protons recombination into the chamber. The chamber current through 2 meters cable leaked in the current-frequency converter with sensitivity 37.5 imp⋅nC-1. The current-frequency converter calibration with direct current source showed that up to 105 imp⋅s-1 rate its integral nonlinearity was less than 0.2%.
The absolute calibration of the beam current chamber was carried out with thin carbon-contained activation detectors (10 cm of diameter) placed directly on the chamber surface. The calibration procedure was repeated four times at different beam intensity within the real beam intensity range. The detector activities were measured by the gamma-spectrometer very thoroughly with account to the real source-detector geometry and self-absorption processes. The cross section of the 12C(p,pn)11C reaction was taken equal to 27 ± 1 mb. The resulting
10-1 100 101 102 10310-6
10-5
10-4
10-3
10-2
10-1
Forward Side
Proton spectrum through surfaces of Pb target, 8.2 cm - CEM-model
Pro
tons
/Sou
rce
prot
on
E, Mev
Figure 4. Spectra of proton leaking from the spallation target. “Forward” stands for protons passing surface 1 – see Fig.2, “Side” – for protons passing surface 12.

5
error of the number of protons per cm-2 measurements was estimated as 5÷6 % (including the reaction cross section error, methodological and statistical errors taking into account irradiation time). The chamber conversion factor was determined to be 6.18×10⁵ proton⋅imp -1.
The measurement of the energetic distribution of the neutrons generated in the target was performed at this stage using a conventional multisphere technique (Bonner Spheres). This technique is considered to be rather imprecise for the demanding physical experiments with targets, but it is a basic tool in radiation protection measurements in mixed scattered radiation fields. The advantages of this technique are a very wide energy range (from thermal neutron to the energy of impinging protons), insensitivity for charged particles and good selectivity for gamma rays. Moreover, it is a simply technique which does not require any sophisticated instruments. This method requires, however, sophisticated procedures for unfolding of neutron spectra and gives relatively poor results in energy region above several tens MeV.
The measurements were performed using a multisphere neutron spectrometer with a LiI(Eu) crystal (4 mm of height and 4.3 mm of diameter) enriched up to 90% with 6Li. The spectrometer was coupled with the spectrometric photomultiplier. A set of polyethylene spherical moderators of 2, 3, 5, 7, 8, 10 and 12 inches in diameter was used [8], [9].
The unfolded neutron spectra require a solution of the Fredholm integral equation system of the 2nd kind:
dE)E()E(Nmax
min
E
Eii ⋅⋅= ∫ ϕΦ (1)
where Φ (E) – the neutron spectrum, ϕi(E) – the response function of the i- sphere, Ni – neutron counts for the i-sphere. The set of the response functions have been calculated using the MCNP code up to neutron energy of 20 MeV. For higher neutron energies up to 1.5 GeV the calculation of the response functions were performed using the HADRON code [9]. Unfortunately, it was not possible to verify or calibrate experimentally the response functions for neutron energies above 14 MeV. The calibration of the response functions for all spheres was done with a standard 252Cf source with neutron yield known within 5% accuracy. The errors of the unfolded spectrum presented as standard deviation of the spectrum function at the given neutron energy, are not really easy to assess in this methodology due to the systematic errors introduced in unfolding calculations and they should be interpreted with a special attention.
Figure 5 shows results of the neutron spectrum measurements at different angles in comparison with the computer simulations of LAHET and MCNPX using different options for high-energy transport
physics. For all 3 angles the experimental data are well reproduced by the simulations for neutron energies below 2 MeV. Above 2 MeV agreement between experiment and simulations become to be poor, worsening even more with the decreased angle. Experimental data does not exhibit a pattern of the “shoulder” on the high-energy part of the spectrum curve, which is very visible on simulation curves, particularly for lower angles. A smooth shape of the experimental data is caused by the imprecise experimental technique. The multisphere technique is not well suited for precise spectroscopic measurements, particularly at this high-energy neutron range. The precision of the experimental data in this energy region is also heavily biased by the experimental difficulties to calibrate response functions above 14 MeV.
The differences between various high-energy transport models used in LAHET and MCNPX codes seem to be very small for this type of experiments and much more precise and refined measurements
10-4 10-3 10-2 10-1 100 101 102 103 104
10-1
100
101
102
103
104
105o
Comparison of Calculated and Experimental Neutron Spectra
Experimental Spectrum LAHET - Bertini INC + ENDFB5 MCNPX - Bertini INC + ENDFB6 MCNPX - Dubna INC + LA150 MCNPX - Dubna INC + ENDFB6 MCNPX - Isabel INC + ENDFB6
10-4 10-3 10-2 10-1 100 101 102 103 104
10-1
100
101
102
103 75o
(E*F
(E),
Neu
tron
/cm
2 per
Uni
t Let
harg
y)
10-4 10-3 10-2 10-1 100 101 102 103 104
10-1
100
101
102
10345o
E, MeV
Figure 5. Comparison of experimental results of the neutron spectrum measurements at different angles with computer simulations of LAHET and MCNPX using different options for a high-energy transport. Label at upper figure specifies options.

6
and better statistics in simulations are needed to make any conclusions concerning the performance of the specific models. This is in principle a good message for those who simulate accelerator-driven systems – neutron yields and their spectra in high-energy region are not very sensitive on different models used for high-energy transport simulations.
IV.B. Studies of different set-up options for SAD
Before the final design of SAD was chosen a series of studies had been performed to assess important physical parameters of different target-subcritical core arrangements. Special attention was focused on a subcritical core design, which would minimize the amount of required fuel elements. A simplified core set-up with a beryllium or lead reflectors was studied with 2 different targets of 9 and 18 cm diameters. See Fig. 6 for details.
The calculated quantities were: the neutron multiplication coefficient, the neutron spectra at different places (“detectors”) inside subcritical assembly and the energetic gain G of system.
Few options for the fuel have been considered with 27% and 35% of a plutonium dioxide (PuO2) contents. These fuel options cover the range of the effective fuel density from 8.6 to 10 g/cm 3. The results of these calculations for lead target and lead reflector are presented in Table IV.
Table IV. The neutron multiplication coefficient keff for different size of target and different percentage of PuO2 Fuel density (g/cm3) keff 9 cm diameter target and 27% of PuO2 9.5 0.92711 +/-0.00263 10.0 0.94831 +/- 0.00310 18 cm diameter target and 35% of PuO2 9 0.90103 +/- 0.00263 9.5 0.93262 +/- 0.00305 10.0 0.96131 +/- 0.00310
According to Table IV, it was found that it is possible to reach keff = 0.95 for the effective fuel density less then 10.0 g/cm 3
Figure 7 presents neutron spectra averaged over small volumes of the subcritical set-ups depicted on Figure 6. Calculations were performed for protons with energy 660 MeV and 1 kW beam power impinging 9 cm diameter lead target enclosed in a subcritical set-up with lead and lead + beryllium reflectors.
Neutron fluxes of 2.23×1012 cm-2s-1, 1.36×1012 cm-2s-1, 9.21×1011 cm-2s-1, and 5.71×1011 cm-2s-1 at volumes 1,2,3 and 4, respectively, corresponding to the upper part of Fig. 7, were obtained for the subcritical assembly with only lead reflector. keff for this setup was 0.948. Neutron fluxes of 1.21×1013 cm-
2s-1, 5.92×1012 cm-2s-1, 9.41×1012 cm-2s-1, and 2.85×1012 cm-2s-1 at volumes 1,2,3 and 4, were
obtained for the subcritical assembly with the lead + beryllium reflector at keff=0.985.
Figure 8 shows neutron spectra calculated for the subcritical assembly presented on lower part of Fig. 6, i.e. the setup with the 18 cm diameter spallation target with lead reflector and to two different targets: lead or tungsten. Neutron fluxes at volumes 1,2,3 and 4 were estimated to 1.64×1012 cm-2s-1, 9.85×1011 cm-
2s-1, 6.80×1011 cm-2s-1, and 5.04×1011 cm-2s-1, respectively, for the assembly with lead target. For the setup with tungsten target the neutron fluxes at volumes 1, 2, 3 and 4 were estimated to 4.48×1011cm-
2s-1, 2.74×1011cm-2s-1, 1.89×1011 cm-2s-1, and 1.14×1011 cm-2s-1, respectively.
Several conclusions follow from the presented results: (i) different neutron spectra can be formed inside the assembly - from a very hard neutron spectrum hard the core to epithermal ones in lead reflector; (ii) fast neutron flux is about 10 12 cm –2 s-1 (iii) the combined lead-beryllium reflector alters very strongly the neutron spectra in all regions except for the fuel, (iv) the beryllium reflector strongly increase keff (0.98) and the neutron flux in all regions of subcritical assembly due to moderation of the neutron
Figure 6. Simplified models of SAD-facility for target-core simulations. Upper figure – 9 cm target diameter model with 27% PuO2, lower figure – 18 cm target diameter model with 35% PuO2. Colors symbolize different materials: green – lead, violet – MOX-fuel, blue – steel, light blue – air, dark green iron and air mixture, yellow – lead or beryllium. Circles show volumes at which the neutron spectra have been calculated. Dimensions in cm.

7
spectra, (v) the tungsten target strongly decrease keff (0.91) and the neutron flux in all regions of subcritical assembly due to increased neutron absorption in the target.
The energetic gain, G calculated by using MCNPX code for presented systems with keff ~ 0.95 is about 20.
The results of calculations have shown that a beryllium reflector allows to decrease significantly the amount of the required MOX fuel (See Table 2, 100 kg). For lead-beryllium reflector a whole range of the neutron spectra from very hard to thermal can be obtained, with a remarkably flat pattern in Be (see green line in Fig. 7, lower part, exhibiting a constant lethargy pattern over the 8 energy decades). Using only lead reflector with the lead target fast and epithermal neutron fluxes about 1012 cm-2s-1 can be obtained. For subcritical setup with the 18 cm diameter lead target and lead reflector we can use 15 standard assemblies of BN-600 reactor and 300 kg of the fuel with 35% of PuO2. The neutron multiplication in this case reaches a value of 0.95. For subcritical set-up with the 9 cm diameter lead target 8 standard assemblies of BN-600 reactor and 350 kg of fuel with 27% of PuO2 can be used. The neutron multiplication in this case will be 0.95 with energetic gain of about 20.
Finally, proton leakage from the spallation target was studied for different target diameters and 2 target materials. Fig. 9 shows an integrated proton flux over all target surfaces. The figure shows clearly that 9 cm target scatters out to the core structure well over one order of magnitude more protons (50 times more). It may have severe consequences for the radiation damages in constructional materials adjacent to the spallation target.
V. CONCLUSIONS
Based on extensive simulation studies the final setup of SAD facility has been chosen. Existing simulation tools, in particular MCNPX, are sufficiently precise to design such a facility. High energy particle transport options used in MCNPX give not a significant impact on the neutronic characteristics of SAD-like experiments. It implies that such experiments may be reliably simulated without special sensitivity analysis, but on the other hand they can hardly be used for a precise validation of the high-energy transport modules.
100 101 102 103
105
106
107
108
109
Proton flux leaking from the target
9 cm diameter Pb target 19 cm diameter W target 19 cm diameter Pb target
Pro
tons
/cm
2 per
one
kW
pro
ton
beam
pow
er
Proton energy E, MeV
Figure 9. Proton flux leaking the spallation target of different diameters and different materials.
10-9 10-8 10-7 10-6 10-5 10-4 10-3 10-2 10-1 100 101 102 103105
106
107
108
109
1010
1011
1012
NEUTRON SPECTRA
1 2 3 4
Neu
tron
s/cm
2 per
one
kW
pro
ton
beam
pow
er
10-9 10-8 10-7 10-6 10-5 10-4 10-3 10-2 10-1 100 101 102 103105
106
107
108
109
1010
1011
1012
Neutron energy E, MeV
Figure 7. Neutron spectra at volumes 1,2,3 and 4 (Fig. 6, upper) for 9 cm spallation target set-ups. Upper picture – the lead reflector set-up (keff= 0.948), lower picture – the lead-beryllium reflector set-up (keff= 0.985).
Figure 8. Neutron spectra at volumes 1,2,3 and 4 (see Fig. 6, lower) for 18 cm spallation target set-ups. a) – the lead target and lead reflector set-up (keff= 0.951); b) – the tungsten target and lead reflector set-up (keff= 0.914)
10-8 10-7 10-6 10-5 10-4 10-3 10-2 10-1 100 101 102 103104
105
106
107
108
109
1010
1011 a)
1 2 3 4
Neu
tron
s*cm
-2 p
er o
ne k
W p
roto
n be
am p
ower
10-8 10-7 10-6 10-5 10-4 10-3 10-2 10-1 100 101 102 103104
105
106
107
108
109
1010
1011 b)
Neutron energy E, MeV

8
It has been shown that experimental results on a simple spallation target can be properly normalized and show remarkable agreement with simulations in the energy range below few MeV. High energy measurements require, however, a much better methodology and more refined experimental technique in order to match accuracy of the results necessary for conclusive comparisons.
The next step of these studies will be investigations of kinetics of SAD-facility. As indicated by the results presented in this paper, such studies will require thorough modeling of the whole environment of SAD-facility including building wall, floors etc. Neutrons moderated in these structures entering back into SAD facility may significantly affect time characteristics.
VI. REFERENCES. [1] J.F. Briesmeister (Ed.). "MCNP - A General
Monte Carlo N-Particle Transport Code". Report LA-12625-M, Los-Alamos National Laboratory, New Mexico, USA.
[2] R.E. Prael, H. Lichtenstein. "User Guide to LCS: The LAHET Code System". Report LA-UR- 89-3014, Los-Alamos National Laboratory, New-Mexico, USA .
[3] L. S. WATERS, “MCNPXTM User´s Manual – Version 2.1.5,” Los Alamos National Laboratory, November 14, (1999). See also http://mcnpx.lanl.gov
[4] V. N. Shvetsov et al., “Construction of the subcritical assembly with combined neutron spectra driven by proton accelerator at proton’s energy 660 MeV for experiments on long lived fission products and minor actinides transmutation”, ISTC application, 2001 and private communications.
[5] A. Polanski. "Monte Carlo Modeling of Electronuclear Processes in Experimental Accelerator Driven Systems". XXVI Mazurian Lakes School of Physics 1-11 September 1999, Krzyze, Poland. A NATO Advanced Research Workshop 2-4 SEPTEMBER 1999. Acta Physica Polonica, January 2000, Vol.B31-Number 1.
[6] For details see for example http://www.nea.fr/html/dbdata/
[7] A. J. Koning, Processing and validation of intermediate energy evaluated data files, Final report of Subgroup 14 of the Working Party on Evaluation Coordiantion of the Nuclear Science Committee, NRG-Petten, 2000.
[8] Bamblevski V.P., Krylov A.R., Polanski A. Timoshenko G.N. Shvecov V.N. “The investigation of the Radiation Field Around the Thick Lead Target Irradiated By The 660 MeV Protons. Part.1. The neutron spectra
measurement around the target”. JINR Preprint E1-2000-307, Dubna, 2000.
[9] Bamblevski V.P., Krylov A.R., Polanski A. Timoshenko G.N. Shvecov V.N. “The investigation of the Radiation Field Around the Thick Lead Target Irradiated by the 660 MeV Protons. Part.2. The measurements of the angular and spatial distributions of the hadron’s yeld from the target”. JINR Preprint E1-2000-308, Dubna.

APPENDIX IX Daniel Westlén, “A Cost Benefit Analysis of an Accelerator Driven Transmutation System”, Msc Tehsis, Kungliga Tekniska Högskolan, Stockholm, 2001.
i
TABLE OF CONTENTS
Table of contents ...........................................................................................................................................i
Disclaimer ................................................................................................................................................... iii
Abbreviations ..............................................................................................................................................iv
1 Background.............................................................................................................................1
1.1 Nuclear wastes ...................................................................................................1
1.2 The fission process ............................................................................................3
2 Goal and method....................................................................................................................8
3 Present knowledge .................................................................................................................9
4 Transmutation......................................................................................................................10
4.1 Physical properties of ADS .............................................................................10
4.2 System design ..................................................................................................13
4.3 The Sing-Sing core design...............................................................................15
5 Fuel cycles..............................................................................................................................17
6 Accelerators ..........................................................................................................................18
6.1 Cyclotrons........................................................................................................18
6.2 Linear accelerators...........................................................................................20
7 Partitioning techniques .......................................................................................................21
7.1 Liquid – liquid aqueous partitioning ...............................................................21
7.2 Chromatographic reprocessing ........................................................................22
7.3 Pyrochemical partitioning................................................................................22
8 Unit costs ...............................................................................................................................23
8.1 Calculation models ..........................................................................................23
8.2 Description of unit costs ..................................................................................24
9 Unit parameters ...................................................................................................................28
9.1 Description of unit parameters ........................................................................28
10 Results....................................................................................................................................29
10.1 Cost of electricity.............................................................................................29
10.2 Sensitivity analysis ..........................................................................................31
11 Conclusions ...........................................................................................................................38

ii
12 Final remarks: Aspects of advanced nuclear fuel cycles...............................................39
12.1 Radiation hazards ............................................................................................39
12.2 Proliferation risks ............................................................................................40
12.3 Social aspects of transmutation .......................................................................40

iii
DISCLAIMER
Paragraph six of the Swedish nuclear technology law reads:
”6 § Ingen får utarbeta konstruktionsritningar, beräkna kostnader,
beställa utrustning eller vidta andra sådana förberedande åtgärder
i syfte att inom landet uppföra en kärnkraftsreaktor.”
”6 § No one may prepare blue prints, calculate costs,
order equipment or commit other preparative actions
aiming at, within the country [Sweden], constructing
a nuclear reactor.”
The authors hereby declare that currently we have no intentions to build a nuclear reactor in
Sweden.

iv
ABBREVIATIONS
ADS Accelerator Driven System
Am Americium
BOL Beginning of Life
BWR Boiling Water Reactor
COE Cost of Electricity
Cm Curium
DOE US Department of Energy
EOL End of Life
ENEA Italian energy agency
EPRI US Electric Power Research Institute
FBR Fast Breeder Reactor
GWd/t Gigawatt days per tonne
Gy Gray
HLW High Level Waste
HM Heavy Metal
IAEA International Atomic Energy Agency
kgHM kilogram heavy metal
kWe kilowatt electric
kWh kilowatt hour
LHC Large Hadron Collider
LLFP Long Lived Fission Product
LWR Light Water Reactor
MOX Mixed Oxide Fuel
MWth Megawatt thermal
O&M Operations and Maintenance
Pu Plutonium
PUREX Plutonium and Uranium extraction process
PWR Pressurised Water Reactor
SSC Sing-Sing Core
U Uranium

1
1 BACKGROUND
1.1 Nuclear wastes
During it’s over fifty years of operation nuclear installations have been producing increasing
amounts of highly radioactive waste. The spent fuel of the nuclear power plants contributes to the
main part of the waste. In some countries nuclear weapon programs have also produced
considerable amounts of radioactive wastes, however those wastes have different form and
composition compared to the commercial nuclear wastes. Also industry and health care produce
non-negligible amount of radioactive wastes from their routine use of radioactive isotopes and
advanced nuclear facilities, like particle accelerators.
1.1.1 Nuclear processes
In a nuclear reactor there are two dominating processes generating radioactive isotopes: nuclear
fission and neutron capture. The dominating process is the nuclear fission reaction. A heavy
element, e.g. uranium or plutonium, absorbing a neutron undergoes nuclear fission and forms two
or three nuclei. Fission may produce any of the isotopes lighter than the element fissioned.
However the most probable is that the heavy nucleus splits into two parts, one with a mass just
above half the initial mass, and another with a mass just below half the initial mass. These fission
products are in most cases radioactive isotopes decaying rather fast through a chain of beta
decays. Only a few of the radioactive fission products, like 99Tc, 129I and some others, are long-
lived.
The other process is the capture of neutrons. Uranium is the most abundant element in thermal
reactors. With some finite probability uranium nuclei capture neutrons and - instead of fissioning
- they form heavier isotopes. These isotopes decay through beta or alpha decay and form other
elements. By successive neutron captures and decays, elements such as plutonium, neptunium,
americium and curium are produced. These are usually referred to as minor actinides (MA). The
probability of neutron capture varies with neutron energy. This will show to be a very important
property when designing reactors dedicated to burn minor actinides. Fresh light water reactor
(LWR) fuel consists of uranium oxide - UO2. About 95-97 percent of the uranium composition is 238U and 3-5 percent fissionable1 235U. As the fuel in a reactor is burned out, the composition
changes. When the fuel eventually gets removed from the reactor, it still consists of over 90
weight percent uranium. Most of the 235U is burnt out, so the remaining uranium is mostly 238U.
1See ”The fission process”, page 3

2
There is about 0,7 weight percent 235U left and there is also some 236U, produced by neutron
capture in 235U.
About one weight percent of the spent fuel is plutonium. The minor actinides comprises another
0,1 weight percent. [1]
1.1.2 Uranium and the transuranic elements
Uranium is from a radiotoxic point of view is not a major problem to the biosphere. The uranium
isotopes found in nature have very long half-lives – Appendix A. Hence, they are not especially
radioactive. Most of the fission products are short-lived in comparison to the transuranic
elements. Typically their half-lives are less than 100 years. From the long-time waste
management point of view, the heavy transuranic elements are the most problematic ones. They
are still very radioactive, even though their half-lives are relatively long. Especially plutonium
and americium are cumbersome due to their relatively high abundances. Neptunium and curium
also appear in the spent fuel, but in significantly lesser amounts.
Figure 1: The radiotoxicity of spent UOX-fuel. The left graph shows the radiotoxicity of the transuranic elements. To the left the radiotoxicity of the fission products is shown. It is obvious from the graphs that the main problem in the short time scale is the fission products. The transuranic elements are the main problem on a long time scale [2].
1.1.3 Technetium
As mentioned before, only a few fission products contribute to the long-time problems for waste
management. One of them, 99Tc with the half-life of 214000 years, may be a good candidate for
transmutation through neutron capture. However storing 99Tc geologically in Sweden does not
pose a major problem. In the chemical environment of the Swedish granite bedrock, technetium

3
does not exist in mobile forms. In the US geological storage in Yucca Mountain2 though, 99Tc is a
problem since it is mobile in the acid chemical environment of volcanic ashes found there.
1.1.4 Iodine
For most of the planned geological disposal sites 129I will create problems due to its volatility and
chemical reactivity. There are a few options to handle 129I. Today the isotope is released into the
atmosphere at reprocessing plants. This is a major radiation source to people working in the
reprocessing industry. It may be possible to transmute 129I if it is first formed into NaI. But it
requires an isotopic separation from a stable 127I-isotope in order to avoid the activation of 127I.
Another possibility is separating the iodine from the rest of the wastes, stabilise it as some
chemical compound and finally put it into a geological disposal. Today release of the iodine into
the atmosphere is considered to be a technically acceptable solution. However with increased
reprocessing, 129I release will at some point start becoming problematic due to the sixteen million
year half-life and consequent build up of radioactive iodine in the atmosphere.
1.1.5 Waste handling options
Two methods are seriously considered to handle radioactive wastes. One is to isolate the wastes
from the biosphere by placing them in a safe place, usually in a geological formation, and then
wait for them to decay. Geological formations and a proper design of waste containers have to
guarantee in practice “an eternal” isolation from the biosphere. Most nuclear countries try to
adopt this strategy. Geological disposals are being planned in several places around the world.
The setback of the repositories is their “eternity”. Since we have to wait for transuranic elements
to decay, the time the storage has to be closed is in the order of several hundreds of thousands
years.
One other possibility is to fission the minor actinides into lighter elements before storing them.
Since the lighter elements have much shorter half-lives, a waste consisting of only fission
products would need to stay for a considerably shorter time in the repository.
1.2 The fission process
In a fission reactor, the nuclei of heavy elements are split into lighter elements. The matter
remaining after the process is somewhat less than the original mass. The difference has been
transformed into energy.
The binding energies of nucleons – neutrons and protons - in different nuclei are different. Nuclei
with an atomic mass of about 56 atomic mass units, thus containing about 56 nucleons, are the
2Yucca Mountain is the geological repository being built in the United States. http://www.ymp.gov

4
tightest bound. Heavier nuclei are less strongly bound. One would need to pull harder to pick out
a strongly bound nucleon than a loosely bound one from a nucleus. Also one would gain more
energy when merging an extra nucleon with a nucleus in the 56-nucleon area than with a heavier
nucleus. Fissioning a nucleus implies going from a comparatively loosely bound structure to a
more tightly bound one closer to the 56-nucleon area. The idea of a utilisation of nuclear power
is to release the difference in energy between heavy and lighter nuclei, and to transform it into
some useful energy like heat or electricity. The composition of the nuclei also has an impact on
binding energy. An even number of both neutrons and protons (even-even) results in higher
binding energy than a composition with an odd number of either neutrons or protons. Nuclei with
odd numbers of both neutrons and protons (odd-odd) have low binding energies and are often
very unstable.
Figure 2: The binding energy per nucleon as function of mass number. The highest binding energies exist in the 56-nucleon area [3].
In principle all elements made up of more than 56 nucleons are fissionable. But in practice it is
not so simple. There is a Coulomb barrier in the nucleus that has to be overcome. The nucleus
simply prefers status quo. However, if the nucleus gets excited to an energy level above the
Coulomb barrier, it will fission.
In a critical fission reactor, one uses a fuel of isotopes that have an even number of protons (e.g.
Th, U or Pu) and an odd number of neutrons. When a neutron hits and penetrates a nucleus of
such an isotope, the nucleus becomes even-even. Since even-even nuclei have higher binding

5
energies some energy has to be released. This energy excites the nucleus and brings it over the
coulomb barrier. The nucleus fissions.
The transuranic elements in the nuclear waste are, from a waste management perspective,
interesting to fission into lighter isotopes with shorter half-lives. However as discussed above not
all isotopes are suitable of fissioning, particularly not using neutrons of low energy. Isotopes with
even numbers of protons and odd numbers of neutrons have the highest probability, i.e. cross-
sections, for being fissioned with neutrons. Hence some isotopes have to be altered into
fissionable isotopes to reach a reasonable probability of fissioning.
Proton and neutron content changes in the reactor environment through neutron capture or alpha
and beta decays. In a beta decay, the number of protons in a nucleus increases by one and the
number of neutrons decreases by one. Phenomenologically it can said that in a beta decay a
neutron in a nucleus is converted into a proton, while releasing an electron and an accompanying
anti-neutrino. A nucleon in a neutron environment always has a chance to capture a neutron. The
probability, expressed by the nuclear cross-section, is different for different nuclei and for
different neutron energies.
10-3 10-2 10-1 100 101 102 103 104 105 106 107
Energy (eV)
10-2
10-1
100
101
102
103
104
σ (b
arns
)
238 U
capture
fission
10-3 10-2 10-1 100 101 102 103 104 105 106 107
Energy (eV)
10-2
10-1
100
101
102
103
104
σ (b
arns
)
239 Pu
capture
fission
Figure 3: The neutron capture and fission cross-sections for 238U and 239Pu
Moreover the neutron capture and fission rates are proportional to the density of capturing nuclei
and to the neutron flux.
The neutron flux is given by
(1)
n - number of neutrons
v - neutron velocity
The reaction rate is given by
∫=Φv
dvvn )(

6
(2)
σ - microscopic cross section for the reaction
N - number of nuclei per volume in the target, number density
V - target volume
Σ - macroscopic cross section.
In a critical reactor the neutron flux has to be high – in the range from 1013 to 1014 n/cm2s - in
order to maintain the required power level determined by the fission rate. Fuel for critical power
reactors is engineered to suit reactor operation. In a transmutation reactor the fuel must be
different due to the different operational conditions. Fuel has to be designed to facilitate burn-up
of a certain isotope mix as efficient as possible. The fuel designed for transmutation purposes will
react differently than ordinary reactor fuel on temperature changes. The temperature reactivity
feedback is one of the main reasons why a transmutation system has got to have an external
neutron source. The external neutron source ensures a subcritical operation with a required power
level without a self-sustained chain reaction. Also the external source gives the possibility to
counteract any undesired mode of operation or a power excursion.
Neutrons are really tricky to handle. They are not charged, so there is no simple way to accelerate
them or to bend a neutron beam. The most efficient, intensive source of neutrons besides the
fission process itself is spallation. Spallation is the process where neutrons are emitted out of
nuclei in a powerful collision with a high-energy charged particle. For transmutation reactors
proton beams hitting a target of a heavy material such as lead or tungsten are proposed as a
neutron source. This is why we refer to these reactors as Accelerator Driven Systems (ADS). The
spallation target would be located in the middle of the reactor core. By controlling the proton
current from the accelerator, the reactor power could be altered.
VNVF ΣΦ=Φ= σ

7
Figure 4: Spallation processes [4]
Throughout the ADS operation fuel composition constantly changes as heavy nuclei fission into
lighter ones and neutrons are captured by nuclei. When the amount of heavy elements decreases,
the beam power, and hence the neutron flux, has to be increased to maintain the required power
level. Eventually there is not enough fissionable material left to maintain the ADS operation. The
decrease of transuranic isotopes up to this point is called the burn-up of the system. When
designing an ADS system, a high burn-up is very desirable because it determines the
transmutation efficiency. The ultimate goal is to fission all of the transuranic atoms. A high burn-
up system can achieve this faster and cheaper. Another important design parameter is the beam
power. For economical reasons it is desirable to construct a system with a low beam power. For
safety reasons the reactor should be sub-critical with some margin to becoming critical. It is also
desirable, both for economic and safety reasons, to run the reactor with the same beam power all
the time. Running an ADS with a large variation of the beam power may be risky because of the
potential increase in beam power, which would immediately be followed by an increase in reactor
power.

8
2 GOAL AND METHOD
The nuclear fuel cycle is the whole path of the reactor fuel from the mine to the final disposal. In
a once through fuel cycle material is used only once. A closed fuel cycle involves recycling of
reactor fuel in order to utilize fissile isotopes built up from 238U. Closed fuel cycles use
significantly less uranium and also produce far less waste than does the once through cycle. The
somewhat misleading phrase “closed” suggests the same fuel would be used forever. This is not
true of course, but the fuel does get used much more efficient than in the once through cycle. The
closure of the nuclear fuel cycle is an important research topic in many countries. Several designs
of ADS have been proposed to address this issue [5], [6]. Also several fuel cycles are being
discussed. Some aspects of the fuel cycles are of a special interest. First, the transmutation
efficiency is very important. The efficiency is strongly connected to the time needed and the cost
to transmute the wastes. Radiation hazard is another important issue. Transmutation will increase
safety for human generations to come. However it might increase the exposure of radiation to
people living today. The risk of proliferation of nuclear weapon usable materials has to be given
serious concern. In a fuel cycle with extensive reprocessing it will be easier to find highly
enriched elements compared to the once through fuel cycle. However, after a few hundred years
of storage, disposed wastes from light water reactors will make up a prime plutonium ore. It will
be possible to mine the plutonium, as radioactivity will have become low enough for industrial
handling of the material. Geological disposal means postponing the proliferation risks.
On top of these aspects, there is the question of economics. The technology for accelerator driven
transmutation and for the reprocessing seems realistic today without major unresolved technical
issues even if some elements of these technologies require very intensive development. Moreover
there is no consensus on the costs for implementation of a transmutation strategy on a large scale.
When assessing costs of a complex technological system, there are two main strategies to choose
between. One may either adopt a bottom up or a top down approach. A bottom up strategy means
calculating the costs of individual components and eventually summing up to reach an overall
cost estimate. The top down approach is based on unit costs estimations for flows through
different parts of the system.
In this paper we try to – via a top down approach - calculate costs for a fuel cycle based on the
Sing-Sing core design [7] considering a Swedish perspective3. A rather simple model based on
unit costs, mass flows and losses have been used to calculate fuel cycle costs and costs of
electricity.
3Please read disclaimer, page i

9
All calculations have been performed assuming a steady state, where all mass flows have levelled
out. In practice steady state is a very unlikely situation. It would take a very long time to reach
steady state. More likely is a situation where Sweden builds ADSs that in the beginning run
together with LWRs. Eventually the LWRs are closed and the transmutation of waste continues
for the following century4 or so.
3 PRESENT KNOWLEDGE
There is a lot of information available on the costs for running light water reactors. Costs of
uranium, LWR fuel fabrication and so on are well known. There are also several estimates
published concerning the short and long-term developments of these costs. Also the costs of
producing, burning and reprocessing MOX fuel are fairly well known.
The EPRI report “A Review of the Economic Potential of Plutonium in Spent Nuclear Fuel” from
1996 [17] contains an Appendix C in, which the breakeven uranium ore cost for plutonium to be
a competitive fuel is calculated. Several interesting cost estimations were performed in this work.
The “Global ‘95” international conference on evaluation of emerging nuclear fuel cycle systems
contains new estimations of fuel cycle costs. B. G. Chow wrote “Plutonium Economics and the
Civilian Nuclear Future” where both MOX fabrication and reprocessing costs are presented
together with estimations of fixed charge rates for nuclear power investments [16].
The OECD/NEA produced several reports on nuclear fuel cycles over the years. The most recent
OECD/NEA publication containing a lot of information in this field is the not yet published
“Trends in the Nuclear Fuel Cycle” [15].
Both the american and European scientists published “roadmaps” for accelerator driven
transmutation of nuclear wastes [5], [6]. The two reports are suggestions on how to reach a
situation with a running transmutation system, starting from the present situation. This includes
estimations of the associated costs of research and construction.
The advanced fuel cycles though are not as well examined. Experience originates mainly from
fast reactor programs. A few estimates have been done concerning reprocessing of and fuel
fabrication from really radioactive material. Two reports are the prime sources of information in
this field. There is the US ATW roadmap [5] and there is the MIT-NFC-TR-019 by D. Kim et al.
[21]. Both reports try to find the costs of the advanced fuel cycles. However since there is
4Transmuting the last fuel would take a very long time since the amounts get so small. It would be reasonable to cooperate between countries to handle the last wastes. The “one century” mentioned is meant to give the reader an order of magnitude, not as an exact prediction.

10
basically no industrial experience in this field, all figures originate from small scale experiments
and subsequent estimations.
Fuel cycle calculations for advanced nuclear fuel cycles have been performed. R. A. Krakowski
of PSI in Switzerland has been working on this for a long time [26]. Those calculations were
based on a number of unit costs and parameters. Krakowski spends at lot of effort on the
sensitivity analysis his results. The calculations performed in this work are similar to the ones
performed by Krakowski, but have been tailored to fit the Sing-Sing core design.
4 TRANSMUTATION
4.1 Physical properties of ADS
The goal of an ADS is to decrease the long-lived radiotoxic inventory of finally disposed waste.
The main contributors to the spent fuel radiotoxicity are - in a long time perspective - the
transuranic elements - Figure 1. We are interested in transmuting those into short-lived fission
products. When designing a transmuter, one has to look for a design that favours the fission
reactions of the transuranic elements over the capture of neutrons in those elements. Energy
dependence of neutron cross sections show - Figure 5 - that the fission to capture ratio goes up
with increasing neutron energy for all the isotope of interest. However working with a harder5
neutron spectrum in combination with the decrease of the uranium content of the core leads to
some operational control problems.
10-2 10-1 100 101 102 103 104 105 106 107
Energy (eV)
10-4
10-3
10-2
10-1
100
101
102
103
104
σ (b
arns
)
237 Np
capture
fission
10-3 10-2 10-1 100 101 102 103 104 105 106 107
Energy (eV)
10-2
10-1
100
101
102
103
104
σ (b
arns
)
239 Pu
capture
fission
5 A hard neutron spectrum is a high-energy neutron flux.

11
10-3 10-2 10-1 100 101 102 103 104 105 106 107
Energy (eV)
10-2
10-1
100
101
102
103
104σ
(bar
ns)
242 Cm
capture
fission
10-3 10-2 10-1 100 101 102 103 104 105 106 107
Energy (eV)
10-2
10-1
100
101
102
103
104
σ (b
arns
)
241 Amcapture
fission
Figure 5: The neutron caption and fission cross-sections for some important transuranic elements. At high neutron energies fission dominates over capture.
A reactor working with neutrons in the thermal6 spectrum is dependent on a medium moderating
the neutrons to thermal energies. A good moderator is water, which can also be used as coolant.
In a water cooled, water moderated reactor, loss of coolant will lead to a decrease of reactivity
and consequently to reactor shutdown. In nuclear systems with fast neutron spectrum use of water
is clearly prohibited by physics since water is an efficient moderator that thermalizes the
neutrons. Therefore other coolants are used such as Na, Pb, Pb/Bi or gas. Loss of coolant7 in such
a system in most cases increases the reactivity and contributes to dangerous positive temperature
reactivity feedbacks.
The Doppler effect in uranium fuel ensures another important feedback in light water reactors.
When temperature of the reactor fuel increases the nuclei in this fuel get higher thermal
vibrations. This process increases the neutron capture probability due to the Doppler effect in
neutron capture cross-section8 resonances. The Doppler effect gives a prompt negative feedback
to temperature increases by increasing the capture of neutrons. This effect is especially strong for 238U, having very large resonances. However, capture reactions in 238U leads to increased
production of transuranic isotopes. The purpose of the transmuter is to reduce the amount of
transuranic material. Hence 238U content in the transmuter has to be kept as low as possible.
Absence of 238U severely reduces the negative Doppler feedback to reactivity.
6Thermal neutrons have low energies, typically in the order of 0,25 eV. 7 Metal coolants are the most common. 8The cross-section is a measure of the interaction probabilities between particles. It is expressed as the area of a particle “seen” by another particle. The unit is “barn”. 1 barn = 10-28m2.

12
10-3 10-2 10-1 100 101 102 103 104 105 106 107
Energy (eV)
10-2
10-1
100
101
102
103
104σ
(bar
ns)
238 U
capture
fission
Figure 6: 238U has very strong resonance peaks, which Doppler effect broadens when temperature increases.
The smooth and reliable power control of the thermal reactors fuelled with uranium is ensured by
a control of the delayed neutrons. Delayed neutrons are released from fission products within
seconds after the fission reaction. The neutrons released directly in the fission reactions are
referred to as prompt neutrons. The life time of the prompt neutrons in a reactor core is orders of
magnitude shorter than the time delay corresponding to release of delayed neutrons Therefore, the
thermal reactor is designed in such a way that prompt neutrons themselves are not sufficient to
maintain the self-sustained chain reaction. The delayed neutrons constitute for those extra
neutrons needed for the reactor to become self-sustained, i.e. critical. Since these neutrons are
released after much longer time compared to the life-times of prompt neutrons, the reactor
operation is determined by these longer time-constants. It is virtually impossible to control a
reactor which runs on prompt neutrons only, the increase of power is driven by the very fast
increase of neutron flux determined by the short life-time of the prompt neutrons. These changes
are very rapid compared to the thermal hydraulic time constants determining efficient cooling of
the reactor core. The delayed neutrons appear relatively abundantly when fissioning uranium.
With plutonium or minor actinides as a fuel the fraction of delayed neutrons is reduced
significantly.
In conclusion, when replacing the uranium fuel with transuranic fuel and simultaneously
hardening the neutron spectrum, all three major phenomena of inherent safety of the thermal
uranium reactor are lost. Something has got to be done in order to improve the safety of the
transmuter.
To increase the safety of the transmuter, the best solution is not to let the fission reaction be self-
sustainable. This solution requires an external neutron source, which constantly supplies the
reactor with the extra neutrons needed to maintain the fission reaction rate under normal

13
operation, and cuts the neutron source in case of unexpected events. Such a system would operate
in steady state until the external neutron source was switched off.
4.2 System design
4.2.1 Accelerator
An accelerator driven transmutation system consists of four main parts; the proton accelerator,
the spallation target, the reactor core and the fuel reprocessing facility.
The accelerator has one task only. It should deliver an intense and reliable current of protons.
Beam stops are very undesirable, since a loss of beam shuts down the nuclear reaction. There are
a few options for accelerators needed for ADS. First of all a decision has to be made whether to
use a linear accelerator or a cyclotron9. A second choice is whether to use one or several
accelerators per reactor. Using more than one accelerator decreases the probability of reactor
shutdown due to beam stops. But cost may also increase. A different option is to use one (or
more) very powerful accelerator and split the beam between several cores. This solution was
suggested by the US ATW roadmap [5]. However there is a major safety concern to this kind of
solution. If the beam would lock on one of the cores when operating at full power, the sudden
power increase at this core would lead most probably to a severe accident. For such a design a
single beam stop would lead to the shutting down of several transmuters simultaneously. If the
transmuters are to be used for electricity production, this raises very high demands on the
electrical grid, especially on reserve capacity.
4.2.2 Target
The spallation target is to be manufactured from heavy elements, having neutron rich nuclei with
small cross-sections for neutron capture reactions. Lead, lead-bismuth eutectic alloy and tungsten
have been suggested. As the spallation target is placed inside the reactor core, the environment is
rather hot. Both lead and bismuth are present in their liquid states.
4.2.3 Target window
The accelerator beam pipe has to operate under vacuum. But, it still has to stay in contact with the
liquid metal spallation target. A kind of “window” has to be placed in between the beam pipe and
the spallation target. This spallation window has got to be thin to let through most of the particle
beam. But, it will also have to be extremely radiation resistant in order to withstand the intense
particle beam passing through it. In fact radiation induced material damage to the spallation
9The characteristics of accelerators are discussed in a separate chapter.
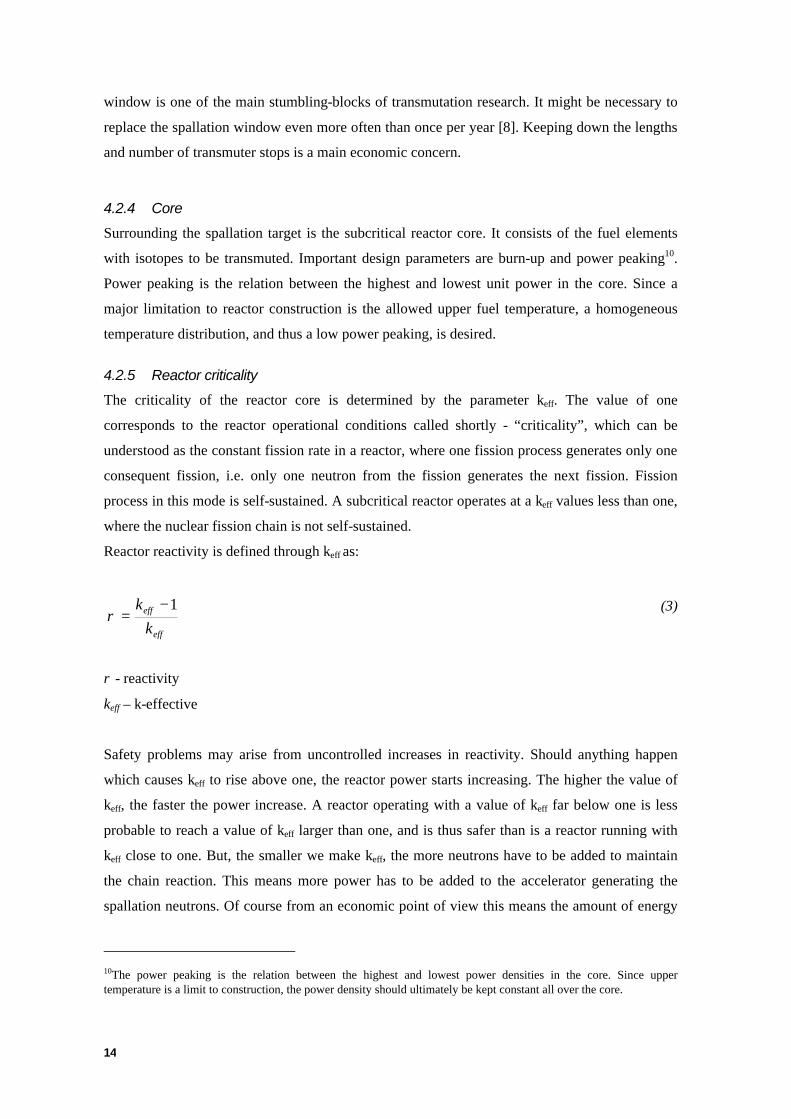
14
window is one of the main stumbling-blocks of transmutation research. It might be necessary to
replace the spallation window even more often than once per year [8]. Keeping down the lengths
and number of transmuter stops is a main economic concern.
4.2.4 Core
Surrounding the spallation target is the subcritical reactor core. It consists of the fuel elements
with isotopes to be transmuted. Important design parameters are burn-up and power peaking10.
Power peaking is the relation between the highest and lowest unit power in the core. Since a
major limitation to reactor construction is the allowed upper fuel temperature, a homogeneous
temperature distribution, and thus a low power peaking, is desired.
4.2.5 Reactor criticality
The criticality of the reactor core is determined by the parameter keff. The value of one
corresponds to the reactor operational conditions called shortly - “criticality”, which can be
understood as the constant fission rate in a reactor, where one fission process generates only one
consequent fission, i.e. only one neutron from the fission generates the next fission. Fission
process in this mode is self-sustained. A subcritical reactor operates at a keff values less than one,
where the nuclear fission chain is not self-sustained.
Reactor reactivity is defined through keff as:
(3)
ρ - reactivity
keff – k-effective
Safety problems may arise from uncontrolled increases in reactivity. Should anything happen
which causes keff to rise above one, the reactor power starts increasing. The higher the value of
keff, the faster the power increase. A reactor operating with a value of keff far below one is less
probable to reach a value of keff larger than one, and is thus safer than is a reactor running with
keff close to one. But, the smaller we make keff, the more neutrons have to be added to maintain
the chain reaction. This means more power has to be added to the accelerator generating the
spallation neutrons. Of course from an economic point of view this means the amount of energy
10The power peaking is the relation between the highest and lowest power densities in the core. Since upper temperature is a limit to construction, the power density should ultimately be kept constant all over the core.
eff
eff
kk 1−
=ρ

15
available to be sold to the grid will decrease. Choosing a proper value of keff becomes a delicate
problem where we choose between safety and the benefits of the transmuter.
The value of keff is determined by many parameters of the reactor core, like geometry, enrichment
of the fuel, type of the fuel and presence of neutron absorbing materials etc. The burn-up of the
fuel also causes changes of keff. It is desirable to keep keff constant because changes in keff will
lead to the altering of beam power. This in itself is a safety problem. The accelerator driven
system has to be constructed in such a way, that a proton beam will be turned off when reactor
power increases too quickly. In order to function automatically this switching off has to rely on
phenomena like thermal expansion or pressure.
4.3 The Sing-Sing core design
A design for a 1200 MWth transmutation core called the “Sing-Sing Core” (SSC) was suggested
by Wallenius et al [7]. The main proposal of the authors is to introduce large amounts of burnable
absorbers into the core. Boron carbide (10B4C) effectively absorbs thermal neutrons. Because of
high capture cross-sections, thermal neutrons are undesirable in a transmuter. The absorbers leave
the fast neutrons that have far more favourable capture to fission probability ratios. Hardening the
neutron spectrum also decreases core power peaking. A major benefit from the introduction of
the absorbers is the decrease in neutron capture in 241Am. This capture reaction is a problem since
americium alpha-decays and produces helium. The helium production raises the pressure within
the fuel pins and eventually destroys them. In a uranium fuelled reactor neutron economy is a
very important design parameter. Introducing neutron absorbers into such a reactor may
jeopardize the criticality of the reactor. However fissioning minor actinides gives a far better
neutron economy. There are more neutrons released in an average fission reaction, which makes
the use of absorbers possible.
The SSC uses a nitride fuel matrix. Nitride fuel was chosen because of its high actinide content
compared to oxide fuels, and the possibility of reprocessing using traditional aqueous methods.
Even if a primary choice for transmutation systems is pyrochemical reprocessing opening
possibilities for reprocessing of highly radioactive fuel and consequently shortening fuel-
recycling times, such technology is not readily available today though. This gives reason to keep
the possibility of using aqueous reprocessing.
The spent LWR fuel is assumed to have cooled down in the interim storage for about thirty years
before it enters the transmutation cycle.
4.3.1 Coolant
As coolant, liquid lead-bismuth eutectic has been proposed. Lead-bismuth has a very high boiling
point. The loss of coolant due to temperature increases and subsequent boiling is unlikely when

16
using lead-bismuth. The neutron capture cross-section is very low which makes the lead-bismuth
almost transparent to neutrons. Lead-bismuth has got a high scattering cross-section that helps
distributing neutrons evenly throughout the core. Table 1 summarizes physical properties of the
main reactor coolant candidates.
300.64-55.2325 (sat)
-0.75H2O12MPa
202961826180.78NaK(56/34 w%)
321260.14357-3813.2Hg
23163-4?0.151737327.411.07Pb
291330.151670123.510.73Pb/Bi
1327561.3880980.82Na
h heat transfercoeff.
kW/m2×oC
kW/m×oC(~400C)
Vm/s
Cp
kJ/kg,oC
Tboil
oCTm elt
oCρ
g/cm3
300.64-55.2325 (sat)
-0.75H2O12MPa
202961826180.78NaK(56/34 w%)
321260.14357-3813.2Hg
23163-4?0.151737327.411.07Pb
291330.151670123.510.73Pb/Bi
1327561.3880980.82Na
h heat transfercoeff.
kW/m2×oC
kW/m×oC(~400C)
Vm/s
Cp
kJ/kg,oC
Tboil
oCTm elt
oCρ
g/cm3
Table 1: Physical properties of major reactor coolant candidates
Setbacks of using lead-bismuth are several. Neutron capture in 209Bi produces 210Bi, which, with a
half-life of 5 days, decays to 210Po. The 210Po is a very mobile isotope, which alpha-decays in 138
days. It is thus very radiotoxic. Further lead-bismuth is very corrosive and may cause severe
material damages. Corrosion of Pb-Bi eutectic may be controlled dynamically by creation of an
oxide film on fuel cladding and reactor parts. This oxide film is destroyed if temperature is raised
over 620°C or coolant flow exceeds 3 m/s. In practice this reduces coolant temperature to 550°C.
An alternative to using lead-bismuth would be using sodium as coolant. Sodium has better
thermo dynamical properties – see Table 1, needs less pumping effort and is less corrosive than is
lead-bismuth. However sodium is very inflammable in an oxygen environment. Using sodium
would mean a major risk of fires and explosions. The choice of lead-bismuth is mainly due to its
high boiling temperature and to the safety concerns of sodium.
4.3.2 Core design
The SSC is divided into four fuel zones - Figure 7. The innermost zone is a so-called driver zone
designed mainly for efficient neutron multiplication. Here 238U is introduced to enhance neutron
production. Zone two is similar to zone one, but also contains 99Tc to be transmuted. The outer

17
zones, three and four, are the main transmutation regions in the reactor. Fuel in these two zones
contains mainly minor actinide nitrides. In these zones the absorber pins are also introduced.
With the suggested composition, the SSC reaches an average burn-up of 8,7 percent in 300 days.
At the beginning of life (BOL) keff is 0,972. The value of keff decreases as the actinides burn. At
the end of life (EOL) keff is down to 0,916. Radial power peaking increases from 1,2 at BOL to
1,7 at EOL. The beam power is 20,5 MW at BOL and has to be increased to 75,1 MW at EOL.
Figure 7: Sing-Sing core sketch. The spallation target is located in the centre of the core [1].
5 FUEL CYCLES
Three different fuel cycle scenarios are considered in this paper. The main idea is to examine the
benefits and associated costs of using a Sing-Sing type transmuter in a closed nuclear fuel cycle.
As reference case, the once through fuel cycle is assumed. In the once through cycle, uranium ore
is mined, after enrichment the uranium is sent to a fuel fabrication facility where it is turned into
uranium oxide fuel bundles. The fuel stays in the reactor for five years leading to a burn-up of
just above 40 GWd/t. A burn-up of 40 GWd/t is realistic for Swedish BWRs. Spent fuel is left to
cool for forty years after which it is encapsulated and deposited into a geological storage.
A closed fuel cycle including an accelerator driven system would look like the once through fuel
cycle up to where the fuel is removed from the light water reactor. Instead of depositing the spent
fuel though, it is reprocessed in an aqueous process. Plutonium and the minor actinides are
extracted from the spent fuel. The losses of the process are treated as high-level waste and
deposited in a geological storage. Irradiated depleted uranium is the main reprocessing product. It
is not very radiotoxic and is no longer high-level waste. The transuranic elements and long-lived
fission products are fabricated into nitride ADS-fuel. Due to the high Am and Cm content the fuel
is very radioactive after irradiation in the ADS. Since the burn-up in the ADS is far from

18
complete the fuel has to be recycled and the isotopes resent to the fuel fabrication facility.
Because of the radioactivity, ADS fuel should ultimately be recycled using pyrochemistry in
order to keep down fuel recycle times. In the reprocessing short-lived fission products are sorted
out and sent to the geological storage.
A developed alternative to the ADS fuel cycle is the introduction of a LWR-MOX step. With this
strategy mixed-oxide fuel (MOX) containing plutonium is loaded into light water reactors. The
main part of the plutonium is burned in the LWRs. The ADS takes care of the surplus plutonium,
the rest of the transuranic elements and of the long-lived fission products.
Figure 8: Sketch of a fuel cycle with recycling of Pu in LWRs and burning of transuranic elements in Sing-Sing reactor (FP-fission products, SL-separation losses, MA-minor actinides) [2].
6 ACCELERATORS
High-energy protons are produced in particle accelerators. Two main types of accelerators are
suitable for spallation. Cyclotrons, in which the particles are accelerated in a loop, and linear
accelerators in which the particles pass through the linear beam pipe only once. Neutron yield of
the spallation is dependent on the incident proton energy, the target nuclei and on the spallation
target design.
6.1 Cyclotrons
A cyclotron accelerator is a circular device consisting of areas with and without electric fields.
Two half-spheres are separated by a gap. The particles start out in the middle of the cyclotron.
They are accelerated over the gap by an electric field. After the acceleration they enter a metal
half-sphere where the electric field is zero. Here, the particle beam is bent 180 degrees by a
strong magnetic field. Then, the beam enters the acceleration gap again. The electric field is

19
produced by alternating current, so this time the voltage has shifted and the field has been
redirected.
As the energy of the particles increases they circulate further away from the centre of the
cyclotron. Hence, the path travelled every turn grows longer. However, the increased speed
compensates exactly for the increased distance – the frequency remains constant.
The cyclotron is a simple accelerator with one major setback. As particles reach relativistic
energies, their momentum changes according to:
(4)
(5)
p – particle momentum
v – particle velocity
c – speed of light
The relativistic effect causes the particles to move to slowly and get out of phase due to the
increased energy needed to increase particle velocity. This gives an upper limit to proton energy
around 40 MeV. The problem of relativistic effects can be overcome by altering the frequency of
the electric field. A cyclotron where the electric field varies with the radius is called a
synchrocyclotron. Particle energy in the synchrocyclotron is limited by cost. A 500 MeV
synchrocyclotron is in the order of hundreds of millions of dollars. The cost is believed to
increase as the cube of the energy [3], which means a 5 GeV synchrocyclotron would cost
hundreds of billions of dollars.
If both the frequency of the electric field and the strength of the magnetic field are altered energy
may be increased at a more modest cost. This kind of cyclotron is called synchrotron. In the
synchrotron, the particles follow the same path during the acceleration. As particle energy
increases the power to the bending magnets is increased and also the frequency of the
acceleration field is increased. There are a few really big synchrotrons built. The LHC (Large
Hadron Collider) currently being constructed at the European particle physics laboratory CERN
in Geneva will be able to reach energies above 1 TeV. Still however, the particle current in such
an accelerator is rather small. To run an ADS a current of 5 to 40 mA of 1 GeV protons may be
needed. Today there is no synchrotron that can deliver a sufficient current for the ADS, but it is
believed that it will be possible to reach such currents with two or three synchrotrons working
together [9].
mvp γ=
21
2
2
1−
−=
cvγ

20
Figure 9: Sketch of a proposed ADS cyclotron [4].
6.2 Linear accelerators
Acceleration of particles in a linear accelerator is based on the same principle, as is the cyclotron.
Particles are accelerated over evacuated gaps by an alternating current. As the voltage changes
the particle travels through a field free “drift tube”. The main difference to cyclotrons is that the
beam travels along a linear path. No bending magnets are needed. Loss of beam focus problems
are almost eliminated.
As particle velocity increases the length of the drift tubes has to be increased. Linear accelerators
tend to be very long. When energies increase linear accelerators grow expensive compared to
circular accelerators. However, linear accelerators may produce larger currents than synchrotrons
and one linear accelerator will be able to run the ADS alone.
Figure 10: Linear Accelerator [9]

21
7 PARTITIONING TECHNIQUES
All nuclear fuel cycle strategies except from the once-through cycle require partitioning of
radioactive material. In the simple case MOX fuel is manufactured from uranium and plutonium
from spent fuel. More advanced strategies may involve fuel mixed with minor actinides, such as
MINOX-fuel. Some strategies even involve the transmutation of fission products. These
strategies all need reprocessing. The elements have to be separated to make construction of
advanced fuels and transmutation targets possible.
Many methods of partitioning have been proposed, but today only the aqueous PUREX process is
used industrially for commercial purposes. There are a few important aspects when discussing
partitioning methods. The main limiting factors today are losses and costs. Losses have to be very
small in order to reduce the amounts of secondary wastes. With transmutation, the losses together
with theburn-up in the ADS decide the efficiency of the entire fuel cycle.
Safety is another important issue. An industrial scale reprocessing plant holds huge amounts of
radioactive material. Both radiation hazards to workers and to the environment have to be
considered. Also, the separating of plutonium, thus making it attainable for potential weapon
makers, has to be given serious consideration.
7.1 Liquid – liquid aqueous partitioning
The partitioning technique that is used predominantly in industry today is called PUREX
(plutonium-uranium extraction). It is a hydro metallurgical process. Variants of the process have
been used for forty years to partition spent LWR fuel.
The principle of liquid-liquid aqueous partitioning is the following. The spent fuel is dissolved in
an acid. In PUREX nitric acid is used. This aqueous phase is put in contact with an organic phase
with some organic molecule [11] dissolved in a hydrophobic solvent. The molecule extracts
metals from the aquatic solution. In PUREX uranium, plutonium and neptunium can be extracted.
Extracting americium and curium is difficult; they are both trivalent and mix with trivalent
lanthanides. As the organic molecule has picked up the metals, the aqueous and organic phases
are separated. The metals are then stripped from the organic molecule into another aqueous
solution. By changing the valence of plutonium from IV to III, plutonium can be extracted from
uranium. The losses in aqueous reprocessing are small, PUREX shows losses in the order of 0,01
percent.
There are some major setbacks to the PUREX technique. As discussed it cannot separate trivalent
actinides from trivalent lanthanides. Several lanthanides show strong neutron capture resonance.
11 For the PUREX process tri-butyl-phosphate (TBP) is used.

22
However, if running the transmutation process with a hard neutron spectrum, the problem of
neutrons getting captured in lanthanides becomes smaller compared to when running with a
thermal spectrum [10]. Also, the organic molecules are sensitive to radiation. Hence hot fuel with
high americium and curium contents have to cool before reprocessing, or it will destroy the
organic molecules. In an advanced fuel cycle with, for example, an ADS present, the cooling
would significantly lengthen the times needed to transmute the transuranic elements. However for
reprocessing LWR spent fuel PUREX works fine. Even the hotter LWR-MOX fuel can be
reprocessed if it is diluted with ordinary LWR fuel.
There have been a few aqueous processes suggested to deal with the minor actinides. These are
all based on organic molecules that extract the transuranic isotopes from some acid solution.
Much research effort is being performed around the world to improve these techniques. The
efforts are concentrated on finding molecules that extract the metals without binding them to hard
to strip them again. These molecules also have to be soluble in some liquid that does not mix too
much with water. Today there are laboratory scale processes that can separate TRUs with small
losses. But still the problem remains to find extraction molecules that withstand intense radiation
and which is not too expensive for industrial applications.
7.2 Chromatographic reprocessing
Chromatographic methods are similar to the liquid-liquid aqueous ones. The dissolved waste
passes through a column filled with ion exchange resins. Different resins might be placed in the
column, thus extracting different elements at different positions. The elements are then released
from the resins using some other solution. As with aqueous partitioning the main problem is the
radio sensitivity of the organic molecules. Today there are molecules that can withstand about 104
Gy [11]. The hot fuels will give much higher doses though.
7.3 Pyrochemical partitioning
There are some partitioning methods that do not involve any aqueous technologies but rather
molten salts. These are referred to as pyrochemical partitioning methods. Pyrochemical methods
were developed early before the PUREX process got into use.
There are two main methods of pyrochemical partitioning. The one primarily considered for
advanced fuel cycles is electro refining. The electro refining process uses the differences in redox
potentials of the actinides, fission products, cladding material and process construction materials.
The fuel is released from its cladding, chopped and put in an anode basket. The anode is placed in
a molten lithium-potassium salt. By altering the voltage between the cathode and the anode, one
element at a time can be extracted. After some time the salt gets polluted with fission products
and has to be purified. Research in this area is underway. The purification is based on a liquid salt

23
– liquid metal process. Today, the main difficulty of electro refining is keeping away oxygen and
water from the argon atmosphere that surrounds the molten salt. More than a few parts per
million of those gases in the atmosphere would ruin the extraction process. Also the purification
of the salt at an industrial scale is a major engineering task that has got to be managed.
The other pyrochemical partitioning method is based on chemical reactions in molten
oxochlorides and oxoflourides. This second method has been used a lot by the Russians to
separate uranium and plutonium from the minor actinides. However it is almost impossible to
then separate the minor actinides from the lanthanides. This is because the metals gets poisoned
by oxochlorides and oxoflourides. Pyrochemical reprocessing has one major advantage to
aqueous reprocessing. The process is very insensitive to radiation. It is possible to partition hot
material directly without cooling. Problems arise because of the radiation hazards to process
personnel, but the process itself will withstand extreme radiation doses. However the need for
radiation shielding when partitioning highly active material makes the process expensive. On the
other hand a pyrochemical facility may be very compact and potentially generates small amount
of secondary waste streams.
8 UNIT COSTS
A top down approach has been used to calculate the costs of nuclear fuel cycles. Using this
approach, unit costs control total costs. The estimated unit costs are multiplied by for example
material flows or installed power. Summing together gives the total cost of the entire system.
This total cost can easily be transformed into for example the unit cost of produced electricity.
The alternative is to use a bottom-up strategy where explicit costs for different processes are
summed together to give the total cost of the system. The top-down strategy was chosen due to
the large technological uncertainties in the technologies connected to some of the unit costs. It is
in some cases simply not possible to guess the explicit cost of a process. Estimations based on the
costs of similar processes have to be used. A bottom-up approach does not allow for this.
8.1 Calculation models
In estimating the costs two economical models have been applied. With increased experience
technology gets cheaper. Costs for design and construction decreases. This is known as the
learning effect. For nuclear power a learning rate of 5.8% applies [12], meaning costs fall by this
amount for every doubling of experience. Costs of operations are usually estimated to rise over
time as maintenance (O&M) costs are estimated to increase. Here, steady state is assumed, O&M
costs are assumed constant as installations are assumed being of different ages.

24
Second a model for calculating the economies of scales has been used. The idea of the model is
that bigger plants are relatively cheaper than smaller ones. The following expression has been
used.
(6)
C - cost (o: reference, n: scaled cost)
K - capacity (o: reference, n: scaled capacity)
X - 0.6 for reactor systems, 0.7 for fabrication and reprocessing [13]
Further all monetary values were recalculated to 2001 dollars. In doing this recent exchange rates
have been used. The inflation has been set to being three percent over all time.
Comparing costs and the value of money is problematic. Costs develop differently in different
countries and in different industries. Thus, it is not so easy as to just recalculate between
currencies using the exchange rate valid at the time the figure was given. The average inflation
approach was chosen. It does give some errors, but those errors are assumed being rather small in
comparison to the errors included in unit costs them selves.
8.2 Description of unit costs
Unit costs are summarized in appendix B.
8.2.1 CostU – Cost of natural Uranium ($/kg)
Natural uranium prices are fairly easy to estimate in the short time scale. However in the longer
time scale the price is not as obvious. The price today is about 40 $/kg. The unit cost was chosen
to 30 $/kg [14]. OECD/NEA [15] suggests 20 $/kg as lower and 80 $/kg as upper bound for
uranium price fluctuations.
8.2.2 CostUconv – Cost of Uranium conversion ($/kg)
The cost for uranium conversion has been chosen to 5 $/kg. A lower limit estimation is 3 $/kg
and an upper 8 $/kg. Conversion costs are discussed in details in the ‘Global 95’ conference
precedings [16].
8.2.3 CostUenr – Cost of Uranium enrichment ($/kg)
Different authors address the cost of enriching uranium [16], [17]. There seems to be some
understanding of a price around 90 $/kg ranging between 70 $/kg and 120 $/kg.
X
o
non K
KCC
×=

25
8.2.4 CostUdepl – Cost of the handling of depleted Uranium ($/kg)
The handling of depleted uranium is not performed in Sweden. Hence, the cost of it does not
show in our calculations. The cost is included in the other uranium costs and was simply set to
zero.
8.2.5 CostUOXfab – Cost of UOX-fuel fabrication ($/kg)
Much has been written [15], [16] on the cost of fabricating UOX-fuel. The general belief is that
the cost of future manufacturing will be about 250 $/kg ranging from 200 $/kg to 350 $/kg.
8.2.6 CostUOXIntstor – Cost of spent UOX-fuel interim storage ($/kg)
The unit cost of the Swedish interim storage CLAB is 59 $/kg UOX [18]. International references
[15], [16], [19] suggest somewhat higher costs, both the Global ’95 conference and OECD/NEA
suggests unit costs as high as around 300 $/kg UOX. Based on this, a reasonable unit cost for
spent UOX-fuel interim storage in the future is assumed to be 120 $/kg UOX ranging from 60
$/kg to 300 $/kg.
8.2.7 CostUOXrepro – Cost of spent UOX-fuel reprocessing ($/kg)
Reprocessing of the spent UOX-fuel is assumed to be performed by an aqueous process such as
the UREX or PUREX process. There are a few reprocessing plants, e.g. La Hauge and Sellafield,
running today. These installations are rather old and are more or less paid off. Future
reprocessing is assumed to be a bit more expensive than reprocessing today. Several references
[15], [17], [20], [21] suggest a unit cost ranging from 500 to 1100 $/kg heavy metal12 (kgHM). A
reasonable estimate of the unit cost in the future is 800 $/kgHM. The Global ’95 conference
proceedings suggests a cost as high as 1800 $/kgHM [16]. Since all other references suggest far
lower values the lower value of 800 $/kgHM ranging from 500 $/kgHM to 1100 $/kgHM was
chosen.
8.2.8 CostMOXfab – Cost of MOX-fuel fabrication ($/kg)
The unit cost has been set to 1100 $/kgHM ranging from 600 to 1750 $/kgHM. This is based on
figures from the EPRI, Global ’95 and OECD/NEA references [15], [16], [17].
8.2.9 CostMOXrepro – Cost of MOX-fuel reprocessing ($/kg)
The mass flow of spent MOX-fuel is rather small in comparison to the flow of spent UOX-fuel.
Hence dilution of the MOX-fuel with UOX-fuel is assumed to decrease the radiation per mass. If
the fraction of MOX-fuel is kept below twenty percent of the total mass flow, the same process is
12When speaking of heavy metal (HM) both the fuel metal itself and the cladding material, which mostly consists of zirkaloy, are included.
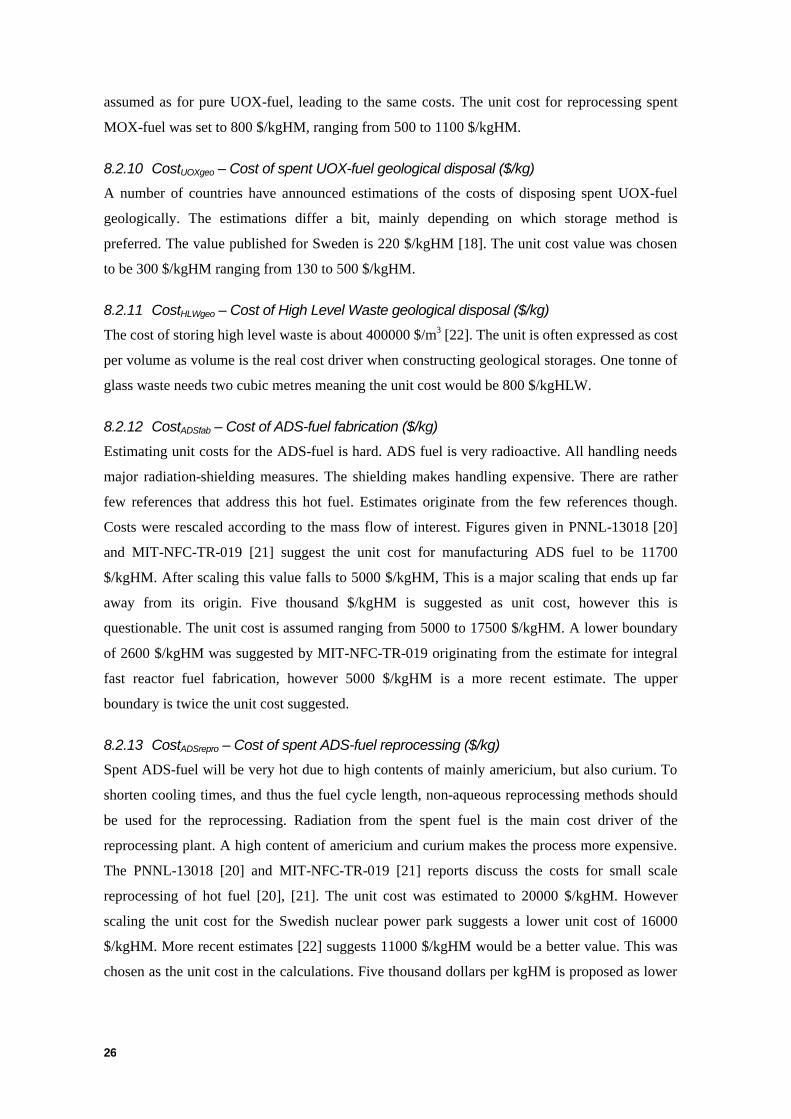
26
assumed as for pure UOX-fuel, leading to the same costs. The unit cost for reprocessing spent
MOX-fuel was set to 800 $/kgHM, ranging from 500 to 1100 $/kgHM.
8.2.10 CostUOXgeo – Cost of spent UOX-fuel geological disposal ($/kg)
A number of countries have announced estimations of the costs of disposing spent UOX-fuel
geologically. The estimations differ a bit, mainly depending on which storage method is
preferred. The value published for Sweden is 220 $/kgHM [18]. The unit cost value was chosen
to be 300 $/kgHM ranging from 130 to 500 $/kgHM.
8.2.11 CostHLWgeo – Cost of High Level Waste geological disposal ($/kg)
The cost of storing high level waste is about 400000 $/m3 [22]. The unit is often expressed as cost
per volume as volume is the real cost driver when constructing geological storages. One tonne of
glass waste needs two cubic metres meaning the unit cost would be 800 $/kgHLW.
8.2.12 CostADSfab – Cost of ADS-fuel fabrication ($/kg)
Estimating unit costs for the ADS-fuel is hard. ADS fuel is very radioactive. All handling needs
major radiation-shielding measures. The shielding makes handling expensive. There are rather
few references that address this hot fuel. Estimates originate from the few references though.
Costs were rescaled according to the mass flow of interest. Figures given in PNNL-13018 [20]
and MIT-NFC-TR-019 [21] suggest the unit cost for manufacturing ADS fuel to be 11700
$/kgHM. After scaling this value falls to 5000 $/kgHM, This is a major scaling that ends up far
away from its origin. Five thousand $/kgHM is suggested as unit cost, however this is
questionable. The unit cost is assumed ranging from 5000 to 17500 $/kgHM. A lower boundary
of 2600 $/kgHM was suggested by MIT-NFC-TR-019 originating from the estimate for integral
fast reactor fuel fabrication, however 5000 $/kgHM is a more recent estimate. The upper
boundary is twice the unit cost suggested.
8.2.13 CostADSrepro – Cost of spent ADS-fuel reprocessing ($/kg)
Spent ADS-fuel will be very hot due to high contents of mainly americium, but also curium. To
shorten cooling times, and thus the fuel cycle length, non-aqueous reprocessing methods should
be used for the reprocessing. Radiation from the spent fuel is the main cost driver of the
reprocessing plant. A high content of americium and curium makes the process more expensive.
The PNNL-13018 [20] and MIT-NFC-TR-019 [21] reports discuss the costs for small scale
reprocessing of hot fuel [20], [21]. The unit cost was estimated to 20000 $/kgHM. However
scaling the unit cost for the Swedish nuclear power park suggests a lower unit cost of 16000
$/kgHM. More recent estimates [22] suggests 11000 $/kgHM would be a better value. This was
chosen as the unit cost in the calculations. Five thousand dollars per kgHM is proposed as lower

27
limit. The unit cost was scaled to fit a US sized reactor park running in a transmutation scenario.
This gives 10000 $/kgHM. The figure was then halved to give some space for technological
breakthroughs. Thus, the lower limit was calculated to 5000 $/kgHM. As an upper limit for the
unit cost 30000 $/kgHM is proposed. This is simply fifty percent more than the value proposed in
the references.
8.2.14 CAPLWR – Investment LWR ($/kWe)
Some LWR-reactors are being built around he world today. Finland is planning for a fifth
commercial reactor. It is estimated to cost around 1590 $/kWe installed [23]. Cost estimations for
other reactors are as high as 2200 $/kWe installed [22]. These values include interest during
construction and decommissioning. In the calculations 1700 $/kWe was chosen as unit cost.
Labour costs in Sweden are rather low which together with a low expected interest during
construction motivates this rather low value.
8.2.15 CAPADS – Investment ADS ($/kWe)
To estimate the investment needed to build an ADS plant, figures from fast reactor construction
have been used [16], [24], [25]. An ADS system is very similar to the fast reactor when it comes
to heat transfer, cooling and electricity production. The very different component is the
accelerator. The unit cost for the ADS was estimated to the cost of building a fast reactor plus the
cost of an accelerator. A fast reactor is assumed to need an investment of 1950 $/kWe ranging
from 1200 to 3450 $/kWe installed power.
8.2.16 Costbeam – Cost of accelerator ($/W beam)
The beam cost is assumed to be 15 $/W beam ranging from 5 to 20 $/W beam. This assumption is
mainly relying on the US ATW roadmap [5].
8.2.17 O&Mreactor – Operations and maintenance costs for reactors (% of investment / yr)
Operations and maintenance cost for LWR-reactors is known [26], [27] to be ranging from two to
three percent of the original investment annually.
8.2.18 O&MADS - Operations and maintenance costs for ADS (% of investment / yr)
The O&M costs for an ADS system is assumed to be twice the LWR costs, i.e. four to six percent
of the original investment annually. This is mainly due to accelerator maintenance and the
frequent replacements of spallation windows.
8.2.19 FCR – Fixed charge rate (%)
The fixed charge rate is assumed to be ranging from eight to fourteen percent. This should be
understood as the return on investment expected by investors.

28
A ten percent fixed charge rate paid during twenty years corresponds to an interest rate of 7,8
percent if paying the dept in equal amounts during the twenty years. This follows from the
expression for annuity
(7)
a – annual payment
c – original dept
p – interest rate expressed in percent
t – pay back time expressed in years
9 UNIT PARAMETERS
9.1 Description of unit parameters
Most of the unit parameters chosen for the calculations are more or less standard and need not be
commented. There are a few though, which might need a comment. Unit parameters are
summarized in appendix B.
Table 2. Unit parameters used in modelling Total electric energy produced in LWR park per year 73TWhe Thermal efficiency LWR 34% Thermal efficiency ADS 40% Load factor LWR 82% Load factor ADS 70% Own energy consumption LWR (% of thermal power) 1% Own energy consumption ADS (% of thermal power) 5% Loss factor in mining & milling 0,01 Loss factor in conversion 0,001 Loss factor in enrichment 0,001 Loss factor in UOX-fuel fabrication 0,001 Loss factor in MOX-fuel fabrication 0,01 Loss factor in UOX-fuel reprocessing 0,001 Loss factor in ADS-fuel fabrication 0,001 Loss factor in ADS-fuel reprocessing 0,001 Scaling exponent for reactors 0,6 Scaling exponent for fuel fabrication 0,7 Scaling exponent for reprocessing 0,7 ADS Accelerator beam power 40MW
1100
1
1001001
−
+
⋅
+
⋅= t
t
p
pp
ca

29
9.1.1 Thermal efficiency LWR - 34%
The modern Swedish LWRs reach 34% thermal efficiency. This value seems reasonable also for
new reactors, especially if they are big ones.
9.1.2 Thermal efficiency ADS – 40%
An ADS will reach a higher thermal efficiency than does the LWRs. This is due to the much
higher upper temperature in the ADS. In theory an even higher efficiency could be reached. It is
just a question of how many steam over heaters you can afford to build.
9.1.3 Load factor LWR – 82%
The average availability of Swedish LWRs is historically around 82%.
9.1.4 Load factor ADS - 70%
The ADS load factor depends mainly on the accelerator availability and is thus very hard to
estimate with good accuracy. Some suggest 85% [2], [22], which we believe is a bit optimistic.
Here, 70% is used, it might be a bit to low, but we choose to not exaggerate the ADS availability
in the calculations.
10 RESULTS
10.1 Cost of electricity
The cost of electricity from nuclear power has been calculated in three different fuel cycle
scenarios. As the reference case a light water reactor scenario without reprocessing was used
(Once through). The two other scenarios use dedicated subcritical systems to transmute the
wastes from the light water reactor park. In one of the scenarios (LWR UOX + ADS) spent UOX
fuel is sent directly to transmutation. The other scenario (ADS + LWR MOX) contains an
intermediate step of plutonium recycling in the light water reactors.
The costs for producing electricity in these three scenarios range from 24,54 mills/kWh to 37,24
mills/kWh - Figure 11. Only the production costs were considered. No taxes or subsidises were
taken into account. Once through is the cheapest scenario. The advanced fuel cycles show a
higher cost of electricity, but are still low enough to be competitive in a future market with
anticipated higher electricity prices.

30
1.743.29 3.34
14.20 11.13 12.16
7.31
5.736.26
4.523.24
6.104.05
6.28
4.16
1.29
0.19
0.19
0.00
5.00
10.00
15.00
20.00
25.00
30.00
35.00
40.00
Once through TRU in ADS TRU in ADS +MOX
CO
E (m
ills)
Wastes
ADS O&M
ADS Capital cost
ADS Fuel cycle
LWR O&M
LWR Capital cost
LWR Fuels
Figure 11: Overall cost distributions for the three fuel cycles considered. COE is the abbreviation for Cost of Electricity, O&A - for Operation and Maintenance.
The main cost driver of the three fuel cycles is the capital cost of the light water reactors. Also in
the advanced fuel cycles light water reactors are still the main reactor type. Operation and
maintenance costs are proportional to the installed power and follow the capital costs. The cost of
nuclear waste management is higher in the once through scenario. The transmutation scenarios
produce a less radioactive waste, which is cheaper to handle.
Even though mass flows are rather small, the ADS fuel cycle accounts for a main part of the total
cost in the advanced fuel cycles. In the second scenario these costs are very close to half the total
cost. But, recycling plutonium in light water reactors as MOX-fuel significantly reduces the

31
amount of material to transmute and consequently reduces the cost of the transmutation. The total
capacity of light water reactors have to be a bit greater which increases LWR related costs, but
the total cost of the third scenario remains smaller than does the total cost of the second scenario.
10.2 Sensitivity analysis
A sensitivity analysis has been performed in order to understand the impact of some parameters
of the final cost of electricity. The cost calculations were based on estimated unit costs and
parameters - Appendix B. The results of these sensitivity studies for some important parameters
are presented in Figure 12 through Figure 23.
10.2.1 Capital costs
05
101520253035404550
1300 1500 1700 1900 2100 2300
LWR Investment ($/kWe)
CO
E (m
ills/
kWh)
Once through
LWR UOX + ADS
ADS + LWR MOX
Figure 12: The cost of electricity as function of the LWR investment
The cost of constructing the light water reactors is a very important part of the total economy of
all three fuel cycles - Figure 12. Even small changes in the cost may significantly change the cost
of electricity. As an example a ten percent higher capital cost raises the once through cost of
electricity by 8,8 percent.

32
0
10
20
30
40
50
60
70
4 5 6 7 8 9 10 11 12 13 14
FCR (%)
CO
E (m
ills/
kWh)
Once through
LWR UOX + ADS
ADS + LWR MOX
Figure 13: The cost of electricity as function of the fixed charge rate
The capital cost is very closely connected to the interest rate. Also changes in the interest rate
have a great impact on the cost of electricity - Figure 13. Doubling of the interest rate increases
the cost of electricity almost by fifty percent.
10.2.2 Reactor operation
Other very important aspects of the total fuel cycle economy are the parameters of the reactor
operation. The thermal efficiencies, availabilities and burn-ups all affect the cost of electricity
produced significantly. Figure 14 presents the effect of LWR thermal efficiency on the final cost
of electricity.
20
25
30
35
40
45
0,25 0,3 0,35 0,4
LWR Thermal efficiency
CO
E (m
ills/
kWh)
Once through
LWR UOX + ADS
ADS + LWR MOX
Figure 14: The cost of electricity as function of the LWR thermal efficiency.

33
The cost of electricity lowers as the efficiency of the turbines and generator increases. For the
advanced fuel cycles the effect is stronger. This is because the need for expensive transmutation
decreases as the fuel is used more efficient in the light water reactors.
20
25
30
35
40
0,3 0,35 0,4 0,45 0,5 0,55 0,6
ADS Thermal efficiency
CO
E (m
ills/
kWh)
Once through
LWR UOX + ADS
ADS + LWR MOX
Figure 15: The cost of electricity as function of the ADS thermal efficiency
Also the ADS thermal efficiency has a rather large impact on total economy - Figure 15. The
ADS thermal efficiency can be raised quite a lot by over-heating steam. However every extra
steam over-heater requires an investment. That effect is not taken into account in the plot above.
This means at some point the curve will start rising again.
0
10
20
30
40
50
60
0,4 0,5 0,6 0,7 0,8 0,9 1
LWR Load factor
CO
E (m
ills/
kWh)
Once through
LWR UOX + ADS
ADS + LWR MOX
Figure 16: The cost of electricity as function of the LWR load factor

34
A high load factor for LWR operation is a prerequisite for an efficient reactor operation. Reactor
stops are very expensive. Figure 16 shows the impact of the LWR load factor on the COE.
0
10
20
30
40
50
0,4 0,5 0,6 0,7 0,8 0,9 1
ADS Load factor
CO
E (m
ills/
kWh)
Once through
LWR UOX + ADS
ADS + LWR MOX
Figure 17: The cost of electricity as function of the ADS load factor
As seen in Figure 17 the effect of low load factors of ADS is smaller than in the LWR case. This
is due to the much smaller power production in the ADS part of the fuel cycle.
30
33
36
39
42
45
5 10 15 20 25 30 35 40 45 50
Burn-up (%)
CO
E (m
ills/
kWh)
LWR UOX + ADS
ADS + LWR MOX
Figure 18: The cost of electricity as function of the ADS burn-up.
Together with separation losses the burn-up factor in the ADS determines the efficiency of the
transmutation. The higher burn-up, the less reprocessing is needed. Since reprocessing is very
expensive, this is an important aspect to the total cost. However the largest impact of increased
burn-up can be seen in the interval of 5 – 20% burn-up – Figure 18 – were the final costs can

35
drop by almost 30%. A further increase in the burn-up over the twenty percent level has a minor
impact on the final costs. The Sing-Sing reactor design has a burn-up of 12,4%, increased burn-
up to 20% could give a 10% drop on the final cost of electricity.
10.2.3 Accelerator economics
The cost of particle accelerator construction for commercial use in transmutation facilities is still
difficult to assess.
Figure 19, based on the data from the US ATW Roadmap [5] shows, surprisingly, that these are
not driving costs. However the accelerator has a great impact on total economy since its
properties are important to the ADS availability. It is important to achieve high accelerator
reliability since beam stops lead to the stopping of the electricity production. Even though the
ADS load factor is not the main cost driver, the prime interest apart from producing electricity is
to transmute radioactive wastes. Transmutation is only possible when the accelerator is running.
20
25
30
35
40
5 10 15 20
Cost of beam ($/W)
CO
E (m
ills/
kWh)
Once through
LWR UOX + ADS
ADS + LWR MOX
Figure 19: The cost of electricity as function of the cost of constructing the ADS accelerator

36
10.2.4 Fuel cycle economics
20
25
30
35
40
20 30 40 50 60 70 80
Uranium price ($/kg)
CO
E (m
ills/
kWh)
Once through
LWR UOX + ADS
ADS + LWR MOX
Figure 20: The cost of electricity as function of the uranium price
Figure 20 indicates that uranium price is not a very important cost driver of the nuclear fuel
cycles studied. The once through fuel cycle uses more uranium per kWh produced than do the
other scenarios. Consequently the once through fuel cycle is affected more by changes in the
uranium price. However, the changes are still small.
20
25
30
35
40
500 600 700 800 900 1000 1100
UOX Reprocessing ($/kgHM)
CO
E (m
ills/
kWh)
Once through
LWR UOX + ADS
ADS + LWR MOX
Figure 21: The cost of electricity as function of the uranium oxide (UOX) reprocessing costs
Reprocessing of spent UOX fuel is an important element in both of the advanced scenarios -
Figure 21. Even though, the impact of rather large changes in the unit cost is still within a few
percent on the total cost of electricity. The once through fuel cycle does not include any form of

37
reprocessing; consequently the cost of electricity remains the same when the unit cost for
reprocessing changes.
It is very difficult to estimate the cost of handling the very radioactive spent ADS fuel. It shows
though - Figure 22 and Figure 23 - that neither the ADS fuel fabrication nor ADS reprocessing
are very important cost drivers. An increased ADS fuel fabrication costs by a factor of two gives
only a few percent (2-3%) impact on the final electricity cost. Variations of the reprocessing costs
by a factor of six - from 5000 $/kg HM to 30000 $/kg HM – results in COE increases of only
12% and 16% respectively for the two advanced schemes.
20
25
30
35
40
5000 6000 7000 8000 9000 10000 11000
ADS fuel fabrication ($/kgHM)
CO
E (m
ills/
kWh)
Once through
LWR UOX + ADS
ADS + LWR MOX
Figure 22: The cost of electricity as function of the ADS fuel fabrication cost.
20
25
30
35
40
45
5000 10000 15000 20000 25000 30000
ADS Reprocessing ($/kgHM)
CO
E (m
ills/
kWh)
Once through
LWR UOX + ADS
ADS + LWR MOX
Figure 23: The cost of electricity as function of the ADS reprocessing cost

38
11 CONCLUSIONS
Figure 12 through Figure 23 all have one thing in common. In all of them, the three scenarios line
up in the same order. “Once through” is cheaper than is “ADS + LWR MOX” which, is cheaper
than is “LWR UOX + ADS”. It is obvious that an ADS strategy needs MOX recycling in light
water reactors to be competitive.
The COE show a linear behaviour in most cases described here. The calculation model used
contains very few feed-backs between variables. Mainly this is because of the bad knowledge in
many areas. Even finding a single estimate for a unit cost is often difficult. Finding the
dependency of that cost on another one is very hard.
Once through TRU in ADS TRU in ADS + MOX
LWR Fuels 1,74 1,36 3,34
LWR Capital cost 14,20 11,13 12,16
LWR O&M 7,31 5,73 6,26
ADS Fuel cycle 6,45 3,24
ADS Capital cost 6,10 4,05
ADS O&M 6,28 4,16
Wastes 1,29 0,19 0,19
COE 24,54 37,24 33,40
Table 3: Summary table of fuel cycle costs
Compared to other sources of electricity nuclear shows to be a realistic alternative. The costs of
electricity from many types of power plants are in the range of the costs discussed above.
0
10
20
30
40
50
Once through ADS ADS with MOX Carbon condensepower 400 MWe
Fossilgascondense combicycle 400 MWe
Bio fuel powerwith sold heat 80
MWe
Fossil gas engine1 MWe
Wind power 0,6MWe
CO
E (
mill
s/kW
h)
Figure 24: The cost of electricity from different power plants13.
As seen in Figure 24 nuclear power plants are competitive to other power plants. It is also – from
an economic point of view - realistic to transmute the nuclear wastes in a transmutation fuel
cycle.

39
12 FINAL REMARKS: ASPECTS OF ADVANCED NUCLEAR FUEL CYCLES
When, in the beginning of the last century, people realised it might be possible to tap matter itself
of energy, optimism was enormous. At last there seemed to be a distant possibility of creating a
paradise on earth. The almost free energy from the fission and fusion processes would give
mankind totally new possibilities. With water from the ice at the poles Sahara would be
transformed into a garden. People would travel around the planet in hours leaving no smoke, nor
noise. And, poverty would be extinct.
Until today, nuclear power did not fulfil this dream. Several accidents taught us of the dangers of
nuclear power. The destructive side of nuclear power got obvious, and forever connected to, the
cruelty of the human race on the sixth of August 1945.
Today the dreams are all gone. Nuclear energy is part of everyday life. It will stay that way as
long as our benefits form having nuclear power exceeds the cost of doing so. Discussion on the
costs and benefits of nuclear power finally caught wind after the Three Mile Island accident in
1979. It boosted following the Chernobyl meltdown in 1986. The discussion is, and should be, a
very important aspect of nuclear power itself.
The once through fuel cycle used in Sweden today could easily be mistaken for the ultimate clean
and safe way to produce cheap electricity. People using the electricity discover no severe
problems. They do not see the opencast mines where huge amounts of radon leaks into the
atmosphere and living creatures are poisoned by the heavy metals leaking from slag deposits.
Also these people will have been long dead when eventually material from the geological
disposals starts reaching the biosphere. The only thing left for them to care about is the risk of an
accident in a nuclear power plant. Considering the experience gained from running nuclear
reactors combined with the culture in the nuclear industry to always work on safety this risk is
probably small. Even if a severe accident would occur the amount of radiation released would
most probably be small. However, people actually do care, especially people care about the
geological disposal of wastes. People would rather see that there was no radioactive waste at all.
12.1 Radiation hazards
Transmutation does offer a possibility of almost deleting the storages of radioactive wastes.
However, new problems arise in a transmutation fuel cycle.
13The costs were calculated using a computer-based model provided by the Swedish National Energy Administration. Costs apply to the current Swedish situation.

40
In a once through fuel cycle uranium mining and geological disposal seem to be the main
problems. With recycling of reactor fuel far less uranium is needed and with transmutation far
less waste is left for disposal. Both of the main problems are reduced. Recycling though raises
new problems. If running recycling on a big scale for many years, somewhere, someday there is
going to be a malfunction of some system which is going to cause release of radioactive material
into the biosphere. With less reprocessing plants the average time for this to happen is longer, but
it will still happen somewhere, someday. From a radiation hazards point of view, the question of
using transmutation is condensed to the question whether to expose the people living today to the
radiation or to expose the generations to come.
12.2 Proliferation risks
As long as there are plants enriching uranium or reactors producing plutonium, there will be the
threat of nuclear weapons. A once through fuel cycle has the advantage of not piling up
plutonium anywhere. When reprocessing the spent fuel, there will be plutonium lying around to
be stolen, or removed in a legal way, to produce nuclear weapons.
However in a few hundred years though, when the wastes in the geological repository have
cooled down, they will make a prime uranium ore. Anyone who needs plutonium could just start
mining it from the bedrock.
The benefit of the reprocessing alternative is that we know who might want the plutonium today.
We could protect ourselves from it at least in the short term. We do not know though how society
looks in, say, five hundred years, and who might need the plutonium then. The choice is who to
trust, the people of today, who deliberately killed 183 million people the last century [28], or our
grand grand children whom we do not know.
12.3 Social aspects of transmutation
Whether to use advanced nuclear fuel cycles like transmutation is not an issue for scientists or
engineers. Society has to make the choice based on the costs and the benefits of different
alternatives.
A really important aspect is the stability of society. Transmutation is a major project. If started it
would have to run for a long time. Society should be ready to accept nuclear power as the main
power source for several hundreds of years. Of course nuclear power can only be safe, especially
considering non-proliferation aspects, in a peaceful and stable society. Before making the
decision to start the transmutation fuel cycle we would need to be confident that our society will
stay stable for a long time.
In order to decide for transmutation in Sweden a pro transmutation opinion would be needed.
Then parliament could change laws concerning planning of nuclear power. Also several

41
paragraphs in the environmental laws would have to be changed in order to build Sing-Sing
cores. Especially a clearance to use huge amounts of lead would be vital.
We have shown that advanced fuel cycles might become an economically realistic option. It
seems society will have to reach the decision pretty soon, whether to use nuclear power or not.

42
REFERENCES
[1] K. Tucek, Burnable Poisons in Sub-Critical Cores Dedicated to Radiotoxic Waste Transmutation, Stockholm 2000, pages 4, 29
[2] K. Tucek, private communication
[3] K. S. Krane, Introductory Nuclear Physics, John Wiley & Sons, 1988, pages 67, 581
[4] W. Gudowski, editor, IAEA Status of the Accelerator Driven Systems (ADS), IAEA, 1997, Chapters B.2, D.3.3.1,
[5] DOE, A Roadmap for Developing Accelerator Transmutation of Waste (ATW) Technology – A Report to Congress, DOE/RW-0519, 1999
[6] S. Monti, editor, A European Roadmap for Developing Accelerator Driven Systems (ADS) for Nuclear Waste Incineration, ENEA, 2001, ISBN 88-8286-008-6
[7] J. Wallenius et al. Application of burnable absorbers in an accelerator driven system, Nuclear Science and Engineering 137 (2001) 96
[8] J. Wallenius, Private communication
[9] M. Eriksson, Reliability Assessment if the LANSCE Accelerator System, Stockholm 1998, pages 20, 24
[10] I. Slessarev et al. On Neutron Consumption Requirements for Long Lived Fission Products (LLFP) Transmutation and Lanthanides (LA), Global ’99 – International Conference on Future Nuclear Systems, proceedings, Snow King Resort, 1999
[11] J-O Liljenzin, Private communication, 2001-09-14
[12] A. McDonald et al. Learning Rates for Energy Technologies, Energy Policy 29:2001
[13] OECD/NEA, Reduction of Capital Costs of Nuclear Power Plants, OECD/NEA, 2000, ISBN-92-64-17144-4
[14] IAEA, Analysis of Uranium Supply to 2050, 2001, IAEA, ISBN-92-0-100401-X
[15] OECD/NEA, Trends in the Nuclear Fuel Cycle: Economic, Environmental and Social Considerations, in preparation, 2001
[16] B. G. Chow, Plutonium Economics and the Civilian Nuclear Future, Global ’95 – International Conference on Evaluation of Emerging Fuel Cycle Systems, proceedings, Paris, 1995
[17] EPRI, A review of the Economic Potential of Plutonium in Spent Nuclear Fuel, EPRI, Palo Alto, 1996, pages 4.11, B-4, C-14, chapter C 5.2

43
[18] SKB, Plan 2000 – Kostnader for kärnkraftens radioaktiva restprodukter, SKB, ISSN 1404-1804, 2000
[19] IAEA, Back end of the Nuclear Fuel Cycle: Economic, Environmental and Social Considerations, in preparation, 2001
[20] R. I. Smith et al. Estimated Cost of an ATW System, 1999, PNNL-13018 pages 4.16, 4.18
[21] D. Kim et al. Economic Analysis of the Fuel Cycle of Actinide Burning Systems, MIT-NFC-TR-019, 2000, pages 18-26
[22] Luc van den Durpel, Private communication, 2001-08-31
[23] R. Tarjanne et al. Nuclear Power: Least-Cost Option for Baseload Electricity in Finland, The Uranium Institute 25th Annual Symposium, London, 2000
[24] R.S. Hall et al, Towards an Economic Fast Reactor, Nuclear Engineering International, 1989
[25] H. Noda, Current status of Fast Reactor Cycle Systems in Japan, ICONE-8, 2000
[26] R. A. Krakowski, Accelerator Transmutation of Waste Economics, Nuclear Technology vol. 110:1995
[27] OECD/NEA, Projected Costs of Generating Electricity, Update 1998, OECD/NEA, 1999
[28] P. Englund, Brev från Nollpunkten, Atlantis, 1996, page 8

APPENDIX X D. Westlén, W. Gudowski, J. Wallenius, K. Tucek: “A Cost Benefit Analysis of an Accelerator Driven Transmutation System”, Proc. Accelerator Applications 2001 and ADTTA 2001 “Nuclear Applications in the New Millennium”, Reno (USA). ANS (2001)

1
A Cost Benefit Analysis of an Accelerator Driven Transmutation System
D. Westlén, W. Gudowski, J. Wallenius, K. Tucek Department of Nuclear and Reactor Physics
Royal Institute of Technology Stockholm Centre for Physics, Astronomy and Biotechnology
S - 106 91 Stockholm www.neutron.kth.se
ABSTRACT
This paper estimates the economical costs and benefits associated with a nuclear waste transmutation strategy. An 800 MWth, fast neutron spectrum, subcritical core design has been used in the study (the so called Sing-Sing Core). Three different fuel cycle scenarios have been compared. The main purpose of the paper has been to identify the cost drivers of a partitioning and transmutation strategy, and to estimate the cost of electricity generated in a nuclear park with operating accelerator driven systems. It has been found that directing all transuranic discharges from spent light water reactor (LWR) uranium oxide (UOX) fuel to accelerator driven systems leads to a cost increase for nuclear power of 50±15%, while introduction of a mixed oxide (MOX) burning step in the LWRs diminishes the cost penalty to 35±10%.
INTRODUCTION
Several detailed studies have been performed on fast reactor fuel cycle costs [1], [2], [3]. The advanced fuel cycles though are not as well examined. Experience originates mainly from fast reactor programs. A few estimates have been done concerning reprocessing of, and fuel fabrication from, really radioactive material. Two reports are the prime sources of information in this field. There is the US ATW roadmap [4] and there is the MIT-NFC-TR-019 by D. Kim et al. [6]. Both reports try to find the costs of the advanced fuel cycles. However since there is basically no industrial experience in this field, all figures originate from small scale experiments and subsequent estimations. Fuel cycle calculations for advanced nuclear fuel cycles have been performed. R. A. Krakowski of Paul Sherrer Institute (PSI) in Switzerland has been working on this for a long time [7]. The calculations were based on a number of unit costs and parameters. Krakowski spends at lot of effort on the sensitivity analysis his results. The calculations performed here are similar to the ones performed by Krakowski, but have been tailored to fit Swedish conditions. A subcritical core, called SSC, designed for transmutation of TRU-discharges from Swedish LWRs was suggested by Wallenius et al. [8]. The main proposal of the authors is to introduce large amounts of burnable absorbers into the core. A major benefit from the introduction of the absorbers is the decrease in neutron capture in 241Am leading to a decrease in He and Cm production. The cost of electricity (COE) from a Swedish reactor park including such cores has been calculated.
SSC TRANSMUTATION CORE
The SSC uses a nitride fuel matrix, which means 15N costs of about 10% of the fuel cost has to be included. Nitride fuel was chosen because of its high actinide content compared to oxide fuels,

2
and the possibility of reprocessing using traditional aqueous methods. Even if a primary choice for transmutation systems is pyrochemical reprocessing opening possibilities for reprocessing of highly radioactive fuel and consequently shortening fuel-recycling times, such technology is not readily available today though. This gives reason to keep the possibility of using aqueous reprocessing. The SSC is divided into distinct fuel zones. The innermost zone is a so-called source multiplication zone designed mainly for maintaining source neutron multiplication. During burn-up 238U is introduced for that purpose. The outer zone is the main transmutation region in the reactor. The fuel in these two zones contains all minor actinides. In these zones the absorber pins are also introduced. With the suggested composition, the SSC reaches a TRU burn-up of 12,4 percent in 600 days.
UNIT COSTS
A top down approach has been used to calculate the costs of nuclear fuel cycles. Using this approach, unit costs control total costs. The estimated unit costs are multiplied by for example material flows or installed power. Summing together gives the total cost of the entire system. This total cost can easily be transformed into for example the unit cost of produced electricity. The alternative is to use a bottom-up strategy where explicit costs for different processes are summed together to give the total cost of the system. The top-down strategy was chosen due to the large technological uncertainties in the technologies connected to some of the unit costs. It is in some cases simply not possible to guess the explicit cost of a process. Estimations based on the costs of similar processes have to be used. A bottom-up approach does not allow for this.
Calculation models
In estimating the costs two economical models have been applied. One assuming that with increased experience technology gets cheaper and costs for design and construction decrease. This is known as the learning effect. For nuclear power a learning rate of 5.8% is commonly applied [9], which assumes costs fall by this amount for every doubling of experience. Costs of operations are usually estimated to rise over time as maintenance (O&M) costs are estimated to increase. Here, steady state is assumed, O&M costs are assumed constant as installations are assumed being of different ages. As a second model - a model for calculating the economies of scales has been used. The idea of the model is that bigger plants are relatively cheaper than smaller ones. The following expression has been used.
(1)
C - cost (o: reference, n: scaled cost) K - capacity (o: reference, n: scaled capacity) X - 0.6 for reactor systems, 0.7 for fabrication and reprocessing [10] Further all monetary values were recalculated to 2001 dollars. In doing this recent exchange rates have been used. The inflation has been set to being three percent over all time. Comparing costs and the value of money is not straight forward. Costs develop differently in different countries and in different industries. Thus, it is not so easy as to just recalculate between currencies using the exchange rate valid at the time the figure was given. The average inflation approach was chosen. It does give some errors, but those errors are assumed being rather small in comparison to the errors included in unit costs themselves.
X
o
non K
KCC
×=

3
Description of unit costs
CostU – Cost of natural Uranium ($/kg) Natural uranium prices are fairly easy to estimate in the short time scale. However in the longer time scale the price is not as obvious. The price today is about 40 $/kg. The unit cost was chosen to 30 $/kg [11]. OECD/NEA [3] suggests 20 $/kg as lower and 80 $/kg as upper bound for uranium price fluctuations.
CostUconv – Cost of Uranium conversion ($/kg) The cost for uranium conversion has been chosen to 5 $/kg. A lower limit estimation is 3 $/kg and an upper 8 $/kg. Conversion costs are discussed in details in the Global ‘95 conference precedings [2].
CostUenr – Cost of Uranium enrichment ($/kg) Different authors address the cost of enriching uranium [2], [1] There seems to be some understanding of a price around 90 $/kg ranging between 70 $/kg and 120 $/kg.
CostUdepl – Cost of the handling of depleted Uranium ($/kg) The handling of depleted uranium is not performed in Sweden. Hence, the cost of it does not show in our calculations. The cost is included in the other uranium costs and was simply set to zero.
CostUOXfab – Cost of UOX-fuel fabrication ($/kg) Much has been written [3], [2] on the cost of fabricating UOX-fuel. The general belief is that the cost of future manufacturing will be about 250 $/kg ranging from 200 $/kg to 350 $/kg.
CostUOXIntstor – Cost of spent UOX-fuel interim storage ($/kg) The unit cost of the Swedish interim storage CLAB is 59 $/kg UOX [12]. International references [3], [2], [13] suggest somewhat higher costs, both the Global ’95 conference and OECD/NEA suggests unit costs as high as around 300 $/kg UOX. Based on this, a reasonable unit cost for spent UOX-fuel interim storage in the future is assumed to be 120 $/kg UOX ranging from 60 $/kg to 300 $/kg.
CostUOXrepro – Cost of spent UOX-fuel reprocessing ($/kg) Reprocessing of the spent UOX-fuel is assumed to be performed by an aqueous process such as the UREX or PUREX process. There are a few reprocessing plants, e.g. La Hauge and Sellafield, running today. These installations are rather old and are more or less paid off. Future reprocessing is assumed to be a bit more expensive than reprocessing today. Several references [3], [1], [14], [6] suggest a unit cost ranging from 500 to 1100 $/kg heavy metal1 (kgHM). A reasonable estimate of the unit cost in the future is 800 $/kgHM. The Global ’95 conference proceedings suggests a cost as high as 1800 $/kgHM [2]. Since all other references suggest far lower values the lower value of 800 $/kgHM ranging from 500 $/kgHM to 1100 $/kgHM was chosen.
CostMOXfab – Cost of MOX-fuel fabrication ($/kg) The unit cost has been set to 1100 $/kgHM ranging from 600 to 1750 $/kgHM. This is based on figures from the EPRI, Global ’95 and OECD/NEA references [3], [2], [1].
CostMOXrepro – Cost of MOX-fuel reprocessing ($/kg) The mass flow of spent MOX-fuel is rather small in comparison to the flow of spent UOX-fuel. Hence dilution of the MOX-fuel with UOX-fuel is assumed to decrease the radiation per mass. If the fraction of MOX-fuel is kept below twenty percent of the total mass flow, the same process is
1When speaking of heavy metal (HM) both the fuel metal itself and the cladding material, which mostly consists of zirkaloy, are included.

4
assumed as for pure UOX-fuel, leading to the same costs. The unit cost for reprocessing spent MOX-fuel was set to 800 $/kgHM, ranging from 500 to 1100 $/kgHM.
CostUOXgeo – Cost of spent UOX-fuel geological disposal ($/kg) A number of countries have announced estimations of the costs of disposing spent UOX-fuel geologically. The estimations differ a bit, mainly depending on which storage method is preferred. The value published for Sweden is 220 $/kgHM [12]. The unit cost value was chosen to be 300 $/kgHM ranging from 130 to 500 $/kgHM.
CostHLWgeo – Cost of High Level Waste geological disposal ($/kg) The cost of storing high level waste is about 400000 $/m3 [15]. The unit is often expressed as cost per volume as volume is the real cost driver when constructing geological storages. One tonne of glass waste needs two cubic metres meaning the unit cost would be 800 $/kgHLW.
CostADSfab – Cost of ADS-fuel fabrication ($/kg) Estimating unit costs for the ADS-fuel is difficult. ADS fuel will be very radioactive. All handling will need major radiation-shielding measures. The shielding makes handling expensive. There are rather few references that address this hot fuel. Estimates originate from the few references though. Costs were rescaled according to the mass flow of interest. Figures given in PNNL-13018 [14] and MIT-NFC-TR-019 [6] suggest the unit cost for manufacturing ADS fuel to be 11700 $/kgHM. After scaling this value falls to 5000 $/kgHM, This is a major scaling that ends up far away from its origin. Five thousand $/kgHM is suggested as unit cost, however this is questionable. The unit cost is assumed ranging from 5000 to 17500 $/kgHM. A lower boundary of 2600 $/kgHM was suggested by MIT-NFC-TR-019 originating from the estimate for integral fast reactor fuel fabrication, however 5000 $/kgHM is a more recent estimate. The upper boundary is 150 percent of the 11700 $/kgHM.
CostADSrepro – Cost of spent ADS-fuel reprocessing ($/kg) Spent ADS-fuel will be very hot due to high contents of americium and curium. To shorten cooling times, and thus the fuel cycle length, non-aqueous reprocessing methods should be used for the reprocessing. Radiation from the spent fuel is the main cost driver of the reprocessing plant. A high content of americium and curium makes the process more expensive. The PNNL-13018 [14] and MIT-NFC-TR-019 [6] reports discuss the costs for small scale reprocessing of hot fuel [14], [6]. The unit cost was estimated to 20000 $/kgHM. However scaling the unit cost for the Swedish nuclear power park suggests a lower unit cost of 16000 $/kgHM. More recent estimates [15] suggest 11000 $/kgHM would be a better value. This was chosen as the unit cost in the calculations. Five thousand dollars per kgHM is proposed as lower limit. The unit cost was scaled to fit a US sized reactor park running in a transmutation scenario. This gives 10000 $/kgHM. The figure was then halved to give some space for technological breakthroughs. Thus, the lower limit was calculated to 5000 $/kgHM. As an upper limit for the unit cost 30000 $/kgHM is proposed. This is simply fifty percent more than the value proposed in the references.
CAPLWR – Investment LWR ($/kWe) Some LWR-reactors are being built around he world today. Finland is planning for a fifth commercial reactor. It is estimated to cost around 1590 $/kWe installed [16]. Cost estimations for other reactors are as high as 2200 $/kWe installed [15]. These values include interest during construction and decommissioning. In the calculations 1700 $/kWe was chosen as unit cost. Labour costs in Sweden are rather low which together with a low expected interest during construction motivates this rather low value.
CAPADS – Investment ADS ($/kWe) To estimate the investment needed to build an ADS plant, figures from fast reactor construction have been used [2], [17], [18]. An ADS system is very similar to the fast reactor when it comes to

5
heat transfer, cooling and electricity production. The very different component is the accelerator. The unit cost for the ADS was estimated to the cost of building a fast reactor plus the cost of an accelerator. A fast reactor is assumed to need an investment of 1950 $/kWe ranging from 1200 to 3450 $/kWe installed power.
Costbeam – Cost of accelerator ($/W beam) The beam cost is assumed to be 15 $/W beam ranging from 5 to 20 $/W beam. This assumption is mainly relying on the US ATW roadmap [4].
O&Mreactor – Operations and maintenance costs for reactors (% of investment / yr) Operations and maintenance cost for LWR-reactors is known [7], [19] to be ranging from two to three percent of the original investment annually.
O&MADS - Operations and maintenance costs for ADS (% of investment / yr) The O&M costs for an ADS system is assumed to be twice the LWR costs, i.e. four to six percent of the original investment annually. This is mainly due to accelerator maintenance and the frequent replacements of spallation windows.
FCR – Fixed charge rate (%) The fixed charge rate is assumed to be ranging from eight to fourteen percent. This should be understood as the return on investment expected by investors. A ten percent fixed charge rate paid during twenty years corresponds to an interest rate of 7,8 percent if paying the dept in equal amounts during the twenty years. This follows from the expression for annuity
(2)
a – annual payment c – original dept p – interest rate expressed in percent t – pay back time expressed in years
UNIT PARAMETERS
Description of unit parameters
Most of the unit parameters chosen for the calculations are standard ones and need not be commented. There are a few though, which might need a comment.
1100
1
1001001
−
+
⋅
+
⋅= t
t
p
pp
ca

6
Table 1. Unit parameters used in modelling Total electric energy produced in LWR park per year 73 TWhe Thermal efficiency LWR 34 % Thermal efficiency ADS 40 % Load factor LWR 82 % Load factor ADS 70 % Own energy consumption LWR (% of thermal power) 1 % Own energy consumption ADS (% of thermal power) 5 % Loss factor in mining & milling 0,01 Loss factor in conversion 0,001 Loss factor in enrichment 0,001 Loss factor in UOX-fuel fabrication 0,001 Loss factor in MOX-fuel fabrication 0,001 Loss factor in UOX-fuel reprocessing 0,001 Loss factor in ADS-fuel fabrication 0,001 Loss factor in ADS-fuel reprocessing 0,001 Scaling exponent for reactors 0,6 Scaling exponent for fuel fabrication 0,7 Scaling exponent for reprocessing 0,7 Mean ADS Accelerator beam power 40 MW
Thermal efficiency LWR - 34% The modern Swedish LWRs reach 34% thermal efficiency. This value seems reasonable also for new reactors, especially if they are big ones.
Thermal efficiency ADS – 40% An ADS will reach a higher thermal efficiency than does the LWRs. This is due to the much higher upper temperature in the ADS. In theory an even higher efficiency could be reached. It is just a question of how many steam over heaters you can afford to build. The upper temperature of coolant reaching the heat exchanger limits the thermal efficiency.
Load factor LWR – 82% The average availability of Swedish LWRs is historically around 82%.
Load factor ADS - 70% The ADS load factor depends mainly on the accelerator availability and is thus very hard to estimate with good accuracy. Some suggest 85% [15], which we believe is a bit optimistic. Here, 70% is used, which might be below the targeted load factor, but is in good agreement with proven load factors for the fast reactors BN-600 and BOR-60.
RESULTS
Cost of electricity
The cost of electricity from nuclear power has been calculated in three different fuel cycle scenarios. As the reference case a light water reactor scenario without reprocessing was used (Once through). The two other scenarios use dedicated subcritical systems to transmute the wastes from the light water reactor park. In one of the scenarios (LWR UOX + ADS) spent UOX fuel is sent directly to transmutation. The other scenario (ADS + LWR MOX) contains an intermediate step of plutonium recycling in the light water reactors.

7
The costs for producing electricity in these three scenarios range from 24,54 mills/kWh to 37,24 mills/kWh - Figure 1. Only the production costs were considered. No taxes or subsidises were taken into account. Once through is the cheapest scenario. The advanced fuel cycles show a higher cost of electricity, but are still low enough to be competitive in a future market with anticipated higher electricity prices.
1.743.23 3.30
14.20 10.9212.01
7.31
5.626.18
4.443.20
5.02 3.35
5.17
3.45
1.29
0.19
0.19
0.00
5.00
10.00
15.00
20.00
25.00
30.00
35.00
40.00
Once through LWR UOX +ADS
ADS + LWRMOX
CO
E (m
ills)
Wastes
ADS O&M
ADS Capital cost
ADS Fuel cycle
LWR O&M
LWR Capital cost
LWR Fuels
Figure 1: Overall cost distributions for the three fuel cycles considered. COE is the abbreviation for Cost of Electricity, O&A - for Operation and Maintenance.
The main cost driver of the three fuel cycles is the capital cost of the light water reactors. Also in the advanced fuel cycles light water reactors are still the main reactor type. Operation and maintenance costs are proportional to the installed power and follow the capital costs. Even though mass flows are rather small, the ADS fuel cycle accounts for a main part of the total cost

8
in the advanced fuel cycles. In the second scenario these costs are very close to half the total cost. But, recycling plutonium in light water reactors as MOX-fuel significantly reduces the amount of material to transmute and consequently reduces the cost of the transmutation. The total capacity of light water reactors have to be a bit greater which increases LWR related costs, but the total cost of the third scenario remains smaller than does the total cost of the second scenario.
Sensitivity analysis
A sensitivity analysis has been performed in order to understand the impact of some parameters of the final cost of electricity. The cost calculations were based on estimated unit costs and parameters [20]. The results of these sensitivity studies for some important parameters are presented in Figure 2 through Figure 13.
Capital costs
05
101520253035404550
1300 1500 1700 1900 2100 2300
LWR Investment ($/kWe)
CO
E (m
ills/
kWh)
Once through
LWR UOX + ADS
ADS + LWR MOX
Figure 2: The cost of electricity as function of the LWR investment
The cost of constructing the light water reactors is a very important part of the total economy of all three fuel cycles - Figure 2. Even small changes in the cost may significantly change the cost of electricity. As an example a ten percent higher capital cost raises the once through cost of electricity by 8,8 percent.

9
0
10
20
30
40
50
60
70
4 5 6 7 8 9 10 11 12 13 14
FCR (%)
CO
E (m
ills/
kWh)
Once through
LWR UOX + ADS
ADS + LWR MOX
Figure 3: The cost of electricity as function of the fixed charge rate
The capital cost is very closely connected to the interest rate. Also changes in the interest rate have a great impact on the cost of electricity - Figure 3. Doubling of the interest rate increases the cost of electricity almost by fifty percent.
Reactor operation Other very important aspects of the total fuel cycle economy are the parameters of the reactor operation. The thermal efficiencies, availabilities and burn-ups all affect the cost of electricity produced significantly. Figure 4 presents the effect of LWR thermal efficiency on the final cost of electricity.
20
25
30
35
40
45
0,25 0,3 0,35 0,4
LWR Thermal efficiency
CO
E (m
ills/
kWh)
Once through
LWR UOX + ADS
ADS + LWR MOX
Figure 4: The cost of electricity as function of the LWR thermal efficiency.
The cost of electricity lowers as the efficiency of the turbines and generator increases. For the advanced fuel cycles the effect is stronger. This is because the need for expensive transmutation decreases as the fuel is used more efficiently in the light water reactors.
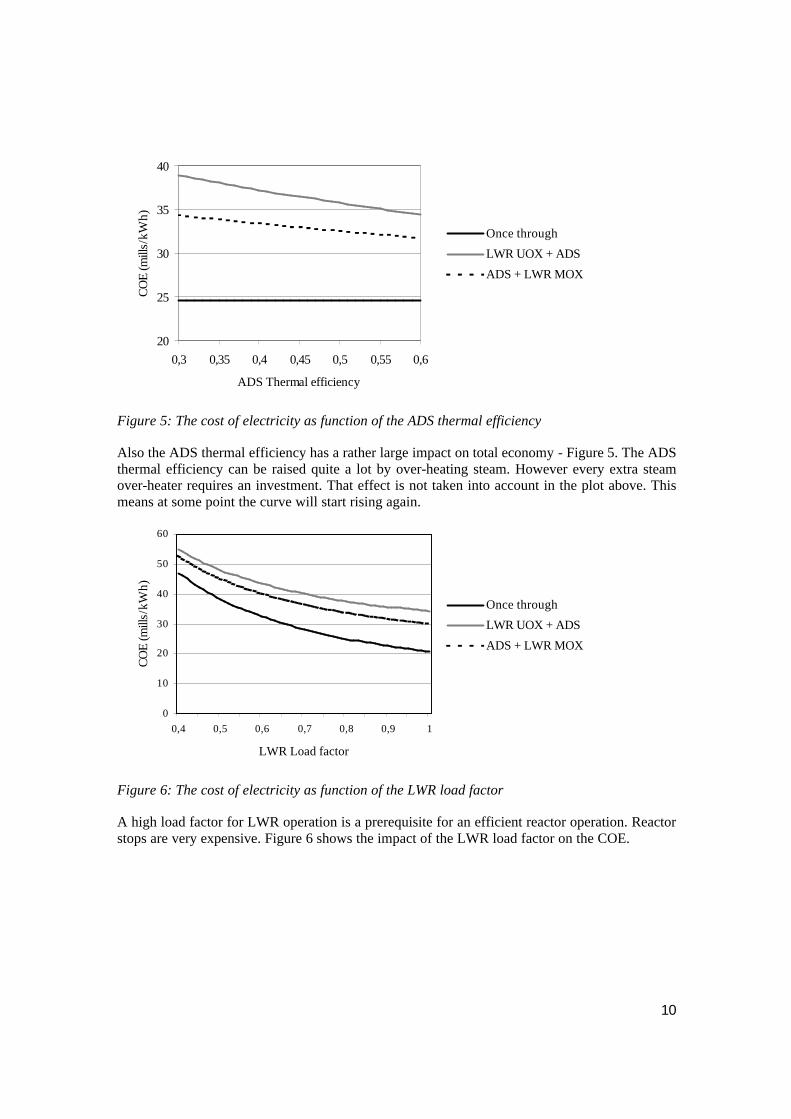
10
20
25
30
35
40
0,3 0,35 0,4 0,45 0,5 0,55 0,6
ADS Thermal efficiency
CO
E (m
ills/
kWh)
Once through
LWR UOX + ADS
ADS + LWR MOX
Figure 5: The cost of electricity as function of the ADS thermal efficiency
Also the ADS thermal efficiency has a rather large impact on total economy - Figure 5. The ADS thermal efficiency can be raised quite a lot by over-heating steam. However every extra steam over-heater requires an investment. That effect is not taken into account in the plot above. This means at some point the curve will start rising again.
0
10
20
30
40
50
60
0,4 0,5 0,6 0,7 0,8 0,9 1
LWR Load factor
CO
E (m
ills/
kWh)
Once through
LWR UOX + ADS
ADS + LWR MOX
Figure 6: The cost of electricity as function of the LWR load factor
A high load factor for LWR operation is a prerequisite for an efficient reactor operation. Reactor stops are very expensive. Figure 6 shows the impact of the LWR load factor on the COE.

11
0
10
20
30
40
50
0,4 0,5 0,6 0,7 0,8 0,9 1
ADS Load factor
CO
E (m
ills/
kWh)
Once through
LWR UOX + ADS
ADS + LWR MOX
Figure 7: The cost of electricity as function of the ADS load factor
As seen in Figure 7 the effect of low load factors of ADS is smaller than in the LWR case. This is due to the much smaller power production in the ADS part of the fuel cycle.
30
33
36
39
42
45
5 10 15 20 25 30 35 40 45 50
Burn-up (%)
CO
E (m
ills/
kWh)
LWR UOX + ADS
ADS + LWR MOX
Figure 8: The cost of electricity as function of the ADS burn-up.
Together with separation losses the burn-up factor in the ADS determines the efficiency of the transmutation. The higher burn-up, the less reprocessing is needed. Since reprocessing is very expensive, this is an important aspect to the total cost. However the largest impact of increased burn-up can be seen in the interval of 5 – 20% burn-up – Figure 8 – were the final costs can drop by almost 30%. A further increase in the burn-up over the twenty percent level has a minor impact on the final costs. The Sing-Sing reactor design has a burn-up of transuranic elements (TRU) of 12,4%, increased burn-up to 20% could give a 10% drop on the final cost of electricity.

12
Accelerator economics The cost of particle accelerator construction for commercial use in transmutation facilities is still difficult to assess. Figure 9, based on the data from the US ATW Roadmap [4] shows, surprisingly, that these are not driving costs. However the accelerator has a great impact on total economy since its properties are important to the ADS availability. It is essential to achieve high accelerator reliability since beam stops lead to the stopping of the electricity production. Even though the ADS load factor is not the main cost driver, the prime interest apart from producing electricity is to transmute radioactive wastes. Transmutation is only possible when the accelerator is running.
20
25
30
35
40
5 10 15 20
Cost of beam ($/W)
CO
E (m
ills/
kWh)
Once through
LWR UOX + ADS
ADS + LWR MOX
Figure 9: The cost of electricity as function of the cost of constructing the ADS accelerator
Fuel cycle economics
20
25
30
35
40
20 30 40 50 60 70 80
Uranium price ($/kg)
CO
E (m
ills/
kWh)
Once through
LWR UOX + ADS
ADS + LWR MOX
Figure 10: The cost of electricity as function of the uranium price
Figure 10 indicates that uranium price is not a very important cost driver of the nuclear fuel cycles studied. The once through fuel cycle uses more uranium per kWh produced than do the

13
other scenarios. Consequently the once through fuel cycle is affected more by changes in the uranium price. However, the changes are still small.
20
25
30
35
40
500 600 700 800 900 1000 1100
UOX Reprocessing ($/kgHM)
CO
E (m
ills/
kWh)
Once through
LWR UOX + ADS
ADS + LWR MOX
Figure 11: The cost of electricity as function of the uranium oxide (UOX) reprocessing costs
Reprocessing of spent UOX fuel is an important element in both of the advanced scenarios - Figure 11. Even though, the impact of rather large changes in the unit cost is still within a few percent on the total cost of electricity. The once through fuel cycle does not include any form of reprocessing; consequently the cost of electricity remains the same when the unit cost for reprocessing changes. It is very difficult to estimate the cost of handling the very radioactive spent ADS fuel. It shows though - Figure 12 and Figure 13 - that neither the ADS fuel fabrication nor ADS reprocessing are very important cost drivers. An increased ADS fuel fabrication costs by a factor of two gives only a few percent (2-3%) impact on the final electricity cost. Variations of the reprocessing costs by a factor of six - from 5000 $/kg HM to 30000 $/kg HM – results in COE increases of only 12% and 16% respectively for the two advanced schemes.
20
25
30
35
40
5000 6000 7000 8000 9000 10000 11000
ADS fuel fabrication ($/kgHM)
CO
E (m
ills/
kWh)
Once through
LWR UOX + ADS
ADS + LWR MOX
Figure 12: The cost of electricity as function of the ADS fuel fabrication cost.

14
20
25
30
35
40
45
5000 10000 15000 20000 25000 30000
ADS Reprocessing ($/kgHM)
CO
E (m
ills/
kWh)
Once through
LWR UOX + ADS
ADS + LWR MOX
Figure 13: The cost of electricity as function of the ADS reprocessing cost
CONCLUSIONS
Analysis of the sensitivity study results show that the three scenarios line up in the same order. “Once through” is cheaper than is “ADS + LWR MOX” which, is cheaper than is “LWR UOX + ADS”. It is obvious that an ADS strategy needs MOX recycling in light water reactors to be competitive. The COE shows a linear behaviour in most cases described here. The calculation model used in this study contains very few feedbacks between variables and further development of the models containing more sophisticated interrelations between parameters requires much deeper knowledge in many areas important for ADS economy. Even finding a single estimate for a unit cost is often difficult. Table 2 summarizes the cost analysis.
Once through LWR UOX + ADS ADS + LWR MOX
LWR Fuels 1.74 3.29 3.34
LWR Capital cost 14.20 11.13 12.16LWR O&M 7.31 5.73 6.26
ADS Fuel cycle 0.00 4.52 3.24ADS Capital cost 0.00 6.10 4.05
ADS O&M 0.00 6.28 4.16
Wastes 1.29 0.19 0.19
COE 24.54 100% 37.24 152% 33.40 136% Table 2: Summary table of fuel cycle costs
Electricity from the “LWR UOX + ADS” scenario is 52% more expensive than is “once through” electricity, “ADS + LWR MOX” is 36% more expensive. Assuming an 85% ADS load factor and 20% TRU burn-up would lower the relative costs to 136% and 125% respectively for the advanced fuel cycle scenarios. Compared to other sources of electricity nuclear shows to be a realistic alternative. The costs of electricity from many types of power plants are in the range of the costs discussed above.

15
0
10
20
30
40
50
Once through ADS ADS with MOX Carbon condensepower 400 MWe
Fossilgascondense combicycle 400 MWe
Bio fuel powerwith sold heat 80
MWe
Fossil gas engine1 MWe
Wind power 0,6MWe
CO
E (
mill
s/kW
h)
Figure 14: The cost of electricity from different power plants2.
As seen in Figure 14 nuclear power plants are competitive to other power plants. It is also – from an economic point of view - realistic to transmute the nuclear wastes in a transmutation fuel cycle.
ACKNOWLEDGMENTS
The authors send their special thanks to Dr. Luc van den Durpel of the Nuclear Energy Agency (OECD/NEA). This work was funded by the Swedish Nuclear Fuel and Waste Management Co. (SKB AB).
REFERENCES
[1] EPRI, A review of the Economic Potential of Plutonium in Spent Nuclear Fuel, EPRI, Palo Alto, 1996, pages 4.11, B-4, C-14, chapter C 5.2
[2] B. G. Chow, Plutonium Economics and the Civilian Nuclear Future, Global ’95 – International Conference on Evaluation of Emerging Fuel Cycle Systems, proceedings, Paris, 1995
[3] OECD/NEA, Trends in the Nuclear Fuel Cycle: Economic, Environmental and Social Considerations, in preparation, 2001
[4] DOE, A Roadmap for Developing Accelerator Transmutation of Waste (ATW) Technology – A Report to Congress, DOE/RW-0519, 1999
[5] S. Monti, editor, A European Roadmap for Developing Accelerator Driven Systems (ADS) for Nuclear Waste Incineration, ENEA, 2001, ISBN 88-8286-008-6
[6] D. Kim et al. Economic Analysis of the Fuel Cycle of Actinide Burning Systems, MIT-NFC-TR-019, 2000, pages 18-26
[7] R. A. Krakowski, Accelerator Transmutation of Waste Economics, Nuclear Technology vol. 110:1995
[8] J. Wallenius et al. Application of burnable absorbers in an accelerator driven system, Nuclear Science and Engineering 137 (2001) 96
2The costs were calculated using a computer-based model provided by the Swedish National Energy Administration. Costs apply to the current Swedish situation.

[9] McDonald et al. Learning Rates for Energy Technologies, Energy Policy 29:2001
[10] OECD/NEA, Reduction of Capital Costs of Nuclear Power Plants, OECD/NEA, 2000, ISBN-92-64-17144-4
[11] IAEA, Analysis of Uranium Supply to 2050, 2001, IAEA, ISBN-92-0-100401-X
[12] SKB, Plan 2000 – Kostnader for kärnkraftens radioaktiva restprodukter, SKB, ISSN 1404-1804, 2000
[13] IAEA, Back end of the Nuclear Fuel Cycle: Economic, Environmental and Social Considerations, in preparation, 2001
[14] R. I. Smith et al. Estimated Cost of an ATW System, 1999, PNNL-13018 pages 4.16, 4.18
[15] Luc van den Durpel, Private communication, 2001-08-31
[16] R. Tarjanne et al. Nuclear Power: Least-Cost Option for Baseload Electricity in Finland, The Uranium Institute 25th Annual Symposium, London, 2000
[17] R.S. Hall et al, Towards an Economic Fast Reactor, Nuclear Engineering International, 1989
[18] H. Noda, Current status of Fast Reactor Cycle Systems in Japan, ICONE-8, 2000
[19] OECD/NEA, Projected Costs of Generating Electricity, Update 1998, OECD/NEA, 1999
[20] D. Westlén, A Cost Benefit Analysis of an Accelerator Driven Transmutation System, MSc Thesis, Royal Institute of Technology, Stockholm, 2001.

APPENDIX XI
Waclaw Gudowski, et al., "IAEA BENCHMARK ON ACCELERATOR-DRIVEN SYSTEMS”, Proc. Accelerator Applications 2001 and ADTTA 2001 “Nuclear Applications in the New Millennium”, Reno (USA). ANS (2001)

1
IAEA BENCHMARK ON ACCELERATOR-DRIVEN SYSTEMS
Waclaw Gudowski1, Cornelis Broeders2, Sergey Chigrinov3, Yaccine Kadi4, Anna Kievitskaya3, Henk
Klippel5, Igor Slessarev6, Alex Stanculescu7 and A. Tchistiakov6
1 Royal Institute of Technology, Dept. of Nuclear and Reactor Physics, SCFAB, 106 91 Stockholm, Sweden 2 Forschungszentrum Karlsruhe, IRS, Postfach 3640, 76021 Karlsruhe, Germany
3 Radiation Physics and Chemistry Problems Institute, 220109, Minsk-Sosny, Belarus 4 CERN, European Organisation for Nuclear Research, Geneve 23, CH-1211 5 Nuclear Research and Consultancy Group,1755 ZG Petten, The Netherlands
6 Commissariat á l' Energie Atomique CEA/CE Cadarache, 13108 Saint Paul Lez Durance, France 7 International Atomic Energy Agency, Post Office Box 100, A-1400 Vienna
Abstract - International Atomic Energy Agency (IAEA) has coordinated a benchmark activity on Accelerator-Driven System (ADS). First stage of this benchmark was focused on simulations of Energy Amplifier-like systems fuelled with Th/233U and cooled with liquid lead. The results showed a common pattern for keff evolution as a function of time with a strong Protactinium reactivity swing. However, with a proper choice of the initial keff an acceptable keff evolution can be obtained limiting the necessity for large variation of the proton accelerator power. A low level of Minor Actinides accumulation has been observed and consequently a relatively low long-term radioactivity of the spent ADS fuel. Essential discrepancies were found in simulations of the keff curves for the end of simulating periods (about 5 years). This is a sign of a significant deficiency in some codes simulating burnup processes and accumulation of the errors in a fission product treatment. Also results for void coefficients, spectral indices distributions and effectiveness of spallation neutrons have not been in the acceptable limits of discrepancies.
I. INTRODUCTION
International Atomic Energy Agency has coordinated a benchmark activity on Accelerator-Driven System (ADS). First stage of this benchmark was focused on simulations of Energy Amplifier-like [1] systems fuelled with 233U/Thorium and cooled with liquid lead.
The following goals have been envisaged for the Stage 1:
o Intercomparison of the principal neutronic features of EA-ADS:
• fuel enrichments corresponding to a different subcriticality levels,
• sensitivity of subcriticality level to fuel burnup value (burnup evolution curves) (stability of ADS-reactivity between fuel reloading)
• evolution of proton current requirements,
• void effect in the EA-ADS fuelled by Th-based fuel,
• long-term activity of fuel under irradiation;
o Intercomparison of results of different calculation codes and data libraries in order to understand the level of current dispersion
in principal neutronic parameters and to identify sources of these discrepancies.
The calculations performed in the very early stage of this benchmark generated a vivid discussion about the importance of k-source (ks) parameter for the subcritical systems. It was one of the achievements of the benchmark to clarify and fully understand the significant differences in source multiplication - ks and keff approaches for simulations of the subcritical systems.
Stage 2 of the benchmark was to devoted to an assessment of the neutronic potential of a modular fast spectrum ADS for radiotoxic waste transmutation. A simplified description of an ADS, restricted to the reactor part, with TRU or MA fuel (keff = 0.96) has been analysed.
In the Stage 3 calculations of the existing experimental subcritical facility have been performed. A thermal neutron subcritical system “Yalina”, at the Radiation Physics and Chemistry Problems Institute in Minsk, has been simulated and results have been compared with experimental data.
This paper due to the limited space and a lot of results to be reported will concentrates on the stage 1 of this benchmark.

2
),(0 ErSS ξ=
II. PRINCIPAL NEUTRONIC FEATURES OF ADS
Neutronics of ADS can be described by the neutron transport equation for neutron flux Φ:
SMA +Φ=Φ (1) where: A - neutron consumption operator (neutron absorption and leakage), M- neutron production in a subcritical blanket, S- neutron source.
The neutron source can be presented as
where So - total neutrons production rate and ),( Erξ normalised to ∫∫ = )1)','(''( ErdEdr ξ
space-energy distribution for the source. If the source depends on spallation neutron
production through the blanket power W(expressed in fission’s per time unit), then
where: µ is a fraction of the power being spent for spallation, Γ is the number of neutrons produced if each fission can be transformed in proton beam.
Let us consider the eigenvalue-type equation for neutron importance Φ*(related to keff):
**1
** Φ=Φ Meffk
A (2)
Combining (1) and (2) one can get easily:
(3)
where
∫∫∫ ΦΣΦ
∫∫∫ ΦΣΦ=
)',()',(),(*'
)',()',()(),(*'
ErErfErdrdEdE
ErErfEErdrdEdE νχν
- the averaged number of secondary neutrons
∫∫
∫∫∫ Φ=Φ
),(
),(*),(*
ErdrdE
ErErdrdEs
ξ
ξ - the averaged
importance of the “external” source,
∫∫ ΦΣ
∫∫∫ ΦΣΦ=Φ
)',()',('
)',()',(),(*'*ErErfdrdE
ErErfErdrdEdEF
ν
the averaged importance of the neutrons producing fission (or “internal neutron source”).
It follows from (3)
−
Γ= 1
1
* effkϕ
νµ (4)
where *
**
F
s
Φ
Φ=ϕ is the ratios of averaged
importances of the “external” and “internal” sources. This parameter can be called as the “effectiveness of spallation neutrons” in an ADS.
Equation (4) describes the fraction of power produced by subcritical system, which is required to sustain spallation processes. It does not depend on power level and serves as the basic equation for ADS’s integral neutronic parameters. Dynamics of such a system is similar to dynamics of a critical system having a supplementary fraction (µ) of delayed neutrons (due to spallation process). Delay time of these neutrons (tSP) is determined by processes taking place between fissions in the subcritical core and production of spallation neutrons in the target. This delay time can be controlled (optimised) within some reasonable interval. For point kinetics approximation, the equation for ADS-power P can be presented in the following form:
(4a)
Where all notations are used as traditionally for critical reactors. ADS’s reactivity ρ(t) takes into account both: initial subcriticality level and reactivity insertion during transients. Intermediate cases can be also realised, when external neutron source is activated simultaneously with delayed and time independent fractions of a spallation neutron source.
Equation (4a) has no external neutron source, similarly as for all critical reactors. This means that if real fraction of power which is being spent for spallation, exceeds one defined by (4) then ADS-power will unlimitedly grow. In its turn, if real fraction will be less than (4) ADS will have “zero-power”. Hence, such ADS can be considered as critical system with two different sources of delayed neutrons: those coming from the decay of fission products and the spallation neutrons. Spallation source delay can be useful for an enhancement of some inherent safety features (self-protection against overheating during transients without scram: LOFWS, LOHSWS, etc.) as well as for improving “load-following” characteristics of ADS. In the case of a long “delay time” of
ΦΦ
Φ+=
M
S
effk
*,1
1
)',()','(''0 rErEfdEdrWS Φ∫∫ ΣΓ=Γ= µµ
*
*
*
*,
F
sWoS
M
S
Φ
Φ×=
ΦΦ
Φ
ν
∑ −Γ++
+−
=
jttPjCj
tPtl
tt
dt
tdP
sp )(
)()(
)()()(
µλ
βρ

3
νW
S
Sk01
1=−
Φ
Φ=
A
Msk
sfissions
effk
SW /
11
0
−
=
ν
spallation neutrons, one has a system similar to the case of “independent external neutron source”.
For completely independent source, equation (3) defines the corresponding power level:
(4b)
if S0 is expressed in neutrons/s. Equations (3-4) allow to evaluate ADS-
neutronics on the base of keff and ϕ* (ν does not change much): this is so called “keff-method” of analysis.
There is another method of the integral-like assessments of ADS-neutronics on the base of the source multiplication factor kS. kS is defined through integration of (1)
(5)
where ; means an integration over all domain of
variables of an operator. Neutron consumption operator consists of two
parts: fission and parasitic capture (including neutron leakage) Φ+Φ=Φ CFA
Then
(6) Equation (6) is equivalent to (3) and it gives the
fraction µ of a subcritical core energy for spallation as the following, if one puts S0=µΓW:
−
Γ= 1
1
Sk
νµ (7)
Comparing (7) and (4) one can get a coupling
between ϕ* and integral parameters keff and kS :
−
−
=∗
11
11
Sk
effkϕ (8)
One can use any of two equivalent expressions
for evaluating µ - the fraction of power needed for accelerator required to produce the external neutron source sufficient to keep any desirable ADS’s power. The µ-value defines so called “energy amplification” factor kW as the ratio of ADS’s power and proton beam power:
−
∗Γ==
11
1
effk
Wk
ν
ϕ
µ=
−
Γ
11
Skν
(9)
For evaluation of proton beam parameters and proton current, one can use the following equations: the number of protons (p) per fission in an ADS:
z
k
zp eff
*
11
ϕ
νµ
−
=Γ
=
the number of protons (ζ) produced by an ADS per 1 Watt of power
10101.3*
11
*
11
××
−
≈×
−
=
z
effky
z
effk
ϕ
ν
ϕ
ν
ς
where y- the number of fissions generating 1W of power, z- the number of neutrons produced by one proton. proton current in ADS ( I ):
,5*
11
16106.1)( Wz
effkmAI ×
−
≈−××=
ϕ
ν
ς (10)
where ADS-power W is expressed in MWth. Equations (4) or (7) can be used for evaluations
of all principal reactivity effects including the void-effect of reactivity playing one of decisive roles in safety analysis.
Void effects reflect a change in neutron balance of a nuclear system in the case of voiding. For subcritical system (driving by an external source), the “void-power effect” can be introduced as a potential change of the power (in relative units) when an ADS is voided.
If one uses keff-method of the ADS neutronics analysis then three parameters define a change of
power W
Wδ: keff , ϕ* and ν . The last one, ν , does
not change essentially during voidage. Then one can get
*
*
1
1
*
*
112 ϕ
δϕδ
ϕ
δϕδδ+
−=+
−
=
effk
effk
effk
effkeffk
effk
W
W (11)
This means that void-power effect consists of
the “void-reactivity effect” effk
effkδ and the void-
external neutron source importance effect” *
*
ϕ
δϕ.

4
Expression (11) shows that W
Wδ is rather sensitive
to keff-changes for keff in vicinity 1. For ks version of ADS neutronics assessment,
one has
SkSk
SkW
W δδ
−
=1
1
One can see that some parameters inside of the ks-version are simplified for calculations. However, ks -value itself depends on both multiplication properties of reactor and source "quality" (neutron spectrum, spatial distribution, etc.) because ks is defined by the solution of transport equation with an external source. It means that the general information about an external source contains in ks value. Meanwhile, keff depends on multiplication properties only and ϕ* reflects an external source properties being applied to the given multiplication system.
III. IAEA-ADS-BENCHMARK GOALS AND DEFINITION
The first stage of ADS-Benchmark was devoted to neutronics analysis of those ADS which are under development for Nuclear Energy production with a low long-term activity of wastes.
As a background of this concept, a simplified model of the Energy-Amplifier (EA-ADS) [1] was intercompared.
The goals of the Stage 1 have been mentioned already in the Introduction.
The majority of participants have been used the “keff - methodology” for calculation integral neutronics parameters. In this case keff (as a degree of subcriticality) and the effectiveness of spallation neutrons were taken as the principal parameters for “parametric study”. At the same time, all spatial distributions and evolution curves have been taken from “source dependent neutron transport code versions”. CERN-group performed the benchmark calculations using kS methodology which gives a very visible impact on the results (as shown on Fig. IV.2)
11 groups from different institutes participated in the benchmark: IPPE - Obninsk (Russia), Drs V. Dekoussar, V. Korobeinikov and A. Chebeskov, PSI (Switzerland), Drs P. Wydler and G. Youinou, ENEA (Italy), Drs. U. Broccoli and V. Peluso, CEA-Cadarache (France), Drs I. Slessarev and G. Ritter, FZK-Karlsruhe (Germany), Drs. C. Broeders and I. Broeders NRG-Petten (The Netherlands), Drs. H. Gruppelaar, W. Freudenreich and A. Hogenbirk, JAERI (Japan), Dr. T. Takizuka
IRPCP-Sosny (Belarus), Drs S. Chigrinov, A. Kievitskaia, I. Rakhno and C. Routkovskaia KTH-Stockholm (Sweden), Drs W. Gudowski, K. Tucek, J. Wallenius, J. Cetnar and J. Soltan KAERI (Korea), Dr. W. Park et al. CERN - EET Group, Dr. Y. Kadi, F. Carminati et al.
III.A BENCHMARK SPECIFICATION
The goal of the Benchmark – Stage 1 has been mainly a verification of reactivity burnup swing, as well as verification of some important reactivity effects for a fast spectrum ASDS (233U – 232Th fuel with an external (spallation type) neutron source at different levels of subcriticality.
III.A.1 ADS GEOMETRY
A graphical representation of the ADS-geometry, as modelled in MCNP [3], is given in Fig. III.1. The system is cylinder symmetric around the vertical axis and symmetric around the midplane.
III.A.2 SPALLATION NEUTRON SOURCE
The main characteristics of the proton beam were defined as:
Proton Energy 1.0 GeV
Proton Beam Intensity Source adjusted to yield a thermal power of 1500 MW.
Proton Beam Diameter 20 cm Proton Beam Profile Parabolic
Figure III.1. ADS-geometry for benchmark calculations. Numbers and colors indicate different material regions. No. 1 is a position of spallation neutron source.

5
Energy cut-off 20 MeV The proton beam entered the subcritical core
from above and interacts with lead at a distance located some 25 cm above the core center.
III.A.3 ADS POWER
The power was set to be constant during burnup calculation – 1500 MWth
Averaged temperatures of the principal components of ADS were:
Fuel 1200K Lead and steel 900K
III.A.4 NUCLEI DENSITIES
Nuclei densities at Beginning of Life (BoL) are given in the Table III.2.
233U-enrichments had to be adjusted to get the given keff-values. The isotopic concentrations of Fe, Cr, Mn, W and Pb corresponded to their natural isotopic content.
III.A.5 REQUIRED CALCULATIONS
The requirted calculations were formulated as
follows: 1. Initial (BoL) enrichments of 233U in
regions 1, 2 (the same for both regions) which correspond to the given initial (BoL) keff-values.
Initial keff-values: 0.98; 0.96; 0.94 2. For every given keff (BoL) the evolution
(function of time) curve has to be calculated :
keff = f(t), where t = 0 - 2250 days, time step ∆t=150 days of continuous work. Simultaneously, a burnup level (averaged over regions 1÷2) (GWd/t of heavy atoms) has to be presented, for the final time.
The external source intensity S (n/s) was to be adjusted to maintain the given total power of 1500 GWth.
3. Void reactivity effect: Calculation of keff (BoL) for voided ADS
1) Pb density is equal to 0 in region 1. 2) Pb densities are equal to 0 in regions
1+2 4. Spectral indices and power distributions: Calculation of a radial
UfThf σσ / - spectral indices
distribution for BoL. 5. Calculation of all inventory activities in
Bq/g (cooling time : 102, 103, 104, 105, l06
years) at EoL (t = 2250 days).
III.B INPUT AND OUTPUT DATA
III.B.1 INPUT DATA
An external neutron source has been defined as shown on Fig. III.2 (blue line). The spectrum of the external neutrons has been chosen to be much harder than a more “realistic” one obtained later with MCNPX [2] (red line). All the neutrons with energy higher than 20 MeV were summed up in the
last energy bin covering a 10-20 MeV interval, in order to make calculations possible with “conventional” neutron transport codes having neutron data libraries only up to 20 MeV.
Table III.1 Nuclide densities [(barn·cm)-1] at BoL Nuclide Region 1 Region 2 Region 3 Region 4 Region 5
232Th - - 7.45E-03 - - 233U + 232Th 6.35E-03 7.45E-03 - - -
O 1.27E-02 1.49E-02 1.49E-02 - - Fe 8.10E-03 8.87E-03 8.87E-03 - 6.63E-03 Cr 1.12E-03 1.06E-03 1.06E-03 - 8.00E-04 Mn 4.60E-05 5.10E-05 5.10E-05 - 3.80E-05
10-3 10-2 10-1 100 101 102 103
0,00
0,05
0,10
0,15
0,20 Benchmark spectrum Real spectrum (MCNPX)
Neu
tron
spe
ctru
m (
dn/d
E)
Energy (MeV)
Figure III.2. Spectrum of the spallation neutron source used in the benchmark. The neutron source used in the benchmark (blue line) is much “harder” than a realistic spallation neutron source (red line) as shown here in the results of MCNPX-simulations.

6
W 4.60E-05 5.10E-05 5.10E-05 - 3.80E-05 Pb 1.77E-02 1.56E-02 1.56E-02 3.05E-02 2.41E-02 Total 4.6062E-02 4.7982E-02 4.7982E-02 3.05E-02 3.1606E-02
IV. RESULTS
Participating groups, codes and nuclear data libraries used and figure designation is presented in Table IV.1.
Table IV.1. Participants of the IAEA benchmark – Stage 1, tools and figure designation. Participants Codes Data basis Figure designation IPPE Diffusion code RZA, RHEIN ABBN � IPPE Monte-Carlo – MMKFK ABBN + PSI Deterministic – 2DTB JEF-2.2 E PSI Deterministic – 2DTB JENDL-3.2 × ENEA MCNP/Origen [4] ENDFB6 ◊ CEA-Cadarache Deterministic JEF2.2 � FZK Deterministic – TWODANT [5] JEF2.2 ♦ NRG Monte-Carlo – MCNP4A [3] JEF2.2 . JAERI Monte-Carlo JENDL3.2 ∆ IRPCP-Sosny Diffusion code ENDFB6 . KTH Monte Carlo- MCB [6] JEF-2.2 • KTH Monte Carlo- MCB JENDL-3.2 ♦ KTH Monte Carlo- MCB ENDFB6.5 ? KTH Monte Carlo- MCB ENDFB6.5+
DN
KTH MCNP/ORIGEN JEF2.2 Ο KAERI MCNP/ORIGEN ENDFB6 CERN EA–Monte Carlo [7] JEF-2.2 •, ¾ CERN EA–Monte Carlo JENDL-3.2 •, ¾ CERN EA–Monte Carlo ENDFB6 •, ¾ CERN EA–Monte Carlo JAR ♦
IV.A ADS FUEL ENRICHMENT
Results of the enrichment calculations – Table IV.2 - show the essential dispersion in neutron balance of the ADS even in beginning of core life (BoL) due to the following factors: different neutron cross-section libraries (see, for example, JEF and JENDL results presented by PSI, JEF, JENDL and ENDFB presented by KTH) and Monte-Carlo versus deterministic codes results (look at IPPE results). This difference can provoke
an accumulation of errors to the end of core life (EoL).
Some extra attention should be put on the results of KTH, showing in row denoted by ENDFB6.5+DNS, an effect of delayed neutron spectrum. Results of KTH- ENDFB6.5 and ENDFB6.5+DNS show clearly an impact of the spectrum of delayed neutrons. Delayed neutrons having a “softer” spectrum reduce enrichment of the fuel by about 0.14%
Table IV.2. 233-U enrichment (E in %) in the zones 1 and 2 and dispersion D(E)
k-eff =0,98 k-eff=0.96 k-eff=0.94 Participants Data library E % D(E) E% D(E) E % D(E) IPPE Diffusion code 10,01 -0,1% 9,69 0,0% 9,38 0,1% IPPE ABBN 10,26 2,4% 9,925 2,4% 9,61 2,5% PSI JEF-2.2 10,28 2,6% 9,95 2,6% 9,62 2,6% PSI JENDL-3.3 9,88 -1,4% 9,57 -1,3% 9,25 -1,3% ENEA ENDFB 10,29 2,7% 9,96 2,7% 9,63 2,7% CEA/Cadarache JEF-2.2 10,27 2,5% 9,94 2,5% 9,61 2,5% FZK JEF-2.2 10 -0,2% 9,68 -0,2% 9,36 -0,1%

7
NRG JEF-2.2 10,13 1,1% 9,81 1,2% 9,49 1,3% JAERI JENDL-3.2 9,7 -3,2% 9,4 -3,0% 9,1 -2,9% IRPCP-Sosny ENDFB6 10,5 4,7% 10,17 4,9% 9,85 5,1% KTH JEF-2.2 10,31 2,9% 9,96 2,7% 9,59 2,3% KTH JENDL-3.2 10,02 0,0% 9,701 0,1% 9,38 0,1% KTH ENDFB6.5 10,137 1,1% 9,77 0,8% 9,4 0,3% KTH ENDFB6.5+DNS* 9,95 -0,7% 9,613 -0,8% 9,26 -1,2% KAERI ENDFB6 9,85 -1,7% 9,48 -2,2% 9,2 -1,8% CERN-corr. for k-eff JEF-2.2 9,898 -1,3% 9,564 -1,3% 9,23 -1,5% CERN-corr. for k-eff JENDL-3.2 9,618 -4,1% 9,294 -4,1% 8,97 -4,3% CERN-corr.for k-eff ENDFB6 9,598 -4,3% 9,274 -4,3% 8,95 -4,5% CERN –keff JAR 9,76 -2,6% 9,45 -2,5% 9,2 -1,8% E-AVERAGED 10,024 9,6947 9,3726
CERN calulation based on ks approach CERN JEF-2.2 9,77 9,42 9,07 CERN JENDL-3.2 9,49 9,15 8,81 CERN ENDFB6 9,47 9,13 8,79 CERN JAR 9,4 9,1 8,8 CERN JAR no n,xn 9,78 9,41 9,175
* DNS – denotes “Delayed Neutron Spectrum”, i.e. simulations using a real delayed neutron spectrum.
IV.B keff EVOLUTION (BURNUP) ANALYSIS, REACTIVITY BURNUP SWING
The keff evolution results are presented in
following series of Figures from IV.2 to IV.4. On Fig. IV.2 the variation of ks calculated by CERN-group has been also presented to show the striking difference between keff and ks formalism.
A KTH-MCB-JENDL curve (♦) on Fig. IV.2 starts at a somewhat higher initial value resulting in a very small “Protactinium dip”. Final values of keff are remarkably dispersed over a range
of over 3000 pcm from 0.928 (JAERI) to 0.96 (PSI-JEF2.2)
A keff evolution curve for the initial keff – Fig. IV.3 – shows similar pattern as Fig. IV.2. Again dispersion of the data for EoL is very large exceeding 4000 pcm. The curves are enclosed in between the highest values of ECN/NRG and lowest of IRPCP.
For the initial value of keff = 0.94 – Fig. IV.4 - dispersion of of data at EoL is even bigger exceeding 5000 pcm. The highest estimation is given by PSI-JEF2.2, the lowest by IRPCP.
233-U Enrichment - %
8
8,5
9
9,5
10
10,5
11
IPPE -
Diff
IPPE -
MC
PSI -
JEF
PSI _
JENDL
ENEA
CEA/Cad
arach
e FZK
NRGJA
ERI
IRPCP-S
osny
KTH - J
EF
KTH - J
ENDL
KTH - E
NDFB
KTH - E
NDFB+D
NSKA
ERI
CERN-JE
F
CERN-JE
NDL
CERN-EN
DFB
CERN -JA
R
233-
U %
_
k-eff=0.98k-eff=0.96k-eff=0.94
Figure IV.1. Results of 233U enrichment calculations for different benchmark participants.

8
A special attention has been focused on the discrepancies originated from different nuclear data libraries. The calculations performed by KTH with MCB-code using different nuclear data libraries:
JEF2.2, JENDL3.2 and ENDFB6 indicate that JENDL3.2 and ENDFB6.5 give virtually the same results for initial keff of 0.94 and 0.96. Unfortunately, for keff= 0.98 the reported simulation results for JENDL calculations are biased with too high initial values. However, it is not difficult to predict that renormalisation of this data will give the same pattern as two other cases. The JEF2.2 library gives for all three cases higher estimations of keff reaching at EoL a difference of 1000 pcm.
However, the differences in results for the different nuclear data libraries are smaller than discrepancies between different codes using the same data library. Looking carefully at the different codes using the same data (e.g. PSI – JENDL, JAERI – JENDL and KTH-JENDL) one can notice that discrepancies between the codes reach a value of about 2000 pcm at EoL, compared to about 1000 pcm for the discrepancy between JEF2.2 and JENDL3.2 for the MCB calculations.
Analysing the evolution curves (Figures IV.2 –
IV.4), one can conclude the following: a) Near beginning of life time interval (0÷150
days) one can see a large reactivity depression due to the "Protactinium effect" (Paeff). These values
)(
)()150(
BoLeffkBoLeffkdteffk
effPa−=
=
are decreasing when subcriticality level
decreases, from 1800 pcm (in average) at keff -BoL = 0.98 up to 1600 pcm at keff - BoL = 0.94 and are sensitive to Protactinium cross-section data (see PSI JEF versus JENDL calculations). KTH-JEF results show a different trend but it is most probably due to relatively large statistical uncertainties in Monte Carlo module in MCB-code. Runs with better statistics are necessary to explain this different behaviour. Discrepancies (%) between participants sometimes are rather large exceeding 500 pcm, see Fig. IV.5
b) On a large time interval evolution curves are not flat as it has been expected :
• for larger keff (~0.98), long burnup leads (in average) to essential decrease of reactivity,
• in vicinity of keff ~0.96 breeding of 233U breeding flattens the evolution curve but also leads to "humpbacked" type of evolution curve with some overshoots.
k-eff (t=0) ~ 0.96
0,9
0,91
0,92
0,93
0,94
0,95
0,96
0,97
0,98
0 150 300 450 600 750 900 1050 1200 1350 1500 1650 1800 1950 2100 2250Days
k-ef
f.
Figure IV.3. Evolution of keff in time for the intial keff
~0.96
Figure IV.2. Evolution of keff in time for an initial keff
~0.98. ks calculated by CERN group evolution is also included in this picture.
k-eff (t=0) ~ 0.98
0,92
0,93
0,94
0,95
0,96
0,97
0,98
0,99
0 150 300 450 600 750 900 1050 1200 1350 1500 1650 1800 1950 2100 2250Days
k-ef
fIPPE,diffusion
IRPCP,diffusion
PSI,JEF 2.2
PSI,JENDL 3.2
ENEA
FZK
JAERI
CEA-Cad.
KTH - MCBJEF
CERN - Ksrc
KTH - MCBJENDL
KTH - MCBENDFB
k-eff (t=0) ~ 0.94
0,9
0,91
0,92
0,93
0,94
0,95
0,96
0 150 300 450 600 750 900 1050 1200 1350 1500 1650 1800 1950 2100 2250Days
k-ef
f
Figure IV.4. Evolution of keff in time for an initial keff ~0.94.

9
• for smaller keff (~0.94), neutron balance enhancement is very visibile, however due to Protactinium effect, the keff evolution curve have significant overshoots exceeding the initial value of keff by over 1000 pcm. PSI results give the biggest overshoots, KTH-MCB curves give nice, flat curves; IRPCP results are most probably not correct giving a steep fall of keff with time
• the most favorable keff evolution can be anticipated to be for initial keff somewhere in between 0.94 and 0.95.
c) Dispersion on neutron balances on every time point is accumulating to the EoL, hence, one can see a large dispersion in keff at EoL between participants.
As a consequence of variable keff, external source intensity required to support the given power is also significantly varying with time.
A possible source of of discrepancies in keff-evolution could be fission yield models for 233U. In some codes these yields are not at all available for Th/233U systems, e.g. in standard ORIGEN application 239Pu yields are used for fast reactor calculations. This was pointed out the ECN Petten contribution (comparison of FISPACT and ORIGEN inventory codes).
IV.C EVOLUTION OF THE SPALLATION NEUTRON SOURCE INTENSITY.
Fig. IV.6 summarizes the results for a source intensity growth with time. Most of these growths factors are in the range of 2 to 3. An unusually high value for KTH-MCB, JENDL for keff=0.98 (Fig. IV.6) is a consequence of too high initial value of keff, as shown on Fig. IV.2.
It should be noted that required increase of the source intensity is larger for higher keff. It is a direct effect of a steeper decrease of keff with time for higher values of the initial keff – see Figs IV.2 –
IV.4. Breeding processes seem to work most effectively for the initial keff = 0.94. Fig. IV.7 shows an example of the spallation neutron intensity evolution in time for keff =0.94. The dispersion of the results at EoL is very large – as a simple consequence of the large discrepancies in the keff-evolution curves. The reasons for that should be investigated in details, 2000 pcm differences in keff
at EoL translates to variation of required accelerator power by the factor of 2.
IV.D SPALLATION NEUTRON SOURCE EFFECTIVENESS ϕ*
Effectiveness of the spallation neutrons is, as expected, rather high reaching a value 1.4 compared to fission neutrons. However, high effectiveness of spallation neutrons leads in most cases to high power densities around the spallation source and consequently to high power peaking factors. Fig. IV.8 shows the values of ϕ* at BoL as obtained by benchmark participants. The spallation neutron effectiveness at BoL for different keff shows 2 different patterns. Some results (IPEE, PSI, CEA) show decreasing spallation neutron effectiveness with decreasing keff , other – like KTH – a distinctly
Variation of the Spallation Neutron Source Intensity
0.00
1.00
2.00
3.00
4.00
5.00
6.00
IPPE, diffu
sion
IRPCP,
diffus
ion
PSI, JEF 2
.2
PSI, J
ENDL 3
.2 CEAEN
EA FZK
JAER
I
KTH-O
rigen
KTH-M
CB, JE
F
KTH-M
CB, JE
NDL
KTH-M
CB, EN
DFB CERN
Max
/Bo
L keff=0,98
keff=0,96
keff=0,94
Figure IV.6. Variation of the spallation neutron source intensity as a ratio of source intensity at t=1800 days to the intensity at BoL (Max/BoL).
Protactinium effect - k-eff=0,94; 0,96; 0,98
0
500
1000
1500
2000
2500
IPPE
IRPCP
PSI, J
EF
PSI, J
ENDL
CEAEN
EA FZK
JAER
I
KTH, O
RIGEN
KTH JE
F
KTH J
ENDL
NRJ, JE
F-2.2
KTH E
NDFB
k-eff=0,94k-eff=0,96k-eff=0,98
Figure IV.5 Protactinium effect for different initial keff values as obtained by the benchmark participants.
Figure IV.7 Evolution of the spallation neutron source intensity demand in time for the initial keff-value of 0.94.
k-eff (t=0) ~ 0.94
0
2
4
6
8
10
12
0 150 300 450 600 750 900 1050 1200 1350 1500 1650 1800 1950 2100 2250
Days
So
urc
e *
10E
+18
(n/s
)
IPPE, diffusion
IRPCP, diffusion
PSI, JEF 2.2
PSI,JENDL 3.2
ENEA
JAERI
CEA-Cadarache
KTH -ORIGENENDFB/JEFKTH-MCB,JEF
KTH - MCBJENDL
KTH - MCBENDFB

10
opposite pattern, i.e. spallation neutron effectiveness is bigger for lower keff. ENEA and IRPCP got the same values for all keff. Intuitively, one could expect that spallation neutron effectiveness in the ADS like in this benchmark should be higher for lower keff.
Taking into account importance of the source neutrons for ADS economy this parameter will be definitely investigated in depth in many other studies.
In Fig. IV.9 one can see a remarkable
depression of the spallation effectiveness with burnup (independently on keff at BoL). This is one of important (besides keff) factors leading to increase of proton current towards EoL. Figure IV.9 shows also that the general pattern of the evolution of spallation neutron effectiveness does not depend strongly on the simulation method, neither nuclear data library. Results of IPPE, ENEA and KTH are very similar in spite of some fluctuations on KTH data resulting from statistical uncertainties.
IV.E VOID EFFECTS
As have been indicated, void power effect for subcritical system can be presented in the form of (11), where the void reactivity effkeffkδ and the
void-external source importance effects ∗∗ ϕδϕ play the most important role.
In the Benchmark, one could not assess void power effect - there is no information about the
δϕ ϕ∗ ∗ component yet. The void-reactivity effect has been assessed as
the following :
effeff kkδ ={keff (BoL,void)- keff (BoL)}/keff (BoL)
Results of the void effect calculations are presented on Fig. IV.10 showed the following :
1. The void reactivity effect in the central core
zone is positive (in average) and changes its sign (becoming negative) for full core.
2. The void effects and their components are weakly sensitive to keff value.
3. The most important components of the void effect are neutron leakage and neutron absorption plus scattering - a competition between them (due to different signs) defines its principal value.
4. Discrepancies of the results are large, particularly for the total voiding of regions 1 and 2. Moreover, deviating results of JAERI
Spallation neutron effectiveness
00,20,40,60,8
11,21,41,6
IPPE
PSI - JE
F-2.2
PSI -
JENDL-3
.2EN
EA
CEA-Cad
.
IRPCP
KTH - J
EF2.2
KTH - J
ENDL3
.2
KTH - E
NDFB6.5 NRJ
k-eff = 0.98keff= 0.96keff= 0.94
Figure IV.8. Spallation neutron effectiveness at BoL as obtained by the benchmark participants.
Effectiveness of spallation neutrons
1
1,1
1,2
1,3
1,4
0 150 300 900 1200 1500 1800 2100Days
Neu
tro
n e
ffec
tive
nes
s m
m
IPPE
ENEA
KTH-MCB
Figure IV.9. Effectiveness of the spallation neutron source as a function of burnup. IPPE, ENEA and KTH-JEF results for keff at BoL = 0.98
Figure IV.10. Voiding effects for different initial keff
as obtained by the benchmark participants. Upper part of the picture – voiding effect of the region 1, lower part – total effect of voiding regions 1 and 2.
Voiding effects - Region 1
0
500
1000
1500
2000
2500
3000
3500
4000
IPPE (
MC)
IPPE (diff.
app.)
PSI - JE
F-2.2
PSI - JE
NDL-3.2
ENEA
CEA-C
ad.
FZK
NRJ
IRPC P(MC)
KTH
JAERI
KAER
I
Rea
ctiv
ity c
hang
e - p
cm
....
keff=0,98
keff=0,96
keff=0,94
Voiding effects - Region 1+2
-1200
-1000
-800
-600
-400
-200
0
200
400
600
800
1000
1200
Rae
ctiv
ity c
hang
e - p
cm .
.....

11
indicate some major errors in the calculation or methodology.
IV.F SPATIAL DISTRIBUTIONS OF POWER DENSITY AT BoL
Spatial distributions of power show a large
deviation from "cos" or "Bessel" type distributions in a critical system due to the subcriticality and the presence in ADS of an intense external neutron source.
IV.F.1 RADIAL DISTRIBUTIONS
Example of the results of the radial core power
distribution is presented on Fig. IV.11. Somewhat lower values for KTH-MCB-JEF data result from a strict normalization to the total energy deposition in ADS, including decay heating.
Power density is very much peaked in the vicinity of the spallation target and it flattens with increasing keff as depicted on Fig. IV.12. Strong peaking of the power density around the spallation target is a real challenge for ADS and will require some novel engineering solutions.
IV.F.2 AXIAL DISTRIBUTIONS
Figures IV.13 shows an example of an axial
power distribution for r=42.5 of the ADS-core for keff of 0.94. Again somewhat lower values for KTH-MCB-JEF data result from a strict normalization to the total energy deposition in ADS, including decay heating.
All results show similar shape, dispersion is most probably due to differencies in treating decay heat process. Special attention should be put on comparison of KTH results: KTH to JEF/ENDFB
and KTH-MCB-JEF. KTH-JEF/ENDFB in difference KTH-MCB-JEF had no strict treatment of gamma heating. For r=42.5, in the region where fission heating dominates two curves almost overlap. For larger r where gamma heating begin to play a significant role those 2 curves are shifted.
It is also worth to observe a very good agreement between FZK and KTH-MCB results for most of the cases.
IV.G. SPECTRAL INDEX : 232TH / 233U FISSIONS
Spectral indices distributions (see example on
Fig. IV.14) show an essential change of neutron spectrum character :
• In the target area, where (due to spallation source) spectrum is very hard,
• In the region around target, where spectrum is changing rapidly.
The most important discrepancy of results occurs in the spallation source area. Most of the results nicely overlap, except for the values close to r=0 where discrepancies reach about 20%.
Figure IV.11. Radial power distribution for the initial keff of 0.94 obtained by benchmark participants.
k-eff (t=0) ~ 0.94
50
150
250
350
450
550
650
0 10 20 30 40 50 60 70 80 90 100 110 120 130 140 150Z, cm
W/c
m^3
IPPE - diff.
FZK
KTH
NRG
KTH-MCB-JEF
Figure IV.13. Axial power distribution for the initial ADS-core at keff=0.94 at r=42.5 as obtained by the benchmark participants.
R=42.5 cm, k-eff (t=0) ~ 0.94
200
225
250
275
300
325
350
375
400
425
450
475
0 10 20 30 40 50 60 70 80Z, cm
W/c
m^3
IPPE - diff.
FZK
NRG
KTH-JEF/ENDFBKTH-MCB-JEF
Figure IV.12. Comparison of radial core power distribution for different keff values. Results of KTH-MCB-JEF simulations.
Specific radial core powerdistribution,
for k-eff (t=0)~ 0.94, 0.96, 0.98
50
100
150
200
250
300
350
400
450
500
0 10 20 30 40 50 60 70 80 90 100 110 120 130 140 150Z, cm
W/c
m^3
k-eff=0.98
k-eff=0.96
k-eff=0.94

12
IV.H RADIOACTIVITY OF THE IRRADIATED FUEL
Activity of irradiated fuel depends very weakly
on the subcriticality of ADS. The dispersion of calculated radioactivity of irradiated fuel as presented on Fig. IV.15 is acceptable except for JAERI’s results for 100 years. The biggest deviations from averaged values are observed for the short time interval after irradiation, where the impact of fission products is very significant. The treatment of the fission products for many codes is still very robust and not precise. Long-term radiation, originated from transuranic elements is simulated without bigger discrepancies by most of the codes.
Radioactivity/radiotoxicity of the irradiated fuel at equilibrium could be an attractive characteristic of the Thorium fuel cycle in ADS compared to the U/Pu fuel cycle.
V. CONCLUSIONS
Neutronics of the Energy Amplifier like ADS
with the Th/233U fuel cycle has been studied internationally in the frame of the IAEA Coordinated Research Project.
The principal integral parameters have been studied in two ways :
• by calculation of the standard keff for ADS blanket, and
• by calculation of the source neutron multiplication factor ks.
These two procedures based on parametric studies of keff or ks are adequat, however, the first one has been chosen by majority of participants taking into account traditional terminology and the experience in nuclear critical reactors.
Common conclusions can be drawn from the results concerning some principal neutronic features of this ADS:
• keff evolution with time (or burnup) and consequently the intensity of spallation neutron source depend strongly on the initial subcriticality level (keff at BoL),
• 233Pa build-up effects strongly reactivity of the system (up to 1800 pcm) within 0÷300 day interval after start. Then a reactivity swing occurring at the time interval between 900-110 days can exceed initial keff .
• variation of the proton current during fuel burnup may be as high as over 3 times due to keff changes and due to a change in the effectiveness of spallation neutrons. Lower keff can significantly mitigate this disadvantage.
• a low level of Minor Actinides accumulation has been observed in this ADS,
• long-term radioactivity of the spent fuel is lower than for U/Pu fuel cycle,
• results for the spatial power distribution do not show any significant discrepancies. This is rather determined by the presence of the point-like external neutron source.
Essential discrepancies were found in: • long term keff evolution curves towards to
EoL. This is a sign of a significant deficiency in some codes simulating burnup processes and accumulation of the errors in fission product treatment
• 233Pa effect values (up to 120%), mostly, due to differences in the neutron cross-section libraries.
• void reactivity effects, differences in the neutron library data for Pb, particularly the inelastic scattering cross section in the 1 MeV region are most probably responsible for this effect
• spectral indices distribution and effectiveness of spallation neutrons at BoL due to a hard neutron spectrum in target area, and the mentioned above differences in Pb neutron data
Results of the benchmark stage 2 and 3 covering
an assessment of the neutronic potential of a modular fast spectrum ADS for radiotoxic waste
Figure IV.14. Radial core distribution of the spectral indices at z=0 for the initial keff=0.98.
Radial core distributionof the spectral index
(232Th/233U fissions),Z=0 cm, k-eff (t=0) ~ 0.98
0
1
2
3
4
5
6
7
8
0 20 40 60 80 100 120 140 160 180R, cm
Sp
ectr
al In
dex
, (*E
-3)
IPPE-diff.
PSI - JEF 2.2
PSI-JENDL3.2FZK
IRPCP- MC
KTH-JEF/ENDFBNRG
Figure IV.15. Radioactivity(Bq/g of HM) of irradiated fuel as a function of cooling time. The initial keff = 0.98.
1,00E+06
1,00E+07
1,00E+08
1,00E+09
1,00E+10
100 1000 10000 100000 1000000Cooling time (years)
Rad
ioac
tivi
ty (
Bq
/g)_
__
IPPEPSI-JEF-2.2PSI-JENDL-3.2CEAENEAJAERIAveraged value

13
transmutation including some fission products transmutation and simulation of the existing experimental subcritical facility are to be reported separately [8].
REFERENCES
[1] C. Rubbia et al, “Conceptual Design of a
Fast Neutron Operated High Power Energy Amplifier”, CERN Divisional Report CERN/AT/95-44 (ET), 29th September 1995. See also C. Rubbia, “A High Gain Energy Amplifier Operated with Fast Neutrons”, AIP Conference Proceedings 346, International Conference on Accelerator-Driven Transmutation Technologies and Applications, Las Vegas, July 1994.
[2] L. S. WATERS, “MCNPXTM User´s Manual – Version 2.1.5,” Los Alamos National Laboratory, November 14, (1999). See also http://mcnpx.lanl.gov
[3] J. F. Briesmeister, Editor: „MCNP –A General Monte Carlo Code N-Particle Transport Code”, LANL report LA-12625-M, Version 4B (March 1997)
[4] M.J. Bell, ORIGEN- The ORNL Isotope Generation and Depletion Code, ORNL-4628 UC-32, 1973; G. Croff: “A User’s Manual for the ORIGEN2 Computer Code”, ORNL /TM-7157 (Oct. 1980)
[5] R.E. Alcouffe, F.W. Brinkley, D.R. Marr, R.D. O'Dell, Users Guide for TWODANT: A Code-Package for Two-Dimensional, Diffusion-Accelerated, Neutral Particle Transport, LA-10049-M, Rev. 1, Manual, October 1984, Revised February 1990.
[6] J. Cetnar: "A Method of Transmutation Trajectories Analysis in Accelerator Driven System" Proc. IAEA Technical Committee Meeting on Feasibility and Motivation for Hybrid Concepts for Nuclear Energy Generation and Transmutation, Madrid, 17-19 Sept. 1997.
[7] F. Carminati and Y. Kadi, CERN/ET/ Internal Note 98-005.
[8] W. Gudowski et al. IAEA ADS Benchamark – Stages 2 and 3” in preparation.

APPENDIX XII
Jerzy Cetnar*, W. Gudowski and J. Wallenius , “User Manual for Monte-Carlo Continuous Energy Burnup (MCB) Code –Version 1C”, KTH, Stockholm 2001.

1
User Manual for Monte-Carlo Continuous Energy
Burnup (MCB) Code –Version 1C
Jerzy Cetnar*, W. Gudowski and J. Wallenius
Department of Nuclear and Reactor Physics, Royal Institute of Technology, 100 44 Stockholm, Sweden
email: [email protected]
*on leave from: Faculty of Physics and Nuclear Techniques, University of Mining and Metallurgy, 30 059 Cracow, Poland
email: [email protected] 1. Introduction MCB is a Monte Carlo Continuous Energy Burnup Code for a general-purpose use to calculate
a nuclide density time evolution with burnup or decay. It includes eigenvalue calculations of critical and subcritical systems as well as neutron transport calculations in fixed source mode or k-code mode to obtain reaction rates and energy deposition that are necessary for burnup calculations. The code integrates well-known code MCNP, version 4C [1], which is used for neutron transport calculation, and a novel Transmutation Trajectory Analysis code (TTA) [2], which serves for density evolution calculation, including formation and analysis of the transmutation chain. MCB is compatible with MCNP and preserves the structure of it. Complete burnup calculations can be done in a one single run and it requires preparation of only one input file by a modest modification of an MCNP input file. The code was extensively tested in benchmark calculations and reactor core designing. The general conclusion from practical application shows that MCB1C produces valuable results that are physically inherent and the correctness of physical model applied has been proved. MCB1C has been also equipped with new features among them the simulation of material processing including continuous feeding of materials is the most important. Development of the code was addressed towards improving calculation effectiveness and system diagnostic and towards improving physical model for rigid treatment but also providing simplified model option for quick design studies or benchmarks.

2
2. Features of MCB
The main goal of a burnup code is to calculate material density evolution function. In a real system under irradiation or decay the nuclide composition undergo evolution that generally can be describe with a continuous function of time. The way of obtaining its approximation by MCB throughout time step procedure starts from assessing reaction and decay probabilities of every possible channel by means of stationary neutron transport calculations. In the next step the transmutation chain is formed and solved to produce nuclide density table in required time points. Since the varied material composition changes the reaction probabilities they should be recalculated. This way the time step process is formed where the neutron transport calculations are performed in discrete time points while obtained reaction probabilities are assumed constant until new recalculation is accomplished. In MCB the time of reaction probability recalculation can be specified by the user or set by the program itself if user activated self-adjusting time step procedure.
2.1. Neutron Transport Calculations MCB1C is using MCNP4C subroutines for neutron transport calculations and evaluation of all
necessary physical quantities required for burnup calculations. It adopts the cross section tables in continuous energy approach. Reaction rates, that are required for transmutation chain formation are calculated exclusively by continuous energy method applying the point-wise transport cross-section libraries and, in case of lack of proper library, by using dosimetry cross section library. The contributions to reaction rates are being scored at every instant of neutron collision occurring in cells filled with burnable material by using the track length estimator of neutron flux.
Numerous cross-section libraries and data sets are automatically loaded into computer memory in order to calculate adequately reaction rates and nuclide formation probabilities. It includes the possibility of using temperature dependent cross section tables for different burnable zones, to account for thermal effects, application of energy dependent distribution of fission product formation, and energy dependent formation of isomer nuclides. The user specifies the libraries explicitly or by using the default library option scheme similar to the one used in MCNP (NLIB entry on M card).
The physical model puts no limitation on the geometry and the volume division into cells or material assignment. Those limits however can be imposed by the computer memory or speed. The transport calculations are invoked in MCB many times in one of the multiple calculation modes. If k-code mode is activated, that is recommended in systems with fissionable materials, every step starts from evaluating the system criticality followed by the transport calculations for reaction rates evaluations. Reaction rates can be calculated either in external fixed source mode (in output files referred to as transport) or in fission source mode (in output files referred to as k-code).
Since the reaction rate calculations consume the most of computer time, a quick trial transport run can be performed with a limited statistics. At the beginning of life or after material processing, MCB invokes emerging nuclide list formation run to set up the list of nuclides that can emerge from the initial composition due to burnup. In this run no reaction rates are scored, which would be time consuming, but only the neutron flux, so it is fast. The reaction rates are then calculated from the obtained neutron flux and are applied in formation of emerging nuclide list throughout the transmutation calculation procedure. This list is used latter in so-called “sound runs”, with full coverage of reaction rates and heating calculations limited however only to the existing or emerging nuclides. The list is also updated at every sound step.

3
The other cases of short runs with lower statistics, concern the self-adjusting step procedure where the calculation at time that was selected by the code itself to roughly evaluate variation of energy deposition or criticality.
2.2. Normalization and Transmutation Chain Formation
After completing the sound run with assessed reaction rates and radiation energy deposition, the
system need to be normalized in order to calculate the absolute probabilities of nuclear reactions and decay and to form nuclide transmutation chains. The system normalization can be made to the external neutron source intensity when the heating has no influence on the neutron source, or to the thermal power when one simulates a system with a limitation of the total power.
Heating is calculated automatically on a similar way as the reaction rates during neutron transport simulation by using heating cross sections, i.e. KERMA factors included in the standard cross section tables. In order to account for gamma heating the heating data in cross section libraries should be processed with an option for local deposition of gamma heating being added to neutron heating. In that way the gamma heating from gamma radiation induced by neutron capture or scattering is already incorporated into the cross section data for neutrons. The cross section libraries processed for MCB have this feature. In case of using cross sections without heating data the user should specified the power without the unaccounted gamma heating. MCB does not implement gamma heating that could be produced in photon transport and if invoked they are not taken to the normalization. The user can also use an option to calculate heating from recoverable energy of fission. This data is by default loaded with transport cross sections. The code calculates automatically the heating from natural decay of nuclides, what allows for consideration of afterheat effects. The energy of decay is taken from the ORIGEN library.
The decay schemes off all possible nuclides and their isomeric states are formed and analyzed on the basis of decay data taken from two sources. The first one – TOI.LIB is prepared on the basis of Table of Isotopes and describes decay schemes for over 2400 nuclides. The second one - XS.LIB is a decay data file used for ORIGEN code system and it supports energy-integrated ratios of nuclide formation in excited states.
Formation of excited state nuclides due to process of the neutron capture or (n,2n) reactions is calculated from energy dependent isomer formation ratios supplied by file ISB.LIB, or, in case of lacking data in this library, by using the integral isomer formation ratios taken from the ORIGEN library - XS.LIB file.
Fission product yield is calculated from incident energy dependent distributions of fission products prepared separately for every fissionable nuclide, which are loaded from the FY.LIB file. Since consideration of production and time evolution of fission products is computer time consuming this option can be disabled by the user or simplified treatment with lump fission product assisted by important neutron absorbers can be used instead.
Nuclide decay and transition through a reaction channel are also analyzed for emitted particles, which are scored and appended to the transmutation chain.
For the purpose of output file clarity the nuclides are divided into few groups depending on their decay half-life versus the fast decay threshold the THFM parameter set by the user. The nuclides that fall into fast decaying group are treated in a simplified manner; they are assumed to decay on prompt of their appearance. However, nuclides having transport cross-sections or explicitly specified on the MR card are treated in a full extend. The calculated system activity or decay heat depositions account for appearance of short-lived nuclides in the system. However, if the user

4
chooses the fast decay threshold high it results in biasing of density evolution of some nuclides for which the calculated evolution is faster than the real one. Having calculated one step transition probabilities the code forms on-line the transmutation chain that is time step and material dependent. The process of chain formation is performed along with its resolution according to general solution of Bateman equations. The transmutation chain is expanded into a series of transmutation trajectories during the trajectory analysis process. Every transmutation trajectory contributes to the destination nuclide density at the end of time step with the value equals the product of starting nuclide density at beginning of time step and the transmutation transition probability. The trajectory extension process is truncated when the transmutation transition probability of any extended trajectory drops below cutoff level – the CMIN parameter.
2.3. Calculation of Bateman Equations Time evolution of nuclide densities is calculated with the complete set of linear transmutation
chains that are prepared for every zone and time step, being automatically adjusted to time evolving transmutation conditions. The code uses an extended linear chain method, which is based on the Bateman approach, to solve prepared-on-line, set of linear chains that noticeably contribute to nuclide formation. Program calculates transmutation transitions from nuclide to nuclide and prints them out to the bmes file. Transmutation chains that are formed by the code can be also printed out for the nuclides of interest. The series of transmutation trajectories is constructed in the following way. The first trajectory consists of only one nuclide and represents simply the survival of the initial nuclide. In the second step, the second generation of trajectories is formed. Those trajectories are extensions of the first trajectory created by the transmutation to one of the daughters of the initial nuclide. During the trajectory formation process, the contribution to the destination nuclide (transmutation transition) is calculated as well as the passage through the trajectory (trajectory passage). The meaning of the trajectory passage is the sum of transmutation transitions from initial nuclide along all trajectories that would emerge as an extension of the considered trajectory to all other nuclides lying beyond the considered trajectory. The value of trajectory passage is used to truncate the trajectory extension process if it drops below a minimum level of concentration that would be worth attention according to the user-defined the CMIN parameter. Since the physical sense of the trajectory passage is the accumulated contribution to the concentration of other nuclides that emerge as products of the trajectory destination nuclide, it can stand for the chain truncation error of contribution calculations. The process of trajectory formation ends when all possible trajectory extensions are done. As a result, the set of trajectories that represents the initial nonlinear transmutation chain is obtained. Each trajectory is flagged by its parent trajectory identification that can be used to skip it in case of insignificance. The transmutations obviously change the nuclide concentrations, which after some time can induce changes in the flux as well as in the transmutation rates. Particularly, the nuclides that were absent in the irradiated material at the beginning of irradiation, but emerged as a result of transmutations, may not only decay but also can be transmuted due to the irradiation. Therefore, transmutation rates of newly created nuclides are also calculated starting from their reaction rate calculations regardless if material is specified in the input or not.
2.4. Time Step Procedure

5
• The code can be used for simulation of subcritical systems with fixed external source of neutrons and for critical systems for which the neutron eigenflux is used for normalization. Pure decay mode is also available. The system normalization can be set in user defined time periods by specification of the external neutron source strength or the system total thermal power. The periods of irradiation can be mixed with the cooling periods with possible material processing at any desired time point. Possible material processing includes removal or admixture of the nuclides as well the shifting of materials from cell to cell as well continuous supply of material to the system.
• Self-adjusting step routine becomes active when the user defines allowed variation of k-eff or heating. The code controls the calculation mode, by setting the external source mode or the fission source mode (k-code), upon the current value of k-eff reaches the value specified with the VKSW parameter.
2.5. Evaluations of Physical Quantities and System Parameters • Radiotoxicity of material is calculated as the dose potentially taken by human population in
case of ingestion on the basis of committed dose per intake tables, according to regulation by EURATOM Directive. The program then lists the most dangerous nuclides along with their radiotoxicity.
• The program calculates neutron multiplication and neutron multiplication factors both in the fixed external source calculations and in criticality calculations with a fission source. Obtained values are then used to calculate the neutron source importance defined in two ways. The first one is the importance for generating the fission reactions, i.e. for fission heating generation. The second is the importance for neutron multiplication that includes non-fission multiplicative reactions. Time evolution of those parameters is printed out together with a neutron source strength, energy deposition per source neutron, potential dose and material activity.
2.6. Cross Section Libraries and Data Files In order to provide accurate transmutation calculations the code requires data files, which allow
for complete simulation of neutron transport and nuclide formation. The bulk of data consists of numerous cross-section libraries for calculation of reaction rates and transport cross-section library. The scope of neutron libraries distributed with MCNP package is limited and lacks data for many nuclides, so it is recommended to use an enlarge set of cross sections. Other problems considers number of available reactions. Since the standard cross-section library for neutron transport contains limited reaction list, it is recommended to supplement the dosimetry library for to complete the reaction list. The code is designed to use simultaneously transport and dosimetry cross section tables for every specified material. The standard xsdir file is used. The code was successfully tested with continuous energy cross section libraries for transport and reaction rates prepared for various material temperatures on the basis of: JEF2.2 JENDL3.2, ENDF-B/VI-8 and EAF99 files [3].
Second part of data files concerns a nuclide formation process and radioactive nuclide properties. The decay schemes of over 2400 nuclides, including metastable nuclides, were prepared on the basis "The Table of Isotopes 8E" [4] while the dose data of 738 nuclides were prepared on the basis of Euratom Council Directive 96/29/EURATOM [5]. The library file toi.lib

6
contains the data describing decay constants with branching ratios, and the values of committed effective dose per unit intake.
Since isomer formation processes are not adequately treated neither in existing libraries of MCNP, nor in “Table of Isotopes”, data from other sources has been applied . The one-group cross-section library of ORIGEN [6] serves for calculation of isomer formation ratio due to decay, reaction (n,2n) or neutron capture. This library is supplied as the xs.lib file.
Since the ORIGEN file supports only average energy data, for some important energy-dependent isomer formation ratios have been prepared as ISB.LIB file. Currently available file contains formation ratios of 242mAm and 244mAm based on the Mann & Schenter model [7].
Incident energy and nuclide dependent fission product yields have been prepared based on the Wahl model [8] and are supplied as the fy.lib file, containing fission product yields functions for 36 heavy nuclides.

7
3. Transmutation System Definition.
The MCB code can work as a standard MCNP unless burnup option is switched on. The BURN card that contains the list of burnable material activates burnup calculation mode. In this mode the code takes control over user specification of the transmutation conditions and gives warning messages in a case of user errors in the specification input. Obviously program does not perform full checkup of physical consistency of the system definition but checks consistency with program requirements to complete calculations. Without BURN card the MCNP mode is used while all other burnup control cards are ignored but the new option of material definition remains valid. The user can use this feature in case of errors to determine if problems occur in system definition for MCNP or in burnup specification. In order to properly set up a simulation run the user needs to introduce following burnup specifications:
• burnable material, • libraries required for reaction rates calculations, • duration of transmutation time periods, • system normalization with external neutron source strength or thermal power, In addition to above the user can specify values of control parameters which otherwise would
have default values. Table 1 shows available control parameters with their default values and the control card to specify in.
3.1. Material and Library Definition.
MCB requires a large number of material specifications. This implies a necessity of somewhat
simplified material specifications in order to avoid unnecessary data processing. Since a calculation process is complex the material and libraries should be differentiated compared to MCNP-input standards. Different treatment is required for abundant materials that influence the neutron transport process and for low abundant materials negligible from the neutron transport point of view. Moreover, in transmutation processes some nuclides may disappear while others emerge. Therefore a burnup mode requires that libraries for all possibly emerging nuclides must be specified. The material and library definition can be setup for such cases using an extended material definition option. MCB, offers a combination of M, MB, MR, and MIX cards.
Following three categories of material are defined: i) Transport material - is used in particle transport simulations and also in remaining
calculations. It is specified on M card and obviously has its density and assigned library. ii) Burnup material - is not used in transport calculation unless its density do not accumulate
to a certain level, when its contribution to the total cross section of the cell materials achieves the discrimination level - TRNDCR specified on the DISCR card. In such a case the material is ranked-up to the transport material. It is specified on the MB card and assigned library is used for calculations of reaction rates.
iii) Residual material - has no defined density and is used only for transmutation transition calculations, so it cannot be depleted due to burnup. It does not contribute neither to the buildup of other nuclides unless it has accumulated as a daughter nuclide due to the burnup of other materials. Residual material can be used also for specification of cross-section library for zones when the nuclide is absent at BoL. It is specified on the MR card and no density is required nor allowed.

8
Table 1. Main control parameters of MCB Parameter Default
value Card Short description
THFM 104 [s] BATCT Decay half life threshold for fast decay treatment CMIN 10-10 BATCT Discrimination level of nuclide-to-nuclide transmutation
transition VKSW 1.0 BATCT Value of k-eff above which k-code is used to calculate
reaction rates VKLIM 2.0 BATCT Value of k-eff that terminates the calculations FHEAT OFF BATCT Switch to calculate heating only from fission BURHT OFF BATCT Switch to calculate heating only in burnable zones TRNDCR 0.0 DISCR Contribution discrimination level for collision simulation in
neutron transport calculations. By default all nuclides having transport cross sections are included
CPRCUT 10-6 DISCR Discrimination level for nuclide density printout DPRCUT 10-3 DISCR Discrimination level for dose printout VART 1.0 [year] STPCT Longest allowed irradiation time step (does not concern
decay periods). VARK 0.0 (OFF) STPCT If greater than zero - allowed variation of k-eff during one
time step VARH 0.0 (OFF) STPCT If greater than zero - allowed variation of energy deposition
per source neutron during one time step The mixing of several materials defined by cards M, MB or MR can be done with a new card
MIX. The MIX material number is the actual material number of the compound material and it should be placed in the respective cell cards. The mixing option can simplify system definition also for MCNP since any material can be made of its component material, and not only directly of nuclides.
The MIX card can be used also for cross-section library hierarchy definition. This option was prepared for cases when cross-section libraries of nuclides used in the system has different id numbers and it would be time consuming to specify them all directly. In such a case the user should specify library id-s with NLIB keyword on M, MB or MR cards and use material-mixing option. MR cards with no material but with NLIB specification are allowed for such purpose. The material numbers from constituting M, MB or MR cards with specified NLIB entries should be specified in required order of importance in the MIX card. Hierarchy list work in a natural way that the cross section table with highest position in the list will be loaded. The lack of the library hierarchy list, results in loading only those cross-section libraries that are, directly or by default, specified for neutron transport calculations. It means that nuclides, which are absent at BoL will have no cross section loaded, but they can emerge as transmutation products what can result in a bogus transmutation system definition.
Appropriate system definition requires that for every burnable material the library hierarchy list should be formed having at least one NLIB specification. There are possible cases when the user does not accept some nuclide cross-section and needs to replace this by other library cross section. In such a case the required nuclide library should be specify directly in on of material card
9
compounding burnable material. It will replace the default specified by NLIB for only this case while cross sections for other nuclides will be loaded with id specified by NLIB.
The library hierarchy list is also required when the user needs to use both transport library and dosimetry library for to support full available list of reaction. Since one nuclide cannot appear twice in the material list it is only way to use one MR card with NLIB specification of dosimetry library and admix it with MIX card to the transport library.
Other problem appears with metastable nuclides since in case of MCNP libraries, there is no distinction between isomers. A new standard of ZAID definition was introduced to solve the problem. When a ZAID number represents a mass number greater than 300 it is treated as isomer excited state of nuclide. The ZAID-s of this form are introduced in MCB cross section libraries distributed with the code should be made at the cross section preparation process and the XSDIR file should contain it. However the cross section libraries distributed with MCNP code in some cases do not distinguished a ground state nuclide from its metastable isomer. For example AM242m is presented like a ground state nuclide what would imply its treatment as a ground state isomer while the actual metastable one would not be represented at all. For such cases the user can use a special GTMET card assigning the loaded cross section tables to the both required isomers unless recognition of the library for metastable isomer is possible. In order to simplify material recognition the user can also use substitutes of ZAID by replacing ZA with nuclide or element chemical symbols. Currently, the substitutes of following forms are acceptable:
• Pu239.55c for 94239.55c • Pb.55c for 82000.55c • U235 for 92235 • Pb for 82000 • Am242m for 95339 • FP for 50120.35c
The last symbol can be used for lump fission products by default assigned to shown ZAID. The LMPFP card can overwrite default ZAID assignment of lump fission products.
3.2. Neutron Source Specification Since MCB performs calculation in fixed source mode or in k-code mode (with fission source)
with one load of input file, the user needs to support neutron source specification for both cases. Comparing to pure MCNP some source definitions are not allowed while new combinations are possible:
• The KSRC card is not allowed. • If SDEF is specified, it is used both for transport in fixed source mode and k-code, unless
the SRCTP card is used. • When both SDEF and SRCTP cards are specified then k-code uses the SRCTP file
prepared earlier while the code in fixed source mode uses SDEF specification. • Usage of RSSA in fixed source mode implies usage of SRCTP for k-code. In such a case
the SRCTP card is not required. • The KCODE card is allowed with the NPS card. • The CTME card is allowed with the NPS card. Termination occurs when one condition is
satisfied.

10
3.3. Mode of Calculations Burnup calculations can be done either in k-code mode or in fixed source mode. This means
that reaction rates are calculated in one of the modes. Also it is possible that system switches between two modes depending on current value of k-eff. In both cases if user whishes to control level of k-eff the k-code mode must be used for this purpose. To invoke k-code calculation the user must use the KCODE card. There are few possibilities:
• Lack of the KCODE card will result in omitting k-eff evaluation and program will make
burnup only in fixed source mode and can accomplish calculations providing system remains subcritical.
• If the user requires using only k-code then VKSW should be set to 0.0. In such a case the system will never switch to the fixed source mode thus the POWER card must be used to enable neutron flux normalization to the thermal power.
• If VKSW is set grater than zero, the program itself will select the mode of burnup calculations. If k-eff exceeds VKSW then k-code mode is used, otherwise – fixed source mode.
• For periods with thermal power and source strength set to zero the burnup is calculated as a natural decay and no reaction rates are need to be calculated.
3.4. Period Specification and System Normalization The user specifies periods of constant physical conditions by using the PRIOD card. Duration of
periods limit the time steps so in cases when physical conditions are not changed but we prefer to fix time steps the periods can be used to specify time steps. Upper limit for time step duration is set in the VART parameter. VARK and VARH should be set to their default values in case of fixed time steps. Otherwise time step self-adjusting procedure will be invoked.
System normalization (i.e. normalization of the neutron flux) can be done by the POWER card setting system thermal power or by the SRCST card that contains external source strength. When both the POWER and SRCST cards are used then the specified values are treated as limits to the system parameters. The actual source strength will be lowered if actual power exceeds the limit or the actual power will be lowered to correspond to the limit of the source strength. If the both parameters, POWER and SRCST, are set to 0, decay calculations are invoked. If the POWER card is used alone the source strength will be adjusted to the level at which the system releases required power. The number of entries on the POWER and SRCTP cards should not exceed number of periods. The last entry fills up the remaining part of the table.

11
4. User Input Specification Input data for burnup are handled by the same routines, which MCNP uses for the problem
setup, although the new data and tables used in burnup calculations are stored in a separate common block. They are shared among the subroutines by the same technique as MCNP does - dynamically allocated storage. Cards described below are optional and they can be used according to users needs, otherwise defaults are used.
4.1. Material Cards
Complete definition of a material can be done using the same number for the M, MB and MR cards or using different numbers for those cards and then mixing them with the MIX card with a new and final material number. The user should pay attention to density treatment by MCNP that are specified on cell cards. This density concerns only materials used in transport calculations (the M card only). Therefore in option without mixing, pseudo-fractions on the MB card must be used defined as ratio of a burnable nuclide concentration to the sum of transportable nuclides concentrations. In case of mixing normalization as described below is applied.
i) Burnup material card Syntax:
MB{n} [NLIB = {id}] {ZAID_1} {fraction_1} [{ZAID_2} {fraction_2}...] where:
{n} material number for which definition will be applied {id} cross section library identifier {ZAID_I} nuclide name as ZAID or chemical symbol {fraction_I} nuclide’s pseudo-fraction in material composition
ii) Residual material card Syntax:
MR{n} [NLIB = {id}] {ZAID_1} [{ZAID_2}...] where:
{n} material number for which definition will be applied {id} cross section library identifier {ZAID_I} nuclide name as ZAID or chemical symbol
Notice that MR card does not contain fractions, and it can consist only from library definition. iii) Material mixing card Syntax:
MIX{n} {n1} {c1} [{n2} {c2} …]

12
where:
{n} is the defined material number that can be used either in the cell card or in the specification field of the MIX card. All material cards including the M card of MCNP must use different numbers for material definition.
{nI} material number defined earlier in one of the material cards: M, MB, or MR. {cI} relative contribution of material {n1} to the new material {n}.
The material mixing procedure requires consistency of fraction definition concerning mass
fraction or atomic fraction. Fraction normalization is done for mixed material and not for its components. At the beginning, fraction of each nuclide is calculated as a product of respective component fraction ({fraction} on M or MB) and its contribution ({cI} on MIX) integrated over all components. In the next step all nuclide fractions are normalized using the sum of transportable nuclides (specified on the M cards). After normalization the sum of transportable nuclides fractions equals one while sum of all fractions becomes larger than one by the fraction of nuclides defined on the MB cards. The nuclide density then is obtained by multiplying the fraction by material density entered on the cell card (that respects only transportable materials). It is advised to use fractions normalized to 1.0 in component material card, or at least to the same value, to keep control over resultant fractions. Notice that since material in the MR card has no fractions therefore its contribution specified on the MIX card is a dummy.
4.2. Control Cards i) Main control card Syntax:
BATCT [THFM {value}] [CMIN {value}] [VKSW {value}][VKLIM {value}] [FHEAT] [BURHT] [SUPEM]
where: THFM decay half-life threshold for fast decay treatment CMIN discrimination level of nuclide-to-nuclide transmutation transition VKSW value of k-eff above which reaction rates are calculated in the k-code mode VKLIM value of k-eff that terminates the calculations FHEAT use fission heating for normalization BURHT use heating only in burnable zones for normalization SUPEM suppresses emerging nuclide runs. Only at BoL the emerging nuclide run will be
executed. ii) Density discrimination card Syntax:
DISCR [TRNDCR {value}] [CPRCUT {value}] [DPRCUT {value}]
where:

13
TRNDCR discrimination level of the contribution to total macroscopic cross section, which is used for the nuclide selection to the list of nuclides that neutron can collide with during transport simulation
CPRCUT discrimination level of nuclide density to be printed out to bout file DPRCUT discrimination level of the nuclide toxicity dose to be printed out to bout file
iii) Time step control card Syntax:
STPCT [VART {value}] [VARK {value}] [VARH {value}] where:
VART longest allowed time step under irradiation (The value can be followed by time unit: day or year or second, by default second
is assumed unit.) VARK if greater than zero - allowed variation of k-eff during one time step if equals minus one – suppress checkup of criticality will be applied VARH if greater than zero - allowed variation of heating generation if equals minus one – suppress checkup of heating will be applied
4.3. Material processing and forced action cards The material processing cards consists of time specification cards and processing specification
cards. Two kinds of processing are allowed: point processing, i.e. processing at specified time points, for which the sequence of time points should be specified, and continuous processing, for which the time periods need to be specified. They can be grouped together to form processing batches to be performed in specified time points or during time periods. The batches can be formed from the same kind of cards concerning continuous or point type of processing. For each batch at required time point or at beginning of the continuous processing period the vector of nuclide density changes is integrated over all processing that form the batch. In case of point processing the densities are changed by this vector in prompt. In case of continuous processing, the vector of changes varies the densities continuously over all time the continuous processing for this batch is performed. If it is physically allowed all required changes would be accomplished at the elapse of continuous processing batch time. However, densities are still subject to additional change
i) Time point card Syntax:
AT {time_1} [{time_2}…] where: {time} the time when the processing batch will be performed. It creates time sub-periods The
value can be followed by time unit: year, day, second or the first letter of unit. By the default seconds are assumed as time unit. Multiple entries are allowed.

14
ii) After period card Syntax:
AFTER {n1} [{n2}…] where: {n} the number of a time period, according to the PRIOD card specification, at the end of
which the time point processing batch will be performed. Multiple entries are allowed. iii) Time sub-periods for continuous processing card Syntax:
FROM {t1} TO {t2} where: {t1} the beginning time of the sub-period for continuous processing. The time unit can
follow each entry. {t2} the end time of sub-period for continuous processing. The time unit can follow each
entry.
iv) Time periods for continuous processing card Syntax:
WHILE {n1} [{n2} …] where: {n} the number of a time period, according to the PRIOD card specification, during which
the continuous processing batch will be performed. Multiple entries are allowed.
v) Remove nuclides card Syntax:
RMOVE{n} {ZA_1} {ZA_2} …….[ DENSITY {treatment} {density}] ] where:
{n} the material number for which the nuclides will be removed {ZA} nuclide names (by ZA number or chemical symbol) to be removed {treatment} treatment type of the overall nuclide density to be applied for the processed
material {density} density of processed material with the sense depending on the density treatment
type Available density treatment types:

15
ADJUST it invokes recalculation of overall material density due to removal of some nuclides. Densities of the each remaining nuclide will be preserved.
RESTORE the overall material atomic density will be preserved after processing, what can implies the rise of densities for particular nuclides.
It removes nuclides from materials. By default the ADJUST option is assumed. vi) Limit nuclide densities card Syntax:
LIMIT{n} {type} {ZA_1} {density_1} [{ZA_2} {density_2} …]
where: {n} the material number for processing {type} the limit type to be used for density modification {ZA} nuclide name (by ZA number or chemical symbol) to be modified {density} nuclide density limit according to the limit type
Available limit types:
UPPER it invokes recalculation of the current nuclide density to be not greater then the specified density. It remains untouched if already satisfy the limit
LOWER it invokes recalculation of the current nuclide density to be not smaller then the specified density. It remains untouched if already satisfy the limit
EXACTLY it changes the current nuclide density to be exactly as specified. It adjusts nuclide density in materials according to given limits. The overall material density is
adjusted to the sum of nuclide densities after processing vii) Admix nuclides card Syntax:
ADMIX{n} {ZA_1} {fraction_1} [{ZA_2} {fraction_2} …] [ DENSITY [{treatment}] {density}]
where: {n} the material number for processing {ZA_I} nuclide names (by ZA number or chemical symbol) to be modified {fraction_I } nuclide fraction or density according to density treatment {treatment } treatment type of the overall nuclide density to be applied for the processed
material {density} density of processed material with the sense depending on the density treatment
type Available density treatment types:

16
NEW the specified density concerns the overall density of the newly created composition. It should contain current material density enlarged by the density of the admixed compound. The fractions specified on the card do not need to be normalized.
ADD the specified density concerns the overall density of the admixed compound. It invokes recalculation of overall material density by simple summation of the old density and the added density. The fraction specified on the card does not need to be normalized.
ADJUST it invokes recalculation of overall material density due to admixture of some nuclides. In this case the entry {density} should not be specified. The fraction specified on the card take the meaning of nuclide densities so the user should normalized them to the desired level.
RESTORE it preserves overall material atomic density. In this case the entry {density} should not be specified. The fraction specified on the card take the meaning of nuclide densities to be mixed with the nuclide densities of the material before the processing. So the user should normalize them to the desired level. Nevertheless they will be changed latter due to normalization of the overall density.
Admixes new portion of nuclides to materials. By default the ADJUST type is assumed.
viii) Copy material card Syntax:
COPY{n} {m} [DENSITY [{treatment}] {density}]
where: {n} the target material number for copying {m} the source material number for copying {treatment} treatment type of the overall nuclide density to be applied for the target material {density} density of processed material with the sense depending on the density treatment
type Available density treatment types:
ADD the specified density concerns the overall density increment as compared to the source material density.
NEW the specified density concerns the overall density of the target material. ADJUST density is kept the same for target as the source material has.
It copies material composition from one material to other with possibility of overall density can
be modification. By default the ADJUST option is assumed
ix) Material shuffling card Syntax:
SHUFL {n1} {m1} [{n2} {m2}… {nI} {mI} ]

17
where: {nI} {mI} are pairs of material numbers to be shuffled
The user can shuffle burnable material with not-burnable while paying attention to the cell density treatment. In cases when the user defines two or more cells having assigned the same material but with different densities and then uses the material for shuffling the densities of the cells of new locations of the material will have the same density that is of the cell with lowest program number before the shuffling.

18
x) Print new input card Syntax:
INPRT [MCNP / MCB] [NOID] [ZAID] [CLEAN]
where: MCNP only input cards accepted by MCNP will be printed to the new input. MCB the MCB specific input cards will be copied to the new input. By default MCNP is assumed. NOID invokes printout of material ZAID-s without library identifiers. By default complete
ZAIDS for every material are printed. ZAID invokes printout of material ZAID-s instead of symbols. By default for MCB input the
symbols are used for material definitions. CLEAN invokes removing material cards not needed for a new run.
Prints material composition at required evolution time point. The fractions and densities will be
printed to created MINP file in the format requited by the MCNP input file. Must be used with cards AT or AFTER specifying the evolution time point for printout. In case when INPRT card is used in a batch together with material processing card, the actual composition that emerges after accomplished processing will be taken. Shortly the position in the batch does matter.
xi) Force criticality calculation card Syntax:
KEFF Card can be used for invoking criticality calculation in decay periods or in required poits in cases
of suppressed criticality checkup (VARK = –1) xii) Force transport calculation card Syntax:
TRNSP The TRNSP card can be used for invoking transport calculation in fixed source mode for
heating and neutron multiplication in required points when by default the action is not performed (for example at the end of irradiation period that is followed by decay period). Not to apply in the decay mode.
xiii) Force reaction rates calculation card Syntax:
REACT

19
Card can be used for invoking neutron transport with reaction rates calculation (it also includes heating and neutron multiplication) in required points when by default the action is not performed (for example at the end of irradiation periods that is followed by decay period or material processing). Not to apply in the decay mode.
xiv) Force emerging nuclide list formation card Syntax:
EMERG When emerging nuclide runs are suppressed this card can be applied for specific time points. It
forces action of emerging nuclide list formation. 4.4. Period Specification Cards i) Burnup periods card Syntax:
PRIOD {tper(1)} {tper(2)} …..{tper(jper)}
Where {tper(i)} is the end time of i-th period. The value of tper(i) can be followed by time unit: day or year, otherwise second is the unit. Specifies duration of periods of established external physical conditions. The number of entries becomes the number of defined periods – jper.
ii) Source strength card Syntax:
SRCTP {srcst(1)} {srcst(2)} …{srcst(jper)} Specifies the neutron source strength, or its upper limit, versus period iii) System power card Syntax:
POWER {pwr(1)} {pwr(2)} …{pwr(jper)} Specifies thermal power of the system in watts, or its upper limit, versus period 4.5. Burnup Material Specification Card. Syntax:
BURN {nmt(1)} {nmt(2)}… {nmt(izn)}

20
Where {nmt(i)} are the numbers of the burnable materials. The BURN card invokes burnup calculations. If burnup calculation is required for a cell then the material assigned for it must be specified on the BURN card. The first zone is created by all cells to which material n1 was assigned. The second and next zones are formed the same way. The user should distinguish between the zone number and the burnable material number. Several cells with the same material assigned constitute one burnable zone. The reaction rates are averaged for each zone over all constituting cells and for next time step the new averaged nuclide concentrations will be set for every constituting cell. The first negative material specification denotes the zone for which transmutation trajectories are buildup and selected. If no entry is negative but trajectory selection is required then it will be done for the first zone. The number of entries becomes the number of burnable zones – izn.
4.6. Additional Cards. i) Print transmutation chains card Syntax:
CHPRT {ZA_1} [{ZA_2}…] Where ZA is made from a nuclide Z and A numbers or its chemical symbol. Specifies nuclides for which set of transmutation chains will be printed out to the bmes file. The printout takes place during the transmutation trajectory selection process.
ii) Fission source file card Syntax:
SRCTP Attaches the stctp file for k-code calculations. Needed if the SDEF card is used for fixed
source case but in k-code calculations the user prefers to use the srctp file.
iii) Isomer cross section assignment card Syntax:
GTMET If recognition of the cross-section library for a metastable isomer is not possible the system
assigns the loaded library to both required isomers. iv) Data allocation debugging card Syntax:
DEBUG {sub_1} [{sub_2}...]

21
Where {sub_I} is subroutine name in which crash error invokes the CKCMR subroutine. Allowed are following subroutines: EXPIRE, STEPRUN, ACECOL and BANKIT. The CKCMR subroutine that checks the data including cross sections stored in the dump file against the same data stored in local memory in common area in cases of crash error occurrence will be called. This feature is design for code developers for crash instances of unknown reasons. Our experience from the code testing shows us imperfection of nuclear data often leading to crashes. This option gives an answer if crucial fixed data used in calculation stay intact along with calculations.
v) Burnup history file card Syntax:
BHIST OFF [ON] Invokes creation of a burnup history file - bhist, which can be used later for result extraction
and processing. Suppressed by default. vi) Burnup message file card Syntax:
BMES ON [OFF] Invokes creation of a large file - bmes with burnup results and messages. It is active by default. vii) No fission product card
Syntax:
NOFP Excludes consideration of fission product evolution with time. It results in instant removal from
the calculation system of all fission products being currently produced. viii) Lump fission product card Syntax:
LMPFP[{n}] {ZAID_0} {fraction_0} [{ZAID_1} {fraction_1}...{ZAID_I} {fraction_I}]
where:
{n} is the material number for which deffintion will be applied. Zero or no number assumes that definition for all burnable materials.
{ZAID_0} corresponds to required lump fission product material. The default value is 50120.35c that is used in MCNP.

22
{fraction_0} corresponds to fraction of lump fission product in fission yield. The default value is 2.0
{ZAID_I} corresponds to accompanying fission product directly specified as nuclides. They will be consecutively transmuted.
{fraction_I} corresponds to fraction of accompanying fission product in fission yield normalized to 2.0
It invokes lump fission product treatment. All created fission products will be cast to the lump
fission product material specified by the user or by default value encoded in the source code with the ZAIDFP0 parameter. The lump fission product influences the neutron transport simulation but does not undergo transmutation.

23
5. Implementation.
The integration of MCNP and TTA is done through the development of a PATCH file for the CODEF file of MCNP-4C for processing with the PRPR preprocessor.
Definition of data for burnup section is done in the way that is employed by the original code and
it is implemented, in the most extends, in a block called COMDECK BP. For this data, new commons are defined and new dynamically allocated storage with the array offsets is implemented separately from the MCNP data. In order to simplify the program flow the external file names and their logical unit definition used in burnup calculations are stored within the MCNP locations as well as some arrays used for simplification of material definition by the user. New cards for the user input, new required data libraries as well as the produced external files for output, dumps and scratch files for burnup calculations are defined. The MCB code can run on standard UNIX platforms as well as on LINUX-PC-s. In both cases the PVM option of parallel execution and the pointer option (dynamic allocation of memory) are available. To activate dynamic allocation of memory on an Intel LINUX-PC-s the commonly available FORTRAN GNU compiler is inappropriate while the ABSOFT compiler does the job.
It is compatible with the MCNP-4C code and can work in the pure MCNP mode run while keeping newly introduced options of material definitions that can simplify the input file preparation process. MCB can be interrupted and restarted a similar way as MCNP does while the backup RUNTPE file can be used for a new restart, also in cases of system malfunction during the run.
Few changes were introduced in the file name definitions. File names are not longer limited to 8 character length strings. The basic default names of the files used are the same as in MCNP: inp, outp, srctp, rssa, wssa, runtpe, xsdir, along with added ones: bout, bmes, bhist, debug. Deferent meaning is given to the execution line key: n= . If the user runs the code by using following syntax:
mcb1c n= {name}
where {name} is the name of an input file, the system will assume following names for other required files: {name}.outp, {name}.srctp, etc. However in cases of the files: srctp, rssa, runtpe and xsdir a lack of file with the “{name}.” prefix when required for reading will cause system to search for a file with the basic default name i.e. without the prefix. This solution allows the user for fast cleaning of a working directory from produced files during a bad run, while keeping the files required for another try by applying command:
rm {name}.*
An interrupted MCB run can be restarted as follows:
mcb1c n= {name} cb or:

24
mcb1c n= {name} cbn={n}
without a need for a runtpe file specification. The system by default assumes {name}. runtpe or runtpe in the absence of the former one. MCB run interrupts have also different meaning as compared with MCNP. A selection of “q” after Ctrl_C interruption will impose a termination of the currently performed transport calculation but, differently from MCNP run, calculation will proceed into next step of burnup procedure. This can result in consecutive error occurrence if achieved statistics falls below required level and burnup calculations cannot proceed, otherwise burnup calculation will continue. The user can use this feature to shorten calculation time of particular step if changes his mined about required statistics. To inflict burnup premature termination process one should select “e” instead of “q”. This termination will produce the runtpe file that can be used latter for burnup run continuation as described above. 5.1. Fast decay analysis Fast decay analysis module is implemented in the FASTD subroutine and makes analysis of nuclear data concerning radioactive decay, checks its consistency and data availability on the file. It divides all nuclides into categories depending on the decay half life that is compared with the user defined threshold, and forms the decay paths for further processing. As a result, the physical decay paths are changed into paths leading to not fast decaying nuclides, which will be used in burnup calculations. When fast decay processing is done the list of nuclides that survive is established and fixed for all time steps. The necessary pointers from the nuclide list to cross section index table and to other tables are formed as well as the table offsets for dynamically allocated storage are finally completed to reserve possible storage for nuclide densities, reaction rates, etc. 5.2. Time step procedures Control subroutine STEPRUN is called after the fast decay analysis and consists mainly of calls to data processing routines or to calculation routines. It controls the program flow depending on the obtained results that are checked with the user requirements. The time step procedure is done with subsequent execution of PREPARE, MCRUN and PROCEEDE routines. 5.3. Reaction Cross Section Processing Reaction table settings and preparation for the first MCNP run is implemented in SETRC. The reaction list is established on the basis of a specification confined in the cross section files by a selection procedure that protects heating data and data of reactions, that lead to nuclear transmutation, against being scratched. The reaction list is used to set daughter for reaction products and other table pointers. At the end, the data are saved on a scratch file as the BOC data, which latter will be used, for system resetting in following time steps. 5.4. Heating and Reaction Rates The system heating calculations are done in the HEATING routine by using the contributions from nuclear energy release that occurred during every neutron path that was generated in the

25
neutron transport simulation. The reaction rates are converted into reaction probabilities in the SETCON routine, after heating normalization if required, and the all parameters of the Bateman equations are calculated as well. The contributions to reaction rates are scored by the RATES routine while those for heating - in the HEATR routine. 5.5. Transmutation Chain Formation and Transmutation Calculations Transmutation calculations are performed in the PASSAGE routine. The transmutation chain is expanded into a series of transmutation trajectories during the trajectory analysis process that is based on the analytical solution of Bateman’s equations. The series of transmutation trajectories is constructed in the following way. The first trajectory consists of only one nuclide and represents simply the survival of the initial nuclide. In the second step, the second generation of trajectories is formed which are extensions of the first trajectory by the transmutation to one of the daughters of the initial nuclide. During the trajectory formation process, the contribution to the destination nuclide (transmutation transition) is calculated as well as the passage through the trajectory (trajectory passage). The meaning of the trajectory passage is the sum of transmutation transitions from initial nuclide along all trajectories that would emerge as an extension of the considered trajectory to all other nuclides lying beyond the considered trajectory. The value of trajectory passage is used to truncate the trajectory extension process if it drops below a minimum level of concentration that would be worth attention according to the user-defined the CMIN parameter. Since the physical sense of the trajectory passage is the accumulated contribution to the other nuclides that emerge as products of the trajectory destination nuclide, it can stand for the chain truncation error of contribution calculations. The process of trajectory formation ends when all possible trajectory extensions are done. As a result, the set of trajectories that represents the initial nonlinear transmutation chain is obtained. Each trajectory is flagged by its parent trajectory identification that can be used to skip it in case of insignificance. The transmutations obviously change the nuclide concentrations, which after time can induce changes in the flux as well as in the transmutation rates. Particularly, the nuclides that were absent in the irradiated material at the beginning of irradiation, but emerged as a result of transmutations, may not only decay but also can be transmuted due to the irradiation. Therefore, transmutation rates of newly created nuclides are also calculated starting from their reaction rate calculations regardless if material is specified in the input or not. The set of trajectories is used for transmutation calculations, for other materials - or zones after recalculations of the transmutation constants. During the transmutation calculation process, the trajectory passage is being checked in order to skip the trajectories that contribute below the required level or in a possible opposite case to inform that the truncation error exceeds the acceptable level. In such a case, the chain resolving procedure is repeated for this particular case. The PASSAGE routine calculates nuclide-to-nuclide transmutation transitions and uses them to calculate nuclide density evolution.
5.6. System Summary Calculation results of MCNP are printed out to one standard output file that contains every step of calculation. Results of transmutation calculation and summary results are output to two MCB files:
- bout - the main output file with the burnup calculations that contains the most important summary results, both from transport and burnup modules.

26
- bmes - detailed information files with data related to burnup calculations. The file is very large but can be reviewed easily by searching for brake lines that contain following string: ####. The summary of system performance is calculated and printed out in the SUMBP routine. In cases when calculation results or system setup need an attention the program prints out a warning message. For those purpose both, output files and the console are used. For the summary of system performance the following data are printed out to the bout file: • thermal power of the system as a whole or its burnable part – depending on the user
specification, • neutron source intensity, when in case of fission source the neutrons from all generation are
accounted for, • average neutron flux in the trajectory selection zone, • effective neutron multiplication factor (keff) with its standard deviation estimated by K-CODE
as an average of collision, absorption and track-length estimators, • energy deposition per source neutron (H/S) ( in cases of fission source the H/S value will be
several times smaller than in cases of external source due to differences in source intensity definition)
• potential dose in case of ingestion and activity (activity contains also contributions from fast decaying nuclides),
• neutron multiplication for fission source (Mfiss);
This is net neutron multiplication calculated in k-code mode, if performed, over all neutron
generations according to the formula: where: M0 is the net nonfission multiplication of fission neutrons treated as the source neutrons, Wf
0 is the weight of neutrons lost to fission per source neutron – fission source, • neutron multiplication for external source (Mext); it is the actual neutron multiplication of the
external source, calculated in the transport mode (fixed source), if performed, according to the formula:
where: Gx is the weight of created neutrons in the non-fission multiplicative processes (n,xn) per source neutron, Wx is the weight of lost neutrons to the non-fission multiplicative processes (n,xn) per source neutron, Gf is the weight of created neutrons due to fission per source neutron, Wf is the weight of lost neutrons to the fission per source neutron, • fission source generated per external source neutron, defined above as Gf, • neutron multiplication factor for external source (kext) defined as:
eff
ffiss k
WMM
−−
=1
00
ffxxext WGWGM −+−+=1
f
fext G
Gk
+=
1

27
It is, the ratio of the fission source multiplication from generation to generation, averaged over all neutron generations in the cascade of fission chain originated from external neutron source.
• fixed neutron source importance (I1) defined as:
it shows effectiveness of net neutron multiplication of the external source as compared with neutron multiplication of the asymptotic fission source,
• fixed neutron source importance (I2) defined as:
it shows effectiveness of fission multiplication, that means also heat generation, of the external source as compared with the asymptotic source case.
References 1. J. F. Briesmeister, Editor: „MCNP –A General Monte Carlo Code N-Particle Transport
Code”, LANL report LA-12625-M, Version 4B (March 1997) 2. J. Cetnar: "A Method of Transmutation Trajectories Analysis in Accelerator Driven System"
Proc. IAEA Technical Committee Meeting on Feasibility and Motivation for Hybrid Concepts for Nuclear Energy Generation and Transmutation, Madrid, 17-19 Sept. 1997 (in pub.)
3. W. Gudowski: unpublished work 4. Firestone, R., B., et al.: ”Table of Isotopes, 8E” John Wiley & Sons, Inc. (1996) 5. ”The Basic Safety Standards” Safety Series No. 115, (1996) IAEA 6. A. G. Croff: “A User’s Manual for the ORIGEN2 Computer Code”, ORNL /TM-7157 (Oct.
1980) 7. A.C. Wahl: “Models for Mass Distribution”: private communication 8. F.M. Mann and R.E. Schenter: ”Calculated Neutron Capture Cross Sections to the Americium
Ground and Isomer States”, Nuclear Sc.& Eng.: 63, 242-249 (1977)
fiss
extMM
I =1
ext
eff
kk
I−−
=11
2

APPENDIX XIII
Jerzy Cetnar, Waclaw Gudowski, Jan Wallenius and Kamil Tucek, “Simulation of Nuclide Transmutations with Monte-Carlo Continuous Energy Burnup Code (MCB1C)”, Proc. Accelerator Applications 2001 and ADTTA 2001 “Nuclear Applications in the New Millennium”, Reno (USA). ANS (2001)

1
SIMULATION OF NUCLIDE TRANSMUTATIONS WITH MONTE-CARLO CONTINUOUS ENERGY BURNUP CODE
(MCB1C)
Jerzy Cetnar†, Waclaw Gudowski, Jan Wallenius and Kamil Tucek Nuclear and Reactor Physics Royal Institute of Technology
Stockholm Center for Physics, Astronomy and Biotechnology 106 91 Stockholm, Sweden
Abstract - A growing research interest in Accelerator Driven Systems (ADS) for nuclear waste
transmutations raised requirements for an application of a Monte Carlo approach to burnup calculations of transmutation systems. However, Monte-Carlo based burnup calculations with reasonable statistics are very lengthy and an average computational time required for these calculations is much than for stationary radiation transport calculations. Therefore effective Monte-Carlo burnup methods require dedicated numerical tools to perform a fast analysis of nuclide transitions in a transmutation phase space. Code system named MCB - Monte Carlo Continuous Energy Burnup Code is a general-purpose code that can be used for calculation of nuclide density evolution with burnup or decay, including keff calculations of critical and subcritical systems and neutron transport calculation together with all necessary reaction rates and energy deposition. The code integrates code MCNP, version 4C, used for neutron transport calculations, and a novel Transmutation Trajectory Analysis module (TTA) performing density evolution calculations, including formation and analysis of transmutation chains.
MCB is compatible with MCNP and complete burnup calculations can be done in a single run that requires preparation of a single input file with a very few more data lines compared to a regular MCNP input. A continuous or batch fuel feed/extraction can be simulated including a possibility of reloading and shuffling of the fuel elements. The code uses extensive data libraries that covers nuclide decay schemes, continuous energy transport and reaction cross-sections, isomer state formation ratios, incident energy and target nucleus dependent fission product yield, and radioactive hazard indexes. This novel and advanced numerical tool can be used for a design of various nuclear systems, particularly for simulations of the accelerator driven systems. The extensive tests on the system were performed on IAEA and NEA ADS-benchmark data covering both, time evolution of keff and transmutation of some isotopes. The very good results of these benchmarks serve as the first validation of the MCB-code.
† On leave: Faculty of Physics and Nuclear Techniques, University of Mining and Metallurgy 30 059 Cracow, Poland
I. INTRODUCTION MCB is a Monte Carlo Continuous Energy
Burnup Code for a general-purpose use to calculate a nuclide density time evolution with burnup or decay. It includes eigenvalue calculations of critical and subcritical systems as well as neutron transport calculations in fixed source mode or k-code mode to obtain reaction rates and energy deposition that are necessary for burnup calculations. The code integrates well-known code MCNP, version 4C [1], which is used for neutron transport calculation, and a novel Transmutation Trajectory Analysis code (TTA) [2], which serves
for density evolution calculation, including formation and analysis of the transmutation chain. MCB is compatible with MCNP and keeps its structure. Complete burnup calculations can be done in a one single run requiring preparation of only one input file by a modest modification of a standard MCNP input file. MCNP version 4C is used to buildup MCB1C. The code was extensively tested in benchmark calculations and reactor core design. The general conclusion from practical application shows that MCB1C produces reliable results that are physically inherent proving the physical model applied in the code is correct. MCB1C has some interesting practical options for

2
burnup calculations among them the simulation of material processing including continuous feed of materials is the most important.
II. FEATURES OF MCB The main goal of a burnup code is to calculate
material density evolution function. In a real system under irradiation or decay the nuclide composition undergo evolution that generally can be describe as a continuous function of time. MCB approximates this continuous function throughout a time step procedure starting from assessing reaction and decay probabilities of every possible reaction channel by means of stationary neutron transport calculations. In the next step the equation of transmutation chain is formed and solved to produce nuclide density table with required time steps. Since the varied material composition alters the reaction probabilities they have to be recalculated. This way the time step process is formed where the neutron transport calculations are performed in discrete time points while obtained reaction probabilities are assumed constant until new recalculation is accomplished. In MCB the time of reaction probabilities recalculation can be specified by the user or set by the program itself if user activated self-adjusting time step procedure.
II.A NEUTRON TRANSPORT CALCULATIONS
MCB1C is using MCNP4C subroutines for
neutron transport calculations and evaluation of all necessary physical quantities required for burnup calculations. It adopts the cross section tables in continuous energy approach. Reaction rates, that are required for transmutation chain formation are calculated exclusively by continuous energy method using the point-wise transport cross-section libraries and, in case of lack of proper library, by using dosimetry and/or activation cross section libraries. The contributions to reaction rates are being scored at every instance of neutron collision occurring in cells containing with burnable material by using the track length estimator of neutron flux.
All necessary cross-section libraries and data sets are automatically loaded into computer memory and used to calculate reaction rates and nuclide formation probabilities. Temperature dependent cross section tables for different burnable zones may be used, if available, to account for thermal effects. Models for energy dependent distribution of fission product yields and energy dependent formation of isomer nuclides are applied in the code. The user specifies the libraries explicitly or by using the default library option scheme similar to the one used in MCNP.
The physical model puts no limitation on the geometry and the volume division into cells or material assignments. Those limits however may be imposed by the available computer memory or by increased speed of calculations.
The MCNP transport calculations are invoked in one MCB run many times with different options concerning the calculation mode, statistics, reaction rates or heating calculation. If k-code mode is activated, what is always recommended in systems containing fissionable materials, every time step calculation starts from estimating the system criticality followed by the transport calculations for reaction rate evaluations. Reaction rates can be calculated in external fixed source mode (in output files referred to as transport) or in fission source mode (in output files referred to as k-code).
Calculations of the reaction rates consume most of the computer time, therefore a quick trial transport run is performed in some occasions. At the beginning of life or after material processing, MCB invokes a MCNP-run to set up the list of nuclides that can emerge from the initial composition during burnup. In this run no reaction rates are scored but the neutron flux so it is fast. The reaction rates are then calculated with the obtained neutron flux and serve for formation of emerging nuclide list throughout the transmutation calculation procedure. This list is used latter in so-called “sound” runs, with full coverage of reaction rates and heating calculations limited however to the meaningful nuclides. The list is also updated with every sound step.
Quick transport calculation runs with lower statistics are also used in the self-adjusting time step procedure for rough evaluation of energy deposition or criticality.
II.B NORMALIZATION AND TRANSMUTATION CHAIN FORMATION After completing the “sound” run with assessed
reaction rates and radiation energy deposition, the system need to be normalized in order to calculate the absolute probabilities of nuclear reactions and decay and to form nuclide transmutation chains. The system normalization can be made with regard to the external neutron source intensity when heating has no influence on its value, or with regard to the system thermal power.
Heating is calculated automatically on a similar way as the reaction rates during the neutron transport simulation by using heating cross section i. e. KERMA factors from standard cross section tables. In order to account properly for gamma heating, the heating data in the input cross section libraries should be processed with local deposition of gamma heating being added to neutron heating. In that way the gamma heating from gamma

3
radiation induced by neutron capture or scattering is properly included in the neutron cross section data. In case of using cross sections without heating data the user should specified the power without the unaccounted gamma heating. MCB does not count gamma heating that could be produced in photon transport and even if photon transport is invoked its contribution is neglected in the normalization procedure. The user can also use an option to calculate heating from recoverable energy of fission. This data is by default loaded with the transport cross sections. The code calculates automatically the heating from natural decay of nuclides, what allows for consideration of decay heat effects. The energy of decay is taken from the ORIGEN library [3].
The decay schemes of all possible nuclides and their isomeric states are formed and analyzed on the basis of decay data taken from two sources. The first one – TOI.LIB is prepared on the basis of Table of Isotopes and describes decay schemes for over 2400 nuclides [4]. The second one - XS.LIB is a decay data file used for ORIGEN code system and it supports energy-integrated ratios of nuclide formation in excited states [3].
Formation of excited state nuclides due to process of neutron capture or (n,2n) reaction is calculated from energy dependent isomer formation ratios supported by file ISB.LIB or, in case of their lack, by using the integral isomer formation ratios taken from the ORIGEN library - XS.LIB file.
Fission product yields are calculated from incident energy dependent distributions of fission products prepared separately for every fissionable nuclide, which are loaded from the FY.LIB file. Since consideration of production and time evolution of fission products is computer time consuming this option can be disabled by the user or simplified treatment with lump fission product assisted by important neutron absorbers can be used instead.
Nuclide decay and transition through reaction channel are also analyzed for emitted particles, which are also scored and appended to the transmutation chain.
For the purpose of output file clarity the nuclides are divided into few groups depending on their decay half-life versus the fast decay threshold set by the user. The nuclides that fall into fast decaying group are treated in a simplified manner; they are assumed to decay on prompt of their appearance. However nuclides having transport cross-sections or explicitly specified on MR card are treated in full extent. The calculated system activity or decay heat depositions accounts for appearance of short-lived nuclides in the system. However, if the user chooses the fast decay threshold to be high it results in biasing of density evolution of some nuclides that the calculated evolution is faster than the real one.
Having calculated one step transition probabilities the code forms on-line the transmutation chain that is time step and material dependent. The process of chain formation is performed along with its resolution according to general solution of Bateman equations. The transmutation chain is expanded into a series of transmutation trajectories during the trajectory analysis process. Every transmutation trajectory contributes to the destination nuclide density at the end of time step with the value equals the product of starting nuclide density at beginning of time step and the transmutation transition probability. The trajectory extension process is truncated when the transmutation transition probability of any extended trajectory drops below a cutoff level.
II.C CALCULATION OF BATEMAN EQUATIONS
Time evolution of nuclide densities is
calculated with the complete set of linear transmutation chains prepared for every zone and time step so it is being automatically adjusted to time evolving transmutation conditions. The code uses extended linear chain method, which is based on the Bateman approach, to solve, prepared-on-line, set of linear chains that noticeably contribute to nuclide formation. Program calculates transmutation transitions from nuclide to nuclide and prints them out to one of the output files. Transmutation chains that are formed by the code can be also printed out for nuclides of interest.
The series of transmutation trajectories are constructed in the following way. The first trajectory consists of only one nuclide and represents simply the survival of the initial nuclide. In the second step, the second generation of trajectories is formed which are extensions of the first trajectory by the transmutation to one of the daughters of the initial nuclide. During the trajectory formation process, the contribution to the destination nuclide (transmutation transition) is calculated as well as the passage through the trajectory (trajectory passage). The meaning of the trajectory passage is the sum of transmutation transitions from initial nuclide along all trajectories that would emerge as an extension of the considered trajectory to all other nuclides lying beyond the considered trajectory. The value of trajectory passage is used to truncate the trajectory extension process if it drops below a minimum level of concentration that would be worth attention according to the user-defined parameter. Since the physical sense of the trajectory passage is the accumulated contribution to the other nuclides that emerge as products of the trajectory destination nuclide, it can stand for the chain truncation error of contribution calculations. The

4
process of trajectory formation ends when all possible trajectory extensions are done. As a result, the set of trajectories that represents the initial nonlinear transmutation chain is obtained. Each trajectory is flagged by its parent trajectory identification that can be used to skip it in case of insignificance. The transmutations obviously change the nuclide concentrations, which after time can induce changes in the flux as well as in the transmutation rates. Particularly, the nuclides that were absent in the irradiated material at the beginning of irradiation, but emerged as a result of transmutations, may not only decay but also can be transmuted due to the irradiation. Therefore, transmutation rates of newly created nuclides are also calculated starting from their reaction rate calculations regardless if material is specified in the input or not.
II.D TIME STEP PROCEDURE
The code can be used for simulations of
subcritical systems with fixed external source of neutrons and for critical systems for which the eigenflux is used for normalization. Pure decay mode is also available. The system normalization can be set in user defined time periods by specification of the external neutron source strength or the system total thermal power. The periods of irradiation can be mixed with the cooling periods with possible material processing at any desired time point. Possible material processing includes removal or admixture of the nuclides as well the shifting of materials from cell to cell as well continuous supply of material to the system.
Self-adjusting step routine becomes active when the user defines allowed variation of keff or heating. The code controls the calculation mode, by setting the external source mode or the fission source mode (k-code), upon the current value of keff reaches the value specified by the user.
III. CROSS SECTION LIBRARIES AND DATA FILES
In order to provide accurate transmutation
calculations the code must be supported with data files, which allow for complete simulation of neutron transport and nuclide formation. The bulk of data consists of numerous cross-section libraries for calculation of reaction rates and transport cross-section library. The scope of neutron libraries distributed with MCNP package is limited and lacks data for many nuclides, so it is recommended to use an enlarge set of cross sections. Another problem is the number of available reactions. Since
the standard cross-section library for neutron transport contains limited reaction list, it is recommended to supplement the dosimetry and/or activation data library in order to complete the reaction list. The code is designed to load in simultaneously, transport and dosimetry libraries for every specified material. The standard MCNP xsdir file needs to be used to guide the program through cross-section libraries. As it is reported below the code was positively tested with continuous energy cross section libraries for transport and reaction rates prepared for various material temperatures on the basis of: JEF2.2 JENDL3.2, ENDF-B/VI and EAF3.1 files.
Second part of data files concerns a nuclide formation process and radioactive nuclide properties. The decay schemes of over 2400 nuclides, including metastable, were prepared on the basis "The Table of Isotopes 8E" [4] while the dose data of 738 nuclides were prepared on the basis of Euratom Council Directive 96/29/EURATOM [5]. The library file TOI.LIB contains the data describing decay constants with branching ratios, and the values of committed effective dose per unit intake.
Since formation process of isomer nuclides is not well treated in existing libraries of MCNP, as well as in “Table of Isotopes” data from other sources is needed. The first one is the one-group cross-section library of ORIGEN [3] which serves for calculation of isomer formation ratio due to decay, reaction (n,2n) or neutron capture. It is attached to the program as XS.LIB file.
Since the ORIGEN file supports only average energy data, for some important energy-dependent isomer formation ratios have been prepared as ISB.LIB file. Currently available file contains formation ratios of 242mAm and 244mAm basing on Mann & Schenter model [8].
Incident energy and nuclide dependent fission product yields were prepared basing on Wahl model [9] as a file FY.LIB, containing fission product yields functions for 36 heavy nuclides.
IV. TRANSMUTATION SYSTEM DEFINITION.
The MCB code can work as a standard
MCNP4C code unless burnup option is switched on. The card BURN that contains the list of burnable material does the switch. In the burnup mode the code takes control over user specification of the transmutation condition and gives warning messages in case of user error of specification. Obviously program does not perform full checkup of physical consistency of the system definition but checks consistency with program requirements to complete calculations. Without BURN card the MCNP mode is used while all other burnup control

5
cards are ignored but the new option of material definition remains valid. In order to properly set up the problem the user need to introduce following specifications:
o burnable material, o libraries required for reaction rates
calculations, o duration of transmutation time periods, o system normalization with external neutron
source strength or thermal power.
IV.A MATERIAL AND LIBRARY DEFINITION.
MCB requires an extensive number of materials
handling what results in necessity of improving (simplification) material specification from the user point of view as well as material differentiation in order to avoid unnecessary data processing. Since a calculation process is much more complex than in case of pure MCNP the material and libraries should be differentiated. Different treatment is required for abundant materials that influence the neutron transport process and for low abundant material. Moreover, the case is fluent when with transmutation some nuclides disappear while others emerge. Therefore for burnup case libraries for all possibly emerging nuclides must be specified. The material and library definition can be done for such a case with usage of extended material definition option design for MCB.
IV.B NEUTRON SOURCE SPECIFICATION Since MCB performs calculation in transport
mode (with external source) or in k-code mode (with fission source) with one load of input file the user need to support neutron source specification for both cases.
IV.C MODE OF CALCULATIONS Burnup calculations can be done either in k-
code mode or in transport mode. This means that reaction rates are calculated in one of the modes. Also it is possible that system switches between two modes depending on current value of keff. In both cases if user whishes to control level of keff the k-code mode must be used for this purpose. To invoke k-code calculation the user must use the KCODE card.
IV. D BURNUP TIME STEP SPECIFICATION AND SYSTEM
NORMALIZATION The user specifies intervals of the constant
physical conditions, i.e. the burnup time step. Also a time step self-adjusting procedure can be invoked.
System normalization, i.e. determining of the absolute value of the neutron flux in cells, can be done to the required thermal power or based on a required external source strength. If the system is to be normalized to the required power the source strength is automatically adjusted to the level at which the system reaches the required power.
V. IMPLEMENTATION. The integration of MCNP and TTA is done
through the development of a PATCH file for the CODEF file of MCNP for processing with the PRPR preprocessor.
Definition of data for burnup section is done in the way fully compatible with by the original MCNP code. New commons are defined and new dynamically allocated storage with the array offsets is implemented separately from the MCNP data location. In order to simplify the program flow the external file names and their logical unit definition used in burnup calculations are stored within the MCNP locations as well as some arrays used for simplification of material definition by the user. New cards for the user input, new required data libraries as well as the produced external files for output, dumps and scratches for burnup calculations are defined.
The MCB code can run on standard UNIX platforms as well as on LINUX–computers. In both cases the PVM option of parallel execution and the pointer option (dynamic allocation of memory) are available. To activate dynamic allocation of memory on an Intel Linux-computers the commonly available FORTRAN GNU compiler is inappropriate while the ABSOFT compiler does the job.
Figure 1 shows a flow diagram of the MCB-code reflecting its main logic and a full integration with the MCNP-code.
Fast decay analysis module is implemented in the FASTD subroutine and makes analysis of nuclear data concerning radioactive decay, checks its consistency and data availability on the file. As a result, the physical decay paths are changed into paths leading to not fast decaying nuclides, which will be used in burnup calculations.

6
No
Yes
No
Yes
No
Yes
Start
Parallel Subtask
lblock
exemes
msgtsk
fastd
stuff
denproc
imcn
blkdat ibldat
bpbdat
setproc
rdprob
chmbp
setdas
pass1
rhoden
ixsdir
nxtit1
oldcd1
items
newcd1
nextit
oldcrd
items
newcrd
xact expung getxst
setkot
resets
restore
msgcon
Parallel Master mcrun
setrct
mcrun
tpefil
prepare
save
proceed
ckcmr
sumbp
steprun
Stop
Stop flow
setmix
setkot heating
passage
setcon
restore
flrates
matproc
save
hstory
trnspt
heatr
rates
acetot
acetotb
utask
vtask
stepden
BurnupMode
Figure 1. A flow diagram of the basic structure of the MCB1C code. Routines in bold are the original burnup routines, routines in normal font are modified MCNP4C routines.

7
Reaction table settings and preparation for the first MCNP run is implemented in SETRCT. The reaction list is established on the basis of a specification confined in the cross section files by a selection procedure that protects heating data and data of reactions, that lead to nuclear transmutation, against being scratched. Control subroutine STEPRUN is called after the fast decay analysis and consists mainly of calls to data processing routines or to calculation routines. It controls the program flow depending on the obtained results that are checked with the user requirements. The time step procedure is done with subsequent execution of PREPARE, MCRUN and PROCEED routines. The reaction rates calculation is implemented in the SETCON routine while heating calculation is done in the HEATING routine by using the contributions from every particle paths that are scored directly during transport calculations, that is, with usage of data tables prepared for particle travel simulation. The contributions to reaction rates are scored by the RATES routine while those for heating - in the HEATR routine.
Material processing that includes material admixture or removal as well as shuffling and copying material composition are implemented in the MATPROC subroutine. The material processing is initialized in grouped into processing batches with application of the subroutines SETPROC and DENPROC.
The PASSAGE routine expands the transmutation chain is into a series of transmutation trajectories during the trajectory analysis process that is based on the analytical solution of Bateman’s equations, and then transmutation calculations are performed. The set of trajectories is used for transmutation calculations after recalculations of the transmutation constants separately for every burnable material and time step. During the transmutation calculation process, the trajectory passage is being checked in order to skip the trajectories that contribute below the required level or in a possible opposite case to inform that the truncation error exceeds the acceptable level. In such a case, the chain resolving procedure is repeated for this particular case. The PASSAGE routine calculates nuclide-to-nuclide transmutation transitions and uses them to calculate nuclide density evolution what is done in subroutine STEPDEN.
VI. BENCHMARKING THE MCB CODE The MCB code has been extensively
benchmarked in 2 international benchmark activities.
VI.A NEA/OECD BENCHMARK ON “COMPARISON CALCULATIONS FOR AN
ACCELERATOR-DRIVEN MINOR ACTINIDE BURNER”
Already the earlier, preliminary version of
MCB (based on MCNP-4B) [1] with JEF2.2 cross-section library showed a reasonable agreement with 6 other participants of the NEA/OECD benchmark on “Comparison Calculations for an Accelerator-Driven Minor Actinide Burner” [10]. In this benchmark a relatively simple model of an accelerator-driven minor actinide burner with liquid Pb-Bi target and cooling systems was benchmarked by seven participants using a variety of simulation codes from fully deterministic ones like ERANOS, TWO-DANT and SCALE code system through a popular Monte-Carlo and ORIGEN burnup hybrid code system to a full Monte-Carlo approach as the MCB-code. Even if the version of the MCB code used in this benchmark was a preliminary one, the comparison with the results of other codes was very good, like for example an evolution of keff for initial and equilibrium cores – see Figs 2 and 3. Some discrepancies observed in a neutron flux distribution, as presented on Fig. 4, where MCB
Figure 2. keff evolution in time for a start-up core of the NEA-OECD benchmark [10]. RIT (JEF2.2) label corresponds to MCB-results.
k-eff in start-up core
0,89
0,91
0,93
0,95
0,97
0,99
0 1 2 3 4 5Burn-up step (year)
k-ef
f
ANL (ENDF/B-VI)CIEMAT (JENDL3.2)KAERI (JEF2.2)PSI/CEA (JEF2.2)JAERI (JENDL3.2)RIT (JEF2.2)
k-eff in equilibrium core
0,90
0,92
0,94
0,96
0,98
0 1 2 3 4 5Burn-up step (year)
k-ef
f
ANL (ENDF/B-VI)
CIEMAT (JENDL3.2)
KAERI (JEF2.2)
PSI/CEA (JEF2.2)
JAERI (JENDL3.2)
RIT (JEF2.2)
Figure 3. keff evolution in time for an equilibrium core of the NEA-OECD benchmark [10]. RIT (JEF2.2) label corresponds to MCB-results.

8
clearly overestimate the flux level, lead to significant improvements of the heating and decay heat treatment in the next version of the code.
VI.B IAEA -ADS BENCHMARK The recent version of MCB1C was very
extensively benchmarked in a large IAEA Accelerator-Driven System Benchmark. This benchmark summary (stage 1) is separately presented on this Conference [11].
12 participants from different countries performed a series of very different calculation of a simple model of Th-233U fuelled Pb-cooled Accelerator-Driven System with a cylindrical symmetry (look to [11] for specific details of the system description).
MCB1C simulations have been uniquely performed for 3 different cross-section data libraries, ENDFB6.5, JEF2.2 and JENDL3.2. All the data libraries have been processed by NJOY99 [12] in order to produce temperature dependent cross section libraries for 2 different temperatures used in this benchmark: 900K for coolant and structural materials and 1200K for fuel. MCB1C code itself is distributed with 6 temperature dependent cross section libraries starting from 300K up to 1800K with a temperature step of 300K.
Figure 5 shows an excellent performance of MCB compared to other codes for keff evolution of the simulated ADS. The keff evolution curves of MCB are very much close to the average results for all 3 data libraries. Even if it is not an unquestionable argument for the absolute quality of the code, it definitely proves that for the simulated ADS system the code gives physically correct results. It is very interesting to intercompare the results for the MCB-code using different data libraries. Fig. 6 presents just this comparison for the keff evolution for the different initial values of keff of 0.94, 0.96 and 0.98. Taking into account the dispersion of the initial data (due to the imprecise
simulations of the initial keff) it can be concluded that results for ENDFB6.5 and JENDL3.2 data libraries coincide very well. Results for JEF2.2 show higher values of keff throughout the simulation period. This difference is most probably due to the
Axial neutron distribution (r = 0 cm) in start-up core
0,0E+00
2,0E+15
4,0E+15
6,0E+15
8,0E+15
1,0E+16
1,2E+16
0 50 100 150 200 Axial position (cm)
Neu
tro
n f
lux
(n/c
m2/
sec)
ANLCIEMATKAERIPSI/CEAJAERIRIT
Figure 4. Axial flux distribution in the centre of the start-up core of the NEA-OECD benchmark [10]. RIT label corresponds to MCB-results and shows a clear overestimation of the flux level.
IPPE, diffusion
IRPCP, diffusion
PSI, JEF 2.2
PSI, JENDL 3.2
ENEA
JAERI CEA-Cad. KTH - MCB JEF
KTH - MCB JENDL
KTH - MCB ENDFB
k-eff (t=0) ~ 0.96
0,9
0,91
0,92
0,93
0,94
0,95
0,96
0,97
0,98
0 150 300 450 600 750 900 1050 1200 1350 1500 1650 1800 1950 2100 2250Days
k-ef
f.
k-eff (t=0) ~ 0.94
0,9
0,91
0,92
0,93
0,94
0,95
0,96
0 150 300 450 600 750 900 1050 1200 1350 1500 1650 1800 1950 2100 2250Days
k-ef
f
Figure 5. Time evolution of keff for the IAEA-benchmarked ADS for the 2 initial keff of 0.94 and 0.96 [11]. KTH-MCB stands for MCB results with different cross-section data libraries. Statistical precision of the MCB results is of the order of 0.1%.
Figure 6. MCB results of the evolution of keff in time for different initial keff-values and different nuclear data libraries: JEF2.2, JENDL3.2 and ENDFB6.5.
k-eff (t=0) ~ 0.96k-eff (t=0) ~ 0.94
k-eff (t=0) ~ 0.98
0,92
0,93
0,94
0,95
0,96
0,97
0,98
0,99
0 150 300 450 600 750 900 1050 1200 1350 1500 1650 1800 1950 2100 2250Days
keff
KTH - MCBJEF
KTH - MCBJENDL
KTH - MCBENDFB

9
inelastic neutron cross sections for Pb in a high neutron energy range.
However it is important to note the differences in results for the different nuclear data libraries is smaller than discrepancies between different codes using the same data library. It is clearly shown on Fig. 7 that discrepancies between the codes reach a value of about 2000 pcm at EoL, compared to about 1000 pcm for the discrepancy between JEF2.2 and JENDL3.2 for the MCB calculations.
Another very interesting feature which can be uniquely simulated with the MCB based on the recent version of MCNP4C is the impact of the delayed neutron spectrum on the ADS reactivity and burnup. For the fast neutron spectrum, like IAEA ADS benchmark, the contribution of the delayed neutron spectrum is worth about 2000 pcm, which gives, for example, a reduction of the initial fuel enrichment of the order of 0.15 % (absolute weight %).
Effectiveness of the spallation neutrons as a function of time is also very reliably simulated by MCB. Fig. 8 shows the comparison of the results for 3 different codes. The small discrepancies between the results can be easily caused by statistical fluctuations of the Monte Carlo method. Decreasing effectiveness of the spallation neutrons with time is due to the higher burnup of the central zone of the core.
VII. CONCLUSIONS MCBC1 is a new Monte Carlo burnup code,
which was successfully validated for the fast neutron spectrum in benchmark simulations of the Accelerator Driven Systems. Comparison of the results gives a confidence that the physical phenomena important for the steady state and burnup calculations are properly modeled.
Application of very fast routines for burnup calculations and optimized time step mitigate the run-time requirements, which is still the biggest disadvantage of the Monte-Carlo burnup approach. Compatibility with the widely used and extensively validated MCNP code is a very attractive feature of MCB and is an important add-on value for simulation of the complex nuclear systems saving the time needed for the preparations of the burnup calculations. Moreover, a concise summary of the results offered by this code saves also significantly time needed for the analysis of the result.
Reported benchmark results give a confidence that use of MCB for simulation of accelerator-driven system give correct results, at least for the fast neutron spectra. The MCB1C source code with the temperature dependent neutron cross-section libraries will be soon available through the NEA/OECD data bank.
The next step in the development of the MCB code is a benchmark and a validation of the calculations for the thermal neutron spectra, continuous feed and reloading/fuel management of the core. Moreover, a graphical interface for an automatic presentation of the burnup results is of a high priority for the code development.
REFERENCES
[1] J. F. Briesmeister, Editor: „MCNP –A General Monte Carlo Code N-Particle Transport Code”, LANL report LA-12625-M, Version 4B (March 1997)
[2] J. Cetnar: "A Method of Transmutation Trajectories Analysis in Accelerator Driven System" Proc. IAEA Technical Committee Meeting on Feasibility and Motivation for Hybrid Concepts for Nuclear Energy Generation and Transmutation, Madrid, 17-19 Sept. 1997.
Effectiveness of spallation neutrons
1
1,1
1,2
1,3
1,4
0 150 300 900 1200 1500 1800 2100Days
Neu
tro
n e
ffec
tive
nes
s m
m
IPPE
ENEA
KTH-MCB
Figure 8. Effectiveness of the spallation neutron source as a function of burnup. IPPE (diffusion code), ENEA (MCNP + Origen) and KTH MCB with JEF2.2 results for keff at BoL = 0.98 [11].
k-eff (t=0) ~ 0.96
0,92
0,93
0,94
0,95
0,96
0,97
0 150 300 450 600 750 900 1050 1200 1350 1500 1650 1800 1950 2100 2250Days
keff
PSI,JENDL 3.2JAERI
KTH - MCBJENDL
Figure 7. Discrepancies of the keff evolution calculations for IAEA benchmark. The same neutron data library JENDL3.2 used in different codes: PSI – deterministic code 2DTB, JAERI – Monte Carlo MCNP-ORIGEN code system, KTH – MCB1C code [11]. The initial keff value – 0.96.

10
[3] M.J. Bell, ORIGEN- The ORNL Isotope Generation and Depletion Code, ORNL-4628 UC-32, 1973; G. Croff: “A User’s Manual for the ORIGEN2 Computer Code”, ORNL /TM-7157 (Oct. 1980)
[4] Firestone, R., B,. et al.: ”Table of Isotopes, 8E” John Wiley & Sons, Inc.(1996)
[5] EURATOM 1996. Laying Down Basic Safety Standards for the Protection of the Health of Workers and the General Public from the Dangers Arising from Ionizing Radiation. Council Directive 96/29 Euratom of May 13, 1996. Official Journal of the European Communities, Vol. 39, No. L 159, June 29, 1996.
[6] W. Gudowski private communication.
[7] ”The Basic Safety Standards” Safety Series No. 115,(1996) IAEA
[8] F.M.Mann and R.E. Schenter: ”Calculated Neutron Capture Cross Sections to the Americium Ground and Isomer States”, Nuclear Sc. & Eng.:63,242-249 (1977)
[9] A.C. Wahl: “Models for Mass Distribution”: private communication
[10] Byung-Chan Na, editor: “Comparison Calculations for an Accelerator-Driven Minor Actinide Burner”, NEA-OECD report 2001, in preparation.
[11] W. Gudowski et al., “IAEA Benchmark on Accelerator-Driven Systems”, AccApp/ADTTA '01 – Reno 2001.
[12] R.E. MacFarlane, The NJOY Nuclear Data Processing System, Version 91, Report LA-12740-M, Los Alamos National Laboratory, 1994 and http://t2.lanl.gov/codes/njoy99/

APPENDIX XIV
Tucek K., et al.: Source efficiency in an accelerator-driven system with burnable absorbers, International Conference on Back-End of the Fuel Cycle: From Research to Solutions, GLOBAL 2001, Paris. ANS (2001).

SOURCE EFFICIENCY IN AN ACCELERATOR-DRIVEN SYSTEMWITH BURNABLE ABSORBERS
Kamil Tucek, Jan Wallenius, Waclaw GudowskiDepartment of Nuclear & Reactor Physics
Royal Institute of Technology100 44 Stockholm, Sweden
ABSTRACT
Burnable absorbers have been suggested by the present authors for mitigation of reactivity losses in sub-criticalsystems fuelled by transuranic fuel. In this study, we investigate the source efficiency in realistic designs ofaccelerator-driven systems with massive presence of burnable absorbers. Different design options of distributingburnable absorbers, diluents and fissile material in the core are considered in order to optimize the value of sourceefficiency while at the same time keeping favourable transmutation characteristics of the system. The sourceefficiency showed to be a strong decreasing function of target radius due to inelastic slowing down of neutronsin the target. We present a conceptual core design of a transuranium sub-critical burner with improved safetycharacteristics (negative void worth, transient of beam power behaviour) while fission probability for 241Am stillremains above 25%.
Keywords: accelerator driven systems (ADS), burnable absorbers, source efficiency
1-INTRODUCTION
Incineration of americium and curium in transmutation reactors is inevitable if the radiotoxic inventory of spentfuel is to be reduced by more than a factor of 100 [1]. However, the extensive helium production in minor actinidefuel pins is the principal limiting factor of achieving high fuel burnups and actinide fission fraction rates. As wehave shown in our previous studies, boron carbide in sub-critical transuranium burners acts as an effective shieldof thermal neutrons, protecting them from being captured in even neutron number actinides. In comparison to sys-tems relying on the diluent option, a factor of 2-3 higher fission-to-absorption probabilities of even neutron numberamericium isotopes (241Am and 243Am) can be achieved in the minor actinide fuel pins. This consequently reducesbuild-up of the strong α-emitter 242Cm, which paves a way for extension of fuel burnup and residence times [2].Difficulties with power peakings and reactivity losses during burnup can also be somewhat mitigated. The in-troduction of burnable absorber, on the other hand, deteriorates the reactor’s safety characteristics, particularlycoolant void reactivity and Doppler effect.
Another major concern specific for ADS is the accidental insertion of full available accelerator margin intothe reactor which could lead to fuel and/or clad damage. Such scenario is particularly relevant for the burnersfuelled with high quality transuranic fuel without a massive fertile material support. In such cases, acceleratorbeam margins larger than a factor of 3-4 have to be provided in order to maintain constant reactor power.
One of the remedies is a substantial increase in pin pitches (more than twice the pin diameter) which providessufficient coolant flow area to carry out the excess heat from the system until reactor operators or passive inherentsafety devices can react. Burnup reactivity swing and consequently accelerator margin can be also minimised by asubsequent breeding of fissile material compensating for fuel burnup and fission product poisoning. On the otherhand, decreased fuel and fissile material fractions have adverse effect on source efficiency [3].
In this study, we present a preliminary, conceptual design of a medium power, 800 MW th accelerator-drivenlead-bismuth cooled core, featuring transuranic nitride fuel. We pay special attention to the economy of the sourceneutrons and the source efficiency is studied for different target radii and axial target positions in the core.
2-SOURCE EFFICIENCY
The source efficiency is a direct coupling factor between the fundamental mode multiplication and the intensity ofthe external neutron source, i.e. accelerator power needed to keep total thermal power of a system constant. Theefficiency of an external neutron source φ� relates the external source neutron multiplication to the multiplicationof a neutron from an average fission as:
φ� =Mext �1Mf iss�1
=
k0
k fs
; (1)
1

where Mext is the external source multiplication Mext=1+νNf , ν is the average fission neutron yield, N f is thenumber of fissions per source neutron, k0 is the external source neutron multiplication factor, and M f iss=1/(1-ke f f )is the fundamental mode neutron multiplication. The multiplication of the neutron chain except of the first neutrongeneration (i.e. neutrons produced by an external source particle) can be expressed as:
1+ k1+ k1 � k2+ k1 � k2 � k3+ : : :�
1
1� k fs
; (2)
where ki are multiplication factors of fission neutrons.For conformity with present definition of ke f f , Mext is the total number of neutrons produced in the system
from fission reactions per source neutron. Alternatively, M ext could be viewed as a total number of neutron bothfrom fissions and non-fission multiplicative reactions ((n,xn), (γ,n), etc.), which would consequently require aredefinition of ke f f and neutron generation as being per one multiplication.
By introducing k0, the physical model of a neutron chain propagation in the system can be conveniently sep-arated into the source and fission parts. Such decomposition of a neutron multiplication is a practical tool forscoping calculations while simulations of a whole neutron cascade are inevitable in order to determine the value ofthe source efficiency. For a system with a source multiplication of M ext= 25, corresponding to ks=1-1/Mext =0.96,about 45% of the power is released for neutron cascades longer than 1000 and 80% for cascades longer than100 [4].
The external source neutron multiplication for spallation is usually obtained in calculation codes per incidentparticle, e.g. proton, and appropriate renormalisation of results per source neutron is necessary. For this purpose,in our simulations, we introduce the multiplication parameter k p of a source particle, which is equal to the numberof neutrons per source particle (i.e. proton).
3-CALCULATION METHODOLOGY
The Monte Carlo code MCNPX [5] in coupled neutron, proton and photon mode with LA150 libraries was usedfor calculation of spallation neutron yields and subsequent particle transport. However, in the present versionof the LA150 library, only about 20 isotopes (e.g. lead, bismuth, iron and chromium) has been supplied withevaluated cross-section data with threshold energies up to 150 MeV. Up to now, no cross-section data for actinidesare available for high energy transport. Since the current version of the MCNPX code (2.1.5) does not supportconcurrent usage of data libraries with different energy thresholds, an external surface source was written on thetarget surface for subsequent simulations in MCNPX.
MCNP4C [6] code was used for eigenvalue calculations. Burnup calculations have been performed by MonteCarlo code MCB [7], integrating neutron transport simulations with in-flight calculations of reaction rates andnuclide density evolution.
-20 0 20 40
0.7
0.75
0.8
Axial position z [cm]
k0
(b)
-100 -50 0 50 100
z [cm]
φ(z)
30 cm
40 cm
20 cm
(a)
0
0.02
0.04
0.06
0.08
50 cm
60 cm
Figure 1: The axial distribution of normalized neutron flux exiting target of a given radius (a). The external sourcemultiplication factor k0 as a function of beam impact relative to the core center (b).
2

Fraction of neutrons fromtarget escaping into the
axial reflectors
Core height [m]
0.1
0.2
0.3
0.4
0.5
0.6
0.6 0.8 1.0 1.2 1.4 1.6 1.8 2.0
R=30 cm
R=40 cm
R=20 cm
R=50 cm
R=60 cm
Figure 2: The fraction of neutrons not directly entering the reactor core as function of active pin length. R is theradius of the spallation target.
4-SPALLATION TARGET
In these simulations, the target height was taken to be 3 m and a beam tube of 15 cm radius was adopted. A protonbeam having a Gaussian shape (beam radius of 7.5 cm) was assumed to impinge on top of the lead/bismuth target.The proton energy was set to 1 GeV, corresponding to the optimal neutron gain per source proton and energy unit.
4-1 Axial position relative to the reactor core
The optimal relative axial position of the spallation target beam impact was investigated in terms of minimizingleakage of neutrons to axial reflectors. Leaked neutrons have lower probability to enter the reactor core and,consequently, induce fission. The neutron leakage is minimized when the target surface is placed 17.6 cm abovethe core center for a radius of 20 cm, while for R = 50 cm, the optimal position is z = 19.7 cm, see Figure 1(a). Theslight shift of the optimal position can be attributed to enhanced diffusion of neutrons in the target material. Thecorresponding external neutron multiplication factor was evaluated for a realistic design of a sub-critical systemwith target radius of 25 cm [2] and is displayed on Figure 1(b).
Considering a typical active core length of 100 cm, about 8.5% of the neutrons leak outside the core (2.6% inthe forward, 5.9% in the backward direction), which is to be compared to the 25.6% in the case of target radius of50 cm (forward 10.8%, backward 14.8%). The total number of neutrons leaking out of the target without enteringthe core is showed in Figure 2. More than 95% of neutrons enters the core when the fuel pin length is larger than1.3 m, for the 50-cm target the corresponding figure is 2.1 m.
4-2 Radius
The spectrum of neutrons escaping the target has been determined for five different target radii. Results are dis-played in Figure 3 together with fission probabilities of even neutron number actinide nuclides. The probabilityto induce a fission for source neutrons sharply decreases with increasing target radius, in the range investigated.We note that a change of source neutron spectrum has the largest effect for fertile matrices 238U and 232Th, whileamericium, neptunium and plutonium fission thresholds are lower, at energies of 400-600 keV. Remembering thatfission neutrons are born with a median energy of 1.6 MeV, it is clear that the source efficiency may fall well bellowunity for targets of any reasonable sizes. The number weighted mean energy of the spectrum decreases by a factorof five for target radius increasing from 20 cm to 50 cm. Only 0.4% neutrons are above 20 MeV in the case of the50 cm target radius while, 3.2% in the case of 20 cm radius.
We conclude that a small target radius is favourable not only from the viewpoint of gaining fast neutron spectrabut also for minimizing neutron losses to the axial reflector, both effects yielding higher source efficiency.
3

0.01 0.05 0.1 0.5 1 2
0.01
0.05
0.1
0.5
1
0 0.5 1.0 1.5
Fraction of neutronswith energy aboveE (a)
Energy [MeV] Energy [MeV]
Fission probability (b)
Am241
Am243
U238
Th232
Pu242
0.2
0.4
0.6
0.8
1.0
30 cm
40 cm
20 cm
50 cm
60 cm
Figure 3: Energy spectra of neutrons exiting target (a) together with fission-to-absorption probabilities of evenneutron number actinides (b).
5-DESIGN CONSIDERATIONS
We embark reactor system investigations by revising our design of an accelerator-driven transuranium burneremploying burnable absorbers [2]. The design consisted of four zones containing 84 hexans, surrounded by a onerow of a steel reflector. Six central sub-assemblies were removed and replaced by a target module. The distributionof materials is given in Table 1.
Material TRUN UN B4C Tc P/D PinsZone 1 0.33 0.67 0.00 0.00 1.950 331Zone 2 0.38 0.42 0.00 0.20 1.785 397Zone 3 0.63 0.00 0.37 0.00 1.785 397Zone 4 0.80 0.00 0.20 0.00 1.785 397Average 0.60 0.18 0.18 0.04
Table 1: Distribution of fuel, boron carbide, and technetium given as relative volume fractions together with pinpitch-to-diameter ratios and total number pins in one sub-assembly of each fuel zone [2].
Boron carbide has been chosen for these simulations as a reference absorber material, mainly due to its rel-atively favourable burnability in the fast reactor spectrum, neutronics, thermal and irradiation stability. The 10Benrichment was taken to be 90% and the composition of the TRU vector was assumed as being that from LWRspent fuel discharges after a burnup of 41 GWd/tHM and 30 years of decay.
5-1 Refined core
First, the technetium was removed from zone 2, and the amount of uranium was adjusted in order to obtain a flatpower profile. Additionally, an appropriate choice of subcriticality at BOL (k e f f = 0.96) was made to accom-modate the maximum reactivity increase associated with lead-bismuth coolant voiding followed by fuel nitridedecomposition [8].
5-2 Improving core design
In order to improve source efficiency, according to the above findings, we start by decreasing the target radius from25 to 19.6 cm. Consequently, power of the system was decreased to 800 MW th in order to assure the removal ofdissipated heat in the target. The basic core characteristics for this improved design are summarized in Table 2.
While in the former design concept all transuranics were loaded homogeneously into the whole core, wenow remove all the minor actinides from the vicinity of target and place them only in sub-assemblies containingburnable absorbers. The core now consists of three distinctive zones: the source multiplication zone ensuring
4

Core power (MWth) 800Cycle length (days) 300k-eigenvalue at BOL 0.96Target radius (cm) 19.6Target wall thickness (cm) 0.5
Fuel (U,TRU)N + ZrNPellet density (% TD) 0.85Coolant and target material Pb/BiMaximum coolant velocity (m.s�1) 2.5Structural material Fe/Cr-steel
Pin designActive pin length (cm) 100Pellet inner radius (mm) 1.00Pellet outer radius (mm) 2.40Clad inner radius (mm) 2.49Clad outer radius (mm) 2.94Smear density (% TD) 0.67
Sub-assembly designOuter flat-to-flat (cm) 17.12Duct wall thickness (cm) 0.25Sub-assembly pitch (cm) 17.32
Table 2: Parameters of the core design improved with respect to source efficiency.
effective multiplication of spallation neutrons, the transmutation zone where all minor actinides are placed andouter driver supplying neutrons to heavy poisoned transmutation zones. In the multiplication zones the 238UN ismixed together with plutonium nitride in order to compensate for burnup of fissile plutonium isotopes. Use of ZrNas inert support in the multiplication zones would be preferable from a viewpoint of the source efficiency [3], butincreasing losses of source neutrons during burnup makes its application unfavourable in the vicinity of the target.However, ZrN still remains a viable option for a reactor with high minor actinide content (> 30%) fuels, as e.g. inJAERI ADS design [9]. The boron carbide pins are placed in transmutation zone assemblies together with minoractinides and plutonium. The outer fuel zones are loaded by plutonium fuel, alternatively mixed with zirconiumnitride in order to compensate for high Pu reactivity and limits to pin linear ratings.
Parameters Unit Refined ref. [2] P/D = 1.883 - UOX P/D = 1.883 - MOX P/D = 2.448Power MWth 1200 800 800 800ke f f 0.960 0.960 0.961 0.961k0 0.82 0.91 0.91 0.77kp 32.2 31.5 30.9 31.7φ� 0.88 1.12 1.05 0.72Reactivity loss pcm/cycle 5600 7000 6800 4300Beam current increase 3.5 3.0 2.6 2.0S/A (multipl/transm/driver) 12/72/0 30/66/20 30/66/20 54/126/74Average linear power kW/m 47.5 40.4 40.4 26.3Uranium content % U/TRU 22.4 22.0 19.2 16.3Fissile inventory kg 4302 3227 3227 4862Absorber inventory kg 306 224 224 236
Table 3: Data and performance characteristics of individual core design options.
5-3 Pin pitch impact
In this study, the source efficiency is studied for geometries with high coolant fractions (pin-to-diameter ratiohigher than two) required to mitigate beam power transients [10]. For this purpose, two reactor configuration with
5

Zone 1 2 3 4 5 6 7 8 9 10 11 12Fuel pins 61 61 61 61 26 26 27 28 29 29 37 37B4C pins 0 0 0 11 11 11 10 9 8 8 0 0Pin P/D 1.83 1.83 1.83 2.33 2.33 2.33 2.33 2.33 2.33 2.33 2.33 2.33
Table 4: Sub-assembly design parameters yielding a radial power peaking less than 1.25 at BOL; at BOL powerpeaks at the outer part of the core (zone 12) and shifts during burnup toward the core center.
P/D=1.883 and 2.448 were set up. A summary results of these studies is given in Table 3 together with parametersof the revised original design. In all cases, the plutonium fraction in the TRU vector was taken to be 82.5%, whichis the plutonium share in TRU vector of aged spent LWR UOX fuel after 30 years of cooling. At the same time,the distribution of fuel, BA and diluents was adjusted in order to achieve a flat power profile (radial power peakingfactor < 1.2). For P/D = 1.883, a plutonium vector corresponding to aged, once-recycled spent MOX fuel (averageburnup of 43 GWd/tHM, 30 y decay) was alternatively supplied into the multiplication zone.
It appeared that for pin pitches equal to 1.883 a source efficiency higher than unity can be obtained. On theother hand, even though the amount of boron carbide fissile inventory is actually lower for a P/D=2.448 coredesign the source efficiency drops to 0.7-0.8 due to neutron slowing down in the coolant. With respect to thesource efficiency, high 240Pu content fuels appear to be more favourable due to the breeding of highly reactive241Pu from 240Pu. In this case, source efficiency remains constant during burnup, reducing thus in comparison todesigns with UOX plutonium vector accelerator margin needed in one irradiation batch.
5-4 Final core design
These results suggest to apply a “reverse strategy” of the reactor lattice design and set up smaller pitches in themultiplication zones while larger in transmutation zones and driver. As the AmN (decomposition temperature> 1573 K) was removed from the multiplication zones, small pitches would not immediately result in the fueldecomposition in the case of accidents (especially transient of beam power).
For the final core design, the flat-to-flat (FTF) of the core sub-assembly was further decreased to 9.72 cm,allowing thus a finer distribution of fuel and burnable absorbers in the core. Further decrease of the duct FTF ishowever not meaningful as this would lead to an excessive fraction of construction material in the core. The outerradius of the target is kept at 19.6 cm and the core now consists of 12 zones, see Figure 4. The distribution ofthe fuel pins and BA is further summarized in Table 4. The three innermost zones are fuelled with uranium andplutonium, 238U content ranging from 80% to 60% in zone 1-3, and Pu vector being as that of high burnup MOXfuel. The volume fraction of boron carbide in transmutation zones (3-10) is kept at 25-30%, yielding fission-to-absoption probabilities of 241Am equal to 0.25, still a factor of two higher than for typical moderated designs.The amount of MA in TRU pins is kept under 30% as pins with larger MA fractions may start to be difficult tofabricate. Driver zones contain high reactive plutonium fuel mixed with 15-20% of zirconium nitride in order tomitigate high power peakings.
The system features favourable safety characteristics. Coolant void worth (upon voiding the core and upperplenum from coolant) is negative, -1500 pcm. An average fuel burnup of 12.4% is reached during 600 efpd (4 x150 days). The associated burn-up reactivity swing can be managed by a 70% increase in source intensity. Sucha beam margin can be safely accommodated by the core, providing sufficient time for passive safety devices orsystem operator to respond.
The source efficiency of this core design is equal to 0.71 which is comparable to the design with P/D=2.448.The source efficiency is mutually interconnected with power peaking in the target vicinity, and thus this rather lowvalue can be attributed to the “power swing” behaviour.
6-CONCLUSIONS
Small target radii are desirable in order to minimize slowing down of neutrons in spallation targets and their leakageinto axial reflectors. Thus, multiple target concepts as those envisioned by FZK [11] are profitable not only froma point of view of better power and flux distribution characteristics but also better utilisation of source neutrons.However, the technological feasibility of such a design still remain to be assessed. The source efficiency can befurther improved by optimisation of active fissile column length with respect to the target radius [12].
6

Figure 4: Core map of the conceptual design.
ACKNOWLEDGMENTS
The authors acknowledge the support of the Swedish Institute and Swedish Fuel and Waste Management BoardLtd. (SKB).
REFERENCES
[1] - M. DELPECH, et al., “The Am and Cm transmutation - physics and feasibility”, In International Conferenceon Future nuclear systems, GLOBAL 99, ANS, Jackson Hole 1999
[2] - J. WALLENIUS, et al., “Application of burnable absorbers in an accelerator driven system”, Nuclear Scienceand Engineering, 96, 137(2001)
[3] - K. TUCEK, et al., “Optimal distribution of fuel, poisons and diluents in sub-critical cores dedicated to wastetransmutation”, In International Conference on Emerging Nuclear Energy Systems, ICENES 2000, NRG, Petten2000
[4] - S. ATZENI, et al., “Statistical fluctuations in Montecarlo simulations of a subcritical system”, CERN-LHC-97-12(EET), CERN 1997
[5] - M.B. CHADWICK, et al., “Cross-section evaluations to 150 MeV for accelerator driven systems and imple-mentation in MCNPX”, Nuclear Science and Engineering, 293, 131(1999)
[6] - J.F. BRIESMEISTER, ed., “MCNP - A General Monte Carlo N-Particle Transport Code - Version 4C”,LA-13709-M, LANL, 2000
[7] - J. CETNAR, et al., “Transmutation calculations with Monte Carlo continuous energy burnup system MCB”In Actinide and Fission Product Partitioning and Transmutation, Proceedings of the 5th International InformationExchange Meeting, OECD/NEA, MOL 1998
[8] - J. WALLENIUS, et al., “Safety analysis of nitride fuels in cores dedicated to waste transmutation”, In Actinideand Fission Product Partitioning and Transmutation, Proceedings of the 6th International Information ExchangeMeeting, OECD/NEA, Madrid 2000
7

[9] - T. TAKIZUKA, et al., “Studies on accelerator driven transmutation systems”, In Actinide and Fission ProductPartitioning and Transmutation, Proceedings of the 5th International Information Exchange Meeting, OECD/NEA,Mol 1998
[10] - M. ERIKSSON, et al., “Preliminary safety analysis of a Swedish accelerator driven system employing nitridefuel and burnable absorbers”, IAEA Technical Committee Meeting on Core Physics and Engineering Aspects ofEmerging Nuclear Energy Systems for Energy Generation and Transmutation, Argonne, 28 Nov-1 Dec, 2000
[11] - J.U. KNEBEL, and G. HEUSENER, “Research on transmutation and accelerator-driven systems at theForschungszentrum Karlsruhe”, Internationale Zeitschrift für Kernenergie atw Jg., Heft 6, June 2000
[12] - G. GHERARDI, et al., “Study of neutron multiplication in accelerator-driven reactor system”, In ThirdInternational Conference on Accelerator Driven Transmutation Technologies and Applications, Praha 1999
8

APPENDIX XV H. Condé, J. Blomgren, W. Gudowski, J.-O. Liljenzin, C. Mileikowsky, N. Olsson, and J. Wallenius, “Swedish Expert Group on Transmutation”, Proc. Accelerator Applications 2001 and ADTTA 2001 “Nuclear Applications in the New Millennium”, Reno (USA). ANS (2001)

Swedish Expert Group on Transmutation
H. Condé*, J. Blomgren*, W. Gudowski**, J.-O. Liljenzin***, C. Mileikowsky****, N. Olsson*, and J. Wallenius**
* Dept. of Neutron Research, Uppsala University, Box 520, SE-751 25 Uppsala ** Dept. of Neutron and Reactor Physics, Royal Institute of Technology, SE-100 44 Stockholm *** Dept. of Nuclear Chemistry, Chalmers University of Technology, SE-412 96 Göteborg **** Avenue de Rochettaz 14A, 1009 Pully, Switzerland
Abstract An informal expert group on transmutation of nuclear waste was formed a few years ago in Sweden. The Group is a forum for discussion of Swedish national research and cooperation in international research in the field. The Group has members from the Chalmers Technical University, the Royal Technical Institute and the Uppsala University with Observers from the Ministry of Environment, Swedish Nuclear Power Inspectorate (SKI) and the Swedish Nuclear Fuel and Waste Management Co (SKB). Mostly basic research on partitioning, reactor and neutron physics, and material research is made at the named Universities with financial support from SKB and by participating in P&T projects within the European research framework programs. The Group has actively participated in discussions with Russian laboratories about applications for research on transmutation to the International Scientific and Technical Centre (ISTC) in Moscow. In particular, a 1 MW Pb/Bi neutron spallation source has been designed and manufactured at IPPE, Obninsk with ISTC financial support by Sweden, USA and the European Union. Introduction Sweden has today 11 nuclear power reactors in operation. Until recently it was twelve reactors but one was shut down as a first step to move out of nuclear energy until about 2010. The nuclear reactors produce 40-50 percent of the electric power consumption in Sweden. The other 50 percent is mainly produced by hydro power. The nuclear power reactors in Sweden will up till 2010 produce about 8000 tons of spent nuclear fuel. According to the Swedish Act on Nuclear Activities, the companies licensed to operate nuclear power plants have full responsibility for safely managing all nuclear production waste and for waste resulting from the dismantling of the facility. The financing system is based on a fee charged per generated kilowatt hour of electricity and is paid to the government. There is a specific law – the Act on the Financing of Future Expenses for Spent Nuclear Fuel etc. – regulating the way in which the expenses are calculated and how they should be met. The total estimated cost for the Swedish program for managing all nuclear waste and for dismantling nuclear power plants are about SEK 50 billion ($ 10 billion). The nuclear power utilities have formed a jointly owned company, the Swedish Nuclear Fuel and Waste Management Company (SKB AB) to fulfil the obligations of the power utilities regarding nuclear waste. The research and development (R&D) for waste management is carried out by SKB AB. The R&D program is evaluated each third year by governmental institutions (Swedish Nuclear Power Inspectorate (SKI) and Swedish Radiation Protection Institute (SSI)) followed by a final decision taken by the government.

The present Swedish program for managing nuclear waste contains the following steps. The spent nuclear fuel is shipped to an interim storage (CLAB) for a 40 years cooling down period. Subsequently, the spent fuel will be put in a deep geological repository. The government has accepted, as the main alternative, that the spent fuel will be encapsulated in canisters of steel and copper, which are placed in crystalline bedrock, at a depth of 500 meters, surrounded by highly absorbent clay in the repository. A demonstration repository will be built. When 5-10 percent of the spent fuel has been lowered in the repository, an evaluation of the method will be made and a definite decision will be taken by the government if the rest of the spent fuel can continue to be deposited in the repository. As one of the alternative options to the direct deposition of the total nuclear waste in a repository, the government has asked the SKB AB to study partitioning and transmutation (P&T) of the nuclear waste in combination with geological deposition of the remaining waste. This request has resulted in a limited support on P&T research from SKB to three different universities in Sweden, the Chalmers University of Technology, the Royal Institute of Technology and the Uppsala University. Furthermore, the same university research groups are also actively taking part in P&T research projects within the European 5th framework program. An informal expert group on P&T with members from the above mentioned university research groups was formed in the early 90-ties to establish a forum for discussions on research strategies, means to find support for doing research, research coordinating and collaboration, and information exchange. One early activity of the expert group was to consult Russian nuclear weapon experts in their ambition to apply for support of civilian research projects on transmutation from the International Scientific and Technical Centre (ISTC) in Moscow. The ISTC was set up by the USA, Russia, Japan and the European Union to support civilian research activities at the weapons laboratories in the former Soviet Union. Sweden contributed directly to the ISTC fund when it was set up, but since Sweden became a member of the European Union the contribution is channelled through this organisation. The present report gives the background, the members and the agenda for the Expert Group on Transmutation. It also shortly describes the P&T research in progress by the university groups, which are represented in the Expert Group, including the ongoing ISTC projects with Swedish involvement. The Swedish Expert Group on Transmutation A renewed interest of partitioning and transmutation of nuclear waste was raised in the early 90-ties mainly due to the technical developments of large accelerators, which made the accelerator driven transmutation concepts more likely to be realized. This interest initiated basic research on partitioning and accelerator driven transmutation at a few Swedish universities namely at the Chalmers University of Technology (partitioning), the Royal Institute of Technology (reactor physics) and the Uppsala University (nuclear data). An informal group was formed with members representing the research groups of the named three universities. At the early 90-ties the International Scientific and Technical Centre (ISTC) was set up in Moscow as a joined undertaking of US, Japan, Russia and the European Union as reported above. The aim was to financially support civilian projects at nuclear weapon laboratories in the former Soviet Union. Sweden joined this effort by contributing to the ISTC fund, first

directly and later, when Sweden became a member of EU, through that organisation. Accelerator driven transmutation was a civilian research area to which the Russian experts could give an important contribution. Thus, discussions started about transmutation research projects that could be made in Russia with support from ISTC. A workshop was arranged at Saltsjöbaden in Sweden in 1991 with participation mainly from US, Russia and Sweden. Following that meeting a number of ISTC funded projects in Russia has been initiated through the years with Swedish collaboration. The Expert Group was charged to report on those projects to the Swedish Nuclear Power Inspectorate (SKI) and subsequently got financial support for travelling expenditures to fulfil that task from the same organisation. Nowadays, an international Contact Expert Group (CEG) has been established to advice the ISTC on which projects related to the research on accelerator driven systems should be supported. The CEG works with subgroups, one for each supporting partner to ISTC, namely US, Japan, EU and Korea. The Swedish Expert Group has close links to the EU subgroup within CEG and channel its recommendations on ISTC projects through that body. The international R&D on transmutation is closely followed. The university research groups participate in international P&T research projects mainly within the EU framework programs and collaborate in ISTC projects. Members of the Expert Group are actively engaged in international working groups, advisory committees, and project steering committees. The Group is arranging conferences, symposia and expert meetings on ADS among those were the 2nd International ADTT Conference in Kalmar, Sweden in 1996. The present members of the Swedish Expert Group, which are the named authors of this report, represent a broad know-how in scientific disciplines of importance for R&D of accelerator driven systems. Observers at the regular meetings of the Group, about 4 per year, come from the Ministry of Environment, the Nuclear Power Inspectorate (SKI), and the Nuclear Fuel and Waste Management Co (SKB). Swedish Research on partitioning and transmutation The remarkable increase in the international research and development on transmutation has taken place during the last few years. This is in particular true for many of the countries within EU. A European road-map for producing an ADS demonstration facility within about the next decade has been produced by a working-group with members from 9 European countries among them Sweden. EU has given a strong support to practical demonstrations of the key issues according to the road-map like the spallation target experiment MEGAPIE at the cyclotron of the Paul Scherrer Institute, Switzerland and the preliminary design study of an demonstration accelerator driven system (PDS-XADS) but also to several basic studies of a wide range of technical and scientific problems for partitioning and transmutation. Chalmers University of Technology
The Department of Nuclear Chemistry, CTH participates in the project PARTNEW within the EU 5th framework programme. The project is a continuation of NEWPART (4th EU FP) to study the extraction of lathanides and actinides using pyridins or similar nitrogen-based molecules. The work to be carried out concerns the design of solvent extraction processes of Am(III) and Cm(III) that are contained within the aqcidic high active raffinates (HARs) or concentrates (HACs) from the reprocessing of spent

nuclear fuels. The work to be done is sorted out in eight Work Packages WPs) corresponding to 3 research domains:
* the actinides (III) (AN(III)) + lanthanides (III) (LN(III)) co-extraction from acidic HARs or HACs (DIAMEX processes)
* the An(III)/Ln(III) group separation from acidic feeds (SANEX processes)
* the Am(III)/Cm(III) separation system
For each domain, basic research and limited flowsheet developments will be carried out.
Royal Institute of Technology
The Department of Neutron and Reactor Physics at the Royal Institute of Technology, Stockholm participates in a number of projects under the 5th Framework Programme of the European Commission. The group coordinates the CONFIRM project aiming to manufacture and test nitride fuel. Irradiaton tests will be made at the R2 reactor at Studsvik. The group also participates in the SPIRE and MUSE projects, in which studies are made of radiation damage effects in martensitic steels and of the coupling between an accelerator driven neutron source and the subcritical assembly MASURCA in CEA/Cadarache, respectively.
The aspects of severe accidents in transmutation systems have been studied together with a group at the EURATOM Joint Research Centre at ISPRA, Italy. Furthermore, the use of Pb-Bi eutectic as the coolant of an accelerator driven system has been studied together with a group at the Technical University, Bilbao, Spain. Extended studies have been made of a Pb/Bi cooled ADS concept (Sing-Sing) for transmutation of the nuclear waste from the Swedish reactors.
Uppsala University
The transmutation related research at Uppsala University is mainly performed by the Department of Neutron Research and makes use of the unique 20-180 MeV quasi-monoenergetic neutron beam at the The Svedberg Laboratory in Uppsala.
Since 1998 a project is run, with the aim to measure elastic neutron scattering from some nuclei at 100 MeV. Such data are crucial to improve existing nuclear models, and in this way improve the existing data libraries and extend them to higher energy. These libraries are needed to reliably calculate neutron and other particle transport in a transmutation target and blanket. The differential elastic scattering cross sections for carbon and lead have been measured using the detector facility, SCANDAL.
The group also participates in an EU supported project HINDAS. Within HINDAS, all kinds of reaction channels for incident neutrons and protons are considered, both experimentally and theoretically. The ultimate goal is to construct a new data library for the energy range 20-2000 MeV, which can be used for engineering design of

transmutation devices. Several of the European experimental groups use the Uppsala neutron beam for their work. Studies linked to the HINDAS project are also made of nuclear models and code developments for ADS at the Department of Radiation Sciences.
ISTC projects Short information is given on a few ISTC research projects in progress related to ADS of special Swedish interest due to initiative in formulating the project and/or close cooperation with Swedish research groups. A general recommendation has been given by the officials of the European Commission who are responsible for the ADS research within the framework programs, that one should seek close links between corresponding EU and ISTC projects. Measurements and comparison of proton- and neutron-induced fission cross section of Lead and neighbouring nuclei in the 20-200 MeV energy region (ISTC project #1309) Project leader: Vilen P. Eismont, V.G. Khlopin Radium Institute, S:t Petersburg
Proton- and neutron-induced fission cross sections of isotopes and elements in the lead region are being measured. The neutron experiments are made at the neutron beam facility of the 200 MeV cyclotron of the The Svedberg Laboratory,.Uppsala in collaboration with the Department of Neutron Research, Uppsala University. The produced database is partly unique and will put light on existing discrepancies between model calculations and experiments. A follow-up project on measurements of proton- and neutron-induced fission cross sections of separated tungsten isotopes and natural tungsten in 50-200 MeV energy region is planned
Pilot flow lead-bismouth target of 1 MWt for accelerator-based systems (ISTC project # 559) Project leader: Boris F. Gromov, Institute of Physics and Power Engineering (IPPE), Obninsk
The Expert Group took originally the initiative to this project, which was supported by Sweden but also became strongly supported by USA and EU.
The purpose of the project was to develop a heavy metal flow target which possesses the best features for producing neutrons at a high power proton accelerator. Thus, the technical key problems of a flowing lead-bismuth 20 MWth-power target should be investigated. The technical base should be established by the design of a pilot lead-bismuth 1 MWth-power target (TC-1). It was planned that the pilot target was going to be tested at the linear proton accelerator (LANSCE, 800 MeV, 1.5 mA proton beam) of the Los Alamos National Laboratory.
The project benefited from the broad experience of specialists at IPPE and RDB "Gidropress", whose experience was developed by designing and operating the Russian nuclear submarines with lead-bismuth cooled reactors. The target design was a result of a close cooperation primarily between IPPE and LANL but was also discussed at several technical meetings with the participants from Sweden (Swedish collaborator: Department of Neutron and Reactor Physics, Royal Institute of Technology, Stockholm) and France (EU collaborator: CEA/Cadarache).

The target past the final delivering tests and was accepted by the Los Alamos National Laboratory, the CEA/Cadarache and the Royal Institute of Technology in the Spring of 2001. The Russian Authorities (MINATOM) has given clearance for exportation of the target. Decisions are still pending on the site for an irradiation test and the financing of that test if any.
Experimental Research of Transmutation of Fission Products and Minor Actinides in a Subcritical System Driven by a Neutron Generator. (ISTC project B-70, Belarus) Project leader: S. E. Chigrinov, Radiation Physics & Chemistry Institute, Minsk-Sosny
The Yalina facility consists of an accelerator driven 14 MeV neutron source surrounded by a sub-critical blanket. The planned experiments will yield information in the following fields.:
• physics of sub-critical systems driven by a neutron generator, • transmutation rates of fission products and minor actinides, • spatial kinetics of sub-critical systems with external neutron sources • experimental techniques for sub-criticality monitoring • dynamical characteristics of sub-critical systems with an external neutron source (pulse mode operation of the neutron generator)
The Department of Neutron and Reactor Physics at the Royal Institute of Technology contributes to the project with the development of computer codes for simulation of the neutronics of the facility.
Experimental Mock-up of Molten Salt Loop of Accelerator-Based Facility for Transmutation of Radioactive Waste and Conversion of Military Plutonium (ISTC project # 1606) Project Manager: K. F. Grebyonkin, Russian Federal Nuclear Centre – Institute of Technical Physics (VNIITF), Snezhinsk, Chelyabinsk reg. Project Scientific Leader: V. V. Ignatiev, Kurchatov Research Centre, Moscow
The mission of the project is to perform an integral reevaluation of the Molten Salt (MS) Nuclear Fuel Technology potential as applied to safe, low-waste and proliferation resistant treatment of RadWaste and Plutonium management as well as to develop a comprehensive program plan of the Technology commercialisation.
Members of the Swedish Expert Group were actively engaged in the planning of the ISTC project #1606. The Department of Nuclear Chemistry, Chalmers University of Technology and the Department of Neutron and Reactor Physics, Royal Institute of Technology will both be project collaborators. Furthermore, a close link will be established with the 5th European Framework project on Molten Salt Reactors (MOST) with 12 participating European institutes.
Combined radiochemical and activation analysis of long-lived nuclear waste transmutation in fast reactors and high energy accelerators (ISTC project # 1372)
Project manager: E. Ya. Smetanin, Institute of Physics and Power Engineering (IPPE), Obninsk
The project will include radiochemical analysis and activation measurements of the isotopic composition changes of minor actinide samples irradiated in fast reactors and by the radiation field from a massive lead spallation neutron source. Comparative analysis of the radioactive isotope transmutation efficiency in fast neutron reactors and accelerator driven systems. The Department of Neutron and Reactor Physics, Royal Institute of Technology will be the Swedish collaborator of the project.
Experimental and theoretical studies of the yields of residual product nuclei produced in thin Pb and Bi targets irradiated by 40-2600 MeV protons (ISTC project #2002) Project manager: Yu. E. Titarenko, Institute of Theoretical and Experimental Physics, (ITEP), Moscow
The project is aimed at experimental and theoretical studies of the independent and cumulative yields of residual product nuclei in high energy proton irradiation of thin targets of highly enriched isotopes and natural Pb and natural Bi. Information exchange will be made with similar projects in progress at Univ. of Hannover and GSI, Darmstadt within the 5th EU Framework program HINDAS.
Preliminary contacts have been taken between ITEP and the Department of Neutron Research, Uppsala University to see if some of the experiments within the project can be made at the accelerator facilities of the The Svedberg Laboratory in Uppsala.
The subcritical Assembly in Dubna (SAD) The planning of the "Subcritical Assembly in Dubna – SAD – project" is in a final
stage with participation of the Department of Neutron and Reactor Physics, Royal Institute of Technology (RIT). The project goals are: to design and construct a small power subcritical system fueled with MOX and driven by the 660 MeV cyclotron, development and validation of techniques for measurements of subcriticality and neutronic properties of the assembly, validation of relevant computer codes and data libraries, dosimetry of high energy neutrons (above 20 MeV) Project is scheduled for 3 years and will use existing infrastructure of institutes in Dubna. A pre-ISTC project is discussed with financial support from ForschungsZentrum Karlsruhe, CIEMAT Madrid, RIT Stockholm, and CEA Cadarache.
Summary A direct disposal of the total spent reactor fuel in a deep geological repository after a cooling period of about 40 years is the option with highest priority of treating the Swedish reactor waste. A limited research effort is devoted to partitioning and transmutation of the waste mainly to keep track of the international R&D in the field if that should pave the road to transmutation concepts which would be technical and economical applicable for the Swedish reactor waste within a foreseeable future.

An informal Expert Group on P&T with members from three universities in Sweden has been formed to establish a forum for discussions on research strategies, means to find support for doing research, research coordinating and collaboration, and information exchange. The university research groups actively participate in many of the research projects on P&T within the on-going 5th EU Framework Program but also collaborate with transmutation research projects in Russia financed by ISTC.

APPENDIX XVI S. Barashenkov, S. Buttsev, S. Chigmnov, S. Dudarev, W. Gudowski et al. ”Fast Sub-Critical Assembly with MOX Fuel for Research on Nuclear Waste Transmutation” , Academy of Sciences of Belarus, 2001.

BECIJI HAI_l[bUIHA.JIbHAn A M B M I I HABYK EETlApYCI NG 3 2001 CEPbIH OI3IKA-T3XHIUHbIX HABYK
YAK 539.1
I? S. BARASHENKOYJ K S. BUTTSEK S. E. CHIGMNOV, S. Ju. DUDAREV, W: GUDOWSKI, H. I. KIYAVITSKAYA,
A. POLANSKI, I. K PUZYNIN, I. L. RAKHNO, A. N. SISSAKIAN
ON NUCLEAR WASTE TRANSMUTATION FAST SUB-CRITICAL ASSEMBLY WITH MOX FUEL FOR RESEARCH
The paper deals with theoretical investigation of transmutation rates for a number of long-lived fission products and minor actinides as well as with neutron spectra formed in a sub-critical assembly driven with the following monodirectional beams: (i) 660 MeV protons; (ii) 14 MeV neutrons. The assembly consists of a central cylindrical lead target surrounded with a cylindrical layer of mixed- oxide (MOX) fuel. As the first step in the studies of characteristics of ADS the <<Plutonu project was proposed [ 1-51 based on metallic weapon-grade plutonium fuel. But the results of the calculations have shown [6, 71 that MOX fuel (25%Puo2 + 75%uo2) is better than metallic plutonium for this sub-critical assembly. Present conceptual design of the. sub-critical assembly in Dubna (SAD) is based on the core with a nominal unit capacity of 15 kW (thermal). This corresponds to the multi- plication coefficient = 0.945 and the accelerator beam power of 0.5 kW. The blanket based on MOX fuel of BN-600 type of the Russian manufacture will be used with average density of fuel 8.64 g/cm3. Content of 239Pu in Pu02 is not less than 93%. Uranium in oxide is natural one. The fuel is placed in a stainless steel vessel. In addition beryllium and lead reflectors will be used in radial and longitudinal direction respectively. A concrete shielding surrounds the blanket. The proton beam will be transported horizontally to the target through a vacuum track provided inside the concrete shielding. The experimental electronuclear installation will include: 660 MeV proton accelerator, beam bending magnets, spallation target with different materials (Pb, W, Pb-Bi, Hg), subcritical blanket based on BN-600 type fuel elements, beryllium reflectors, concrete shielding, protective control and measuring systems.
The installation will be placed in an experimental hall of the accelerator surrounded with a concrete wall with thickness not less than 2 m. The hall of the accelerator is equipped with special ventilation system with the control of radioactive aerosols. For transportation of the extracted beam of protons to blanket the transportation line will be created. To measure the spectra of the neutrons leaving the sub-critical assembly, we propose to use a spectrometric method of neutron slowing down time in a block of lead.
Main parameters of the ADS facility are given in table 1. The CASCADE, LAHET and MCNP computer codes [8- 101 have been used for the calculations.
T a b 1 e 1 . Main parameters of the ADS facility with the lead target
.
Value I Charackrisric I Proton beam energy Beam power kerr Energetic gain Fission power Core length of a fuel element Core diameter (with Be reflector)
660 MeV 0.5 kW 0.945 30
15 kW 30 cm 80 cm
In this work our main objective is comparison of neutron spectrum in the MOX assembly for different external driving sources: 660 MeV proton accelerator and 14 MeV neutron generator. It is well known that in high energy region (several GeV/A) nuclear reactions are described in the frame of three-stage mechanism including cascade, pre-equilibrium and equilibrium stages. Energy distri- butions of secondary particles formed in nuclear reactions in this region depend weakly on projectile type and energy, mass number of target nucleus, and angle of emitting. It is possible to extract pre-
150

n c 1
m
E 0 W
J- . ..
I
Neutron Energy (eV) . Calculated neutron spectra averaged over small volumes (1 cm3) m n g e d along radius of the subcritical assembly with kf = 0.95,
used. Normalization was performed per 1 pA proton current (a ) and per one incident neutron per second (6) I irradiated with monodirectional proton ( a ) and neutron (b ) beams. Computer codes LAHEP, MCNP'O and SONET'* were ~
equilibrium and equilibrium stages in nuclear reactions induced by 14 MeV neutrons as well. In this case energy distributions of secondary particles are similar to that observed for high energy projec- tiles. When considering thick heavy metal targets one should take into account slowing-down of par- ticles and fission of nuclei in wide energy region. It was shown [ I l l that energy distributions of es- caped neutrons for such targets bombarded with high- energy protons and 14 MeV neutrons are the same. It gives principal possibility to investigate different characteristics of accelerator driven sub- critical systems by means of low energy accelerators and neutron generators.
In figure calculated neutron spectra averaged over small volumes arranged along radius of the sub-critical assembly are presented. The three volumes are sitbated inside core of the assembly in its middle (along Z-axis) cross-section. Several conclusions follow from the presented results:(i) neutron spectra inside the core are the same disregarding whether projectiles are relativistic protons or low energy neutrons; (ii) different neutron spectra can be formed inside the assembly - from hard up to almost thermal ones; (iii),neutron fluences about 10l2 cm-2.s-1 can be obtained inside the core; (iv)
' neutron spectra calculated by means of the computer codes LAHET and SONET [ 121 are similar not only qualitatively but quantitatively also.
.
I
1 151

To describe quantitatively the scaling between protons and neutrons as projectiles different calculated reaction rates are presented in table 2. One can see from it that the average scaling factor equals to 6.6 with local deviations being equal approximately to calculated statistical uncertainty (2σ) This value can be easily understood when taking into account number of neutrons generated in- the lead target by a 660 MeV proton (r12) as well as reaction (n, 2n) for a 14 MeV neutron incident on the target.
T a b 1 e 2. Calculated reaction rates for two positions inside the sub-critical assembly irradiated with proton (a) and neutron (6) beams. Computer codes SONET and MCNP were used. Normalizationwas performed per
one target nucleus and per one incident particle per second
R = 3 0 c m Reaction Rate
(10-24 s-1)
99Tc(n, y)'ooTc 1291(n, y)130~
'35Cs(n, y)'36Cs '37Cs(n, y)'38Cs
241Am(n, y)242Am 243Am( n, y)2%bl
23"P(n, n 24'Am(n, j) *43Am(n, j)
237Np(n, y)238Np 2.4.10'" 2.9.1 O-'** 3.8.10-'** 9.7.1 0-2 8.5 6.7 *lo-*
2.0* 1.2
6.0. lo-' 6.0-1 0-3 10.2 31.6 9.0*
1.2.10-2 1.8 -lo-' 1.9 -10-2
Tn = 14 MeV
R = 6 c m I R- 3 0 c m
3.2-10-2' 6.1 * 1 Oe2** 6.5.1 0-2** 1.4. 1.3.1 O-* 1 .o. 10-2
2.9.10'" 1.6.10-1 8.5.1 0-2 9.4.1 0-4 1.5 4.5 1.5*
1.9. 2.7.1 0-2 3.0-
I (Reaction Rate)d(Reaction Rate),, R = 3 0 c m
6.7 7.0 7.1 6.4 7.0 7.0 5.9 6.3 6.8 6.2
.
Note: Statistical uncertainties (la) for most of the values in the table do not exceed 5%. *) Statistical uncertainty is within the range 5-10%. **I Statistical uncertainty is within the range 20-30%.
Another interesting conclusion from the table 2 is that for the considered actinides the transmutation rates due to reactions (n, y) significantly exceed these due to fission reactions even for the hard spectrum observed near boundary between the lead target and the core.
In conclusion one can state that such an assembly fuelled with commerciaUy available MOX fuel enables us to investigate nuclear waste transmutation in dicerent neutron spectra by means of the currently available proton accelerator and neutron generator.
Summary
The paper deals with theoretical investigation of transmutation rates for a number of long-lived frssion products and minor actinides as well as with neutron spectra formed in a sub-critical assembly driven with the following monodirectional beams: (i) 660 MeV protons; (ii) 14 MeV neutrons. In this work the main objective is the comparison of neutron spectrum in the MOX assembly for different external driving sources: 660 MeV proton accelerator and 14 MeV neutron generator. The SAD project (JINR, Russia) has being discussed. In the frame of this project a sub-critical assembly consisting of cylindrical lead target surrounded by cylindrical MOX he1 layer will be constructed. Present conceptual design of the sub-critical assembly is based on the core with a nominal unit capacity of 15 kW (thermal). This corresponds to the multiplication coefficient kc = 0.945 and the accelerator beam power of 0.5 kW. The results of theoretical investigations on a possibility to incinerate long-lived fission products and minor actinides in fast neutron spectrum, formation of neutron spectra with different hardness in sub-critical systems based on the MOX subcritical assembly are discussed.
.
References
L B a r a s h e n k o v V.S., P o l a n s k i k , S o s n i n AN.//Kerntechnik. 1998.Vol.63,N4. P. 197.
2. B a r a s h e n k o v V. S., C e t n a r J., D o m a n s k a G. etal.//Conf.onNuclearEnergyin Central Europe '98. Terme Catez, Slovenia, 7-10 Sept., 1998. P. 67.
3 . B a r a s h e n k o v V . S , . P o l a n s k i A, P u z y n i n I.V., S i s s a k i a n k N . / / P r o c . o f 3d Int. Cod. on Accelerator Driven Transmutation Technologies and Applications. Prague, Czech Republic (CD-ROM edition). June 7-1 1, 1999.
4 . A r k h i p o v A.V., B a r a s h e n k o v V. S., B u t t s e v V. S. etal.//Proc.ofInt. Conf'.Ex- perimental Nuclear Physics in Europe (ENPE 99). Seville, Spain. June 21-26, 1999. P. 478-481.
152

5. B a r a s h e n k o v V. S . et al. // Topical Conference on Plutonium and Actinides ((Plutonium
6. P o 1 a n s k i A. //XXVI Mazurian Lakes School of Physics. Krzyze, Poland. Sept. 1-11, 1999. 7. P o 1 a n s k i A. //Acta Phys. Polonica. 2000. Vol. B31. P.95. 8. P r a e 1 R. E., L i c h t e n s t e i n H. // Report LA-UR-89-3014, In-Alamos National Laboratory,
New-Mexico, USA, 1989. 9. B r i e s m e i s t e r J. F. (Ed.). // Report LA-12625-M, Los-Alamos National Laboratory. New-
Mexico, USA, 1997. 1 0 . C h i g r i n o v S . E . , K i e v i t s k a i a A.I., R a k h n o I. L. etal. / /Proceedingsof3dInt.
C o d on Accelerator Driven Transmutation Technologies and Applications. Prague, Czech Republic. Mo-0- B14 (CD-ROM edition). June 7-1 1, 1999.
1 1 . C h i g r i n o v S.E. , K i e v i t s k a i a AI., R a k h n o I.L., R u t k o v s k a i a C.K. Mo-OC12 (Ibid).
Futures - the Science*. Santa Fe, New Mexico, USA. July 10-13, 2000. P. 194-197 I
20 3au. 2507
flocmynwa t3 pedauyuro 20.12.2000
Joint Institute for Nuclear Research, Russia,
Royal Institute of Technology, Sweden, Soltan Institute for Nuclear Studies, Poland,
Fermi National Accelerator Laboratory, USA
Radiation Physics and Chemistry Problems Institute, Belams,