Embed Size (px)
Citation preview

1
Total Dissolved Gas Decision Support WorkshopSYSTDG Workbook Overview
byMike Schneider
US Army Corps of Engineers
Spill
Forebay
Powerhouse Flow
Heat Exchange
Transport, Mixing, Dispersion
Air/Water TDGExchangeWind
Aerated Flow
Entrainment
Tailwater

2
Total Dissolved Gas Exchange in the Columbia River Basin: Management Tools
• TDG Models – Hydrodynamic and Water Quality Models– Governing Equations
• Momentum, Energy, and Mass
– Temporal and Spatial Resolution• 1 Dimensional• 2 Dimensional
– Solution Techniques
3
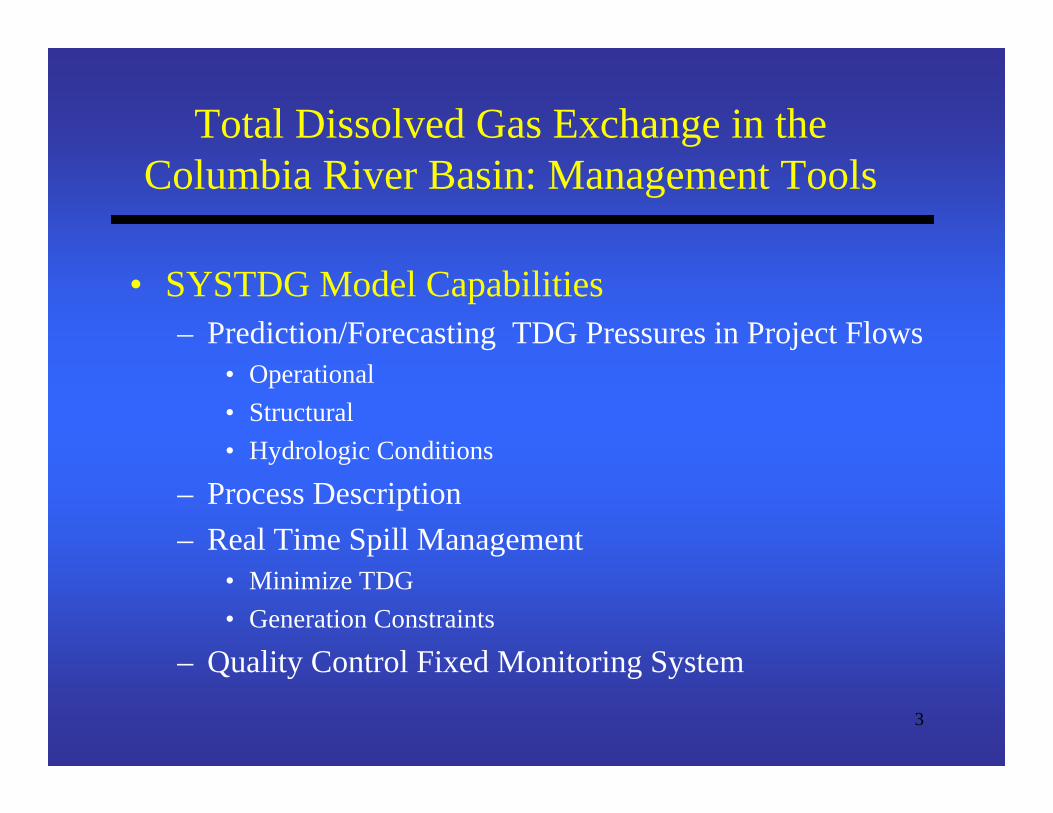
Total Dissolved Gas Exchange in the Columbia River Basin: Management Tools
• SYSTDG Model Capabilities– Prediction/Forecasting TDG Pressures in Project Flows
• Operational• Structural• Hydrologic Conditions
– Process Description– Real Time Spill Management
• Minimize TDG• Generation Constraints
– Quality Control Fixed Monitoring System
4
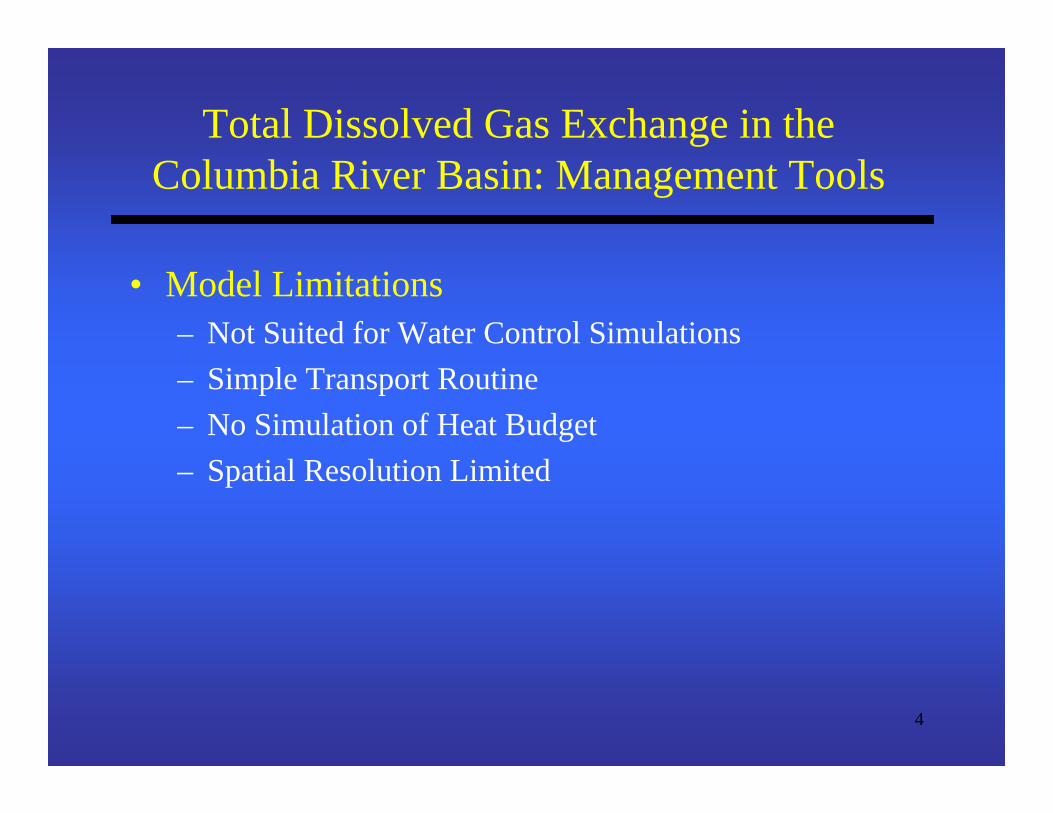
Total Dissolved Gas Exchange in the Columbia River Basin: Management Tools
• Model Limitations– Not Suited for Water Control Simulations– Simple Transport Routine– No Simulation of Heat Budget– Spatial Resolution Limited

5
Total Dissolved Gas Exchange in the Columbia River Basin: Management Tools
• Approach– Empirical TDG Model Developed for Each Dam
• Intuition was used to develop the independent variables• Regressions used to determine equation constants
– Powerhouse and Spillway Releases Treated Separately• Powerhouse Flow
– Forebay Pressures Delivered Through The Powerhouse– Entrainment into Bubbly Flow Qe– Residual Qph-Qe Enters into the Lower Pool

6
Total Dissolved Gas Exchange in the Columbia River Basin: Management Tools
• Approach– Spillway Flows
• Composite of Deflectored and Non-Deflectored Bays• Spill Pattern - Specific Discharge (qs)• Total River Flow - Tailwater Depth (Dtw)• Entrained Powerhouse Flows Acquire Spill Flow TDG
Pressures
),( tws DqfP =∆
7
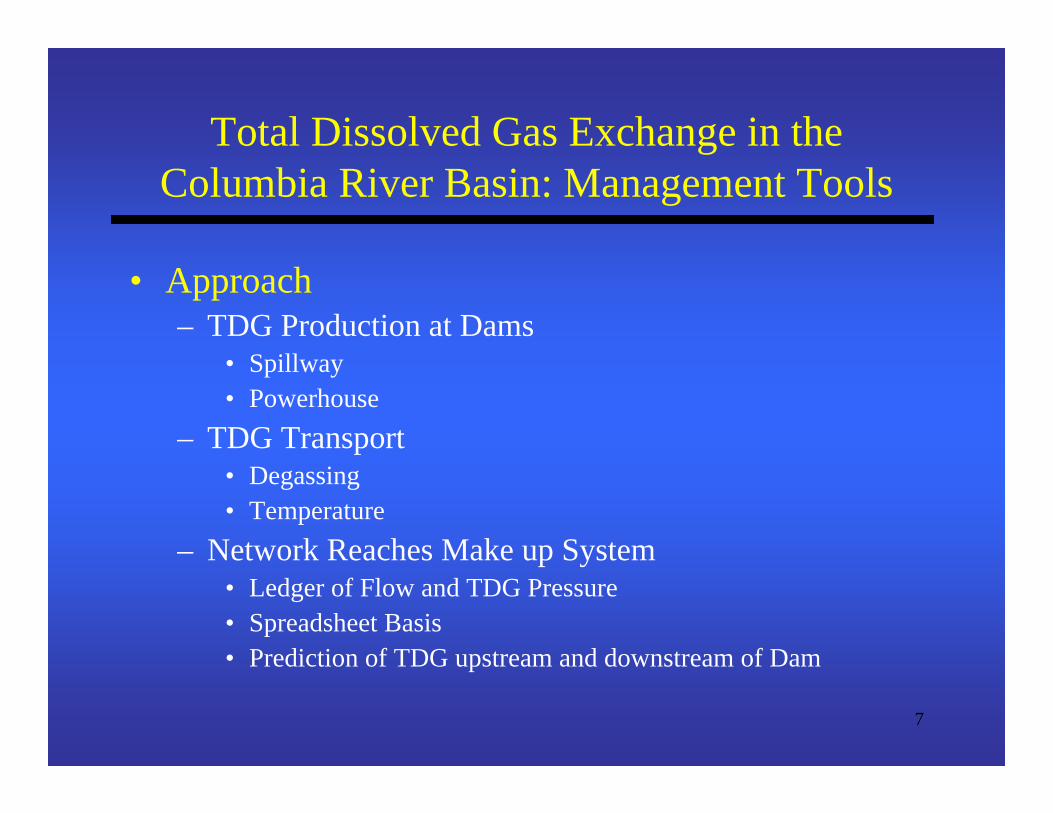
Total Dissolved Gas Exchange in the Columbia River Basin: Management Tools
• Approach– TDG Production at Dams
• Spillway• Powerhouse
– TDG Transport • Degassing• Temperature
– Network Reaches Make up System• Ledger of Flow and TDG Pressure• Spreadsheet Basis• Prediction of TDG upstream and downstream of Dam

8
Total Dissolved Gas Exchange in the Columbia River Basin: Management Tools
• Approach– Model Input
• Total Flow - Stage -Temperature• Spill Management Strategy
– Spill Caps and Priority– Minimized TDG subject to System Power Need
• Operational Parameters and Constraints• TDG Exchange Coefficients
– Domain• Columbia River RM 120-Grand Coulee Dam• Snake River RM 140
– Boundary Conditions• Historic TDG Loading at GCL and LGW

9
Total Dissolved Gas Exchange in the Columbia River Basin: Management Tools
• Approach– Spreadsheet (MS Excel 2000)
• Visual Basic Routines• Interactive Graphical Output• Statistical Output• Database Interaction • Commonly Available• Ease of Use• Computationally Efficient

10
Total Dissolved Gas Exchange in the Columbia River Basin: Management Tools
• Results– Model Output (hourly)
• TDG Pressure– Spillway– Powerhouse– Aggregate
• Water Temperature• Project Operations - Optimization• Graphs Observed and Calculated Data• Statistical Summary

11
Total Dissolved Gas Exchange in the Columbia River Basin: Management Tools

12
SYSTDG
Excel Spreadsheet
FMSMASTER.mdb
Access Database
WWW Real-time DataWater QualityFlowProject OperationsWeather
Spill Management Decision MakingOther considerations,constraints, inputs.
Decision Support Flow Chart
Spill Directive
13
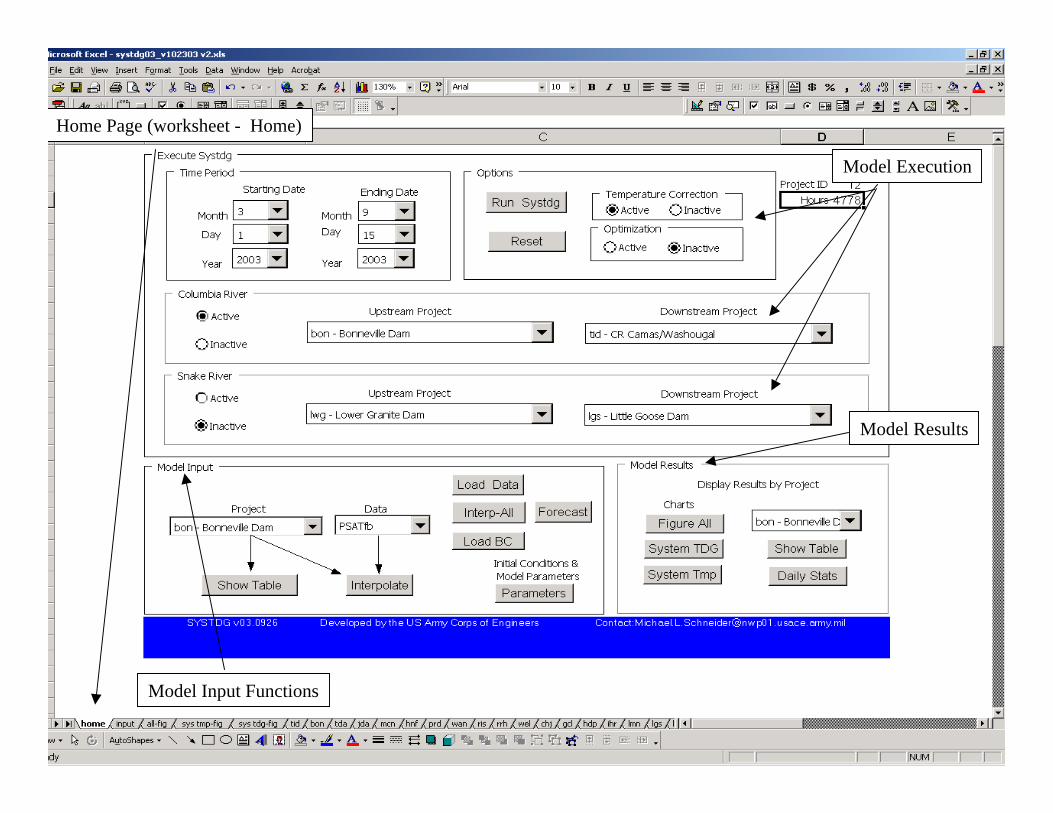
Model Execution
Model Input Functions
Model Results
Home Page (worksheet - Home)
14
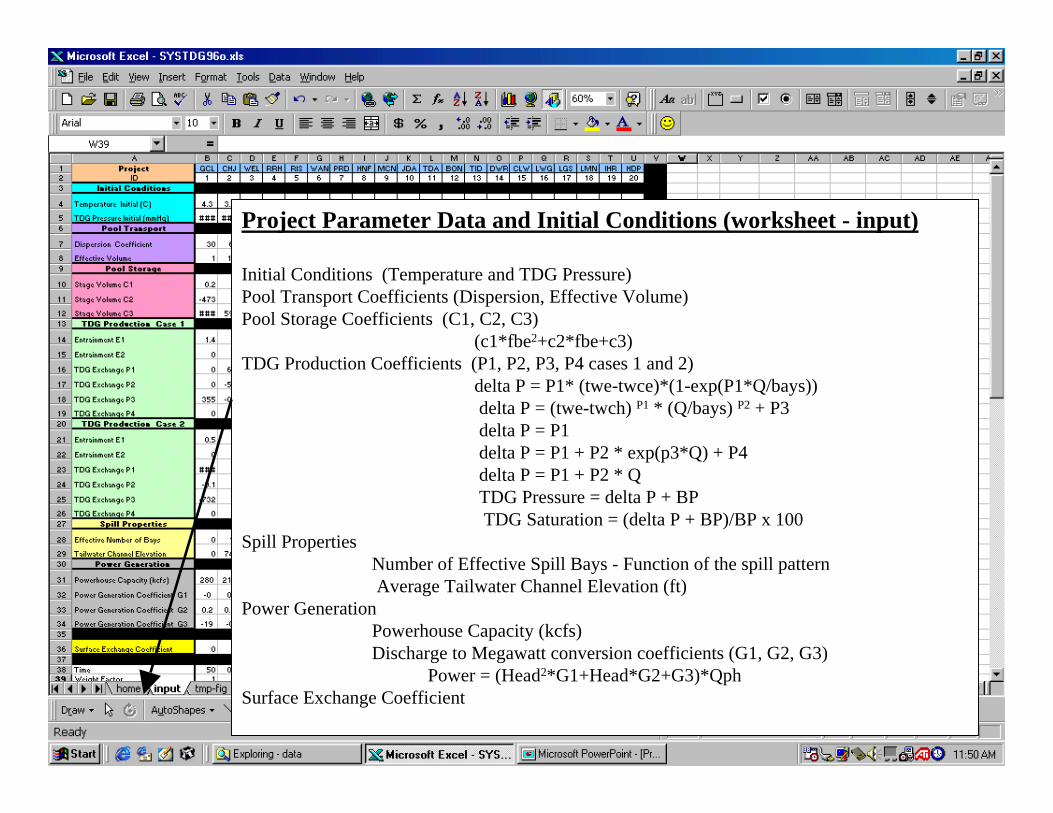
Project Parameter Data and Initial Conditions (worksheet - input)
Initial Conditions (Temperature and TDG Pressure)Pool Transport Coefficients (Dispersion, Effective Volume)Pool Storage Coefficients (C1, C2, C3)
(c1*fbe2+c2*fbe+c3)TDG Production Coefficients (P1, P2, P3, P4 cases 1 and 2)
delta P = P1* (twe-twce)*(1-exp(P1*Q/bays))delta P = (twe-twch) P1 * (Q/bays) P2 + P3delta P = P1delta P = P1 + P2 * exp(p3*Q) + P4delta P = P1 + P2 * Q TDG Pressure = delta P + BPTDG Saturation = (delta P + BP)/BP x 100
Spill PropertiesNumber of Effective Spill Bays - Function of the spill patternAverage Tailwater Channel Elevation (ft)
Power GenerationPowerhouse Capacity (kcfs)Discharge to Megawatt conversion coefficients (G1, G2, G3)
Power = (Head2*G1+Head*G2+G3)*QphSurface Exchange Coefficient

15
Hourly Project Input Data - Project WorksheetLower Columbia Mid-Columbia Snake Rivertid - Columbia River gcl-Grand Coulee Dam hdp - Snake River bl IHRbon- Bonneville Dam chj-Chief Joseph Dam ihr - Ice Harbor Dam Damtda - The Dalles Dam wel-Wells Dam lmn- Lower Monumentaljda - John Day Dam rrb-Rocky Reach Dam lgs - Little Goose Dam Dammcn - McNary Dam ris-Rock Island Dam lwg - Lower Granite
wan-Wanapum Dam clw - Clearwater Riverprd-Priest Rapids Dam dwr - Dworshak Damhnf-Columbia River Hanford Reach
16
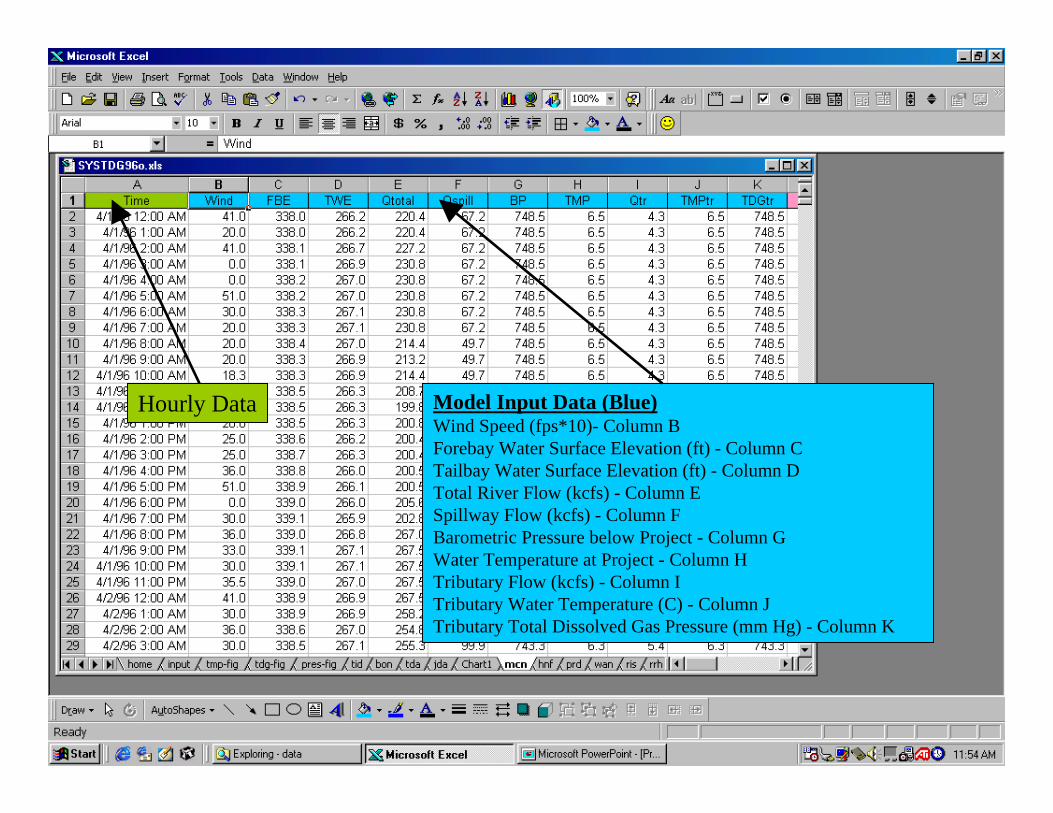
Model Input Data (Blue)Wind Speed (fps*10)- Column BForebay Water Surface Elevation (ft) - Column CTailbay Water Surface Elevation (ft) - Column DTotal River Flow (kcfs) - Column ESpillway Flow (kcfs) - Column FBarometric Pressure below Project - Column GWater Temperature at Project - Column HTributary Flow (kcfs) - Column ITributary Water Temperature (C) - Column JTributary Total Dissolved Gas Pressure (mm Hg) - Column K
Hourly Data
17
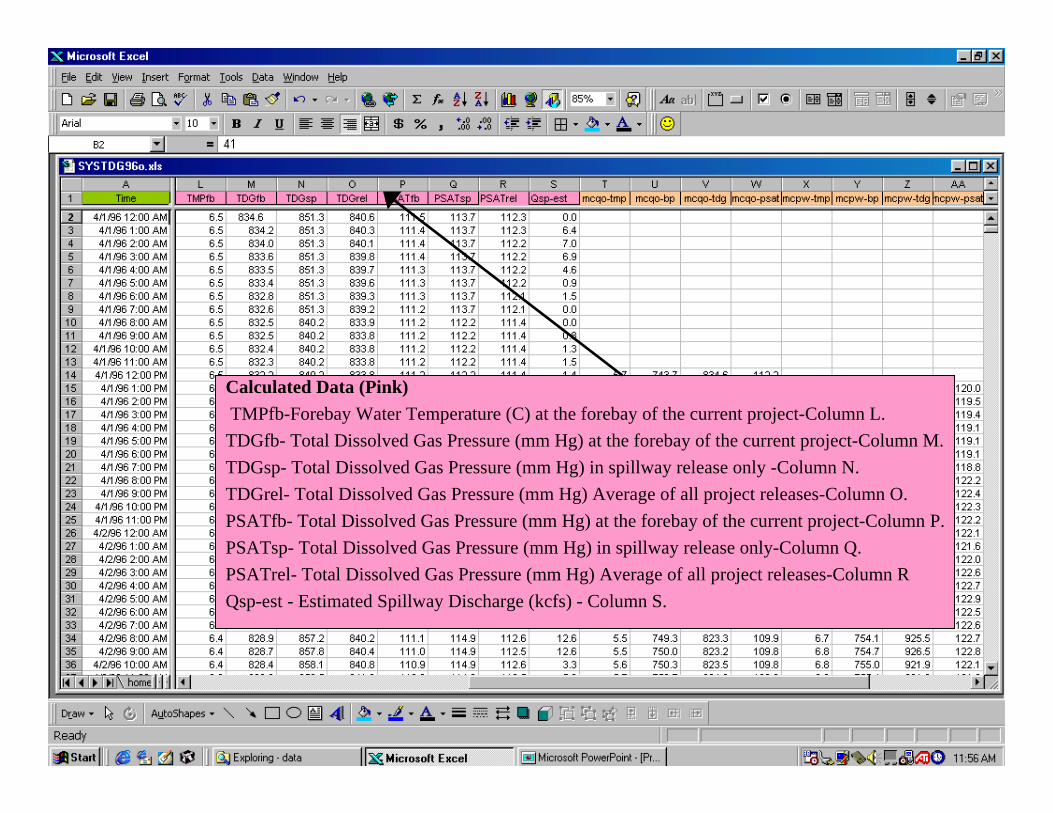
Calculated Data (Pink)TMPfb-Forebay Water Temperature (C) at the forebay of the current project-Column L.TDGfb- Total Dissolved Gas Pressure (mm Hg) at the forebay of the current project-Column M.TDGsp- Total Dissolved Gas Pressure (mm Hg) in spillway release only -Column N.TDGrel- Total Dissolved Gas Pressure (mm Hg) Average of all project releases-Column O.PSATfb- Total Dissolved Gas Pressure (mm Hg) at the forebay of the current project-Column P.PSATsp- Total Dissolved Gas Pressure (mm Hg) in spillway release only-Column Q.PSATrel- Total Dissolved Gas Pressure (mm Hg) Average of all project releases-Column RQsp-est - Estimated Spillway Discharge (kcfs) - Column S.

18
Fixed Monitoring Station Observed Water Quality Data (Tan)Forebay FMS Temperature (C) - Column TForebay FMS Barometric Pressure-Column UForebay FMS Total Dissolved Gas Pressure- Column VForebay FMS Total Dissolved Gas Saturation - Column WTailwater FMS Temperature (C) - Column XTailwater FMS Barometric Pressure-Column YTailwater FMS Total Dissolved Gas Pressure- Column ZTailwater FMS Total Dissolved Gas Saturation - Column AA
19
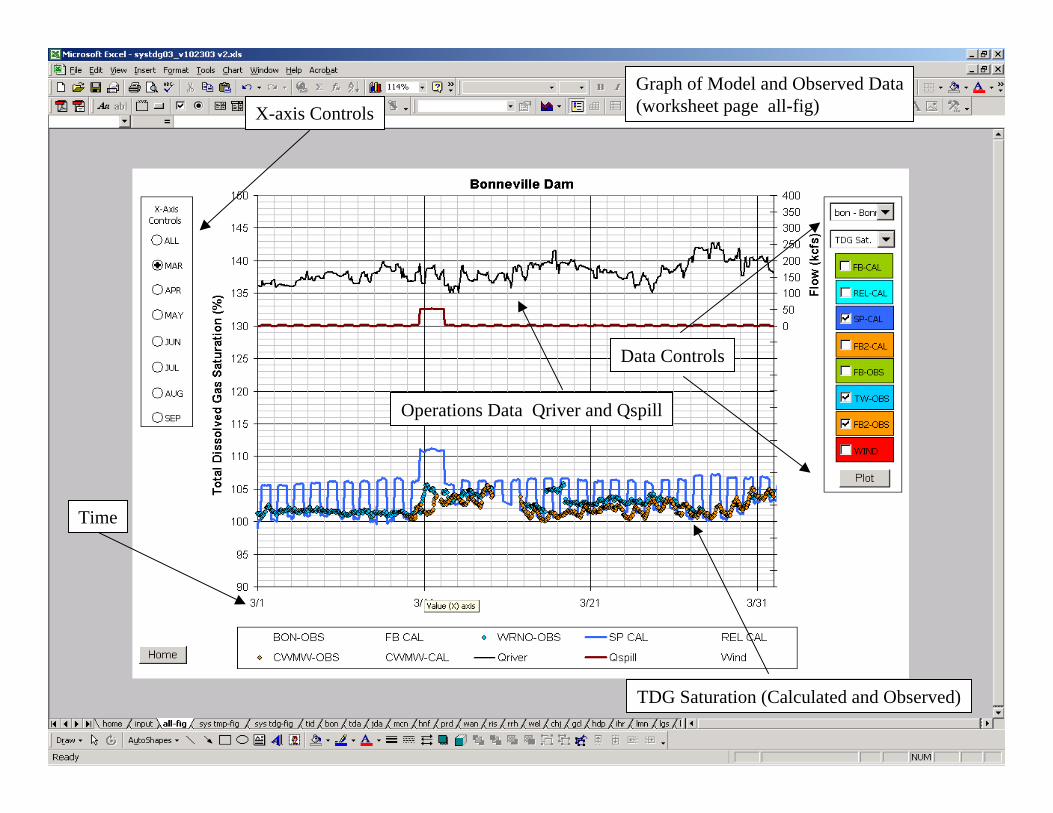
Graph of Model and Observed Data(worksheet page all-fig)
Operations Data Qriver and Qspill
TDG Saturation (Calculated and Observed)
Time
X-axis Controls
Data Controls

20
System Graph of Operations and TDG(worksheet page sys-tmp-fig)
Observed Forebay and Tailwater Temperature symbols
Project/River
Time Controls
Project Operations River Mile

21
System Graph of Operations and TDG(worksheet page sys-tdg-fig)
Observed Forebay and Tailwater TDG saturation symbols
Project/River
Time Controls
Project Operations River Mile

22
23
Total Dissolved Gas Exchange in the Columbia River Basin: Management Tools
• Model Enhancements– Forecasting short-term conditions– Update Project TDG Exchange Descriptions
• Mid-Columbia PUD’s– Streamline Input Data Management– Data Screening (Quality control)– Post-processing Model Output
• Statistical Summary– Documentation and Training
• Web based framework