Embed Size (px)
Citation preview

SysNet Research Paper Series

SysNet Research Paper Series No. 1 (1998)
SysNet is a systems research network established to develop methodologies for determining land use options and to evaluate these methodologies for generating options for policy and technical changes in selected areas.
SysNet is coordinated by the International Rice Research Institute (IRRI). The following main NARS partner organizations participate in the SysNet project:
India:
Malaysia:
Philippines:
Vietnam:
Indian Agricultural Research Institute (IARI) of Indian Council for Agricultural Research (ICAR)
Malaysian Agricultural Research and Development Institute (MARDI)
University of the Philippines at Los Baños (UPLB)
Philippine Rice Research Institute (PhilRice)
Mariano Marcos State University (MMSU)
Cuu Long Delta Rice Research Institute (CLRRI)
Collaborating institutions within the Wageningen Agricultural University and Research Centre (Wageningen UR), The Netherlands, include:
DLO-Research Institute for Agrobiology and Soil Fertility (AB-DLO) DLO-Winand Staring Centre for Integrated Land, Soil and Water Research (SC-DLO) Sub-Department of Theoretical Production Ecology (TPE-WAU)
ISBN: 90-6754-557-0
Cover design: Juan Lazaro and Grant Leceta, CPS-Creative Services Team, IRRI
Printing: Grafisch Service Centrum Van Gils B.V., Wageningen

SysNet Research Paper Series No. 1 (1998)
Exchange of methodologies in land use planning
Proceedings of an International Workshop held at Can Tho, Vietnam 15-19 June 1998
Organized by Cuu Long Rice Research Institute, Can Tho, Vietnam International Rice Research Institute, Los Baños, Philippines
Edited by R. Roetter International Rice Research Institute C.T. Hoanh
N.V. Luat Cuu Long Rice Research Institute M.K. Van Ittersum Wageningen University and Research Centre H.H. Van Laar Wageningen University and Research Centre
International Rice Research Institute
International Rice Research Institute, Los Baños, Philippines National Agricultural Research Systems: India, Malaysia, Philippines, Vietnam

Acronyms
AEU Agro-Ecological Unit CAP Common Agricultural Policy CERES Crop Estimation through Resource and Environment Synthesis CLRRI Cuu Long Rice Research Institute DSS Decision Support System EOA Environment Oriented Agriculture EC European Community EU European Union GDP Gross Domestic Product GIS Geographic Information System GOAL General Optimal Allocation of Land use GPS Global Positioning System GVA Gross Value Added IARI Indian Agricultural Research Institute IMGLP Interactive Multiple Goal Linear Programming IPM Integrated Pest Management IRRI International Rice Research Institute LINTUL Light INTerception and Utilization simulator
LUPAS Land Use Planning and Analysis System LUST Land Use System at a defined Technology MADA Muda Agricultural Development Authority MARDI Malaysian Agricultural Research and Development Institute MGLP Multiple Goal Linear Programming NAP National Agricultural Policy NARS National Agricultural Research System QUASI QUantitative Analysis of (agro-eco-)Systems at higher Integration levels REPOSA Research programme on Sustainability of Agriculture in the Atlantic Zone of
LP Linear Programming
Costa Rica SSL Self Sufficiency Level SUCROS Simple and Universal CROp growth Simulator UPLB University of the Philippines at Los Baños WOFOST Crop growth simulation model for WOrld FOod STudies WRR Netherlands Scientific Council for Government Policy YOA Yield Oriented Agriculture

Contents
Preface
Opening addresses N.T. Dan V.V. Luy K.S. Fischer N. V. Luat
New methodologies in land use planning New concepts and directions in exploratory land use studies
Use of crop simulation models and alternative yield estimation techniques for optimizing agricultural land use and resource management
Description of input-output relations for various production activities
Generalizing SysNet methodologies for land use planning at the sub-national level
M K. Van Ittersum
R. Roetter et al.
D.M. Jansen
C. T. Hoanh et al.
SysNet methodologies Exploring agricultural land use options for the State of Haryana: Biophysical modelling
P. K. Aggarwal et al. SysNet methodology development in Malaysia with special reference to policy views
Systems methodology development for exploratory agricultural land use planning for Ilocos Norte Province, Philippines
SysNet methodology development in Vietnam
A. Tawang et al.
F. P. Lansigan et al.
N.X. Lai et al.
SysNet applications Exploring agricultural land use options for the State of Haryana: Linking biophysical modelling with socio-economics
SysNet methodology development and application for land use exploration in the Kedah-Perlis region, Malaysia: Preliminary results
A. K. Vashisht et al.
A.A. Kamaruddin et al.
vii
ix xi
xii xiii
1
3
15
31
41
57
59
67
73
81
87
89
93

A systems approach to agricultural land use planning at the provincial and municipal levels of Ilocos Norte Province, Philippines
Application of the SysNet methodology in Vietnam: Preliminary results S.R. Francisco et al.
N.X Lai et al.
Land use planning in Can Tho Province, Vietnam A socio-economic perspective for Land Use Planning in the Mekong Delta, Vietnam
A.M. Mandac & N.V. Luat Strategy of agricultural development in Can Tho Province for the year 2000
Land use planning in Can Tho Province (Vietnam) for the year 2010 V.V. Luy
N.T. Chuc
General discussion, Workshop summary and Closing remarks
Annexes Annex 1: Characterization of physical environment and land use
Annex 2: SysNet land use analysis terminology (glossary) in the four study regions
103
111
117
119
125
129
137
145
147 151

vii
Preface
The ‘Systems Research Network for Ecoregional Land Use Planning in support of Natural Resource Management in Tropical Asia’ (SysNet) is one of the development projects under the Ecoregional Initiative for the Humid and Subhumid Tropics and Subtropics of Asia. The project, launched in late 1996, comprises five main partners: National Agricultural Research Systems (NARS) of India, Malaysia, Philippines and Vietnam, and the International Rice Re- search Institute (IRRI). The purpose of SysNet is to develop methodologies in support of improved land use planning at sub-national level. Study regions include Haryana State (India), Kedah-Perlis Region (Malaysia), Ilocos Norte Province (Philippines) and Can Tho Province (Vietnam). The workshop on ‘Exchange of Methodologies in Land Use Planning', the first international workshop held by SysNet project, attracted more than 180 participants from eight countries. These Proceedings present most of the contributions to the workshop. The main focus of these Proceedings is to present methodology development and preliminary results of the four SysNet case studies. Other papers address the context of land use problems and the role that SysNet methodology is expected to play in the arena of developing sustainable land use policies.
A careful assessment of potential usefulness and limitations of each type of land use study is crucial for a targeted application and proper interpretation of its results. Land use policies are not developed by scientists and land use studies. Land use policies are developed by policy makers and interest groups, in a societal and political process. The role of land use studies is to enhance transparency of that process, by supplying relevant information, arguments and options. The specific type of required information depends on the stage of the policy process. Diagnosis of the actual situation and problems, specification of strategic and short-term policy objectives, identification of policy instruments, policy implementation, and monitoring of implemented policies all require targeted information.
SysNet methodology on explorative land use studies is aimed at strategic land use issues: how to satisfy a range of well-defined, often conflicting, objectives focusing on economic, food security, ecological and social dimensions of land use. Where to produce what and how in future, in order to meet a set of well-defined objectives? The methods are not aimed at simple projections, based on today’s and yesterday’s facts, neither are they designed to provide blue-print answers with detailed prescriptions of what to do to reach desired situations. The primary aim of the current methodology is to support and stimulate open discussion about future possibilities and limitations. The agricultural sector is a unique sector for which it is possible to sketch contours of future options, simply because we largely deal with biophysical processes and a natural resource base. Understanding of these processes and quantified knowledge about this resource base enables quantification (e.g. in tables) and visualization (e.g. in maps) of alternative options and associated limitations of agricultural systems under various policy scenarios. Explorative studies are needed to enhance transparency in the policy debate by segregating science-driven and value-driven information. And, to thoroughly explore consequences of different priorities for policy objectives, before discussing about the means to realize particular objectives. To summarize, keywords with

viii
respect to explorative land use studies are: strategic, agricultural and non-agricultural land use, use of resources, and consequences of policy objectives on land use allocation.
With this, the limitations of explorative land use studies are implicitly indicated: SysNet methodology in the current project phase is not aimed at predicting, nor identification of policy means to realize desired options. In addition to this: usually just one scale level is addressed in a study, in the presented case studies the regional or county level of scale. Assessment of policy options requires explorations at different levels of scale, including the farm level. A challenge for the next phase of the SysNet project is to explore options at different scale levels and to confront opportunities and limitations for these various levels.
There is a last aspect, certainly an important one, which must be mentioned in relation to usefulness and limitations of SysNet methodology. The method should preferably be seen as an integral part of developing land use policies. That implies involvement of interest groups from the very beginning. Interest groups contribute to identification of policy objectives and alternative production technologies. Involvement in defining and constructing land use scenarios and evaluating land use options truly enhances understanding of the system’s opportunities and limitations. Land use studies used in this way, not only deliver information, arguments and options, but contribute to learning what are the sustainable options that have a chance to be implemented. SysNet has the opportunity to do so.
The workshop was hosted by the Cuu Long Rice Research Institute (CLRRI) in Can Tho City. We thank the local organizing committee consisting of Drs. B.C. Buu, P.S. Tan, C.V. Phung, and Prof. N.V. Luat and the many helpers from ‘SysNet team Vietnam’ for all their efforts in making this workshop successful and a very pleasant experience for its participants. The following IRRI and CLRRI staff were responsible for developing and handling the scientific sessions: C.T. Hoanh, R. Roetter, T.P. Tuong, V.P. Singh, O. Ito, P.S. Teng and K.S. Fischer, and N.X. Lai, P.S. Tan and N.V. Luat. They were supported by representatives of NARS partners and the Wageningen University and Research Centre: F.P. Lansigan, S.R. Francisco, S.R. Obien (Philippines), P.K. Aggarwal (India), A. Tawang, A. Zamzam (Malaysia) and M.K. Van Ittersum, D.M. Jansen and H.H. Van Laar (Wageningen UR).
We extend our sincere thanks to N.T. Dan (Deputy Minister for Agriculture and Rural Development, Vietnam), V.V. Luy (Vice-chairman, People Committee, Can Tho Province) and N.V. Luat (Director CLRRI) for their input to the workshop programme.
The contributions of many stakeholders from the various provinces of the Mekong Delta in the SysNet meetings were stimulating and are highly acknowledged. SysNet thanks the many other people from this international (IRRI-NARS-Wageningen UR) network that directly or indirectly were supportive to this workshop. Special mention deserve: Alice Laborte, Peewee Cabrera, Benjie Nunez, Cecille Lopez and Arlene Dela Cruz (IRRI SysNet staff) for their enthousiasm and great help in preparing this workshop.
Financial support for this workshop was provided by IRRI and the Ecoregional Fund, The Hague, The Netherlands.
Los Baños, December 1998 The Editors

ix
Opening addresses
Ngo The Dan Deputy-Minister of Agriculture and Rural Development, Vietnam
Distinguished guests, Ladies and gentlemen,
On behalf of the Ministry of Agriculture and Rural Development, I would like to welcome cordially the participants of the Workshop on ‘Exchange of Methodologies in Land Use Plan- ning’, coorganized by the International Rice Research Institute (IRRI) and the Cuu Long Delta Rice Research Institute (CLRRI) at Can Tho.
After the reunification of Vietnam in 1975, land use planning has been carried out under the appropriate attention of the Government. To date, although the way of land use planning still needs further improvement, it has helped in formulating the land use strategy at national, regional and provincial levels. Land use planning has contributed to the development of agriculture in Vietnam with an annual increase of 4-7%, of which the most prominent success is recorded in rice production. Two decades ago, the country’s food supply did not meet our demands, Vietnam started to export rice in 1989 and reached the second position of the world among rice-exporting countries, with 3.7 million tonnes of rice exported in 1997.
Vietnam is an agricultural country with 33 million ha of land, of which agriculture occupies 10 million ha, and at present another 7.3 million ha is under exploitation. Land for rice production is 4.3 million ha. Land for upland food crops occupies 1.1 million ha. So, the land resource for food production is 5.4 million ha with a cropping area of 7.6 million ha. Land for fruit trees is about 400.000 ha, and 2 million ha for industrial crops.
Changes in Vietnamese agriculture in response to the accelerating process of industrialization and modernization of the country are obvious everywhere. Under this change, the labour available for agriculture will decrease and move to other sectors, the relative share of crop production in agriculture will be reduced, while the absolute value continues to increase, and the relative share of fishery and other production activities will also increase. In crop production, the relative share of industrial crops, vegetables and fruit production will increase. To the year 2000, the economic structure in rural areas is projected to be 50% for agriculture, 25% for industry and 25% for service activities. Corresponding to this change, there should be a shift in land use: a section of agricultural land including land for crop production will be converted into other purposes under the pressure of industrialization and urbanization. The development of land use planning methodology, therefore, should be directed in harmony with the shift in agricultural structure.
Food demand in Vietnam will increase rapidly from now to the year 2000 and 2010. Population will be 80 million in 2000 and 95 million in 2010. To meet the requirements of nutrition in the coming years at a level of 2300 kcal person–1 d–1, plus the supply for feed and materials for food processing, a food quantity equivalent to 38-40 millions tomes of rice has to be produced in 2010, while the present level is 30.6 million tonnes (year 1997). To meet future demand, the land resource for food production should be controlled strictly. To serve
x
the national need for industrialization and urbanization, a section of agricultural land may be converted for other purposes, so new land should be found to compensate for this loss. The land resource for food production in Vietnam in 2000 will be 6.2 million ha, of which the land for rice production is maintained at 4.3 million ha as at present and the land for upland food crops will increase to 2 million ha. Up to 2000, it is possible to get 130.000 ha of new land for rice production in the Mekong Delta.
Along with the policy to control land use for rice production and upland food crops, the land use strategy should be directed towards the diversification of agricultural production, to- wards better conservation and enhancement of soil fertility and towards the harmony of a productive and environmental-friendly agriculture. And at last, the success of land use planning should be assessed in terms of economic efficiency, in which the increase in income and living standards of the farmers from the land they toil is the most important measure.
In Vietnam, the work of land use planning is done by various institutions belonging to the Ministry, such as the Institute for Agricultural Planning and Projection, the Institute for For- estry Planning, the Institute for Water Management Planning and other research institutes specialized for regions or for specific crops, along with agricultural universities. At the pro- vincial level, the Department of Agriculture and Rural Development and the Department of Land Management, under inspection of the Committee, executes land use planning for Planning of the Province. The organizational structure for land use planning in Vietnam has been developed and established. The important issue presently is to enhance the quality of its activities. Planning always implies some kind of prediction, and planning for land use is a prediction towards a moving target influenced by various environmental and social factors, which are always changing. Therefore, to advance and operationalize methodologies for land use planning is a crucial step in enhancing the quality of planning to serve effectively the economic development goals. Within this view, the workshop on ‘Exchange of Methodologies in Land Use Planning’, which is starting here today is a workshop that Vietnam and other countries in the region are most expecting.
During the workshop, the ideas on methodologies in land use planning will be exchanged, either from the angle of science or from the angle of practical application, either from national or regional point of view. I hope these ideas will result in a common attempt to identify the appropriate methodologies to serve as a base for land use planning, which will be able to serve the higher goals in agricultural development. I consider this workshop to be a challenge for Vietnamese agricultural scientists and officers in approaching the latest developments in land use planning science of the world.
Lastly, I wish to thank the International Rice Research Institute for providing the condi- tions that this workshop could be held in Vietnam. I thank the distinguished guests from abroad and from my own country for participating in this important workshop.
I wish the workshop to be successful.

xi
Vo Van Luy Vice-Chairman, People’s Committee of Can Tho Province, Vietnam
Distinguished Prof. Ngo The Dan, Dr. K.S. Fischer, Ladies and gentlemen,
I consider it really a great privilege to be here today in this SysNet International Workshop on ‘Exchange of Methodologies in Land Use Planning’. On behalf of the Can Tho People’s Committee, I extend to you a most cordial welcome to the Mekong Delta to participate in the workshop organized by SysNet, one of the methodology development projects under the umbrella of IRRI’s Ecoregional Initiative for the Humid and Sub-humid Tropics and Sub- tropics of Asia. Can Tho has been a research target site and it is being able to host such an important workshop.
We feel honoured by the presence of Prof. Ngo The Dan, the Deputy-Minister of Agricul- ture and Rural Development to give the inaugural address.
I most cordially welcome you, especially the foreign delegates from IRRI, India, Japan, Malaysia, Netherlands, Philippines and all Vietnamese scientists. You are here to contribute and share your knowledge and wide experience on methodologies in land use planning to meet the demand of sustainable agricultural development. This gives us a good opportunity to learn about novel tools including optimization models. We wish to gain from your experience for the benefit of better promoting our agricultural modernization and industrialization.
I extend my heartfelt thanks to the managers and agricultural officers from many provinces attending this workshop, to exchange our methodologies for our further cooperation to meet the target objectives for the development of the Mekong Delta. I also welcome all visitors, journalists from Press Agencies, Television and Radio Broadcasting Agencies paying special attention to this workshop.
I very much appreciate the efforts of Dr Luat and his staff at CLRRI for the organization of such an important international workshop in Can Tho Province, one of the largest granaries in the Mekong Delta. In Can Tho, rice production is 1.75-1.90 million tonnes. Our goal for 2000 is to increase GDP by 12-13% and agricultural production by 6-7%. Land and water resources have been thoroughly exploited. It is necessary to have a good strategy to find appropriate solutions to the problems of growing rice under such conditions, to reap heavy harvests, and to receive much higher farmer profits. The workshop will deal with various aspects to meet the demand not only for Can Tho but also for the whole region. We will be supplied by new tools, e.g. GIS and simulation models, so that policy-makers can prepare better plans to synchronize both exploiting and conserving our natural resources to ensure sustainable agricultural systems.
We hope the workshop will achieve our common objectives. Congratulations to our international collaboration. I wish the deliberations during this workshop great success.

xii
K.S. Fischer Deputy Director-General, International Rice Research Institute, Los Baños, Philippines
Dear Deputy-Minister for Agriculture and Rural Development, Dear Vice-chairman of the Provincial People’s Committee of Can Tho, Distinguished Colleagues of Vietnam and other Partner Countries and Research Colleagues,
I am taking this opportunity to convey to you my disappointment in not being present to open the SysNet International Workshop on ‘Exchange of Methodologies in Land Use Planning’.
I regret that a series of unplanned activities have made it impossible for me to attend. Yet, I am keenly interested in hearing of the rapid advancement and success of SysNet as we all address the challenges of careful use of our natural resources as we endeavour to feed the growing population in Asia and elsewhere.
The competition between agriculture for land use to produce food and alternative uses of these resources grows at an alarming rate. Yet so too does the demand for food. In Asia, it is estimated that we will need approximately 40-50% more rice in the year 2025 than we do to- day. And as well, there will be large demands for other cereals, poultry, and fish. With such pressure, marginal lands are forced under cultivation; species habitats are destroyed setting a cycle of destruction of the earth’s resources and a worsening of the lives of the already poor.
Under this scenario, the primary effort should be to design production systems that opti- mize the efficiency of inputs and minimize emissions and losses — to the environment. In this way, we can begin to make considered judgements about the trade-offs in land use to meet a varied and diverse set of objectives.
To date, our ability to make such considered judgements has been limited by the tools at our disposal and by our approach to research planning and implementation. But today, we are using our knowledge about ecosystems as a new ecological basis for food production. This approach of production ecology is the interdisciplinary science that integrates the knowledge of basic physical, chemical, physiological and ecological processes in agro-ecosystems and uses that to understand their functioning.
For this approach, we need new tools and new methodologies. SysNet is developing and applying such tools for application in different case studies of land use options in the region. The International Rice Research Institute (IRRI) is strongly committed to this new holistic approach to resource management. Indeed, the CGIAR (Consultative Group on International Agricultural Research) system as a whole is seeking to enhance its effective work in natural resource management. SysNet is seen by many to be a leader in exploring new grounds for the future. A close look at the workshop agenda confirms that view and I regret not having the opportunity to hear first hand the gains that you are all making in this frontier area. I wish you a great and successful workshop, and wish to assure you that IRRI places this initiative very high on its agenda.

xiii
Nguyen Van Luat Cuu Long Delta Rice Research Institute (CLRRI), O Mon, Can Tho, Vietnam
Distinguished Prof. Ngo The Dan, Dr. K.S. Fischer, Ladies and gentlemen,
The Systems research Network for eco-regional land use planning in tropical Asia (SysNet) is sponsored and coordinated by the International Rice Research Institute (IRRI). The project started October 1996, this workshop on ‘Exchange of Methodologies in Land Use Planning’ is the mid-term workshop of the current phase. The objective of the workshop is to exchange new methodologies in developing land use considering multiple objectives. It was approved by the Deputy-Premier (CV No.l458/VPCP-QHQT, 21/4/1998) and MOSTE (CV No. 1133/ BKHCNMT, 15/5/1998) of the Vietnamese Government.
In SysNet, many different countries, international organizations and scientists participate at different levels and in a wide range of activities. In Vietnam, Can Tho Province is the research site; Cuu Long Delta Rice Research Institute is coordinator in conjunction with the Land Use Department, Department of Science Technology and Environment of Can Tho Province; Can Tho University; College of Agriculture and Forestry - Thu Duc, Southern Agriculture and Planning Centre. The leaders of Can Tho Province and different departments and agricultural officers at different districts contributed many valuable viewpoints.
Besides sending persons to IRRI for training, three training courses in the application of new land use methodology, modelling, GIS were undertaken in Can Tho Province. The participants came from different locations since the SysNet project promotes the transfer of the methodology and technology in land use planning in different countries through Institutions. We strongly believe that at the end of project phase I in 1999, the Cuu Long Delta Rice Research Institute, along with cooperating agencies, will understand the methodology and technology. CLRRI will transfer the knowledge to persons at different localities in order to contribute more significantly ideas for policy makers to make better decisions on agricultural land use. It is hoped that training for more research staff and planners would receive sufficient attention in phase II of SysNet project.
Long-term agricultural land use planning has been conducted through decades. At the initial stage, due to lack of experience in land use planning, actual production was far from target. For example, land planned for soybean cultivation was grown to jute, because it suits acid sulphate soil, while jute, planned to increase 10-fold, decreased ten times. However, the process of planning gained experience. At present, land use planning includes objectives, data, and strategies that are almost close to the actual condition and at the same time can reveal strategic viewpoints of the whole country involving sustainable development and environmental considerations. In order to strengthen the effectiveness of planning data, materials, documents of high quality are needed. The methodology of land use planning in SysNet project is to increase planning skills to obtain the above-mentioned objectives.
Under direct guidance from SysNet scientists, the Cuu Long Delta Rice Research Institute has suggested various scenarios for optimum land use in the province. Can Tho provincial leaders provided partial budget support for this activity in its locality. The Cuu Long Delta Rice Research Institute also integrated other projects conducted at O Mon district involving crop production models CES’VI (NGO) and with Mega Project under IRRI support to

xiv
improve rice production efficiency. The objectives of this combination are to provide alternative production technologies for future land use.
The workshop on ‘Methodology Exchange in land use planning’ comprises about 20 scientific papers and discussions which can be classified into three sessions: ( i ) viewpoints about development and strategies to select optimum land use ( ii ) new methodologies and tools in land use planning, and ( iii ) experiences in methodology from SysNet project in India, Malaysia, Philippines and Vietnam. The contents of the workshop will go into depth concerning methodology aspects and key problems in land use planning.
The results obtained from this workshop will make a significant contribution to imple- menting future SysNet projects. The purpose of implementing the SysNet methodology is to identify possibilities for exploiting and utilizing land potential efficiently.

New methodologies in land use planning

New concepts and directions in exploratory land use studies
M.K. Van Ittersum 1
1 Theoretical Production Ecology, Wageningen University and Research Centre, P.O. Box 430, 6700 AK Wageningen, The Netherlands E-mail: [email protected]
Introduction Problems with food security, nature conservation, the maintenance of social objectives, unequal distribution of regional income and the depletion of natural resources are some of the reasons for a government to initiate active land use policies. Policies aimed at changing land use in a predefined direction form strong instruments to alleviate all these problems. A major aim of eco-regional research is to support strategic policy-making on management of land and other natural resources, and rural development (Rabbinge, 1995). Such research should syn- thesize basic biophysical and socio-economic knowledge about crop and animal production systems and their interactions with biophysical and social environments, in order to support decision-making processes for the regional and higher levels of scale. Which options for land use prevail, what are the major conflicts between objectives and the consequences of prioritizing one objective over the other? How to stimulate implementation of desired land use options or resource use?
A major objective of the eco-regional project Systems Research Network for Tropical Asia (SysNet) is the development of scientific-technical methodology to explore land use options using models and expert systems at sub-national scales in Southeast Asia (Roetter et al., 1998; Roetter & Hoanh, 1998). It adopted, advances and elaborates an exploratory methodology, as described by e.g. Rabbinge et al. (1994) and Van Ittersum et al. (1998), to analyse land use options for four case study regions in India, Malaysia, Philippines and Vietnam. Such studies fulfil the role of synthesizing fragmented agricultural knowledge to support development of land use policies. For a careful assessment and successful role of this type of land use study in the policy making process, several issues are crucial: - Which types of land use studies and future studies in general can be distinguished? What
questions can different types of land use studies address, how should their answers be interpreted and how can different land use studies be used in a complementary way? In the next section this issue will be dealt with.
- Is the research sufficiently embedded within the process of creating awareness and learning of stakeholders to ensure a dovetailing of questions of stakeholders and answers of research? Several contributions in these proceedings report on how stakeholders are in- volved in the various SysNet case studies.
- Are results of exploratory land use studies presented in such a way that stakeholders can easily draw meaningful conclusions within the context of policy formulation? In this paper, I address the issue of how to present results of exploratory land use studies using Multiple
3 R. Roetter et al. (eds): Exchange of methodologies in land use planning. SysNet Research Paper Series No. 1 (1998). 3-13. IRRI, Los BañOS, Philippines.

4
Goal Linear Programming (MGLP) models, as used in SysNet, in a meaningful way. - Exploratory land use studies might play an important role in distinct phases of the policy
debate as a first step in designing options. However, successful further development and implementation of promising land use options and farming systems require another type of research. The last section of this contribution, therefore, focuses on potentially relevant approaches for a follow-up to the current phase (1996-99) of the SysNet project.
Types of land use studies and their role in developing land use policies For a successful policy intervention in land and resource use a clear discrimination among the subsequent phases in policy making is a prerequisite, i.e.: - Problem definition - Awareness and agreement on the need for policy intervention - Identification of policy objectives - Identification of the means to realize these objectives. In each of these phases different types of information are needed. This implies that each phase in the policy-making process requires specific types of land use studies and modelling approaches. Since land use studies of this type are future studies, we can use the classification used in future studies to come to grips with their differences in design and output.
One classification divides future studies into four categories (Van Ittersum et al., 1998; Becker & Dewulf, 1989), based on the criteria: - The ‘level of uncertainty’ in assessing future values of system parameters, and exogeneous
factors (e.g. related to land use: population growth, trade and market developments) greatly affecting the options and limitations of system behaviour. Usually the longer the time horizon for which the study should give a forecast, the greater the level of uncertainty.
- The ‘level of causality’ in the model of the system, used to forecast possible future states of the system. Models can have an empirical statistical basis enabling description of the system, rather than explanation, or models may have a more mechanistic basis with information on causal relationships within the system.
The four different categories of future-oriented studies that emerge from these criteria are (see Figure 1): Projection: based on a low level of causality, and valuable for those conditions where the level of uncertainty is relatively low, due to a short time horizon for which the projections should be valid, and relatively stable or negligible exogeneous conditions. Prediction: if more information on causality and relations behind a projection is available, a projection may evolve into a prediction. Speculation: if the level of uncertainty increases, usually associated with a longer time horizon, a projection based on a low level of causality might evolve into a speculation. Exploration: if more information is available about causal relationships within the system, it becomes possible to explore future options, even though future developments on exogeneous factors are highly uncertain. If causal information is only available for subsystems, explorations may show options for future developments given explicit assumptions about uncertain developments for other parts of the entire system.
In the phase of problem definition of a policy process, projective and predictive land use

5
Figure 1. Typology of future-oriented studies, as defined by two criteria: level of uncertainty and level of causality (see text). After: Becker & Dewulf (1989) and Van Ittersum et al. (1998).
studies can each play a role. These studies are based on extrapolated trends and facts from the past and present and may shed light on plausible developments. Examples of such studies are those of the World Watch Institute (e.g. Brown & Kane, 1995) and FAO (Alexandratos, 1995). A particular type of land use study is that presented by Veldkamp & Fresco (1996). Their spatially explicit model uses statistical relationships to identify land use drivers at different scale levels and accounts for dynamic interaction among these drivers. It can be used to project future land use changes, and to analyse possible impacts of changes in land use drivers. In general, studies used in the phase of problem definition should show probable developments in land use for the near future, if trends do not really change, and as such, project the current situation and likely developments to the near future. Their results should stimulate political and societal agreement on the need for intervention to prevent that probable developments become reality.
After the phases problem definition and creating consensus on the need for intervention, in general the policy debate often shifts towards the policy measures before having identified the policy objectives. Reason may be that it is much easier to discuss concrete policy measures instead of more abstract objectives and their consequences. There might also be a political reason for not being too explicit about policy objectives: consequences might be poorly understood, or consequences may be foreseen but unpopular. Studies combining biophysical opportunities and limitations with societal objectives explore ultimate options and conse- quences of priorities. They might be very effective in showing technical and biophysical possibilities and limitations of the agricultural system, and in creating consensus on objectives, and a targeted identification of policy instruments.
The final phase, the phase of identification of policy measures, requires more predictive studies again. The studies should show probable and plausible results of sets of policy meas- ures. The last section of this paper addresses some features of systems approaches that might be useful for this phase of policy development.
The SysNet project primarily focuses on exploration of land use options, particularly addressing the phase of identifying policy objectives. When formulating objectives for future

6
land use, there usually is consensus on striving for ‘sustainable land use’, but there will probably be as many perceptions on its meaning and implications as there are stakeholders. Sustainable land use comprises ecological, agro-technical and socio-economic requirements. These can be regarded as objectives and constraints that are given different priority by the various stakeholders. Operationalizing sustainable development is equivalent to finding com- promises that are acceptable to the various stakeholders involved. The Netherlands Scientific Council for Government Policy pointed out in their report Sustained risks, a lasting phenomenon (WRR, 1995) that priorities for various objectives are driven by perceived needs and risks related to socio-economic systems and ecosystems. All causes and effects of human activities are appreciated differently by the various stakeholders as a result of differing ideo- logical preferences or aspirations. This implies that for the initiation of a land use policy there is no use in coming up with a single option to be accepted by all parties involved, since that denies the presence of different perceptions of needs and risks. Consensus can only be the result of a debate or a learning process in which different objectives are explicitly addressed and trade-offs among and consequences of objectives are revealed. It is here where science in the form of exploratory land use studies can contribute, i.e. to examine the technical feasibil- ity of meeting different sets of objectives and to analyse trade-offs among objectives. Thus, science shows the consequences of different appraisals of needs and risks involved in society and environment, thus providing an appropriate basis for discussion among stakeholders. This requires a method of analysis that discriminates between information on ( i ) value-driven preferences and ( ii ) science-driven information, to generate the consequences in terms of achievement of societal objectives, but also in terms of where to produce, what and how. Exploratory land use studies, as applied within SysNet, operationalize such a method.
How to analyse and present results of exploratory land use studies Exploratory land use studies as applied within SysNet use multiple goal linear programming (MGLP) as the integrating modelling tool. Results of an MGLP model run are characterized by the optimum objective values and the associated optimum set of decision variables (agri- cultural land use activities: where, what type of agriculture to which extent). Such results can be presented in a table or a bar diagram showing the objective values, and in a map showing the optimum land use allocation. Numerous runs can be made with the model, each representing a different priority setting of objectives, resulting in different optimum land use allocations. So far results of exploratory studies have been presented for so-called alternative scenarios (Veeneklaas et al., 1991; Rabbinge et al., 1994; Stoorvogel et al., 1995). In a study for the European Union (Rabbinge et al., 1994; WRR, 1992), four land use scenarios have been defined and evaluated: Free trade and Free market, Regional Development, Nature and Landscape, and Environmental Protection. The scenarios have been derived from policy documents and interviews with policy-makers. Each of the four scenarios represents a differ- ent priority setting of the objectives and is evaluated in the study by the consequences of these priorities in terms of objective values and in terms of optimum land use allocation within the European Union. Scenarios and the way they are evaluated and presented, such as in the European Union study, may be very effective in stimulating discussion on strategic land use options, defining policy objectives and directing discussion on effective policy means. However, such scenario analyses using linear programming (LP) models also have some
7
limitations. First, an exact definition of a limited number of scenarios, fully representing the range of
priorities among objectives that might prevail in the policy arena, will always be a very difi- cult task. Secondly, and more importantly, the presentation of a limited number of scenarios as such lacks information on robustness of the scenario results and on the main aspects of agricultural production characterizing optimal solutions or options. For instance, do regional differences in physical environments (‘where’) determine which land use allocations are optimal, or do differences among production systems (‘what’) or differences among production techniques (‘how’) rather determine optimally. In short, presentation of a limited number of alternative land use options can only partly summarize the results of an exploratory study. The policy-maker still lacks suffjcient information on the aspects of agricultural production (where, what and how) that really make a difference in policy making, and on the aspects that are, or are not worthwhile to consider in the definition of policy objectives and policy means. This has to do with (i) a continuous range of priority setting that might occur (as opposed to a limited number of scenarios), and (ii) technical features of LP models.
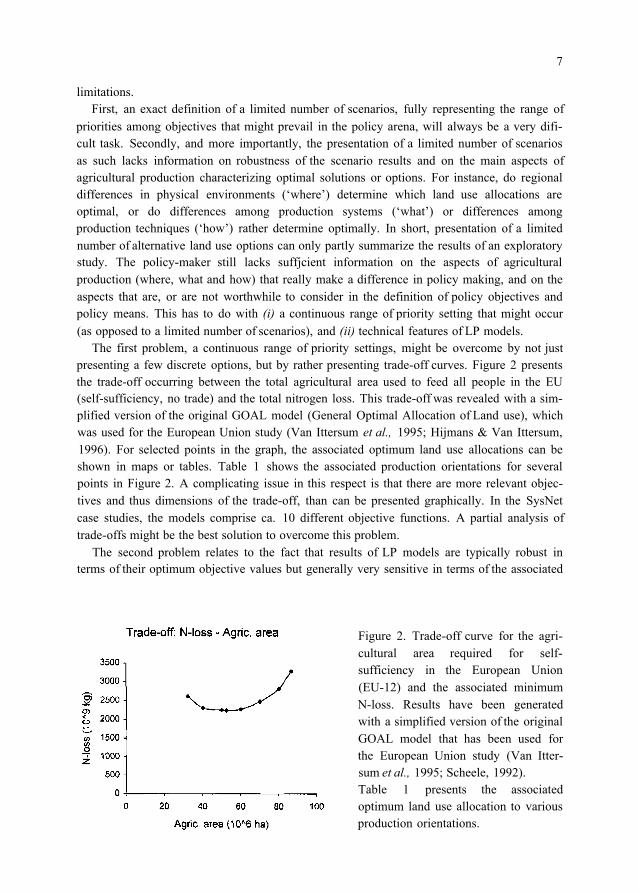
The first problem, a continuous range of priority settings, might be overcome by not just presenting a few discrete options, but by rather presenting trade-off curves. Figure 2 presents the trade-off occurring between the total agricultural area used to feed all people in the EU (self-sufficiency, no trade) and the total nitrogen loss. This trade-off was revealed with a sim- plified version of the original GOAL model (General Optimal Allocation of Land use), which was used for the European Union study (Van Ittersum et al., 1995; Hijmans & Van Ittersum, 1996). For selected points in the graph, the associated optimum land use allocations can be shown in maps or tables. Table 1 shows the associated production orientations for several points in Figure 2. A complicating issue in this respect is that there are more relevant objec- tives and thus dimensions of the trade-off, than can be presented graphically. In the SysNet case studies, the models comprise ca. 10 different objective functions. A partial analysis of trade-offs might be the best solution to overcome this problem.
The second problem relates to the fact that results of LP models are typically robust in terms of their optimum objective values but generally very sensitive in terms of the associated
Figure 2. Trade-off curve for the agri- cultural area required for self- sufficiency in the European Union (EU-12) and the associated minimum N-loss. Results have been generated with a simplified version of the original GOAL model that has been used for the European Union study (Van Itter- sum et al., 1995; Scheele, 1992). Table 1 presents the associated optimum land use allocation to various production orientations.

8
Table 1. Different agricultural areas used to realize self-sufficiency in the European Union, associated minimum N-loss and associated optimum land use allocation to five different production orientations*. Results were calculated with the simplified GOAL model (Van Ittersum et al., 1995).
Agric. area (10 6 ha)
32.3 40 50 52.5 60 70 80 86.6
N-loss (10 9 ha)
2605 2309 224 1 2234 2266 2475 2815 3269
Relative allocation to different production orientations (%)
YOP* YOW EOP EOW LOA 100 86 66 58 17 17 3 7 2
7 46 30 31
6
6 17 36
14 34 35 37 47 50 49
* YOP: Yield-Oriented Potential; YOW Yield-Oriented Water-limited; EOP: Environment-Oriented Potential; EOW: Environment-Oriented Water-limited; LOA: Land use-Oriented (see also Rabbinge et al., 1994).
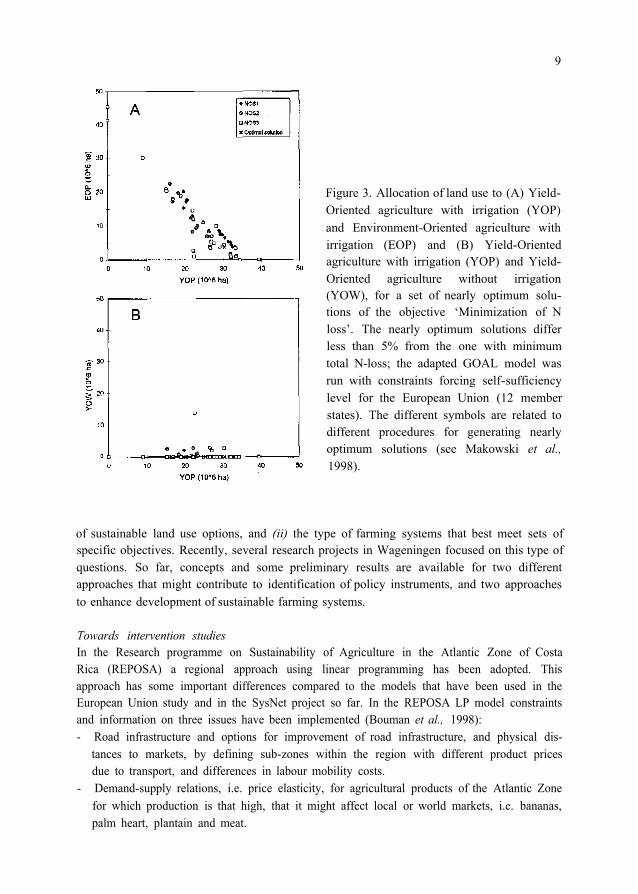
optimum land use (Scheele, 1992; Hijmans & Van Ittersum, 1996). To put it differently: several, often very different land use allocations, result in similar objective values, which is not necessarily an artefact of the model, but may represent reality as well. Default, LP models just generate the optimum solution. Makowski et al. (1998) have elaborated various procedures to generate nearly optimum solutions, differing only slightly in objective values but greatly in terms of land use allocation. Figure 3A graphically presents land use allocation to production orientations (‘how’ to produce) of a set of solutions of the adapted GOAL model that differ less than 5% from the one with minimum total N-loss for total agricultural production within the EU. In this figure, only two out of five production orientations are considered: Yield-Oriented Agriculture with irrigation (YOP), and Environment-Oriented Agriculture with irrigation (EOP). It can be concluded from this figure that these production orientations are highly equivalent in terms of nitrogen loss, since they can be easily substituted in nearly optimum solutions. The figure showing substitutability of YOP and Yield-Oriented Agriculture without irrigation (YOW) is very different (Figure 3B), indicating that solutions that are (nearly) optimal in terms of nitrogen loss, will primarily be associated with irrigated agriculture. The challenge is to present results of MGLP models in such a way, that stakeholders can easily identify those aspects of agricultural land use that really make a difference in satisfying different objectives. Should policy-makers target policy instruments to re-allocation of land use among (sub-)regions, to a change in agricultural production systems or to different production technologies?
From exploratory land use studies towards designing land use policies and farming systems As argued above, exploratory studies aim at supporting definition of policy objectives. Two important questions that come up after defining policy objectives, and even while defining policy objectives, are ( i ) which type of policies should be promoted to stimulate development
9
Figure 3. Allocation of land use to (A) Yield- Oriented agriculture with irrigation (YOP) and Environment-Oriented agriculture with irrigation (EOP) and (B) Yield-Oriented agriculture with irrigation (YOP) and Yield- Oriented agriculture without irrigation (YOW), for a set of nearly optimum solu- tions of the objective ‘Minimization of N loss’. The nearly optimum solutions differ less than 5% from the one with minimum total N-loss; the adapted GOAL model was run with constraints forcing self-sufficiency level for the European Union (12 member states). The different symbols are related to different procedures for generating nearly optimum solutions (see Makowski et al., 1998).
of sustainable land use options, and (ii) the type of farming systems that best meet sets of specific objectives. Recently, several research projects in Wageningen focused on this type of questions. So far, concepts and some preliminary results are available for two different approaches that might contribute to identification of policy instruments, and two approaches to enhance development of sustainable farming systems.
Towards intervention studies In the Research programme on Sustainability of Agriculture in the Atlantic Zone of Costa Rica (REPOSA) a regional approach using linear programming has been adopted. This approach has some important differences compared to the models that have been used in the European Union study and in the SysNet project so far. In the REPOSA LP model constraints and information on three issues have been implemented (Bouman et al., 1998): - Road infrastructure and options for improvement of road infrastructure, and physical dis-
tances to markets, by defining sub-zones within the region with different product prices due to transport, and differences in labour mobility costs.
- Demand-supply relations, i.e. price elasticity, for agricultural products of the Atlantic Zone for which production is that high, that it might affect local or world markets, i.e. bananas, palm heart, plantain and meat.

10
- Labour market: it is assumed that extra labour can be drawn from the non-agricultural labour force in and outside the Atlantic Zone, but at a certain cost, which increases with increasing labour demand.
Partly as a consequence of above-mentioned aspects, the LP model is a model with just one objective function, i.e. maximizing the regional economic objective. Priorities on other objec- tives related to land use (e.g. environmental and social) can be analysed by changing bounds on constraints related to these issues.
This type of modelling enables analysis of consequences of current infra-structural and socio-economic constraints by running the model with and without these constraints. In addi- tion, possible effects of hypothetical, improved infrastructure or changed labour or product markets could be analysed 1 . The REPOSA model has been developed basically for the regional level of scale, to explore optimum land use allocations and to assess possible impacts of infrastructure or market changes. However, this model is, per definition, not capable of predicting impacts of particular policy instruments. The level of scale at which ultimate land use decisions are merely taken is the farm level, which is not addressed in this type of model- ling. In addition, apart from price elasticity, no behavioural component is included in the REPOSA (nor SysNet) type of models. The research project of Sustainable land use and Food Security in the Tropics (Dutch abbreviation: DLV) attempted to address this issue.
In the DLV project, a farm household modelling approach was developed, capable of assessing possible impacts of policy instruments, both for the farm, and aggregated regional level (Kruseman et al., 1995; Kruseman & Bade, 1998). Farm household decisions on allo- cation of land, labour and capital resources for crop and production technique choice are simulated, taking into account resource availability, household objectives and prevailing market conditions. The modelling approach relies on ( i ) farm household modelling focusing on farm household behaviour; ( ii ) linear programming for assessment of performance of actual and alternative production options in terms of several objectives, and ( iii ) partial equi- librium analysis for assessing interactions between farm households. The aim of the approach is to evaluate the impact or effectiveness of technology improvement, improvement of infra- structure, price support, etc., in economic and environmental terms (Kruseman & Bade, 1998). From a theoretical point of view the methodology is very promising, and the type of results seems to be highly relevant. The method has been applied twice in a research setting (Mali and Costa Rica) and the main challenge is now to test applicability and effectiveness in a context with stakeholders.
Towards design of sustainable farming systems Implementation of sustainable land use also requires on-farm development of sustainable farming systems. Research and development could focus on important components of the farming system, e.g., integrated nutrient management or integrated pest management (see e.g. Kenmore, 1991), but could and should also address whole-farm design. The last decade a promising empirically based methodology for developing sustainable farming systems has
1 In fact, the basic idea of this type of analysis is very similar to analysis of possible effects and opportunities of introducing irrigation networks, that enable sharing water among sub-regions or municipalities, as suggested by Hijmans & Van Ittersum (1996) and Roetter & Hoanh (1998).

11
been put forward, i.e. prototyping (Vereijken, 1997). In close cooperation with commercial or experimental farms, farming systems are developed in an applied-oriented fashion. Four phases are distinguished: diagnosis, design, testing and improvement, and dissemination (Vereijken, 1997; Rossing et al., 1997a). In these subsequent steps, a hierarchy of objectives is established considering the shortcomings of current farming systems in a region. The objectives are transformed into a set of multi-objective indicators to quantify them, and a set of multi-objective farming methods is established, such as multi-functional crop rotation, inte- grated nutrient management, or integrated crop protection. Next, a theoretical prototype is designed by linking indicators to farming methods and designing the methods until they are ready for testing. The theoretical prototype is laid out on several pilot farms, to test and im- prove the prototype variants until the objectives have been achieved. Finally, the prototype variants are ready for being disseminated to other farms within the region. The method has been elaborated and tested in an European network. Results that are reported by e.g. Vereijken (1997) and Wijnands (1997) are impressive.
Complementary to this line of research and development of sustainable farming systems, model-based explorations for the farm level are put forward. Rossing et al. (1997a) identified two major shortcomings of prototyping: ( i ) only a few theoretical prototypes can be tested on- farm, resulting in a lack of information on trade-off among objectives; and ( ii ) systems design is based on expertise summarized in simple rules, which narrows views on the range of avail- able options and obscures understanding of the system. Model-based explorations enable nu- merical computation and evaluation of numerous alternative theoretical prototypes. They reveal trade-offs among partly conflicting economic and environmental objectives. In addition they synthesize detailed knowledge about components of farming systems and enable a better understanding of relations between components and their effects on systems behaviour. Promising examples of such model-based explorations have been presented by Rossing et al. (1997a, b). In fact philosophy and approach of these model-based explorations for the farm level, is very similar to the one adopted by SysNet, for the regional level. Rossing et al. (1997a) argue that model-based explorations can be very complementary to prototyping, particularly for identifying a wide range of theoretical prototypes and for learning about options and limitations of the system.
Much methodological research has been done and much more should be done in the sphere of generating relevant policy information with exploratory land use studies and in the sphere of designing strategic policies and sustainable farming systems. Eco-regional projects, such as SysNet, should play an important role in this scene. In this section, we sketched some ideas based on on-going projects in Wageningen, which might supply interesting and relevant ideas for possible next phases of SysNet. For all such methodologies it applies that a critical success factor of their application lies in creating a setting in which stakeholders are fully involved, thus stimulating awareness, right interpretation, and true decision support. SysNet methodology and suggested items for possible next phases integrate existing knowledge on field, crop and animal level, and may stimulate and direct future research for these lower levels of scale. For the higher levels of scale, SysNet’s current focus and the suggested topics for its next phases are highly complementary in developing strategic land use policies and operationalizing a sustainable land use that satisfies a range of societal objectives.

12
References Alexandratos, N., 1995. World agriculture: Towards 2010. An FAO study. FAO and John
Wiley & Sons, Chichester, UK, 488 pp. Becker, H.A. & G. Dewulf, 1989. Terugkijken op toekomstonderzoek (Reviewing future re-
search - in Dutch). Interdisciplinair Sociaal-wetenschappelijk Onderzoeksinstituut Rijks- universiteit Utrecht - ISOR, University of Utrecht, The Netherlands, 440 pp.
Boman, B.A.M., R.A. Schipper, A. Nieuwenhuyse, H. Hengsdijk & H.G.P. Jansen, 1998. Quantifying economic and environmental trade-offs in land use exploration at the regional level: A case study for the Northern Atlantic Zone. (in prep.)
capacity. Worldwatch Environmental Alert Series. Earthscan, London, UK, 261 pp.
models to explore land use options. Neth. Journal of Agricultural Science 44, 145-162. Kenmore, P.E., 1991. How rice farmers clean up the environment, conserve biodiversity, raise
more food, make higher profits – Indonesia’s IPM-model for Asia. FAO Inter-Country Programme for Integrated Pest Control in Rice and South and South-East Asia, Manila, Philippines, 56 pp.
Kruseman, G. & J. Bade, 1998. Agrarian policies for sustainable land use: Bio-economic modelling to assess the effectiveness of policy instruments. Agricultural Systems 5, 465- 481.
Kruseman, G., R. Ruben, H. Hengsdijk & M.K. Van Ittersum, 1995. Farm household model- ling for estimating the effectiveness of price instruments in land use policy. Neth. Journal of Agricultural Science 43, 111-123.
Makowski, D., E.M.T. Hendrix, M.K. Van Ittersum & W.A.H. Rossing, 1998. A framework to study nearly optimal solutions of linear programming models developed for agricultural land use exploration. Technical Note 98-6, Sub-department Mathematics, Wageningen Agricultural University, Wageningen, The Netherlands, 16 pp.
Rabbinge, R., 1995. Eco-regional approaches, why, what and how. In: Eds J. Bouma, A. Kuyvenhoven, B.A.M. Bouman, J.C. Luyten & H.G. Zandstra, Eco-regional approaches for sustainable land use and food production. Kluwer Academic Publishers, Dordrecht, The Netherlands, pp. 3-11.
Rabbinge, R., C.A. Van Diepen, J. Dijsselbloem, G.J.H. De Koning, H.C. Van Latesteijn, E. Woltjer & J. Van Zijl, 1994. Ground for choices: A scenario study on perspectives for rural areas in the European Community. In: Eds L.O. Fresco, L. Stroosnijder, J. Bouma & H. Van Keulen, The Future of the land: Mobilising and integrating knowledge for land use options. John Wiley & Sons, Chichester, UK, pp. 95-121.
Roetter, R. & C.T. Hoanh, 1998. The systems research network for ecoregional land-use planning in Tropical Asia. Progress and Outlook. In: Proceedings of the ‘Methodological Research at the Ecoregional Level - Review Workshop’, held at ISNAR, The Hague, April 20-22, 1998. International Service for National Agricultural Research, The Hague, The Netherlands, pp. 21-37.
Roetter, R., C.T. Hoanh & P.S. Teng, 1998. A systems approach to analyzing land use options for sustainable rural development in South and Southeast Asia. IRRI Discussion Paper Series No 28, International Rice Research Institute, Los Baños, Philippines, 110 pp.
Brown, L.R. & R. Kane, 1995. Full house: Reassessing the earth’s population carrying
Hijmans, R.J. & M.K. Van Ittersum, 1996. Aggregation of spatial units in linear programming

13
Rossing, W.A.H., J.M. Meynard & M.K. Van Ittersum, 1997a. Model-based explorations to support development of sustainable farming systems: Case studies from France and The Netherlands. European Journal of Agronomy 7, 271-283.
Rossing, W.A.H., J.E. Jansma, F.J. De Ruijter & J. Schans, 1997b. Operationalizing sustainability: Exploring options for environmentally friendly flower bulb production sys- tems. European Journal of Plant Pathology 103, 217-234.
Scheele, D., 1992. Formulation and characterization of GOAL. Technical Working Document (W64), Netherlands Scientific Council for Government Policy (WRR), The Hague, The Netherlands, 64 pp.
Stoorvogel, J.J., R.A. Schipper & D.M. Jansen, 1995. USTED: A methodology for a quantita- tive analysis of land use scenarios. Neth. Journal of Agricultural Science 43, 5-18.
Van Ittersum, M.K., R.J. Hijmans & D. Scheele, 1995. Description and user guide of GOAL- QUASI: An IMGLP model for the exploration of future land use. Quantitative Approaches in Systems Analysis, no 2. DLO-Research Inst. for Agrobiology and Soil Fertility and C.T. de Wit Graduate School for Production Ecology, Wageningen, The Netherlands, 19 pp.
Van Ittersum, M.K., R. Rabbinge & H.C. Van Latesteijn, 1998. Exploratory land use studies and their role in strategic policy making. Agricultural Systems 58, 309-330.
Veeneklaas, F.R., S. Cissé, P.A. Gosseye, N. Van Duivenbooden & H. Van Keulen, 1991. Competing for limited resources: The case of the Fifth region of Mali. Report 4. Develop- ment scenarios. CABO/ESPR, CABO, Wageningen, The Netherlands, 144 pp.
Veldkamp, A. & L.O. Fresco, 1996. CLUE-CR: An integrated multi-scale model to simulate land use change scenarios in Costa Rica. Ecological Modelling 91, 231-248.
Vereijken, P., 1997. A methodical way of prototyping integrated and ecological arable farm- ing systems (I/EAFS) in interaction with pilot farms. European Journal of Agronomy 7,
Wijnands, F.G., 1997. Integrated crop protection and environment exposure to pesticides: Methods to reduce use and impact of pesticides in arable farming. European Journal of Agronomy 7, 251-260.
WRR, 1992. Ground for choices. Four perspectives for the rural areas of the European Community. Netherlands Scientific Council for Government Policy, Reports to the Government nr. 42, The Hague, The Netherlands, 149 pp.
WRR, 1995. Sustained risks, a lasting phenomenon. Netherlands Scientific Council for Government Policy, Reports to the Government nr. 44, The Hague, The Netherlands, 205 pp.
235-250.

Use of crop simulation models and alternative yield estimation techniques for optimizing agricultural land use and resource management
R. Roetter 1 , P.K. Aggarwa l 2 , P.S. Tan 3 , C.T. Hoanh 1 , J.M.C.A. Cabrera 1 and B. Nunez 1
1 International Rice Research Institute (IRRI), P.O. Box 3127, Makati Central Post Office, 1271 Makati City, Philippines E-mail: [email protected]
2 Indian Agricultural Research Institute (IAN), New Delhi-110012, India 3 Cuu Long Delta Rice Research Institute (CLRRI), O Mon, Can Tho, Vietnam
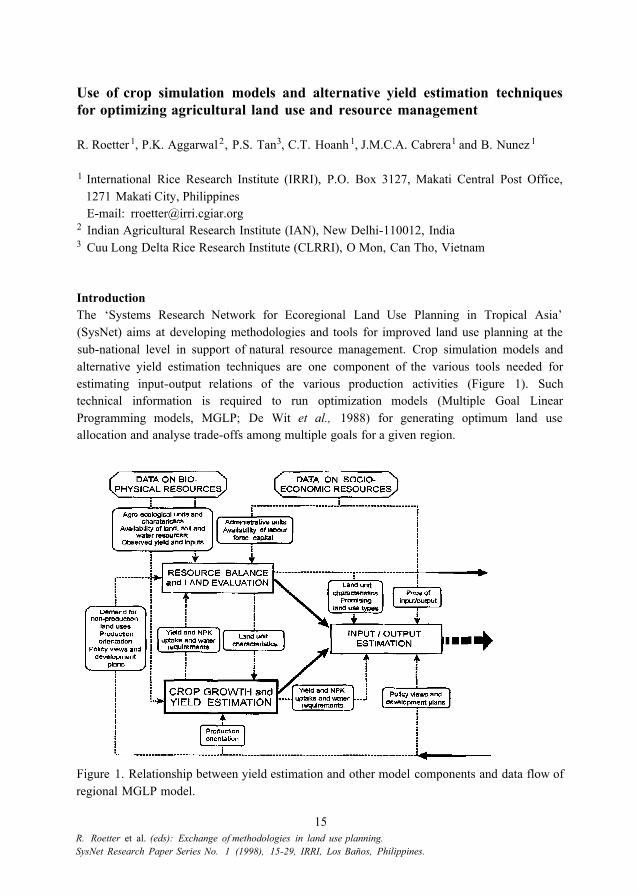
Introduction The ‘Systems Research Network for Ecoregional Land Use Planning in Tropical Asia’ (SysNet) aims at developing methodologies and tools for improved land use planning at the sub-national level in support of natural resource management. Crop simulation models and alternative yield estimation techniques are one component of the various tools needed for estimating input-output relations of the various production activities (Figure 1). Such technical information is required to run optimization models (Multiple Goal Linear Programming models, MGLP; De Wit et al., 1988) for generating optimum land use allocation and analyse trade-offs among multiple goals for a given region.
Figure 1. Relationship between yield estimation and other model components and data flow of regional MGLP model.
15 R. Roetter et al. (eds): Exchange of methodologies in land use planning. SysNet Research Paper Series No. 1 (1998), 15-29, IRRI, Los Baños, Philippines.
16
Land use planning can be defined as the systematic assessment of land and water potential, alternatives for land use and economic and social conditions. FAO (1995) presented land use planning as a two-stage approach — output from the physical land evaluation becomes the input for socio-economic evaluation. In physical land evaluation (stage 1), agro-ecological units are identified and these are compared with the environmental requirements of possible crops that can be produced from it. The essence of land evaluation is then to compare or match the requirements of each potential land use with the characteristics of each kind of land. It is also important that the various current and possible future types of production systems are identified for each unit, and that input-output relationships for the various alternative production activities are quantified in order to arrive at an optimum allocation of land use, both in economic and ecological terms.
Crop simulation models are one of the tools applied, in particular for the purpose of providing yield estimates of possible future types of crop production systems. In physical land evaluation, a range of alternative yield estimation techniques is applied to provide yield estimates for the different production levels ranging from potential to actual conditions.
This paper reviews the different types of yield estimation techniques applied in land use planning and discusses the advantages and disadvantages in view of the requirements of new approaches and associated decision support systems. Questions related to model evaluation and the choice of appropriate model complexity in relation to study purpose, data requirements and availability are discussed. Current work on developing a common tool for annual crops, the generic crop growth simulation model WOFOST (version 7.1) is presented. Pragmatic approaches to yield estimation for different production levels as applied in the four case studies of SysNet are described. The wide range of crop models/yield estimation techniques currently applied by the SysNet teams constitutes a compromise between information needs and data availability for agro-ecological characterization, model evaluation and applications. Finally, opportunities to develop a common biophysical modelling framework for SysNet are outlined.
SysNet’s hierarchical approach to yield estimation In late 1996, the ‘Systems Research Network for Ecoregional Land Use Planning in Tropical Asia was launched with the aim to develop methodology for determining land use options and to evaluate these methodologies for generating options for policy and technical changes in selected areas. The case study regions are States or Provinces, with total land area ranging from 0.30 to 4.39 million ha. Relatively homogeneous agro-ecological units, for which yield estimates have to be provided, may vary in size from approximately 25 to 200,000 ha, depending on the total land area and agro-ecological diversity of the target region. Input- output relations need to be quantified for, at least, three production situations:
Potential yield is achieved when nutrients and water are not limiting. Solar radiation, temperature, and crop characteristics solely determine crop growth. This is differentiated from attainable yield where crop growth is limited by abiotic resources such as water and/or macro-nutrients nitrogen, phosphorus or potassium. Attainable yield is further reduced to actual yield when pests and diseases affect crop growth. Differences between potential, attainable, and actual yield levels for poorly- to well-endowed physical environments are illustrated in Figure 2.

17
Figure 2. Production situations, production levels and associated growth factors (after Rabbinge et al., 1993)
In reality, usually more than just these three production situations are found, the gaps between potential, attainable and actual yields may vary widely and not always the way presented for the schematized types of physical environments in Figure 2. Moreover, there is usually a yield range for each production level, which depends on weather variability, specific management practices and their interaction. This range can vary widely among the various physical environments. Some general rules for resource management apply, however, when following this hierarchical approach: potential yields can be raised by new cultivars (or by controlling CO 2 concentrations and temperature as done in ‘greenhouses’); the gap between potential and attainable yields can be narrowed by (more) efficient use of water and nutrients, while the gap between attainable and actual yields can be narrowed by yield-protecting measures which are often exchangeable (such as labour, mechanization, and herbicides).
Modelling techniques and underlying principles A range of modelling approaches and techniques exist for estimating reference yields for the various production situations. These may be roughly grouped into four: (1) formal (mechanistic) crop simulation models, (2) empirical (statistical) crop yield models, (3) expert judgement and (4) surveys. In this section, principles underlying and incorporated in different crop yield model types/yield estimation approaches will be described. Different approaches to yield estimation are sometimes used in combination.
Yield can be expressed as a function of resource availability (e.g. water (W), solar radiation (R)) and resource use efficiency (e.g. g dry matter per g water used (WUE)) (Haverkort et al., 1997). In a first approximation, potential and water-limited yield can be estimated by calculating total dry matter production (De Wit, 1958) using the concepts of radiation use efficiency (Ritchie, 1983) and water use efficiency according to Monteith (1986,

18
1990), Muchow & Davis (1988), Sinclair & Hoxie (1989). To determine attainable yield level under nutrient-limited production data from fertilizer experiments can be used (Roetter & Dreiser, 1994; Roetter & Van Keulen, 1997). For unfertilized soil, the supply of (macro-) nutrients (N, P, K) can be introduced in crop simulation models as exogenous variables. Fertilizer requirements to arrive at both potential and water-limited yield can be calculated from fertilizer recovery fractions and calculated target yields of marketable products and crop residues with their crop specific minimum and maximum nutrient concentrations.
In a very simplified model, potential crop yield (Y) can be calculated based on the amount of intercepted radiation (R), the conversion efficiency (E), the harvest index (H) and dry matter yield (D):
Y = (R × E × H) / D
Such a model may be called a ‘generic skeleton crop model’ (IRRI, 1996).
Formal simulation models based on the slate variable approach Dynamic, process-based crop simulation models follow the state variable approach. This modelling approach is characterized by state, rate, and driving variables. The underlying assumption is that the state of the system at any moment can be quantified and that changes in the state can be described by mathematical equations (De Wit, 1982). Each state variable is associated with rate variables that characterize their rate of change at a certain time step. Driving variables are not part of the system but characterize environmental effects on the system. It depends on the position of the system boundaries, whether a variable is a state, driving or rate variable.
For a quantitative analysis of sustainable land use options, application of well-validated dynamic crop simulation models would have the clear advantage of providing both quantitative yield estimates and estimates of which of the different growth factors limits crop growth and production when and to what extent. Such models allow the user to identify yield constraints, determine yield probabilities and quantify inputs needed for a particular production level in the various agro-ecological zones. For many crops relevant to SysNet (Table 1) such models do not yet exist and we expect that during this phase of the project (1996-99) formal simulation models can only be applied with confidence for a quarter of the crops relevant to the study regions. Some alternative approaches as described in this section have to be followed.
Empirical (statistical) crop yield models A large number of linear, multiple regression models exists, where yield as the dependent variable is predicted on the basis of independent variables such as effective temperature during the growing season, intercepted radiation, ratio of precipitation plus stored soil water to potential evapotranspiration or certain soil properties (Olson & Olson, 1986; Van Diepen et al., 1991). Establishment of such statistical models usually requires a large amount of data, is location-specific and restricted to the management practices associated with the available yield data, This makes it often difficult apply such models for larger areas.
A yield estimation technique, that has been widely used in connection with the Agro- Ecological Zone (AEZ) concept (FAO, 1978), for predicting water-limited yield for larger

19
Table 1. Crops and cropping systems relevant to SysNet study regions. Relevant Crops Crops
Asparagus Bamboo Banana Barley Cacao Cashew Cempedak Chinese apple Ciku Coconut Cotton Cotton-rice Cotton-vegetables Dokong Durian Dusun Garlic Garlic-mungbean Gram Guava Hog plum (sour fruit)
Relevant to region* 3 3 2,4 1 4 3,4 2 4 2 2,4 1, 3 3 3 2 2,4 2 3 3 1 2,4 4
* 1 = Haryana State, India 2 = Kedah-Perlis, Malaysia
Crops
Jawar fodder/fodder Longan sapodilla Maize Mandarin Mango Mangostin Mungbean Mungbean-soybean Mustard Mustard-pearl millet Non-irrigated rice +
tobacco-irrigated Non-irrigated rice +
others-irrigated Oil palm Onion Orange Papaya Peanut (groundnut) Pearl millet (bajra) Pigeonpea
to region* 1 4 1,3,4 4 2,3,4 4 3,4 3 1 1
2,3
2,3 2 3 4 2,4 3 1 1
3 = Ilocos Norte, Philippines 4 = Can Tho Province, Vietnam
Pineapple Pomelo Rambutan Rice Rubber Soybean Starfruit Sugarcane Sweet pepper Thai custard fruit Tobacco Tomato Vegetables Watermelon Wheat Wheat-cotton Wheat-maize Wheat-pearl millet Wheat-rice
Relevant to region* 4 4 2, 4 1, 2, 3, 4 2 1, 3, 4 2 1, 2, 4 3 4 2, 3
1, 2, 3, 4 3
3 1 1 1 1 1
(Crops in bold: formal simulation models to be applied for estimating potential yield level)
areas is applicable where water availability is the overruling factor and where crop choice is in line with the suitable temperature range. The method has been elaborated and applied to 50 crops in about 90 agro-ecological zones and sub-zones in Kenya (33 districts) by Jaetzold & Schmidt (1982). Maximum crop yield (Ymax) for well-described physical environments is estimated on the basis of research station reports and highest farmers' yields in a series of years under best management practices. For well-defined crops, the corresponding maximum crop evapotranspiration (ETm) can be obtained according to Doorenbos & Kassam (1979) by computing crop development stage specific water requirement coefficients (kc) and evaporative demand (Eo) for each 10-day period from sowing to maturity (Figure 3):
ETm = kc × Eo.
In a next step, root development and other soil water balance components are taken into account to calculate actual water consumption (ETa) during the growing period, concluding with values for crop water supply. Subsequently, yield reduction (% of Ymax) is calculated based on crop development specific yield reduction values from the water supply deficit (Doorenbos & Kassam, 1979), or, more generally, is related to a water satisfaction index (FAO, 1986).
Consequently, yield levels (expected actual yield, Ya) and probabilities under water- limited conditions can be calculated. For larger areas (agro-ecological zones), water balance calculations and subsequent yield estimation can then be based on rainfall probabilities to determine yield variability and related risk.

20
Figure 3. Example of the automatic construction of the dynamic water requirement curve (kc curve) for a ‘normal’ crop (After: Jaetzold & Schmidt, 1982).
Expert judgement Expert judgement either based on ‘transfer by analogy’ (Nix, 1985) or on local knowledge gained from agronomic experiments, long-term farm records, regional yield statistics are often used to correct or supplement estimates of potential and attainable yield and they are often the only source to estimate actual yield level.
Such expert knowledge can be formalized. Of particular use are data from fertilizer experiments with a wide range of application rates and combinations of nitrogen, phosphorus and potassium (N, P, K). Results can be used to derive calculation rules for estimating yields under nutrient-limited conditions. An example for presenting indicators on nitrogen-use efficiency for rice cultivar OM997 obtained from experimental data from O Mon (Can Tho, Vietnam) is illustrated in Figure 4. By calculating fertilizer recovery fiactions under the prevailing climatic conditions, estimates of nutrient requirements for the various yield levels can be made. ‘Apparent fertilizer’ recovery fraction as defined by Van Keulen & Wolf (1986) is expressed in the following equation:
Rx = ( Uf,x - Uo,x ) / Ax
where: Rx = the recovery fraction of element x (kg kg-1) Uf,x = the uptake of nutrient x from fertilized field (kg ha-1) Uo,x = the uptake of nutrient x from control or unfertilized field (kg ha-1) Ax = the application of nutrient x to fertilized field (kg ha-1).

21
Surveys Farm survey data, often with large samples (as in the case of Can Tho Province, see Lai et al., 1998, this volume) often grouped by agro-ecological units are a valuable source for estimating actual yield and even can be supportive to estimate attainable yields for a wide range of crops under different agro-ecological conditions. Farm survey data for yield estimation are being used extensively in all ongoing SysNet case studies.
Choice of model complexity The core problem, how to provide reliable estimates of yield for the various crops and crop rotations under different crop management practices (and production levels) in different physical environments is related to the question of appropriate model complexity in relation to study purpose, data availability and requirements (Wopereis, 1993). In estimating target yields under different production situations as a reference for determining possibilities to im- prove resource-use efficiencies, various time and spatial scales need to be considered. One of the main problems to be resolved in each specific case study is then how to treat the many dif-
Figure 4. Relationship between total nitrogen (N) uptake and biomass production, N application rate and N uptake, and between N application rate and biomass production as observed for rice variety OM997 in 1995-96 at O Mon, Can Tho, Vietnam.
22
ferent spatially and temporally varying parameters that are used as input to process-based crop yield models. Furthermore, outputs from process-based models have to be considered as point data; thus, how can such models then be applied for estimating crop yields for larger areas? Basically, there are two approaches in that situation: - Aggregating model input data and parameters (averaging in time and space), assuming that
for larger areas, spatial averages and coarser time scales are sufficiently representative. - Separation of the target area as much as data allow into smaller units that are homogeneous
in terms of well-defined properties and subsequent calculation of yield for representative point data followed by aggregation of output (model results).
In SysNet, the second approach is applied, following the rule ‘first calculate, then aggregate’ (De Wit & Van Keulen, 1987), since the first approach neglects nonlinear relationships that exist between growth factors and yield and between individual input parameters. Van Diepen (1992) lists a number of negative examples for aggregation neglecting nonlinear relationships, such as defining an average soil type by averaging properties of very different soils.
Summary models (Bouman et al., 1996) derived from explanatory, comprehensive crop growth simulation models representing the most important interrelations among subsystems in the crop-weather-soil interface would be most suitable for the purpose of estimating potential and attainable yields as required for exploratory regional land use systems analysis. In gen- eral, the aim in SysNet is to simplify existing models (e.g. crop simulation models of the C.T. De Wit School, Figure 5) by reducing and balancing the number of state variables and processes essential for a given production situation with the number of data sets available. Criteria and some procedures for model simplification have been described by Roetter et al. (1998). One example of rigorous simplification is a ‘skeleton model’ for estimating potential dry matter production, named LINTUL (light interception and utilization) (Spitters & Schapendonk, 1990) derived from the ‘Simple and Universal Crop Simulator’ (SUCROS; Spitters et al., 1989; Spitters, 1990; Van Laar et al., 1997). LINTUL has been applied for broad regions and at global scale (Van Keulen & Stol, 1995; Luyten, 1995).
Current work on the generic crop simulation model WOFOST for annual crops One model of the CT De Wit School is the generic crop simulation model WOFOST (WOrld FOod STudies; Van Diepen et al., 1988, Bouman et al., 1996), one of the first application- oriented models to be derived from SUCROS (Figure 5). It was originally developed to assess the production potential of more than 20 annual crops in the tropics such as rice, tobacco, mungbean, and maize (Van Keulen & Wolf, 1986). Currently, this model is further developed for the purpose of improving land use planning methodology in the framework of SysNet (Boogaard et al., 1998).
WOFOST is designed for estimating potential and attainable yields — it does not include routines for estimating yield reduction due to pests and diseases. For estimating attainable yields, it distinguishes between water-limited and nutrient-limited production situations. In the water-limited situation, growth is limited by water shortage or oxygen deficit due to excess water for at least part of the growing period. In the nutrient-limited production, growth is limited by the shortage of one or more of the macro-nutrients (N, P, K). While potential and water-limited yields are estimated based on dynamic (daily time step) simulation of photosynthesis, dry potential growth rate, field water balance and reduced growth rate and
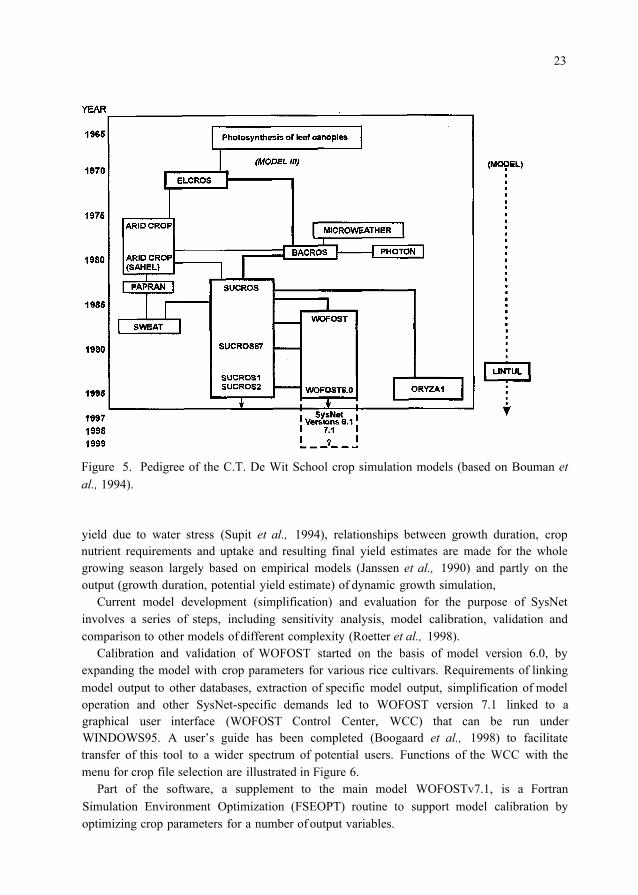
23
Figure 5. Pedigree of the C.T. De Wit School crop simulation models (based on Bouman et al., 1994).
yield due to water stress (Supit et al., 1994), relationships between growth duration, crop nutrient requirements and uptake and resulting final yield estimates are made for the whole growing season largely based on empirical models (Janssen et al., 1990) and partly on the output (growth duration, potential yield estimate) of dynamic growth simulation,
Current model development (simplification) and evaluation for the purpose of SysNet involves a series of steps, including sensitivity analysis, model calibration, validation and comparison to other models of different complexity (Roetter et al., 1998).
Calibration and validation of WOFOST started on the basis of model version 6.0, by expanding the model with crop parameters for various rice cultivars. Requirements of linking model output to other databases, extraction of specific model output, simplification of model operation and other SysNet-specific demands led to WOFOST version 7.1 linked to a graphical user interface (WOFOST Control Center, WCC) that can be run under WINDOWS95. A user’s guide has been completed (Boogaard et al., 1998) to facilitate transfer of this tool to a wider spectrum of potential users. Functions of the WCC with the menu for crop file selection are illustrated in Figure 6.
Part of the software, a supplement to the main model WOFOSTv7.1, is a Fortran Simulation Environment Optimization (FSEOPT) routine to support model calibration by optimizing crop parameters for a number of output variables.
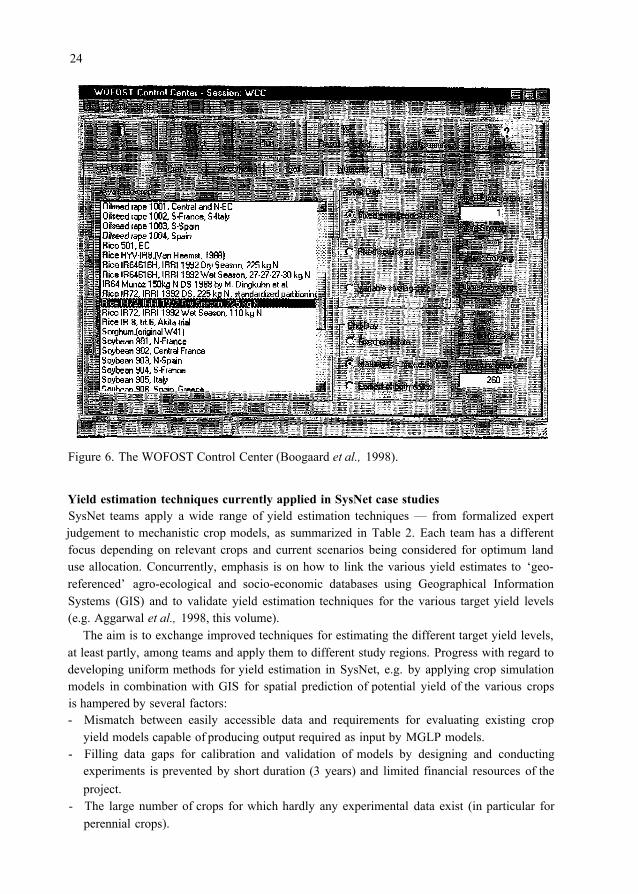
24
Figure 6. The WOFOST Control Center (Boogaard et al., 1998).
Yield estimation techniques currently applied in SysNet case studies SysNet teams apply a wide range of yield estimation techniques — from formalized expert judgement to mechanistic crop models, as summarized in Table 2. Each team has a different focus depending on relevant crops and current scenarios being considered for optimum land use allocation. Concurrently, emphasis is on how to link the various yield estimates to ‘geo- referenced’ agro-ecological and socio-economic databases using Geographical Information Systems (GIS) and to validate yield estimation techniques for the various target yield levels (e.g. Aggarwal et al., 1998, this volume).
The aim is to exchange improved techniques for estimating the different target yield levels, at least partly, among teams and apply them to different study regions. Progress with regard to developing uniform methods for yield estimation in SysNet, e.g. by applying crop simulation models in combination with GIS for spatial prediction of potential yield of the various crops is hampered by several factors: - Mismatch between easily accessible data and requirements for evaluating existing crop
yield models capable of producing output required as input by MGLP models. - Filling data gaps for calibration and validation of models by designing and conducting
experiments is prevented by short duration (3 years) and limited financial resources of the project.
- The large number of crops for which hardly any experimental data exist (in particular for perennial crops).

25
Table 2. Techniques and problems in yield estimation for the various case studies.
Case study Techniques and problems in yield estimation
Haryana (India)
Kedah-Perlis (Malaysia)
Ilocos Norte (Philippines)
Can Tho (Vietnam)
Crop models:
Other techniques: Focus:
Crop models: Other techniques:
Focus: Problems:
Crop models: Other techniques:
Focus:
Crop models:
Other lechniques: Focus:
WTGROWS (wheat), ORYZA1 and WOFOSTv7.1 (rice), WOFOSTv7.1 (mustard, gram, maize, pearl-millet, mungbean) Expert judgement based on experimental and survey data Model evaluation and integration of components into an elaborated crop yield modelling framework DSSAT, WOFOSTv7.1 (rice) Expert judgement based on experimental data and agricultural reports Yield estimation (attainable and actual) for perennial trees Scarcity of experimental data for perennial trees; huge number of varieties ORYZA1 and WOFOSTv7.1 (rice) Expert judgement based on experimental, survey data and agricultural statistics Yield estimation (attainable and actual) on the basis of recent experiments and agricultural statistics WOFOSTv7.1 and ORYZA1 (rice), WOFOSTv7.1 (sugarcane, mungbean and maize) Expert judgement based on survey data Yield estimation (actual) on the basis of survey data
In spite of delayed progress, enormous efforts have been and are being made to mobilize additional data sets from South and Southeast Asia and from countries with similar climatic conditions for crop model comparison and validation for a wide range of annual crops/crop cultivars. These include rice, wheat, maize, soybean, potato, mustard and pearl millet.
Outlook on required biophysical modelling framework for SysNet As shown in Figure 1, the components crop yield estimation and land evaluation are needed to generate technical coefficients for the input-output tables of crop production activities, and, there is mutual data exchange among these two components (e.g. on water and nutrient supply and crop requirements). Such interdependence requires standardization of databases and calculation rules for estimating the various outputs of the production system. This does not only pertain to desired outputs such as target crop yields, but also to inputs and undesired outputs such as nutrient requirements and nitrogen loss for a given cropping system. A biophysical modelling framework for crop production, integrating models and formalized knowledge (expert systems) based on different sources of information is outlined in Figure 7. Though the required inputs and outputs shown may slightly vary depending on agro- ecological conditions and study focus, the example contains the major elements of the agricultural production process.

26
Figure 7. Biophysical modelling framework for generating input-output tables for various crop production systems.
Conclusion A hierarchical procedure for analysing crop production activities at different technology levels is outlined. Such procedure is a key element for providing the technical information needed for exploring land use optians using the IMGLP method. Starting point is the estimation of target yields in different production situations, ranging from potential to actual yield levels. Different yield estimation techniques as applied in SysNet and their underlying concepts are introduced. So far, a generic crop simulation model for annual crops (WOFOST7.1) has been developed and adapted to the requirements of explorative land use studies. This summary model provides estimates of potential, water- and nutrient-limited yields as well as crop water and nutrient requirements integrating several well-established concepts of production ecology. Such estimates together with geo-referenced agro-ecological databases, observed yields and inputs (based on surveys and expert judgements) constitute the basis for developing biophysical modelling frameworks for representing the agricultural production process in a quantitative manner. In order to further elaborate and apply such formalized knowledge for optimizing yield and resource use in given physical environments, more data sets need to be mobilized and integrated to evaluate and adapt different models and expert systems for estimating yield and environmental effects. SysNet has the opportunity to develop such operational modelling frameworks for diverse agro-ecological conditions on the basis of best available local knowledge and well-established principles of production ecology.
References Aggarwal, P.K., N. Kalra, S.K. Bandyopadhyay, H. Pathak, V.K. Sehgal, R. Kaur, T.B.S.
Rajput, H.C. Joshi, R. Choudhary & R. Roetter, 1998. Exploring agricultural land use op- tions for the State of Haryana: Biophysical modelling. (this volume)
Boogaard, H.L., C.A. Van Diepen, R.P. Roetter, J.M.C.A. Cabrera & H.H. Van Laar, 1998.

27
User’s guide for the WOFOST7.1 crop growth simulation model and WOFOST Control Center 1.51. DLO-Winand Staring Centre, Wageningen, The Netherlands, Technical Document 52,140 pp.
Bouman, B.A.M., H. Van Keulen, H.H. Van Laar & R. Rabbinge, 1996. The ‘School of De Wit’ crop growth simulation models: A pedigree and historical overview. Agricultural Systems 52(2/3), 171-198.
De Wit, C.T., 1958. Transpiration and crop yields. Verslagen van Landbouwkundige Onderzoekingen (Agricultural Research Reports) 64.6, Pudoc, Wageningen, The Netherlands, 88 pp.
De Wit, C.T., 1982. Simulation of living systems. In: Eds F.W.T. Penning de Vries & H.H. Van Laar, Simulation of plant growth and crop production. Simulation Monographs, Pudoc, Wageningen, The Netherlands, pp. 3-8.
De Wit, C.T. & H. Van Keulen, 1987. Modelling production of field crops and its requirements. Geoderma 40,253-265.
De Wit, C.T., H. Van Keulen, N.G. Seligman & I. Spharim, 1988. Application of interactive multiple goal programming techniques for analysis and planning of regional agricultural development. Agricultural Systems 26(3), 211-230.
Doorenbos, J. & A.H. Kassam, 1979. Yield response to water. FAO Irrigation and Drainage Paper no. 33, Rome, Italy, 193 pp.
FAO, 1978. Report on the Agro-Ecological Zones Project. Methodology and Results for Africa. FAO World Soil Resources Report 48/1, Rome, Italy, 158 pp.
FAO, 1986. Early agrometeorological crop yield assessment. Plant Production and Protection Paper no. 73, Rome, Italy, 150 pp.
FAO, 1995. Planning for sustainable use of land resources. Towards a new approach. Background paper to FAO’s Task Managership for Chapter 10 of Agenda 21 of the UNCED. Food and Agriculture Organization, Rome, Italy, 60 pp.
Haverkort, A.J., H. Van Keulen & M.I. Minguez, 1997. The efficient use of solar radiation, water and nitrogen in arable farming: Matching supply and demand of genotypes. In: Eds M.K. Van Ittersum & S.C. Van de Geijn, Perspectives for agronomy - Adopting ecological principles and managing resource use. Elsevier, Amsterdam, The Netherlands, pp. 191 - 199.
IRRI, 1996. SysNet-A Systems Research Network to Develop Systems Methodology for Ecoregional Land Use Planning in Support of Sustainable Resource Management in Tropical Asia. A Project proposal submitted on behalf of four national agricultural systems by the International Rice Research Institute, P.O. Box 933, 1099 Manila, Philippines, 25 pp. (unpublished)
Jaetzold, R. & H. Schmidt (Eds), 1982. Farm management handbook of Kenya. Vol.II/A: West Kenya. Ministry of Agriculture/GAT Nairobi and GTZ Eschborn, 739 pp.
Janssen, B.H., F.C.T. Guiking, F. Van der Eijk, E.M.A. Smaling, J. Wolf & H. Van Reuler, 1990. A system for the Quantitative Evaluation of the Fertility of Tropical Soils (QUEFTS). Geoderma 46,299-318.
Lai, N.X., N.V. Luat, D.M. Jansen, C.T. Hoanh, N.T.H. Loc, P.S. Tan, V.T.K. Hoa, M.T. Quang, T.Q. Tuan, T.T.N. Huan, H.V. Nghiep, N.T. Cuong, F.Q. Hung & N.T.P. Nga, 1998. Application of the SysNet methodology in Vietnam: Preliminary results. (this
28
volume) Luyten, J.C., 1995. Sustainable world food production and environment. Agricultural
Research Department, Research Institute for Agrobiology and Soil Fertility, AB-DLO Report 37, AB-DLO and Delft Hydraulics, Wageningen and Delft, The Netherlands, 159 pp. + Appendices.
Monteith, J.L., 1986. How do crop manipulate water supply and demand. Phil. Trans. Roy. Soc. Lond A316, London, UK, pp. 245-259.
Monteith, J.L., 1990. Conservative behavior in the response of crops to water and light. In: Eds R. Rabbinge, J. Goudriaan, H. Van Keulen, F.W.T. Penning de Vries & H.H. Van Laar, Theoretical production ecology: Reflections and prospects. Simulation Monographs 34, Pudoc, Wageningen, The Netherlands, pp. 3-16.
Muchow, R.C. & R. Davis, 1988. Effect of nitrogen supply on the comparative productivity of maize and sorghum in a semi-arid tropical environment II. Radiation interception and biomass accumulation. Field Crops Research 18, 17-30.
Nix, H., 1985. Biophysical impacts: Agriculture. In: Eds R.W. Kates, J.H. Ausubel & M. Berberian, Climate impact assessment: Studies of the interaction of climate and society. Scientific Committee on Problems of the Environment (SCOPE), Chichester, UK, pp. 105- 130.
Olson, K.R. & G.W. Olson, 1986. Use of multiple regression analysis to estimate average corn yields using selected soils and climatic data. Agricultural Systems 20, 105-120.
Rabbinge, R, H.C. Van Latesteijn & J. Goudriaan, 1993. Assessing the greenhouse effect in agriculture. In: Environmental change and human health. Ciba Foundation Symposium 175, John Wiley & Sons, Chichester, UK, pp. 62-79.
Ritchie, J.T., 1983. Efficient water use in crop production. Discussion on the generality of relation between biomass production and evapotranspiration. In: Eds H.M. Taylor, W.R. Jordan & T.R. Sinclair, Limitations to efficient water use in crop production. American Society of Agronomy, Madison, USA, pp. 29-44.
Roetter, R. & C. Dreiser, 1994. Extrapolation of maize fertiliser trial results by using crop- growth simulation: Results for Murang’a District, Kenya. In: Eds L.O. Fresco, L. Stroosnijder, J. Bouma & H. Van Keulen, The future of the land: Mobilising and integrating knowledge for land use options. John Wiley & Sons, Chichester, UK, pp. 249- 260.
Roetter, R. & H. Van Keulen, 1997. Variations in yield response to fertilizer application in the tropics. II. Risks and opportunities for smallholders cultivating maize on Kenya's Arable land. Agricultural Systems 53,41-68.
Roetter, R., J.M.C.A. Cabrera & C.T. Hod, 1998, Development and evaluation of crop models for yield estimation at different scales, In: Eds R.P. Roetter, C.T. Hoanh & P.S. Teng, A systems approach to analyzing land use options for sustainable rural development in south and southeast Asia. IRRI Discussion Paper Series no. 28. International Rice Research Institute, Manila, Philippines, pp. 14-29.
Spitters, C.J.T., 1990. Crop growth models: Their usefulness and limitations. Acta Horticulturae 247, 345-363.
Spitters, C.J.T. & A.H.C.M. Schapendonk, 1990. Evaluation of breeding strategies for drought tolerance in potato by means of crop growth simulation. Plant and Soil 123, 193-

29
203. Spitters, C.J.T., H. Van Keulen & D.W.G. Van Kraalingen, 1989. A simple and universal
crop growth simulator: SUCROS87. In: Eds R. Rabbinge, S.A. Ward & H.H. Van Laar, Simulation and systems management in crop protection. Simulation Monographs 32, Pudoc, Wageningen, The Netherlands, pp. 147-181.
Sinclair, T.R. & T. Horie, 1989. Leaf nitrogen, photosynthesis, and crop radiation use efficiency: A review. Crop Science 29, 90-98.
Supit, I., A.A. Hooijer & C.A. Van Diepen (Eds), 1994. System description of the WOFOST 6.0 crop simulation model implemented in CGMS. Vol. 1: Theory and Algorithms. Joint Research Centre European Commission, Luxembourg, 144 pp.
Van Diepen, C.A., 1992. An agrometeorological model to monitor the crop state on a regional scale in the European Community: Concept, implementation and first operational outputs. In: Eds F. Tosselli & J. Meyer-Roux, Proceedings of the Conference on The Application of Remote Sensing to Agricultural Statistics, Villa Carlotta, Italy, Joint Research Centre, Commission of the European Communities, Ispra, Italy, pp. 269-277.
Van Diepen, C.A., C. Rappoldt, J. Wolf & H. Van Keulen, 1988. Crop growth simulation model WOFOST. Documentation version 4.1, SOW-88-01, Wageningen, The Netherlands, Centre for World Food Studies, 299 pp.
Van Diepen, C.A., J. Wolf, H. Van Keulen & C. Rappoldt, 1989. WOFOST: A simulation model of crop production. Soil Use and Management 5(1), 16-24.
Van Diepen, C.A., H. Van Keulen, J. Wolf & J.A.A. Berkhout, 1991. Land evaluation: From intuition to quantification. Advances in Soil Science 15, 139-204.
Van Keulen, H. & C.A. Van Diepen, 1990. Crop growth models and agro-ecological characterization. In: Ed. A. Scaife, Proceedings of the first congress of the European Society of Agronomy, 5-7 December 1990, Paris, CEC, ESA, INR4 session 2, pp. 1-16.
Van Keulen, H. & W. Stol, 1995. Agro-ecological zonation for potato production. In: Eds A.J. Haverkort & D.K.L. MacKerron, Potato ecology and modelling of crop under conditions limiting growth. Current Issues in Production Ecology Volume 3, Kluwer Academic Publishers, Dordrecht, The Netherlands, pp. 357-371.
Van Keulen, H. & J. Wolf (Eds), 1986.) Modelling of agricultural production: Weather, soils and crops. Simulation Monographs, Pudoc, Wageningen, The Netherlands, 478 pp.
Van Laar, H.H., J. Goudriaan & H. Van Keulen (Eds), 1997. SUCROS97: Simulation of crop growth for potential and water-limited production situations. DLO-Research Institute for Agrobiology and Soil Fertility and C.T. De Wit Graduate School for Production Ecology, Wageningen, The Netherlands. Quantitative Approaches in Systems Analysis no. 14, 52 pp. + Appendices.
Wopereis, M.C.S., 1993. Quantifying the impact of soil and climate variability on rainfed rice production. PhD thesis, Wageningen Agricultural University, The Netherlands, 188 pp.


Description of input-output relations for various production activities
D.M. Jansen 1
1 DLO-Winand Staring Centre for Integrated Land, Soil and Water Research (SC-DLO), Wageningen URC, P.O. Box 125, 6700 AK Wageningen, The Netherlands E-mail: [email protected]
Introduction Land evaluation as proposed by the FAO (FAO, 1976) comprises the determination of the suitability of defined agro-ecological units, i.e. specific combinations of climate, soil and other land characteristics, for specific land use types, i.e. crops and rotations. To a large extent, this form of land evaluation is a qualitative process: based upon subjective criteria, that depend on the evaluators, the suitability is defined in classes ranging from ‘good’ to ‘not suitable’. Apart from being subjective and often strongly bound to knowledge about the actual situation, there is little scope to include economic criteria into the evaluation process, nor of a weighing of options and constraints. Also, it is not possible to evaluate (assumed) effects of changes in technologies and prices. For scenario analysis addressing policy making, therefore, the FAO guidelines are not very suitable. To overcome the shortcomings in the FAO approach, quantitative tools for analysis and planning of land use are being developed, among others in the SysNet project. These methods include the possibility to select the ‘best’ combination of land use systems in a given situation. Also they allow the quantification of effects of indicated technologies on derived characteristics of land use such as economic feasibility, production capacity, input use and sustainability (Driessen, 1986; Van Diepen et al., 1991; Stomph et al., 1994). In many studies, quantitative methods are used to weigh interests and to relate land use options to goals and constraints imposed on them (e.g. Alcocilja & Ritchie, 1993; Fuchs & Murschel, 1992; Spharim et al., 1992; Stoorvogel et al., 1995; Stroosnijder & Van Rheenen, 1993; Veeneklaas et al., 1990). In these studies, scenarios are developed that reflect assumptions about expected or desired changes in the conditions for land use, such as prices and labour availability, in the various options for land use, such as different technologies to grow crops and, to a lesser extent, in land characteristics, such as the hydrological situation after flood control. The scenarios have been evaluated with an optimization model (linear programming, LP) that generates the optimal (allocation of) land use types considering the situation described (Figure 1).
The knowledge base and information about land use systems is continuously improving, and with it, the possibilities to quantify at least part of the many factors that are influenced by land use systems, such as nitrate leaching and phosphate accumulation, erosion or income. The relativity of the value of these factors and the methods to quantify them, makes that a description of land use systems on basis of these factors restricts its relevance to particular applications. A better approach is to describe land use systems in terms of operation sequences (i.e. listing all management operations) that include a quantification of all inputs
31 R. Roetter et al. (eds): Exchange of methodologies in land use planning. SysNet Research Paper Series No. 1 (1998). 31-40, IRRI, Los Baños, Philippines.
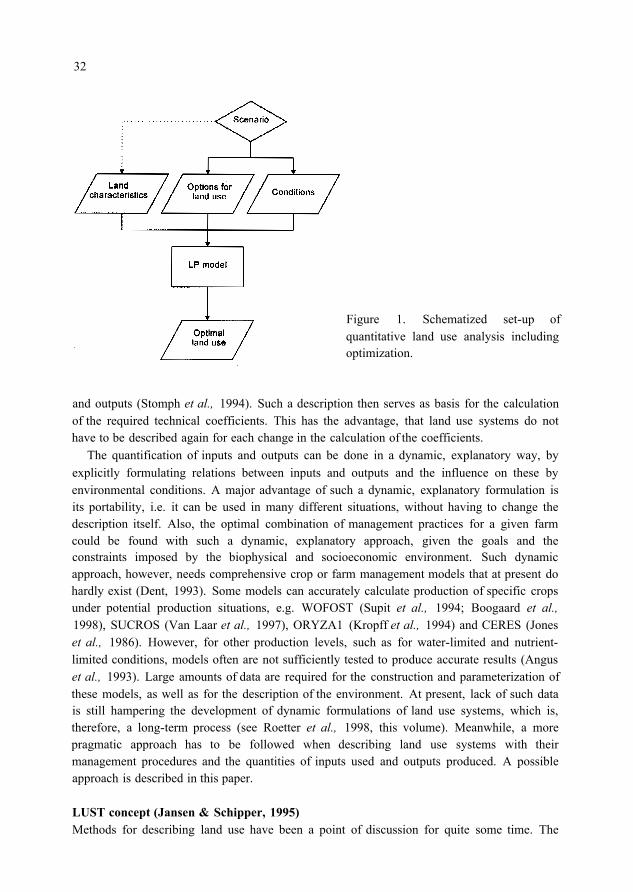
32
Figure 1. Schematized set-up of quantitative land use analysis including optimization.
and outputs (Stomph et al., 1994). Such a description then serves as basis for the calculation of the required technical coefficients. This has the advantage, that land use systems do not have to be described again for each change in the calculation of the coefficients.
The quantification of inputs and outputs can be done in a dynamic, explanatory way, by explicitly formulating relations between inputs and outputs and the influence on these by environmental conditions. A major advantage of such a dynamic, explanatory formulation is its portability, i.e. it can be used in many different situations, without having to change the description itself. Also, the optimal combination of management practices for a given farm could be found with such a dynamic, explanatory approach, given the goals and the constraints imposed by the biophysical and socioeconomic environment. Such dynamic approach, however, needs comprehensive crop or farm management models that at present do hardly exist (Dent, 1993). Some models can accurately calculate production of specific crops under potential production situations, e.g. WOFOST (Supit et al., 1994; Boogaard et al., 1998), SUCROS (Van Laar et al., 1997), ORYZA1 (Kropff et al., 1994) and CERES (Jones et al., 1986). However, for other production levels, such as for water-limited and nutrient- limited conditions, models often are not sufficiently tested to produce accurate results (Angus et al., 1993). Large amounts of data are required for the construction and parameterization of these models, as well as for the description of the environment. At present, lack of such data is still hampering the development of dynamic formulations of land use systems, which is, therefore, a long-term process (see Roetter et al., 1998, this volume). Meanwhile, a more pragmatic approach has to be followed when describing land use systems with their management procedures and the quantities of inputs used and outputs produced. A possible approach is described in this paper.
LUST concept (Jansen & Schipper, 1995) Methods for describing land use have been a point of discussion for quite some time. The
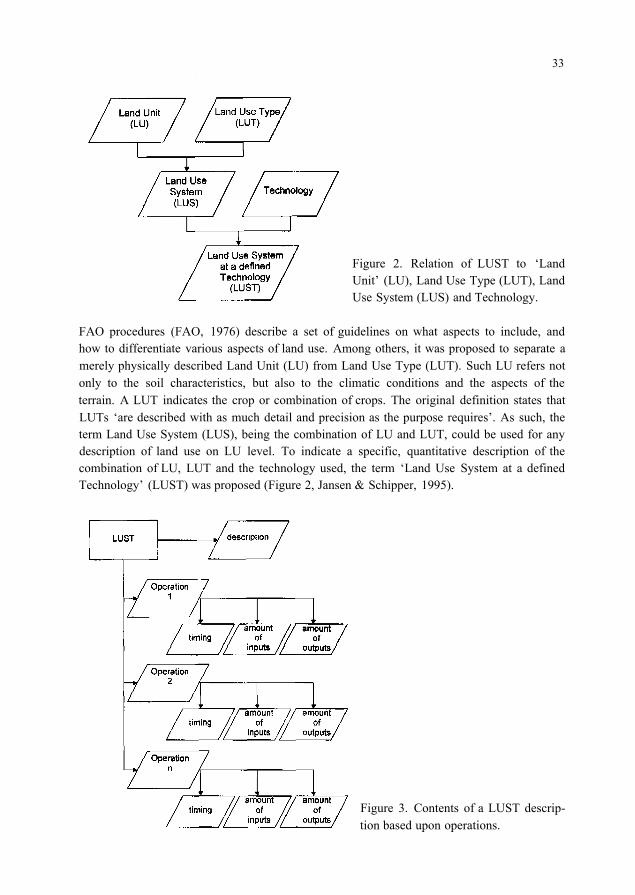
33
Figure 2. Relation of LUST to ‘Land Unit’ (LU), Land Use Type (LUT), Land Use System (LUS) and Technology.
FAO procedures (FAO, 1976) describe a set of guidelines on what aspects to include, and how to differentiate various aspects of land use. Among others, it was proposed to separate a merely physically described Land Unit (LU) from Land Use Type (LUT). Such LU refers not only to the soil characteristics, but also to the climatic conditions and the aspects of the terrain. A LUT indicates the crop or combination of crops. The original definition states that LUTs ‘are described with as much detail and precision as the purpose requires’. As such, the term Land Use System (LUS), being the combination of LU and LUT, could be used for any description of land use on LU level. To indicate a specific, quantitative description of the combination of LU, LUT and the technology used, the term ‘Land Use System at a defined Technology’ (LUST) was proposed (Figure 2, Jansen & Schipper, 1995).
Figure 3. Contents of a LUST descrip- tion based upon operations.
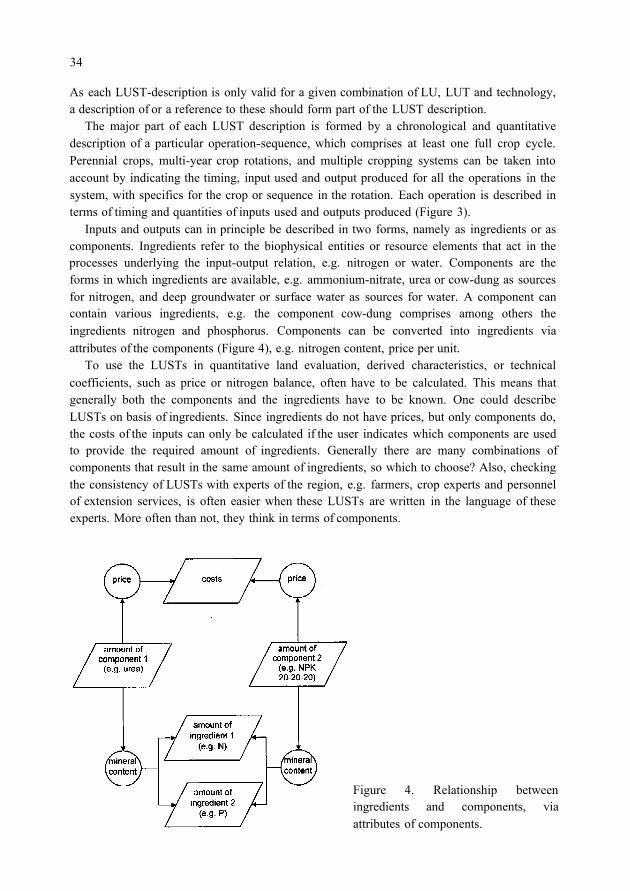
34
As each LUST-description is only valid for a given combination of LU, LUT and technology, a description of or a reference to these should form part of the LUST description.
The major part of each LUST description is formed by a chronological and quantitative description of a particular operation-sequence, which comprises at least one full crop cycle. Perennial crops, multi-year crop rotations, and multiple cropping systems can be taken into account by indicating the timing, input used and output produced for all the operations in the system, with specifics for the crop or sequence in the rotation. Each operation is described in terms of timing and quantities of inputs used and outputs produced (Figure 3).
Inputs and outputs can in principle be described in two forms, namely as ingredients or as components. Ingredients refer to the biophysical entities or resource elements that act in the processes underlying the input-output relation, e.g. nitrogen or water. Components are the forms in which ingredients are available, e.g. ammonium-nitrate, urea or cow-dung as sources for nitrogen, and deep groundwater or surface water as sources for water. A component can contain various ingredients, e.g. the component cow-dung comprises among others the ingredients nitrogen and phosphorus. Components can be converted into ingredients via attributes of the components (Figure 4), e.g. nitrogen content, price per unit.
To use the LUSTs in quantitative land evaluation, derived characteristics, or technical coefficients, such as price or nitrogen balance, often have to be calculated. This means that generally both the components and the ingredients have to be known. One could describe LUSTs on basis of ingredients. Since ingredients do not have prices, but only components do, the costs of the inputs can only be calculated if the user indicates which components are used to provide the required amount of ingredients. Generally there are many combinations of components that result in the same amount of ingredients, so which to choose? Also, checking the consistency of LUSTs with experts of the region, e.g. farmers, crop experts and personnel of extension services, is often easier when these LUSTs are written in the language of these experts. More often than not, they think in terms of components.
Figure 4. Relationship between ingredients and components, via attributes of components.
35
A problem when LUSTs are described with components only is that in each LUST the user has to estimate the efficiency of use of the component. Assume for example, that in a LUST the production of a certain amount of rice grain is described with a certain input of urea. This relation includes assumptions about the amount of nitrogen that is taken up by the rice crop following that application and the relation between uptake and production. When describing LUSTs with different input-output coefficients, one has to be careful that the assumptions in each LUST correspond to the assumptions in other LUSTs.
Target yield LUST generator approach To overcome part of these problems, an approach can be followed where required inputs are related to a given target yield and to the biophysical conditions at the location where this target yield has to be achieved. The following steps are required to make this approach open for examination by others and for improvements: 1. Assumptions about quantitative input-output relations are made explicit and are quantified.
The major relations are between: - Uptake of nutrients and physical production per unit area for a well-watered crop, free
of pests and diseases. - Fertilizer and manure application rate and the uptake of nutrients per unit area, also for a
crop that is well-watered and free of pests and diseases; estimates have to be provided of the apparent efficiency of fertilizer applications and of the nutrient availability per unit area for each soil type at zero fertilizer application; effects of technology can be included, e.g. a higher efficiency of application of drilled urea compared to broadcast urea.
- Irrigation (or drainage) and physical production per unit area, for a crop free of pests
- Effect of irrigation (or drainage) on the apparent efficiency of fertilizer applications and
- Physical production and the efficiency of control of weeds, pests and diseases. - Efficiency of control of weeds, pests and diseases and the technology of control; this
requires the description of strategy (timing, number of applications), substances (type of chemicals), and tools (equipment, traction); various options for the same efficiency of control could be described: e.g. replacement of cheaper pesticides by more expensive but more effective substances, replacement of pesticides by labour used for mechanical weeding.
and diseases and well supplied with nutrients.
soil nutrient availability per unit area.
- Labour use and input or output level per operation. - Effect of other factors, such as flooding depth, on the labour efficiency per operation.
2. A list of operations is made, comprising the following types of actions: - Land preparation - Seed/seedling preparation - Sowing/transplanting - Fertilizer, manure and compost application - Weed management - Pest and disease management - Harvesting - Post-harvest operations at the field or farm - Other crop maintenance operations, e.g. bird chasing, pruning.
3. A target yield level is chosen as the starting point for the LUST description. This yield level can be taken as a fraction of a simulated potential yield, the highest observed yield, or

36
an estimate by experts of the maximum yield possible. The yield has to be described in terms of the physical produce, e.g. rice grains at 14% moisture, or the weight of pineapples in defined quality classes.
4. A choice is made for the type of technology used in the operations that have different technology options, such as manual weeding instead of chemical weed control.
5. Inputs and outputs are calculated per operation. 6. LUST description is checked with experts,
The formulation of assumptions about quantitative input-output relations is a process that requires a lot of research. It is typically a process that can not be automated. Also the checking of the results has to be done ‘manually’. The other steps however, can very well be formalized into an automated procedure, e.g. in a database or in a spreadsheet (Figure 5).
Figure 5. Example of automated yield target LUST generator in spreadsheet EXCEL.
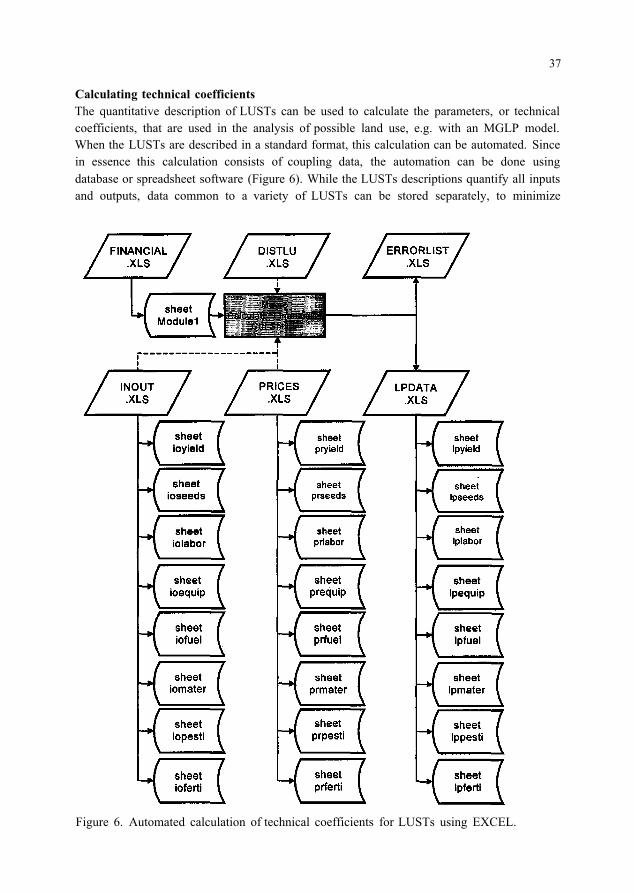
37
Calculating technical coefficients The quantitative description of LUSTs can be used to calculate the parameters, or technical coefficients, that are used in the analysis of possible land use, e.g. with an MGLP model. When the LUSTs are described in a standard format, this calculation can be automated. Since in essence this calculation consists of coupling data, the automation can be done using database or spreadsheet software (Figure 6). While the LUSTs descriptions quantify all inputs and outputs, data common to a variety of LUSTs can be stored separately, to minimize
Figure 6. Automated calculation of technical coefficients for LUSTs using EXCEL.
38
duplication, and to facilitate maintenance of the databases. These common data refer to the attributes of the components, e.g. prices, nutrient contents and toxicity. These attributes can be varied according to scenario, region or period. Users of LUST descriptions need to develop customized procedures to extract information from the LUST descriptions and the attribute databases, and to convert this information into coefficients for further analysis. To enable referencing between the various databases, a clear definition of the data is required, while unique identifiers should enable recognition of similar data in different databases.
Instead of first describing LUSTs and then calculating technical coefficients, the technical coefficients can be calculated immediately from the assumptions and formal description of LUSTs can be omitted (Hengsdijk et al., 1996). This approach is useful in a situation where the persons that describe the input-output relations for the crops have a good overview of the use of their data in the optimization model or other evaluation procedures. Furthermore, the ideas about type and number of technical coefficients, and the way they should be calculated, generally change faster than the assumptions about the input-output relations. While running scenarios with an MGLP model, e.g. on the effect of prices, it is quite common that insights gained from calculations result in the description of new scenarios. In that case, it is faster not to have to calculate all LUSTs again, but only to calculate new technical coefficients on the basis of existing LUSTs. Though MGLP models and methodology in SysNet adopted some of the concepts underlying LUST, the terminology applied is different (see Annex 2, this volume)
Conclusions Describing LUSTs and calculating technical coefficients is a time consuming job, and often requires creativity in formulating and quantifying the relations between the various inputs and outputs. Results of the LP model can strongly be affected by small differences in the efficiency of input use. It is, therefore, important that the descriptions of all LUSTs and the calculation of their technical coefficients are based on similar assumptions regarding the input-output relations. Formalized and automated procedures to describe LUSTs and to generate technical coefficients can be of great help to achieve a consistent set of LUSTs and technical coefficients.
The development of such automated procedures is typically a joint task of scientists, who provide the technical information, and information technologists that are able to develop the required software and database structure.
References Alcocilja, E.C. & J.T. Ritchie, 1993. Multicriteria optimization for a sustainable agriculture.
In: Eds F.W.T. Penning de Vries, P. Teng & K. Metselaar, Systems approaches for agri- cultural development. Kluwer Academic Publishers, Dordrecht, The Netherlands, pp. 381- 396.
Angus, J.F., J.W. Bowden & B.A. Keating, 1993. Modelling nutrient responses in the field.
Boogaard, H.L., C.A. Van Diepen, R.P. Roetter, J.M.C.A. Cabrera & H.H. Van Laar, 1998. User’s guide for the WOFOST7.1 crop growth simulation model and WOFOST Control Center 1.51. DLO-Winand Staring Centre, Wageningen, The Netherlands, Technical
Plant and Soil 155/156,57-66.
39
Document 52, 140 pp. Dent, J.B., 1993. Potential for simulation in farming systems research? In: Eds F.W.T.
Penning de Vries, P. Teng & K. Metselaar, Systems approaches for agricultural development. Kluwer Academic Publishers, Dordrecht, The Netherlands, pp. 325-339.
Driessen, P.M., 1986. Quantified land evaluation (QLE) procedures, a new tool for land use planning. Netherlands Journal of Agricultural Science 34, 295-300.
FAO, 1976. A framework for land evaluation. Soils Bulletin 32. FAO, Rome, 72 pp. Fuchs, C. & B. Murschel, 1992. Optimierung der N-Düngung unter Beachtung ökologisch-
ökonomischer Ziele. Agrarwirtschaft 41, 118-128. Hengsdijk, H., W. Quak & E.J. Bakker, 1996. A technical coefficient generator for land use
activities in the Koutiala region of South Mali. DLV-report 5, AB-DLO, Wageningen, The Netherlands, 96 pp.
Jansen, D.M. & R.A. Schipper, 1995. A static, descriptive approach to quantify land use sys- tems. Netherlands Journal of Agricultural Science 43, 31-46.
Jones, C.A., J.R. Kiniry, P.T. Dyke, D.B. Farmer & D.C. Godwin, 1986. CERES-maize: A simulation model of maize growth and development. College Station: Texas A&M University Press, 194 pp.
Kropff, M.J., H.H. Van Laar & R.B. Matthews (Eds), 1994. ORYZA1: An ecophysiological model for irrigated rice production. SARP Research Proceedings, AB-DLO, TPE-WAU, Wageningen, The Netherlands, and International Rice Research Institute, Los Baños, Philippines, 100 pp.
Spharim, I., R. Spharim & C.T. De Wit, 1992. Modelling agricultural development strategy. In: Eds Th. Alberda, H. Van Keulen, N.G. Seligman & C.T. De Wit, Food from dry lands. An integrated approach to planning of agricultural development. Kluwer Academic Publishers, Dordrecht, The Netherlands, pp. 159-192.
Stornph, T.J., L.O. Fresco & H. Van Keulen, 1994. Land use systems evaluation: Concepts
Stoorvogel, J.J., R.A. Schipper & D.M. Jansen, 1995. USTED: A methodology for quantita- tive analysis of land use scenarios. Netherlands Journal of Agricultural Science 43, 5-18.
Stroosnijder, L. & T. Van Rheenen, 1993. Making farming systems analysis a more objective and quantitative research tool. In: Eds F.W.T. Penning de Vries, P. Teng & K. Metselaar, Systems approaches for agricultural development. Kluwer Academic Publishers, Dordrecht, The Netherlands, pp. 341-353.
Supit, I., A.A. Hooijer, & C.A. Van Diepen, 1994. System description of the WOFOST 6.0 crop simulation model implemented in CGMS. Office for Official Publications of the European Commission, Luxembourg, 144 pp.
Van Diepen, C.A., H. Van Keulen, J. Wolf & J.A.A. Berkhout, 1991. Land evaluation: From intuition to quantification. Advances in Soil Sciences 15, 139-204.
Van Laar, H.H, J. Goudriaan & H. Van Keulen, 1997. SUCROS97: Simulation of crop growth for potential and water-limited production situations: As applied to spring wheat. Quantitative approaches in systems analysis 14, AB-DLO, Wageningen, The Netherlands,
Veeneklaas, F.R., S. Cissé, P.A. Gosseye, N. Van Duivenbooden & H. Van Keulen, 1990. Competition pour des ressources limitées: Le cas de la cinquieme region du Mali. Rapport
and methodology. Agricultural Systems 44, 243-255.
52 pp.

40
4: Scenarios de développement. CABO, Wageningen, The Netherlands & ESPR, Mopti, Mali, 182 pp.

Generalizing SysNet methodologies for land use planning at the sub-national level
C.T. Hoanh 1 , R. Roetter 1 , D.M. Jansen 2 , P.K. Aggarwal 3 , F.P. Lansigan 4 , N.X. La i 5 , I.A. Bakar 6 and A. Tawang 6
1 International Rice Research Institute (IRRI), P.O. Box 3127, Makati Central Post Office, 1271 Makati City, Philippines E-mail: [email protected]
2 DLO-Winand Staring Centre for Integrated Land, Soil and Water Research (SC-DLO),
3 Indian Agricultural Research Institute (IARI), New Delhi-110012, India Wageningen UR, P.O. Box 125, 6700 AK Wageningen, The Netherlands
4 Institute of Statistics, UPLB, 4031 College, Laguna, Philippines
5 Cuu Long Delta Rice Research Institute (CLRRI), O Mon, Can Tho, Vietnam
50774 Kuala Lumpur, Malaysia
6 Malaysian Agricultural Research and Development Institute (MARDI), P.O. Box 12301,
Introduction The main purpose of the SysNet project is to develop unifying systems analysis methods for improving the scientific basis in land use planning (LUP) at regional (sub-national) level and evaluate these in various eco-regions of Asia.
The methodology developed by the SysNet project is based on the concepts adopted from several studies on land use planning, following the approach proposed by De Wit et al. (1988). In SysNet adopted concepts are translated into operational procedures and tested in four case studies in tropical Asia, i.e. Haryana State in India, Kedah-Perlis Region in Malaysia, Ilocos Norte Province in the Philippines, and Can Tho Province in Vietnam. Finally, the operational procedures applied in these case studies are generalized to achieve a system analysis methodology and corresponding models that can be applied in other regions.
This paper briefly reviews the main problems to be addressed in land use planning, describes concepts and the research method applied in the SysNet project, revisits the four case studies and outlines the methodology, procedures and models to be generalized from these case studies. Main points in further research needed conclude this paper. Details on case study-specific methodologies and applications are given in other papers in these Proceedings.
Land use planning, main problems and solutions Main issues in land use planning FAO (1995) provided a number of important issues to be resolved in planning for sustainable use of land resources, summarized as follows: • Issues in the rural sphere:
- Recuperation of degraded marginal lands versus conservation and improvement of prime agricultural land
41 R. Roetter et al. (eds): Exchange of methodologies in land use planning. SysNet Research Paper Series No. 1 (1998), 41-56. IRRI, Los Baños, Philippines.

42
- Protection of ecological values versus the need for food and other produce - Smallholder settlement versus large-scale mechanized farming - Forestry and silviculture versus animal husbandry and fisheries versus arable cropping
- Rights of indigenous groups versus the need for resettlement of excess population from and integrated uses of the land
elsewhere in the country. • Issues in the peri-urban and coastal sphere:
- Prime agricultural land versus urbanization - Irrigation development versus apportioning of water resources for urban settlement and
industrial development - Disposal versus reuse of urban waste in peri-urban and rural areas - Coastal zones planning.
• Cross-cutting global issues: - Capital investment in infrastructure versus capital investment in land quality improve-
- Primary agricultural production versus bio-industrial processing - Production of medical or addicting drugs versus local food production.
ment
Core problems to be addressed The most crucial constraints to effective land use planning in Asia are: - Conflicts on land use objectives by different stakeholders/interest groups are neglected, and - Uncertainty about future land use objectives, availability of land resources, and exploita-
tion technologies are not explicated.
For the SysNet project, key stakeholders are provincial or state authorities, who (co-)decide on the use of land and its resources in the study areas.
A solution: explorative land use study The implementation of land use plans often failed due to not including methods for overcom- ing above-mentioned core problems. Because of the diversity in both biophysical and socio- economic conditions, what happens in the reality is often very different from results of prospective studies. The concept of explorative studies on land use (Rabbinge, 1995; Van Ittersum & Rabbinge, 1997) has been developed as a solution for dealing with combinations of conflicting interests in an uncertain future. In this type of study, prediction of the future is not the major purpose, but important is to explore possibilities for the future use of land and other resources to achieve development objectives of different land users in the best possible way. Since the number of possibilities in land use is enormous and it is not feasible to analyse all of them, explorative studies focus on the land use options that optimize achievements for different objectives, assuming that future development tends to optimum solutions. By generating and analysing optimal land use options for alternative scenarios (with different sets of goals), conflicts on land use objectives as well as uncertainty issues are identified and a best compromise on sustainable land use can be reached.
In practice, land use planning comprises different types of studies that can be related to differ- ent phases of the planning process: explorative, prospective and instrument studies (Hoanh,

43
1996). Information and data used as inputs in an explorative study refer to many preceding prospective studies such as those on population projection, national development plan, sectoral plans. Then, the explorative study will be followed by other prospective studies in which a highly promising scenario will be identified, to formulate an action plan, and subsequently studies on policies are conducted to identify instruments for implementing the plan. These selected instruments then serve as the key interventions in a new explorative study, and the sequence will be repeated incorporating again anticipated future developments and directions.
Land use planning and analysis system (LUPAS) A methodology for explorative land use planning comprises a number of analytical proce- dures that can be incorporated into a computer system for decision-making support. Advancing systems methodologies and operationalizing these through a Land Use Planning and Analysis System (LUPAS) is the declared goal of SysNet Project, Phases I and II. LUPAS is considered a decision support system (DSS) for land use planning made for apply- ing the interactive multiple goal linear programming (IMGLP) method to deal with the first core problem, i.e. conflicting land use objectives by stakeholders at different levels. It also includes analytical tools needed for explorative land use studies in dealing with the second, i.e. uncertainty in land use objectives, land resources, and exploitation technologies.
Turban (1993) has given a working definition for a DSS: an interactive, flexible and adapt- able computer-based information system, specially developed for supporting the solution of a particular management problem for improved decision-making. The structure of a DSS (e.g. Lam, 1997) for the purpose of land use planning is outlined in Roetter et al. (1998).
What types of analysis should be included in LUPAS? The following analyses and estimation techniques are required: - Estimates of variation in future production: crop yield estimation (modelling and expert
- Formulate scenarios from policy views and development plans: bottom-up and top-down
- Estimates of effects of interventions on biophysical and socio-economic factors: bio-
system techniques).
approaches (participatory process).
physical and socio-economic models.
achievement and land use allocation due to variations in key factors.
analysis.
- Sensitivity analysis of single and/or group of factors: consequences on development goal
- Risk and uncertainty analysis of single and/or group of factors: probability and scenario
Thus, LUPAS has the following characteristics of a DSS: - Integration of biophysical and socio-economic factors. - Incorporation of local and international expertise: local researchers and other stakeholders. - Quantitative modelling: from qualitative judgement to quantification. - Database management: relational database with three dimensions: attribute, spatial and
temporal. - Spatial and temporal analysis incorporating a geographic information (GIS) subsystem
with land mapping units or grid cells.
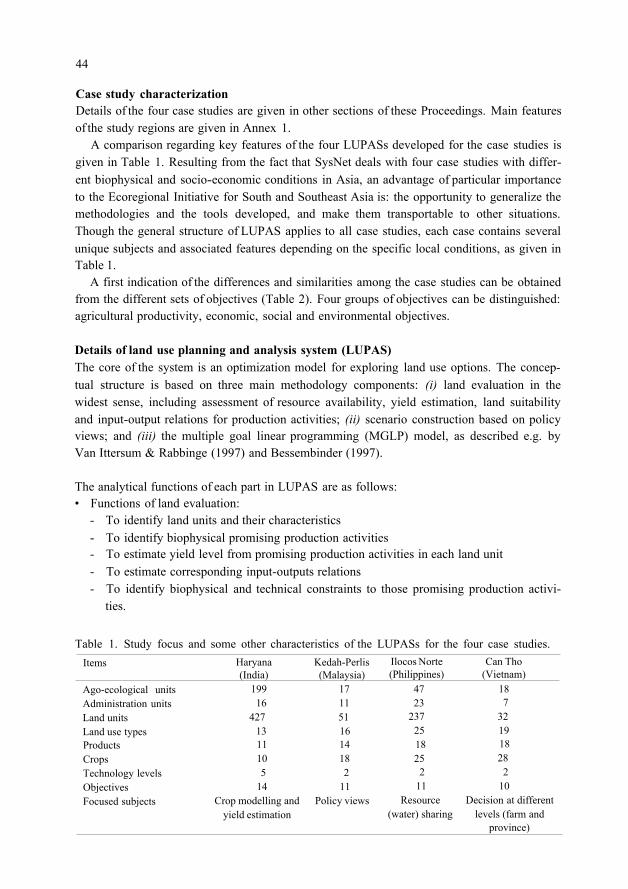
44
Case study characterization Details of the four case studies are given in other sections of these Proceedings. Main features of the study regions are given in Annex 1.
A comparison regarding key features of the four LUPASs developed for the case studies is given in Table 1. Resulting from the fact that SysNet deals with four case studies with differ- ent biophysical and socio-economic conditions in Asia, an advantage of particular importance to the Ecoregional Initiative for South and Southeast Asia is: the opportunity to generalize the methodologies and the tools developed, and make them transportable to other situations. Though the general structure of LUPAS applies to all case studies, each case contains several unique subjects and associated features depending on the specific local conditions, as given in Table 1.
A first indication of the differences and similarities among the case studies can be obtained from the different sets of objectives (Table 2). Four groups of objectives can be distinguished: agricultural productivity, economic, social and environmental objectives.
Details of land use planning and analysis system (LUPAS) The core of the system is an optimization model for exploring land use options. The concep- tual structure is based on three main methodology components: (i) land evaluation in the widest sense, including assessment of resource availability, yield estimation, land suitability and input-output relations for production activities; (ii) scenario construction based on policy views; and (iii) the multiple goal linear programming (MGLP) model, as described e.g. by Van Ittersum & Rabbinge (1997) and Bessembinder (1997).
The analytical functions of each part in LUPAS are as follows: • Functions of land evaluation:
- To identify land units and their characteristics - To identify biophysical promising production activities - To estimate yield level from promising production activities in each land unit - To estimate corresponding input-outputs relations - To identify biophysical and technical constraints to those promising production activi-
ties.
Table 1. Study focus and some other characteristics of the LUPASs for the four case studies. Items
Ago-ecological units Administration units Land units Land use types Products Crops Technology levels Objectives Focused subjects
Haryana (India)
199 16
427 13 11 10 5
14 Crop modelling and
yield estimation
Kedah-Perlis (Malaysia)
17 11 51 16 14 18 2
11 Policy views
Ilocos Norte (Philippines)
47 23
237 25 18 25
2 11
Resource (water) sharing
Can Tho (Vietnam)
18 7
32 19 18 28
2 10
Decision at different levels (farm and
province)

45
• Functions of scenario construction and policy views: - To identify objective functions as part of land use scenarios - To identify actual and possible future socio-economic constraints to biophysical prom-
- To identify potential changes in demand for products (amount and type).
- To identify conflicts in land use objectives and land resources, and - To generate optimum land use options for each land use scenario.
ising production activities
• Functions of the multiple goal linear programming (MGLP) model:
Table 2. Objectives identified for the four case studies.
No Objectives Kedah-Perlis Ilocos Norte Can Tho (Malaysia) (Philippines) (Vietnam)
Haryana (India)
Total
1 2 3 4 5 6 7 8 9
10 11 12
13 14 15
16 17
18 19 20 21
22 23 24
25 26 27 28
Maximixing Agricultural Production - food - non-food - rice - non-rice - crop - cotton seeds - oil seeds - pulses - milk - rubber - oil palm Maximize Labour Productivity Maximize Income - total regional - total farmer - per labour-hour Maximize Equity - income Maximize Employment in Agriculture Minimize Water Use - total - per unit income Minimize Salinization Minimize Variation of Water Table Minimize Pesticide Use - total - per unit income Minimize Pesticide Index Minimize Fertilizer Use - total - per unit income Minimize N Loss Minimize Soil Loss TOTAL
x
x x x x x
x
x x
x x
x
x
x
14
x
x x
x
x
x x
x x
x x
11
x x
x
x x
x x
x
x
x
x 11
x x
x
x
x x
x
x
x
x
10
1
3 2 1 1 1 1 1 1 1 2
4 1 1
3 3
3 1 1 I
3 1 1
4 1 2 1
46

46
The conceptual structure of LUPAS has been adopted for all four case studies and converted into an operational structure as presented in Figure 1.
Components:
ae : d: g: lut: n: p: v:
D1 D2 D3 C1 C2 C3 C4
Biophysical resources Socio-economic resources Policy views and development plans Resource balance and land evaluation Yield estimation
LUPAS, with Can Tho as example, comprises three databases and four components: Databases:
Input-output estimation MGLP
by agro-ecological unit by district by goal (or objective function) by land use type by nutrient (N, P, K) by product by village
Main outputs from the MGLP model are optimal land use allocations and achievement of tar- get values for certain objectives and goals associated with land use options. A GIS tool is linked to the system for displaying maps on land units and optimal land use. For Can Tho, the contents of the model is summarized in Table 3.
The following abbreviations (dimensions of variables) are used in the description of the various model components:
c: by crop i: by input-output item lu: by land unit (combination of ae and d) m: by month pe: by pesticide type t: by technology level
C1 Resource balance and land evaluation Functions: - TO generate land units and identify their characteristics from agro-ecological units and ad-
- To estimate available resources for production-oriented land use (agriculture, fisheries, and
- To identify promising land use types in each land unit.
Input data: - Agro-ecological units and their characteristics Char(ae) from D1. For Can Tho, climate is
homogeneous in the whole province. Based on soil (soil type, acidity and salinity) and water conditions (flooding and irrigation), 18 agro-ecological units were identified by the Sub-National Institute for Agricultural Planning and Projection (Sub-NIAPP; see also Lai et al., 1998, this volume).
- Total land area Land(lu) and water resources Water(lu) from D1. For Can Tho, data on land area of 100 villages are available. Under the current situation, it is assumed that water is in ample supply in irrigated areas and flooding is the main constraint to agriculture.
ministrative units.
production forestry).
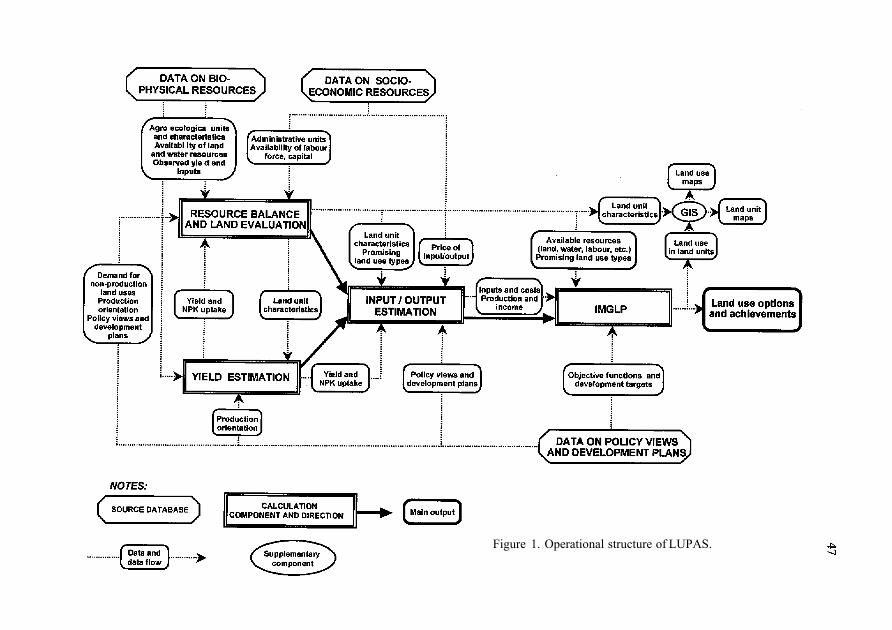
Figure 1. Operational structure of LUPAS.

48
- Administrative units and available socio-economic resources such as labour-force Labour(d), capital Cap(d), etc. from D2. For Can Tho, seven districts aggregated from 100 villages were used as administrative units in the model. Data on population and labour force at village level in 1996 were used for the current situation. Capital constraints were not included in the current model because data are not available.
- Demand of resources Dem(1u) for non-production oriented land use forms such as settle- ments, industries, nature conservation areas, etc. from D3. For Can Tho, data on current land use and development plans of all sectors in the province are available.
- Policy views, development plans and production orientation from D3. - Actual yield AY(lu,c) and maximum attainable yield MY(lu,c) estimated (see C2 ).
Calculation procedures: - Generate land units and their characteristics Char(1u) by overlaying agro-ecological units
with administrative units. GIS is useful for this operation. For Can Tho, no agro-ecological map was available at the time the current model was developed, as far as natural resources in each village are concerned, homogeneity was assumed: a village belongs to one agro- ecological unit. GIS was used to overlay the 18 agro-ecological units with seven districts generating 32 land units. Characteristics of a land unit were those of the corresponding agro-ecological unit and district.
- Estimate available resource for production. AvaiArea(lu), AvaiWater (lu), AvaiLab(d), etc. For Can Tho, land and water resources were estimated at land unit level, and labour force was estimated at the district level. In 1996, agricultural land in the province is 79.7% of total area. In 2010 it will decrease to 78.9% due to increased population and the develop- ment of new industrial centres. A flood control plan is implemented to prevent deep- flooded conditions in 2010. In the whole province, total labour force is 52.5% of the population. In 1996, 68% of the labour force was available to agriculture and in 2010 this percentage will decrease to 42%.
- Identify promising land use types. First, promising land use types are selected from the current land use inventory and development plans, as well as from reports of other regions under similar agro-ecological conditions. Next, the list is revised based on yield levels generated from C2 . They are then verified by considering other factors that cannot be included in the yield estimation and input-output estimation such as production orientation in each land unit. An indicator, Prom(lu, lut), equal to 1 or 0 is used to indicate promising or non-promising land use type, respectively. For Can Tho, rice, the most important crop, is promising in the whole province, while sugarcane is promising only in land units in the southern districts where two sugar factories are under construction. In a scenario without production orientation by land unit, sugarcane can be assumed promising in all land units, and the selection will take place during the optimization in C4 .
Output data: - Land unit characteristics Char(1u) to C2 and C3 . - Available resources AvaiLand(lu), AvaiWater(lu), AvaiLab(d), etc. to C4 . - Promising indicators Prom(lu, lut) to C4 .

Table 3. Contents in the MGLP model for Can Tho (Vietnam).
No Objective function Optimi- Agro- District zation ecological
unit 1 Rice production max
2 Non-rice production max 3 Total farm income max 4 Income equity max
5 Employment generation max 6 Labour productivity min
7 Water use efficiency max 8 Fertilizer use efficiency max 9 Pesticide use min 10 Nitrogen loss min 11 12 13 14 15 16 17 18 19 20 21 22 23 24 25 26 27
Income
Rice production Corn production Vegetable production
Bean production Sugarcane production
Fruit production Pineapple production Area of exported rice Area of sugarcane Area of pineapple Area of special fruit Area of upland crops Area of fisheries
01
02 03 04
05 06
07 08 09 10 11 12 13 14 15 16 17 18
Chau Thanh Long My Omon Fhung Hiep Thot Not Tp can Tho Vi Thanh
Land use type
Rice WS-Rice SA*
Rice WS-Rice SS-Rice SA Rice WS-Soybean SS-Rice SA Rice WS-Mungbean SS-Rice SA
Sugarcane + Bean Rice SA-Transplant Rice-Soybean SS
Rice WS-Watermelon SS-Rice SA Rice WS-Rice SA+Fish Cucumber WS-Cucumber SA Petchay WS-Cucumber SS-Cucumber SA Bitter gourd WS-Gourd SA Rice WS-Sweet Potato SS-Rice AW Rice WS-Corn SS-Rice SA Cabbage SS-Petchay SA Rice WS-Petchay SS-Rice SA Sugarcane Sugarcane-Rice WS Pineapple Fruit
Crops
28 SA = summer-autumn; WS = winter-spring; SS = spring-summer; AW = autumn-winter
Rice WS
Rice SA Rice SS Soybean SS
Mungbean SS Sugarcane (with beans)
Beans (with sugarcane) Transplanting rice Watermelon SS Fish (with rice) Cucumber WS Cucumber SA Petchay WS Cucumber SS Bittergourd WS Gourd SA Sweet Potato SS Rice AW Corn SS Cabage SS Petchay SA Petchay SS Sugarcane Sugarcane (rotation wit Pineapple Rice WS (with fish) Rice SA (with fish) Fruit
Tech- Product group nology level High Rice
Low Non-rice Sugarcane Vegetable
Beans Corn
Fish Fruit Pineapple Exported rice Upland
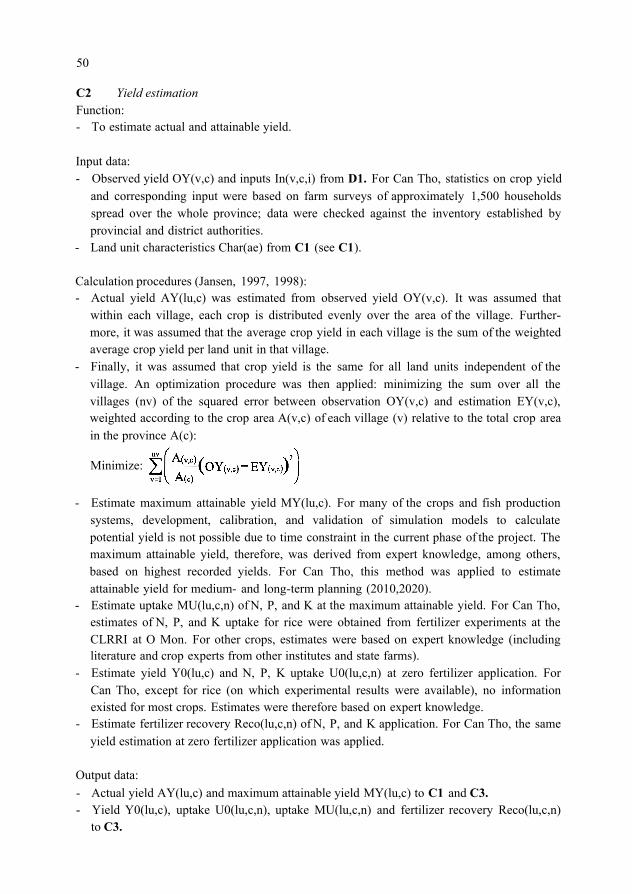
50
C2 Yield estimation Function: - To estimate actual and attainable yield.
Input data: - Observed yield OY(v,c) and inputs In(v,c,i) from D1. For Can Tho, statistics on crop yield
and corresponding input were based on farm surveys of approximately 1,500 households spread over the whole province; data were checked against the inventory established by provincial and district authorities.
- Land unit characteristics Char(ae) from C1 (see C1 ).
Calculation procedures (Jansen, 1997, 1998): - Actual yield AY(lu,c) was estimated from observed yield OY(v,c). It was assumed that
within each village, each crop is distributed evenly over the area of the village. Further- more, it was assumed that the average crop yield in each village is the sum of the weighted average crop yield per land unit in that village.
- Finally, it was assumed that crop yield is the same for all land units independent of the village. An optimization procedure was then applied: minimizing the sum over all the villages (nv) of the squared error between observation OY(v,c) and estimation EY(v,c), weighted according to the crop area A(v,c) of each village (v) relative to the total crop area in the province A(c):
Minimize:
- Estimate maximum attainable yield MY(lu,c). For many of the crops and fish production systems, development, calibration, and validation of simulation models to calculate potential yield is not possible due to time constraint in the current phase of the project. The maximum attainable yield, therefore, was derived from expert knowledge, among others, based on highest recorded yields. For Can Tho, this method was applied to estimate attainable yield for medium- and long-term planning (2010,2020).
- Estimate uptake MU(lu,c,n) of N, P, and K at the maximum attainable yield. For Can Tho, estimates of N, P, and K uptake for rice were obtained from fertilizer experiments at the CLRRI at O Mon. For other crops, estimates were based on expert knowledge (including literature and crop experts from other institutes and state farms).
- Estimate yield Y0(lu,c) and N, P, K uptake U0(lu,c,n) at zero fertilizer application. For Can Tho, except for rice (on which experimental results were available), no information existed for most crops. Estimates were therefore based on expert knowledge.
- Estimate fertilizer recovery Reco(lu,c,n) of N, P, and K application. For Can Tho, the same yield estimation at zero fertilizer application was applied.
Output data: - Actual yield AY(lu,c) and maximum attainable yield MY(lu,c) to C1 and C3. - Yield Y0(lu,c), uptake U0(lu,c,n), uptake MU(lu,c,n) and fertilizer recovery Reco(lu,c,n)
to C3.

51
C3 Input-output estimation Function: - To estimate inputs-outputs for production activities.
Input data: - Policy views and development plans from D3 . For Can Tho, provincial authorities are
paying attention to the effects of cost-benefit variations on land use. Therefore, different scenarios with changes in input-output prices Pri(d,i), in particular for rice production, will be studied.
- Land unit characteristics Char(lu) from C1 (see Cl ). - Actual yield AY(lu,c) and maximum attainable yield MY(lu,c) from C2 (see C2 ). - Yield Y0(lu,c), uptake U0(lu,c,n), uptake MU(lu,c,n) and recovery Reco(lu,c,n) from C2
- Price Pri(d,i) of input-output items from D2 . For Can Tho, current prices (1998) were (see C2 ).
applied for scenarios of the current situation and for the year 2010.
Calculation procedures: • Estimate target yields in the year to be optimized. Target yields vary between actual yield
AY(lu,c) and maximum attainable yield MY(lu,c). For Can Tho, actual yield level is used for the current situation (or year 2000) and target yields are used in the optimization for scenarios in the year 2010.
- Monthly labour requirements Lab(lu,lut,t,m) - Total amount of pesticides used Pest(lu,c,t) indiscriminate of type of pesticides - Total amount of fertilizer used Fert(lu,lut,t) as total weight of combined N, P and K fer-
• Estimate amounts and costs per hectare per year for the following inputs:
tilizer - Amount of irrigation water used Irri(lu,lut,t,m) - Amount of fuel used Fuel(lu,lut,t) - Total costs Cost(lu,lut,t) as the sum of all input costs (except family labour, for financial
- Physical production per product type Prod(lu,lut,t,p) - Total gross income Gross(lu,lut,t) as the sum of the production multiplied by the price
• First, all operations during the cultivation period such as land preparation, seeding, fertil- izer application, harvesting, etc. are listed. Then, labour force, input materials (seeds, fertilizer, etc.), facilities (tools, tractor, etc.), and main product and by-products related to each of these activities are estimated. Finally, input costs and gross income are calculated by multiplying input-output amounts by unit prices. Two input types are distinguished: fixed inputs that do not vary with yield level such as labour force for land preparation, etc. and variable inputs that depend on yield level such as labour force for harvesting, fertilizer, etc. For the second type, input amount is interpolated between two levels corresponding to actual yield and maximum attainable yield. For Can Tho, activities required for sugarcane cultivation are given as an example: - Land preparation: making furrows, weed removal, putting mud into furrow
analysis)
of the product).

52
- Planting: cutting sugarcane seedling, transporting seedling - Fertilizer application: day 10, day 40, day 70 - Maintenance: 1 st hand weeding, 2 nd hand weeding, taking leaves, hilling up - Spraying pesticide: day 15, day 70 - Irrigation: machine application day 10, day 20, day 30, day 40 - Harvest: sugarcane, tie-up, transport.
Output data: - Input amounts Lab(lu,lut,t,m), Pest(lu,c,t), Fert(lu,lut,t), Irri(lu,lut,t,m), Fuel(lu,lut,t) and
- Production Prod(lu,lut,t,p) and gross income Gross(lu,lut,t) to C4.
C4 MGLP model Function: - To generate land use options by optimizing selected objective functions under explicit goal
total costs Cost(lu,lut,t) to C4
constraints.
Input data: - Available resources AvaiLand(lu), AvaiWater(lu), AvaiLab(d), etc. from C1 - Promising indicators Prom(lu, lut) from C1 - Input amounts Lab(lu,lut,t,m), Pest(lu,c,t), Fert(lu,lut,t), Irri(lu,lut,t,m), Fuel(lu,lut,t) and
- Production Prod(lu,lut,t,p) and gross income Gross(lu,lut,t) from C3.
Calculation procedures: - Formulate equations for objective functions. For Can Tho, optimum land use allocations
LUA(lu,lut,t) were generated for the objective functions as listed in Table 4. - Formulate equations for constraints. Two types of constraints are considered: resource
limits and development targets. For Can Tho, the resource limits considered in the current model are listed in Table 5.
- The development targets were extracted from the master plan of the province as listed in
total costs Cost(lu,lut,t) from C3
Table 6.
Table 4. Obiective functions in the Can Tho case study.
No. Objective function Optimization Equation
1 Total regional farm net income Maximize = S [Gross(lu,lut,t)-Cost(lu,lut,t)]×Prom(lu,lut)×LUA(lu,lut,t)
2 Total rice production Maximize = S Yield(lu,lut,t,“Rice”)×Prom(lu,lut)×LUA(lu,lut,t)
3 Total non-rice production Maximize = S Yieid(lu,lut,t,“Non-Rice”)×Prom(lu,lut)×LUA(lu.lut,t)
4 Employment generation Maximize = S Lab(lu,lut,t,m)×Prom(lu,lut)×LUA(lu,lut,t)
5 Labour use Minimize = Minimize Employment while achieving targets
6 Fertilizer efficiency Maximize = Minimize Fertilizer use while achieving targets
= S Fert(lu,lut,t)×Prom(lu,lut)×LUA(lu,lut,t)
7 Total pesticide use Minimize = S Pest(lu,1ut,t)×Prom(lu,lut)×LUA(lu,lut,t)

53
Table 5. Constraints to land use in the Can Tho case study.
No. Constraint Equation/Calculation
1
2
3
Available land resource
Water resource
Monthly available labour force
S LUA (lut,lu,t) <= Area(lu)
Water resource was assumed abundant for irrigation. Constraint due to flood was
reflected in yield reduction and higher costs in cultivation. Flood control structure
was assumed complete in 2010.
S Lab(lut,lu,t,m) × LUA(lut,lu,t) <= S AvaiLab(d)
(assuminn that labourer can migrate within the province)
Table 6. Development targets in the Can Tho case study.
1 2 3 4 5 6 7
8
No. Development target
Total regional farm net income
Total rice production
Total corn production
Total vegetable production
Total bean production
Total sugarcane production
Total fruit production
Total pineapple production
Equation
S [Gross(lu,lut,t) - Cost(lu,lut,t)] × Prom(lu,lut) × LUA(lu,lut,t) >= Income target
S Yield(lu,lut,t, “Rice”) × Prom(lu,lut) × LUA(lu,lut,t) >= Rice target
S Yield(lu,lut,t, “Corn”) × Prom(lu,lut) × LUA(lu,lut,t) >= Corn target
S Yield(lu,lut,t, “Vegetable”) × Prom(lu,lut) × LUA(1u,lut,t) >= Vegetable target
S Yield(lu,lut,t, “Bean”) × Prom(lu,lut) × LUA(lu,lut,t) >= Bean target
S Yield(lu,lut,t, “Sugarcane”) × Prom(lu,lut) × LUA(lu,lut,t) >= Sugarcane target
S Yield(lu,lut,t, “Fruit”) × Prom(lu,lut) × LUA(lu,lut,t) >= Fruit target
S Yield(lu,lut,t, “Pineapple”) × Prom(lu,lut) × LUA(lu,lut,t) >= Pineapple target
Table 7. Scenarios proposed for the Can Tho case study.
No. Scenario Year Resource limits Development Policy views Development plan
target
1
2
3
4
5
6
2000-0 round
2000-1 st round
2000-2 st round
2010-0 round
2010-1 st round
2010-2 st round
2000
2000
2000
2010
2010
2010
Land-Water-Labour
Land-Water-Labour
Land-Water-Labour
Land-Water-Labour
Land-Water-Labour
Land-Water-Labour
No target
All targets
All targets
No target
All targets
All targets
Rice oriented
Rice oriented
Rice oriented price
changes
Rice oriented
Rice oriented
Rice oriented price
changes
No flood control
No flood control
No flood control
With flood control
With flood control
With flood control
- Formulate optimization scenarios on the basis of policy views, development plans and tar- gets. For Can Tho, two series of scenarios were formulated: ( i ) scenarios for current situation to analyse the possibility of achieving higher level of goal achievement under present conditions, and ( ii ) scenarios for 2010. In each scenario, all objective functions were optimized one by one. The scenarios were proposed for the Can Tho case study are presented in Table 7.
- Optimize objective functions Obj(g) and determine land use allocations LUA(lu,lut,t) for each scenario by using a linear programming software package. The MGLP model is interactively run by adjusting policy views and development plans and targets in each scenario. New scenarios can be formulated during this interactive process. For Can Tho, the Visual XPRESS-MP (1997) software package has been used.

54
- Post-optimal processing and output analysis: (1) degree of goal achievement of all objec- tive functions at regional level generated during the optimization process; (2) goal achievement and areas of each land use type are aggregated from land unit to subregional level and transferred to a GIS for mapping. For Can Tho, the land unit map was digitized and loaded into MAPINFO. It was used as base map for displaying a series of land use maps; each describes the spatial distribution of each land use type in the province (by hec- tare or % land unit area).
Output data: - Optimized objective functions Obj(g) and land use allocations LUA(lu,lut,t) for each
scenario.
Conclusions and outlook The development of the LUPAS for exploring options is only the first step in the land use planning methodology. The main objective of this step is to analyse land use options while optimizing different objective functions in the MGLP model of LUPAS. Conflicts during selection of objective functions can be clearly identified during the interactive operation of the model. Some critical points, that necessitate advancement of the methodology and tools are further elaborated here and in Section ‘General discussion and Workshop summary’ (this volume): - So far, studies on land use planning at regional level focus on the trade-offs among
different objectives at one decision level such as a farm, an enterprise or a region. Decisions at higher level or lower level are only referred to as exogeneous factors introduced to set boundaries for the decisions at the target level. SysNet introduced this approach into LUPAS to generate results for the four case study regions during the current Phase of the SysNet project.
- In reality, however, there are usually conflicts among the various decision levels. In order to proceed towards instrument studies, the analysis of such conflicts should be incorporated in the methodology and the LUPAS developed by SysNet. This will be a major methodological focus in the further study. The implementation of the SysNet methodology in the four case studies with different decision processes will allow identifying quantitatively what an individual unit can achieve or loose if the decision at a higher or lower level is accepted. Such analysis is important for illustrating how different interest groups can more profitably share the natural and economic resources under improved management.
- Similarly, planning deals with multi-temporal issues, since usually conflicts among short-, medium- and long-term objectives exist. At present, however, most methodologies and studies either emphasize explorations of future development without outlining the required development pathway, or they focus on implementation of plans without considering alternative future opportunities or options for a given region. Based on a strong partnership and demand from stakeholders of the current study regions, SysNet provides the unique opportunity to link the process of exploring options with the analysis of development pathways from the current situation to the most promising option. Even though a perspective of an optimal solution for the future may be very attractive to local people, it is

55
crucial to further analyse how such plans can be initiated and implemented. In the SysNet study, optimization for selected development pathways will be another major focus of methodology development.
- In reality, all three types of conflicts, i.e. trade-offs among various objectives at one decision level, conflicts among different decision levels and conflicts with regard to short, medium and long term objectives may exist in any region at any time. Therefore, the last step of methodology development should be to formulate an integrated approach that can deal with all these conflicts in the LUPAS.
- Land use plans must contain well-defined activities/projects in order to be implemented. As a first step in the implementation process, such plans should contain or propose a number of feasibility studies on promising interventions. Hence, formulation and analysis of feasible interventions using optimization techniques should form part of the methodology and the corresponding LUPAS.
References Bessembinder, J., 1997. Uncertainty and temporal aspects in long-term explorations of sus-
tainable land use. With reference to the Northern Atlantic Zone of Costa Rica. PhD thesis, Wageningen Agricultural University, The Netherlands, 166 pp.
De Wit, C.T., H. Van Keulen, N.G. Seligman & I. Spharim, 1988. Application of interactive multiple goal programming techniques for analysis and planning of regional agricultural development. Agricultural Systems 26(3), 211-230.
FAO, 1993. Guidelines for land use planning. Interdepartmental Working Group on Land Use Planning. Food and Agriculture Organization, Rome, Italy, 140 pp.
FAO, 1995. Planning for sustainable use of land resources. Towards a new approach. Background paper, FAO’s Task Managership for Chapter 10 of Agenda 21 of the United Nations Conference on Environment and Development (UNCED). Land and Water Development Division and Interdepartmental Working Group on Land Use Planning. Food and Agriculture Organization, Rome, Italy, 60 pp.
Hoanh, C.T., 1996. Development of a computerized aid to integrated land use planning (CAILUP) at regional level in irrigated areas. PhD thesis, Wageningen Agricultural University, The Netherlands, 297 pp.
Jansen, DM., 1997. Report of consultancy to Cuu Long Delta Rice Research Institute, O Mon, Can Tho, Vietnam (28 Nov - 13 Dec 1997). SysNet Group, International Rice Research Institute, Los Baños, Philippines, Internal report, 33 pp.
Jansen, D.M., 1998. Report of 2nd consultancy to Cuu Long Delta Rice Research Institute, O Mon, Can Tho, Vietnam (13 - 28 Feb 1998). SysNet Group, International Rice Research Institute, Los Baños, Philippines, Internal report, 43 pp.
Lai, N.X., N.V. Luat, D.M. Jansen, C.T. Hoanh, N.T.H. Loc, P.S. Tan, V.T.K. Hoa, M.T. Quang, T.Q. Tuan, T.T.N. Huan, H.V. Nghiep, N.T. Cuong, P.Q, Hung & N.T.P. Nga, 1998. Application of the SysNet methodology in Vietnam: Preliminary results. (this volume)
Lam, D., 1997. Decision support systems for water resources problems. In: Eds A.D. McDonald & M. McAleer, Proceedings of the International Congress on Modeling and Simulation (MODSIM 97), 8 - 11 December 1997, University of Tasmania, Hobart,
56
Australia. Vol. 4, pp. 1827-1834. Rabbinge, R., 1995. Eco-regional approaches, why, what and how. In: Eds J. Bouma, A.
Kuyvenhoven, B.A.M. Bouman, J.C. Luyten & H.G. Zandstra, Eco-regional approaches for sustainable land use and food production. Kluwer Academic Publishers, Dordrecht, The Netherlands, pp. 3- 11.
Roetter, R., C.T. Hoanh & P.S. Teng, 1998. A systems approach to analyzing land use options for sustainable rural development in South and Southeast Asia. IRRI Discussion Paper Series No 28, International Rice Research Institute, Los Baños, Philippines, 110 pp.
Turban, E., 1993. Decision support and expert systems: Management support systems. Third edition. Macmillan Publishing Company, New York, 833 pp, + Appendices.
Van Ittersum, M.K. & R. Rabbinge, 1997. Concepts in production ecology for analysis and quantification of agricultural input-output combinations. Field Crops Res. 52, 197-208.
XPRESS-MP, 1997. User guide and reference manual. Dash Associates Ltd. Blisworth House, Blisworth, Northants NN7 3BX, UK, 290 pp.

SysNet methodologies


Exploring agricultural land use options for the State of Haryana: Biophysical modelling
P.K. Aggarwal 1 , N. Kalra 1 , S.K. Bandyopadhyay 1 , H. Pathak 1 , V.K. Sehgal 1 , R. Kaur 1 , T.B.S. Rajput 1 , H.C. Joshi 1 , R. Choudhary 1 and R. Roetter 2
1 Indian Agricultural Research Institute (IARI), New Delhi-110012, India
2 International Rice Research Institute, P.O. Box 3127, MCPO, 1271 Makati City, Philippines E-mail: [email protected]
Introduction Rapidly increasing population and income growth coupled with urbanization implies increas- ing demand for food and feed to be produced from less arable area in the coming decades. It is important to develop strategies to ensure that such production levels are attained.
The Indo-Gangetic Plains, in particular the States of Punjab and Haryana have contributed tremendously to the success of the Green Revolution in India. This was largely possible because the region is endowed with good natural resources such as fertile soils and sufficient irrigation water. Also, it is relatively more developed in respect of markets and infrastructure. Rice and wheat, commonly grown in double cropping rotation, are the major cereal crops of the region and their average productivity ranges between 3 to 5 t ha-1. Signs of environmental degradation in the form of declining soil fertility, decline in water table, rising salinity, and resistance to many pesticides, are now becoming visible. Economically recoverable yield gap and marginal returns of increased input use are relatively small in the Indo-Gangetic Plains. Since Haryana State contributes significantly to the present food security, it is essential to explore future land use options for the region that will meet the increasing food demands with minimal negative environmental impacts while at the same time increasing farmers' income.
When there are potentially conflicting objectives such as maximizing production, sustaining environment and maximizing farmers' income, it is generally difficult to define the best solution. Information, therefore, needs to be generated to determine the consequences and trade-offs of different sets of policy aims on agriculture. The conventional approach to land evaluation does not relate biophysical criteria with crop productivity, intensity of input use, and socio-economic environment (FAO, 1976; Seghel & Mandal, 1995). At the same time, it lacks the flexibility to rapidly respond to continuously changing policy environment with multiple and often conflicting goals. A systems approach is needed where it is possible to translate policy goals into objective functions integrated into a biophysical and economic land evaluation model.
We have recently started studies to develop a framework to explore future land use options based on our present technical knowledge, and anticipated future objectives and constraints. Haryana State in northern India has been selected for the study with an objective to determine the magnitude of production possibilities, associated environmental risks and the inputs required to attain the targeted production levels. Implications of various conflicting situations
59 R. Roetter et al. (eds): Exchange of methodologies in land use planning. SysNet Research Paper Series No. 1 (1998). 59-65, IRRI, Los Baños, Philippines.

60
relating to multiple goals of maximizing food production and income while minimizing environmental degradation are evaluated by symphonic use of expert knowledge, simulation models, GIS (Geographic Information System) and optimization techniques. The overall approach of our study is outlined in Figure 1. This paper briefly describes the methodology for defining agro-ecological units and for generating input-output matrices for different utilization types of the agro-ecological units. The optimization programme and the results are described in Vashisht et al. (1998, this volume).
Figure 1. A framework for integrated land evaluation.

61
The study region Haryana has an area of 4,421,000 ha, located in a semi-arid, subtropical environment, between 27.4° to 30.6° N and 74.3° to 77.4° E. The agricultural area comprises 81% of the total area, and 47% of agricultural area is sown more than once per year. It consists of 16 administrative regions (districts) made of 108 blocks and 7073 villages.
Agro-ecological units Soils of Haryana state have been mapped and published at a scale of 1:250,000 (Sachdev et al., 1995). These have been divided into 199 soil mapping units based on surface form, parent material, soil depth, particle size class, mineralogy, calcareousness, soil temperature regime, soil pH, drainage class, groundwater depth, presence of compact layer, slope, erosion class, level and extent of salinity and sodicity, flooding sensitivity and soil taxonomy. The soil map was digitized and imported into IDRISI GIS (Eastman, 1995) for manipulation and further analysis. The mapping units were reclassified based on soil texture, level and extent of salinity and sodicity, slope and groundwater depth. Other soil properties were not included because either they were dependent upon other properties selected already or were relatively less important for deciding agricultural land use options in Haryana State. This resulted in 33 distinct soil mapping units.
Organic carbon is an important indicator of soil fertility. Based on the data collected from literature for 73 locations in Haryana, a map of organic carbon was prepared by inverse square distance interpolation and was segmented into three distinct classes: low (<0.2%), medium (0.2 - 0.4%) and high (> 0.4%). This map was then overlaid on the basic soil map and this combination resulted in 63 homogeneous soil mapping units.
The annual rainfall in Haryana varies between 300 mm and 1200 mm. A rainfall map was prepared based on data of 58 weather stations in and around Haryana (IMD, 1991). Inverse distance interpolation was used and the resultant map consisted of 9 rainfall zones of 100 mm intervals. The overlay of rainfall and soil maps resulted in 199 homogeneous agro-ecological units. These units vary in size from 37 ha to 208877 ha. The number (Table 1) and area of different agro-ecological units in each district was determined by overlaying the district boundaries on the agro-ecological unit map.
Input-output tables The important future agricultural development goals for Haryana were considered to be maximization of the production of cereal (rice+wheat), pulse (gram), fibre (cotton), oilseed (mustard) and milk, accompanied by maximization of employment and income from agriculture, reclamation of salinity and minimization of pesticide residues, N leaching and groundwater withdrawal (Vashisht et al., 1998). The availability of land, water, labour and capital were considered the major constraints.
To determine strategies for such goals through linear programming, an input-output matrix is needed for major production activities of the region. This was developed for each of the agro-ecological units (AEU) for the 10 key land utilization types (LUT) in the region (shown in Table 2). Three livestock activities (buffalo, local cows and crossbred cows) were also included. For each of the land utilization types, 5 technology (T) levels were considered: potential yield level, current yield level and three levels in between these two levels.
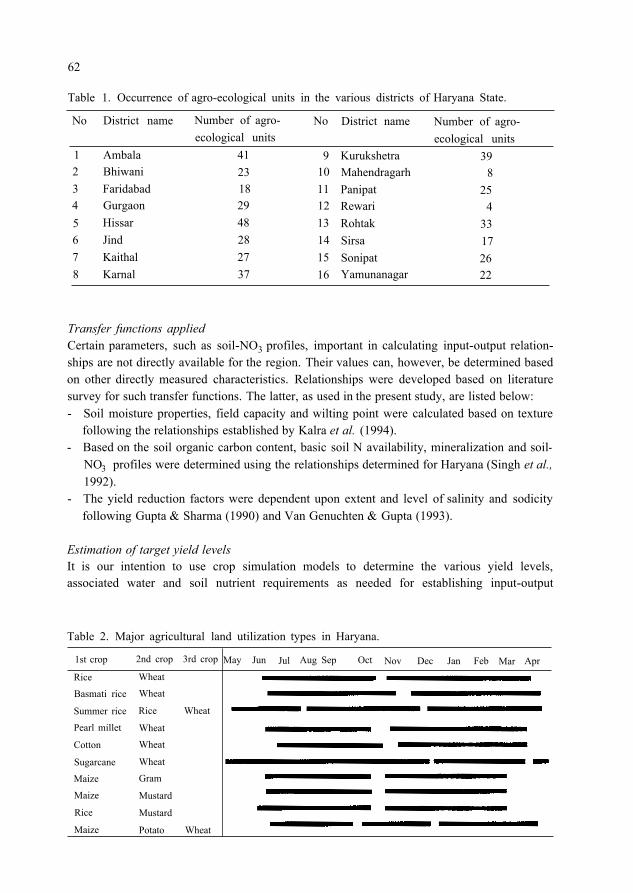
62
Table 1. Occurrence of agro-ecological units in the various districts of Haryana State.
No
1 2 3 4 5 6 7 8
District name
Ambala Bhiwani Faridabad Gurgaon Hissar Jind Kaithal Karnal
Number of agro- ecological units
41 23 18 29 48 28 27 37
No
9 10 11 12 13 14 15 16
District name
Kurukshetra Mahendragarh Panipat Rewari Rohtak Sirsa Sonipat Yamunanagar
Number of agro- ecological units
39 8
25 4
33 17 26 22
Transfer functions applied Certain parameters, such as soil-NO 3 profiles, important in calculating input-output relation- ships are not directly available for the region. Their values can, however, be determined based on other directly measured characteristics. Relationships were developed based on literature survey for such transfer functions. The latter, as used in the present study, are listed below: - Soil moisture properties, field capacity and wilting point were calculated based on texture
following the relationships established by Kalra et al. (1994). - Based on the soil organic carbon content, basic soil N availability, mineralization and soil-
NO 3 profiles were determined using the relationships determined for Haryana (Singh et al., 1992).
- The yield reduction factors were dependent upon extent and level of salinity and sodicity following Gupta & Sharma (1990) and Van Genuchten & Gupta (1993).
Estimation of target yield levels It is our intention to use crop simulation models to determine the various yield levels, associated water and soil nutrient requirements as needed for establishing input-output
Table 2. Major agricultural land utilization types in Haryana.
1st crop
Rice
Basmati rice
Summer rice
Pearl millet
Cotton
Sugarcane
Maize
Maize
Rice
Maize
2nd crop 3rd crop
Wheat
Wheat
Rice Wheat
Wheat
Wheat
Wheat
Gram
Mustard
Mustard
Potato Wheat
May Jun Jul Aug Sep Oct Nov Dec Jan Feb Mar Apr

63
relationships for the different land utilization types. The performance of crop simulation models in Haryana State, however, has not been adequately evaluated.
Procedure for establishing input-output relationships The following production function approach, which uses the basic characteristics of each agro-ecological unit, is currently applied.
1 Set target yield 2 Target yield 3 Reduction factor(sal)
4 Reduction factor(sod)
5 ET 6 Irrigation
7 Percolation
8 Nutrient (N,P,K) requirement
9 Fertilizer required
10 NO3-N leaching
11 Possible yield loss due to pests
12 Biocide residue index
13 Change in soil salinity
14 Milk production 15 Labour used 16 Input costs
17 Output value
= f{AEUsolar rad., temp, LUT, T} = Set_target_yield × Reduction-factor max(sal, sod)
= SlopeLUT × (ECAEU - EC_thresholdLUT) ×
= SlopeLUT × (ESPAEU-ESP_thresholdLUT) ×
= Target_yield / WUELUT, T
Area_affectedAEU
Area-affectedAEU
= ET - Rainseasonal × (1-RunoffAEU(slope) × Irrig._eff.LUT - Avail_soil_water AEU(fc,wp), LUT(root_depth)
Profile_water_change AEU(fc), LUT
= Irrigation + Rainseason × (1 - RunoffAEU(slope)) - ET -
= Target_yield × Nut_grainLUT + StrawLUT (HI, target yield) ×
= (Nut_requirement - Soil_nut_baseLUT - N_fixation) /
= [{Fertilizer_N × (1 - Volatilization AEU(pH) - NuptakeLUT +
Nut_strawLUT
Nut_use_efficiencyLUT, T
Net_mineralizationAEU(org C) + Profile_NLUT} × NO3_N_fraction_of_Mineral_NLUT] × [Percolation/{Irrigation + Rainseasonal × (1 - RunoffAEU(slope)) + Avai_soil_waterAEU(root_depth)}]
Damage_coefficientLUT,pest_pop × Control_measuresbioicides,LUT, T × Target_yieldAEU, LUT, T
= Pest_populationAEU, LUT, T, type ×
= Biocide_used_(a.i.)LUT, T × Toxicity_indexbiocide ×
= EC_initialAEU(root_depth) + { IrrigationAEU, LUT, T × Salt_concAEU - Percolation × Salt_concAEU × Leaching_coefficientAEU}
Persistencebiocide
= LivestockLUT, T × ResiduesAEU, LUT, T
= Fixed + Seeds + Irrigation + Fertilizers + Biocides +
= Target_yieldLUT × Price-grainLUT + ResiduesLUT ×
= MandaysAEU, LUT, T
Labour(machine, animal, human) + Miscellaneous
Price_strawLUT
The results of this analysis are too detailed to be described in this paper. As an illustration, calculated N fertilizer requirement and NO3-N leaching is shown for rice in rice-wheat system

64
Figure 2. Calculated N fertilizer requirement and NO 3– N leaching in rice at the current level of technology in the different agro-ecological units.
at the current level of technology for different agro-ecological units (Figure 2). The target yields in the current level of technology, based on 1995-96 production statistics of the State and various districts of Haryana, was considered to be 2.6 t ha-1. This was scaled down for different agro-ecological units depending upon the extent and severity of salinity and sodicity in the various agro-ecological units. The required N fertilizer needed was calculated based on the nutrient content of grain and straw, agro-ecological unit specific soil N supply and N use efficiency. Because the organic carbon content varied a lot among the different agro- ecological units, N fertilizer requirement varied from zero to 80 kg ha-1 (Figure 2). Several agro-ecological units had the same N fertilizer requirement because they were different in some other parameter not related to the factors considered for this calculation. NO3-N leaching varied from nil to 17 kg ha-1 depending upon the percolation rates, rainfall (+irrigation), run-off, and N fertilizer applied.
Conclusions and future work By overlaying soil properties and rainfall, we have been able to classify the entire state of Haryana (4.4 million ha) into 199 agro-ecological units that vary in size from 37 ha to 208877 ha. Almost 80% of the land area is, however, covered by only 50 agro-ecological units. There is, therefore, a need to aggregate these units by further simplify the classification procedure either by merging small units into large neighbouring units or by reducing the number of soil layers used.
A simple calculation procedure has been developed based on current knowledge of production ecology to generate biophysical input-output tables needed for optimization. This procedure relates basic soil and weather characteristics, and inputs used to economic yields and environmental impacts for current land use types. Although simple in approach and easy

65
to use, this approach, however, is not able to upscale critical daily events to seasonal and annual results. This semi-empirical approach also has limitations in extending current knowledge for determining input-output relationships for alternate but possible production activities in future. Simple yet robust simulation models are needed to facilitate this.
References Eastman, J.R., 1995. Idrisi for Windows. User’s guide, version May 1995. Clark University,
FAO, 1976. A framework for land evaluation. Soils Bulletin 32. FAO, Rome, 72 pp. Gupta, S.K. & S.K. Sharma, 1990. Response of crops to high exchangeable sodium
percentage. Irrigation Science 11, 173-179. IMD, 1991. Climate of Haryana and union territories of Delhi and Chandigarh, India
Meteorology Department, Government of India, Pune, India, 97 pp. Kalra, N., P.K. Aggarwal, S.K. Bandyopadhyay, A.K. Malik, & S. Kumar, 1995. Prediction
of moisture retention and transmission characteristics from soil texture of Indian soils. In: Eds F.P. Lansigan, B.A.M. Bouman & H.H. Van Laar, Agro-ecological zonation, characterization and optimization of rice-based cropping systems. SARP Research Proceedings, AB-DLO and TPE-WAU, Wageningen, The Netherlands and International Rice Research Institute, Los Baños, Philippines, pp. 24-31.
Sachdev, C.B., T. Lal, K.P.C. Rana, & J. Sehgal, 1995. Soils of Haryana for optimising land use. National Bureau of Soil Survey and Land Use Planning, Nagpur, India, 59 pp. + 2 maps.
Seghel, J. & D.K. Mandal, 1995. National Bureau of Soil Survey and Land Use Planning. ICAR, Soil-climatic environment in India. NBSS Publication 58, Nagpur, India, 19 pp.
Singh, J.P., D.J. Dahiya, V. Kumar & M. Singh, 1992. Distribution and status of different forms of nitrogen in soils of Haryana. J. Indian Soc. Soil Sci. 40,698-704.
functions. J. Indian Soc. Soil Sci. 41(4), 730-737.
950 Main St., Worchester, MA, USA.
Van Genuchten, M.Th. & S.K. Gupta, 1993. A reassessment of the crop tolerance response
Vashisht, A.K., S. Sujith Kumar, C.T. Hoanh, H. Pathak, S.K. Bandyopadhyay, N. Kalra & P.K. Aggarwal, 1998. Exploring agricultural land use options for the State of Haryana: Linking biophysical modelling with socio-economics. (this volume)


SysNet methodology development in Malaysia with special reference to policy views
A. Tawang 1 , LA. Bakar, A.A. Kamaruddin, T.M.T. Yahya, M.Y. Abdullah, H.B. Jaafar, A.S. Othman, A. Yusoff, Z. Ismail, A.R. Hamzah, A.M. Jaafar, Z.A. Aziz, M.Z.A. Ghani, Normah A. Majid, A.A. Rashid and R. Krishnan
1 Malaysian Agricultural Research and Development Institute (MARDI), P.O. Box 12301, 50774 Kuala Lumpur, Malaysia E-mail: [email protected]
Introduction The uniqueness of the SysNet methodology in exploring land use options is by virtue of its capacity to incorporate multiple objectives. Hence, different land use scenarios can be formulated for different sets of policy views and analysed in a quantitative manner. Such an exercise would require objectives using appropriate target values to be explored. Malaysia is fortunate in the sense that the country is well endowed with various development plans and policies. In fact, the successful development of the agricultural sector in the past had to a large extent been attributed to these efforts, which could be in the form of policy and planning documents, guidelines and regulations. Against this background, this paper will focus on the role of policy views in the methodology development, specifically in relation to the identification of objectives and formulation of objective functions. Relatedly, the relevant processes that are involved in the formulation of the policy views are highlighted to reflect the comprehensiveness of the exercise (see also Kamaruddin et al., 1998, this volume).
Methods to assess policy views Policy views as an important component in the SysNet methodology development for Kedah- Perlis Region were well accepted. These views had been extensively used not only in understanding the stakeholders’ perceptions on what goals agricultural development should focus on and hence on the development of the objective functions, but also in determining the resource limits and goal restrictions faced by the region. Thus, views were derived from the following sources: - Formal mechanism where references were made to the various policy documents both at
the Federal and State levels. These included the Second Operational Perspective Plan, National Agricultural Plan, and the various five-year Malaysia Plans. At the State level, the various development action plans were utilized. For the State of Kedah, the Kedah Development Action Plan which was a detailed planning document outlining the overall development strategy and goals was available for the purpose. For the State of Perlis, a less formal planning document was used for this purpose. Formal one-to-one meetings with major stakeholders were conducted, notably with the state Economic Planning Unit, Muda Agricultural Development Authority (MADA), Department of Agriculture, and all major
67 R. Roetter et al. (eds): Exchange of methodologies in land use planning. SysNet Research Paper Series No. 1 (1998), 67-72. IRRI, Los Baños, Philippines.

68
agricultural and land development authorities in the region. - A farm survey was conducted to assess on the ground perceptions of the specific
agricultural (and land use) development objectives in the region, and to validate information on the various obstacles as perceived through the formal mechanisms above. About 220 farmers were queried for the purpose. They were selected from the list of the so-called progressive farmers identified by the Department of Agriculture. Their responses and feedback were assessed against the stakeholders’ perceptions at the state level as interpreted by the planners. The resource endowments at the farm level were also established. The information derived from these interactions were used in formulating and quantifying the various objective functions and constraints for the study area.
Results and discussion Federal level policy views All policy documents related to agricultural development at the Federal level are consistent in that the role of agriculture will remain strategically important as a provider of food and raw materials for the agro- and resource-based industrial development. The focus will continue on increasing productivity and competitiveness, whilst managing the natural resources judi- ciously toward protection of the environment. Vision 2020, the national vision to make Malaysia a developed nation, advocates the need to ensure some level of self-sufficiency of major food crops, using less and less farm labour force and other resources in the process. Laterally translated, the emphasis on agricultural development must be towards income gen- eration, food provision, and productive and optimal utilization of resources in a sustainable manner.
State level development plan In line with the national policy guidelines, the Kedah-Perlis development plans have identi- fied agriculture as one of the three pillars of development. The strategy is to maximize growth prospects through modernization and productivity improvements towards the development of commercialized agriculture. At the same time, the region is also committed to ensure that MADA, which covers both Kedah and Perk, continues with the cultivation of rice towards achieving the national target of 65% self-sufficiency. Based on these broad policy views, the overall objectives of the agricultural development are to optimize resource use (land, water, and labour), to enhance farm productivity to ensure competitive incomes from the agricultural sector, and to ensure maintenance and improvement of the quality of the natural resource base and protection of the environment. To realize these objectives, the Plan has identified specific programmes to the extent of determining production targets (related to the land use allocation in the region). These include identifying areas for land rehabilitation programmes, fruit zones, cropping strategies and the development of marginal lands. This represents a detailed policy objective with regard to what needs to be done and to what extent. This information has been extensively used in the formulation and quantification of different sets of objectives and re- source limits and demands as part of SysNet methodology development.
The farm survey The main objective of the survey was to verify whether the various scenarios (translated into

69
objective functions and constraints) identified by the (higher level) stakeholders are similar or not to that perceived by the farmers. It was also used to gather information with regard to resource endowment at the farm level, input-output price, cropping cycles and other socio- economic information. Particularly for the verification of development goals and resource limits, the analysis at the farmers’ level provided another perspective regarding policy views derived from the Federal Level Policy Views and State Level Development Plan above. The policy goals of maximizing incomes and agricultural production as well as that of optimizing the efficiency of resource use received a very favourable response from the farmers. However, policy goals, related to the protection of the environment through minimization of chemical inputs, were not acceptable on account that such practices would not be able to satisfy the goals of income and production maximization. Similarly, the need to strive for greater efftciency in water use was supported only by about half of the respondents, possibly due to the free water supply for agricultural use at the moment. What was important, however, was that overall the stakeholder perceptions derived from planning documents and formal interactions did not deviate very much from the perceptions at the farm level (Table 1). On the other hand, the need for nature conservation and protection of the environment is a new concept to the farmers, and they cannot rationalize this because there is no scope for further opening up of more land for agricultural purposes at the expense of forest preservation. About two-thirds of the respondents belonged to this group. Similarly, an analysis on the constraining factors at the farmers’ level indicated an overall agreement with that perceived at the state level (Table 2). A significant exception was noted with regard to water constraints where about two-thirds of the respondents did not consider water as a constraint - which was rather surprising. Capital, land and labour, pests and diseases and competition with other sectors and markets were regarded as most critical constraints to goal achievement.
Scenario development Based on the stakeholders’ analysis, two development scenarios can be distinguished. Firstly, there is ‘the market-led agricultural development’ scenario, where the focus would be in exploiting agricultural economic activities capable of generating maximum returns to the economy. The choice of agricultural activities and land use would be determined entirely by market forces, and similar forces would dictate the resource allocation. Government inter-
Table 1. Farm level response on land use objectives.
Obiectives % Agreed Maximizing farm income Maximizing food production Maximizing non-food production Maximizing labour productivity Maximizing land productivity Maximizing input efficiency Minimizing production cost
Maximizing water efficiency
Minimizing chemicals used
86.0 83.1 74.8 88.5 86.8 73.1 62.4
61.9 47.7

70
Table 2. Farm level response on constraints to goal achievement. Constraints % Agreed Capital 82.5 Land 68.8 Labour 78.0 Water 51.7 Pests and diseases 80.2 Competition with other sector 71.1 Small farm size 68.0 Natural hazards 65.8 Old farmers 62.7 Markets 60.1 Competition from neighbouring country Infrastructures Post harvests losses Agricultural machinery availability
50.6 50.0 45.2 41.8
ference would be kept very minimal, the social and environmental considerations not being very important. Under the second scenario ‘the sustainable agricultural development’, however, the imposition of policy views and development targets would be very prominent. For this scenario, the inputs from the policy views were fully taken into account, specifically issues addressing food production, farm income, healthy environments, resource conservation and the requirement to fulfil the state’s own goals, targets and restrictions. Based on these two scenarios, a series of intermediate scenarios were formulated during the running of the models. Relatedly, sets of objective functions were formulated. The various objectives were broadly categorized into income maximization, maximization of food and non-food production and maximizing resource-use productivity and efficiency. Major constraints incorporated in the model related to natural resources including labour and capital, policy ‘restrictions’ (e.g. production quotas), market size, wage rates (vis-his other sectors), infrastructure and mechanization support.
Policy development process and implementation A policy or a plan is only as good as its implementation. The ability to put the plan into reality depends not only on an efficient institutional and infrastructure support, but more importantly the plan itself must be good and acceptable to the stakeholders. If that pre-condition is given, the planning process in this country will always involve many agencies and institutions from the public and private sectors. Since development planning and policy making is predominantly a Federal matter, the key agency in this respect is the Economic Planning Unit (EPU) of the Prime Minister’s Department. This is the agency responsible for formulating national development policies as well as preparing the public sector investment programmes for the successive five-year Malaysia Plans. In the preparation of national policies on specific sectors such as the National Agricultural Policy, EPU will provide macro-perspectives especially on directions, expected contributions and some level of resource allocations

71
(especially land). The Ministry of Agricultural would spearhead the actual preparation of the documents, A number of working groups comprising members from all agencies and institutions (including the private sectors) associated with agricultural development, both from the Ministry of Agriculture and from other ministries such as the Ministry of Primary Industries which is responsible for industrial commodities (rubber, oil palm, forest products, and cocoa) is formed to develop specific development strategy and plans. The Plan will undergo a series of processes for approval, from the Ministry Level and National Planning Council right up to the Cabinet.
Once approved, the documents will be used as a basis for the development of action plans. The Ministry of Agriculture will continue to coordinate and administer the plan. At the State level, the Sate Economic Planning Unit (SEPU) is the leading development planning agency. Among others, it is responsible for the formulation of development plans and policy advice within the state in line with federal policies. This is translated in the form of action plans by the various agencies and institutions within the state.
Policy views: Historical perspectives The agricultural development programmes in this country have always been heavily guided by policies governing the sector (e.g. Government of Malaysia, 1993; Kedah State Government, 1994; ISIS, 1994). A brief analysis on the historical perspective of the changes in policies related to agricultural development indicated the roles played by these policies in changing the agricultural development scenarios at the different time periods. In the 1960s, the crop diversification policy had the objectives of providing employment, earnings and import substitution as the primary goals. High emphasis was also given on food security issues where a 100% self-sufficiency level (SSL) was set for domestic rice production. The launching of the first National Agricultural Policy (NAP) in 1984 shifted the policy, which then focused on productivity, efficiency and competitiveness. Rice production had also been rationalized to 85% of domestic consumption. With rapid expansion of the manufacturing and service sectors in the rnid-eighties and nineties, coupled with problems within the agricultural sector, the relative importance of the sector declined. The second NAP was introduced in 1992, emphasizing the need to address productivity, efficiency and competitiveness in the context of sustainable development. Development efforts were concentrated on modernization and commercialization. SSL for rice was further reduced to 65% in view of the continued constraints on the factors of production. The third review of NAP is now in progress. It should be noted that although the policy on rice (and to some extent tobacco production) is very explicit and public sector-led, this is not the case with other commodities. Basically these commodities are left entirely to the market forces and for the private sector to undertake.
Conclusions Policy views within the SysNet methodology development can be viewed from two different perspectives. As is presented in this paper, it is a component of the methodology development itself and as input to the optimization model. From another perspective, the output from the exercise is also in some form of policy views — it provides sets of different options that are supposed to suggest policy changes to be considered by the stakeholders in relationship to their development goals, and the available resources. In a situation where the policy views are
72
very strong and comprehensive, and formulated with the involvement of major stakeholders at the macro-planning level, as is the case in Malaysia, the policy views could be in the form of quantification of resource use and expected outputs. Hence, if these views are considered in totality, fully expressed in the form of objective functions and constraints, the primary goal of the methodology development itself, that is a tool for exploring land use options by opening up ‘windows of opportunities’, might not be fully realized. It is thus important that critical analysis is done on all possible policy views to ensure that a limited set of current views are not ‘binding’ the final outputs from the analysis, so that more future-oriented scenarios can be developed to support the decision-making process among the various stakeholders.
References Kamaruddin, A.A., A. Tawang, I.A. Bakar, T.M.T. Yahya, M.Y. Abdullah, H.B. Jaafar, AS.
Othman, A. Yusoff, Z. Ismail, A.R. Hamzah, A.M. Jaafar, Z.A. Aziz, M.Z.A. Ghani, Normah A. Majid, A.A. Rashid & R. Krishnan, 1998. SysNet methodology development and application for land use exploration in the Kedah-Perlis region, Malaysia: Preliminary results. (this volume)
Government of Malaysia, 1993. The National Agricultural Policy (1992-2010). Publication Unit, Ministry of Agriculture, Kuala Lumpur, Malaysia, 77 pp.
ISIS, 1994. The national spatial planning study - Overview, state profiles and conclusions. Institute of Strategic and International Studies, Kuala Lumpur, Malaysia, 119 pp.
Kedah State Government, 1994. Kedah Development Action Plan (1991-2000). State Secretariat, Kedah State Economic Planning Unit, Alor Setar, Malaysia, 483 pp.
Systems methodology development for exploratory agricultural land use planning for Ilocos Norte Province, Philippines
F.P. Lansigan 1 , J.L. Orno 2 , C.M. Pascual 3 , N.R. Navarrete Jr 4 , S.R. Francisco 5 , A.G. Laborte 6 , C.T. Hoanh 6 and R. Roetter 6
1 Institute of Statistics, University of the Philippines Baños (UPLB), 4031 College, Laguna, Philippines E-mail: [email protected]
2 School of Environmental Science and Management, UPLB, Los Baños, Philippines 3 Mariano Marcos State University (MMSU), Batac, Ilocos Norte, Philippines 4 Institute of Mathematical Sciences and Physics, UPLB, Los Baños, Philippines 5 Philippine Rice Research Institute (PhilRice), Muñoz, Nueva Ecija, Philippines 6 International Rice Research Institute, P.O. Box 3127, MCPO, 1271 Makati City, Philippines
Introduction The Philippine Local Government Code of 1991 or Republic Act (RA) 7160 provides for the devolution of power from the national level to the provincial and municipal levels. The Code also mandated the change in development planning from top-down planning to bottom-up planning. In 1997, the Province of Ilocos Norte has initiated the development of a provincial land use plan, which translates the provincial development goals and objectives, taking into account the development concerns such as food production, human settlements, agro- industrial development, and natural resources conservation and management (Ilocos Norte Land Use Committee, 1998). The provincial land use plan serves as the basic reference for the component city and municipalities in the preparation of their respective land use and devel- opment plans.
This paper briefly describes the development of the methodology using systems approaches and optimization technique for exploring agricultural land use options for the province of Ilocos Norte in northern Philippines. The development goals and priorities defined by the province and the component municipalities and city are also described. The agro-ecological units are defined and delineated. Their production potentials, resource re- quirements and constraints are scientifically evaluated, and their contribution to the develop- ment goals and land use objectives of the province is analysed. The technical procedures and scientific techniques to generate data and information needed for establishing the input-output tables required for optimization analysis are also described. Moreover, the emerging inter- decision level and intra-decision level conflicts on development priorities and goals, and resources management at the provincial and municipal levels is presented. The systems methodology to determine the preferred agricultural land use options considering the emerging conflicts between the province and the municipalities, and also among munici- palities on the use of natural resources in their respective domains is presented.
73 R. Roetter et al. (eds): Exchange of methodologies in land use planning. SysNet Research Paper Series No. 1 (1998), 73-80. IRRI, Los Baños, Philippines.
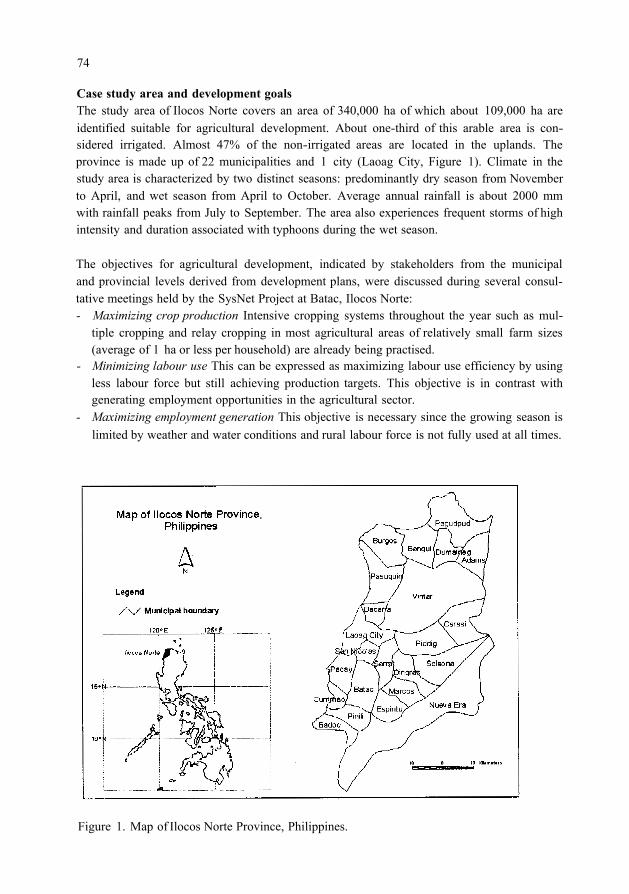
74
Case study area and development goals The study area of Ilocos Norte covers an area of 340,000 ha of which about 109,000 ha are identified suitable for agricultural development. About one-third of this arable area is con- sidered irrigated. Almost 47% of the non-irrigated areas are located in the uplands. The province is made up of 22 municipalities and 1 city (Laoag City, Figure 1). Climate in the study area is characterized by two distinct seasons: predominantly dry season from November to April, and wet season from April to October. Average annual rainfall is about 2000 mm with rainfall peaks from July to September. The area also experiences frequent storms of high intensity and duration associated with typhoons during the wet season.
The objectives for agricultural development, indicated by stakeholders from the municipal and provincial levels derived from development plans, were discussed during several consul- tative meetings held by the SysNet Project at Batac, Ilocos Norte: - Maximizing crop production Intensive cropping systems throughout the year such as mul-
tiple cropping and relay cropping in most agricultural areas of relatively small farm sizes (average of 1 ha or less per household) are already being practised.
- Minimizing labour use This can be expressed as maximizing labour use efficiency by using less labour force but still achieving production targets. This objective is in contrast with generating employment opportunities in the agricultural sector.
- Maximizing employment generation This objective is necessary since the growing season is limited by weather and water conditions and rural labour force is not fully used at all times.
Figure 1. Map of Ilocos Norte Province, Philippines.

75
- Minimizing water use Water for irrigation mainly comes from surface water during the wet season, and from subsurface water drawn, using portable water pumps to supplement irri- gation requirements of crops particularly during the dry season.
- Maximizing the minimum per capita income by municipality This addresses the issue of equity among municipalities in such a way that development opportunities will occur with much coverage as possible in all municipalities.
- Minimizing soil erosion This may involve alternative agricultural land uses or crop pro- duction systems that will reduce soil erosion in the area. One approach involves identification of critical areas with high risk of soil erosion and determining the appropriate land use options. Another involves the choice of crops in mono-cropping or combinations (multiple cropping or rotation).
- Minimizing biocide use This concerns the use of efficient crop production systems and associated technologies such as fertilizer application and chemicals for crop protection.
- Minimizing nitrate-leaching Some preliminary studies indicated nitrate contamination of water table in some areas. Agricultural land use and crop production systems must consider the nitrogen fertilizer applications, and what has accumulated in the soil.
Development constraints due to limited resources such as land for agricultural production, water, and labour availability for agricultural activities for the province as a whole and for the component municipalities and city were considered as well.
Objective functions In applying the optimization techniques, development goals are translated into mathematical equations, which are called objective functions. Because of limited data available, only nine objective functions were considered for this preliminary study (for details see Francisco et al., 1998, this volume): - Maximize rice production - Maximize non-rice production - Maximize employment in agriculture - Maximize farmers’ income - Maximize total provincial income - Minimize soil erosion - Minimize the use of biocides - Minimize fertilizer use - Minimize labour use. The objective of minimizing nitrate leaching has not been taken into account yet; the objec- tive of maximizing crop production was split into rice and non-rice production.
These objective functions were optimized imposing limits on land area for each munici- pality, available labour supply, and water resources for the entire province and available irrigation water in each irrigation system.
Two alternative scenarios for water availability in the future were considered: (1) without water-sharing and (2) with water-sharing among municipalities. Scenario 2 assumes an intervention for alleviating the water resource constraint by irrigation systems connecting all the municipalities, allowing more efficient use of available water for agricultural production in the province as a whole (see also Francisco et al,, 1998, this volume).

76
Land evaluation The quantitative approach for exploratory land use analysis requires the delineation of land areas with more or less homogeneous land characteristics. Land units form the basis for quan- tifying input-output relations pertaining to agricultural production activities. As a first step in defining land units for land use planning, zoning of the physical environment is required. Based on the most relevant properties such as climatic, soil and hydrological characteristics, agro-ecological units (Smaling & Van de Weg, 1990) are defined. Data on some crucial land characteristics or qualities may be inadequate, or may not be available for larger areas. In such a case, transfer functions (Aggarwal et al., 1998, this volume) and interpolation techniques (SysNet, 1998) can be applied. For Ilocos Norte, five land characteristics were considered for defining agro-ecological units: - Total annual rainfall The availability of water determines the type of crops that may be
grown. In many places in Ilocos Norte, crops are mainly dependent on rainwater. Annual rainfall in the province varies from 1680 to 2300 mm per year. This range of values was grouped into two classes:
> 2000 mm yr –1 and <2000 mm yr –1
- Rainfall distribution Rainfall distribution throughout the year largely determines the climatic suitability for cropping systems that may be adopted. The rainfall pattern in Ilocos Norte is characterized by distinct dry and wet periods with the length of the dry season and the onset of the rainy season varying considerably within the province. Agro-climatic subzones were defined by the number of dry months. A dry month has less than 100 mm of rain, while a wet month has over 200 mm. Three subzones were distinguished:
areas with 2 – 4 dry months areas with 5 – 6 dry months areas with at least 7 dry months.
- Irrigated areas The availability of surface and groundwater for irrigation depends on many land characteristics, such as geo-hydrological conditions, soil texture, river and canal net- work. There is scarce data on these characteristics, so a first approach is to map the areas actually under irrigation. Irrigated and non-irrigated areas are delineated based on the aggregated cropping systems map developed by the Bureau of Soils and Water Manage- ment (BSWM, 1990).
- Slope Areas are classified as either level to gently sloping or moderately sloping. Areas with steep slopes are considered unsuitable for crop production and are excluded from possible agricultural development areas.
- Soil texture Three broad soil texture classes are distinguished, namely: fine (silty clay loam to clay), medium (sandy clay loam to loam), and coarse (sand to sandy loam).
Furthermore, the areas clearly not suitable for agricultural use were excluded. Unsuitable areas are identified based on data on soils, topography and current land use. Areas under the following categories were excluded:
- Unsuitable soil (mountainous soils, river wash, dune land, sand and coral bed, rock land) - Severely eroded areas, and steep slopes - Water bodies (rivers, lakes) - Forest (current and planned) - Built-up areas.
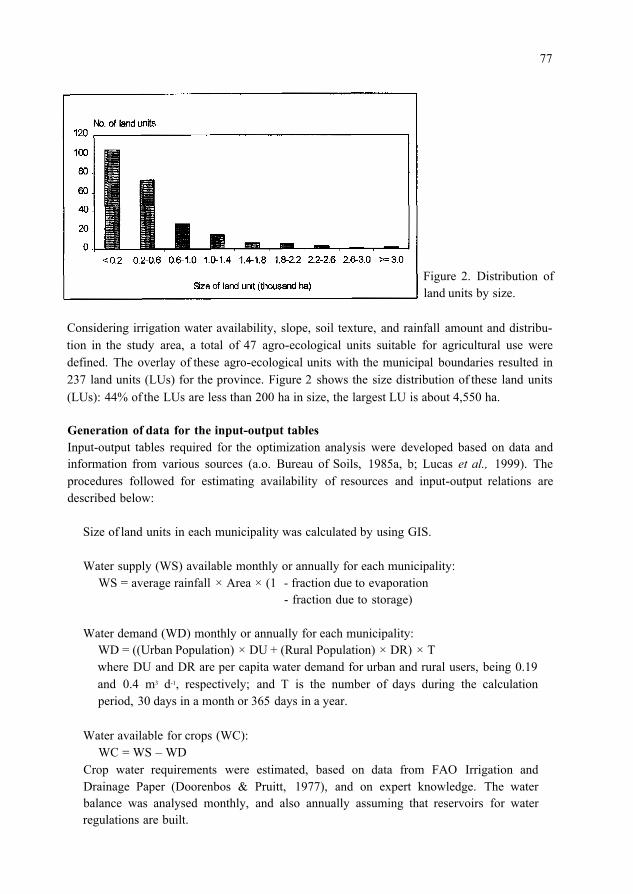
77
Figure 2. Distribution of land units by size.
Considering irrigation water availability, slope, soil texture, and rainfall amount and distribu- tion in the study area, a total of 47 agro-ecological units suitable for agricultural use were defined. The overlay of these agro-ecological units with the municipal boundaries resulted in 237 land units (LUs) for the province. Figure 2 shows the size distribution of these land units (LUs): 44% of the LUs are less than 200 ha in size, the largest LU is about 4,550 ha.
Generation of data for the input-output tables Input-output tables required for the optimization analysis were developed based on data and information from various sources (a.o. Bureau of Soils, 1985a, b; Lucas et al., 1999). The procedures followed for estimating availability of resources and input-output relations are described below:
Size of land units in each municipality was calculated by using GIS.
Water supply (WS) available monthly or annually for each municipality: WS = average rainfall × Area × (1 - fraction due to evaporation
- fraction due to storage)
Water demand (WD) monthly or annually for each municipality: WD = ((Urban Population) × DU + (Rural Population) × DR) × T where DU and DR are per capita water demand for urban and rural users, being 0.19 and 0.4 m3 d-1, respectively; and T is the number of days during the calculation period, 30 days in a month or 365 days in a year.
Water available for crops (WC):
Crop water requirements were estimated, based on data from FAO Irrigation and Drainage Paper (Doorenbos & Pruitt, 1977), and on expert knowledge. The water balance was analysed monthly, and also annually assuming that reservoirs for water regulations are built.
WC = WS – WD
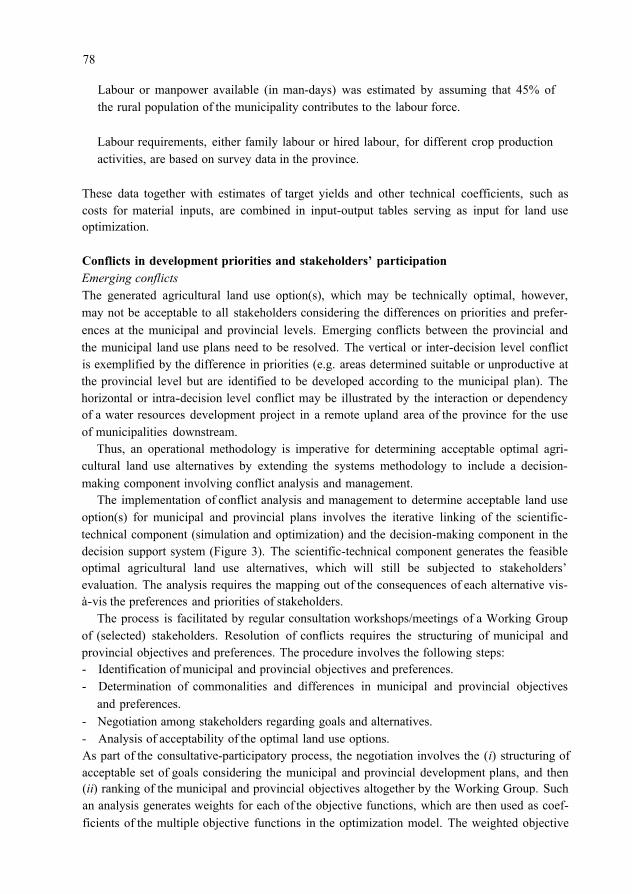
78
Labour or manpower available (in man-days) was estimated by assuming that 45% of the rural population of the municipality contributes to the labour force.
Labour requirements, either family labour or hired labour, for different crop production activities, are based on survey data in the province.
These data together with estimates of target yields and other technical coefficients, such as costs for material inputs, are combined in input-output tables serving as input for land use optimization.
Conflicts in development priorities and stakeholders’ participation Emerging conflicts The generated agricultural land use option(s), which may be technically optimal, however, may not be acceptable to all stakeholders considering the differences on priorities and prefer- ences at the municipal and provincial levels. Emerging conflicts between the provincial and the municipal land use plans need to be resolved. The vertical or inter-decision level conflict is exemplified by the difference in priorities (e.g. areas determined suitable or unproductive at the provincial level but are identified to be developed according to the municipal plan). The horizontal or intra-decision level conflict may be illustrated by the interaction or dependency of a water resources development project in a remote upland area of the province for the use of municipalities downstream.
Thus, an operational methodology is imperative for determining acceptable optimal agri- cultural land use alternatives by extending the systems methodology to include a decision- making component involving conflict analysis and management.
The implementation of conflict analysis and management to determine acceptable land use option(s) for municipal and provincial plans involves the iterative linking of the scientific- technical component (simulation and optimization) and the decision-making component in the decision support system (Figure 3). The scientific-technical component generates the feasible optimal agricultural land use alternatives, which will still be subjected to stakeholders’ evaluation. The analysis requires the mapping out of the consequences of each alternative vis- à-vis the preferences and priorities of stakeholders.
The process is facilitated by regular consultation workshops/meetings of a Working Group of (selected) stakeholders. Resolution of conflicts requires the structuring of municipal and provincial objectives and preferences. The procedure involves the following steps: - Identification of municipal and provincial objectives and preferences. - Determination of commonalities and differences in municipal and provincial objectives
and preferences. - Negotiation among stakeholders regarding goals and alternatives. - Analysis of acceptability of the optimal land use options. As part of the consultative-participatory process, the negotiation involves the ( i ) structuring of acceptable set of goals considering the municipal and provincial development plans, and then ( ii ) ranking of the municipal and provincial objectives altogether by the Working Group. Such an analysis generates weights for each of the objective functions, which are then used as coef- ficients of the multiple objective functions in the optimization model. The weighted objective
79
functions, after being normalized, are optimized using linear goal programming. The resulting land use options will then be subjected to an acceptability analysis by stakeholders.
Stakeholders consultative meetings In order to operationalize the participatory and systems approach to exploratory agricultural land use planning in Ilocos Norte, a series of consultative workshop/meetings with stakeholders were conducted. These were held in Batac, Ilocos Norte in January 1997 and again in January 1998. Small meetings were also conducted in Ilocos Norte between the SysNet Steering Committee and the stakeholders Working Group composed of representa- tives from the Provincial Planning Office (PPO) and some Municipal Planning and Development Offices (MPDOs).
A SysNet project team workshop was held in April 1997 to learn the tools and identify the data requirements and data available. A training course on linear programming (LP) and optimization techniques was conducted at IRRI in September 1997. The team analysed the objective functions for agricultural development, identified and rationalized on the constraints, prepared the preliminary input-output tables, and also formulated the LP model. Subsequent team workshops and meetings dealt with data requirements and acquisition.
During the consultative workshop held in January 1998, the team presented a preliminary analysis of agricultural land use planning as an optimization problem based on available data at that time. The workshop revealed the over-simplification of the primary agricultural land use analysis and also the paucity of reliable crop production data needed for optimization.
Figure 3. Framework of a decision- support system for optimizing agricultural land use.

80
Concluding remarks While the scientific-technical component may come up with optimal agricultural land use options, their acceptability by stakeholders may still be an issue. Thus, a methodology towards a decision support system (DSS) such as one based on the framework described in Figure 3 is imperative. Methodology for resolving or managing conflicts must be tested involving the use of aggregation and disaggregation techniques at different levels, and proce- dures for hierarchical analysis of priorities (Saaty, 1977). While a systematic holistic approach to resolve such emerging conflicts may still have to be developed, the systems approach provides a rational basis for addressing such differences in goals and priorities taking into account the available resources.
References Aggarwal, P.K., N. Kalra, S.K. Bandyopadhyay, H. Pathak, V.K. Sehgal, R. Kaur, T.B.S.
Rajput, H.C. Joshi, R. Choudhary & R. Roetter, 1998. Exploring agricultural land use op- tions for the State of Haryana: Biophysical modelling. (this volume)
Bureau of Soils and Water Management (BSWM), 1985a. Physical land resources: Province of Ilocos Norte, Land resources evaluation project (LREP), Vol. 1, Metro Manila, Philippines, 258 pp.
BSWM, 1985b. Agro-socio economics and land evaluation: Province of Ilocos Norte, Land resources evaluation project (LREP), Vol. 2, Metro Manila, Philippines, 146 pp.
BSWM, 1990. Rice-based cropping system development planning guide map: Region I, Bureau of Soils and Water Management, Manila, Philippines.
Doorenbos, J. & W.O. Pruitt, 1977. Crop water requirements. FAO Irrigation and Drainage Paper 24, FAO, Rome, 144 pp.
Francisco, S.R., N.R. Navarrete Jr, L.B. Dimasuay, F.P. Lansigan, C.M. Pascual, M.P. Lucas, J.L. Orno, R.Roetter, C.T. Hoanh, A.G. Laborte, T.F. Marcos, C.G. Acosta, E.O. Agustin, M.E. Pascua, S.R. Pascua Jr, R.C. Utrera, R.T. Cruz & S.R. Obien, 1998. A systems approach to agricultural land use planning at the provincial and municipal levels of Ilocos Norte Province, Philippines. (this volume)
Ilocos Norte Land Use Committee, 1998. Provincial physical framework plan/Comprehensive provincial land use plan for the province of Ilocos Norte. Laoag City, Philippines, 216 pp.
Lucas, M.P., S. Pandey, R.A. Villano, D.R. Culanay & S.R. Obien, 1999. Characterization and economic analysis of intensive cropping systems in rainfed lowlands of Ilocos Norte, Philippines. Experimental Agriculture (in revision).
Saaty, T.L., 1977. A scaling method for priorities in hierarchical structures. J. Mathematical Psychology 15, 234-281.
Smaling, E.M.A. & R.F. Van de Weg, 1990. Using soil and climate maps and associated data sets to select Sites for fertilizer trials in Kenya, Agriculture, Ecosystems and Environment,
SysNet, 1998. Third six-monthly Progress Report Nov 1997 - Apr 1998. Enclosure 5: Land evaluation procedure – Ilocos Norte Province. IRRI, Los Baños, Philippines, pp. 114-130 + 10 maps.
XPRESS-MP, 1997. User guide and reference manual. Dash Associates Ltd., Blisworth House, Blisworth, Northants NN7 3BX, UK, 290 pp.
31, 263-274.

SysNet methodology development in Vietnam
N.X. Lai 1 , D.M. Jansen 2 , C.T. Hoanh 3 , N.V. Luat 1 , N.T. Loc 1 , P.S. Tan 1 , V.T.K. Hoa 1 , M.T. Quang 1 , T.Q. Tuan 1 , T.T.N. Huan 1 , H.V. Nghiep 1 , N.T. Cuong 1 , P.Q. Hung 1 and N.T.P. Nga 1
1 Cuu Long Delta Rice Research Institute (CLRRI), O Mon, Can Tho, Vietnam E-mail: [email protected] DLO-Winand Staring Centre for Integrated Land, Soil and Water Research (SC-DLO), Wageningen UR, P.O. Box 125,6700 AK Wageningen, The Netherlands
3 International Rice Research Institute, P.O. Box 3127, MCPO, 1271 Makati City, Philippines
2
Introduction The SysNet Project is one of the Methodology Development Projects under coordination of IRRI's Ecological Initiative for the Humid and Sub-humid Tropics of Asia. The purpose of SysNet is to develop and apply methodologies and tools for improving land use planning at the sub-national level. These include various components such as crop simulation models, technical coefficient generators, Geographic Information Systems (GIS) and Multiple Goal Linear Programming (MGLP) models. The Cuu Long Delta Rice Research Institute (CLRRI), located at O Mon, Can Tho Province, Vietnam, is one of members of the network. In this paper, we discuss the methodology developed during the first 18 months of the project. Preliminary results of the project are given by Lai et al. (1998, this volume).
Analytical steps in the methodology The SysNet project focuses on the development of a methodology for quantitative land evaluation and analysis. In the Vietnamese context, it comprises the following steps: - Delineation of biophysical land units - Delineation of socio-economic or administrative land units - Delineation of management land units - Description of the biophysical input and output relations for technically feasible options in
- Description of socio-economic factors that affect the socio-economic viability of the
- Description of biophysical constraints to land use - Description of socio-economic constraints to land use - Description of land use objectives - Development of an MGLP model to investigate the optimal land use given the agro-
technical possibilities, the socio-economic boundary conditions, the constraints and the objectives.
management land units
technical options
The quantitative land evaluation approach followed goes beyond qualitative approaches to
81 R. Roetter et al. (eds): Exchange of methodologies in land use planning. SysNet Research Paper Series No. 1 (1998), 81-86. IRRI, Los Baños, Philippines.

82
land evaluation that merely depict the suitability of defined land units for a (number of) crops. Firstly, instead of only crops (or crop rotations), also technologies for growing these crops are considered, thus allowing the description of various options for land use. Secondly, it is recognized that ‘suitability’ is not an absolute and independent characteristic for each option to use land. Instead, suitability for specific land use options can only be viewed relative to that for other options. Therefore, the different land use options have to be compared on the basis of their contribution to the objectives of the land users. Thirdly, since decision-making on land use does not only take place at farms, the methodology requires specification of objec- tives and constraints at different management levels in the agricultural system, such as farm level, village and province. Thus, achievements from the optimal land use options, derived by the MGLP model, reflect the wishes of a large part of society and not only the biophysical potentials. Fourthly, the quantitative approach allows the evaluation of different expectations about future or possible developments as far as these can be translated into quantitative assumptions regarding changes in objectives, constraints, socio-economic and biophysical factors.
Each step of the approach as outlined above and as followed for Can Tho Province will be discussed in the next sections.
Delineation of land units Biophysical land units A biophysical land unit is defined as a specific combination of land characteristics such as soil, hydrology and climate, that has a unique effect on the biophysical input-output relation- ships of the major crop-technologies (combinations of crops with technology levels). The concept of land unit is scale dependent, since at more detailed levels, e.g. field or farm, smaller differences between land units are taken into account than at less detailed levels, e.g. region or nation. For the regional study in Can Tho Province, only major differences in soil type and flooding regime were taken into account.
Socio-economic or administrative land units Differences between biophysical land units may be reflected in different levels in the bio- physical input-output relations for specific crop production technologies, e.g. the amount of urea to be applied in order to obtain a certain yield. These biophysical input-output relations do not reflect the socio-economic viability of the technologies. If transport costs of fertilizers are very high, applying high fertilizer rates on a poor soil type located close to the place where they are sold might economically be more viable than applying less fertilizer on a fertile soil far away, even if both technologies result in the same yield. Similarly, other socio- economic factors might make specific land use systems unattractive or impossible in certain regions, even though they are technically feasible.
Socio-economic factors that should be taken into account when differentiating socio- economic land units are those that affect directly the socio-economic viability of the various options to use the biophysical land units. Differences in population density, for example, should only be considered if these differences affect strongly a change in price for labour and other inputs, and for land use products. When the population density only influences the available labour force, then should be dealt with determining the management units of land

83
and the constraints that apply to land use in these units. Socio-economic land units reflect better the reasons of differences in the province than the administrative units do. However, socio-economic data are usually available at the administrative land unit level, therefore, the boundary of administrative land units is used for socio-economic units. For the Can Tho Province case study, differences in prices were related to average distance of the village to the major market (Can Tho City).
Management land units Objectives and part of the constraints regarding land use are determined per management unit, i.e. those parts of the region that are managed by a specific organization. These units can be at a detailed scale, e.g. fields or farms, to reflect the level at which the decisions are made regarding the choice among land use options. Units at larger scales, e.g. municipalities, districts or provinces, reflect the level at which policies are made or implemented that influ- ence (part of the) factors that play a role in the decision-making process at the detailed scale. Although in theory, it is possible to include all the different management levels in the methodology, practically there are limitations in regional land use planning. Firstly, there is a lack of data to describe all the characteristics at the detailed levels, and secondly, the resulting MGLP model would become too large for the available optimization software package. In addition, it can be argued (Van Latesteijn, 1995) that for the indication of long-term prospects on land use potentials, the behaviour of decision-makers at the detailed scales is not a main determining factor. When behaviour is included, e.g. by stating objectives and constraints at the farmer’s level, evaluating effects of changes in behaviour is not possible. In the Can Tho case study, the farm level is not taken into account, and policies are assumed to be valid at the district level.
Biophysical input and output relations for technically feasible land use options For each of the biophysical land units, different options for using the land need to be described. The suitability of biophysical land units (LU) is identified for each land use type (LUT). For the Can Tho case study, this was done on the basis of a quantitative approach in combination with expert judgement. A certain LUT can not be applied on a certain LU, if the estimated costs of measures for alleviating the effects of flooding or soil-acidity would be too expensive, i.e. the LU-LUT combination would never be economically viable. Thereafter, two technical options for all possible LU-LUT combinations were described, along the lines of the concept of Land Use System at a defined Technology (LUST: Jansen & Schipper, 1995). The two technical options reflect two yield levels, the current yield level, derived from survey data, and an estimated farmer’s maximum yield. The latter is derived from expert knowledge but should be estimated more objectively, e.g. by using simulation models. Using an automated procedure made in Excel, all inputs and outputs of the relevant on-farm operations were quantified on a per ha basis for each LUST. In this procedure, based on assumptions about effects of inputs, the input-output relations are formalized and quantified. Differences in yield levels results in a difference in labour use, i.e. the required amount of labour depends on biomass production, the number of crop protection measures, the amount of inputs used in these measures and the quantity of fertilizer. Differences in characteristics between LUs are reflected in the estimation of the required labour force, which for certain operations is

84
assumed to be in proportion to flooding depth, and of the required amount of fertilizer for different soil types. More detailed studies on the input-output relations are needed, especially for the long-term effects of LUSTs on the soil nutrient balances.
Biophysical constraints Options for land use are limited by the availability of land. For each district, therefore, the total area available for agriculture for each biophysical land unit was determined and used as a constraint in the model. Not available for agriculture were areas with buildings and infra- structure, and those protected for nature conservation. Water availability for irrigation might hamper land use in the dry season. However, due to lack of information and time constraints, this aspect of resource limitation is not yet included in the analysis.
Socio-economic factors affecting the socio-economic viability of technical options Factors that are assumed to affect the socio-economic viability of the LUSTs comprise net revenue and monthly labour requirements. In the Can Tho case, the net revenue of each LUST is calculated as the total gross revenue from products minus the total costs for inputs. Both these factors depend on prices, which are assumed to vary between districts. Based upon a price-survey in the province, for each district prices were determined for all types of inputs and outputs quantified in the LUSTs. For out- puts that show a strong seasonal variability in price, different product types were defined for the relevant seasons, each with its own price. For each LUST, prices were multiplied by the quantities used or produced, and summed over all inputs to arrive at the total costs, and over all products to arrive at the total gross revenue.
Apart from being a cost factor, labour requirements might also affect the socio-economic viability when they are higher than the availability of labour. Since in agriculture often tempo- ral peaks in labour demand occur, such as for land preparation and harvesting, not the average daily requirement is important, but more the distribution during the year. Taking into account the seasonal effects, total labour requirements for each LUST are, therefore, calculated on a monthly basis. For each operation in each LUST, it is indicated between which dates the operation takes place in the region. Assuming within this period a parabolic distribution of the fraction of farmers in the region performing this operation, the average monthly labour requirement for each operation is calculated. The total monthly labour requirement for all operations is found by summing up the requirements.
Socio-economic constraints It is assumed that there is a free exchange of labour within the province, and that there is no influx of labour from other provinces. This means that it is only required to put a constraint on the total amount of labour that is used for the province as a whole. For each district, the labour availability is estimated on the basis of census data, providing the number of inhabitants in the district. This number is multiplied by the fraction of people in the working age group, which is at present about 52.5% for the province. The result is then multiplied by the fraction of the labour force that is available for agriculture. In the model, the calculated labour availability per district is used to calculate the hours of labour that should be hired from outside the dis- trict. It is, however, not used as a constraint at the district level.

85
Objectives for using land As discussed before, in the current analysis, farm level objectives are not taken into account and only land use objectives at the regional level of policy-makers are considered. These objectives were formulated based on reviews of land use plans by the provincial planning agency and checked in a consultative workshop with policy-makers. Based on the policy views, the following objectives regarding land use options were formulated: - Maximize total regional net income from agriculture - Maximize total regional rice production - Maximize total regional non-rice production - Maximize generation of employment - Minimize labour use - Maximize fertilizer use efficiency - Minimize total pesticide use.
MGLP model An MGLP model was developed using XPRESS-MP (1997) and linked with Excel spread- sheets containing input data and modules for ex-post analysis of results (listing of the model is given in SysNet, 1998). Considering the constraints and land use options as described above, the model indicates that given certain objectives optimal land use allocation can be achieved. The objectives listed above also appear as goal restrictions in the MGLP model, each with a minimum and a maximum value that needs to be achieved. Each of these objectives is also used as an objective function to be optimized by the MGLP model. The objective, which refer to maximization of the efficiency of the use of inputs, i.e. fertilizer use, was effectuated as minimization of the input factor (fertilizer).
In addition, goal restrictions were set to reflect some specific requirements, such as the production of individual products (corn, vegetables, bean, sugarcane, fruits, pineapple) to be achieved, or the area to be used for certain crops (export rice, sugarcane, pineapple, fruit- trees, upland crops, fishery). In fact, the required area mentioned in the provincial plan was estimated from production targets with an average expected yield, and, therefore, can be ignored because of overlap, or in some cases conflict with the production constraints.
Discussion and recommendations This paper describes the current status of the methodology development for land use planning for Can Tho Province. Although a lot of work has been done, it is clear that improvement is still needed. This will be done in various respects: - Interactions among factors Many input-output relationships are based on assumptions that
need thorough checking. This also holds, and maybe even stronger, for implicit assump- tions, such as the long-term interaction of land use management and land characteristics. An important interaction, not yet studied, is the relationship between soil nutrient availability on one hand, and yield level and fertilizer application on the other (for most crop production technologies.
- Socio-economic factors The elasticity of prices in relationship to supply and demand should be studied and incorporated into the model, especially for products where Can Tho Province is a major provider, such as for rice. Another aspect that requires attention is the
86
labour market. The assumption that labour exchange is free within the province might be true, but there will be costs involved with moving labour from one part of the province to another. The assumption that there is no labour migrating from other provinces is obviously not correct, especially for districts located at the provincial borders.
- MGLP model Apart from the improvements in the socio-economic part of the model, it should be extended to include other biophysical aspects of land use, such as irrigation water. Maximization of non-rice production is only a general objective, since it compares products on the basis of biomass, thus favouring high biomass crops such as sugarcane. If non-rice production is considered as an important objective, either the quantity of each type of produce should be maximized, or a weighting factor should be introduced to allow a sum of different types of products. Such a weighting factor could be the net revenue earned by growing each product, i.e. products that are compared on their economic benefit.
- Various models and software tools used in the methodology are not very user-friendly, and data-flows between the various models and tools is not very clear. This may easily lead to errors and misinterpretations. Especially when interaction with policy-makers is required, the system should, therefore, be more user-friendly and transparent.
References Jansen, D.M. & R.A. Schipper, 1995. A static, descriptive approach to quantify land use
Lai, N.X., N.V. Luat, D.M. Jansen, C.T. Hoanh, N.T.H. Loc, P.S. Tan, V.T.K. Hoa, M.T. Quang, T.Q. Tuan, T.T.N. Huan, H.V. Nghiep, N.T. Cuong, P,Q. Hung & N.T.P. Nga, 1998. Application of the SysNet methodology in Vietnam: Preliminary results. (this volume)
SysNet, 1998. Fourth six-monthly Progress Report. International Rice Research Institute, Los Baños, Philippines, pp. 23-26.
Van Latesteijn, H.C., 1995. Scenarios for land use in Europe: Agro-ecological options within socio-economic boundaries. In: Eds J. Bourna, A. Kuyvenhoven, B.A.M. Bouman, J.C. Luyten & H.G. Zandstra, Eco-regional approaches for sustainable land use and food production. Kluwer Academic Publishers, Dordrecht, The Netherlands, pp. 43-63.
XPRESS-MP, 1997. User guide and reference manual. Dash Associates Ltd. Blisworth House, Blisworth, Northants NN7 3BX, UK, 290 pp.
systems. Netherlands Journal of Agricultural Science 43, 31-46.

SysNet applications


Exploring agricultural land use options for the State of Haryana: Linking biophysical modelling with socio-economics
A.K. Vashisht 1 , S. Sujith Kumar 1 , C.T. Hoanh 2 , H. Pathak 1 , S.K. Bandyopadhyay 1 , N. Kalra 1
and P.K. Aggarwal 1
1 Indian Agricultural Research Institute (IARI), New Delhi-110012, India
2 International Rice Research Institute, P.O. Box 3127, MCPO, 1271 Makati City, Philippines E-mail: [email protected]
Introduction The Indo-Gangetic Plains including the State of Haryana have contributed tremendously to the success of Green Revolution in India. Rice and wheat, commonly grown in double crop- ping rotation, are the major cereal crops of the region and their average productivity ranges between 3 to 5 t ha-1. Rapidly increasing population necessitates that the productivity of the land be further increased. This has to be achieved without increasing environmental degrada- tion while maintaining or increasing farmers’ income. From an ecological point of view, land use/land cover change is a major factor affecting the health and stability of an ecosystem. Therefore, economically viable optimal solutions for land use can be determined by the use of a systems approach where the biophysical potential of the resources available and the socio- economic constraints, which are often inherently conflicting in nature, are considered to determine the consequences and trade-offs of different sets of policy aims on agriculture (Romero & Rehman, 1989; Rehman & Romero, 1993).
We have recently started studies to develop a framework to explore the agricultural land use options based on our present technical knowledge, and anticipated future objectives and constraints. Haryana State in northern India has been selected for the study with an objective to determine the magnitude of production possibilities, associated environmental risks and the inputs required to attain the targeted production levels.
Implications of various conflicting scenarios relating to multiple goals of maximizing food production and income while minimizing environmental degradation are evaluated in this framework by the symphonic use of simulation models, GIS (Geographic Information Sys- tem) and optimization techniques. The overall approach of our study and the method of generating agro-ecological units and biophysical input-output relationships are outlined by Aggarwal et al. (1998, this volume).
This paper describes the approach of linking the biophysical framework with the socio- economic analysis for the interactive multiple goal linear programming. The procedure is illustrated for current level of technologies practised in Karnal – a major district of Haryana.
Material and methods The study region Karnal district in the State of Haryana typically represents an irrigated, input intensive rural
89 R. Roetter et al. (eds): Exchange of methodologies in land use planning. SysNet Research Paper Series No. 1 (1998). 89-92. IRRI, Los Baños, Philippines.

90
area. Rice and wheat occupy more than 90% of the total cultivated area. Almost the entire (>96%) net sown area is irrigated. Groundwater is a major source of irrigation in Karnal. The district consists of ten revenue blocks but for the purpose of this study, the entire district was considered as a one-decision unit.
Interactive Multiple Goal Linear Programming (IMGLP) method Goals Various policy views concerning future land use in the state were distilled from policy documents and in consultation with the regional policy makers and stakeholders. These views have been operationalized by means of objective functions. The important future agricultural development goals for Haryana were considered to be maximization of cereal (rice + wheat), pulse (gram), fibre (cotton), oilseed (mustard) and milk production accompanied by maximi- zation of employment in and income from agriculture, reclamation of salinity and minimization of pesticide residues, N leaching and groundwater use. From these, the following six important goals were selected for this preliminary study, based on their relative importance for the Karnal district and considering the availability of limited time and data. - Maximize food production - Maximize cotton production - Maximize income - Maximize employment - Minimize groundwater pumping - Minimize N fertilizer use.
Agro-ecological units The entire State of Haryana (4.4 m ha) has been classified into 199 homogeneous agro-ecological units by overlaying field scale soil characteristics (texture, organic carbon, slope, groundwater depth and extent and level of salinity and sodicitiy) and annual rainfall, which varies from 300 to 1200 mm (Aggarwal et al., 1998, this volume). Thirteen agro-ecological units within the administrative boundaries of the district Karnal were delineated for this study.
Optimization A multiple goal linear programming model has been used in this study (De Wit et al., 1988). The model was developed using a mathematical modelling and optimization software, namely XPRESS-MP (1997).
Data base generation Technical coefficients were generated as described by Aggamal et al. (1998, this volume) to quantify the input-output relationships for various production activities in the agro-ecological units. This biophysical data set was supplemented by a small, primary survey and by other socio-economic studies conducted in the same area. Several cropping activities were selected for detailed analysis, from the data set obtained by primary survey and discussion with agricultural experts within the region.
Set of constraints The constraints for the current optimization exercise included the availabil- ity of the land, water and labour. Land constraint was specified in a two-dimensional form namely, block and land unit, respectively, Labour constraint was specified for each block on a monthly basis. Matrix coefficients for each activity were quantified from data collected

91
through farm level survey and also by technical coefficients generated following the method described by Aggarwal et al. (1998, this volume).
For the objective functions relating to minimizing of pumped water and N fertilizer used, a lower limit of 1.05 10 6 t food, the current level of food production in the district, was used to avoid zero results.
Results and discussion Table 1 describes the preliminary results of the ‘zero round’ of optimization for different objective functions. It could be observed that a maximum food production of 2.1 million tonnes could be produced from the Karnal district provided the entire area was allocated to food production. This is almost double the current level of production from the district. The most common cropping system in Karnal at present is basmati rice-wheat. In the ‘zero round’ (without any goal restrictions), the model results suggest that rice-rice-wheat can be produced in the entire district provided there are no constraints such as spatial and temporal availability of water and nutrients. Once these constraints are imposed in the model, possible food production will be lower. This maximum food production (2.1 10 6 t) attained in this analysis uses all available water (18.0 × 10 8 m 3 ) and needs 89,000 t of N fertilizer and 72.3 million man-days of labour to give an income of 197 million rupees.
When production of cotton is maximized, 493,000 tomes of cottonseed can be produced in the district together with 1.1 million tomes of food in the rabi season (cotton-wheat rotations). This cropping pattern uses small amount of pumped water (2.0 × 10 8 m 3 ) but reduces agricultural employment and income (Table 1). Maximization of income gives more or less the same results as maximization of food except here a small area of Karnal would be allocated to cotton-wheat.
Maximization of employment in agriculture can be an important goal for many policy makers. Our results show that the agricultural scenarios used in this preliminary analysis for the Karnal district can absorb a maximum of 77.9 million man-days per year. This is done by diversifying a significant portion of land to the maize-potato-wheat cropping pattern, which is more labour intensive. However, when maximizing employment, the income is very much reduced due to lower production of ( basmati ) rice.
Table 1. The results of ‘zero round’ of optimization (and first round for water and N fertilizer use with bound on food production).
Goal
Food Cotton Oil seed Other crops Income Employment Water pumped N fertilizer
Unit
10 6 t 10 3 t 10 3 t 10 3 t
10 6 rupees 10 6 m-d
10 8 m 3
10 3 t
Max. food
2.12 0 0 0
197 72.3 18.0 89
Max. cotton
1.1 493
0 0
156 39.6 2.0 77
Max. income
2.07 94 0 0
214 64.9 14.9 82
Max. employment
1.44 0 0
208 79
77.9
6.5 65
Min. water 1.05 209
0 175 72
62.9 1.3 63
Min. N fertilizer
1.05 0 0 0
95 32.7 8.1 34
92
When we minimized the water use keeping the lower bound of food (rice + wheat) at 1.05 10 6
t, the results, as expected, showed no cropping system including rice. Instead, the entire area was dominated by the cropping systems cotton-wheat and maize-potato-wheat. The income in this scenario was, however, fairly low. Similarly, when we minimized N use, the lower limit of food (1.05 l0 6 t) was produced by the rice-wheat system but with much reduced income level and labour employment.
Conclusions and future work This preliminary study was done to develop the framework for linkage of biophysical input- output matrix with the socio-economic databases and the objectives different from major policy goals. Although such a linkage of the framework is now successfully demonstrated, the results are still of no consequence to influence policy decisions. There are several limitations in the methodology that need to be overcome before meaningful results can be obtained. First of all there is an urgent need to compare the input-output relations (biophysical as well as socio-economic) with the field situations to have greater confidence in the results. Primary surveys, using a GPS (Global Positioning System), need to be done in order to geo-reference the sampled fields according to agro-ecological zones. We have recently started such primary surveys in different parts of Karnal.
The current optimization exercise was done with only a limited number of objective functions. Important objectives related to the sustainability of the production systems, such as NO3 leaching and biocide residues could not be processed because of limitations in the methodologies to determine their quantities on a long-term basis. Many of the socio-economic data are old and from secondary sources. Greater efforts need to be made to update this information. Lastly, lower and upper bounds for different objective functions and constraints still need to be determined carefully in consultation with the regional stakeholders.
References Aggarwal, P.K., N. Kalra, S.K. Bandyopadhyay, H. Pathak, V.K. Sehgal, R. Kaur, T.B.S.
Rajput, H.C. Joshi, R. Choudhary & R. Roetter, 1998. Exploring agricultural land use op- tions for the State of Haryana: Biophysical modelling. (this volume)
De Wit, C.T., H. Van Keulen, N.G. Seligman & I. Spharim, 1988. Application of interactive multiple goal programming techniques for analysis and planning of regional agricultural development. Agricultural Systems 26(3), 211-230.
Rehman, T. &. C. Romero, 1993. Multiple criteria analysis in agricultural systems. Elsevier, Amsterdam, The Netherlands, 183 pp,
Amsterdam, The Netherlands, 257 pp.
House, Blisworth, Northants NN7 3BX, UK, 290 pp.
Romero, C. & T. Rehman, 1989. Multiple criteria analysis for agricultural decisions. Elsevier,
XPRESS-MP, 1997. User guide and reference manual. Dash Associates Ltd. Blisworth

SysNet methodology development and application for land use exploration in the Kedah-Perlis region, Malaysia: Preliminary results
A.A. Kamaruddin 1 , A. Tawang, I.A. Bakar, T.M.T. Yahya, M.Y. Abdullah, H.B. Jaafar, A.S. Othman, A. Yusoff, Z. Ismail, A.R. Hamzah, A.M. Jaafar, Z.A. Aziz, M.Z.A. Ghani, Normah A. Majid, A.A. Rashid and R. Krishnan
1 Malaysian Agricultural Research and Development Institute (MARDI), P.O. Box 12301, 50774 Kuala Lumpur, Malaysia. E-mail: [email protected]
Introduction The SysNet methodology as a tool for decision support, especially with regard to identifying strategic options in land use planning is well accepted. Its capability to assess different scenarios to fulfil different and conflicting goals, be it at national or at regional level is also well recognized. However, the application of the methodology would depend very much on the capability and capacity to undertake the planning exercise with a clear understanding on what the stakeholders exactly want on sufficient information for land delineation, input-output considerations and the programming itself (see also Tawang et al., 1998, this volume). This paper gives a first attempt of the Malaysian team to present the status of the methodology for Kedah-Perlis, particularly how it takes into account the critical factors for successful applica- tion, based on the current level of knowledge and information. Subsequently, the results are reported after the test-run of the model following the SysNet Workshop in Alor Setar, Malaysia, 3-9 May 1998.
Aspects of the methodology Scenario setting (a) Based on existing policy views both at the Federal and State level, and after consultation with the stakeholders through formal and informal discussions and meetings, two major scenarios were established. Firstly, it was the ‘market-led land use scenario’ where the primary objec- tives were to maximize returns through optimization of resource use with very limited government intervention and consideration for environmental protection. The second scenario was the ‘sustainable agricultural development scenario’. Under this scenario, whilst the goals for optimization of income and food production were stressed, there were equally strong con- siderations for environmental protection, productivity and efficiency related to resource use. Government policies with regard to what should and should not be done, even to the extent of allocating resources, were considered. This information, once translated in the form of objec- tive functions and constraints, was presented to the farmers through a formal field survey for verification and validation. No major deviation in terms of development goals and resource limits against that perceived by the stakeholders was recorded. In the running of the model, however, a series of intermediate scenarios between the first and second scenario were
93 R. Roetter et al. (eds): Exchange of methodologies in land use planning. SysNet Research Paper Series No. 1 (1998). 93-102. IRRI, Los Baños, Philippines.

94
conducted. A total of six scenarios were run.
Land delineation (b) A land unit is referred to as a relatively ‘homogeneous’ land area in terms of agricultural policy formulation, planning and implementation strategy, socio-economic setting, and crop management and performance. Parameters considered in the delineation of land units in the region were as follows: - District boundary (11 districts) - Climatic zone (five zones) - Soil parent material (M-marine alluvium, R-recent riverine alluvium, Z-old riverine allu-
- Soil texture (H-heavy clay, C-clay, L-loam) - Soil with special features (S-saline, L-lateritic, O-not relevant) - Present irrigation facility (MADA area, Muda Agricultural Development Authority).
Resource assessment (c) - Rainfall data were considered for the determination of water adequacy for certain crops as
well as concentration of agricultural activities (e.g. labour requirement) throughout the year. Average monthly rainfall data representing each climatic zone were employed. For the purpose of irrigating the double cropping rice in the MADA area, monthly capacity of Pedu and Muda reservoirs was estimated based on their active storage capacity. About 60% water from the reservoirs was expected to reach the MADA area, where the water distribution potential was considered homogeneous throughout the scheme.
- Availability of labour force was based on rural population. The population by districts in the Kedah-Perlis region is obtained from the ‘Kedah Development Action Plan 1991- 2000’. The urban population of towns in five districts is also available from the same source. This figure is deducted from the population by districts to obtain the figure for rural population. The population figure from other districts that do not have urban population, remain as they are. The population growth rate per annum is also known from the docu- ment and thus calculations were made to obtain figures for the current situation (1998), 2010 and 2020. The labour force available in the three years is based on percentage sug- gested from the rural population and trend projections of the ratio urban to rural, resulting in 35% for 1998, 30% for 2010 and 25% for 2020.
- Potential area for agriculture in each land unit was estimated, firstly, by excluding major built-up areas. This was done by subtracting certain percentages from the rural areas, e.g. settlements, transportation infrastructure, drainage/irrigation, amenities. It has been esti- mated that 5% of the hilly/sedentary area was not available for agriculture (sparsely popu- lated), 15% for the MADA area (highly populated and high intensity of drainage/irrigation canals) and 10% for other forms of land use. For the future (year 2010 and 2020), available area in each land unit was similarly estimated based on a 4% increase in urban area and 2% increase of the settlement and associated infrastructures in the rural areas.
- Promising land use types for each land unit was based on readily available information on crop suitability for the area, which was based on agro-climate, topography, soil character- istics and soil-moisture potential.
vium, S-sedentary)
95
Target demand (d) The minimum quantity of produce demanded by the state for the various commodities is gen- erally calculated using the national per capita consumption figures obtained from the National Agricultural Policy (NAP, 1992-2010) and multiplied by the population of the state. For rubber and oil palm, the figures quoted are based on projections on local processing (NAP). For tobacco, it is based on the quota set by the Government.
Commodities and cropping systems (e) The commodities considered for the region were categorized under three broad areas: annual crops (rice, vegetables, tobacco and sugarcane), perennial crops (fruits, rubber and oil palm) and livestock (cattle integration under oil palm). For these commodities, the production activities (cropping systems) were based on the existing systems in the region, as follows: Rice - Rice Durian Rice - Tobacco Mango Rice - Leafy vegetables Rubber Rice - Fallow Oil palm with cattle Tobacco - Fallow Oil palm Tobacco - Leafy vegetables Sugarcane Leafy - Trellis - Leafy (Vegetables) Starfruit Chilli - Fallow Banana
Yield estimation and Production Situation (f) Three levels of yield estimations were used; actual, good management practice (GMP) and near potential. Actual yield is basically the average yield level recorded by a majority of the farmers. The application of the current technology with respect to crop management and cultural practices are considered moderate. The yield level is generally low due to limitations of water, nutrients and poor control of pests and diseases management. Good management practice's yield level refers to a maximum yield obtainable by some advanced farmers or from estates/plantations using recommended agricultural practices and under good management practices with respect to water and nutrient applications. The source of information for actual and GMP yields was obtained through a survey conducted on selected farmers as well as a compilation of yield records from farmers conducted by agricultural extension workers from the State Agriculture Department.
Near potential yield on the other hand refers to a maximum yield obtainable under ex- tremely good conditions. All available current technology is used with little resource (water and nutrient) limitation and pest and disease management is kept at a very high level. The data for yield level is obtained from experimental plots and also estates/plantations with very good management practices and yield records. In some cases, yield is also calculated on the basis of yield component analysis to give a possible range of maximum yield.
The potential yield (referring to the yield defined by climatic factors viz. radiation, tem- perature and crop physiological properties only) for rice was calculated by using the CERES- Rice model (Singh et al., 1993). In the future, potential yields for other annual crops will be calculated using WOFOST 7.1 (Boogaard et al., 1998). In this preliminary study, the empha- sis was given to the estimation of actual and GMP yields only.

96
A maximum of four production technology levels, based on water status (irrigated and rainfed) and level of nutrient and pesticide application (high input versus low input) were used for the yield estimation. Based on the current practice with respect to water use, some crops maybe planted using irrigation facilities or just under rainfed conditions. Crops that fall under this group such as rice, banana and sugarcane may have four production technologies namely; irrigated-high input, irrigated-low input, rainfed-high input and rainfed-low input. Vegetables (chilli, trellis and leafy) and tobacco are usually grown with supplementary irriga- tion. For these crops, only two technology levels, irrigated-high input and irrigated-low input are applicable. Irrigation is not essential or a common practice for most of perennials such as fruit trees (durian, mango and carambola), oil palm and rubber. For these crops only rainfed- high input and rainfed-low input are applicable.
For each production scenario, yield estimation was based on two main factors namely, land unit characteristics, and rainfall pattern for the particular area. Soil fertility, moisture status and water table are land unit characteristics affecting target yield levels under similar level of inputs for each production technology. Cropping activities were determined according to wet and dry months from the rainfall pattern for the area. Rainfall pattern is also used for the esti- mation of severity of pest and disease outbreak, which may affect final yield.
Input-output estimations (g) In land use analysis, agricultural activities involve the use of substitutable and non-sub- stitutable inputs for the production of desirable outputs as indicated in the yield estimation, such as grain yield (t ha -1 ). Inevitably, some undesirable outputs would also be produced. In the current study, the undesirable outputs such as nitrogen losses were not considered.
The types of substitutable or non-substitutable inputs used varied with product types, whilst that of quantity varied with land-use types, both agro-ecological zone-specific. The main substitutable production inputs involved were fertilizer (inorganic and organic manure), chemicals (herbicides, fungicides, insecticides, rodenticides, growth hormones, etc.) and labour, whilst the non-substitutable input was irrigation water. These inputs were expressed in physical units per area unit for example kg ha -1 for fertilizer, a.i. kg ha -1 for chemicals. Where liquid chemical was used, the amount of active ingredient was converted from litre h a -1 to kg ha -1 using the standard conversion factor. The quantity of irrigation water con- sumed was based on crop water requirements and expressed in mm ha -1 season -1 . The use of irrigation water in input-output tables was only confined to annual crops, rice and vegetables, and short-term fruit such as banana. The use of labour input was divided into three common categories viz. land preparation, harvesting, others. Labour was such differentiated because each category represents a separate workload with inherently different costs involved. All land preparations were carried out by mechanization. Similarly rice harvesting was done completely by combine harvesters. Hence labour requirements for these two operations were very small.
Production inputs were used with the aim of producing the desired outputs. The estimated quantum for these inputs was related to the estimated outputs. They were based on the total amount of variable inputs required to manage, maintain and produce that amount of specific desirable output, as reported in experimental plots. Where data from experimental plot was unavailable, farm survey or secondary data was used. For annual crops, total amount of inputs

97
used comprised of the complete production or growing season. Due to lack of protocol, the total inputs for perennials comprised of inputs used only during productive years, excluding those utilized during the establishment period. Thus, in perennials, the input-output may not show a true relationship. Similarly, irrigation water was only confined to the annual crops (rice and vegetables) and also short-cycle fruit crops (e.g. banana).
The outputs, represented by the yields of the commodities, are given in t ha–1. The esti- mated levels of outputs were differentiated by the production situation/technology level. Where production situations only differ in soil characteristics or biotic factors, the potential production levels for these remained the same. The difference between near-optimum and actual production levels was estimated to be higher in the favourable ago-ecological zones for a given crop, than in less favourable, at the same input levels. For sugarcane, variations in day-night temperature were considered for estimating differences in yield levels among agro- climatic zones.
In calculating the production costs and incomes, the retail prices of inputs from major dis- tributing centres within the region were collected. Labour wages were based on information derived from farm survey, similarly for the fixed land-rent rate (especially for rice). Output prices were based on information collected at six wholesale markets and adjusted to ex-farm prices.
Linear programming (h) The MGLP (Multiple Goal Linear Programming) model was developed using Visual XPRESS-MP (1997) to explore options for future land use, utilizing information established in ( a ) to ( g ) above. An LP model is composed of: ( i ) activities, ( ii ) linear constraints and ( iii ) a linear objective function for which the model is optimized. MGLP models have more than one objective function. In each interactive run of an MGLP model, the model is optimized for one of the objective functions with upper or lower bounds on the other objectives, with the later objectives used as goal restrictions. In this way, the consequences of tightening one objective in terms of other objectives are revealed and trade-offs between objectives become visible.
Land use activities, resource or product balances (demands/targets) and constraints were defined and quantified for each of the land units (integration of agro-ecological zones and administrative boundaries) within the Kedah-Perlis region. Specific objectives derived from policy views were identified and formulated with a set of explicit objective functions as given in Table 1.
Results and discussion In this preliminary study, six scenarios, each with nine objective functions were formulated and analysed. Although the option for optimizing land use in Kedah and Perlis states sepa- rately had been established in the model, the analysis conducted was based on the Kedah- Perlis region as a whole. The set-up of the six scenarios analysed is presented in Table 2.
Based on the analysis of the current MGLP model, a brief summary of the results, empha- sizing only the two major objective functions, i.e. maximizing incomes and rice production under the three major constraints (land, labour and water), is shown in Table 3.
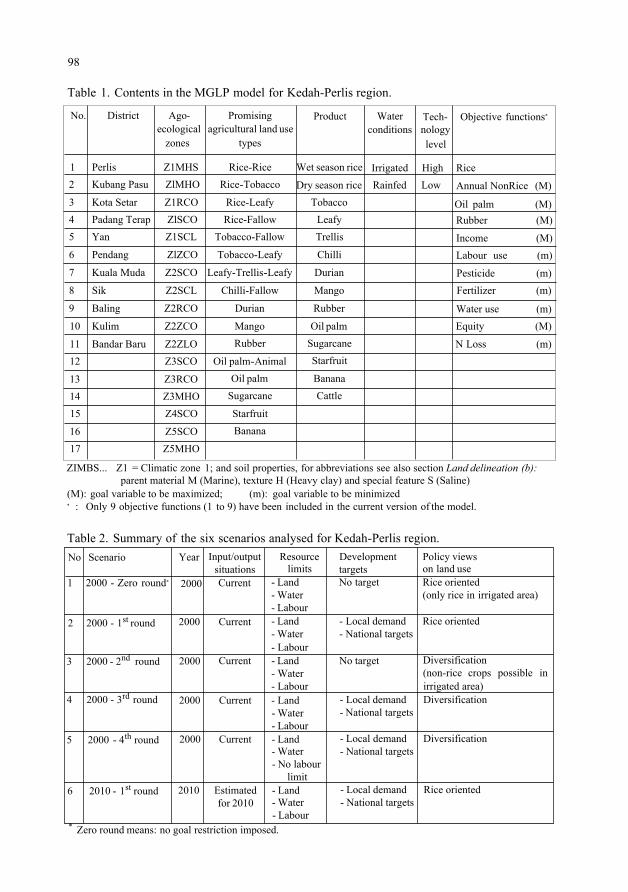
98
Table 1. Contents in the MGLP model for Kedah-Perlis region.
No. Ago- ecological
zones
1 Z1MHS 2 ZlMHO
3 Z1RCO 4 ZlSCO 5 Z1SCL
6 ZlZCO
7 Z2SCO
8 Z2SCL
9 Z2RCO
10 Z2ZCO
11 Z2ZLO 12 Z3SCO
13 Z3RCO 14 Z3MHO 15 Z4SCO
16 Z5SCO 17 Z5MHO
ZIMBS... Z1 = Climatic zone 1; and soil properties, for abbreviations see also section Land delineation (b):
(M): goal variable to be maximized; (m): goal variable to be minimized parent material M (Marine), texture H (Heavy clay) and special feature S (Saline)
* : Only 9 objective functions (1 to 9) have been included in the current version of the model.
District
Perlis Kubang Pasu
Kota Setar Padang Terap Yan
Pendang
Kuala Muda
Sik
Baling
Kulim
Bandar Baru
Promising agricultural land use
types
Rice-Rice Rice-Tobacco
Rice-Leafy Rice-Fallow
Tobacco-Fallow
Tobacco-Leafy
Leafy-Trellis-Leafy
Chilli-Fallow
Durian
Mango Rubber
Oil palm-Animal Oil palm
Sugarcane
Starfruit Banana
Product
Wet season rice
Dry season rice Tobacco
Leafy Trellis
Chilli
Durian
Mango
Rubber
Oil palm Sugarcane Starfruit
Banana Cattle
Water conditions
Irrigated Rainfed
Tech-
Low
nology level
High
Objective functions*
Oil palm (M)
Rice
Annual NonRice (M)
Rubber (M)
Income (M) Labour use (m)
Pesticide (m) Fertilizer (m)
Water use (m) Equity (M)
N Loss (m)
Table 2. Summary of the six scenarios analysed for Kedah-Perlis region. No Scenario
1 2000 - Zero round*
2 2000 - 1 st round
3 2000 - 2 nd round
4 2000 - 3 rd round
5 2000 - 4 th round
6 2010 - 1 st round
2000
2000
2000
2010
Input/output situations Current
Current
Current
Current
Current
Estimated for 2010
Resource limits
- Land - Water - Labour
- Water - Labour - Land - Water - Labour
- Water - Labour
- Water - No labour
limit - Land
- Land
- Land
- Land
- Water - Labour
* Zero round means: no goal restriction imposed.
Development targets No target
- Local demand - National targets
No target
- Local demand - National targets
- Local demand - National targets
- Local demand - National targets
Policy views on land use Rice oriented (only rice in irrigated area)
Rice oriented
Diversification (non-rice crops possible in irrigated area) Diversification
Diversification
Rice oriented
Year
2000
2000
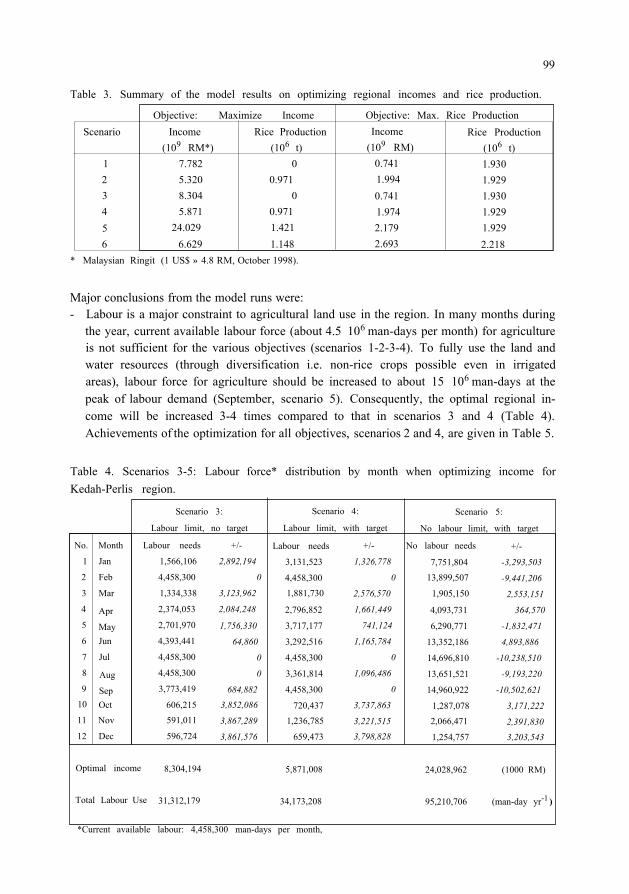
99
Table 3. Summary of the model results on optimizing regional incomes and rice production.
Objective: Maximize Income Objective: Max. Rice Production Scenario
1 2 3 4 5 6
Income (10 9 RM*)
7.782 5.320 8.304 5.871
24.029 6.629
Rice Production (10 6 t)
0 0.971
0 0.971 1.421 1.148
Income (10 9 RM)
0.741 1.994 0.741 1.974 2.179 2.693
Rice Production (10 6 t) 1.930 1.929 1.930 1.929 1.929 2.218
* Malaysian Ringit (1 US$ » 4.8 RM, October 1998).
Major conclusions from the model runs were: - Labour is a major constraint to agricultural land use in the region. In many months during
the year, current available labour force (about 4.5 10 6 man-days per month) for agriculture is not sufficient for the various objectives (scenarios 1-2-3-4). To fully use the land and water resources (through diversification i.e. non-rice crops possible even in irrigated areas), labour force for agriculture should be increased to about 15 10 6 man-days at the peak of labour demand (September, scenario 5). Consequently, the optimal regional in- come will be increased 3-4 times compared to that in scenarios 3 and 4 (Table 4). Achievements of the optimization for all objectives, scenarios 2 and 4, are given in Table 5.
Table 4. Scenarios 3-5: Labour force* distribution by month when optimizing income for Kedah-Perlis region.
No.
1
2
3
4
5
6
7
8
9
10
11
12
Month
Jan
Feb
Mar
Apr
May Jun
Jul
Aug
Sep Oct
Nov
Dec
Labour needs
1,566,106
4,458,300
1,334,338
2,374,053
2,701,970
4,393,441
4,458,300
4,458,300
3,773,419
606,215
591,011
596,724
Scenario 3:
Labour limit, no target
+/-
2,892,194
0
3,123,962
2,084,248
1,756,330
64,860
0
0
684,882 3,852,086
3,867,289
3,861,576
Optimal income
Total Labour Use
8,304,194
31,312,179
Scenario 4:
Labour limit, with target
Labour needs
3,131,523
4,458,300
1,881,730
2,796,852
3,717,177
3,292,516
4,458,300
3,361,814
4,458,300
720,437
1,236,785
659,473
5,871,008
34,173,208
+/-
1,326,778
0
2,576,570
1,661,449
741,124
1,165,784
0
1,096,486
0
3,737,863
3,221,515 3,798,828
No labour needs
7,751,804
13,899,507
1,905,150
4,093,731
6,290,771
13,352,186
14,696,810
13,651,521
14,960,922
1,287,078
2,066,471
1,254,757
Scenario 5:
No labour limit, with target
+/-
-3,293,503
-9,441,206
2,553,151
364,570
-1,832,471
4,893,886
-10,238,510
-9,193,220
-10,502,621
3,171,222
2,391,830 3,203,543
24,028,962
95,210,706
(1000 RM)
(man-day yr -1 )
*Current available labour: 4,458,300 man-days per month,

Table 5. MGLP model results for goal variables being optimized and achievements other goals for Kedah-Perlis region (scenarios 2 and 4).
Scenario 2 (only rice in irrigated area / with local demand and national targets)
Achievement of objectives 1 2 3 4 5 6 7 8 9
No. 1 2 3 4 5 6 7 8 9
Goal variable Rice AnNonRice*
Oil palm Rubber Income Labour Use Pesticide Fertilizer Water Use
Unit t t t t
m-d yr–1
103 RM
kg t
103 m3
Rice 1,928,665
4,085 540,961 216,700
1,994,264 18,320,436
1,196,645 173,376
2,307,349
AnNonRice*
971,000 933,553 300,534 216,700
1,440,772 29,994,628
874,149 215,388
1,170,074
Oil palm Robber Income 971,000 971,000 971,000
4,085 2,413,375
216,700 2,032,648
14,922,748 656,610 108,644
1,084,150
4,085 300,534
1,457,514 2,231,466
27,382,791 489,343
59,834 1,085,356
691,612 2,413,375
216,700 5,319,695
24,812,723 1,264,929
266,807 1,117,260
Labour Use 971,000
4,085 300,534 216,700 739,696
9,103,049 487,811
59,569 1,084,070
Pesticide 971,000
4,085 300,534 216,700 743,284
9,139,447 487,749
59,624 1,084,036
Fertilizer 971,000
4,085 300,534 216,700 741,208
9,156,180 488,177
59,540 1,084,176
Water Use 971,000
4,085 418,679 216,700
1,773,809 15,136,866
735,878 113,542
1,060,752
Scenario 4 (other crops possible in irrigated area / with local demand and national targets)
No. 1 2 3 4 5 6 7 8 9
Goal variable Rice AnNonRice*
Oil palm Rubber Income Labour Use Pesticide Fertilizer Water Use
Unit 1
Rice t t t t
10 3 RM m-d yr –1
kg
10 3 m 3 t
1,928,665 25,228
640,370 216,700
1,974,071 18,629,839
1,202,158 176,291
2,312,607 * Annual non-rice production
971,000 1,630,043
300,534 216,700
2,804,268 29,980,319
1,249,982 381,372
1,207,428
Achievement of objectives 2 3 7 8 9
AnNonRice* Oil palm Pesticide Fertilizer Water Use 971,000 971,000 971,000 971,000
68,128 4,085 4,085 4,085 2,413,375 640,370 300,534 640,370
216,700 216,700 216,700 216,700 2,177,809 851,610 761,823 1,724,405
18,270,009 9,573,575 9,178,211 15,498,305 817,873 487,705 488,071 758,536 139,852 59,586 59,529 118,080
1,094,326 1,084,112 1,084,149 1,060,724
4 Rubber 971,000
4,085 410,290
1,457,514 2,263,027
27,322,787 488,346
59,859 1,084,194
5 Income 971,000
1,323,546 2,413,375
216,700 5,871,008
34,173,208 1,522,696
377,873 1,162,639
6 Labour Use
971,000 4,085
300,534 216,700 739,696
9,099,623 487,705
59,564 1,083,976
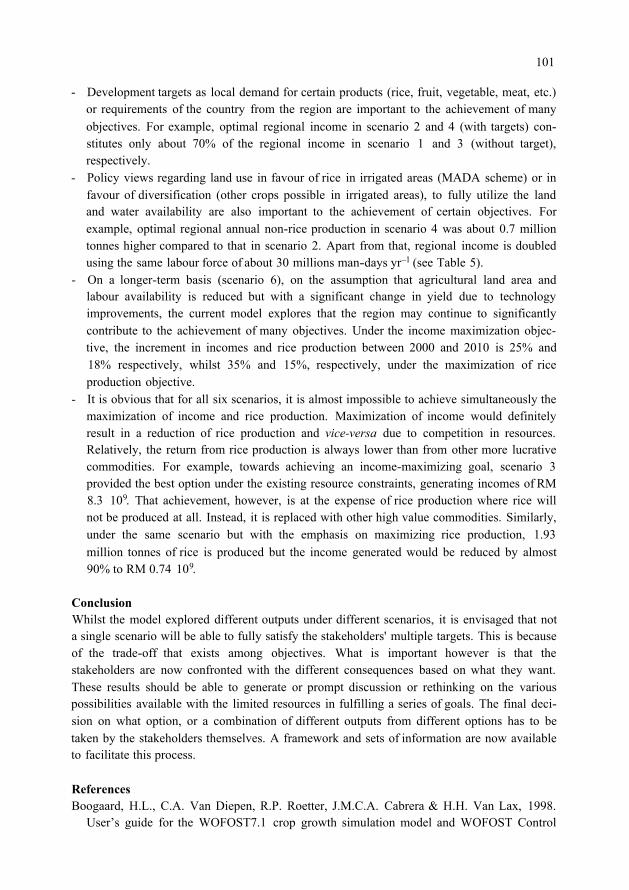
101
- Development targets as local demand for certain products (rice, fruit, vegetable, meat, etc.) or requirements of the country from the region are important to the achievement of many objectives. For example, optimal regional income in scenario 2 and 4 (with targets) con- stitutes only about 70% of the regional income in scenario 1 and 3 (without target), respectively.
- Policy views regarding land use in favour of rice in irrigated areas (MADA scheme) or in favour of diversification (other crops possible in irrigated areas), to fully utilize the land and water availability are also important to the achievement of certain objectives. For example, optimal regional annual non-rice production in scenario 4 was about 0.7 million tonnes higher compared to that in scenario 2. Apart from that, regional income is doubled using the same labour force of about 30 millions man-days yr –1 (see Table 5).
- On a longer-term basis (scenario 6), on the assumption that agricultural land area and labour availability is reduced but with a significant change in yield due to technology improvements, the current model explores that the region may continue to significantly contribute to the achievement of many objectives. Under the income maximization objec- tive, the increment in incomes and rice production between 2000 and 2010 is 25% and 18% respectively, whilst 35% and 15%, respectively, under the maximization of rice production objective.
- It is obvious that for all six scenarios, it is almost impossible to achieve simultaneously the maximization of income and rice production. Maximization of income would definitely result in a reduction of rice production and vice-versa due to competition in resources. Relatively, the return from rice production is always lower than from other more lucrative commodities. For example, towards achieving an income-maximizing goal, scenario 3 provided the best option under the existing resource constraints, generating incomes of RM 8.3 10 9 . That achievement, however, is at the expense of rice production where rice will not be produced at all. Instead, it is replaced with other high value commodities. Similarly, under the same scenario but with the emphasis on maximizing rice production, 1.93 million tonnes of rice is produced but the income generated would be reduced by almost 90% to RM 0.74 10 9 .
Conclusion Whilst the model explored different outputs under different scenarios, it is envisaged that not a single scenario will be able to fully satisfy the stakeholders' multiple targets. This is because of the trade-off that exists among objectives. What is important however is that the stakeholders are now confronted with the different consequences based on what they want. These results should be able to generate or prompt discussion or rethinking on the various possibilities available with the limited resources in fulfilling a series of goals. The final deci- sion on what option, or a combination of different outputs from different options has to be taken by the stakeholders themselves. A framework and sets of information are now available to facilitate this process.
References Boogaard, H.L., C.A. Van Diepen, R.P. Roetter, J.M.C.A. Cabrera & H.H. Van Lax, 1998.
User’s guide for the WOFOST7.1 crop growth simulation model and WOFOST Control

102
Center 1.51. DLO-Winand Staring Centre, Wageningen, The Netherlands, Technical Document 52, 140 pp.
Singh, U., J.T. Ritchie, & D.C. Godwin, 1993. A user’s guide to CERES-Rice - V2.10. Simulation manual IFDC-SM-4, International Fertilizer Development Center, Muscle Shoals, Al, USA, 131 pp.
Tawang, A., I.A. Bakar, A.A. Kamaruddin, T.M.T. Yahya, M.Y. Abdullah, H.B. Jaafar, A.S. Othman, A. Yusoff, Z. Ismail, A.R. Hamzah, A.M. Jaafar, Z.A. Aziz, M.Z.A. Ghani, N.A. Majid, A.A. Rashid & R. Krishnan, 1998. SysNet methodology development in Malaysia with special reference to policy views. (this volume)
XPRESS-MP, 1997. User guide and reference manual. Dash Associates Ltd. Blisworth House, Blisworth, Northants NN7 3BX, UK, 290 pp.

A systems approach to agricultural land use planning at the provincial and municipal levels of Ilocos Norte Province, Philippines
S.R. Francisco 1 , N.R. Navarrete Jr 2 , L.B. Dimasuay 2 , F.P. Lansigan 3 , C.M. Pascual 4 , M.P. Lucas 4 , J.L. Orno 5 , R. Roetter 6 , C.T. Hoanh 6 , A.G. Labort e 6 , T.F. Marcos 4 , C.G. Acosta 4 , E.O. Agustin 4 , M.E. Pascua 4 , S.R. Pascua Jr 4 , R.T. Utrera 1 , R.T. Cruz 1 and S.R. Obien 1
1 Philippine Rice Research Institute (PhilRice), 3119 Muñoz, Nueva Ecija, Philippines
2 Institute of Mathematical Sciences and Physics, UPLB, Los Baños, Philippines 3 Institute of Statistics, UPLB, Los Baños, Philippines 4 Mariano Marcos State University (MMSU), Batac, Ilocos Norte, Philippines 5 School of Environmental Science and Management, UPLB, Los Baños, Philippines 6 International Rice Research Institute, P.O. Box 3127, MCPO, 1271 Makati City, Philippines
E-mail: [email protected]
Introduction In many developing economies, such as the Philippines, agriculture plays an important role as it provides the basis for food production. In the past, the problem of increasing food produc- tion is addressed by expanding area under cultivation. However, scientists and planners recognized expansion of the area alone, as not a permanent solution considering the limited land resources. To cope up with this problem, the government embarked on various develop- ment programmes aimed at increasing production per unit area. Not all of these programmes, however, were successful either because the suggested improvements were not economically feasible or not socially acceptable. These failures made the government to rethink of other strategies to address the problems, one of which is the integrated rural development approach. This approach takes into account the various functions of the rural environment and gives due consideration to the aspirations and goals of various stakeholders in the area. Conflicting interests may arise among such different goals, as increasing food production, minimizing environmental degradation (e.g. by erosion and groundwater pollution) insuring food security to the urban population at acceptable price and guaranteeing a reasonable increase in farmer's income. Furthermore, the satisfaction of the various goals and aspirations pursued may all be calling for the same limited resources, so that the competition for these resources and the out- come are dependent on both the agro-technical possibilities and the socio-economic factors, in a way that more often than not seemed to be intuitively unpredictable. Recognizing this, De Wit et al. (1988) proposed a method to investigate the development possibilities for a region, based on a quantitative analysis of the natural resources base, and taking into consideration various constraints and demands.
In this paper, we applied this methodology for exploring land use options for the province of Ilocos Norte, Philippines (see also Lansigan et al., 1998, this volume).
103 R. Roetter et al. (eds): Exchange of methodologies in land use planning. SysNet Research Paper Series No. 1 (1998), 103-109. IRRI, Los Baños, Philippines.
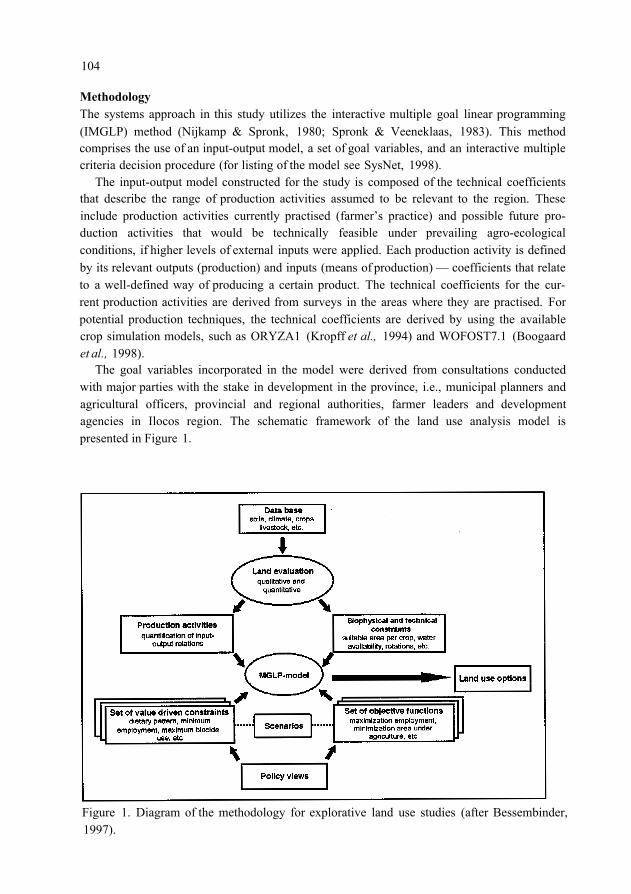
104
Methodology The systems approach in this study utilizes the interactive multiple goal linear programming (IMGLP) method (Nijkamp & Spronk, 1980; Spronk & Veeneklaas, 1983). This method comprises the use of an input-output model, a set of goal variables, and an interactive multiple criteria decision procedure (for listing of the model see SysNet, 1998).
The input-output model constructed for the study is composed of the technical coefficients that describe the range of production activities assumed to be relevant to the region. These include production activities currently practised (farmer’s practice) and possible future pro- duction activities that would be technically feasible under prevailing agro-ecological conditions, if higher levels of external inputs were applied. Each production activity is defined by its relevant outputs (production) and inputs (means of production) — coefficients that relate to a well-defined way of producing a certain product. The technical coefficients for the cur- rent production activities are derived from surveys in the areas where they are practised. For potential production techniques, the technical coefficients are derived by using the available crop simulation models, such as ORYZA1 (Kropff et al., 1994) and WOFOST7.1 (Boogaard et al., 1998).
The goal variables incorporated in the model were derived from consultations conducted with major parties with the stake in development in the province, i.e., municipal planners and agricultural officers, provincial and regional authorities, farmer leaders and development agencies in Ilocos region. The schematic framework of the land use analysis model is presented in Figure 1.
Figure 1. Diagram of the methodology for explorative land use studies (after Bessembinder, 1997).

105
The current model constructed for the province of Ilocos Norte and its municipalities consist of the following nine objective functions:
A. Maximize rice production B. Maximize non-rice production C. Maximize employment in agriculture D. Maximize farmer income E. Maximize total provincial income F. Minimize soil erosion G. Minimize the use of biocides H. Minimize fertilizer use I. Minimize labour use
The goal of income equity has not yet been translated into an objective function. Within the model, constraints on land area, labour, and water availability for the entire province were imposed. In addition, two alternative scenarios were considered: without water-sharing among municipalities and with water-sharing, the latter assuming existence of an efficient irrigation network connecting all the municipalities.
Results and discussion This section discusses the preliminary results obtained from the operational MGLP (Multiple Goal Linear Programming) model. The results of the zero round optimization of the different objective functions are presented in Tables 1 and 2. A zero round is a model run optimizing goals individually without imposing restrictions set by requirements for other goals.
The results of the zero round optimization indicated that farmers will be better off, if the province will opt to maximize non-rice production. The benefits, which farmers will derive, come from increased income due to the production of more profitable crops such as garlic, tomato and onion. Though not optimal with regard to other objectives, maximizing non-rice production gave the farmer and the province a highest income. If the province in general will maximize rice production, income will be less than 50% of the income generated when maximizing the production of other crops (see Table 1). Results from the zero round are summarized below: - Total agricultural production is highest under Goal B, where non-rice production accounts
for 90.3% (see Figure 2). On the other hand, total production is lowest when rice produc- tion is maximized (Goal A). There is a trade-off of 6.4 t increase in non-rice production to 1 t decrease in rice production.
- Labour needs account for less than 50% of total available labour in the province. Maxi- mizing employment in agriculture (Goal C) accounts for about 30% of total available labour. Employment under Goal D accounts for 21% and under Goal A for 11% of total available labour. The lowest labour utilization occurs under Goal B (9%) This result sug- gests that given the size of farm area in the province (less than 0.5 ha on the average), there is not much need for hired labour when non-rice production is maximized. Most of the labour needs can be supplied by family labour. Rice production is labour intensive and this is shown in the average decrease of 5.2 labour-days for every tonne decrease in rice production.
- With the assumption of water-sharing, the result of the optimization runs indicated that the
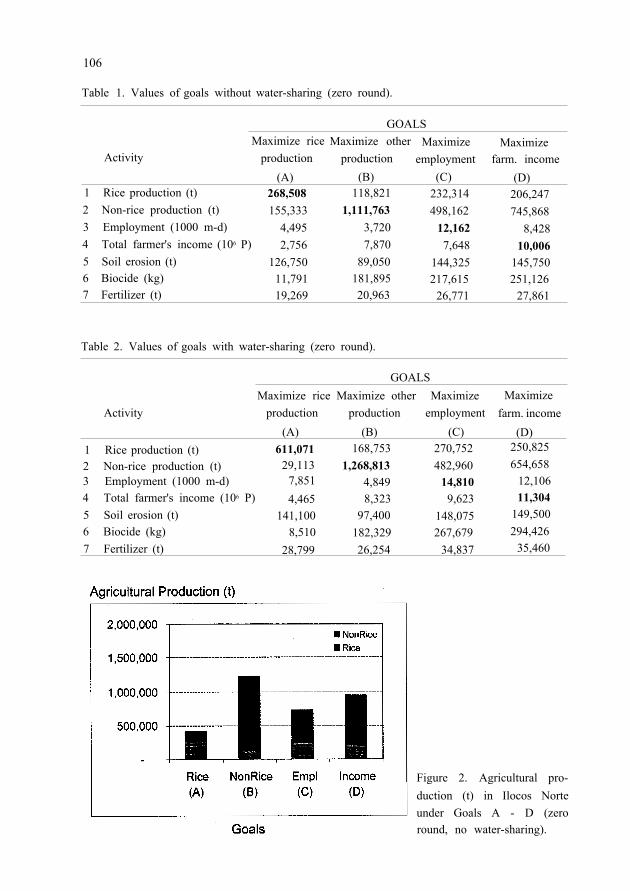
106
Table 1. Values of goals without water-sharing (zero round).
GOALS
Activity Maximize rice
production (A)
1 Rice production (t) 2 Non-rice production (t) 3 Employment (1000 m-d) 4 Total farmer's income (106 P) 5 Soil erosion (t) 6 Biocide (kg) 7 Fertilizer (t)
268,508 155,333
4,495 2,756
126,750 11,791 19,269
Maximize other production
(B) 118,821
1,111,763 3,720 7,870
89,050 181,895 20,963
Maximize employment
(C) 232,314 498,162
12,162 7,648
144,325 217,615
26,771
Maximize farm. income
(D) 206,247 745,868
8,428 10,006
145,750 251,126
27,861
Table 2. Values of goals with water-sharing (zero round).
Activity
GOALS Maximize rice Maximize other Maximize
production production employment (A) (B) (C)
1 Rice production (t) 611,071 168,753 270,752 2 Non-rice production (t) 29,113 1,268,813 482,960 3 Employment (1000 m-d) 7,851 4,849 14,810 4 Total farmer's income (106 P) 4,465 8,323 9,623 5 Soil erosion (t) 141,100 97,400 148,075 6 Biocide (kg) 8,510 182,329 267,679 7 Fertilizer (t) 28,799 26,254 34,837
Maximize farm. income
(D) 250,825 654,658
12,106 11,304
149,500 294,426
35,460
Figure 2. Agricultural pro- duction (t) in Ilocos Norte under Goals A - D (zero round, no water-sharing).
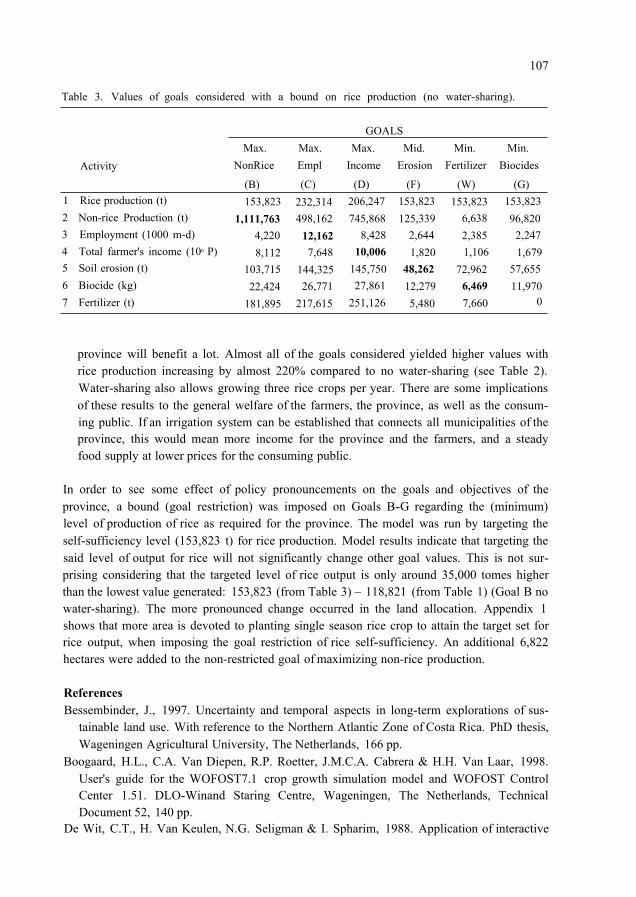
107
Table 3. Values of goals considered with a bound on rice production (no water-sharing).
Activity
1 Rice production (t) 2 Non-rice Production (t) 3 Employment (1000 m-d) 4 Total farmer's income (106 P) 5 Soil erosion (t) 6 Biocide (kg) 7 Fertilizer (t)
GOALS Max. Max. Max. Mid. Min. Min.
NonRice Empl Income Erosion Fertilizer Biocides
(B) (C) (D) (F) (W) (G) 153,823 232,314 206,247 153,823 153,823 153,823
1,111,763 498,162 745,868 125,339 6,638 96,820 4,220 12,162 8,428 2,644 2,385 2,247 8,112 7,648 10,006 1,820 1,106 1,679
103,715 144,325 145,750 48,262 72,962 57,655 22,424 26,771 27,861 12,279 6,469 11,970
181,895 217,615 251,126 5,480 7,660 0
province will benefit a lot. Almost all of the goals considered yielded higher values with rice production increasing by almost 220% compared to no water-sharing (see Table 2). Water-sharing also allows growing three rice crops per year. There are some implications of these results to the general welfare of the farmers, the province, as well as the consum- ing public. If an irrigation system can be established that connects all municipalities of the province, this would mean more income for the province and the farmers, and a steady food supply at lower prices for the consuming public.
In order to see some effect of policy pronouncements on the goals and objectives of the province, a bound (goal restriction) was imposed on Goals B-G regarding the (minimum) level of production of rice as required for the province. The model was run by targeting the self-sufficiency level (153,823 t) for rice production. Model results indicate that targeting the said level of output for rice will not significantly change other goal values. This is not sur- prising considering that the targeted level of rice output is only around 35,000 tomes higher than the lowest value generated: 153,823 (from Table 3) – 118,821 (from Table 1) (Goal B no water-sharing). The more pronounced change occurred in the land allocation. Appendix 1 shows that more area is devoted to planting single season rice crop to attain the target set for rice output, when imposing the goal restriction of rice self-sufficiency. An additional 6,822 hectares were added to the non-restricted goal of maximizing non-rice production.
References Bessembinder, J., 1997. Uncertainty and temporal aspects in long-term explorations of sus-
tainable land use. With reference to the Northern Atlantic Zone of Costa Rica. PhD thesis, Wageningen Agricultural University, The Netherlands, 166 pp.
Boogaard, H.L., C.A. Van Diepen, R.P. Roetter, J.M.C.A. Cabrera & H.H. Van Laar, 1998. User's guide for the WOFOST7.1 crop growth simulation model and WOFOST Control Center 1.51. DLO-Winand Staring Centre, Wageningen, The Netherlands, Technical Document 52, 140 pp.
De Wit, C.T., H. Van Keulen, N.G. Seligman & I. Spharim, 1988. Application of interactive

108
multiple goal programming techniques for analysis and planning of regional agricultural development. Agricultural Systems 26(3), 211-230.
Kropff, M.J., H.H. Van Laar & R.B. Matthews, 1994. ORYZA1: An ecophysiological model for irrigated rice production. SARP Research Proceedings, International Rice Research Institute, P.O. Box 933, Manila, Philippines, 110 pp.
Lansigan, F.P., J.L. Orno, N.R. Navarrete Jr, C.M. Pascual, S.R. Francisco, A.G. Laborte, C.T. Hoanh & R. Roetter, 1998. Systems methodology development for exploratory agri- cultural Land Use Planning for Ilocos Norte Province, Philippines. (this volume)
Nijkamp, P. & J. Spronk, 1980. Interactive multiple goal programming: An evaluation of some results. In: Eds G. Fandel. & T. Gal, Multiple criteria decision-making: Theory and applications. Springer Verlag, Berlin, Germany, pp. 278-293.
Spronk, J. & F. Veeneklaas, 1983. A feasibility study of economic and environmental scenarios by means of Interactive Multiple Goal Programming. Regional Science and Urban Economics 13, 141-160.
SysNet, 1998. Fourth six-monthly Progress Report. International Rice Research Institute, Los Baños, Philippines, pp. 18-22.

Appendix 1. Land use allocation (in ha) for maximizing non-rice production, zero and 1 st round optimization.
No bound on rice production With bound on rice production RFa For RVe
- 100 1,825 - 350
Total Available
100 3,550 4,725 1,925 6,700
10,650 3,100
425 3,700 6,025
50 8,900 4,575 1,600 5,925 5,600 6,250 7,575 4,925 4,275 6,125 4,250
Municipality Adams Bacarra Badoc Bangui Banna Batac
Carasi Currimao
Dumalneg Laoag City Marcos Nueva Era Pagudpud Paoay
Piddig Pinili San Nicolas Sarrat Solsona Vintar
Burgos
Dingras
Pasuquin
For* RVe 100
Mango
275
525 2,700
Rootc
125
Total 100 750
650 4,125
Balance Mango
275
Rootc
125
1,425
Total 100
2,575
650 4,125
Balance
2,800 4,725 1,275 2,575
10,650 3,100
350
125
975 4,725 1,275 2,575
10,650 3,100
125 525 2,700 1,425
425 7 8 9 10 11 12 13 14 15 16 17 18 19 20 21 22 23
425
6,025 50
4,450 4,575
3,825
425 425
4,500 50
3,475 900
400
1,525
600
3,700 3,700
1,550
1,525
2,900
4,500 50
3,475 900
6,025 50
7,350 4,575
600 375 3,675
1,950
4,450
1,600 2,100 5,600 5,450
375 3,675
1,600 2,100 4,053 4,900
1,475 1,547
550
1,475 400
700 5,250
1,950
100 2,325
3,825 1,547 1,350 7,575
1,425 2,625 4,250
700 5,250
625 850
1,975
100 2,325
800 1,425 2,275
50 18,000
800 7,575
1,425 2,625 4,250 3,325
44,975
4,925 2,850 31500
4,925 2,850 3,500
4,100 63,400
800 1,425 2,275
625 850
1,975 2,975
22,700
350 350
300 2,800 56,578
4,100 2,975 22,700
50 18,000
300 2,800
3,325 51,797
7,425 108,375 Total 1,475 6,822 1,475
* For RVe Mango Rootc RFa
Forage Rice-Vegetables Mango Root crops Rice-Fallow
1 2 3 4 5 6
- - - - - - - - - - - - - -
- - - - - - - -
No.
-
- - -
-
-
-
-
-
-
- - - -
-
-
-
-
-
- -
- - - - - -
- - - - - - - -
-
-
- -
-
-
-
-
-
-
- -
-
-
-
-
- - - - - - - - -
- - -
- - - - - -
- - - - - - - - - - - -
- - - - - - - -
-
- - -
-
-
-
-
-
-
- - -
-
-
-
-
-
-
- -
- - - - - -
- - - - - - - -
-
-
- -
-
-
-
-
-
- -
-
-
-


Application of the SysNet methodology in Vietnam: Preliminary results
N.X. Lai1, N.V. Luat1, D.M. Jansen2, C.T. Hoanh3, N.T. Loc1, P.S. Tan1, V.T.K. Hoa1, M.T. Quang1, T.Q. Tuan1, T.T.N. Huan1, H.V. Nghiep1, N.T. Cuong1, P.Q. Hung1 and N.T.P. Nga1
1 Cuu Long Delta Rice Research Institute (CLRRI), O Mon, Can Tho, Vietnam
2 DLO-Winand Staring Centre for Integrated Land, Soil and Water Research (SC-DLO),
3 International Rice Research Institute, P.O. Box 3127, MCPO, 1271 Makati City, Philippines
E-mail: [email protected]
Wageningen UR, P.O. Box 125, 6700 AK Wageningen, The Netherlands
Introduction Can Tho Province is located in the central part of the Mekong Delta with a total area of about 0.3 million ha. Total population of Can Tho in 1994 was 1.82 million. About 83% of the total area are under arable farming, with rice-based cropping systems as the predominant land use type. The major biophysical constraints to agricultural production in Can Tho are seasonal flooding, acid sulphate soils and brackish water intrusion during dry season.
The objective of the Can Tho case study in the SysNet project is to develop and apply the SysNet methodology and tools to explore different development options for the agricultural sector, taking into account the different socio-economic and biophysical conditions, as well as the different goals of the community. A major objective is to develop options for sustainable land use, characterized by economically viable, ecologically sound, and socially acceptable production systems and techniques.
This paper describes preliminary results of the case study application of the methodology. Specific methodological aspects are discussed in more detail by Lai et al. (1998, this volume).
Land evaluation, resource availability and demand Since the Can Tho case study aims at a regional land use planning, only major differences between land characteristics were taken into account. Although spatial distribution of rainfall slightly varies in the region, weather conditions can be assumed homogeneous in the region. Rainfall during the wet season usually excesses the water requirement, therefore, drainage is needed. Biophysical land units were identified based on soil type and surface water condi- tions: - Soil type of land units was based on the 1:100,000 soil map of Can Tho developed by the
Sub-National Institute of Agricultural Planning and Projection (Sub-NIAPP, 1997). The major soil types were identified (Table 1). Variations in soil physical characteristics are small in the region, while those in soil chemical characteristics are significant and have a strong effect on the response of crops to fertilizer applications.
- Surface water conditions were based on the 1:100,000 inundation map of Can Tho, devel- oped by the Department of Water Resource Management of Can Tho Province (1994).
111 R. Roetter et al. (eds): Exchange of methodologies in land use planning. SysNet Research Paper Series No. 1 (1998); 111-116. IRRI, Los Baños, Philippines.

112
Annually, a large part of the province is flooded. Maximum flood level and flood duration at a location depend on topography and the distance to drainage canals. Flooding depth and duration determine the cultivation period for many crops and will also affect the input re- quired for several operations, such as drainage of excess water. It is expected that in the near future, the construction and improvement of flood protection measures, such as dikes, dams and drainage canals, will reduce the risk of flooding. Then, other economic activities, such as industry and services, will occupy a larger part of the area than at present. There- fore, land units were classified according to the current flooding conditions, as well as to the improved conditions with full flood control expected to be realized by the year 2010 (Table 1).
Location and area of the biophysical land units were determined by overlaying soil and sur- face water maps in GIS (Table 1).
In Can Tho Province, agricultural policies are being implemented at the provincial level. For this case study, they are translated into goals and requirements at the district level. Therefore, the administrative boundary was used to delineate management land units. By combining biophysical land units with administrative boundaries, 32 management land units were identified.
Rice, the most important crop in Can Tho, is suitable in the whole province, while cultivation of other crops is only suitable in certain land units. Based on current land use inventory, development plans, production orientation and referring to other regions with similar agro-ecological conditions, 19 land use types were selected as promising.
Land area and water conditions were identified for each land unit, and available labour force was estimated at the district level. At present, agricultural land in the province occupies 79.7% of the total area. It was assumed that total available land area would decrease to 78.9% in the year 2010 because of increases in use for other purposes. Water was assumed to be in ample supply and flooding the major constraint at present. In 2010, however, full flood control is anticipated. In the whole province, total labour force is 52.5% of the population. At present, about 68% of the labour force is engaged in agriculture, and in 2010, it is expected to decrease to 42% due to increased demand by other sectors (Provincial People Committee of Can Tho, 1995).
MGLP model Agricultural land use options were generated by using an MGLP (Multiple Goal Linear Programming) model to optimize selected objectives (listing of the model is given in SysNet, 1998).
Objective functions As the result of consultations with stakeholders, the following objectives were identified for the current phase of the study: - Maximize total regional net farm income - Maximize total rice production - Maximize total non-rice production - Maximize employment generation

Table 1. Biophysical land units in Can Tho Province.
Unit
Vietnamese classification
Code Description Equivalent USDA classification
Soil Water conditions
Flooding Irrigation condition
LU01 LU02 LU03 LU04 LU05 LU06 LU07 LU08 LU09 LU10 LU11 LU12 LU13 LU14 LU15 LU16 LU17 LU18
Pb P
Pfb
Pfb
Pf Pf Pf
Sp1 Sj2M Sj3
Sp2 Sj2 Sj1M Sp2M Sp1M Sj1 Mi Sj3M
Alluvial with new sediment Alluvial without new sediment Alluvial with yellow-reddish layer and new sediment Alluvial with yellow-reddish layer and new sediment Alluvial with yellow-reddish layer but no new sediment Alluvial with yeIlow-reddish layer but no new sediment Alluvial with yellow-reddish layer but no new sediment Strongly potential acid sulphate soils Moderately active salino-acid sulphate soils Slightly active acid sulphate soils Moderately potential acid sulphate soils Moderately active acid sulphate soils Strongly active salino-acid sulphate soils Moderately potential salino-acid sulphate soils Strongly potential salino-acid sulphate soils Strongly active acid sulphate soils Slightly saline soils Slightly active salino-acid sulphate soils
Typic Tropaquents Aeric Tropic Fluvaquents Fluventic Aeric Tropaquepts Fluventic Aeric Tropaquepts Aeric Tropaquepts Aeric Tropaquepts Aeric Tropaquepts Sulfaquepts Sulfic Tropaquepts, Salic Surfic Tropaquepts Sulfic Fluvaquents Pale Sulfic Tropaquepts Sulfaquents Sulfic Tropaquents, Salic Sulfaquents, Salic Sulfaquepts Tropaquepts, Salic Tropaquepts, Salic
Depth
(cm)
Duration (from to)
<30 0 <30 Oct. 30-60 Oct. 30-60 Sept-Nov <30 Oct. 30-60 Oct. 60-100 Sept-Nov 30-60 Oct 30-60 Aug-Oct 30-60 Aug-Oct 60-100 Sept-Nov >100 Aug-Dec 30-60 Aug-Oct 30-60 AUg-Oct 60-100 Aug-Oct 60-100 Aug-Oct 30-60 Aug-Oct 30-60 Aug-Oct
Irrigated Irrigated Irrigated Irrigated Irrigated Irrigated Irrigated Irrigated Irrigated Rainfed Irrigated Irrigated Irrigated Rainfed Irrigated Rainfed Irrigated
Rainfed
Area (ha)
Current
1,605 15,078 35,010 17,759 17,663 6,609
36,762 13,359 28,799 12,323 20,193
5,510 3,790 5,431 4,766 2,141 5,304 4,163
Future
1,605 15,078 76,952
0 16,684 43,371
0 12,683 28,799 12,323 20,193
5,510 3,790 5,431
4,766 2,141 5,304 4,163

114
- Minimize labour use - Maximize fertilizer use efficiency - Minimize total pesticide use.
Constraints Two types of constraints were identified: - Resource constraints: Land area, labour and water availability are considered as major
resource constraints. Assuming that farmers can get support from the Agricultural Bank and private lenders, capital is not a constraint.
- Goal restricting development targets: Development targets are stipulated in the master plan of the province (Table 2). Since Can Tho is one of the provinces providing rice for the whole country of Vietnam, rice-oriented production is selected as a major policy goal.
Technical coefficients Land use options for using land are characterized by technical coefficients that quantify the inputs and outputs. The following inputs-outputs were estimated for promising land types: - Monthly labour requirements - Total amount of pesticides - Total amount of fertilizer - Total amount of fuel - Total costs - Production and total gross income.
Scenarios On the basis of policy views, development plans and targets, two sets of scenarios were formulated (Table 3): - Scenarios for current situation (1997) to analyse the possibilities of achieving goals under
- Scenarios for year 2010 to analyse the possibilities to achieve goals under improved water
In each scenario, objective functions were optimized one by one.
Model results and discussion Using the MGLP model, results of the above-mentioned scenarios were generated. In this paper, the two following scenarios will be discussed as examples: - Results of the ‘zero round’ (without bounds, which means no goal restrictions) and targets
under current conditions are presented in Table 4. When total rice production is maximized, it can reach 3.37 million tonnes, nearly two times the current (1997) rice production in the province. However, no rice crop is selected when total non-rice production is maximized, since sugarcane is selected for all land units due to its highest biomass production. Total non-rice production can be as high as 13.8 million tonnes. Total regional net farm income is lowest when employment is maximized, while it is relatively high in the scenario of maximizing total rice production. This shows that at present, non- rice crops are not profitable compared to rice. In all optimization runs, total labour needs
present constraints, assumed to last until the year 2000, and
conditions.

115
are less than the total labour force available in the province. - Results of the '1 st round' optimization with all development targets (Table 5) indicates that
the targets of the crop production can be reached in all optimization runs. Total rice production, however, is about 1.88 million tonnes, which is only slightly above the target, while non-rice production is considerably higher than the target. There is not much variation in total regional net farm income among the optimization runs. More labour force is required when production of non-rice crops is optimized. However, total labour needs under all optimization runs are less than 50% of the total labour force available in the province. All goal values, however, are considerably lower than the potential when no bounds are set.
Conclusions and recommendations - By application of the SysNet methodology, different land use options can be set-up and
analysed. The MGLP model can help in analysing the possibility to achieve the targets. As
Table 2. Development targets as stated in the provincial master plan.
Item Total regional net farm income Total rice production Total corn production
Unit 10 6 VND*
ton ton
Relation >= >= >=
Total vegetable production ton >= Total bean production ton >= Total sugarcane production ton >= Total fruit production ton >= Total pineapple production ton >= Export rice area ha >= Sugarcane area ha >= Pineapple area ha >= Fruit tree area ha >= Upland crop area ha >= Fishery ha >=
* Vietnamese Dong; 1 US$ = 14,000 Dong (October 1998)
Target 4,429,000 1,800,000
68,000 120,000 15,000
2,000,000 700,000
22,500 50,000 30,000 5,000
30,000 30,000 15,000
Table 3. Scenarios analysed by using the MGLP model.
No Scenario Resource limit Development Policy view Development plan
1 2 3
4 5 6
2000 - 0 round 2000 - 1 st round 2000 - 2 nd round
2010 - 0 round 2010 - 1 st round 2010 - 2 nd round
Land, Water, Labour Land, Water, Labour Land, Water, Labour
Land, Water, Labour Land, Water, Labour Land, Water, Labour
target
No target All targets All targets
No target All targets All targets
Rice oriented Rice oriented Rice oriented, price changes Rice oriented Rice oriented
Rice oriented, price changes
No flood control No flood control No flood control
Flood control Flood control
Flood control

116
Table 4. Goals without specific development targets under the current conditions (1997-2000).
No Goal
1 Rice production (t) 2 Non-rice production (t) 3 Income (million Dong) 4 Labour use (man-day) 5 Fertilizer use (t) 6 Pesticide use (t)
Maximize rice
production
3,372,710 0
47,648,595 44,329,384
238,129 4,252
Maximize non-rice
production
0 13,844,697 31,647,890
112,006,887 309,500
7,478
Maximize income
581,354 2,774,505
83,686,652 34,712,905
233,957 3,263
Maximize employment
762,351 6,385,688
19,910,048 157,038,274
148,875 7,523
Table 5. Goals with development targets under the current conditions (1997-2000).
No Goal
1 Rice production (t) 2 Non-rice production (t) 3 Income (million Dong) 4 Labour use (man-day) 5 Fertilizer use (t) 6 Pesticide use (t)
Maximize rice
production
1,876,088 2,943,000
51,965,329 51,669,253
230,779 4,516
Maximize non-rice
production
1,800,000 4,069,447
52,835,194 53,420,767
257,884 4,734
Maximize income
1,800,000 3,416,023
54,886,085 49,957,372
250,811 4,526
Maximize employment
1,800,000 2,980,929
51,722,626 57,254,976
216,650 4,708
such, the SysNet methodology is not only an academic tool, but is also useful for management. A link between research institutes and management agencies is required to take the full advantages of the SysNet tools for land use planning.
- No solution can be generated to optimize all objectives at the same time. Instead, a stepwise procedure shows the effects of optimizing one objective on the potential for fulfilling the others. Conflicts in selection of objective functions are identified. It is necessary to analyse all these conflicts to formulate an optimal land use plan.
- At present, the SysNet tools are still prototypes. Improvements are required to facilitate their applications.
References Department of Water Source Management, Can Tho, 1994. Inundation map of Can Tho. Lai, N.X., D.M. Jansen, C.T. Hoanh, N.V. Luat, N.T.H. Loc, P.S. Tan, V.T.K. Hoa, M.T.
Quang, T.Q. Tuan, T.T.N. Huan, H.V. Nghiep, N.T. Cuong, P.Q. Hung & N.T.P. Nga, 1998. SysNet methodology development in Vietnam. (this volume)
Provincial People Committee of Can Tho, 1995. Master plan of Can Tho up to year 2010, pp. 34-35. (in Vietnamese)
Sub-National Institute for Agricultural Planing and Projection (NIAPP), 1997. Report on Soil inventory and land evaluation for Can Tho Province, pp. 8-9. (in Vietnamese)
SysNet, 1998. Fourth six-monthly Progress Report. International Rice Research Institute, Los Baños, Philippines, pp. 23-26.

Land use planning in Can Tho Province, Vietnam


A socio-economic perspective for Land Use Planning in the Mekong Delta, Vietnam
A.M. Mandac1 and N.V. Luat2
1 United Nations Development Programme, Cuu Long Delta Rice Research Institute (CLRRI), O Mon, Can Tho, Vietnam E-mail: [email protected] Cuu Long Delta Rice Research Institute (CLRRI), O Mon, Can Tho, Vietnam 2
Introduction The basic conditions of the Mekong Delta's farm economy — scarcity of land and increasing population — have led to increasing demands on agriculture to support industry. Increasing the Gross Value Added (GVA) per hectare of agricultural land will gain increasing importance as a means of combating the problems of population pressure and employment.
Consider a scenario of a massive effort at converting rural society into an efficient agro- industrial community based on an intensity of land use that approximates present day mainland China. In China, farmers get a GVA from agriculture of roughly US$ 2,000 ha-1. Taiwan which gets about US$ 4,000 and South Korea which does over US$ 5,000 ha-1 are rather ambitious models (Roxas, 1989).
The SysNet Project has been undertaking an exploratory land use study in Can Tho Province, Mekong Delta, with the aid of optimization techniques. To understand the regional farm economy is needed for such a study. The objective of this paper is to examine the Mekong Delta's: - Current agricultural production and its likely interaction with intensified crop production,
- Potential farming systems and associated technology, and - To indicate future needs of land use planning research.
Framework for agricultural production in the Mekong Delta There are many potential uses of land in the Mekong Delta. A first step in determining priorities is to examine the major farming systems in the region with respect to land use.
Land use Rice is the single most important crop in the region accounting for 84% of the Mekong Delta's total sown area of about 3.8 million ha (Table 1). The Mekong Delta accounts for 47.2% of the country's total rice land of about 6.76 million ha. Rice has a higher concentration in the Mekong Delta than elsewhere in the country, due to its abundance of water. Fruit trees and coconut rank a distant second and third occupying 4.6 and 3.2% of arable land, respectively. The most common fruit trees are oranges, bananas, pineapples, and mangoes. Fishponds and livestock farms account for only a small fraction of the arable land.
Current crop diversification,
119 R. Roetter et al. (eds): Exchange of methodologies in land use planning. SysNet Reseurch Paper Series No. 1 (1998), 119-124. IRRI, Los Baños, Philippines.
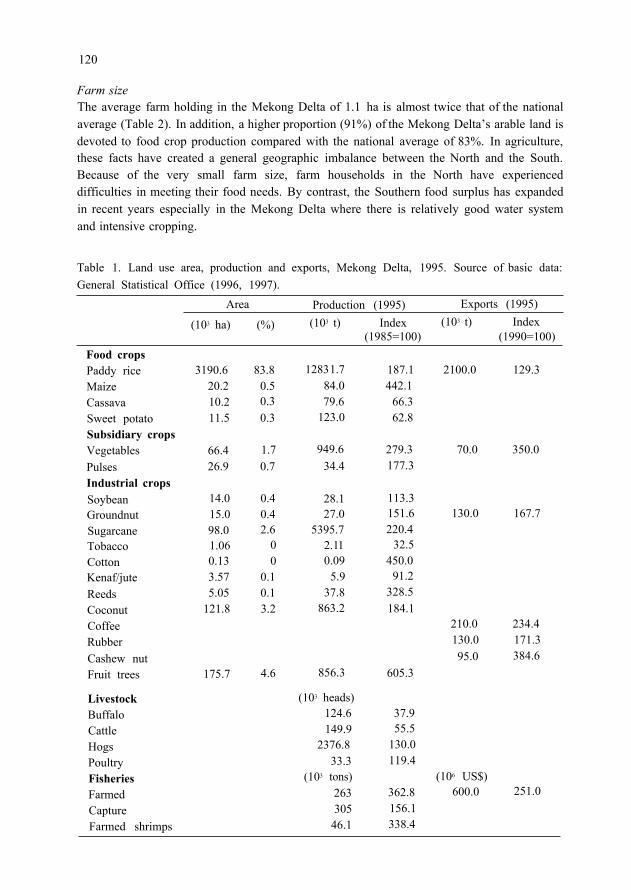
120
Farm size The average farm holding in the Mekong Delta of 1.1 ha is almost twice that of the national average (Table 2). In addition, a higher proportion (91%) of the Mekong Delta’s arable land is devoted to food crop production compared with the national average of 83%. In agriculture, these facts have created a general geographic imbalance between the North and the South. Because of the very small farm size, farm households in the North have experienced difficulties in meeting their food needs. By contrast, the Southern food surplus has expanded in recent years especially in the Mekong Delta where there is relatively good water system and intensive cropping.
Table 1. Land use area, production and exports, Mekong Delta, 1995. Source of basic data: General Statistical Office (1996, 1997).
Food crops Paddy rice Maize Cassava Sweet potato Subsidiary crops Vegetables Pulses Industrial crops Soybean Groundnut Sugarcane Tobacco Cotton Kenaf/jute Reeds Coconut Coffee Rubber Cashew nut Fruit trees
Livestock Buffalo Cattle Hogs
Fisheries Farmed Capture Farmed shrimps
Poultry
Area Production (1995) Exports (1995)
(103 ha) (%) (103 t) Index (103 t) Index (1985=100) (1990=100)
3190.6 20.2 10.2 11.5
66.4 26.9
14.0 15.0 98.0 1.06 0.13 3.57 5.05
121.8
175.7
83.8 0.5 0.3 0.3
1.7 0.7
0.4 0.4 2.6
0 0
0.1 0.1 3.2
4.6
1283 1.7 84.0 79.6
123.0
949.6 34.4
28.1 27.0
5395.7 2.1 1 0.09
5.9 37.8
863.2
856.3
(103 heads) 124.6 149.9
2376.8 33.3
263 305
46.1
(103 tons)
187.1 442.1
66.3 62.8
279.3 177.3
113.3 151.6 220.4
32.5 450.0
91.2 328.5 184.1
605.3
37.9 55.5
130.0 119.4
362.8 156.1 338.4
2100.0
70.0
130.0
210.0 130.0 95.0
(106 US$) 600.0
129.3
350.0
167.7
234.4 171.3 384.6
251.0
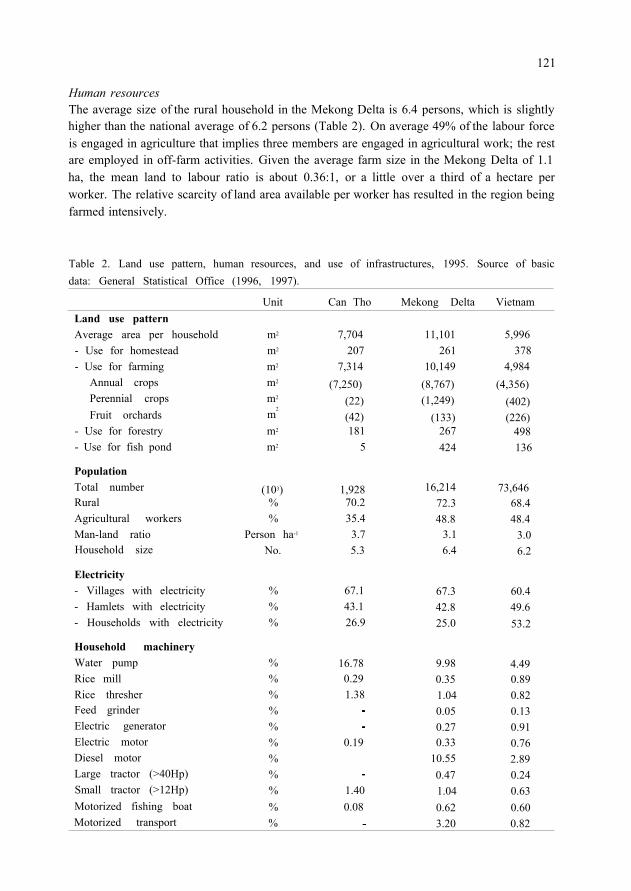
121
Human resources The average size of the rural household in the Mekong Delta is 6.4 persons, which is slightly higher than the national average of 6.2 persons (Table 2). On average 49% of the labour force is engaged in agriculture that implies three members are engaged in agricultural work; the rest are employed in off-farm activities. Given the average farm size in the Mekong Delta of 1.1 ha, the mean land to labour ratio is about 0.36:1, or a little over a third of a hectare per worker. The relative scarcity of land area available per worker has resulted in the region being farmed intensively.
Table 2. Land use pattern, human resources, and use of infrastructures, 1995. Source of basic data: General Statistical Office (1996, 1997).
Land use pattern Average area per household - Use for homestead - Use for farming
Annual crops Perennial crops Fruit orchards
- Use for forestry - Use for fish pond
Population Total number Rural Agricultural workers Man-land ratio Household size
Electricity - Villages with electricity - Hamlets with electricity - Households with electricity
Household machinery Water pump Rice mill Rice thresher Feed grinder Electric generator Electric motor Diesel motor Large tractor (>40Hp) Small tractor (>12Hp) Motorized fishing boat Motorized transport
Unit Can Tho
m2
m2
m2
m2
m2
m m2
m2
2
7,704 207
7,314 (7,250)
(22) (42) 181
5
(103) 1,928 % 70.2 % 35.4
Person ha-1 3.7 No. 5.3
% 67.1 % 43.1 % 26.9
% % % % % % % % % % %
16.78 0.29 1.38
0.19
1.40 0.08
Mekong Delta
11,101 261
10,149 (8,767) (1,249)
(133) 267 424
16,214 72.3 48.8
3.1 6.4
67.3 42.8 25.0
9.98 0.35 1.04 0.05 0.27 0.33
10.55 0.47 1.04 0.62 3.20
Vietnam
5,996 378
4,984 (4,356)
(402) (226)
498 136
73,646 68.4 48.4
3.0 6.2
60.4 49.6 53.2
4.49 0.89 0.82 0.13 0.91 0.76 2.89 0.24 0.63 0.60 0.82 -

122
Infrastructures The level of physical, social and institutional infrastructures in the region is low (Table 2). Three-fourths of farms in the Mekong Delta have no access to electricity; only 1.3% has access to running water. Post-harvest processing and marketing of agricultural products currently must function within the constraints imposed by systems of transportation and electric power. Transport bottlenecks are seen as the main obstacle to regional development of specialized production capabilities in both perishable and non-perishable crops that require provision of food to farmers.
Capital Although Vietnamese farming relies mainly on draft animals and hand tools, mechanization is growing, particularly in the south, and based mainly on small-scale equipment (Table 2). In addition to the usual hand tools and equipment, the most common agricultural implements are the diesel motor (10.6%) and water pump (10%). Less than 5% of all farmers have reported owning any other agricultural implement such as rice threshers, small tractors, rice mills, etc. A few prosperous farmers have invested in large tractors (<1%). Greater mechanization is found only on state farms.
Agricultural production systems Rice-based farming systems Rice-based farming systems research has resulted into a wide variety of sophisticated farming systems models have been developed and practised by farmers in the Mekong Delta. Policy incentives provided by the economic liberalization programme, investments in infrastructures as irrigation and drainage facilities, and adoption of improved crop varieties have brought about a rapid growth in rice production (Table 1). Over the period 1985 to 1995, rice production in the Mekong Delta, on the average, increased by about 6.3% per year.
Food crop production An agricultural development strategy founded on a goal of self-sufficiency has led to rapid increases in production of the major food items of rice and maize (Table 1). Significant production increases were also achieved with vegetables and pulses. However, production of cassava and sweet potato tended to decrease due to the increased availability of rice.
Industrial crop production Table 1 indicates that the national production of tobacco, kenaf/jute, reeds, pineapple, and mango declined between 1985-95. By contrast, the production of sugarcane and coconut almost doubled while those of cotton and mulberry more than doubled. The highest production increase was obtained from oranges, almost four times its 1990 level. The non- uniform performance of industrial and fruit tree crops reflect the changes occurring in foreign markets. For example, the decrease in pineapple production is associated with the decline in exports to the eastern block countries.
Livestock and fishery production For the country as a whole, livestock and fishery productions increased between 1985-95 with

123
the highest growth rates obtained in farmed fish and shrimps (Table 1). The Mekong Delta supplied 83% of the country's farmed shrimps, 65% of farmed fish, and 42% of capture fish making the delta the single most important region in fisheries production. The population of buffalo and cattle has declined an indication of the diminishing importance of animals in the region’s agriculture. Hog raising in Mekong Delta appears adequately profitable as implied by the increasing production level.
Agricultural exports Between 1990-95, rice exports from Vietnam grew from 1.6 to 2.1 million tons for an average 5.9% increase per year. Coffee exports during the same period more than doubled; while exports of cashew nuts and fruits and vegetables more than tripled. The generation of export surplus in the sub-sector indicates that the reforms founded on the rapid generation of agricultural surplus have created a positive environment for increased production.
Potential farming systems Rice-rice+fish system (R-R+F) Of the total arable land, 23% exists out of bunds and channels surrounding the fields. One small pond, 170 m2 on average, is kept as fingerling nursery. The remaining area is used for rice. Fish cultures consist of Common Carp (Cyprinus carpio ), Silver Carp ( Hypophthalmichtys molitrix ), Silver Barb ( Puntius genionotus ), Rohu ( Labco rohota ) and Nile tilapia ( Oreochromis niloticus ).
Rice-rice+fish+fruit tree system In this system, 39% of the farm area is used for bunds and channels. Fruit trees such as mango, orange, mandarin and banana are planted on the bunds around the rice fields. The rice cropping calendar is similar to the R-R+F system. Fish polyculture is also practised.
Fish+fruit tree system The fruit tree gardens are usually situated in the lower landscape. To establish gardens, farmers raise the beds by constructing channels comprising about 30% of the total farm area. Fruit trees are planted on the raised beds that are 6-9 m wide and 0.6-1.0 m high depending on the water level. The most common fruit trees in this system are oranges, mandarin, and sapodilla plum. Fishes are raised in the channels to take full advantage of the gardens, providing a favourable environment for fish culture.
Benefits Gross returns from the executed farming systems ranged from $1,258 to $1,657 ha-1 (Lai & Turn, 1997). However, because these systems involved increased cash expenditures on material inputs such as fertilizers and insecticides, the gross value added (or the total value of output less the cost of purchased inputs) was less than $2,000 ha-1.
Summary The Mekong Delta is characterized by: (a) a small farm size and relatively high man-land ratio, (b) a general lack of power (electrical and mechanical), (c) a low level of cash capital,

124
(d) a low level of infrastructure, and (e) rapidly increasing population in agriculture. The implication of these characterizations is that, farming systems Research &
Development in the Mekong Delta must take into account the constraints imposed by: (a) lack of power for agro-processing and (b) cash scarcity, particularly for low resource farmers. Research emphasis should be tailored toward developing technology that matches the farmers’ limited resources.
Rice is the region’s most important crop occupying 62.6% of total sown area; upland food grain crops are second with 11%. Other significant crops in terms of area are maize, vegetables and fruit trees.
Integrated crop-fish-fruit tree farming systems have shown promising in increasing the gross value added per hectare. However, GVA per hectare in these production systems will not make Vietnam a ‘Tiger’.
Future needs of land use planning research There are many unresolved questions involving the relationship between agricultural development and the policy environment needed to make it effective. The problem in defining the relationship is partly due to our lack of understanding of household decision-making, especially in an environment still under the inertia of the command system but fast changing into a free market economy.
The main difficulty in understanding decision-making in agriculture is that farmers face remarkably diverse ecological and economic settings. State farms and private farms, despite differences in scale of operation and location, make the same decisions on how to make use of their agricultural resources. The decision-making process is made more complicated by risk and uncertainty. A better understanding of the decision-making process among farmers on their use of agricultural resources would be useful.
References Lai, N.X. & T.Q. Tuan, 1997. Integrated rice, fish and fruit tree farming system in Can Tho,
Mekong Delta, Vietnam. O Mon Rice 5, 88-95. Roxas, S.K., 1989. Industrialization through agricultural development. Paper prepared for the
Philippine Agricultural Economics and Development Association Annual Conference, Makati City, Philippines, 25 August.
General Statistical Office, 1996. Statistical data of Agriculture, Forestry and Fishery, 1985 – 1995. Statistical Publishing House, Hanoi, 403 pp.
General Statistical Office, 1997. Statistical yearbook 1996. Statistical Publishing House, Hanoi, 334 pp.

Strategy of agricultural development in Can Tho Province for the year 2000
V.V. Luy 1
1 People's Committee of Can Tho Province, Can Tho, Vietnam
Introduction Can Tho Province is located in the centre of the Mekong Delta, Vietnam, with a total area of 2,962 km 2 and a total population of 1,927,887 persons in 1996. The province has seven districts comprising 73 villages, 15 wards (division of local government area) and 6 towns. The province has become the centre of economic development in the Mekong Delta towards agricultural modernization and industrialization.
Agricultural development In 1996-1997, total provincial food production reached 1.8 million tonnes despite many constraints such as pests and diseases, a high flood in 1996 and an unusual strong typhoon in November 1997. Sugarcane area reached 22,400 ha with an average yield of 66 t ha -1 in 1997. Total fruit tree area was 30,800 ha including citrus (14,680 ha), mango (2,950 ha), pineapple (1,350 ha), longan and other crops (1,300 ha). Aquaculture area increased from 8,200 ha in 1995 to 11,400 ha with a total production of about 18,120 tonnes in 1997. Significant progress has been achieved in animal husbandry. Pigs numbered 220,000 in 1997, supplying 21,000 tonnes meat to the market; poultry contributed 3.1 million animals with a total production of 7,000 tonnes meat and 110 million eggs.
In 1996, agriculture and fisheries contributed 98.6 million US$, accounting for 73.2% of total exported value, and even more in 1997, with 152 million US$ or 78.7% of total exported value.
Industrialization The value of industrial production increased with 22% in 1995 - 1996 and with 16.2% in 1996 - 1997. An indication of increasing industrialization is the considerably lower proportion of agriculture in the economy in 1997 (39.7%) as compared to 1995 (still 53.9%).
There are three industrial regions in Can Tho Province. The Tra Noc industrial region has attracted 20 foreign projects with a total investment of 128 million US$. The Nam Hung Phu industrial region is calling for investment. The Vi Thanh industrial region with a total area of 150 ha is specialized in food processing, construction material and machine fabrication.
Development in the commercial sector Total export production in 1995 was 110 million US$ increasing to 197.7 million US$ in 1997. The major products are rice (360,000 tonnes in 1997), fisheries products, fruits, leather goods and clothing materials. Currently, Can Tho Province has good business relationships with 30 countries and economic consortiums.
125 R. Roetter et al. (eds): Exchange of methodologies in land use planning. SysNet Research Paper Series No. 1 (1998), 125-127. IRRI, Los Baños, Philippines.

126
The economy of Can Tho Province developed well between 1991 and 1996, with an annual economic rate of 9.27%. This slightly increased in 1997 with 9.45%. Between 1995 and 1997, the proportion of industry and services in the economy increased from 17.5% to 21.6%, and from 28.7% to 38.7%, respectively. Development in all sectors led to a higher average Gross Domestic Product (GDP) per capita, 473 US$ in 1997 compared to 369 US$ in 1995. At the end of 1997, 39.6% of the households had been supplied with electricity, and 40% with clean water. Transport network has been improved in 70% of the villages and hamlets in the province.
Can Tho Province has the largest port in the Mekong Delta, classified as an international port, with a storage capacity between 1.5 to 2 million tonnes per year. The Tra Noc Airport will be improved to become an international airport in the region.
Objectives of agricultural development until 2000 The economic development of the province continues to be based on agriculture. This strategy means that an optimal use of agricultural land is required to increase yield and quality of agricultural products, especially cereals. The objectives of agricultural development are: - To assure food self-sufficiency - To increase agricultural production value from 4,471 109 to 5,800 109 VND* in 2000, and - To increase the total value of export from 152 million in 1997 to 162 and 182 million US$
The total export value from cereals alone is expected to increase from 111.6 million US$ in 1997 to 121.8 and 143 million US$ in 1998 and 2000, respectively.
Strategies achieving the development objectives Improved water management This activity is given highest priority to support the three major crops, rice, fruit trees and sugarcane. It involves the construction of dikes and pumping systems. Improved water management will allow to expand the rice area from 110,000 ha at present (1997) to 160,000 ha by 2010. At the same time, areas of fruit trees and sugarcane will increase from 30,000 to 38,000 ha, and from 20,000 to 30,000 ha, respectively. Areas of pineapple and aquaculture will be enlarged to 1,500 ha and 10,000 ha, respectively. The expected results of these changes are shown in Table 1.
Improvement of crop varieties This strategy requests a close collaboration between provincial departments, the Can Tho University (CTU) and the Cuu Long Delta Rice Research Institute (CLRRI) for extension of modern production technologies, including promotion of new crop varieties to the farmers. Can Tho Province is also collaborating with the Southern Fruit Research Institute (SOFRI) to produce clean citrus seeds suitable to different agro-climatic conditions.
Strengthening the extension service for agriculture and aquaculture, and plant protection The agricultural extension service of the province will be strengthened by learning and disseminating more information on plant protection, animal husbandry, and Integrated Pest
in 1998 and 2000, respectively.
* 1 US$ 14,000 Vietnamese Dong (October 1998) ~ ~

127
Table 1. Some economic development indicators for 1998 and targets for 2000.
Major products Food (mainly rice, for home consumption) Exported rice Fisheries (incl. aquaculture) Meat Exported meat Duck eggs Exported duck eggs Exported mushroom Fruit Exported fruit Exported duck leather Exported buffalo leather Exported sugarcane
Export value
Units ton ton ton ton ton
106 eggs 106 eggs
ton 1000 ton 1000 ton
ton ton ton
106 US$
1998 1,900,000
400,000 4,000
30,000
117 60
6,000 170
2,500 1,400
162
2000 2,000,000
500,000 6,000
41,000 1000
150 60
6,500 250
40 2,700 1,500 8,000
182
Management (IPM) measures. Information on new varieties, cultivation techniques and improved farming systems will be regularly provided to the farmers. Intensive training for extension officers is needed to continuously update their knowledge on technology before transferring it to the farmers.
Incrensed agricultural investments Increased funding for enhancing agricultural production will be made available through agricultural banks and other agencies. Farmers will be able to get credit for improving production systems with simpler procedures. Priority will be given to encourage foreign investments in developing rural economy and providing job opportunities.
-
-


Land use planning in Can Tho Province (Vietnam) for the year 2010
N.T. Chuc 1
1 Department of Planning and Investment of Can Tho Province, Can Tho, Vietnam
Framework for natural land use planning Can Tho Province has a total area of 296,284 ha (Table 1). There are many potential land use types arising from different land and water conditions with many micro-ecological niches. In this case, therefore, planning for the best land use in the province is a complicated exercise. The first step in determining priorities is to examine the major cropping systems and other non-agricultural activities with respect to land use, human resources, farm size and landholding patterns.
Provincial land use patterns Total agricultural land in Can Tho is over 250,000 ha or 84.4% of the total area. Rice, the most important crop in the province, accounts for 63% of the total area (Table 1). Double rice cropping is the most popular (34%), followed closely by the rapidly increasing triple rice cropping (23.5%). Rice is also grown in rotation with upland crops. Rice cropping intensity is about 224%, or 2.24 crops per year on average.
With occupying 43,009 ha (14.5%, perennial crops are the second important land use type. The rest of the area is devoted to a wide variety of other uses: aquaculture (0.1%), forest (0.9%), special uses as construction (5.2%), residential (2.9%) and currently unused land (6.5%). The overall land use intensity (2.03 crops per year) in the province is relatively high, as compared to other provinces in Vietnam.
Human resources and farm size Can Tho had a total population of 1.89 million people in 1996. Over 80% of the population is classified as rural (Table 2). The average size of the rural household in Can Tho is 6.0 persons, which is slightly less than the national average of 6.2 persons. On average 49% of the total population is engaged in agriculture. The remaining group (51%) is too old or employed in off-farm activities such as trading, construction, and public services. The relative scarcity of land area available per worker has resulted in intensive cultivation the province.
Household-landholding patterns It is estimated that by 2010, there will be 472,500 households in the province or an increase of almost 50% since 1996. The average household-landholding ratio in the province in 1996 was 0.94 ha or 0.15 ha per person. Because of an increasing population, the average landholding per household is predicted to decrease by 33.3% to 0.62 ha by 2010. Average farm size by 2010 is also expected to decrease to only ca 0.5 ha. In contrast, residential land per household, in both rural and urban areas, is expected to increase slightly by 7.7 and 16.0%, respectively.
129 R. Roetter et al. (eds): Exchange of methodologies in land use planning. SysNet Research Paper Series No. 1 (1998), 129-133. IRRI, Los Baños, Philippines.

130
Table 1. Land use in 1996 and planned for 2010, Can Tho Province. Source: Land use planning, 1997.
Items
Total area Arable land
Annual crop land Rice Triple rice Double rice Double rice + Upland crop Single rice + 2 Upland crops Single rice + Upland crop Upland industrial
Perennial crops Fruit trees Other perennial
Aquaculture area Forest land
Land for special use Construction Transportation Water management Historic and cultural National defence Burial grounds Others
Urban resident land Rural resident land Unused land
1996 2010 Area Total area
(ha) (%) 296,286 100.0
250,212 84.4
206,991 69.9
186,764 63.0 69,712 23.5
100,791 34.0 1,955 0.7
950 0.3 8,200 2.8
20,227 6.8 43,009 14.5 30,369 10.2 11,264 3.8
212 0.1 2,730 0.9
15,510 5.2 779 0.3
3,157 1.1 9,368 3.2
5 0.0 944 0.3 619 0.2 638 0.2
1,112 0.4 7,472 2.5
19,248 6.5
Area
(ha) 296,286
243,998 205,420 173,386 50,000
103,387 9,500 1,000 9,500
32,033 38,366 38,000
366 212
3,111 24,763
3512 7,957
11,430 22
510 719 618
3,473 9,935
10,995
Total area
(%) 100.0
82.4 69.3 58.5 16.9 34.9 3.2 0.3 3.2
10.8 12.9 12.8 0.1 0.1 1.0 8.4 1.2 2.7 3.9 0.0 0.2 0.2 0.2 1.2 3.4 3.7
% increase or (decrease) 1996-2010
0.0
(2.5) (0.8)
(7.2) (28.3)
2.6 385.9
5.3 15.9 58.4
(10.8) 25.1
(96.8) 0.0
14.0 59.7
350.8 152.0 22.0
340.0 (46.0)
16.2
(3.1) 212.3
33.0 (42.9)
Objectives of agricultural development in Can Tho up to 2010 Industrialization and modernization of agriculture and rural areas is the principal strategy in Can Tho's economic development programme. This strategy focuses on the following objectives: - To increase land use efficiency by improving crop yields and animal husbandry - To improve the living standards of the rural population - To reduce underemployment of farm labourers - To increase agricultural production of both staple and non-traditional crops - To increase exports and competitiveness in both domestic and international markets - To strengthen cooperatives in rural areas, and - To protect the environment.

131
Table 2. Human resources and average landholding per household, 1996 - 2010.
Items
Total area (ha) Arable area (ha) Urban resident land area (ha) Rural resident land area (ha) Human resources
Population (people) Urban Rural
Number of households Urban Rural
Average household size (persons) Urban Rural
Average area per household (m 2 ) Total Arable land Rural resident land Urban resident land
Total Arable land Rural resident land Urban resident land
Average area per capita (m 2 )
1996
296,286 250,212
1,112 7,472
1,892,000 368,600
1,523,400 315,333
61,433 253,900
6.00 6.00 6.00
9,400 7,948
300 181
1,566 1,322
50 30
2010
296,286 243,998
3,473 9,985
2,362,200 862,950
1,535,200 472,500 165,500 307,000
5.00 5.21 5.00
6,270 5,163
323 210
1,254 1,033
65 42
% increase or (decrease)
0.0
(2.5) 212.3
33.6
24.9 134.1
0.8 49.8
169.4 20.9
(16.7) (13.2) (16.7)
(33.3) (35.0)
7.7 16.0
(19.9) (21.9)
30.0 40.0
The scarcity of land and the population pressure has led to increasing demands on agriculture to support industry. Enlarging farm size for mechanization is very difficult. Farm sizes become even smaller if land consolidation is not implemented.
Land use and agricultural development The objectives of agricultural development, i.e. improvement of land use efficiency and environmental protection are achieved through the expansion of perennial crops and the, enlargement of green cover surrounding cities, towns and wards. Farmers are encouraged to apply rice varieties resistant to pests and diseases, practise sustainable cropping systems, reduce mono-cropping rice pattern, apply Integrated Pest Management (IPM) techniques to reduce chemical pesticides, improve water management, reclaim acid sulphate and saline soils, and protect fishery resources for long-term exploitation. In addition, the transfer of agricultural innovations to farmers will be given greater attention.
The targets of the land use plan are shown in the last column of Table 1. Because triple rice is considered unsustainable, from 1996 to 2010 the area of this cropping system will reduce

132
Items
Increased value in agricultural land Total agricultural production value
Cultivation Animal husbandry Forestry Aquaculture
Average production value ha-1 year-1
Average income ha-1 year-1
Major products Cultivation
Rice Maize Green gram Grams (beans) of all kinds
Table 3. Anticipated increases in output values between 1996 and 2010.
Unit 1996 2010 % increase or (decrease)
10 9 VND* 2,152 3,680 71.0 10 9 VND 4,754 8,480 78.4 10 9 VND 4,249 6,648 56.4 1 0 9 VND 310 1,196 285.9 10 9 VND 29 38 32.9 10 9 VND 166 598 259.9
10 6 VND 8 13.65 79.5 10 6 VND 19 34.12 79.5
Soybean Vegetables Watermelon Sugarcane Citrus Mango Longan Pineapple Durian Sapodilla Other fruit trees
Animal husbandry Meat Eggs
Aquaculture Fish Shrimp Cuttle fish (squid)
Other fresh water / sea products * Vietnamese Dong; 1 US$= 14,000 Dong (October 1998)
ton ton ton ton ton ton ton ton ton ton ton ton ton ton ton
1,802,887 3,623 3,084
402 974
39,245 4,197
1,638,866 147,142
6,404 25,367 12,654
42,132
ton 106 eggs
ton ton ton ton ton
21,182 101
17,984 16,792
284 168 740
2,050,000 15,000 6,000 3,000 4,500
165,000 30,000
2,115,000 800,000
40,500 150,000 75,000 22,500 12,800 54,000
13.7 314.0
94.6 646.3 362.0 320.4 614.8
29.1 443.7 532.4 491.3 492.7
28.2
122,860 480.0 222.3 120.4
56,000 211.4 50,000 197.8
3000 956.3 1,000 495.2 2,000 170.3
from 23.5 to 16.9% of the total area, equivalent to a decrease of 28% decrease. The area of double-cropped rice will slightly increase by 2.6%. The fruit tree area will increase to 38,000 ha (11%) while forested land will increase by a mere one percent. In total, agricultural area will decrease by 2.5% as a result of shifting to non-agricultural uses; the most important part is used for construction, transportation and water control. Urban area will be tripled from

133
1996 to 2010, up to 3,473 ha. Area of land currently unused will decrease by 43% during that period.
Economic benefits Table 3 shows the anticipated increases in economic benefits from land use. The main source of economic benefits will remain crop cultivation that yields 6,648 billion VND in 2010, equivalent to an increase of 56.4% from 1996. The highest increase is expected from animal husbandry (286%), contributing 1,196 billion VND. Aquaculture is also expected to increase by 260%, up to 598 billion VND. Forestry will remain a minor contribution to the economy. Net income from land use per hectare increases from 8 to 13.6 million VND, or 80%.
In terms of tonnage contribution, sugarcane and rice will continue to be the two most important products with total yields of 2.11 and 2.05 109 tonnes, respectively. However, the highest increase will be from upland crops, such as grams, watermelons and fruit trees (mango, citrus and longan). Production of shrimps and cuttle fish is expected to increase up to 3,000 t (956%) and 1,000 t (495%), respectively.
The social benefit of land use will be the reduction of unemployment in the province. Diversification in agriculture will require 14.5 - 15 million labour-days from about 100,000 farmers.
Reference Land use planning, 1997. Land Administration Department of Can Tho Province, Can Tho,
Vietnam, 141 pp. (in Vietnamese)


Workshop: General discussion and Summary


General discussion, Workshop summary and Closing remarks
R. Roetter1, T.P. Tuong1, M.K. Van Ittersum2, P.K. Aggarwa1 3 , LA. Bakar4, A. Tawang4, N.X. Lai1, S.R. Francisco6, F.P. Lansigd, N.V. Luat5 and H.H. Van Laar 2
1 International Rice Research Institute, P.O. Box 3127, MCPO, 1271 Makati City, Philippines
2 Theoretical Production Ecology, Wageningen University and Research Centre,
3 Indian Agricultural Research Institute (IARI), New Delhi-110012, India 4 Malaysian Agricultural Research and Development Institute (MARDI), P.O. Box 12301,
5 Cuu Long Delta Rice Research Institute (CLRRI), O Mon, Can Tho, Vietnam 6 Philippine Rice Research Institute (PhilRice), 3119 Munoz, Nueva Ecija, Philippines 7 Institute of Statistics, UPLB, College, Laguna, Philippines
Objectives of the General discussion Groups were formed to discuss questions on the four major topics on Methodologies in Land Use Planning: Group A Resource Balancing and Land Unit delineation Keywords: - Scale issues: Agro-ecological units — land units — farm — region
E-mail: [email protected]
P.O. Box 430,6700 AK Wageningen, The Netherlands
50774 Kuala Lumpur, Malaysia
- Farms within region - Interaction among land use types
Animators: I.A. Baku, V.P. Singh, T.P. Tuong
Group B Input-Output including Yield Estimation Keywords: - Quantifying and identifying input-output relationships
(actual versus alternative; annual versus perennial crops) - Different information and data sources: how to weigh differences in data quality - Need for sensitivity analyses
Animators: P.K. Aggarwal, R. Roettet, D.M. Jansen
Group C Optimization Model Keywords: - Including translation of policy views into scenarios
- Questions on technical aspects of formulation of objectives functions - Conceptual aspects on how to develop a Land Use Planning and Analysis
- Making case-studies more future-oriented System (LUPAS)
Animators: S.R. Francisco, C.T. Hod, M.K. Van Ittersum
Group D Stakeholder Conflicts and LUP Process Keywords: - How to apply the methodology, what can you do with it and what not
137 R. Roetter et al. (eds): Exchange of methodologies in land use planning. SysNet Research Paper Series No. 1 (1998), 137-143. IRRI, Los Baños, Philippines.
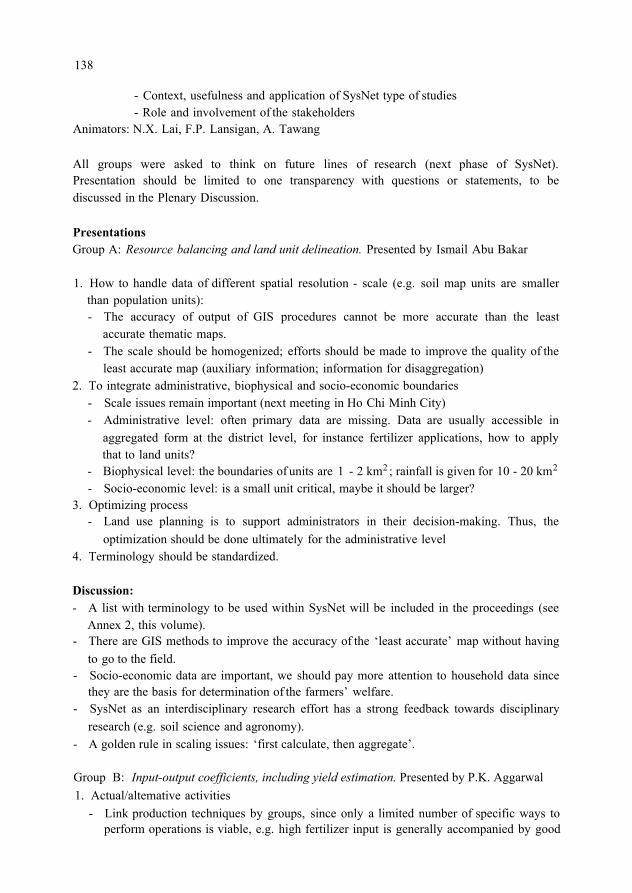
138
- Context, usefulness and application of SysNet type of studies - Role and involvement of the stakeholders
Animators: N.X. Lai, F.P. Lansigan, A. Tawang
All groups were asked to think on future lines of research (next phase of SysNet). Presentation should be limited to one transparency with questions or statements, to be discussed in the Plenary Discussion.
Presentations Group A: Resource balancing and land unit delineation. Presented by Ismail Abu Bakar
1. How to handle data of different spatial resolution - scale (e.g. soil map units are smaller than population units): - The accuracy of output of GIS procedures cannot be more accurate than the least
accurate thematic maps.
least accurate map (auxiliary information; information for disaggregation) - The scale should be homogenized; efforts should be made to improve the quality of the
2. To integrate administrative, biophysical and socio-economic boundaries - Scale issues remain important (next meeting in Ho Chi Minh City) - Administrative level: often primary data are missing. Data are usually accessible in
aggregated form at the district level, for instance fertilizer applications, how to apply that to land units?
- Biophysical level: the boundaries of units are 1 - 2 km 2 ; rainfall is given for 10 - 20 km 2
- Socio-economic level: is a small unit critical, maybe it should be larger?
- Land use planning is to support administrators in their decision-making. Thus, the 3. Optimizing process
optimization should be done ultimately for the administrative level 4. Terminology should be standardized.
Discussion: - A list with terminology to be used within SysNet will be included in the proceedings (see
- There are GIS methods to improve the accuracy of the ‘least accurate’ map without having
- Socio-economic data are important, we should pay more attention to household data since
- SysNet as an interdisciplinary research effort has a strong feedback towards disciplinary
- A golden rule in scaling issues: ‘first calculate, then aggregate’.
Group B: Input-output coefficients, including yield estimation. Presented by P.K. Aggarwal 1. Actual/altemative activities
Annex 2, this volume).
to go to the field.
they are the basis for determination of the farmers’ welfare.
research (e.g. soil science and agronomy).
- Link production techniques by groups, since only a limited number of specific ways to perform operations is viable, e.g. high fertilizer input is generally accompanied by good

139
control of weeds and pests. - Describe cropping systems, not just crops (there is much interaction between crops) - Make assumptions explicit about time and land qualities - Within the group there were different opinions whether to separate or not model runs for
actual and future alternative production activities. 2. Source of information input-output tables
- Uniformity in approach needed (e.g. avoid surveys for potential production situation as
- Target is to determine potential yields by crop growth simulation models - Standard calculation rules for water and nutrient balances
much as possible)
3. Annual versus perennial crops - Same time frame for all activities; e.g. by calculating the net present value at the first
year, Economic and environmental indicators could be calculated with different rates of depreciation.
4. Sensitivity analysis/uncertainty - Selective sensitivity analysis for LP model as a whole (this will be an enormous job,
focus on those parameters with strongest effects on land use allocation) 5. Scaling
6. Automation of relating land qualities to input-output relations is desirable.
Discussion: - Agree that we should simulate cropping systems not just crops. But we need a
methodology and simulation models for ‘cropping systems’, while at the moment we have models for single crops. What to do?
- Scaling to be based on output data rather than on input data
- We also need crop parameters for local varieties. - If we do not have enough infomation we have to rely on ‘expert knowledge’, especially on
farmers knowledge. We have to appreciate actual knowledge. - SysNet is a Network to develop methodologies based on systems approaches, within the
remaining period available or accessible knowledge should as far as possible be integrated in formal crop simulation models. Results of these models have to be compared with alternative approaches, e.g. expert knowledge.
Group C: Optimization model. Presented by M.K. Van Ittersum 1. Technical aspects
- Windows-based XPRESS-MP software is appreciated - Reveal trade-offs, rather than presenting differences in overall results among a few
- Transfer of methodologies to planning agencies requires in order of priority 1. training scenarios
in interpretation of the results; 2. user-friendliness of tools 2. Policy views, objectives, scenarios
- Relationship policy views - resources (are the targets possible concerning the resources?)
- Evaluate policy views and give feedback to key stakeholders in the region

140
- Equity (include objectives that deal with equity: employment, income) Maximize employment in the sub-region with the lowest employment Gini coefficient
3. Future-oriented - Production orientations (most teams work on short-term orientations 2000-2010) - Constraints and scenarios for food production should be more future-oriented than in
current SysNet models; try to keep the scenarios as open as possible.
Discussion: Optimization models cannot be validated! What can be validated are the components of the optimization model. - Could you validate the model if you go back in time and try to simulate the current
Response: This is not possible for two reasons: 1. Many factors that determine the current situation cannot be included in the model. 2. The model optimizes while actual situations are never optimal.
- Though we cannot ‘validate’ the optimization models, we should look at the sturdiness of the model, perhaps we should look at ‘near optimum solutions’? We can do that with input-output of activities, for instance, by estimating lower and upper boundaries of technical coefficients for the ‘important’ activities chosen by the model, and check whether the model still gives the same output.
situation?
Group D: Stakeholders conflicts. Presented by A. Tawang
Conflicts with respect to: Objectives
Decision level
Different development plan
Malaysia
little
implementing stage
longer vs short- term
Philippines
little
implementing stage
same
Vietnam
little
implementing stage
same
India
not relevant
strong farmers’ decision
same
Conflicts occur at all stages: Planning Formulation Implementing How to overcome this:
- Core independent moderator needed in stakeholder discussions - Farmers involvements / participatory - Policy transparent - Strengthened coordination among agencies - Policy supported by programmes / action plans.
Test results (robustness of the model) - To incorporate other sectors than only agriculture? - More dynamic, not static - Minimization of risks and uncertainties (risk analysis) - Assessment of results, what indicator to use for Monitoring & Evaluation of changes - Prioritization of objectives/weighing.
141
Discussion: - There are technical possibilities to incorporate the ‘weighing’ or relative importance of
objectives in the model. Scientists should focus on methodology development, and leave the prioritization of objectives itself to the policy makers.
- We need not extend our model to more than agriculture. Agriculture is complex enough, we do not understand all the interactions even in agriculture alone. Keep the model as transparent as possible and use it for the purpose where it’s made for. Use estimates that are not derived from agricultural data as boundary conditions, e.g. to estimate the labour availability for agriculture we use a fraction of total labour force.
- It is also almost impossible to make the model dynamic instead of static. But if the politicians are willing to pay for extra scientific work, it can be done.
Further, many topics came across in the discussions. They can be grouped into four classes of future research: - Disciplinary research for soil scientists, agronomists, including crop growth models. - Transfer of this type of methodology to planning agencies (a project in itself, that requires
- Extend the methodology to other scale levels (national, sub-continental, farm level). - This type of methodology is good for exploration of the options: how to use your resources
in the best way you want to achieve certain objectives? Other questions require different tools, e.g. identification of policy instruments requires another methodology than the exploratory methodology applied in SysNet.
training in usefulness and context).
Workshop summary presented by R. Roetter
The objectives of the workshop were: 1. To report and discuss preliminary results of systems methodology development and
2. To examine and exchange recent research efforts and accomplishments of land use systems
3. To review project progress and amend work plans in order to achieve tangible outputs. 4. To convene the second meeting of the SysNet International Steering Committee for review
applications for land use planning with stakeholders.
analysis methodology among SysNet teams and collaborating research groups.
and endorsement of Year 2 and 3 Workplans and Outputs.
Expected outputs were: 1. Stakeholders sensitized to the relevance of systems approaches to land use planning and
NRM at regional scale and informed about concepts, approaches and different methodologies and techniques.
2. Stimulating exchange and discussion of different methodological approaches among SysNet teams.
3. Case studies presented as a basis for further elaboration and illustration of emerging eco- regional approaches to natural resource management.
4. Amended and endorsed work plans for achieving project goals.

142
What is next? - More concerted efforts on using common biophysical modelling framework
determining potential yields and calculation of water and nutrient balances (documentation and exchange is necessary).
Interactive Process: SysNet teams jointly with stakeholders in another round of workshops scheduled for: January 1999 Haryana, Chandigarh, India February 1999 Can Tho, Vietnam March 1999 Ilocos Norte, Batac, Philippines April 1999 Kedah-Perlis, Alor Setar, Malaysia
with stakeholders.
- Continue with operationalizing the methodology plus quality of components.
- Improved LP model structure and new runs and interpretation of results in close discussion
- Introduce new elements in the IMGLP technique: - Conflicts between different decision levels. - Conflicts from land use allocations that apply at different phases of the development
- Integration of all conflicts in the Decision Support System. pathway.
For more details, see paper of Hoanh et al. ‘Generalizing SysNet Methodology’ (this volume). To extend the methodology to new sites or new scales of integration is beyond the scope of the current project, what we should do in the remaining period of the project is to discuss and perform model application and scenario formulation closely with the stakeholders (Figure 1, steps 6-9 iterations). Steps 1-5 have been accomplished.
Figure 1. SysNet sequence in development of a Land Use Planning and Analysis System (LUPAS).
143
Closing remarks by N.V. Luat
Ladies and gentlemen,
We are concluding the first three days of the ‘SysNet International Workshop on Exchange of Methodologies in Land Use Planning’. The workshop consisted of seven sessions involving presentations on new concepts of land use planning, development of new methodologies and the preliminary results of exploratory land use studies from the four member countries. I’m sure that the members of the SysNet teams gained further knowledge. At the same time, stakeholders have shown great interest in applying these methods in their land use planning.
As an immediate follow-up activity, the provincial leaders of Can Tho, represented by the Vice-chairman, Mr Vo Van Luy, will meet with the Vietnamese SysNet team to develop a work plan for training provincial planners in the SysNet Methodology. I’m sure the level of awareness about SysNet has been increased from the multi-media - radio, TV, and newspapers - coverage of the workshop.
In closing, I would like to thank all the participants who actively engaged in the discussions, the SysNet Project coordinated by IRRI, the Wageningen University and Research Centre, Can Tho officials for their support, the media, and all those who have contributed to the success of this workshop. Thank you.


Annexes


147
Annex 1: Characterization of physical environment and land use in the four study regions*.
CLIMATE Annual rainfall (mm) and distribution
Annual mean temperature (°C) and seasonality
Radiation and seasonality
Adverse weather phenomena/calamities
SOILS AND HYDROLOGY Major soil types/groups
Haryana (India)
300 - 1200 mm
western zone: 300-550 mm
550-1200 mm eastern zone:
85% of rainfall from Jun-Sep annual avg.: 25° 14° in Jan 34° in Jun
annual avg.:
Dec (low):
May (high):
465 cal cm-2 d-1
323 cal cm-2 d-1
627 cal cm-2 d-1
flooding in the central depression
inseptisol; entisol; sandy loam; loam; (some soils are saline and sodic)
Kedah-Perlis (Malaysia)
in the north: 1600 - 2000 mm in the south: 2000 - 2,400 mm
wet season: Oct-Nov
dry season:
annual avg.: 27° min. 21° - 23° max. 32° - 34°
minimal seasonality
Dec-Mar
sunshine hours: mean 6.5 - 7.5
dry season: 8 - 10 hrs
wet season: 5 - 7 hrs
solar radiation (cal cm-2 d-1): ann. avg: 453 Feb-May 477-525 Jun-Sep 430-477 Oct-Jan 334-406 occasionally strong gusts during thunderstorms
marine alluvium; recent/old riverine alluvium; sedentary/residual soil derived from acid-intermediate igneous rocks
soil texture: heavy clay clay loam
(some soils are saline or lateritic)
Ilocos Norte (Philippines)
from west to east: 1700 - 2400 mm (annual total higher in mountainous eastern part) wet season:
Jun-Oct dry season:
Nov-May
generally, northern is cooler and southern is hotter than central part 28.9° in May 24.4° in Jan annual avg.:
dry season:
26.8° - 27.4°
420 cal cm-2d-1
423 cal cm-2 d-1
417 cal cm-2 d-1
wet season:
annual avg. of 6 - 7 typhoons; mostly from Jun - Nov
plains and velley soils: formed mainly from alluvial deposits or sediments laid by water (23 soil types)
upland, hills and mountain soils: derived through weathering of igne- ous rocks, shale, calcareous sandstone and coralline lime- stone (10 soil types)
miscellaneous: dune land, undiffe- rentiated mountain soils, riverwash, rockland, sand and coral bed (6 soil types)
Can Tho (Vietnam)
from east to west: 1500 - 2000 mm
wet season: May-Nov
Dec-Apr dry season:
26.5° - 28.5°
34.7° in May 20.1° in Jan annual avg.:
427 cal cm-2d-1
seasonality data not available
annually 200,000 ha is flooded (0.3 - 1.5 m) for 2 - 3 months
alluvial: Typic Tropaquents Aeric Tropic
Fluvaquents Fluventic Aeric
Tropaquepts Aeric Tropaquents
acid sulphate: Sulfic Fluvaquents Typic Sulfaquepts Sulfic Tropaquepts
saline acid sulphate: Salic Typic
Salic Sulfic Sulfaquents
Tropaquepts
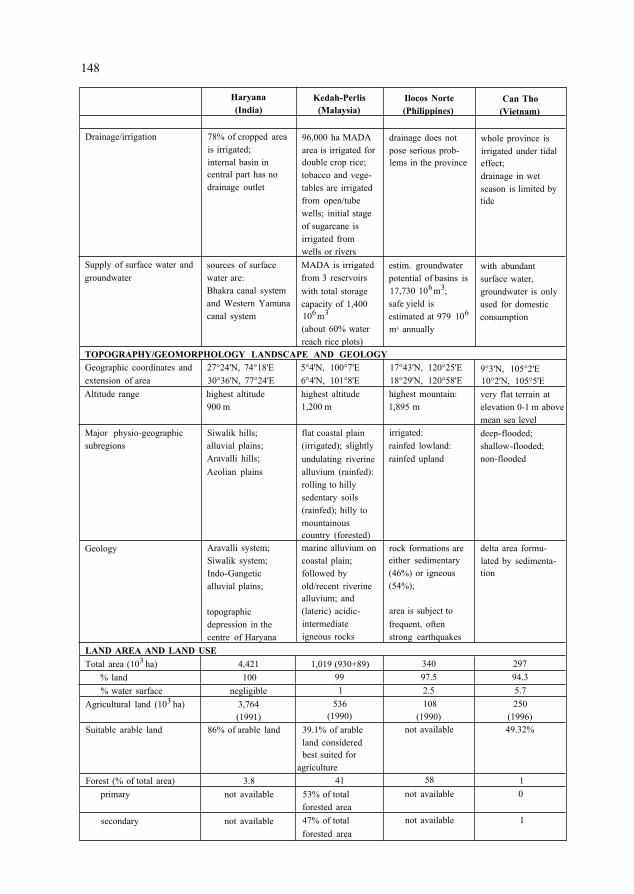
148
Drainage/irrigation
Supply of surface water and groundwater
Haryana (India)
78% of cropped area is irrigated; internal basin in central part has no drainage outlet
sources of surface water are: Bhakra canal system and Western Yamuna canal system
Kedah-Perlis (Malaysia)
96,000 ha MADA area is irrigated for double crop rice; tobacco and vege- tables are irrigated from open/tube wells; initial stage of sugarcane is irrigated from wells or rivers MADA is irrigated from 3 reservoirs with total storage capacity of 1,400 10 6 m 3
(about 60% water reach rice plots)
TOPOGRAPHY/GEOMORPHOLOGY LANDSCAPE AND GEOLOGY Geographic coordinates and 27°24'N, 74°18'E 5°4'N, 100°7'E 17°43'N, 120°25'E extension of area 30°36'N, 77°24'E 6°4'N, 101°8'E 18°29'N, 120°58'E Altitude range highest altitude highest altitude highest mountain:
900 m 1,200 m 1,895 m
Ilocos Norte (Philippines)
drainage does not pose serious prob- lems in the province
estim. groundwater potential of basins is 17,730 10 6 m 3 ; safe yield is estimated at 979 10 6
m3 annually
Major physio-geographic subregions
Geology
Siwalik hills; alluvial plains; Aravalli hills; Aeolian plains
Aravalli system; Siwalik system; Indo-Gangetic alluvial plains;
topographic depression in the centre of Haryana
LAND AREA AND LAND USE Total area (10 3 ha)
% land % water surface
Agricultural land (10 3 ha)
Suitable arable land
Forest (% of total area) primary
secondary
4,421 100
negligible 3,764 (1991)
86% of arable land
3.8 not available
not available
flat coastal plain (irrigated); slightly undulating riverine alluvium (rainfed): rolling to hilly sedentary soils (rainfed); hilly to mountainous country (forested) marine alluvium on coastal plain; followed by old/recent riverine alluvium; and (lateric) acidic- intermediate igneous rocks
1,019 (930+89) 99 1
536 (1990)
39.1% of arable land considered best suited for
agriculture 41
53% of total forested area 47% of total forested area
irrigated: rainfed lowland: rainfed upland
rock formations are either sedimentary (46%) or igneous (54%);
area is subject to frequent, often strong earthquakes
340 97.5 2.5 108
(1990) not available
58 not available
not available
Can Tho (Vietnam)
whole province is irrigated under tidal effect; drainage in wet season is limited by tide
with abundant surface water, groundwater is only used for domestic consumption
9°3'N, 105°2'E 10°2'N, 105°5'E very flat terrain at elevation 0-1 m above mean sea level deep-flooded; shallow-flooded; non-flooded
delta area formu- lated by sedimenta- tion
297 94.3 5.7 250
(1996) 49.32%
1 0
1

149
Urban land (% of total area) Main products
Main cropping systems
Indicative cropping calendar
Haryana (India)
2.5 wheat, rice, mustard, pearl millet, cotton, sugarcane, maize, gram, potato
rice - wheat; basmati rice - wheat; summer rice - rice -
wheat; pearl millet - wheat; cotton - wheat; sugarcane - wheat; maize - gram; maize - mustard; rice - mustard; maize - potato -
wheat
kharif: Jul - Sep
summer: Apr - Jun
rubi: Oct - Mar
Kedah-Perlis (Malaysia)
1.2 rubber, rice, oil palm, sugarcane, fruits (mango, durian, rambutan, banana etc.), tobacco, vegetables
Ilocos Norte (Philippines)
3.4 rice, tobacco, garlic, corn, sugarcane, mungbean, peanut, tomato, cotton, po- tato, soybean, onion, pepper, melon, root crops
Can Tho (Vietnam)
0.4 rice, soybean, mung- bean, sugarcane, beans, watermelon, cucumber, petchay, bittergourd, gourd, sweet potato, corn, cabbage, pineapple, fruit
rice - rice; rice - corn; rice - rice; rice - tobacco; rice - garlic; rice - rice - rice; rice - vegetables; rice - mungbean; rice - soybean - rice; rice - fallow; tobacco - fallow; rice - tomato;
rice - peanut; rice - mungbean -
tobacco - leafy; rice - tobacco; leafy - trellis - leafy; rice - fallow;
sugarcane + bean; rice - transpl. rice** -
vegetables; rice - rice; soybean; chilli - fallow; rice - cotton; rice - watermelon - durian; rice - potato; rice; mango; rice - soybean; rice - rice + fish; rubber; rice - onion; cucumber - cucumber oil palm; rice - pepper; petchay - cucumber - oil palm with cattle; forage; cucumber; sugarcane rice - vegetables; bittergourd - gourd; star fruit corn; mungbean; rice - sweet potato - banana mango; sugarcane; rice;
rice;
root crops; rice - corn - rice; rice - rice - rice; cabbage - petchay - rice - garlic - rice;
mungbean; rice - corn -
sugarcane; sugarcane - rice;
mungbean; pineapple; rice - melon fruit
double rice: high-yielditag rice winter-spring: Jan/Feb - Jun/Jul variety: Nov - Feb Jul/Aug - Nov/Dec 1 st Jun - Sep
single rice: 3 rd Feb - May Feb - May Aug - Dec
2 nd Oct - Jan spring-summer:
traditiod variety: summer-autumn: tobacco: 1 st Jun - Oct May - Sep Dec/Jan - Apr/May 2 nd Nov - May
Sources: SysNet, 1998; Roetter et al., 1998; Agarwal & Roest, 1996; Bureau of Soils, 1985a, b; SysNet teams; Climate Unit, IRRI. transplanted deepwater rice (traditional variety). **
References Agarwal, M.C. & C.J.W. Roest (Eds), 1996. Towards improved water management in Haryana State: Final report of the
Indo-Dutch operational research project on hydrological studies. Chaudary Charan Singh Haryana Agricultural University, Hisar, Haryana, India (CCHAU), Int. Inst. for Land Reclamation and Improvement (ILRI), DLO-Winand Staring Centre for Integrated Land, Soil, and Water Research (SC-DLO), Wageningen, The Netherlands, 80 pp.
Bureau of Soils, 1985a. Physical land resources: Province of Ilocos Norte, Land resources evaluation project (LREP), Vol. 1, Metro Manila, Philippines, 258 pp.
Bureau of Soils, 1985b. Agro-socio economics and land evaluation: Province of Ilocos Norte, Land resources evaluation project (LREP), Vol. 2, Metro Manila, Philippines, 146 pp.
Roetter. R., C.T. Hoanh & P.S. leng, 1998. A systems approach to analyzing land use options for sustainable rural development in South and Southeast Asia. IRRI Discussion Paper Series No 28, International Rice Research Institute, Los Baños, Philippines, 110 pp.
SysNet, 1998. Fourth six-monthly Progress Report. International Rice Research Institute, Los Baños, Philippines, 44 pp.
*

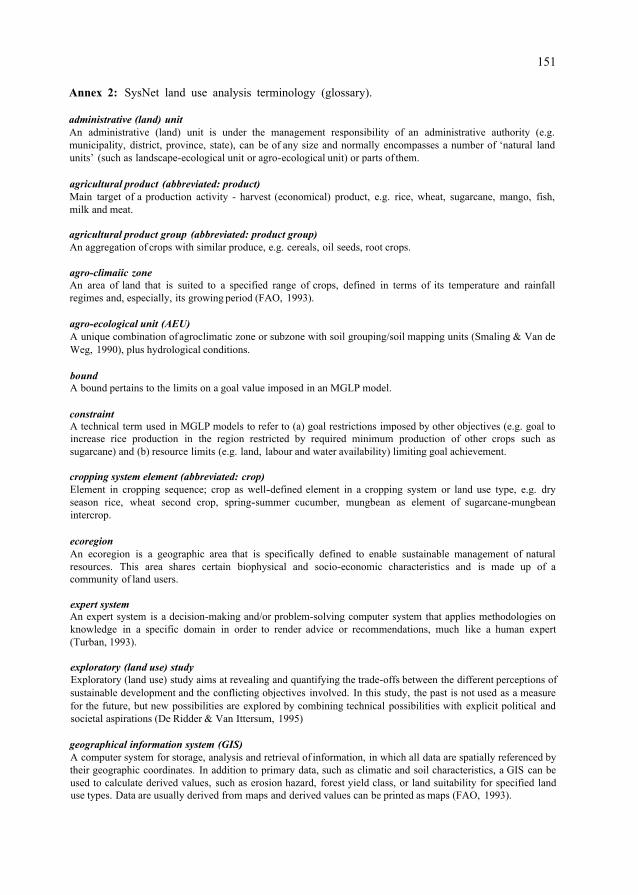
151
Annex 2: SysNet land use analysis terminology (glossary).
administrative (land) unit An administrative (land) unit is under the management responsibility of an administrative authority (e.g. municipality, district, province, state), can be of any size and normally encompasses a number of ‘natural land units’ (such as landscape-ecological unit or agro-ecological unit) or parts of them.
agricultural product (abbreviated: product) Main target of a production activity - harvest (economical) product, e.g. rice, wheat, sugarcane, mango, fish, milk and meat.
agricultural product group (abbreviated: product group) An aggregation of crops with similar produce, e.g. cereals, oil seeds, root crops.
agro-climaiic zone An area of land that is suited to a specified range of crops, defined in terms of its temperature and rainfall regimes and, especially, its growing period (FAO, 1993).
agro-ecological unit (AEU) A unique combination of agroclimatic zone or subzone with soil grouping/soil mapping units (Smaling & Van de Weg, 1990), plus hydrological conditions.
bound A bound pertains to the limits on a goal value imposed in an MGLP model.
constraint A technical term used in MGLP models to refer to (a) goal restrictions imposed by other objectives (e.g. goal to increase rice production in the region restricted by required minimum production of other crops such as sugarcane) and (b) resource limits (e.g. land, labour and water availability) limiting goal achievement.
cropping system element (abbreviated: crop) Element in cropping sequence; crop as well-defined element in a cropping system or land use type, e.g. dry season rice, wheat second crop, spring-summer cucumber, mungbean as element of sugarcane-mungbean intercrop.
ecoregion An ecoregion is a geographic area that is specifically defined to enable sustainable management of natural resources. This area shares certain biophysical and socio-economic characteristics and is made up of a community of land users.
expert system An expert system is a decision-making and/or problem-solving computer system that applies methodologies on knowledge in a specific domain in order to render advice or recommendations, much like a human expert (Turban, 1993).
exploratory (land use) study Exploratory (land use) study aims at revealing and quantifying the trade-offs between the different perceptions of sustainable development and the conflicting objectives involved. In this study, the past is not used as a measure for the future, but new possibilities are explored by combining technical possibilities with explicit political and societal aspirations (De Ridder & Van Ittersum, 1995)
geographical information system (GIS) A computer system for storage, analysis and retrieval of information, in which all data are spatially referenced by their geographic coordinates. In addition to primary data, such as climatic and soil characteristics, a GIS can be used to calculate derived values, such as erosion hazard, forest yield class, or land suitability for specified land use types. Data are usually derived from maps and derived values can be printed as maps (FAO, 1993).

152
goal It is one of the major objectives of a land use plan, defined in generalized terms, often those of policy (FAO, 1993). AS tm example: ‘In a farm planning problem, gross margin is an attribute; to optimize gross margin, an objective; and to achieve a gross margin of at least a certain target, a goal’ (Romero & Rehman, 1989).
goal restriction Goal restrictions are imposed by other objectives, e.g. goal to increase rice production in the region restricted by required minimum production of other crops such as sugarcane. Same as (a) under constraint.
goal variable A goal variable is one constituent for expressing an objective in a land-use plan; in the objective ‘maximize rice production’ rice production is the goal variable (see, objective and objective function).
land An area of the earth’s surface, including all elements of the physical and biological environment that influence land use. Thus, land refers not only to soil but also to landforms, climate, hydrology, vegetation and fauna, together with land improvement such as terraces and drainage works (FAO, 1993).
land characteristic An attribute of land that can be measured or estimated, for example slope angle, soil depth or mean annual rainfall (FAO, 1993).
land management unit An area of land that is a unique combination of agro-ecological, administrative, and socio-economic land units.
land quality A complex attribute of land which affects its suitability for specific uses in a distinct way. For example, the land quality ‘availability of water’ directly affects crop yields and, therefore, land suitability for different crops. Most land qualities can only be assessed by modelling the interaction of a number of land characteristics. For example, availability of water is modelled from data on rainfall, available water capacity of the soil, potential evapo-transpiration (FAO, 1993).
land use planning The systematic assessment of land and water potential, alternative patterns of land use and other physical, social and economic conditions, for the purpose of selecting and adopting land use options which are most beneficial to land users without degrading the resources or the environment, together with the selection of measures most likely to encourage such land uses (FAO, 1993).
land unit (LU) An area of land which possesses specific land characteristics and land qualities and which can be mapped (FAO, 1993). - In SysNet, it is a unique combination of subregion and agro-ecological unit, currently, smallest calculation
unit for which input-output relationships for the various production activities are quantified. At current level of detail in SysNet case studies, land unit is identical with land management unit.
land use type (LUT) It is a cropping system/livestock production system, or a combination of both, e.g. double rice (winter-spring and summer autumn), rice-fallow, cotton-wheat, fruit, rice-rice+fish. In general, this term is also used for built-up areas, forestry, etc. by FAO (1993).
multiple goal linear programming model (MGLP) A model for exploring land use options under different policy views that uses the technique of optimizing (by using linear programming) an objective while considering a set of constraints. The different (often conflicting) development objectives are taken into account in the optimization process.
objective An objective is a specific aim, expressing something to be achieved as part of the goals of a land use plan (FAO, 1993). In MGLP models, it is expressed by the goal variable and the associated optimization (e.g. maximize rice production, maximize income, minimize fertilizer use, also refer to example in goal definition).

153
objective function The objective function is a technical term for a linear equation formulated by specifying the coefficients of the decision variable(s) for achieving the goal (XPRESS-MP, 1997), e.g.:
Rice Production :
where, is the coefficient is the decision variable.
production activity A production activity is defined as cultivation of a crop or crop rotation in a particular physical environment, completely specified by its inputs and outputs. The inputs and outputs are fully determined by the production technique and the physical environment (Van Ittersum & Rabbinge, 1997).
production orientation Aims and restrictions, that direct the choice of production techniques in particular physical environments, may include a high land productivity (thus a high production level), a high financial return, high resource-use efficiencies (high input-output ratios), low emissions per unit product, low emissions per unit area and no use of chemical inputs (fertilizer and pesticides) (Van Ittersum & Rabbinge, 1997).
production technique The inputs and the way they are applied characterize the production technique. Because some inputs may be mutually substitutable (e.g. labour, mechanization or pesticides), a particular production level in a certain physical environment may be realized with various production techniques (Van Ittersum & Rabbinge, 1997).
regional agricultural development authority A government agency responsible for planning, management and development of a specific region which need not to be an administrative unit.
resource limit The resource limit is one type of constraint to achieving goal(s) and objectives; e.g., land, water availability, and available labour force.
socio-economic unit An area governed by a similar set of socio-economic conditions.
soil unit A unit based on soil physical/chemical/biological or a combination of these characteristics that can be mapped.
stakeholder The FAO defines stakeholder (or interested parties) as: ‘individuals, communities or governments that have a traditional, current or future right to co-decide on the use of the land’ (FAO, 1995).
subregions (SubR) Subregions are distinguished based on decision structure within the target region; decentralization level of decisions on land use and management of natural resources are crucial. - In Sys Net, subregions are delineated by administrative boundaries (district, municipality).
References De Ridder, N. & M.K. Van Ittersum, 1995. Quantitative analysis of ago-ecosystems at higher integration levels (QUASI).
FAO, 1993. Guidelines for land-use planning. FAO Development Series 1, Rome, Italy, 96 pp. FAO, 1995. Planning for sustainable use of land resources. Towards a new approach. Background paper to FAO’s Task
membership for Chapter 10 of the Agenda 21 of the United Nations Conference on Environment (UNCED). FAO Land and Water Bulletin 2. FAO, Rome, Italy, 60 pp.
Quantitave analysis of agro-ecosystems at higher integration levels (QUASI), 1998. Glossary at website: http://www.wau.nl/beng/quasi/test.htm. Crop Science Department, Wageningen University, The Netherlands.
Romero, C. & T. Rehman, 1989. Multiple-criteria analysis for agricultural decisions. Elsevier, Amsterdam, The Netherlands,
Wageningen Agricultural University, The Netherlands.

154
257 pp.
trials in Kenya. Agriculture, Ecosystems and Environment 31, 263-274.
Company, New York, 833 pp + Appendices.
input-output combinations. Field Crops Research 52(3), 197-208.
3BX, UK, 290 pp.
Smaling, E.M.A. & R.F. Van de Weg, 1990. Using soil and climate maps and associated data sets to select sites for fertilizer
Turban, E., 1993. Decision support and expert systems: management support systems. Third edition. Macmillan Publishing
Van Ittersum, M.K. & R. Rabbinge, 1997. Concepts in production ecology for analysis and quantification of agricultural
XPRESS-MP, 1997. User guide and reference manual. Dash Associates Ltd. Blisworh House, Blisworth, Northants NN7