Embed Size (px)
Citation preview
Synthetic low and high fat diets for the study of atherosclerosis in the mouse
Patsy M. Nishina', Judy Verstuyft, and Beverly Paigen"
Children's Hospital Oakland Research Institute, Children's Hospital Medical Center, 747 52nd Street, Oakland, CA 94609, and The Jackson Laboratory,* Bar Harbor, h4E 04609
Abstract Diets currently used to produce atherosclerotic le- sions in mice are often undefined and cause accumulation of fat in the liver and gallstone formation. Therefore, synthetic low and high fat diets of known composition were formulated in this study. A synthetic diet containing 50 % sucrose, 15 % cocoa butter, 1 % cholesterol, and 0.5% sodium cholate was found to produce a depression in high density lipoprotein cholesterol (HDL-C) and an elevation of very low density lipoprotein (VLDL) and low density lipoprotein cholesterol (LDL-C) in the atherosclerosis-susceptible strain, C57BL/6J. This diet was able to consistently produce aortic lesions and led to a decrease in liver damage and gallstone formation. The synthetic low fat diet did not produce HDL-C levels as high as those found in mice fed chow, but resulted in similar VLDL/LDL-C levels. Lipopro- tein and apolipoprotein parameters were compared in C57BL/ 6J and the atherosclerosis-resistant strain, C3H/HeJ, consuming the synthetic low fat or high fat diets. As reported earlier, when consuming a high fat diet C57BL/6J mice have significantly lower HDL-C and apoA-I levels than C3H/HeJ mice. Further analysis shows that the molar ratio of plasma HDL-C to apoA-I is significantly lower in C57BL/6J mice, suggesting that HDL in the susceptible strain has a lower cholesterol-carrying capacity. This conclusion is consistent with the observation that the HDL particle size is smaller for C57BL/6J mice than for C3H/HeJ. Both strains increased their apoE levels when fed the synthetic high fat diet, but C3H/HeJ mice had higher levels of apoE on both diets. The major response to consumption of the high fat diet for both strains was an increase in apoB-48 from 5 pg/ml on a low fat diet to 54 and 109 pglml for C57BLhJ and C3H/HeJ, respectively. ApoB-100 showed minimal response to the high fat diet. The defined high fat diet can be used to study atherosclerosis in the mouse since it produces aortic le- sions but reduces or eliminates other pathological changes such as gallstone formation and liver damage. -"ishina, P. M., J. Verstuyft, and B. Paigen. Synthetic low and high fat diets for the study of atherosclerosis in the mouse. J. Lipid Res. 1990. 31: 859-869.
Supplementary key words lesterol gallstones lipoprotein particle size
atherogenic diets mouse model cho- profiles apolipoproteins HDL
quently map the genes determining such variants. In this way, we can begin to determine what genes might be in- volved in the development of atherosclerotic lesions. For example, differences observed in the formation of lipid- staining lesions in the aorta and HDL-cholesterol levels in mice in response to high fat feeding has made it possible to identify two genes, Ath-1 and Ath-2, determining sus- ceptibility or resistance to atherosclerosis (1, 3).
Previous studies in this laboratory to identify such genetic factors have relied on the use of nondefined diets (3, 4). Commercial pelleted rat chow, containing 4% fat, served as the low fat diet and a mixture of the Thomas- Hartroft diet and rat breeder chow, served as the athero- genic diet. The Thomas-Hartroft diet contains 30 % cocoa butter, 5 % cholesterol, 2 7% sodium cholate, 30 % casein, 5 % alphacel, 4 70 vitamin mixture, 4% salt mix- ture, 6.5% sucrose, 6.5% dextrose, 6.5% dextrin, and 0.5% choline chloride (5). The breeder chow contains crude protein not less than 17 %, crude fat not less than 11 %, crude fiber not more than 3 '3% , ash not more than 6.5%, and added minerals not more than 2.5%. The chow is made from natural products such as grains, and the exact amount and the source of fat, carbohydrate, and protein is not specified. Thus, the composition from batch to batch can vary markedly (6). Because such differences between batches in the diet could influence experimental results, use of the mouse model for studies of lipoprotein metabolism and atherosclerosis risk requires test diets of defined composition. The goal of this study was to formu- late a diet of known composition that would produce aor- tic lesions in order to further develop the mouse model for examining heart disease and factors that may influence its progression.
Inbred strains of mice are a useful experimental tool to study the etiology and development of atherosclerosis, They offer a system to characterize genetic variants of lipoproteins (1) and apolipoproteins (2) and to subse-
Abbreviations: K, total plasma cholesterol; HDL-C, high density lipoprotein cholesterol; LDL, low density lipoprotein; VLDL, very ]OW density lipoprotein; ALT, plasma alanine aminotransferase; AcCoA, acetyl coA; RID, radial immunodiEusion,
'To whom reprint requests should be addressed.
Journal of Lipid Research Volume 31, 1990 859
by guest, on May 18, 2018
ww
w.jlr.org
Dow
nloaded from
Feeding mice the atherogenic diet described above leads to enlarged livers, engorged with fat, and gallstone formation as early as 3 weeks. An additional goal, there- fore, was to produce a diet that minimized lipid accu- mulation in the liver and gallstone formation. Tepper- man, Caldwell, and Tepperman (7) have shown that the cholesterol and cholic acid in the diet was responsible for these problems. However, earlier studies done in this laboratory (B. Paigen and A. Morrow, unpublished re- sults) have shown that cholesterol and sodium cholate are absolutely necessary for aortic lesion formation in mice. Therefore, manipulation of the atherogenic diet by de- creasing the levels of these two dietary components was done rather than excluding them totally.
Finally, a careful characterization of lipoprotein and apolipoprotein profiles of the susceptible C57BL/6J (B6) and the resistant C3H/HeJ (C3H) strains of mice con- suming the defined diets was carried out in order to better understand factors that may be involved in atherosclerosis risk.
MATERIALS AND METHODS
Materials
The sources of chemicals and reagents were as follows: cholesterol oxidase, bovine pancreas cholesteryl ester hydrolase, peroxidase, plasma alanine aminotransferase assay kit, Sigma Chemicals Go., St. Louis, MO; chemi- cals for gel electrophoresis, Bio-Rad Laboratories, Rich- mond, CA; gradient gels (4-30 % polyacrylamide), Phar- macia, Piscataway, NJ; Oil red 0, Aldrich Chemical Company, Inc., Milwaukee, WI; hematoxylin and light green, Fisher Scientific Go., Dallas, TX and gentamycin sulfate, US Biochemical Gorp., Cleveland, OH. Other chemicals utilized were of reagent grade or better.
All components for the purified diets were purchased from ICN Biochemicals, Inc., Cosa Mesa, CA with the ex- ception of Mazola corn oil (Best Foods, Englewood Cliffs, NJ). Nonpurified commercial breeder chow (#5015) con- taining 10 % fat and laboratory rat chow (#5012) contain- ing 4 % fat were obtained from Ralston Purina, St. Louis, MO. Thomas-Hartroft diet utilized in the control athero- genic diet was purchased from Teklad Test Diets, Madi- son, WI.
Animals
Female B6 and C3H mice, 4-8 weeks old were pur- chased from Jackson Laboratory, Bar Harbor, ME and maintained in a room illuminated from 7 AM through 7 PM. All animals were allowed to adapt to the environ- ment for at least 2 weeks prior to dietary treatment and were provided free access to food and water throughout the experiment. Weight gain was monitored every 3 weeks and food intake one or two times during the period of each study. Prior to any experimental procedure, animals
were fasted overnight (;.e., food removed at 5 PM on the day previous to the experiment).
Diets
In all experiments, components for purified diets were mixed for 45 min, formed into a dough with the addition of double-distilled water, rolled into pellets, and allowed to dry for 1 day in a dehydrator at 29OC and an additional 2 or 3 days in a 37OC room (diets may also be dried for 48 h in a dehydrator at 29°C without the use of a warm room). Diets were stored at - 20°C until use to minimize oxidation. In addition, fresh food was provided to animals weekly. Composition of these diets is given in Tables 1 and 4, and relevant sections of the results. The athero- genic diet currently used in this laboratory (8) served as the basis for comparison of the synthetic high fat diets and is referred to, hereafter, as the control atherogenic diet. A single batch of control atherogenic diet consisting of a mixture of one part Thomas-Hartroft diet and three parts breeder chow was prepared. The final mixture contained 15 % fat, approximately 1.25 % cholesterol, and 0.5 % sodium cholate. The source of the fat contained in chow, which can contain cholesterol, is not specified by the manufacturer; however, if the fat was solely from an ani- mal source the cholesterol content of the diet could only vary up to 1.2514%.
Collection of blood and body tissues
Blood was obtained from the tail vein when a small amount of plasma was needed for analysis and from the brachial artery when the animals were killed. Blood was transferred into chilled tubes containing a mixture of EDTA, sodium azide, and gentamycin sulfate. The final concentration of these components were 2 mM, 0.05 mg/ml, and 0.05 mg/ml, respectively. Plasma was ob- tained by centrifugation of the whole blood for 5 min at 12,000 g at 4OC.
Upon killing the animals, the heart and the upper sec- tion of the aorta were removed and placed in 0.9 % saline at room temperature. After 1 h, the heart was trimmed of extraneous tissue and placed in 10% saline-buffered formalin for 24 h at room temperature. Livers were blotted, quickly frozen in liquid nitrogen, and stored at - 70°C for future lipid analysis. Necropsy observations about the stomach, intestine, and gallbladder were re- corded.
Plasma lipids
Total plasma cholesterol (E) was determined by a colorimetric assay based upon the use of o-phthalaldehyde (9). HDL-cholesterol (HDL-C) was measured using the same method after selective precipitation of LDL and VLDL with polyethylene glycol (10). VLDL/LDL-choles- terol (VLDL/LDL-C) was calculated as the difference between TC and HDL-C.
860 Journal of Lipid Research Volume 31, 1990
by guest, on May 18, 2018
ww
w.jlr.org
Dow
nloaded from
Agarose gel electrophoresis of mouse plasma was car- ried out according to the method of Noble et al. (11) with modifications described by Paigen et al. (4). Two distinct bands were visualized by Sudan black staining of neutral lipids. One band represented the apolipoprotein B-con- taining particles (VLDL and LDL) and the second con- tained the HDL particles. Standards used to evaluate the cholesterol content of the bands consisted of pooled plasma samples obtained from B6 mice that were ana- lyzed for TC and HDL-C as described above. Plasma from mice fed chow was used as the standard for HDL-C. However, so little VLDL/LDL-C is present in the plasma of chow-fed mice that plasma from mice fed the control atherogenic diet was used as a standard for VLDLILDL- C. The single exception was the first experiment, which used only plasma from chow-fed animals; thus, for this experiment, depicted in Table 2, the VLDL/LDL band was expressed in relative units as area under the curve.
Liver lipids and plasma alanine aminotransferase activity
Lipids were extracted from livers by the method of Folch, Lees, and Sloane Stanley (12) and assayed for triglyceride (13), cholesterol (14), and phosphorus (15). Phosphorus values were multiplied by a factor of 25 to es- timate liver phospholipid content based on the assump- tion that phospholipids contain approximately 4 % phos- phorus. Plasma alanine aminotransferase activity was measured using the Sigma Kit No. DG591K which is based upon a coupled reaction in which NADH is oxidized.
Plasma apolipoproteins
Plasma concentrations of apolipoprotein A-I (apoA-I) and apolipoprotein E (apoE) were estimated by radial im- munodiffusion (RID; 16). Specificity of antisera, raised in New Zealand white rabbits, for RID was tested by Western analysis and subsequent testing against plasma and purified antigen by RID. Anti-mouse apoA-I or anti- mouse apoE sera were immobilized in 1% or 0.5% agarose/TBS (0.02 M Tris-HC1, pH 7.4, 0.15 M NaCl, and 1 mM EDTA) gels, respectively. Prior to loading, plasma samples were solubilized in 10 M urea for apoA-I and 5 % Triton X-100 (final concentration) for apoE. The RID gels were left at 37OC for 24 h in a humidified chamber. The gels were then washed, dried, and stained with Coomassie Brilliant Blue G-250. Purified mouse apoA-I and apoE served as standards. In order to deter- mine changes in the quantity of apolipoprotein B-48 (apoB-48) and B-100 (apoB-loo), whole plasma was pre- treated as described in Ishida and co-workers (17). Briefly, 4 pl plasma, 10 p1 deionized water, 8 pl 10% SDS, and 33 nmol of dithiothreitol were vortexed and allowed to sit at room temperature for 30 min in the dark. Ninety nmol of iodoacetic acid was then added to the sample, vortexed, and allowed to sit for an additional 30 min at room
temperature. One-fifth volume of sample buffer contain- ing 312 mM Tris-HC1 (pH 6.8), 10 % SDS, 25 '% glycerol, 25 % beta-mercaptoethanol, and 0.005 % bromophenol blue was added to the sample mixture and boiled for 30 sec prior to electrophoresis in a discontinuous, 5 % polya- crylamide gel in the presence of SDS (18). Gels were stain- ed with Coomassie G-250, destained, and scanned with a densitometer. A series of dilutions of human apolipopro- tein B-100 included on each gel was used as a standard by which both the apoB-48 and apoB-100 content of the plasma could be estimated. Mouse apoB-100 migrates similarly to human apoB-100 and has the same chromo- genicity when stained with Coomassie Blue. However, the chromogenicity of apoB-48 differs from that of apoB-100. Therefore, the concentrations of apoB-48 can only be viewed as values relative to the apoB-100 standard (B. Y. Ishida, unpublished results).
Nondenaturing gradient gel electrophoresis of HDL particles
Total plasma lipoproteins (d < 1.21 g/ml) were obtained by density ultracentrifugation of plasma (19) and sub- jected to nondenaturing gradient gel electrophoresis as described by Blanche et al. (20). Gels were analyzed by densitometry after staining with Coomassie Blue G-250, and the particle sizes were estimated by comparison to the migration of high molecular weight proteins (Pharmacia) which were included on each gel. The values used for Stokes' diameter for the protein standards were thyroglob- ulin, 17.0 nm; apoferritin, 12.2 nm; lactate dehydrogenase, 8.1 nm; and serum albumin, 7.1 nm.
Evaluation of atherosclerotic lesions
Evaluation of aortic lesions has been described in detail by Paigen et al. (21). Briefly, mouse hearts were fixed, stored in 4 % phosphate-buffered formaldehyde, and embedded in 25 % gelatin. After removing the lower two- thirds of the heart, the remaining tissue was sectioned on a cryostat at - 25OC. Alternate 10-pm sections were saved on slides. Sections were stained with aqueous Oil Red 0 for neutral lipid and hematoxylin for nuclei and baso- philic tissue, and counterstained with light green. Five sections at 80 pm intervals were evaluated for the cross- sectional area of lesions beginning where the aorta was rounded and valves appeared distinctly through to the endpoint where the valves disappeared, a distance of approximately 350 pm.
Statistical analysis Number Cruncher Statistical System, Version 4.21 1/
86, Kaysville, UT was used for statistical analysis. Com- parison of data from more than two groups was analyzed by using one-way analysis of variance with Fisher's least significant difference test to determine which means were
Nishina, Grstuyj, and Paigen Synthetic low and high fat diets for mice 861
by guest, on May 18, 2018
ww
w.jlr.org
Dow
nloaded from
significantly
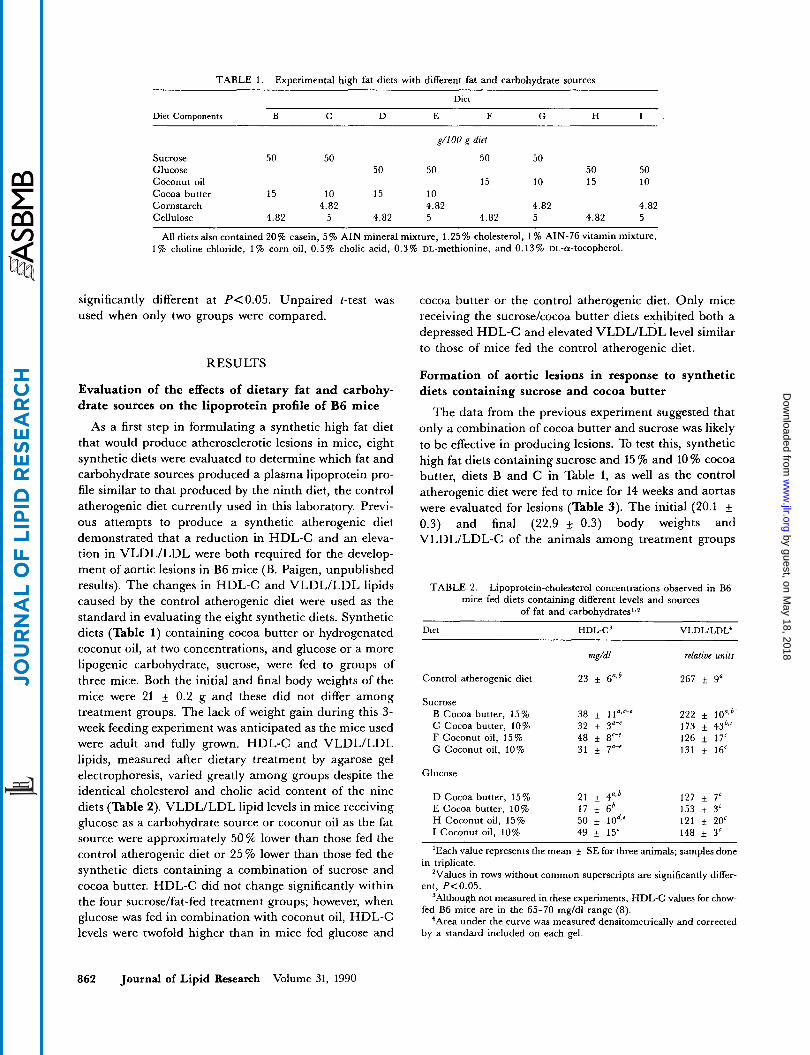
TABLE 1. Experimental high fat diets with different fat and carbohydrate sources
Diet
Diet Components B C D E F G H I
g/lOO g diet
Sucrose 50 50 50 50 Glucose 50 50 50 50 Coconut oil 15 10 15 10 Cocoa butter 15 10 15 10 Cornstarch 4.82 4.82 4.82 4.82 Cellulose 4.82 5 4.82 5 4.82 5 4.82 5
All diets also contained 20% casein, 5% AIN mineral mixture, 1.25% cholesterol, 1 % AIN-76 vitamin mixture, 1% choline chloride, 1% corn oil, 0.5% cholic acid, 0.3% uL-methionine, and 0.13% uL-a-tocopherol.
different at P<O.O5. Unpaired t-test was used when only two groups were compared.
RESULTS
Evaluation of the effects of dietary fat and carbohy- drate sources on the lipoprotein profile of B6 mice
As a first step in formulating a synthetic high fat diet that would produce atherosclerotic lesions in mice, eight synthetic diets were evaluated to determine which fat and carbohydrate sources produced a plasma lipoprotein pro- file similar to that produced by the ninth diet, the control atherogenic diet currently used in this laboratory. Previ- ous attempts to produce a synthetic atherogenic diet demonstrated that a reduction in HDL-C and an eleva- tion in VLDL/LDL were both required for the develop- ment of aortic lesions in B6 mice (B. Paigen, unpublished results). The changes in HDL-C and VLDL/LDL lipids caused by the control atherogenic diet were used as the standard in evaluating the eight synthetic diets. Synthetic diets (Table 1) containing cocoa butter or hydrogenated coconut oil, at two concentrations, and glucose or a more lipogenic carbohydrate, sucrose, were fed to groups of three mice. Both the initial and final body weights of the mice were 21 f 0.2 g and these did not differ among treatment groups. The lack of weight gain during this 3- week feeding experiment was anticipated as the mice used were adult and fully grown. HDL-C and VLDLILDL lipids, measured after dietary treatment by agarose gel electrophoresis, varied greatly among groups despite the identical cholesterol and cholic acid content of the nine diets (Table 2). VLDL/LDL lipid levels in mice receiving glucose as a carbohydrate source or coconut oil as the fat source were approximately 50% lower than those fed the control atherogenic diet or 25% lower than those fed the synthetic diets containing a combination of sucrose and cocoa butter. HDL-C did not change significantly within the four sucrose/fat-fed treatment groups; however, when glucose was fed in combination with coconut oil, HDL-C levels were twofold higher than in mice fed glucose and
cocoa butter or the control atherogenic diet. Only mice receiving the sucrose/cocoa butter diets exhibited both a depressed HDL-C and elevated VLDL/LDL level similar to those of mice fed the control atherogenic diet.
Formation of aortic lesions in response to synthetic diets containing sucrose and cocoa butter
The data from the previous experiment suggested that only a combination of cocoa butter and sucrose was likely to be effective in producing lesions. To test this, synthetic high fat diets containing sucrose and 15 % and 10 % cocoa butter, diets B and C in Table 1, as well as the control atherogenic diet were fed to mice for 14 weeks and aortas were evaluated for lesions (Table 3). The initial (20.1 0.3) and final (22.9 f 0.3) body weights and VLDL/LDL-C of the animals among treatment groups
TABLE 2. Lipoprotein-cholesterol concentrations observed in B6 mice fed diets containing different levels and sources
of fat and carbohydrates',?
VLDLILDL' Diet HDL-C'
Control atherogenic diet
Sucrose B Cocoa butter, 15% C Cocoa butter, 10% F Coconut oil, 15% G Coconut oil, 10%
Glucose
D Cocoa butter, 15% E Cocoa butter, 10% H Coconut oil, 15% I Coconut oil, 10%
mg/dl
23 f 6",'
38 * 1 lo- 32 + 3"-' 48 f 8"-' 31 f 7"-'
21 * 40,' 1 7 f 6' 50 f lod'' 49 f 15'
relative units
267 * 9'
222 * 10"db 173 f 43',' 126 f 17' 131 * 16'
127 .t 7' 153 f 3'
148 f 3' 121 * 2OC
'Each value represents the mean f SE for three animals; samples done
'Values in rows without common superscripts are significantly differ-
3Although not measured in these experiments, HDL-C values for chow-
'Area under the curve was measured densitometrically and corrected
in triplicate.
ent, P<0.05.
fed B6 mice are in the 65-70 mg/dl range (8).
by a standard included on each gel.
862 Journal of Lipid Research Volume 31, 1990
by guest, on May 18, 2018
ww
w.jlr.org
Dow
nloaded from
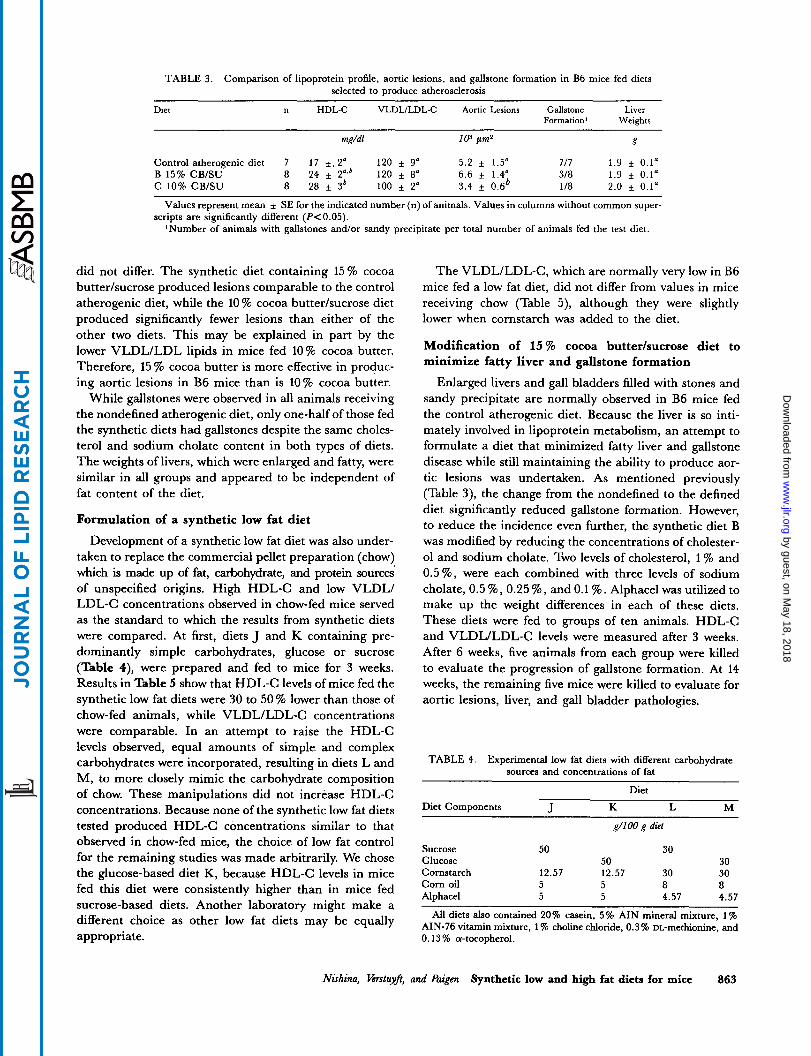
TABLE 3. Comparison of lipoprotein profile, aortic lesions, and gallstone formation in B6 mice fed diets selected to produce atherosclerosis
Diet n HDL-C VLDLILDL-C Aortic Lesions Gallstone Liver Formation' Weights
mg/dl lo3 Fm2 g
Control atherogenic diet 7 1 7 f. 2' 120 f 9" 5.2 f 1.5" 71 7 1.9 f 0.1= B 15% CB/SU 8 24 f 2",' 120 f 8' 6.6 f 1.4" 318 1.9 f 0.1" C 10% CB/SU 8 28 f 3' 100 * 2' 3.4 f 0.6' 1 /8 2.0 f 0.1"
Values represent mean f SE for the indicated number (n) of animals. Values in columns without common super-
'Number of animals with gallstones and/or sandy precipitate per total number of animals fed the test diet. scripts are significantly different (PC0.05).
did not differ. The synthetic diet containing 15% cocoa butter/sucrose produced lesions comparable to the control atherogenic diet, while the 10 % cocoa butter/sucrose diet produced significantly fewer lesions than either of the other two diets. This may be explained in part by the lower VLDL/LDL lipids in mice fed 10% cocoa butter. Therefore, 15 % cocoa butter is more effective in produc- ing aortic lesions in B6 mice than is 10% cocoa butter.
While gallstones were observed in all animals receiving the nondefined atherogenic diet, only one-half of those fed the synthetic diets had gallstones despite the same choles- terol and sodium cholate content in both types of diets. The weights of livers, which were enlarged and fatty, were similar in all groups and appeared to be independent of fat content of the diet.
Formulation of a synthetic low fat diet
Development of a synthetic low fat diet was also under- taken to replace the commercial pellet preparation (chow) which is made up of fat, carbohydrate, and protein sources of unspecified origins. High HDL-C and low VLDL/ LDL-C concentrations observed in chow-fed mice served as the standard to which the results from synthetic diets were compared. At first, diets J and K containing pre- dominantly simple carbohydrates, glucose or sucrose (Table 4), were prepared and fed to mice for 3 weeks. Results in Table 5 show that HDL-C levels of mice fed the synthetic low fat diets were 30 to 50 % lower than those of chow-fed animals, while VLDL/LDL-C concentrations were comparable. In an attempt to raise the HDL-C levels observed, equal amounts of simple and complex carbohydrates were incorporated, resulting in diets L and M, to more closely mimic the carbohydrate composition of chow. These manipulations did not increase HDL-C concentrations. Because none of the synthetic low fat diets tested produced HDL-C concentrations similar to that
The VLDL/LDL-C, which are normally very low in B6 mice fed a low fat diet, did not differ from values in mice receiving chow (Table 5), although they were slightly lower when cornstarch was added to the diet.
Modification of 15 % cocoa butterlsucrose diet to minimize fatty liver and gallstone formation
Enlarged livers and gall bladders filled with stones and sandy precipitate are normally observed in B6 mice fed the control atherogenic diet. Because the liver is so inti- mately involved in lipoprotein metabolism, an attempt to formulate a diet that minimized fatty liver and gallstone disease while still maintaining the ability to produce aor- tic lesions was undertaken. As mentioned previously (Table 3), the change from the nondefined to the defined diet significantly reduced gallstone formation. However, to reduce the incidence even further, the synthetic diet B was modified by reducing the concentrations of cholester- ol and sodium cholate. Two levels of cholesterol, 1 % and 0.5%, were each combined with three levels of sodium cholate, 0.5 %, 0.25 %, and 0.1 %. Alphacel was utilized to make up the weight differences in each of these diets. These diets were fed to groups of ten animals. HDL-C and VLDLILDL-C levels were measured after 3 weeks. After 6 weeks, five animals from each group were killed to evaluate the progression of gallstone formation. At 14 weeks, the remaining five mice were killed to evaluate for aortic lesions, liver, and gall bladder pathologies.
TABLE 4. Experimental low fat diets with different carbohydrate sources and concentrations of fat
Diet
Diet Components J K L M
g/lOO g diet
observed in chow-fed mice, the choice of low fat control for the remaining studies was made arbitrarily. We chose
Sucrose Glucose
50 30 50 30
the glucose-based diet K, because HDL-C levels in mice Cc"arch 12.57 12.57 30 30 fed this diet were consistently higher than in mice fed sucrose-based diets. Another laboratory might make a different choice as other low fat diets may be appropriate. 0.13% a-tocopherol.
5 5 8 8 5 5 4.57 4.57
All diets also contained 20% casein, 5% AIN mineral mixture, 1 % ~ 1 N - 7 6 vitamin mixture, 1 % choline chloride, 0.3% DL-methionine, and
Nishina, Krstuyj, and Paigen Synthetic low and high fat diets for mice 863
by guest, on May 18, 2018
ww
w.jlr.org
Dow
nloaded from
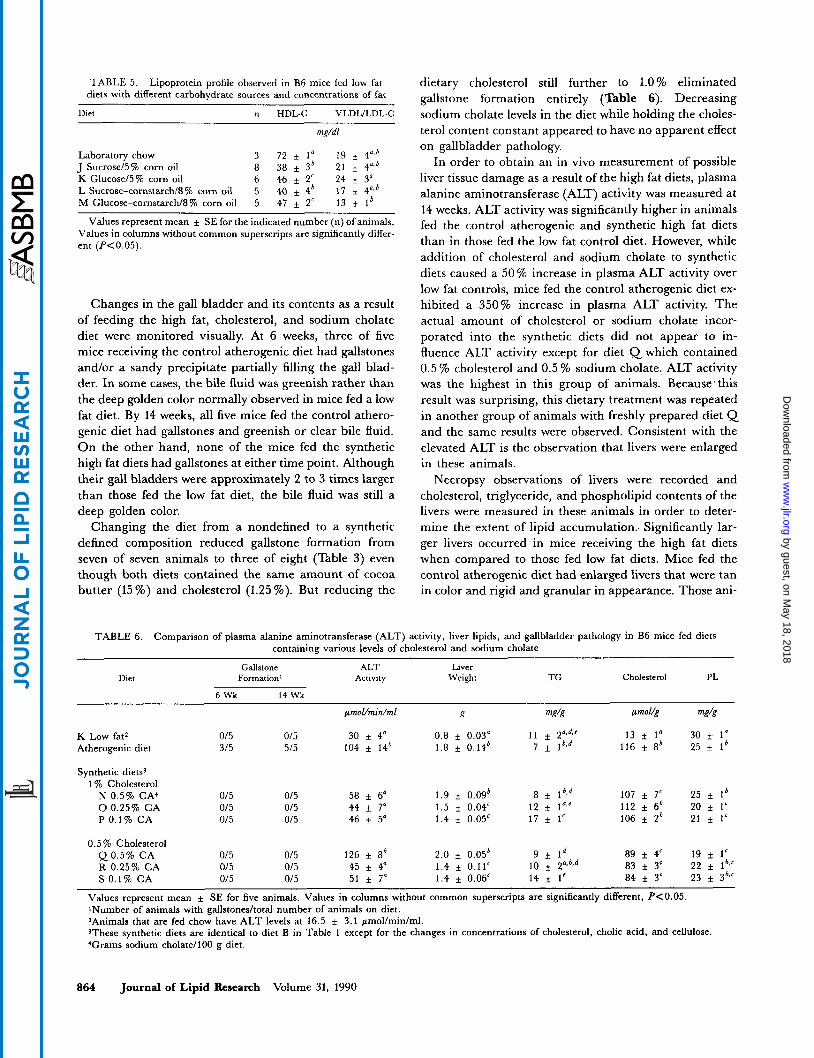
TABLE 5. Lipoprotein profile observed in B6 mice fed low fat diets with different carbohydrate sources and concentrations of fat
Diet n HDL-C VLDLtLDL-C
mg/dl
Laboratory chow 3 72 f 1' 19 f 4")' J Sucrose/5% corn oil 8 38 f 3' 21 f 4",' K Glucose/5% corn oil 6 46 f 2' 24 f 3" L Sucrose-cornstarch/8% corn oil 5 40 4' 17 f 4.j' M Glucose-cornstarch/8% corn oil 5 47 2' 13 1'
Values represent mean & SE for the indicated number (n) of animals. Values in columns without common superscripts are significantly differ- ent (P<0.05).
Changes in the gall bladder and its contents as a result of feeding the high fat, cholesterol, and sodium cholate diet were monitored visually. At 6 weeks, three of five mice receiving the control atherogenic diet had gallstones and/or a sandy precipitate partially filling the gall blad- der. In some cases, the bile fluid was greenish rather than the deep golden color normally observed in mice fed a low fat diet. By 14 weeks, all five mice fed the control athero- genic diet had gallstones and greenish or clear bile fluid. O n the other hand, none of the mice fed the synthetic high fat diets had gallstones at either time point. Although their gall bladders were approximately 2 to 3 times larger than those fed the low fat diet, the bile fluid was still a deep golden color.
Changing the diet from a nondefined to a synthetic defined composition reduced gallstone formation from seven of seven animals to three of eight (Table 3) even though both diets contained the same amount of cocoa butter (15 %) and cholesterol (1.25 76). But reducing the
dietary cholesterol still further to 1.0 % eliminated gallstone formation entirely (Table 6). Decreasing sodium cholate levels in the diet while holding the choles- terol content constant appeared to have no apparent effect on gallbladder pathology.
In order to obtain an in vivo measurement of possible liver tissue damage as a result of the high fat diets, plasma alanine aminotransferase (ALT) activity was measured at 14 weeks. ALT activity was significantly higher in animals fed the control atherogenic and synthetic high fat diets than in those fed the low fat control diet. However, while addition of cholesterol and sodium cholate to synthetic diets caused a 50 % increase in plasma ALT activity over low fat controls, mice fed the control atherogenic diet ex- hibited a 350% increase in plasma ALT activity. The actual amount of cholesterol or sodium cholate incor- porated into the synthetic diets did not appear to in- fluence ALT activity except for diet Q which contained 0.5 % cholesterol and 0.5 sodium cholate. ALT activity was the highest in this group of animals. Because this result was surprising, this dietary treatment was repeated in another group of animals with freshly prepared diet Q and the same results were observed. Consistent with the elevated ALT is the observation that livers were enlarged in these animals.
Necropsy observations of livers were recorded and cholesterol, triglyceride, and phospholipid contents of the livers were measured in these animals in order to deter- mine the extent of lipid accumulation.. Significantly lar- ger livers occurred in mice receiving the high fat diets when compared to those fed low fat diets. Mice fed the control atherogenic diet had enlarged livers that were tan in color and rigid and granular in appearance. Those ani-
TABLE 6. Comparison of plasma alanine aminotransferase (ALT) activity, liver lipids, and gallbladder pathology in B6 mice fed diets containine various levels of cholesterol and sodium cholate
Gallstone ALT Liver Diet Formation' Activity Weight TG Cholesterol PL
pmol/min/ml g mS'g pmol/g mdE
6 Wk 14 Wk
K Low fat2 0/5 015 30 + 4" 0.8 f 0.03" 1 1 f 2"++ 13 f 1' 30 f 1" Atherogenic diet 315 515 104 + 14' 1.8 f 0.14' 7 f 1b.d 116 f 8' 25 + 1'
Synthetic diets3 1 % Cholesterol
8 f lb,d 107 j: 7' 25 f 1' 0 0.25% CA 015 015 44 f 7" 1.5 f 0.04' 12 f 112 f 6' 20 f 1' P 0 .1% CA 015 0/5 46 + 5" 1.4 f 0.05" 17 f 1' 106 f 2' 21 + 1'
N 0.5% CA' 0/5 015 58 f 6" 1.9 f 0.096
0.5% Cholesterol 89 f 4' 19 f 1' 83 f 3'
Q 0 . 5 % CA 0/5 015 126 f 8' 2.0 f 0.05* 9 f I d R 0.25% CA 015 0 / 5 45 f 4" 1.4 f 0.11' 10 f 2",b,d 22 f lb,' S 0.1% CA 015 015 51 f 7" 1.4 f 0.06c 14 f 1' 84 f 3' 23 f 3','
~
Values represent mean f SE for five animals. Values in columns without common superscripts are significantly different, PC0.05. 'Number of animals with gallstones/total number of animals on diet. *Animals that are fed chow have ALT levels at 16.5 f 3.1 pmollminlml. 'These synthetic diets are identical to diet B in Table 1 except for the changes in concentrations of cholesterol, cholic acid, and cellulose. 'Grams sodium cholate/100 g diet.
864 Journal of Lipid Research Volume 31, 1990
by guest, on May 18, 2018
ww
w.jlr.org
Dow
nloaded from
mals receiving the synthetic high fat diets had pale pink- colored livers that were neither as rigid as those observed above nor as plastic as those found in low fat control mice. Overall, the concentration of sodium cholate in the diet appeared to influence liver size as mice receiving 0.5% sodium cholate had significantly larger livers than those fed lower percentages of sodium cholate irrespective of the cholesterol content of the diets. Accumulation of triglycerides appeared to be inversely related to dietary sodium cholate as an increasing total liver triglyceride was observed with decreasing concentrations of sodium cholate, with the exception of those mice fed the diet Q Liver phospholipids also appeared to be influenced by dietary sodium cholate. Significantly higher total liver phospholipid levels were observed in those animals receiv- ing 0.5 % sodium cholate in their diets. Total liver choles- terol, on the other hand, appeared to be directly related to the cholesterol content of the diets (i.e., higher dietary cholesterol accumulation in the liver) and not sodium cholate content in the diets. Thus, the highest sodium cholate concentration of 0.5 % was associated with an in- creased liver size, an increased total liver phospholipid level, and a decreased total liver triglyceride concentra- tion, while the higher cholesterol concentrations of the diets caused an increased accumulation of liver cholesterol.
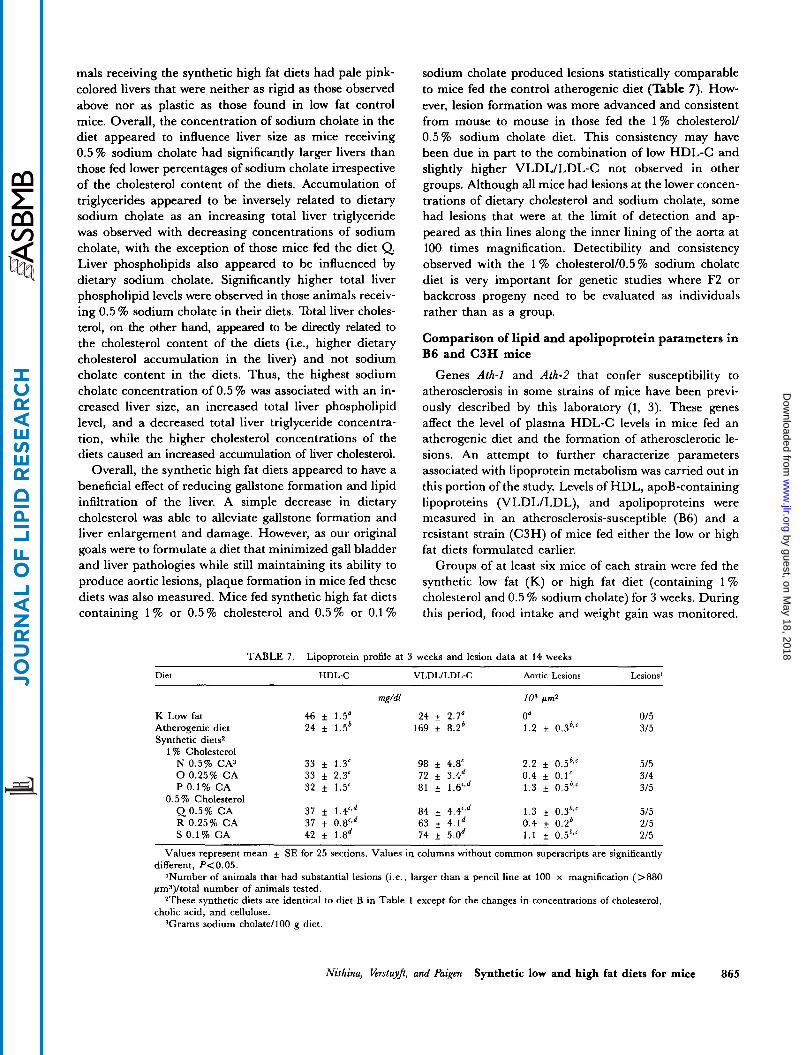
Overall, the synthetic high fat diets appeared to have a beneficial effect of reducing gallstone formation and lipid infiltration of the liver. A simple decrease in dietary cholesterol was able to alleviate gallstone formation and liver enlargement and damage. However, as our original goals were to formulate a diet that minimized gall bladder and liver pathologies while still maintaining its ability to produce aortic lesions, plaque formation in mice fed these diets was also measured. Mice fed synthetic high fat diets containing 1 % or 0.5 % cholesterol and 0.5 % or 0.1 %
sodium cholate produced lesions statistically comparable to mice fed the control atherogenic diet (Table 7). How- ever, lesion formation was more advanced and consistent from mouse to mouse in those fed the 1% cholesterol/ 0.5% sodium cholate diet. This consistency may have been due in part to the combination of low HDL-C and slightly higher VLDL/LDL-C not observed in other groups. Although all mice had lesions at the lower concen- trations of dietary cholesterol and sodium cholate, some had lesions that were at the limit of detection and ap- peared as thin lines along the inner lining of the aorta at 100 times magnification. Detectibility and consistency observed with the 1 % cholesterol/0.5 % sodium cholate diet is very important for genetic studies where F2 or backcross progeny nzed to be evaluated as individuals rather than as a group.
Comparison of lipid and apolipoprotein parameters in B6 and C3H mice
Genes Ath-1 and Ath-2 that confer susceptibility to atherosclerosis in some strains of mice have been previ- ously described by this laboratory (1, 3). These genes affect the level of plasma HDL-C levels in mice fed an atherogenic diet and the formation of atherosclerotic le- sions. An attempt to further characterize parameters associated with lipoprotein metabolism was carried out in this portion of the study. Levels of HDL, apoB-containing lipoproteins (VLDL/LDL), and apolipoproteins were measured in an atherosclerosis-susceptible (B6) and a resistant strain (C3H) of mice fed either the low or high fat diets formulated earlier.
Groups of at least six mice of each strain were fed the synthetic low fat (K) or high fat diet (containing 1% cholesterol and 0.5 % sodium cholate) for 3 weeks. During this period, food intake and weight gain was monitored.
TABLE 7 . Lipoprotein profile at 3 weeks and lesion data at 14 weeks
Diet HDL-C VLDWLDL-C Aortic Lesions Lesions'
mg/dl IO3 pm2
K Low fat Atherogenic diet Synthetic diets2
1 % Cholesterol N 0.5% CA3 0 0.25% CA P 0.1% CA
0.5% Cholesterol Q 0 . 5 % CA R 0.25% CA S 0.1% CA
46 f 1.5" 24 f 1.5'
33 f 1.3'
32 f 1.5'
37 f 1.4c3d
33 f 2.3c
37 f 0.8L.d 42 f 1.8d
24 f 2.7" 169 f 8.2'
98 f 4.SC 72 f 3.C.d
84 f 4 . 4 4
81 i 1.6"d
63 f 4.1d 74 f 5.0d
o4 1.2 f 0.3*,'
2 .2 f 0.5*" 0.4 i 0.1' 1.3 f 0.56,c
1.3 f 0.3',' 0.4 f O . Z b 1 . 1 f 0.5b,c
015 315
515 314 315
515 215 215
Values represent mean + SE for 25 sections. Values in columns without common superscripts are significantly
'Number of animals that had substantial lesions ( i .e . , larger than a pencil line at 100 x magnification (>a80
*These synthetic diets are identical to diet B in Table 1 except for the changes in concentrations of cholesterol,
3Grams sodium cholate1100 g diet.
different, P< 0.05.
pm3)ltotal number of animals tested.
cholic acid, and cellulose.
Nishina, Erstuyj, and Paigen Synthetic low and high fat diets for mice 865
by guest, on May 18, 2018
ww
w.jlr.org
Dow
nloaded from
The animals were then killed and plasma lipid and apo- lipoproteins were measured.
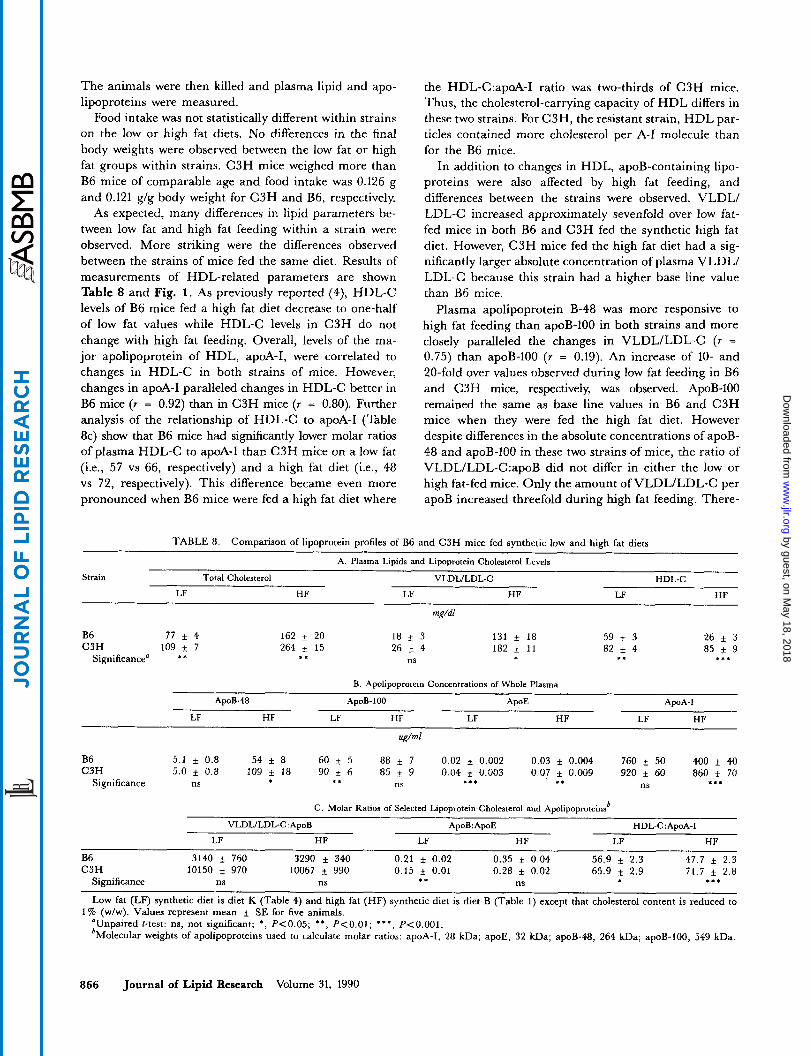
Food intake was not statistically different within strains on the low or high fat diets. No differences in the final body weights were observed between the low fat or high fat groups within strains. C3H mice weighed more than B6 mice of comparable age and food intake was 0.126 g and 0.121 g/g body weight for C3H and B6, respectively.
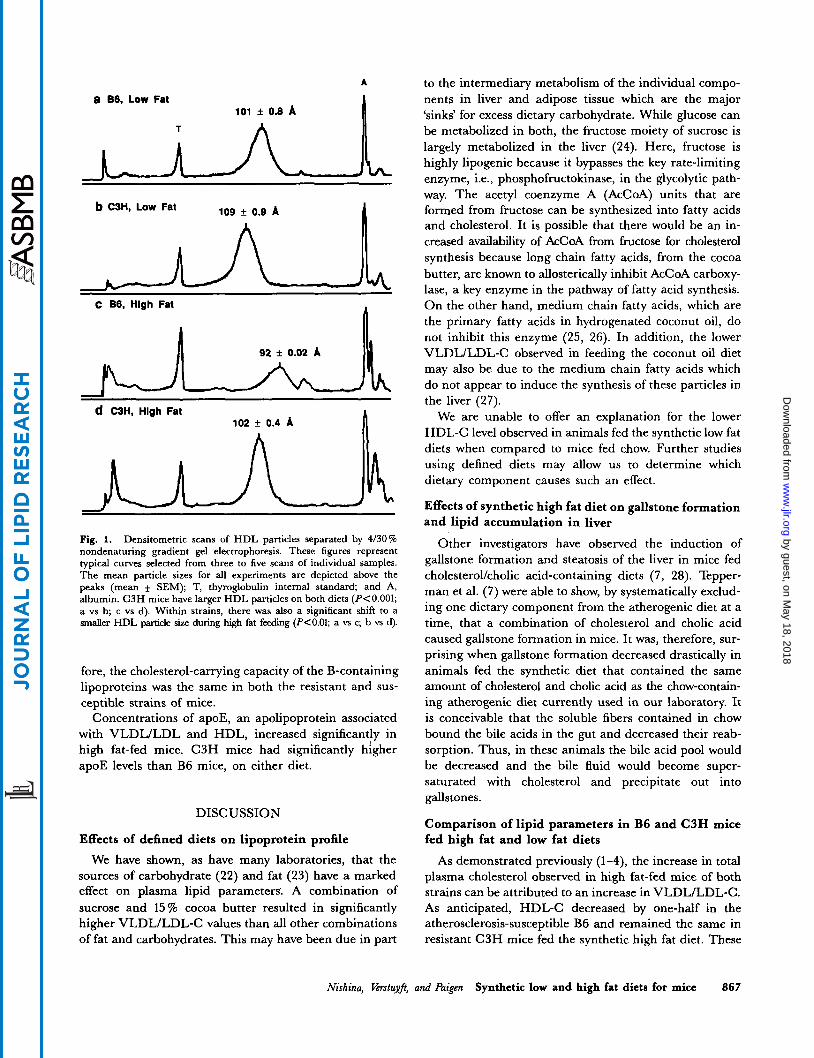
As expected, many differences in lipid parameters be- tween low fat and high fat feeding within a strain were observed. More striking were the differences observed between the strains of mice fed the same diet. Results of measurements of HDL-related parameters are shown Table 8 and Fig. 1. As previously reported (4), HDL-C levels of B6 mice fed a high fat diet decrease to one-half of low fat values while HDL-C levels in C3H do not change with high fat feeding. Overall, levels of the ma- jor apolipoprotein of HDL, apoA-I, were correlated to changes in HDL-C in both strains of mice. However, changes in apoA-I paralleled changes in HDL-C better in B6 mice (Y = 0.92) than in C3H mice ( r = 0.80). Further analysis of the relationship of HDL-C to apoA-I (Table 8c) show that B6 mice had significantly lower molar ratios of plasma HDL-C to apoA-I than C3H mice on a low fat (i.e., 57 vs 66, respectively) and a high fat diet (Le., 48 vs 72, respectively). This difference became even more pronounced when B6 mice were fed a high fat diet where
the HDL-C:apoA-I ratio was two-thirds of C3H mice. Thus, the cholesterol-carrying capacity of HDL differs in these two strains. For C3H, the resistant strain, HDL par- ticles contained more cholesterol per A-I molecule than for the B6 mice.
In addition to changes in HDL, apoB-containing lipo- proteins were also affected by high fat feeding, and differences between the strains were observed. VLDL/ LDL-C increased approximately sevenfold over low fat- fed mice in both B6 and C3H fed the synthetic high fat diet. However, C3H mice fed the high fat diet had a sig- nificantly larger absolute concentration of plasma VLDL/ LDL-C because this strain had a higher base line value than B6 mice.
Plasma apolipoprotein B-48 was more responsive to high fat feeding than apoB-100 in both strains and more closely paralleled the changes in VLDLILDL-C (Y =
0.75) than apoB-100 ( 7 = 0.19). An increase of 10- and 20-fold over values observed during low fat feeding in B6 and C3H mice, respectively, was observed. ApoB-100 remained the same as base line values in B6 and C3H mice when they were fed the high fat diet. However despite differences in the absolute concentrations of apoB- 48 and apoB-100 in these two strains of mice, the ratio of VLDLILDL-C:apoB did not differ in either the low or high fat-fed mice. Only the amount of VLDLILDL-C per apoB increased threefold during high fat feeding. There-
TABLE 8. Comparison of lipoprotein profiles of B6 and C3H mice fed synthetic low and high fat diets
A. Plasma Lipids and Lipoprotein Cholesterol Levels
Strain Total Cholesterol VLDLILDL-C HDL-C
LF HF LF HF LF HF ~ -
mg/di
B6 77 f 4 162 f 20 18 * 3 131 f 18 59 f 3 26 f 3 C3H 109 f 7 264 f 15 26 f 4 182 f 1 1 a2 f 4 85 * 9
ns Significance" * * * * * * I *It
B. Apolipoprotein Concentrations of Whole Plasma
ApoB-48 ApoB-100 ApoE ApoA-I
LF HF LF HF LF HF LF HF
ug/ml
B6 5.1 f 0.8 54 f 8 60 5 88 f 7 0.02 f 0.002 0.03 f 0.004 760 f 50 400 f 40 C3H 5.0 f 0.8 109 i 18 90 f 6 85 f 9 0.04 f 0.003 0.07 f 0.009 920 f 60 860 f 70
t * * * ns *.* * I ns * * Significance ns
C. Molar Ratios of Selected Lipoprotein-Cholesterol and Apolipoproteinsb
VLDWLDL-C: ApoB ApoB:ApoE HDL-C:ApoA-I
LF HF LF HF LF HF
47.7 f 2 . 3 B6 3140 f 760 3290 f 340 0.21 f 0.02 0.35 f 0.04 C3H 10150 i 970 10067 f 990 0.15 f 0.01 0.28 f 0.02 65.9 i 2.9 7 1 . 7 f 2.8
56.9 f 2.3
* * * ns .* Siwificance ns ns
Low fat (LF) synthetic diet is diet K (Table 4) and high fat (HF) synthetic diet is diet B (Table 1) except that cholesterol content is reduced to
"Unpaired t-test: ns, not significant; *, P<0.05; **, P<O.Ol; ***, P<O.OOl. bMolecular weights of apolipoproteins used to calculate moIar ratios: apoA-I, 28 kDa; apoE, 32 kDa; apoB-48, 264 kDa; apoB-100, 549 kDa.
1 % (w/w). Values represent mean f SE for five animals.
866 Journal of Lipid Research Volume 31, 1990
by guest, on May 18, 2018
ww
w.jlr.org
Dow
nloaded from
A
a B6, Low Fat io1 f 0.8 A
T
b C3H, Low Fat io9 f 0.9 A I
n C B6, Hlgh Fat
~~ ~~
d C3H, Hlgh Fat 102 f 0.4 A n
Fig. 1. Densitometric scans of HDL particles separated by 4/30% nondenaturing gradient gel electrophoresis. These figures represent typical curves selected from three to five scans of individual samples. The mean particle sizes for all experiments are depicted above the peaks (mean * SEM); T, thyroglobulin internal standard; and A, albumin. C3H mice have larger HDL particles on both diets (PCO.001; a vs b; c vs d). Within strains, there was also a significant shift to a smaller HDL particle size during high fat feeding (P<O.O1; a vs c; b ys d).
fore, the cholesterol-carrying capacity of the B-containing lipoproteins was the same in both the resistant and sus- ceptible strains of mice.
Concentrations of apoE, an apolipoprotein associated with VLDL/LDL and HDL, increased significantly in high fat-fed mice. C3H mice had significantly higher apoE levels than B6 mice, on either diet.
DISCUSSION
Effects of defined diets on lipoprotein profile We have shown, as have many laboratories, that the
sources of carbohydrate (22) and fat (23) have a marked effect on plasma lipid parameters’. A combination of sucrose and 15% cocoa butter resulted in significantly higher VLDL/LDL-C values than all other combinations of fat and carbohydrates. This may have been due in part
to the intermediary metabolism of the individual compo- nents in liver and adipose tissue which are the major ‘sinks’ for excess dietary carbohydrate. While glucose can be metabolized in both, the fructose moiety of sucrose is largely metabolized in the liver (24). Here, fructose is highly lipogenic because it bypasses the key rate-limiting enzyme, i.e., phosphofructokinase, in the glycolytic path- way. The acetyl coenzyme A (AcCoA) units that are formed from fructose can be synthesized into fatty acids and cholesterol. It is possible that there would be an in- creased availability of AcCoA from fructose for cholesterol synthesis because long chain fatty acids, from the cocoa butter, are known to allosterically inhibit AcCoA carboxy- lase, a key enzyme in the pathway of fatty acid synthesis. On the other hand, medium chain fatty acids, which are the primary fatty acids in hydrogenated coconut oil, do not inhibit this enzyme (25, 26). In addition, the lower VLDL/LDL-C observed in feeding the coconut oil diet may also be due to the medium chain fatty acids which do not appear to induce the synthesis of these particles in the liver (27).
We are unable to offer an explanation for the lower HDL-C level observed in animals fed the synthetic low fat diets when compared to mice fed chow. Further studies using defined diets may allow us to determine which dietary component causes such an effect.
Effects of synthetic high fat diet on gallstone formation and lipid accumulation in liver
Other investigators have observed the induction of gallstone formation and steatosis of the liver in mice fed cholesterolkholic acid-containing diets (7, 28). Tepper- man et al. (7) were able to show, by systematically exclud- ing one dietary component from the atherogenic diet at a time, that a combination of cholesterol and cholic acid caused gallstone formation in mice. It was, therefore, sur- prising when gallstone formation decreased drastically in animals fed the synthetic diet that contained the same amount of cholesterol and cholic acid as the chow-contain- ing atherogenic diet currently used in our laboratory. It is conceivable that the soluble fibers contained in chow bound the bile acids in the gut and decreased their reab- sorption. Thus, in these animals the bile acid pool would be decreased and the bile fluid would become super- saturated with cholesterol and precipitate out into gallstones.
Comparison of lipid parameters in B6 and C3H mice fed high fat and low fat diets
As demonstrated previously (1 -4)) the increase in total plasma cholesterol observed in high fat-fed mice of both strains can be attributed to an increase in VLDL/LDL-C. As anticipated, HDL-C decreased by one-half in the atherosclerosis-susceptible B6 and remained the same in resistant C3H mice fed the synthetic high fat diet. These
Nirhina, Vustuyj, and Paigen Synthetic low and high fat diets for mice 867
by guest, on May 18, 2018
ww
w.jlr.org
Dow
nloaded from
changes in HDL-C levels were paralleled by changes in the concentration of plasma apoA-I, a major apolipopro- tein in mouse HDL particles (29).
We have confirmed the observation by Lusis et al. (2) that HDL particles are smaller in B6 mice in comparison to C3H mice fed chow and further observed that this size difference persists with high fat feeding. The lower HDL- C per apoA-I (Le., lower core to surface ratio) observed in B6 mice may be partially responsible for the size differ- ence in HDL particles observed between strains. This is supported by the observation that overexpression of apoA- I in transgenic mice produced smaller H D L particles (30). However, this cannot be the whole explanation of the HDL size difference because HDL particle size decreased significantly (P< 0.01) in both strains when placed on the high fat diet, while HDL-C:apoA-I only decreased in B6 mice. Perhaps, the difference between these two strains in apoA-I1 levels, not measured here but reported previously (2), may play a role in HDL particle size (31).
The 1.5- to 2-fold increase in plasma apoE over baseline values observed with high fat feeding has been reported by others (32, 33). The increase we observed with our syn- thetic high fat diet may be due in part to the source of carbohydrate, sucrose. Strobl et al. (33) reported a 2-fold increase in the secretion of apoE in hepatocytes cultured from sucrose-fed rats over hepatocytes cultured from chow-fed animals. Taken as a whole, in strain compari- son, C 3 H had significantly higher apoE than B6 mice. Morrisett et al. (34) have suggested that apoE may be a factor in resistance to atherosclerosis observed in certain strains of mice.
The increase in apoB observed with high fat feeding was primarily due to a n increase in apoB-48. In agree- ment with Lusis et al. (35), apoB-100 in B6 mice did not respond to high fat feeding. However, while they observed a 50% decrease in apoB-100 in C 3 H mice, we observed only a slight decrease. This difference in response may be due to the compositional differences of the two high fat diets.
The importance of using defined diets in studying biochemical phenomena and for comparing results be- tween laboratories is generally recognized (6). For these reasons we have attempted to formulate defined diets that would allow us to continue our studies in understanding how environmental factors such as diet interact with genetic factors in the development of atherosclerosis. In this series of experiments, we were able to produce a syn- thetic high fat diet which was as effective in its ability to produce aortic lesions as the nondefined atherogenic diet used previously. I
We wish to thank Jin Wang for her excellent technical assis- tance, Brian Ishida for providing protocols for apolipoprotein assays performed in this study, and Jurgen Naggert and Ronald W. Krauss for their helpful discussions and advice. This work was supported by grants 86-1387 from the American Heart
Association with funds contributed in part by the Alameda, Orange, and Santa Barbara County chapters; HL-32087 from the National Heart, Lung, and Blood Institute, National Insti- tutes of Health; and BG88-192 from the National Dairy Promo- tion and Research Board. Manuscript received 8 September 1989 and in revisedfonn 2 January 1990.
REFERENCES
1.
2.
3.
4.
5.
6.
7 .
8.
9.
10.
11.
12.
13.
14.
15.
16.
Paigen, B., D. Mitchell, K. Reue, A. Morrow, A. J. Lusis, and R. C. LeBoeuf. 1987. Ath-1, a gene determining atherosclerosis susceptibility and high density lipoprotein levels in mice. PTOC. Natl. Acad. Sci. USA. 84: 3763-3767. Lusis, A. J., B. A. Taylor, R. W. Wangenstein, and R. C. LeBoeuf. 1983. Genetic control of lipid transport in mice. 11. Genes controlling structure of high density lipoproteins. J. Biol. Chem. 258: 5071-5078. Paigen, B., M. N. Nesbitt, D. Mitchell, D. Albee, and R. C. LeBoeuf. 1989. Ath-2, a second gene determining atherosclerosis susceptibility and high density lipoprotein levels in mice. Genetics. 122: 163-168. Paigen, B., D. Albee, P. A. Holmes, and D. Mitchell. 1987. Genetic analysis of murine strains C57BL/6J and C3H/ HeJ to confirm the map position of Ath-1, a gene determin- ing atherosclerosis susceptibility. Biochem. Genet. 25:
Thomas, W. A,, and W. S. Hartroft. 1959. Myocardial in- farction in rats fed diets containing high fat, cholesterol, thiouracil and sodium cholate. Circulation. 19: 65-74. Beynen, A. C. 1985. Biochemists and the diet of their rats. Trends Biochem. Sci. 10: 108-109. Tepperman, J., F. L. Caldwell, and H. M. Tepperman. 1963. Induction of gallstones in mice by feeding a choles- terol-cholic acid-containing diet. Am. J. Physiol. 206:
Paigen, B., A. Morrow, C. Brandon, D. Mitchell, and P. Holmes. 1985. Variation in susceptibility to atherosclerosis among inbred strains of mice. Atherosclerosis. 57: 65-73. Rudel, L. L., and M. D. Morris. 1973. Determination of cholesterol using a-phthalaldehyde. J. Lipid Res. 14:
Izzo, C., F. Grillo, and E. Murado. 1981. Improved method for determination of high density lipoproteins by using polyethylene glycol 6000. Clin. Chem. 27: 371-374. Noble, R. P., F. T. Hatch, J. A. Marzrimas, E T. Lind- gren, L. C. Jensen, and G. L. Adamson. 1969. Comparison of lipoprotein analysis by agarose gel and paper electro- phoresis with analytical centrifugation. Lipidr. 4: 55-59. Folch, J., M. Lees, and G. H. Sloane Stanley. 1957. A sim- ple method for the isolation and purification of total lipides from animal tissues. J. Biol. Chem. 226: 497-509. Fletcher, M. J. 1968. A colorimetric method for estimating serum triglycerides. Clin. Chim. Acta. 22: 393-397. Allain, C. C., L. S. Poon, C. S. G. Chang, W. Richmond, and P. C. Fu. 1974. Enzymatic determination of total serum cholesterol. Clin. Chem. 20: 470-475. Rousner, G. 1970. Two-dimensional thin-layer chromato- graphic separation of polar lipids and determination of phospholipids by phosphorus analysis of spots. Lipids. 5 :
Fielding, C. J., J. Frohlich, K. Moser, and P. E. Fielding. 1982. Promotion of sterol efflux and net transport by apo- lipoprotein E in 1ecithin:cholesterol acyltransferase defi- ciency. Metabolism. 31: 1023-1028.
501-511.
628-634.
364-366.
494-496.
868 Journal of Lipid Research Volume 31, 1990
by guest, on May 18, 2018
ww
w.jlr.org
Dow
nloaded from
17. Ishida, B. Y., P. J. Blanche, A. V. Nichols, M. Yashar, and B. Paigen. 1989. Lipoprotein differences between the athero- sclerosis susceptible strain C57BL/6J and the atherosclero- sis resistant strain C3H/HeJ. (submitted for publication).
18. Laemmli, U. K. 1970. Cleavage of structural proteins dur- ing the assembly of the head of bacteriophage T4. Nature (London) 227: 680-685. Lindgren, F. T. 1975. Preparative ultracentrifugal labora- tory procedures and suggestions for lipoprotein analyses. In Analyses of Lipids and Lipoproteins. E. G. Perkins, editor. American Oil Chemistry Society, Champaign, IL. 204- 224.
20. Blanche, P. J., G. L. Gong, T. M. Forte, and A. V. Nichols. 1981. Characterization of human high-density lipoproteins by gradient gel electrophoresis. Biochim. Biophys. Acta. 665: 408-419. Paigen, B., A. Morrow, P. A. Holmes, D. Mitchell, and R. A. Williams. 1987. Quantitation assessment of athero- sclerotic lesions in mice. Atherosclerosis. 68: 231-240.
22. Bauer, J. E. 1987. Serum lipoproteins of rabbits fed semi- purified diets varying protein and carbohydrate source. J. Am. Oil Chem. SOC. 64: 1183-1192.
23. Paul, R., C. S. Ramesha, and J. Ganguly. 1980. On the mechanism of hypocholesterolemic effects of polyunsa- turated lipids. Adv. Lipid Res. 17: 1555-1571.
24. Chevalier, M.'M., J. H. Wiley, and G. A. Leville. 1972. Effect of dietary fructose on fatty acid synthesis in adipose tissue and liver of the rat. J. Nutr. 102: 337-342.
25. Numa, S., E. Ringlemann, and F. Lynen. 1965. Zur Hem- mung der Acetyl-coA Carboxylase durch Fettsaure-Coenz A-Verbindungen. B i o c h . Z. 343: 243-257.
26. Woollett, L. A,, B. K. Spady, and J. M. Dietschy. 1989. Mechanisms by which saturated triacylglycerols elevate the plasma low density lipoprotein cholesterol concentration in hamsters. J. Clin. Invest. 84: 119-128.
27. Petit, D., A. Raisonnier, N. Amit, and R. Infante. 1982.
19.
21.
28.
29.
30.
31.
32.
33.
34.
35.
Lack of induction of VLDL apoprotein synthesis by me- dium chain fatty acids in the isolated rat liver. Ann. Nutr Metab. 26: 279-286. Bergman, F., A. H. Juul, and W. van der Linden. 1970. De- velopment and regression of morphological and biochemi- cal changes in hamsters and mice fed a cholesterol-cholic acid-containing diet. Acta Pathol. Micmbiol. Scand. /A/ 72:
LeBoeuf, R. C., D. L. Puppione, V. N. Schumaker, and A. J. Lusis. 1983. Genetic control of lipid transport in mice. I. Structural properties and polymorphisms of plasma lipo- proteins. J. Biol. Chem. 258: 5063-5070. Walsh, A,, Y. Ito, and J. L. Breslow. 1989. High levels of human apolipoprotein A-I in transgenic mice result in in- creased plasma levels of small high density lipoprotein (HDL) particles comparable to human HDLS. J. Biol.
Doolittle, M. H., A. J. Lusis, J. Lucero, and R. C. LeBoeuf. 1987. The apolipoprotein A-I1 structural gene controls A-I1 synthetic rate and size of high density lipo- proteins. Circulation. 76: IV-222. Lin-Lee, Y-C., Y. Tanaka, C-T. Lin, and L. Chan. 1981. Effects of an atherogenic diet on apolipoprotein E biosyn- thesis in the rat. Biochemistry. 20: 6474-6480. Strobl, W., N. L. Gorder, G. A. Fienup, Y-C. Lin-Lee, A. M. Gotto, and W. Patsch. 1989. Effect of sucrose diet on apolipoprotein biosynthesis in rat liver. J. Biol. Chem. 264:
Morrisett, J. D., H. S. Kim, J. R. Patsch, S. K. Data, and J. J. Trentin. 1982. Genetic susceptibility and resistance to diet-induced atherosclerosis and hyperlipoproteinemia. Arteriosclerosis. 2: 312-324. Lusis, A. J., B. A. Taylor, D. Quon, S. Zollman, and R. C. LeBoeuf. 1987. Genetic factors controlling structure and expression of apolipoproteins B and E in mice. J. Biol.
179-191.
Chm. 264: 6488-6494.
1190-1194.
Chem. 262: 7594-7604.
Nishina, Verstuyj, and Paigen Synthetic low and high fat diets for mice 869
by guest, on May 18, 2018
ww
w.jlr.org
Dow
nloaded from