Embed Size (px)
Citation preview

Synthetic Aperture Radar (SAR)
Image Fusion with Optical Data
(Lecture I- Monday 21 December 2015)
Training Course on Radar Remote Sensing and Image Processing
21-24 December 2015, Karachi, Pakistan
Organizers: IST & ISNET
Parviz Tarikhi, PhD [email protected]
http://parviztarikhi.wordpress.com
Alborz Space Center, ISA, Iran

Introduction
Definition
Levels of Data Fusion
General Workflow
Comparison Image Geometry Optical & SAR
Pixel Level Fusion Techniques
• Color related techniques
• Statistical fusion techniques
• Numerical fusion techniques
Feature Level and Decision Level Fusion Techniques
• Artificial Neural Networks
• Fuzzy Logic
• Bayesian Fusion
• Dempster Shafer‘s Method
Outline
5-Jan-16
12:24:44 PM
2

5-Jan-16
12:24:44 PM
3
Remote Sensing imagery
invaluable to acquire geospatial information about
Earth surface for the assessment of land
resources and environmental monitoring.
In most cases
the information provided by a single sensor is not
complete or sufficient.
So, the images collected by different sensors are
combined to obtain complementary information.
Each remote sensing sensor has its own advantage and
disadvantage over other sensors.

5-Jan-16
12:24:44 PM
4
Synthetic aperture radar (SAR) imaging is an efficient tool for
monitoring and investigation
of dynamic phenomena.
It is a feasible alternative or a
complement to traditional
optical remote sensing
techniques because it does not
depend on solar illumination
and weather conditions.
The high spatial resolution of
SAR imagery makes it
applicable for high spatial resolution mapping purposes. However,
difficulties sometimes exist in the interpretation of SAR images.
Image fusion presents an alternative to improve the interpretability of
SAR images by fusing the color information from moderate spatial
resolution multispectral (MS) images.

5-Jan-16
12:24:44 PM
5
SAR (Synthetic Aperture Radar) sensors
active sensors capable of collecting images circadian without being affected
by weather conditions.
SAR sensors capable of
sensing the geometry & structure of the features such as terrain
topography, thickness and roughness of surface cover. They can also sense
the moisture content and presence of vegetation.
Visible-Infrared (VIR) sensors
passive sensors that sense the electromagnetic energy reflected from surface.
Information provided by the SAR data alone may not be satisfactory for a
detailed analysis of the terrain,
since it lacks the capability of collecting spectral information about terrain
cover types.
Fusion of VIR and SAR images provides complementary data
to increase the amount of information that can be extracted from the
individual input images.

5-Jan-16
12:24:44 PM
6
For an optimal image fusion,
some criteria should be defined for algorithmic development.
The success of the fusion strongly depends
on the criteria selected.
An example,
a pixel based image fusion algorithm. The method
forms the fused images as the linear combination of the input images.
employs adaptive windows to establish statistical relationships between the
input images to calculate new fused pixels.
The fused pixels are calculated using two criteria:
1) Variance of the local window in fused image should be equal to the variance of
the corresponding window in higher resolution image to transfer spatial detail.
1) Mean of the local window in the fused image should be equal to the mean of
the window in the original lower resolution image to retain the color content.

5-Jan-16
12:24:44 PM
7
Image fusion is used for many purposes.
Very often it is used to produce an image with an improved spatial resolution.
The most common situation is represented by a pair of images where the first acquired by
a multispectral sensor has a pixel size greater than the pixel size of the second image
acquired by a panchromatic sensor.
Fusing these images a new multispectral image with a spatial resolution equal to the
panchromatic one is produced.
Image fusion introduces important distortion on the pixel spectra which in turn improve
the information content of remote sensing (RS) images.
Different fusion methods have been developed over years for improving spatial and
spectral resolutions of RS data sets. It includes: (Karathanassi et al. 2007, Ehlers et al. 2008)
the intensity-hue-saturation (IHS) transform,
the Brovey transform,
the principal components analysis (PCA) method,
the Gram-Schmidt method,
the local mean matching method,
the local mean and variance matching method,
the least square fusion method,
the wavelet-based fusion method,
the multiplicative and
the Ehlers Fusion.
Most fusion applications use modified approaches or combinations of these methods. Karathanassi V, Kolokousis P and Ioannidou S (2007) A comparison study on fusion methods using evaluation indicators, International Journal of Remote Sensing, 28, pp.2309 – 2341
Ehlers M, Klonus S and Åstrand P J (2008) Quality Assessment for multi-sensor multi-date image fusion, CD-ROM Proceedings of ISPRS Congresses, Beijing, China, 3-11 July 2008

5-Jan-16
12:24:44 PM
8
Image fusion is capable of integrating different imagery data
creating more information than that from a single sensor.
Many image fusion algorithms and software tools have been
developed, such as (Alparone et al. 2004)
the IHS (Intensity, Hue, Saturation),
PCA (Principal Components Analysis),
SVR (Synthetic Variable Ratio) and
wavelet based fusion.
However, such available algorithms are not efficient for the fusion
of SAR and optical images any more.
In an urban area, many land cover types/surface materials are
spectrally similar. This makes it extremely difficult to analyze an
urban scene using a single sensor.
Some of these features can be discriminated in a radar image based
on their dielectric properties and surface roughness. Alparone L, Baronti S, Garzelli A et al. (2004) Landsat ETM+ and SAR Image Fusion Based on Generalized Intensity Modulation, IEEE Trans. on Geosci. Remote Sensing, vol 42, pp. 2832 – 2839

5-Jan-16
12:24:44 PM
9
In case of RS data sets, three different fusions is possible:
fusion of optical data with optical data,
fusion of microwave data with microwave data and
fusion of optical and microwave data sets
For several decades, fusion of multiresolution optical images has
been successfully used for the improvement of information
contents of images for visual interpretation as well as for the
enhancement of land surface features.
Many studies have been conducted on the improvement of spatial
resolution of multispectral images by the use of the high
frequencies of panchromatic images, while preserving the
spectral information.
Successful attempts have made fuse the interferometric or multi-
frequency SAR images.
Unlike the fusion of optical images, most fusions of the synthetic
aperture radar (SAR) data sets aims to increase the spectral
variety of the classes.

5-Jan-16
12:24:44 PM
10
The fusion of optical and SAR data sets has been widely used for different applications.
It has been found that the images acquired at optical and microwave ranges of electro-
magnetic spectrum provide unique information when they are integrated.
Image fusion based on the integration of multispectral optical and multi-frequency
microwave data sets is being efficiently used for interpretation, enhancement and
analysis of different land surface features.
It is known that optical data contains information on the reflective and emissive
characteristics of the Earth surface features, while the SAR data contains information
on the surface roughness, texture and dielectric properties of natural and man-made
objects.
It is evident that a combined use of the optical and SAR images will have a number of
advantages because a specific feature which is not seen on the passive sensor image
might be seen on the microwave image and vice versa because of the complementary
information provided by the two sources.
Different techniques have proposed and applied to combine optical and SAR images
aiming to enhance various features. The results from the fused images is judged to be
better than the results obtained from the individual images.
Although, many studies of image fusion have been conducted for derivation of new
algorithms for the enhancement of different features, still little research has been done
on the influence of image fusions on the automatic extraction of different thematic
information within urban environment.

5-Jan-16
12:24:44 PM
11
For the extraction of thematic information from multispectral RS images, different
supervised and unsupervised classification methods have been applied for many years.
Unlike the single-source data, data sets from multiple sources have proved to offer better
potential for discriminating between different land cover types.
The potential of multisource images for the classification of different land cover classes
have assessed with promising results.
In RS applications, the most widely used multisource classification techniques are
statistical methods,
Dempster–Shafer theory of evidence,
neural networks,
decision tree classifier, and
knowledge-based methods.
Proposed image fusion includes two different approaches such as
fusion of SAR data with SAR data (ie, SAR/SAR approach) and
fusion of optical data with SAR data (ie, optical/SAR approach),
while the knowledge-based method includes different rules based on the spectral and
spatial thresholds.

Definition
Data Fusion:
‚…a formal framework in which are expressed means and tools for the
alliance of data originating from different sources.
It aims at obtaining information of greater quality;
the exact definition of greater quality will depend upon the application’
(Wald 1999)
‘Image fusion is the combination of two or more different images to
form a new image by using a certain algorithm’
(Genderen & Pohl 1994 cited in: Pohl and Van Genderen 1998)
S
AR
-ED
U, h
ttp
s://
sare
du
.dlr
.de/
5-Jan-16
12:24:44 PM
12

5-Jan-16
12:24:44 PM
13
As a general and popular multi-discipline approach,
Data Fusion combines data from multiple sources to
improve the potential values and interpretation
performances of the source data, and to produce a
high-quality visible representation of the data.
Data Fusion techniques useful for a variety of
applications, such as
object detection, recognition, identification and
classification, object tracking, change detection,
decision making, etc.
Data Fusion successfully applied in the
space and earth observations, computer vision,
medical image analysis and defense security, etc.

5-Jan-16
12:24:44 PM
14
Remote sensing data fusion aims to
integrate the information acquired with different spatial and spectral
resolutions from sensors mounted on satellites, aircraft and ground
platforms to produce fused data that contains more detailed information
than each of the sources.
Research on data fusion has a long history in remote sensing since
fusion products are the basis for many applications.
Advanced fusion approaches and techniques have been developed to
improve performance and accuracy.
Remote Sensing Data Fusing, especially multi-source data, still challenging
because of various requirements, the complexity of the landscape, the
temporal and spectral variations within the input data set and accurate data
co-registration.

5-Jan-16
12:24:44 PM
15
Pohl and van Genderen (1998) classify remote sensing data fusion techniques
into three levels:
the pixel/data level,
the feature level and
the decision level.
Pohl C and van Genderen, J L (1998) Multisensor image fusion in remote sensing: concepts, methods and applications. International Journal of Remote Sensing, 19 (5) 823–854

5-Jan-16
12:24:44 PM
16
Pixel level fusion
the combination of raw data from multiple
sources into single resolution data, that is
expected to be more informative and synthetic
than either of the input data or reveal the
changes between data sets acquired at different
times.

5-Jan-16
12:24:44 PM
17
Feature level fusion
extracts various features, e.g. edges, corners, lines, texture
parameters, etc., from different data sources and then
combines them into one or more feature maps that may be used
instead of the original data for further processing.
This is particularly important when the number of available
spectral bands becomes so large that it is impossible to analyze
each band separately.
Methods applied to extract features usually depend on the
characteristics of the individual source data, and therefore may be
different if the data sets used are heterogeneous. Typically, in
image processing, such fusion requires a precise (pixel-level)
registration of the available images. Feature maps thus obtained
are then used as input to pre-processing for image segmentation or
change detection.
5-Jan-16
12:24:44 PM
18
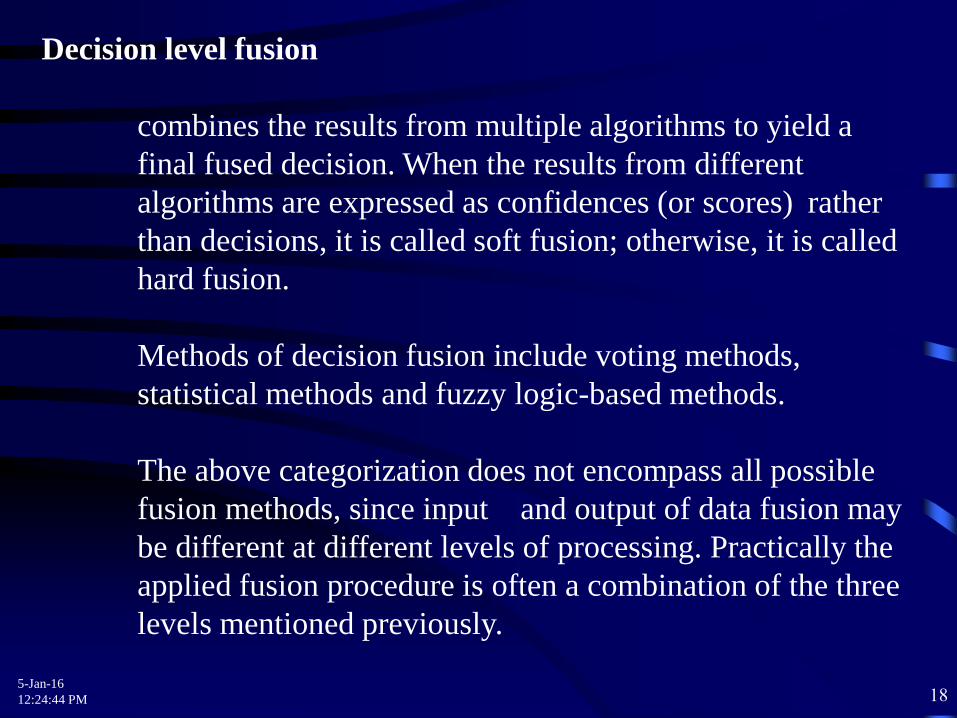
Decision level fusion
combines the results from multiple algorithms to yield a
final fused decision. When the results from different
algorithms are expressed as confidences (or scores) rather
than decisions, it is called soft fusion; otherwise, it is called
hard fusion.
Methods of decision fusion include voting methods,
statistical methods and fuzzy logic-based methods.
The above categorization does not encompass all possible
fusion methods, since input and output of data fusion may
be different at different levels of processing. Practically the
applied fusion procedure is often a combination of the three
levels mentioned previously.
Levels of Data Fusion
5-Jan-16
12:24:44 PM
19
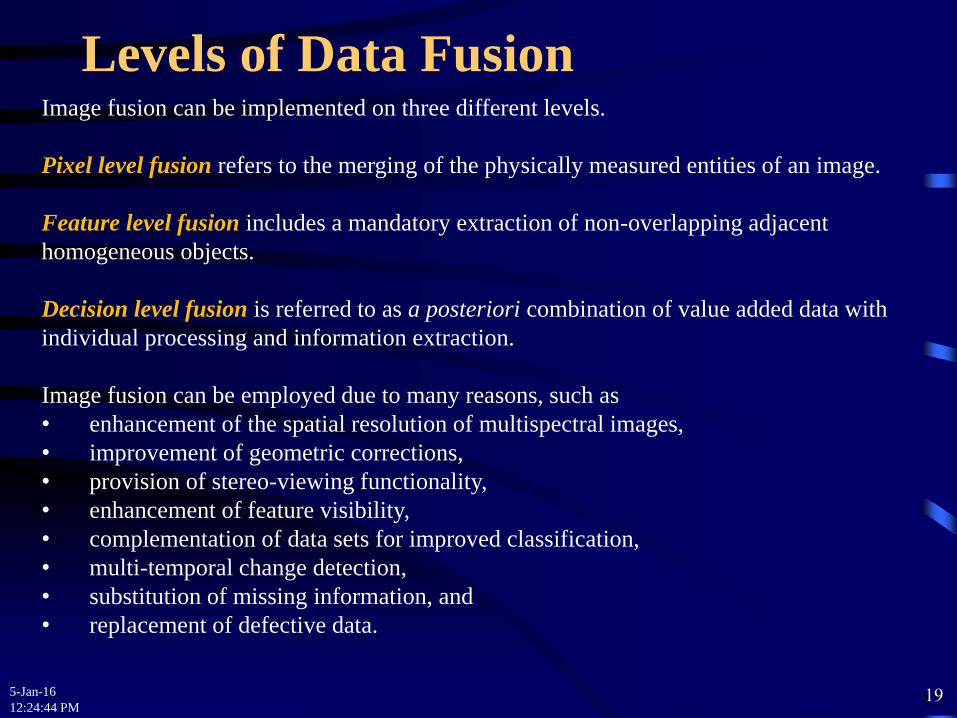
Image fusion can be implemented on three different levels.
Pixel level fusion refers to the merging of the physically measured entities of an image.
Feature level fusion includes a mandatory extraction of non-overlapping adjacent
homogeneous objects.
Decision level fusion is referred to as a posteriori combination of value added data with
individual processing and information extraction.
Image fusion can be employed due to many reasons, such as
• enhancement of the spatial resolution of multispectral images,
• improvement of geometric corrections,
• provision of stereo-viewing functionality,
• enhancement of feature visibility,
• complementation of data sets for improved classification,
• multi-temporal change detection,
• substitution of missing information, and
• replacement of defective data.
19

Levels of Data Fusion
Data Fusion Levels
5-Jan-16
12:24:44 PM
20
(re
pro
du
ced
fro
m P
ohl
& V
an G
ender
en 1
998
)
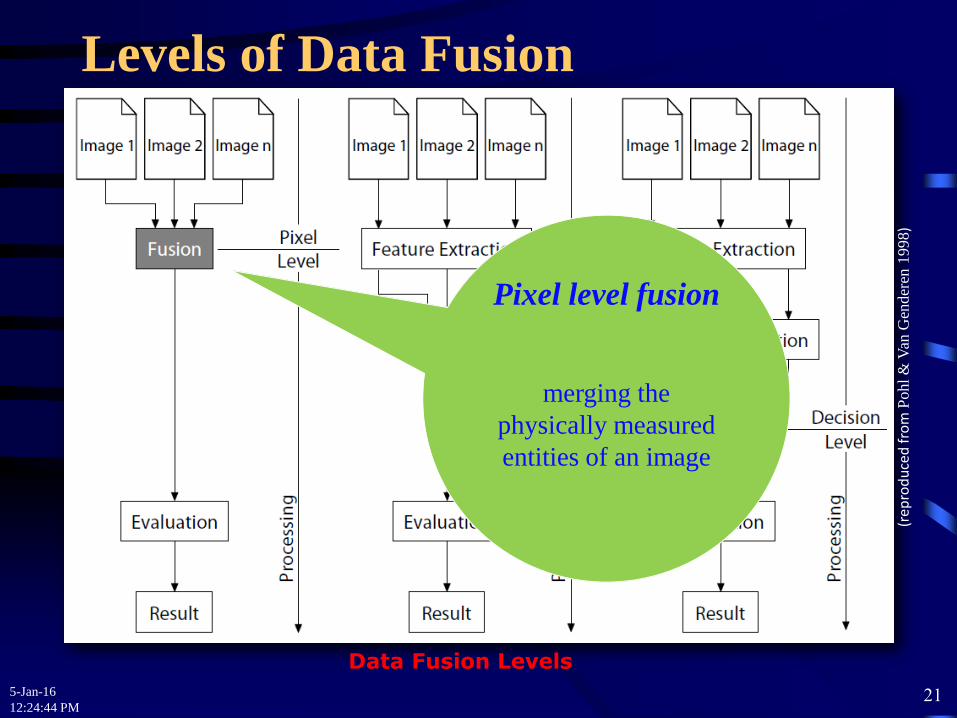
Levels of Data Fusion
Data Fusion Levels
5-Jan-16
12:24:44 PM
21
(re
pro
du
ced
fro
m P
ohl
& V
an G
ender
en 1
998
)
Pixel level fusion
merging the
physically measured
entities of an image

Levels of Data Fusion
Data Fusion Levels
5-Jan-16
12:24:44 PM
22
(re
pro
du
ced
fro
m P
ohl
& V
an G
ender
en 1
998
)
Feature level
fusion
a mandatory
extraction of non-
overlapping adjacent
homogeneous objects

Levels of Data Fusion
Data Fusion Levels
5-Jan-16
12:24:44 PM
23
(re
pro
du
ced
fro
m P
ohl
& V
an G
ender
en 1
998
) Decision level
fusion
a posteriori
combination of value
added data with
individual processing
and information
extraction

Levels of Data Fusion
Data Fusion Levels
5-Jan-16
12:24:44 PM
24
(re
pro
du
ced
fro
m P
ohl
& V
an G
ender
en 1
998
)

General Workflow
Optical-SAR data fusion workflow
S
AR
-ED
U, htt
ps:
//sa
redu.d
lr.d
e/
5-Jan-16
12:24:44 PM
25

General Workflow
Optical-SAR data fusion workflow
S
AR
-ED
U,
htt
ps:
//sa
red
u.d
lr.d
e/
5-Jan-16
12:24:44 PM
26
• It comprises multiple steps.
• Sometimes processing chain of an optical–SAR data fusion
differs from conventional approaches, where a high resolution
panchromatic image and a lower resolution multispectral
dataset are being merged.
• After the correction of system-specific errors, the fusion inputs
undergo radiometric processing.
• Speckle filtering is an important and essential precaution to be
careful of the impact of an unfiltered Radar image on the
fusion results.
• The quality of multispectral data frequently suffers from
atmospheric effects during data acquisition and can be
improved by means of radiometric calibration.
• In the next stage of data preprocessing, the geometric
correction of the multi-source imagery is required.
• Datasets need at least to be resampled to a common grid, but
are preferably geocoded, ortho-rectified and most desirably
co-registered to each other.
• High resolution SAR scene is used to sharpen the optical
inputs employing one of the presented data fusion techniques.
• Considering the type of applications, the synthesized imagery
is finally subject to further analysis.

Optical and SAR Image Geometry
Optical and SAR sensors geometry
5-Jan-16
12:24:44 PM
27
(re
pro
duce
d f
rom
Weg
ner
et
al.
2008)

Optical and SAR Image Geometry
Optical and SAR sensors geometry
5-Jan-16
12:24:44 PM
28
(re
pro
duce
d f
rom
Weg
ner
et
al.
20
08
) Optical Sensor Model • For optical imagery, the inverse 3D collinearity
equations (object to image) are used in order to project
the image to the ground.
• An indirect geometric image transformation for each
pixel of the ortho-image is conducted.
• The pixel size of the ortho-image is selected
corresponding to the ground resolution of the sensor.
• For all raster points of the ortho-image on the ground,
the corresponding height values have to be interpolated
within the DEM.
• The entire geometric modelling process is conducted in
physical coordinates.
• The interpolation of the grey value within the original
image in sensor geometry is a simple bilinear
interpolation.
SAR Sensor Model • The SAR image is projected to the ground with the inverse equations originally derived from the collinearity
equations.
• They incorporate three different models: the motion model, the sensor model and the earth model. Hence, three
coordinate systems are used: the image coordinate system, the intermediate coordinate system and the ground
cartographic coordinate system.
• The first step is a transformation of the ground coordinates to the intermediate coordinate system.
• It simply applies one translation and one rotation.
• Furthermore, the coordinates of the intermediate system are transformed to the image coordinates.

Fusion techniques
5-Jan-16
12:24:44 PM
29

Fusion techniques in Pixel Level
Data Fusion
Color related Statistical/Numerical
• IHS (Intensity-Hue-Saturation) Transformation
• HSV (Hue-Saturation-Value) Transformation
Statistical
• Principal Component Substitution (PCS)
• Gram-Schmidt Transformation
Numerical
• Brovey Transform
• Color Normalized algorithm
• High Pass Filter method
• Wavelets
S
AR
-ED
U, htt
ps:
//sa
redu.d
lr.d
e/
5-Jan-16
12:24:44 PM
30

Color related Fusion techniques
• Not very useful for Optical - SAR
data fusion
• Usally applied in Multi-spectral –
PAN fusion (PAN sharpening)
Simplified processing scheme of the Intensity
Hue Saturation (IHS) transform (up)
and
the Hue Saturation Value (HSV) transform (down)
S
AR
-ED
U, htt
ps:
//sa
redu.d
lr.d
e/
5-Jan-16
12:24:44 PM
31

Color related Fusion techniques
Simplified processing scheme of the Intensity Hue Saturation (IHS)
transform (up) and the Hue Saturation Value (HSV) transform
(down)
S
AR
-ED
U,
htt
ps:
//sa
red
u.d
lr.d
e/
5-Jan-16
12:24:44 PM
32
• Multispectral imagery is usually displayed as a color composite of
three bands utilizing the Red Green Blue (RGB) color space.
• Another way of representation comes with the Intensity Hue
Saturation (IHS) domain.
• In chromatics, Intensity refers to the total brightness of a color,
Hue describes the average wavelength of the light contributing to
the color and Saturation corresponds to its purity.
• The IHS transform makes use of this concept in order to sharpen
multispectral remote sensing data.
• In a first step, the multispectral input is transformed from the
RGB domain to the IHS color space.
• This enables the separation of spatial (Intensity) and spectral
(Hue and Saturation) information.
• Following, the Intensity component is replaced by the
panchromatic input.
• To achieve higher quality fusion results, the panchromatic image
is matched to the Intensity histogram prior to the replacement
procedure.
• The final step comprises the reverse transformation of the
replaced Intensity component and the original Hue and
Saturation components to the RGB domain.
• First applications of the IHS transform in the field of remote
sensing are reported by Haydn et al. in 1982 and Carper et al. in
1990.
• A potential disadvantage is that only three spectral bands can be
processed at once. (continued)

Color related Fusion techniques (ctd.)
Simplified processing scheme of the Intensity Hue Saturation (IHS)
transform (up) and the Hue Saturation Value (HSV) transform
(down)
S
AR
-ED
U,
htt
ps:
//sa
red
u.d
lr.d
e/
5-Jan-16
12:24:44 PM
33
• Hence, if a multispectral dataset features more than three
channels, the whole procedure has to be repeated for each
desired band combination.
• Using the IHS transform, the best results are to be expected
when the high resolution panchromatic image and the lower
resolution multispectral dataset are highly correlated – a
preliminary that is hard to fulfill when a SAR scene is used as
panchromatic input.
• In order to obtain a better fit between the fused and the original
data, a modified version of the IHS transform is developed.
• The HSV transform (Hue Saturation Value transform) follows
the same principle as the IHS method.
• In fact, the only difference is the HSV color space to which the
multispectral data are transferred to. Instead of the Intensity
component, as in the case of the IHS fusion, the Value
component is replaced by the high resolution panchromatic
image using the HSV transform.
• Afterwards, the substituted Value component and the original
Hue and Saturation components are subject to back
transformation from the HSV into the RGB domain.
• Gillespie et al. (1986) and Kruse & Raines (1984) are amongst
the first authors to describe the application of the HSV fusion
method to digital imagery.

Statistical Fusion techniques
Principal Component Substitution
Processing scheme of the Principal Component Substitution (PCS) method
5-Jan-16
12:24:44 PM
34
(re
pro
duce
d f
rom
Zhan
g 2
002
)
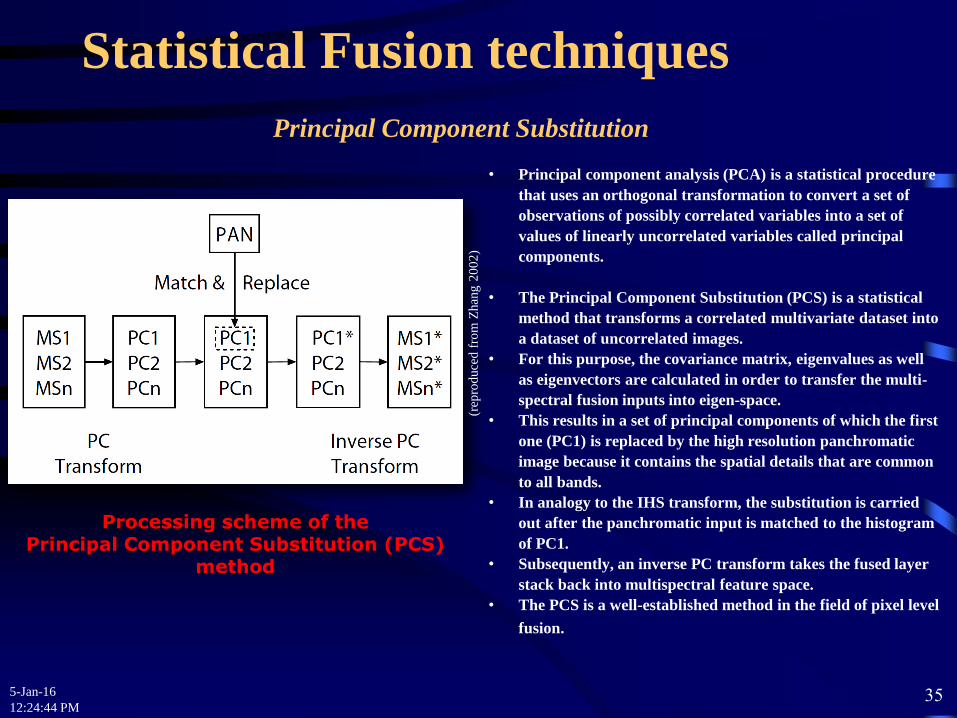
Statistical Fusion techniques
Principal Component Substitution
Processing scheme of the Principal Component Substitution (PCS)
method
5-Jan-16
12:24:44 PM
35
(re
pro
duce
d f
rom
Zhan
g 2
00
2)
• Principal component analysis (PCA) is a statistical procedure
that uses an orthogonal transformation to convert a set of
observations of possibly correlated variables into a set of
values of linearly uncorrelated variables called principal
components.
• The Principal Component Substitution (PCS) is a statistical
method that transforms a correlated multivariate dataset into
a dataset of uncorrelated images.
• For this purpose, the covariance matrix, eigenvalues as well
as eigenvectors are calculated in order to transfer the multi-
spectral fusion inputs into eigen-space.
• This results in a set of principal components of which the first
one (PC1) is replaced by the high resolution panchromatic
image because it contains the spatial details that are common
to all bands.
• In analogy to the IHS transform, the substitution is carried
out after the panchromatic input is matched to the histogram
of PC1.
• Subsequently, an inverse PC transform takes the fused layer
stack back into multispectral feature space.
• The PCS is a well-established method in the field of pixel level
fusion.
Statistical Fusion techniques
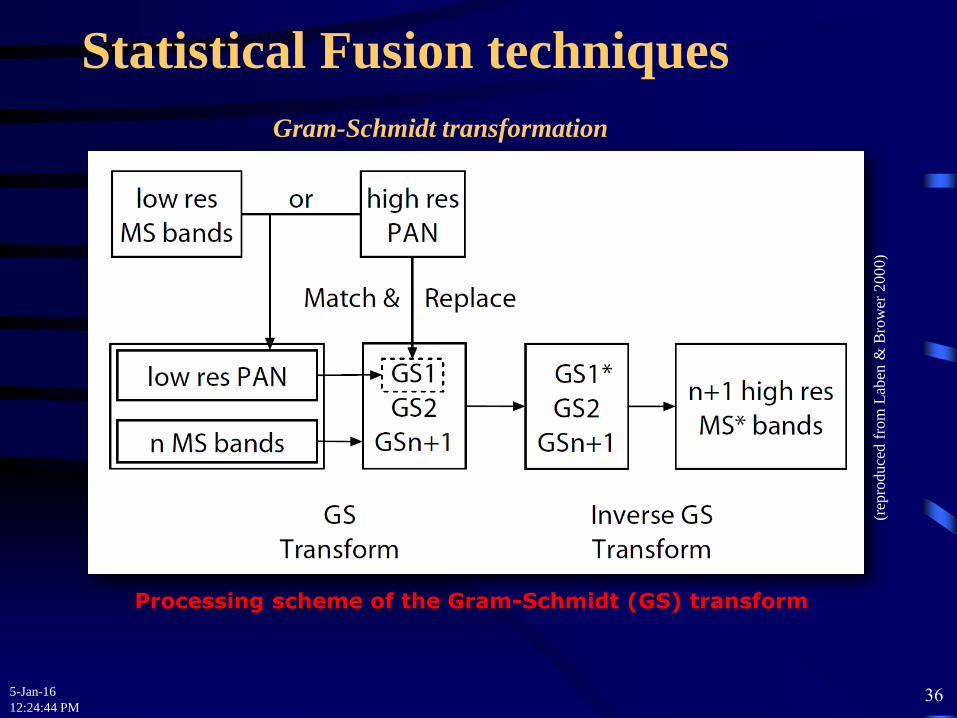
Gram-Schmidt transformation
Processing scheme of the Gram-Schmidt (GS) transform
5-Jan-16
12:24:44 PM
36
(re
pro
duce
d f
rom
Lab
en &
Bro
wer
2000)
Statistical Fusion techniques
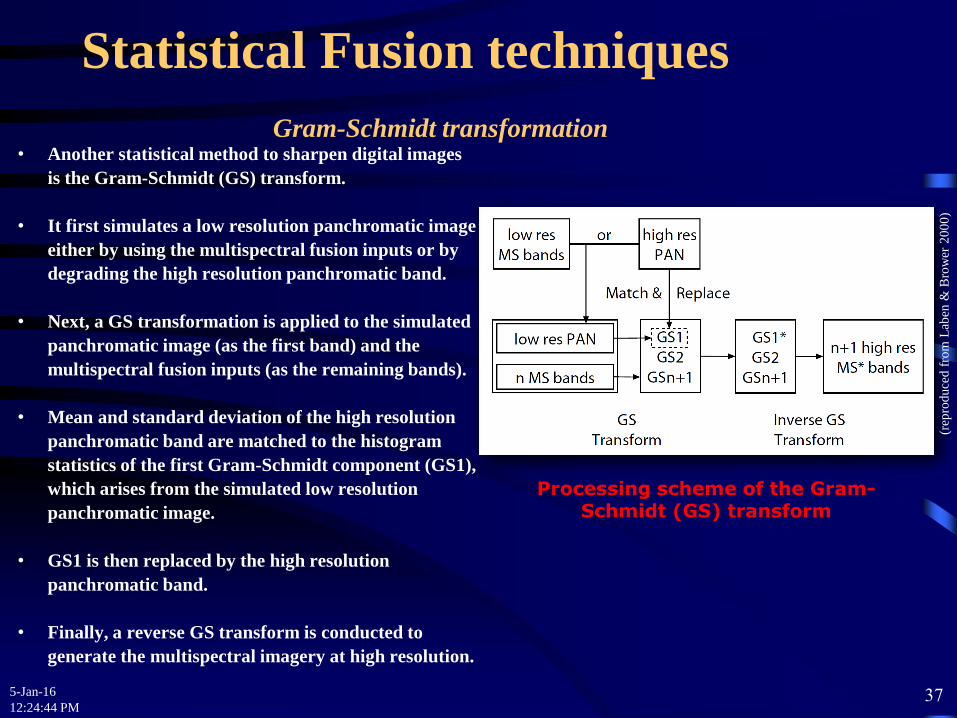
Gram-Schmidt transformation
Processing scheme of the Gram-Schmidt (GS) transform
5-Jan-16
12:24:44 PM
37
(re
pro
duce
d f
rom
Lab
en &
Bro
wer
20
00
)
• Another statistical method to sharpen digital images
is the Gram-Schmidt (GS) transform.
• It first simulates a low resolution panchromatic image
either by using the multispectral fusion inputs or by
degrading the high resolution panchromatic band.
• Next, a GS transformation is applied to the simulated
panchromatic image (as the first band) and the
multispectral fusion inputs (as the remaining bands).
• Mean and standard deviation of the high resolution
panchromatic band are matched to the histogram
statistics of the first Gram-Schmidt component (GS1),
which arises from the simulated low resolution
panchromatic image.
• GS1 is then replaced by the high resolution
panchromatic band.
• Finally, a reverse GS transform is conducted to
generate the multispectral imagery at high resolution.

𝐷𝑁𝑓 =𝐷𝑁𝑏1
𝐷𝑁𝑏1 + 𝐷𝑁𝑏2 + 𝐷𝑁𝑏3⋅ 𝐷𝑁ℎ𝑟
Numerical Fusion techniques
Brovey transformation
DNf Digital Numbers of the fusion result DN1…3 Digital numbers of the spectral input bands DNhr Digital Numbers of the Data to fuse with (PAN, SAR…)
SA
R-E
DU
, htt
ps:
//sa
redu.d
lr.d
e/
5-Jan-16
12:24:44 PM
38

𝐷𝑁𝑓 =𝐷𝑁𝑏1
𝐷𝑁𝑏1 + 𝐷𝑁𝑏2 + 𝐷𝑁𝑏3⋅ 𝐷𝑁ℎ𝑟
Numerical Fusion techniques
Brovey transformation
DNf Digital Numbers of the fusion result DN1…3 Digital numbers of the spectral input bands DNhr Digital Numbers of the Data to fuse with (PAN, SAR…)
S
AR
-ED
U,
htt
ps:
//sa
red
u.d
lr.d
e/
5-Jan-16
12:24:44 PM
39
• There is a large number of arithmetic fusion techniques that base upon addition or multiplication
and may incorporate different scaling factors and weighting parameters.
• The Brovey transform is a numerical method that employs mathematical combinations in order
to sharpen color images with the help of high resolution data.
• According to Pohl & Van Genderen (1998:835), its formula basically normalizes the
multispectral bands of an RGB display before they are multiplied with the panchromatic imagery
where DNf, DNb and DNhr refers to the Digital Numbers (DNs) of the fusion result f , the three
spectral input bands b and the high resolution data hr, respectively. Thanks to the normalization
step, the Brovey transform overcomes the disadvantages of the multiplicative method.
• One of the first authors that make use of this fusion technique are Hallada & Cox (1983). In the
software Environment for Visualizing Images (Envi), a modification of the Brovey transform is
implemented.

Numerical Fusion techniques
Color Normalized (spectral sharpening)
𝐶𝑁𝑖 =𝑀𝑆𝐼𝑖 + 1 ⋅ 𝑃𝐴𝑁 + 1 ⋅3
𝑀𝑆𝐼𝑖 + 3𝑖
− 1
𝐶𝑁𝑖 =𝑀𝑆𝐼𝑖⋅𝑃𝐴𝑁⋅𝑁𝑠𝑒𝑔𝑚𝑒𝑛𝑡
𝑆𝑠𝑒𝑔𝑚𝑒𝑛𝑡 + 𝑁𝑠𝑒𝑔𝑚𝑒𝑛𝑡
CNi ith Band of the fusion result MSIi ith Band of the multispectral input PAN Band of the Data to fuse with (PAN, SAR…)
CNi ith Band of the fusion result MSIi ith Band of the multispectral input PAN Band of the Data to fuse with (PAN, SAR…) Nsegment # of bands belonging to one spectral segment Ssegment Sum of bands belonging to one spectral segment
S
AR
-ED
U, htt
ps:
//sa
redu.d
lr.d
e/
5-Jan-16
12:24:44 PM
40

Numerical Fusion techniques
Color Normalized (spectral sharpening) [energy subdivision transform]
𝐶𝑁𝑖 =𝑀𝑆𝐼𝑖 + 1 ⋅ 𝑃𝐴𝑁 + 1 ⋅3
𝑀𝑆𝐼𝑖 + 3𝑖
− 1
CNi ith Band of the fusion result MSIi ith Band of the multispectral input PAN Band of the Data to fuse with (PAN, SAR…)
SA
R-E
DU
, htt
ps:
//sa
red
u.d
lr.d
e/
5-Jan-16
12:24:44 PM
41
• The additive constants in the equation are to avoid division by 0.
• A refined version of the CN algorithm is called CN spectral sharpening.
• The method can be used to spatially enhance any number of spectral bands within one step.
• The extended CN resolution merge only sharpens those input channels that fall within the spectral range of
the high resolution panchromatic image, as defined by the center wavelength of the spectral bands and their
Full Width at Half Maximum (FWHM) value.
• If this precondition is provided for, the color images are grouped into spectral segments that correspond to
the spectral range of the high resolution data.
• The resulting band segments are then processed in the following manner.

Numerical Fusion techniques
Color Normalized (spectral sharpening) [energy subdivision transform]
𝐶𝑁𝑖 =𝑀𝑆𝐼𝑖⋅𝑃𝐴𝑁⋅𝑁𝑠𝑒𝑔𝑚𝑒𝑛𝑡
𝑆𝑠𝑒𝑔𝑚𝑒𝑛𝑡 + 𝑁𝑠𝑒𝑔𝑚𝑒𝑛𝑡
CNi ith Band of the fusion result MSIi ith Band of the multispectral input PAN Band of the Data to fuse with (PAN, SAR…) Nsegment # of bands belonging to one spectral segment Ssegment Sum of bands belonging to one spectral segment
S
AR
-ED
U,
htt
ps:
//sa
red
u.d
lr.d
e/
5-Jan-16
12:24:44 PM
42
• Since it takes into account the wavelengths that are covered by the fusion inputs, the
CN spectral sharpening is particularly useful to improve the geometric resolution of
hyperspectral imagery.
•
• On the contrary, this technique might be inappropriate for an optical–SAR fusion
scheme.

Numerical Fusion techniques
High Pass transformation
𝐷𝑁 𝑜𝑢𝑡𝑝𝑢𝑡 = 𝐷𝑁 𝑖𝑛𝑝𝑢𝑡 + 𝐻𝑃𝐹⋅𝑊
𝑊 =𝜎 𝑀𝑆
𝜎(𝐻𝑃𝐹)⋅M
W Weighting factor σ(MS) Std.-Dev. Of multispectral channels σ(HPF) Std.-Dev. of high pass filtered PAN/SAR image M Modulating factor
S
AR
-ED
U, htt
ps:
//sa
redu.d
lr.d
e/
5-Jan-16
12:24:44 PM
43

Numerical Fusion techniques
High Pass transformation
𝐷𝑁 𝑜𝑢𝑡𝑝𝑢𝑡 = 𝐷𝑁 𝑖𝑛𝑝𝑢𝑡 + 𝐻𝑃𝐹⋅𝑊
𝑊 =𝜎 𝑀𝑆
𝜎(𝐻𝑃𝐹)⋅M
W Weighting factor σ(MS) Std.-Dev. Of multispectral channels σ(HPF) Std.-Dev. of high pass filtered PAN/SAR image M Modulating factor
S
AR
-ED
U, htt
ps:
//sa
redu.d
lr.d
e/
5-Jan-16
12:24:44 PM
44
• The High Pass Filter (HPF) method first computes the resolution ratio between the multispectral dataset and the
panchromatic image.
• Then a high-pass convolution kernel filters the panchromatic input using a window size that is based upon the ratio.
• After the multispectral imagery is oversampled to fit the pixel spacing of the high resolution data, the HPF image is
weighted relative to the global standard deviation of the spectral bands by the factor W.

Numerical Fusion techniques
High Pass transformation
𝑊 =𝜎 𝑀𝑆
𝜎(𝐻𝑃𝐹)⋅M
W Weighting factor σ(MS) Std.-Dev. Of multispectral channels σ(HPF) Std.-Dev. of high pass filtered PAN/SAR image M Modulating factor
SA
R-E
DU
, htt
ps:
//sa
redu.d
lr.d
e/
5-Jan-16
12:24:44 PM
45
• σ(MS) and σ(HPF) are the standard deviations of the respective multispectral channels and
the high-pass filtered panchromatic image.
• M is a modulating factor used to determine the crispness of the fusion output. Note that M is
user-adjustable, but also depends on the resolution ratio.
• The above equation enables the calculation of band-specific values for W which are then
employed to inject the HPF image into the individual spectral input bands via addition.

Numerical Fusion techniques
High Pass transformation
𝐷𝑁 𝑜𝑢𝑡𝑝𝑢𝑡 = 𝐷𝑁 𝑖𝑛𝑝𝑢𝑡 + 𝐻𝑃𝐹⋅𝑊
S
AR
-ED
U, htt
ps:
//sa
redu.d
lr.d
e/
5-Jan-16
12:24:44 PM
46
As the final step of the HPF resolution merge, the output images are rescaled by linear
stretching in order to match the mean and standard deviation of the original
multispectral images.

Numerical Fusion techniques
Wavelets
Processing scheme of Wavelet fusion approach
5-Jan-16
12:24:44 PM
47
(pro
duce
d f
rom
Lei
ca G
eosy
stem
s 2005)

Numerical Fusion techniques
Wavelets
Processing scheme of Wavelet fusion approach
5-Jan-16
12:24:44 PM
48
(pro
duce
d f
rom
Lei
ca G
eosy
stem
s 2
00
5)
• Wavelet transforms are powerful
mathematical tools that have their origin in the
field of signal processing.
• The technique entered in the image fusion
domain when Mallat in 1989 proposed a
functional framework for wavelet-based image
decomposition and reconstruction called
Multiresolution Analysis (MRA).
• Since then, various data fusion techniques
have been introduced that rely on this very
concept.
• Wavelets are elementary functions in which a
given input signal can be decomposed.
• In Wavelet fusion, a high resolution panchromatic band (PAN) is first decomposed into four components: A low
resolution approximation of the panchromatic image (PAN’) and three images of horizontal (H), vertical (V)
and diagonal (D) Wavelet coefficients representing the spatial details in the high resolution panchromatic
image.
• Later the individual bands of the multispectral dataset (MS) substitute the low resolution panchromatic image.
• The spatial details of the high resolution data are finally injected into each spectral band (MS*) by applying an
inverse Wavelet transformation that makes use of the corresponding Wavelet coefficients for reconstruction.

Fusion techniques in Feature Level
Data Fusion
Knwoledge based Identity Fusion Concepts
• Cluster Analysis
• Neural Networks
• Fuzzy Logic
• Expert Systems
• Logical Templates
• Bayesian Inference
• Dempster-Shafer Method
S
AR
-ED
U, htt
ps:
//sa
redu.d
lr.d
e/
5-Jan-16
12:24:44 PM
49

Fusion techniques in Decision Level
Data Fusion
Knwoledge based Identity Fusion Concepts
• Expert Systems
• Logical Templates
• Neural Networks
• Fuzzy Logic
• Blackboard
• Contextual Fusion
• Syntactic Fusion
• Classical Inference
• Bayesian Inference
• Dempster-Shafer Method
• Voting Strategies
SA
R-E
DU
, htt
ps:
//sa
redu.d
lr.d
e/
5-Jan-16
12:24:44 PM
50

Artificial Neural Networks (ANN)
Input Units Hidden Units Output Units
Image Channels
Thematic Classes
“A neural network consists of a
number of interconnected nodes […].
Each node is a simple processing
element that responds to the weighted
inputs it receives from other nodes.
The arrangement of the nodes is
referred to as the network
architecture.”
ANN Classifier
(Atk
inso
n &
Tat
nal
l 1997)
5-Jan-16
12:24:44 PM
51

Artificial Neural Networks (ANN)
Input Units Hidden Units Output Units
Image Channels
Thematic Classes
• Neural networks are the systems that seek to
emulate the process used in biological nervous
systems.
• A neural network consists in layers of processing
elements, or nodes, which may be interconnected
in a variety of ways.
• The neural network performs a non-linear
transformation of an input vector.
• This theory is used when the relation between
output and input data is unknown.
• A neural network can be trained using a sample or
training data set (supervised or unsupervised
depending on the training mode) to perform
correct classifications by systematically adjusting
the weights in the activation function.
• This activation function defines the processing in a
single node.
• The ultimate goal of neural network training is to
minimize the cost or error function for all possible
examples through the input-output relation.
ANN Classifier
(Atk
inso
n &
Tat
nal
l 1997)
5-Jan-16
12:24:44 PM
52

Artificial Neural Networks (ANN)
Input Units Hidden Units Output Units
Image Channels
Thematic Classes
• The neural networks can be used to transform
multi-sensor data into a joint declaration of identity
for an entity.
• The Figure illustrates a four-layer network with
each layer having multiple processing elements.
• In 1994 A. Chiuderi et al. used a neural network
approach for data fusion of land cover classification
of remote sensed images on an agricultural area. By
using supervised and unsupervised neural network,
the optical-infrared data and microwave data were
fused for land cover classification.
• In 2001 L. Yiyao et al. adopted a knowledge-based
neural network for fusing edge maps of multi-
sensor remote sensing images.
• In 2003 He Mingyi and Xia Jiantao proposed
DPFNN (Double Parallel Feedforward Neural
Networks) used to classify the high dimensional
multispectral images.
• Other applications can be found in crop
classification, forest type classification, recognition
of typhoon clouds etc.
ANN Classifier
(Atk
inso
n &
Tat
nal
l 1997)
5-Jan-16
12:24:44 PM
53

Fuzzy Logic
µ „low“ = 0.4
µ „medium“ = 0.2
µ „high“ = 0.0
µ „low“ = 0.0
µ „medium“ = 0.0
µ „high“ = 0.8
Principle Concept of Fuzzy Logic
5-Jan-16
12:24:44 PM
54
( re
pro
duce
d f
rom
BA
AT
Z e
t al.
2004
)

Bayesian Fusion
Bayesian Fusion
S
AR
-ED
U, htt
ps:
//sa
redu.d
lr.d
e/
5-Jan-16
12:24:44 PM
55
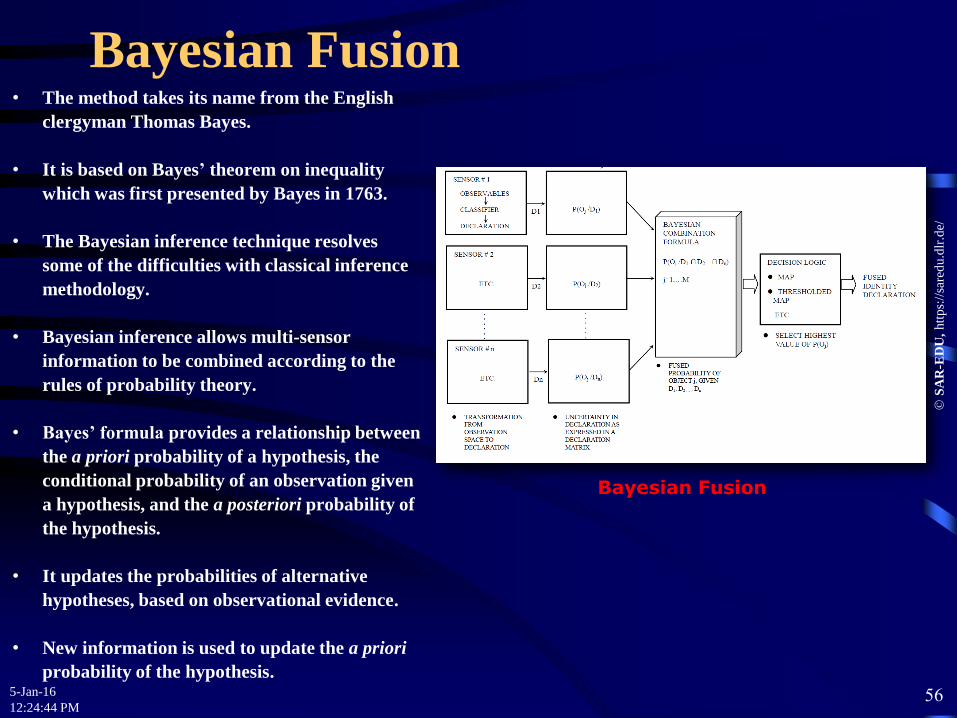
Bayesian Fusion
Bayesian Fusion
S
AR
-ED
U,
htt
ps:
//sa
red
u.d
lr.d
e/
5-Jan-16
12:24:44 PM
56
• The method takes its name from the English
clergyman Thomas Bayes.
• It is based on Bayes’ theorem on inequality
which was first presented by Bayes in 1763.
• The Bayesian inference technique resolves
some of the difficulties with classical inference
methodology.
• Bayesian inference allows multi-sensor
information to be combined according to the
rules of probability theory.
• Bayes’ formula provides a relationship between
the a priori probability of a hypothesis, the
conditional probability of an observation given
a hypothesis, and the a posteriori probability of
the hypothesis.
• It updates the probabilities of alternative
hypotheses, based on observational evidence.
• New information is used to update the a priori
probability of the hypothesis.

Dempster-Shafer fusion
Dempster-Shafer method
S
AR
-ED
U, htt
ps:
//sa
redu.d
lr.d
e/
5-Jan-16
12:24:44 PM
57

Dempster-Shafer (DS) fusion
Dempster-Shafer method
SA
R-E
DU
, htt
ps:
//sa
red
u.d
lr.d
e/
5-Jan-16
12:24:44 PM
58
• The DS method’s theory was proposed by
Dempster in 1967 and extended by Shafer.
• It is a generalization of Bayesian theory
that allows for a general level of
uncertainty.
• Unlike the Bayesian approach, the DS
method provides a means to account
explicitly for unknown possible cause of
observational data.
• DS utilizes probability intervals and
uncertainty intervals to determine the
likelihood of hypotheses based on multiple
evidence.
• DS computes a likelihood that any
hypothesis is true.
• Both DS and Bayesian methods lead to
identical results when all of the hypotheses
considered are mutually exclusive and the
set of hypotheses is exhaustive.

5-Jan-16
12:24:44 PM
59
Thank you!
&
any question